Embed Size (px)
Citation preview
ARCAA 2015, 1-14 1
VOLUME 30, 2015
Effect of First Pitch type and Outcome on Hitter Success in High School Baseball
Grant M. Hill Ralph Rozenek
Jill Crussemeyer California State University, Long Beach
Scott Glasser Long Beach Unified School District
The purpose of this study was to determine the ef-fect of a first pitch ball or strike on both batting average and on-base percentage for a high school team through-out an entire season. Frequency of first pitch fast ball vs. non-fastball was determined as well as batting average of first pitches that were hit into fair territory. Partici-pants were male varsity baseball players from Southern California High Schools with student populations over 2000. Five pitchers from one team faced 706 batters over the course of 30 regular 2011 season games with two in-dependent, trained observers recording first pitch type and at-bat outcome for each batter. Data were compared with 2003 major league baseball data in order to deter-mine differences in at-bat outcome based on results of first pitch. Non-parametric statistical comparisons re-vealed high school pitchers are more likely to throw a first pitch fastball than major league pitchers. In addi-tion, a first pitch ball at the high school level is more likely to result in an on-base at-bat than at the major league level. The results are discussed in relation to Mixed Strategy Nash Equilibrium Theory (MSNE).
2 FIRST PITCH OUTCOME
APPLIED RESEARCH IN COACHING AND ATHLETICS ANNUAL
A baseball team’s success is largely based on the out-comes of individual battles between pitchers and batters. A primary indicator of whether the batter or pitcher will be successful is whether the first pitch outcome is a strike or a ball. Pitchers can greatly increase the probability they will be successful in keeping an opponent from getting a hit or getting on base by throwing a first pitch strike (Szolek & Oslin, 2003; Guerrero, 1997). Ching (2004) stated that the first pitch strike is the most critical factor in pitch-ing success and winning games because throwing first pitch strikes significantly decreases the hits, walks, and on-base (OB) percentage of opposing hitters. Bamberger (2001) suggests pitchers should try to have a high first pitch strike average (FPS) and that when the FPS average is less than 54%, the pitcher is considered to be ineffective. Burley (2004a) found, in analyzing the results of the 2003 major league season, that when pitchers threw a FPS, op-ponents had an OB percentage of .296; however when the first pitch was a ball, the OB percentage was .385. In addi-tion, when pitchers threw a first pitch strike, 92.7% of the time the result of that pitch was either an out or an 0-1 count. This occurred primarily because more than three-quarters of the time, the first strike from the pitcher was taken for a strike, swung and missed, or fouled off. Over the 2003 season, major league pitchers threw first pitch strikes approximately 57% of the time. When pitchers threw a first pitch strike, their Earned Run Average (ERA) was 3.60. However, when pitchers threw a first pitch ball, their ERA was 5.50. Burley concluded that 0-0 is the pre-dominant count in baseball and the first strike is the key to a pitcher's success. More recent data from the 2012 Major League Baseball season has also shown that major league hitters are more likely to both get a hit after a first pitch
FIRST PITCH OUTCOME 3
VOLUME 30, 2015
ball than a strike (.270 vs. .226) and have a higher on-base percentage (.379 vs. .265) (Gelb, 2013). Bickel and Stotz (2002) analyzed four years of Stanford University baseball team data and found batters reached base 44% of the time after a first pitch ball, but only 32% of the time after a FPS. Bennett and Mack (1999) also examined the importance of FPS at the college level and found that first-pitch balls yielded an OB percentage of .480, whereas FPS’s yielded an OB percentage of .350.
Another way of assessing the importance of the first pitch outcome is to study possible outcomes of a 1-0 vs. 0-1 pitch count. If the first pitch is a strike, of the seven possi-ble pitch counts that remain (0-2, 1-1, 2-1, 3-1, 1-2, 2-2, and 3-2), four favor the pitcher resulting in a 57.1% advantage for the pitcher. In contrast, if the first pitch is a ball, then eight possible pitch counts remain (1-1, 1-2, 2-0, 2-1, 2-2, 3-0, 3-1, and 3-2. Of these eight pitch counts, only three pitch counts (1-2, 2-2, and 3-2) favor the pitcher, resulting in just a 37.5% advantage for the pitcher (Dunn, 2014).
It appears important for batters to have a strategy be-cause hitting a pitched ball is truly one of the most chal-lenging tasks in all of sports. Robson (2003) determined that an 80-90 mph pitch takes approximately 0.4 seconds to travel from a pitchers hand to the strike zone, and it takes 0.2 seconds for a hitter to initiate a swing and reposition their bat into the strike zone. This leaves just 0.2 seconds for batters to recognize the pitch type and location and make a decision regarding whether or not to swing. This extremely brief reaction time makes it advantageous for batters to eliminate some potential options before the ball ever leaves the pitchers hand. A common plan for high school hitters is to hit the first pitch if it is a fastball and not swing at off-speed or breaking pitches (Hanson & Ravizza,
4 FIRST PITCH OUTCOME
APPLIED RESEARCH IN COACHING AND ATHLETICS ANNUAL
1995). Even at the major league level, anticipating a first pitch fast ball may be considered a good strategy since that is the pitch batters see approximately 64% of the time ac-cording to Weinstein-Gould (2009). While having a plan is a valuable tool for hitters, any modification of that plan in ever changing environmental circumstances is very diffi-cult because reaction time is consequently delayed (Magill, 2011). A weakness of young hitters, according to Gola and Myers (2000), is they like to swing at the 1st pitch, even if it is out of the strike zone, which is indicative of a lack of pa-tience; this attribute can be exploited by opposing pitchers. However, Burley (2004a) found when major league hitters were able to successfully hit the pitcher’s first strike into fair territory, the resulting batting average was approxi-mately .341, which is much higher than the average of all plate appearances - .268. Guerrero (1997) and Bamberger (2001) also found in analyzing multiple years of major league statistics that batters hit for the highest average on the first pitch of an at-bat.
To counter a batter’s tendency to anticipate a fast ball during various pitch counts, pitchers may employ a “mixed strategy” (Weinstein-Gould, 2009), which involves throwing a non-fastball (Curve Ball, Change-up, etc.) in traditionally predictable fastball counts such as 0 – 0, 1 – 0, 2 – 0, 3 – 0, or 3 – 1. According to Weinstein-Gould (2009), this unexpected pitch provides an advantage for a pitcher because of the delayed reaction time of the hitters to make decisions and respond successfully to the pitch. Weinstein-Gould refers to strategic response selections based upon the perceived choices of an opponent as Mixed Strategy Nash Equilibrium (MSNE). Evidence of MSNE being used by elite players in tennis and soccer have been verified, however there is little evidence that players at lower levels
FIRST PITCH OUTCOME 5
VOLUME 30, 2015
of experience and skill employ MSNE (Chiappori, Grose-close, & Levitt, 2002; Walker & Wooders, 2001; Weinstein-Gould, 2009). While professional pitchers often effectively mix their pitches, Robson (2003) notes that, in little league through college programs, most pitchers throw predictable pitches based on the pitch count. This allows hitters to an-ticipate a fastball in a good fastball count. The primary dif-ficulty for young pitchers to utilize a mixed pitching strat-egy is that they are unable to consistently control multiple pitches (Gola & Myers, 2000).
While extensive research has been conducted at both the major league and collegiate levels regarding at-bat out-come after a first pitch ball or strike, little research has fo-cused on the high school level. Consequently, it was con-sidered important to determine the percentage of outs rec-orded by high school pitchers after throwing a first pitch ball or strike. In addition, it appeared important to com-pare the outcomes of at-bats depending on whether the first pitch is a fast ball, curve ball, or change up. For this study, a high school baseball team was selected and careful examination was made of the pitch selection and outcomes of those pitches during an entire season of interscholastic play. By charting every pitch, the following information was sought: 1) the frequency of first pitch types: Fastball, Curveball, and Change-up, 2) responses of batters to each first pitch type, 3) on-base percentage of players based upon whether the first pitch was a ball or a strike, 4) the number of called strikes and swinging strikes for each pitch type, and 5) the outcome when batters hit first pitches into fair play. It was hoped the results of this study would help high school coaches provide better advice for both pitchers and batters in terms of gaining a competitive edge during an at-bat.
6 FIRST PITCH OUTCOME
APPLIED RESEARCH IN COACHING AND ATHLETICS ANNUAL
Methods
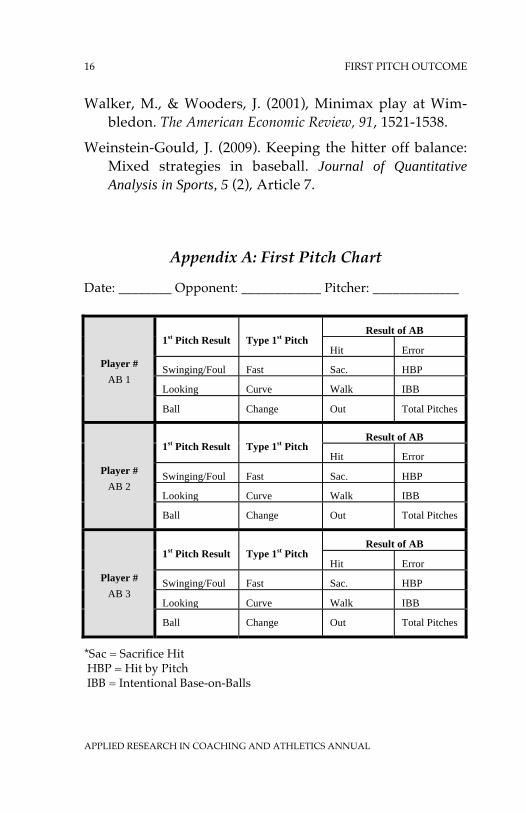
High school participants did not know that they were being analyzed beyond the normal scope of coaching. The study was approved by the school district IRB in an expe-dited review since the data collection neither identified any of the participants nor exceeded normal record keep-ing. Two trained coaches, who had extensive experience with the use of pitching charts, utilized direct observation documents to evaluate the varying pitches, the results of those pitches, and outcomes of all plate appearances dur-ing a 30 game umpired season. All participants were male varsity baseball player’s ages (15-18) from Southern Cali-fornia High Schools with student populations over 2000. Five pitchers from one team faced 706 batters over the course of 30 regular season games. The participants were selected by coaches of their respective teams using non-random, criterion based procedures to represent their high school in athletic competitions. Two direct observation documents were used to record data. The main document was the First Pitch Chart (see Appendix A) which was cre-ated by the researchers for the specific purpose of this study. The supporting document was the official score-book kept by a trained scorekeeper in a Glover’s Score-book. The main document was analyzed by multiple expe-rienced baseball coaches for possible editing. The score-book was kept by a team manager.
A pilot test was held in three separate pre-season games with the same participants to ensure that the in-struments and observations were appropriate. Following the pilot study, researchers noted the importance of being in close proximity to the coach calling the pitches so they could communicate if there was any uncertainty about
FIRST PITCH OUTCOME 7
VOLUME 30, 2015
pitch type and correct any inaccuracies in data immedi-ately during the game. The pitching coach called all the pitches to be thrown by the participants. Each “First Pitch Chart” was recorded by more than one expert for each game throughout the study so that data could be evaluated for accuracy. Comparisons of all game charts were taken and a Cronbach Alpha of p >.85 was used to determine the reliability of the charts and recorders. The official score-book was used as a secondary tool to verify the accuracy of the data.
Prior to the regular season, which extended from March through May, 2011, the five pitchers being observed in this study were trained to throw three different pitches (a fast ball, a curve ball, and a change-up) for strikes. The five pitchers were also informed of the strategic advantage of throwing a FPS in regards to how it would directly re-late to their personal success as well as the team’s success. The training included drills where players work with each other, coached bullpen sessions that simulated pitching practices from the mound, and three pre-season scrim-mage games (from October 2010 through February 2011) against other high schools of comparable ability levels. During each game of the regular season, the two trained researchers used the First Pitch Chart to record every first pitch type, pitch result, and the outcome of the plate ap-pearance. The actual recording took place immediately af-ter the result of the pitch was determined and before the next pitch was thrown. After each game, the lead re-searcher compared both charts with the scorebook to as-sure accuracy in record keeping. A running tally of the re-sults was kept by uploading the data to a formatted Excel worksheet. Intentional Walks (IBB) were not recorded be-cause the outcome of those at bats was predetermined by
8 FIRST PITCH OUTCOME
APPLIED RESEARCH IN COACHING AND ATHLETICS ANNUAL
the coach. Hit by Pitches were counted the same as a walk. Errors, fielder’s choices, and sacrifice flies were counted the same as an out. Fly balls that were caught for an out in foul territory were considered to be “put into play.” In ad-dition, to remain consistent with the Burley’s (2004a, 2004b) analysis of major league data, all first pitches hit into fair play were analyzed twice: first as a FPS and se-cond as a hit or an out with regards to at-bat OB percent-age.
Results
Of the 706 recorded first pitches by high school pitch-ers, 231 (32.7%) were swinging strikes, 232 (32.9%) were called strikes, and 243 (34.4%) were balls. In terms of pitch type, 537 (76.1%) were fastballs, 128 (18.1%) were curves, and 41 (5.8%) were change-ups. Of the 706 pitches, 111 were put into play by the batters with 43 scored as hits and 68 as outs. When batters hit the first pitch into fair play, their overall batting average was .387, with .412 for fast-balls, .375 for curves, and .000 for change ups. A total of 54% of first pitch fastball strikes and 55% of first pitch change up strikes were swinging strikes; however, more of the first pitch curve balls were called strikes (53/74 = 71.6%). The OB percentage of batters after a FPS was .281, but if the first pitch was a ball, OB percentage was .486. When pitchers threw a FPS, 90.7% (420/463) of the time the result of the at-bat was either an out or an 0-1 count.
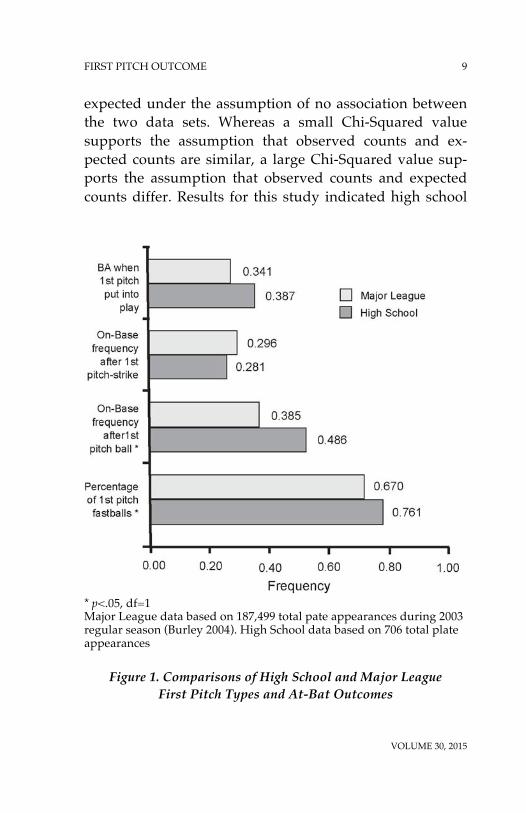
Chi-Squared non-parametric analysis was conducted to compare the high school results with data obtained during the 2003 Major League season (see Figure 1). The Chi-Squared statistic was selected because it compared the ob-served count in each table cell to the count which would be
FIRST PITCH OUTCOME 9
VOLUME 30, 2015
expected under the assumption of no association between the two data sets. Whereas a small Chi-Squared value supports the assumption that observed counts and ex-pected counts are similar, a large Chi-Squared value sup-ports the assumption that observed counts and expected counts differ. Results for this study indicated high school
* p<.05, df=1 Major League data based on 187,499 total pate appearances during 2003 regular season (Burley 2004). High School data based on 706 total plate appearances
Figure 1. Comparisons of High School and Major League First Pitch Types and At-Bat Outcomes
10 FIRST PITCH OUTCOME
APPLIED RESEARCH IN COACHING AND ATHLETICS ANNUAL
pitchers were significantly more likely than major league pitchers to throw a first pitch fastball (X2 (1) = 26.1 p < 0.05). In addition, when high school pitchers fell behind in the count because of a first pitch ball, the batters were sig-nificantly more likely to get on base than at the major league level (X2 (1) = 10.4 p < 0.05).
Discussion
The percentage of first pitch fastballs by the high school pitchers was significantly higher than those rec-orded by major league pitchers during the 2003 season (76% vs. 67%) (Weinstein-Gould, 2009). This finding is not surprising given the greater number of different pitches utilized by major league pitchers as compared with the high school pitchers in this study. The disparity between the percentages of fastballs suggests that pitchers at the major league level have more confidence and command over non-fast ball pitches than high school pitchers, and consequently utilize them more frequently on the critical first pitch. Given the predictability of the first pitch fast ball at the high school level, there appears to be a greater opportunity for high school pitchers to dominate batters if they are able to throw a non-fastball strike on the first pitch, particularly if they recognize the batter has a first pitch fastball hitting strategy. This advantage was illus-trated in that 72% of the first pitch curve balls were called strikes, whereas just 46% of the first pitch fastballs were called strikes. These findings are consistent with Bennett and Maneval (2000) who found that collegiate players are much more likely to take an off-speed first pitch for a strike than a fastball first pitch. This finding also suggests
FIRST PITCH OUTCOME 11
VOLUME 30, 2015
some of the pitchers were effectively utilizing a mixed strategy (MSNE) by throwing a curve ball in a normal fast ball count (Weinstein-Gould, 2009). Just 45% of the first pitch change-up strikes were called, suggesting the hitters were able to more easily adjust to that pitch than to a first pitch curveball, perhaps because of the slower speed and more direct flight path.
The findings suggest that high school batters are more likely than major league batters to get on base when the outcome of the first pitch is 1-0 instead of 0-1. Whereas major league pitchers establish an advantage over hitters by throwing a FPS rather than a ball (i.e., 0.296 vs 0.385 on-base percentage), the advantage of throwing FPS, rather than a first pitch ball, appears to be much greater at the high school level (i.e., 0.281 vs. 0.486 on-base percentage). These results suggest that high school pitchers who fall behind in the count after the first pitch are much less likely than major league pitchers to get a batter out if the first pitch is a ball. This may be because they are more likely to walk batters after a first pitch ball than major league pitch-ers (Burley, 2004b). Consequently, it is not surprising that high school pitchers in this study threw their most easy to control pitch – a fastball - approximately 76% of the time. In contrast, Major League pitchers are more successful af-ter a first pitch ball and Major League hitters are more suc-cessful than high school hitters after falling behind in the count 0-1.
The percentage of high school hitters who took the first pitch (67%) is very similar to the 70% Bennett and Maneval (2000) found in examining the response of college hitters to the first pitch of an at-bat. These results are also consistent with Burley’s analysis of 2003 major league batters which also revealed a disparity between the batting averages of
12 FIRST PITCH OUTCOME
APPLIED RESEARCH IN COACHING AND ATHLETICS ANNUAL
batters who hit the first pitch into fair territory as com-pared to all plate appearances (0.341 vs. 0.268). The much wider gap at the high school level compared to the major league level may be at least partially explained by the greater predictability of a first pitch fast ball at the high school level, allowing batters to better prepare for the speed and location of the pitch. In addition, considering the fastball is the most frequently thrown first pitch, it ap-pears to be logical that many high school coaches teach players to expect a fastball and only swing if that is what is thrown (Hanson & Ravizza, 1995). However, it is interest-ing to note that when pitchers threw a first pitch strike, only 9.3% resulted in a hit. This percentage is very close to the 7.7% Burley (2004a) found when analyzing batting sta-tistics from the 2003 Major League season.
For hitters, it appears important to be prudent regard-ing a decision to swing at a first pitch, since falling behind in the count 0-1 provides pitchers with a significant statis-tical and psychological advantage. However, Vickery (2003) found that hitters who put the ball into play early in the pitch count have higher batting averages, slugging percentages, and OB percentages than players who are less aggressive. The high school hitters in this study who were able to hit the first pitch into fair territory fared much bet-ter in terms of at-bat batting average versus their total bat-ting average (0.387 vs. 0.254). Smith (2002) suggested hit-ters should study pitchers to find tendencies regarding what type of pitch will be thrown in order to become more aggressive and, subsequently, productive.
For pitchers, it appears important to focus primarily on control on the first pitch rather than trying to overpower hitters. Pitchers should strive to get a FPS in order to get ahead early in the pitch count because this provides them
FIRST PITCH OUTCOME 13
VOLUME 30, 2015
with more choices in subsequent pitches. In contrast, when the first pitch is a ball, hitters can be more selective later in the count (O’Sullivan, 2000). A first pitch strike also in-creases the possibility of retiring batters and should also help pitchers avoid a high pitch count and stay in the game longer. In addition, control of multiple pitches, par-ticularly a curve ball, should profoundly enhance a pitcher’s prospect for success. Marshall (1998) advises pitchers to keep track of the tendencies of batters in order to choose the best first pitch type for subsequent plate ap-pearances. It appears to be prudent for coaches to be aware of the past first pitch performance of opposing pitchers in order to advise their players to either swing at or take the first pitch (Guerrero, 1997).
The results of this study are limited to the high school level; however, comparisons with other age levels should prove interesting and valuable to youth baseball coaches. This study involved just five pitchers from one high school; data from additional schools of various enrollment levels would provide more confidence regarding generali-zability of results. Future studies could include interviews with elite pitchers and hitters in order to determine spe-cific factors they consider in trying to achieve a competi-tive edge. It would also be interesting to determine if dif-ferences exist when a pitcher faces a batter who swings from the same or opposite side of the plate. Comparisons could also be made to determine whether pitchers use dif-ferent strategies based on such factors as the batter’s place in the line-up, the number of outs in the inning, the ab-sence or presence of base runners, and the score of the game.
14 FIRST PITCH OUTCOME
APPLIED RESEARCH IN COACHING AND ATHLETICS ANNUAL
References
Bamberger, M. (2001). First-strike capability. Sports Illus-trated, 94(23), 48-52.
Bennett, G. & Maneval, M. (2000). Validation of the first pitch axiom in baseball. Applied Research in Coaching Athletics Annual, 15, 78-84.
Bickel, J.E. & Stotz, D. (2003, September 5). When should hitters take pitches during baseball contest. Collegiate Baseball, 1-6.
Burley, C. (2004a). The importance of strike one (part one). The Hardball Times. Retrieved July 24, 2010, from http://www.hardballtimes.com/main/article/the-importance-of-strike-one-part-one/
Burley, C. (2004b). The importance of strike one (and two, and three), part two. The Hardball Times. Retrieved July 24, 2010, from http://www.hardballtimes.com/ main/article/the-importance-of-strike-one-part-two/
Chiappori, P.A., Groseclose, T., & Levitt, S.D. (2002). Testing Mixed Strategy Equilibrium when players are heterogeneous: The case of penalty kicks in soccer. The American Economic Review, 92, 1138-1151.
Ching, L. (2004). A comparison of batting averages of Ma-jor League Baseball players among three combination pitch counts. Kinesiology Publications, University of Oregon. 2004. http://kinpubs.uoregon.edu/
Dunn, J. (2014). The importance of the first pitch. JUGGS Sports. Retrieved January 31, 2014 from http:// www.philly.com/philly/blogs/phillies_zone/Cliff-Lee-and-the-importance-of-throwing-strike-one.html?c=r
FIRST PITCH OUTCOME 15
VOLUME 30, 2015
Gelb, M. (2013). Cliff Lee and the importance of throwing strike one. The Phillies Zone. Retrieved January 31, 2014 from http://www.philly.com/philly/blogs/phillies_ zone/Cliff-Lee-and-the-importance-of-throwing-strike-one.html?c=r
Gola, M.& Myers, D. (2000) The Louisville Slugger com-plete book of pitching. New York, NY: McGraw Hill.
Guerrero, L.M. (1997). The relationship between pitch count and hitting success in major league baseball. Published Dissertation, Pro Quest.
Hanson, T. & Ravizza, K. (1995) Heads-up baseball: Playing the game one pitch at a time. Indianapolis, IN: Masters Press.
Magill, R. (2011). Motor Learning and Control: Concepts and Applications (9th ed.), New York, N.Y.: McGraw-Hill.
Marshall, M.G. (1998). How I develop my pitching plan. Coach and Athletic Director, 67, 40.
O’Sullivan, K. (2002). Making intelligent pitching deci-sions. America Baseball Coaches Association, 29, 25-27.
Robson, T. (2003). The hitting edge: How to excel at the plate. Champaign, IL: Human Kinetics.
Szolek, J.D. & Oslin, J. (2003). The benefit of first or second pitch strikes thrown by the high school baseball pitcher. The Applied Research in Coaching and Athletics Annual, 18, 212-228.
Smith, B. (2002). Getting ready for a successful at bat. Scholastic Coach & Athletic Director, 71 (8), 6-7.
Vickery, S. (2003, May 16) Research began after listening to top-notch coaches explain stats. Collegiate Baseball, 1-5.
16 FIRST PITCH OUTCOME
APPLIED RESEARCH IN COACHING AND ATHLETICS ANNUAL
Walker, M., & Wooders, J. (2001), Minimax play at Wim-bledon. The American Economic Review, 91, 1521-1538.
Weinstein-Gould, J. (2009). Keeping the hitter off balance: Mixed strategies in baseball. Journal of Quantitative Analysis in Sports, 5 (2), Article 7.
Appendix A: First Pitch Chart
Date: ________ Opponent: ____________ Pitcher: _____________
Player # AB 1
1st Pitch Result Type 1st Pitch Result of AB
Hit Error
Swinging/Foul Fast Sac. HBP
Looking Curve Walk IBB
Ball Change Out Total Pitches
Player # AB 2
1st Pitch Result Type 1st Pitch Result of AB
Hit Error
Swinging/Foul Fast Sac. HBP
Looking Curve Walk IBB
Ball Change Out Total Pitches
Player # AB 3
1st Pitch Result Type 1st Pitch Result of AB
Hit Error
Swinging/Foul Fast Sac. HBP
Looking Curve Walk IBB
Ball Change Out Total Pitches
*Sac = Sacrifice Hit HBP = Hit by Pitch IBB = Intentional Base-on-Balls


![MATH-8 Exam [E-0FG8G0] SOL8.13ab Compare Graphs and ... · D 65 + 3 Three baseball players were arguing over who was the best hitter on the team. Ben and Carl claimed that all three](https://img.pdfslide.us/doc/110x75/5f01e1687e708231d4017d11/math-8-exam-e-0fg8g0-sol813ab-compare-graphs-and-d-65-3-three-baseball.jpg)