Embed Size (px)
Citation preview

On Foraging Models and Lower Columbia
Subsistence Change
Virginia L. ButlerDept. AnthropologyPortland State University

Acknowledgements
- Many people in this session have helped out in many ways over the last 10 years; funding for analysis: USFWS, AINW, CASCADIA
-Student help: Greg Baker, Stephanie Butler, Mike Mayhew, Lee Levy, Roy Schroeder, Martha Corcoran, Fred Anderson
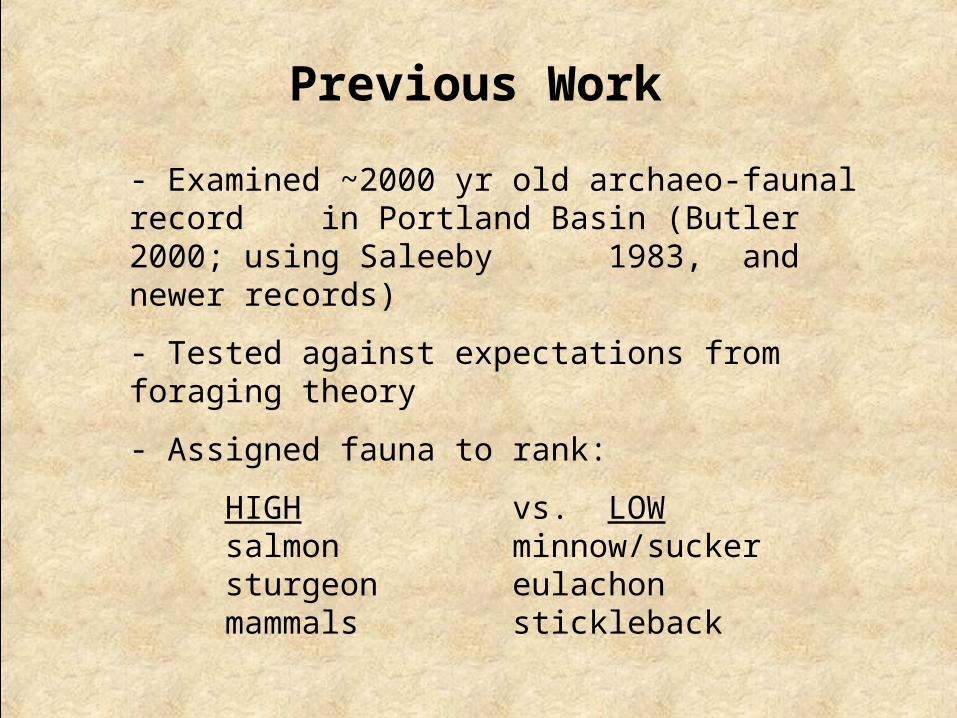
Previous Work
- Examined ~2000 yr old archaeo-faunal record in Portland Basin (Butler 2000; using
Saleeby 1983, and newer records)
- Tested against expectations from foraging theory
- Assigned fauna to rank:
HIGH vs. LOWsalmon minnow/sucker sturgeon eulachonmammals stickleback
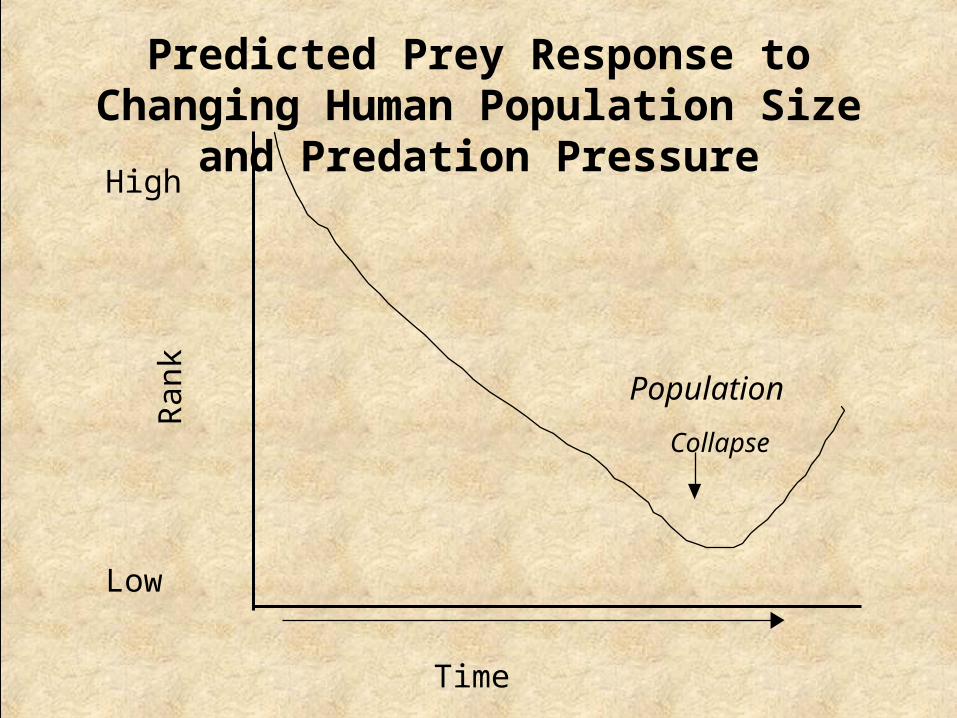
Population
Collapse
Time
High
Low
Ran
k
Predicted Prey Response to Changing Human Population Size
and Predation Pressure
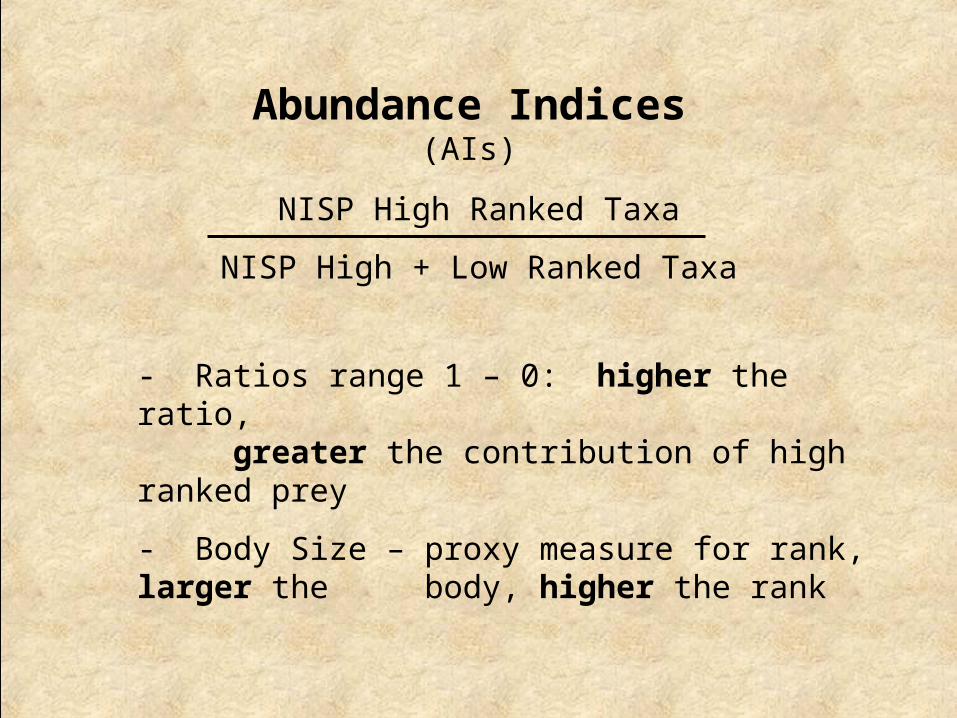
Abundance Indices (AIs)
NISP High Ranked Taxa
NISP High + Low Ranked Taxa
- Ratios range 1 – 0: higher the ratio, greater the contribution of high
ranked prey
- Body Size – proxy measure for rank, larger the body, higher the rank
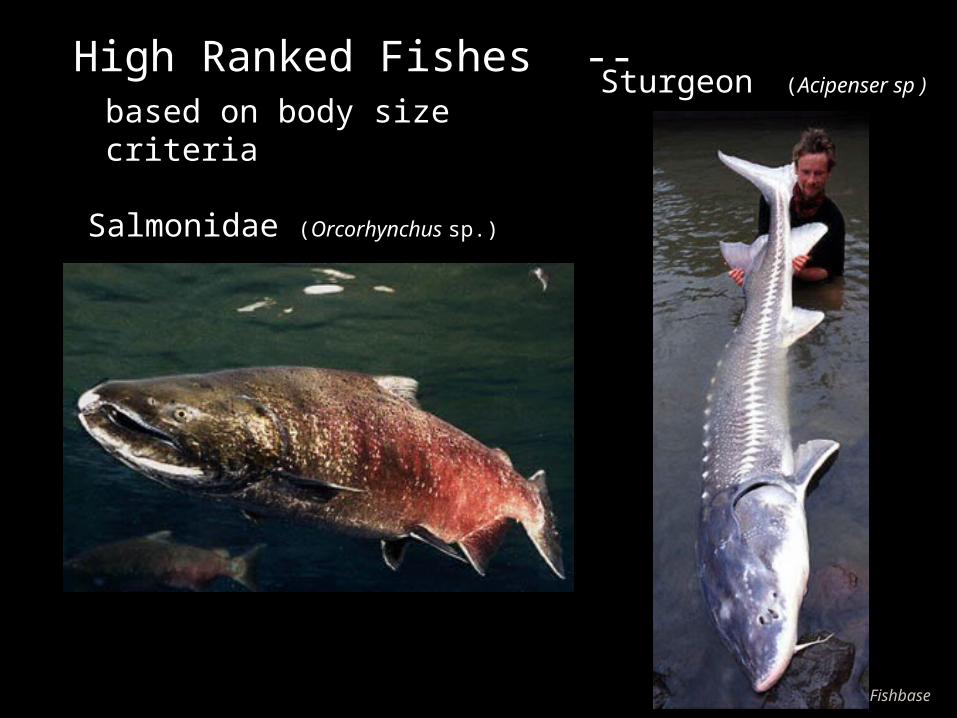
Based on Body Size Criteria
High Ranked Fishes --
Salmonidae (Orcorhynchus sp.)
Sturgeon (Acipenser sp ) based on body size criteria
Fishbase
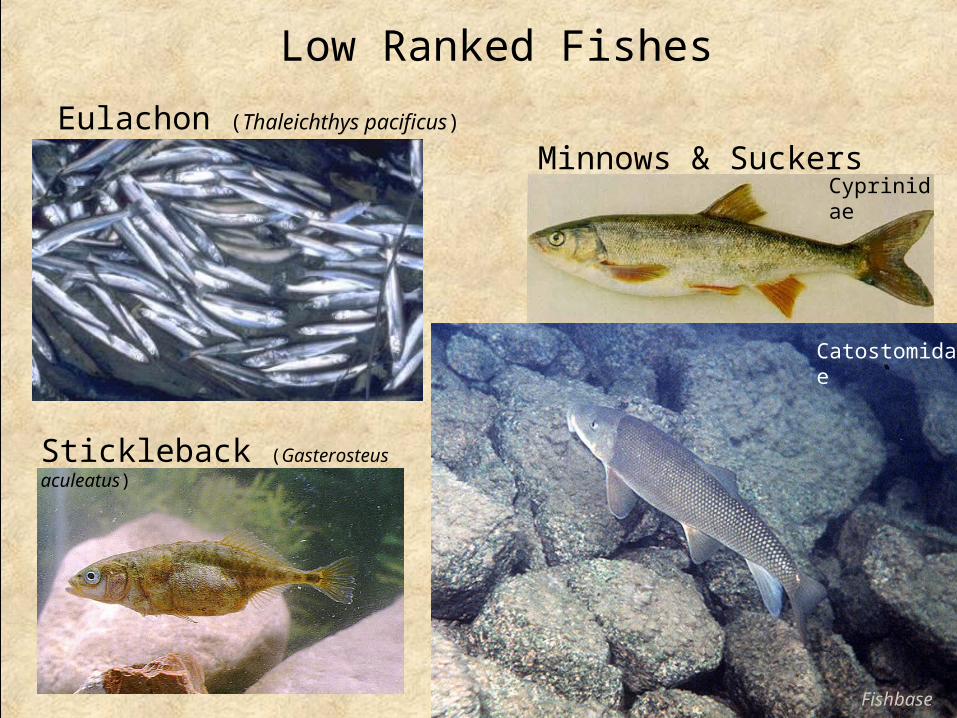
Low Ranked Fishes
Eulachon (Thaleichthys pacificus)
Minnows & Suckers
Stickleback (Gasterosteus aculeatus)
Cyprinidae
Catostomidae
Fishbase
0
0.2
0.4
0.6
0.8
1
1.2
0 1 2 3 4 5Merrybell Multnomah 1
Multnomah 2
Multnomah 3
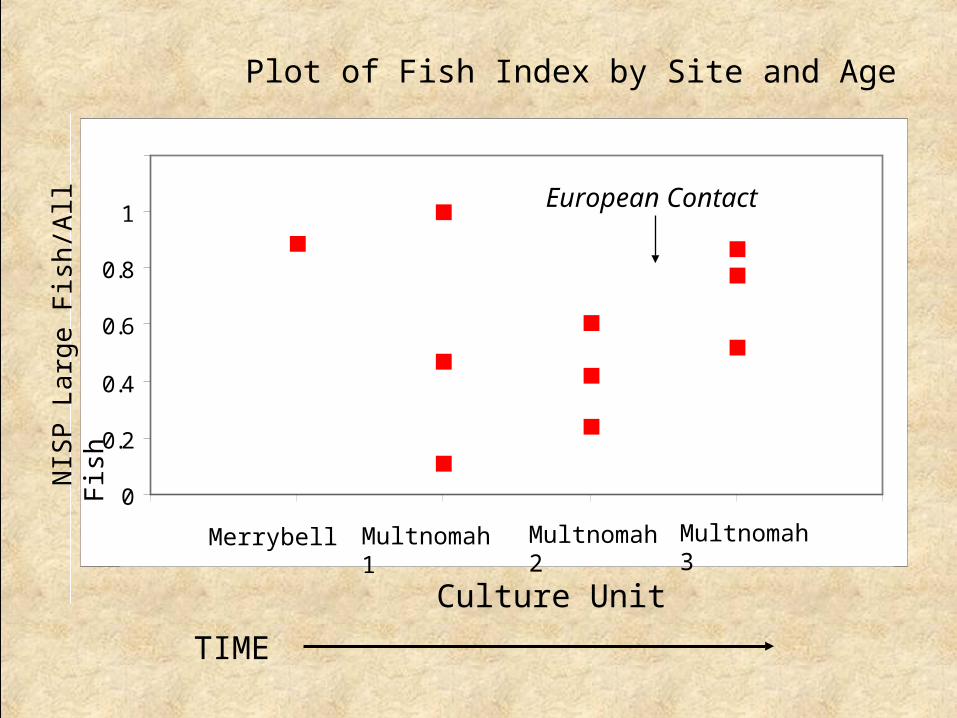
European Contact
NIS
P L
arg
e F
ish
/All
F is h
Plot of Fish Index by Site and Age
Culture Unit
TIME
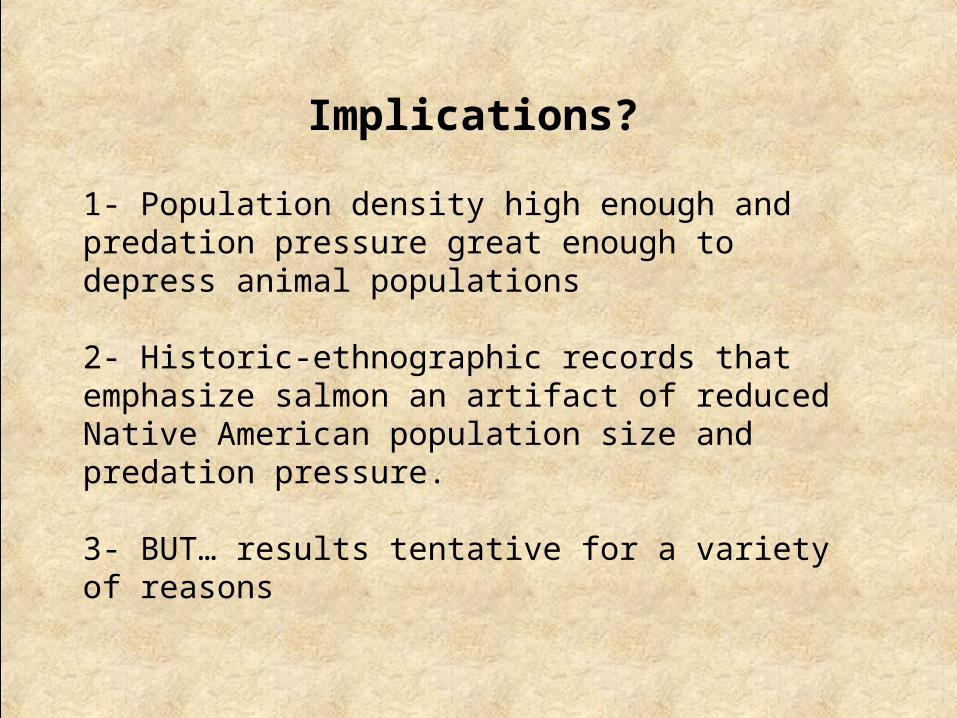
Implications?
1- Population density high enough and predation pressure great enough to depress animal populations
2- Historic-ethnographic records that emphasize salmon an artifact of reduced Native American population size and predation pressure.
3- BUT… results tentative for a variety of reasons
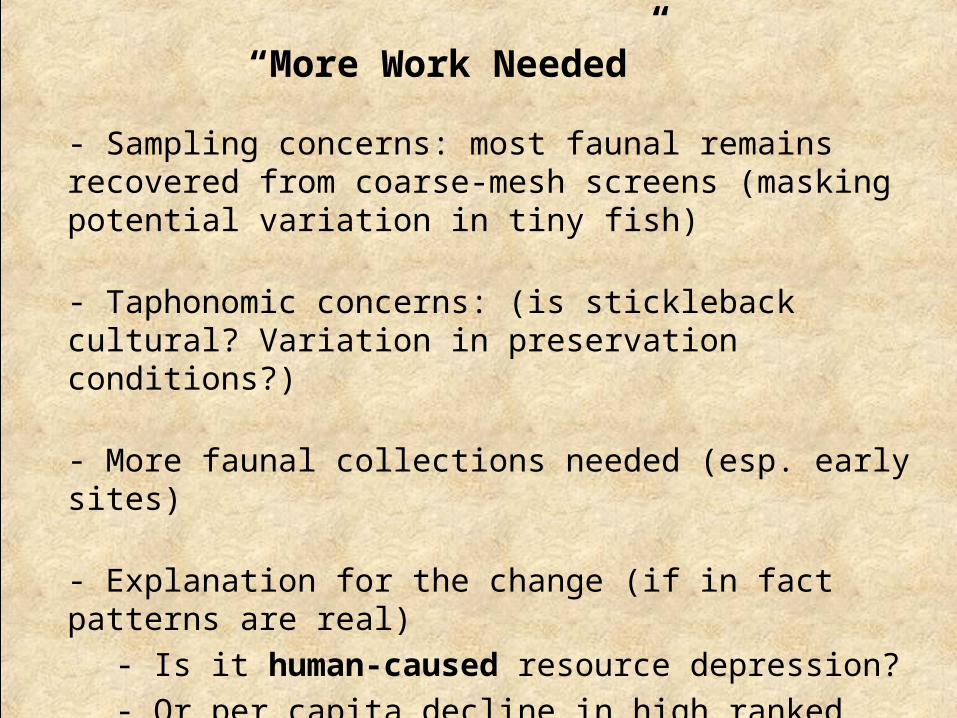
“More Work Needed”
- Sampling concerns: most faunal remains recovered from coarse-mesh screens (masking potential variation in tiny fish)
- Taphonomic concerns: (is stickleback cultural? Variation in preservation conditions?)
- More faunal collections needed (esp. early sites)
- Explanation for the change (if in fact patterns are real)
- Is it human-caused resource depression?- Or per capita decline in high ranked resources?
- What about alternate approaches to resource ranking or patch definition?
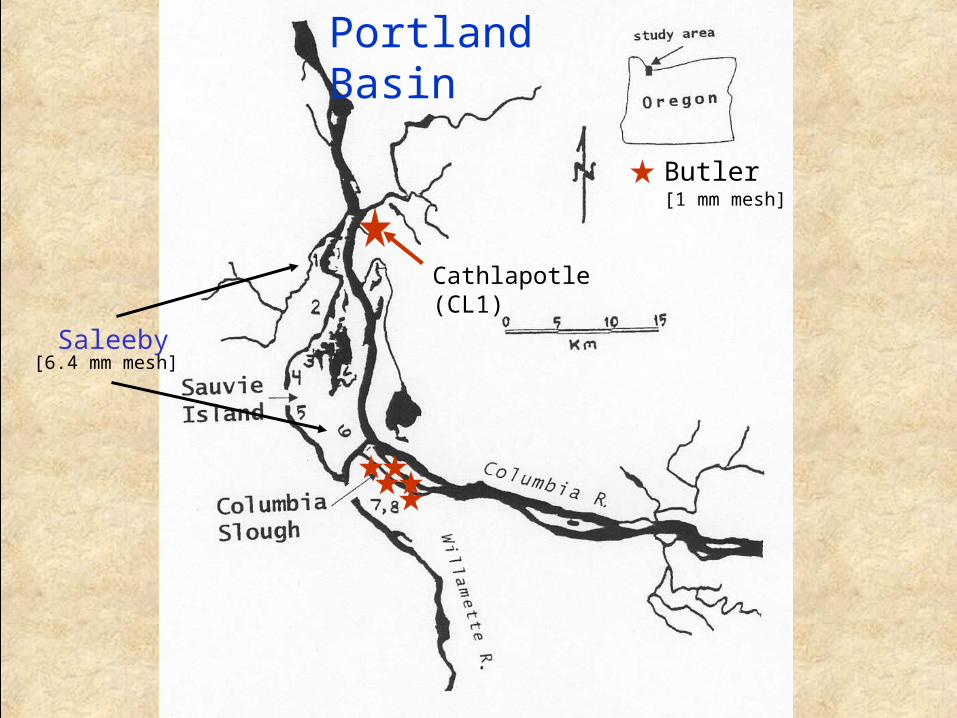
Portland Basin
Cathlapotle (CL1)
Saleeby[6.4 mm mesh]
Butler [1 mm mesh]
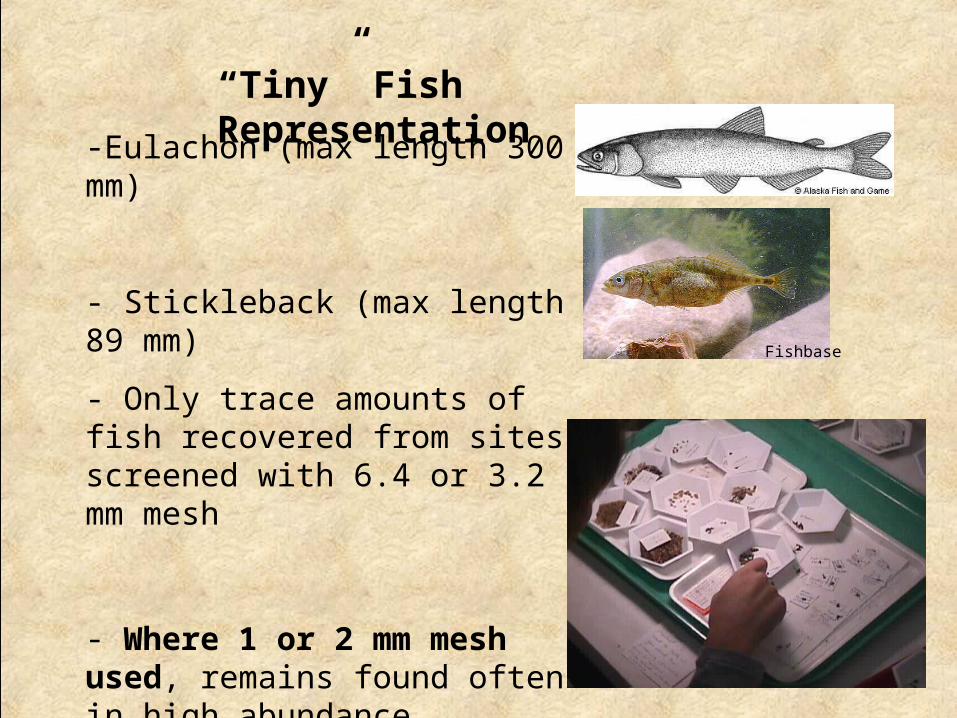
-Eulachon (max length 300 mm)
- Stickleback (max length 89 mm)
- Only trace amounts of fish recovered from sites screened with 6.4 or 3.2 mm mesh
- Where 1 or 2 mm mesh used, remains found often in high abundance
“Tiny” Fish Representation
Fishbase
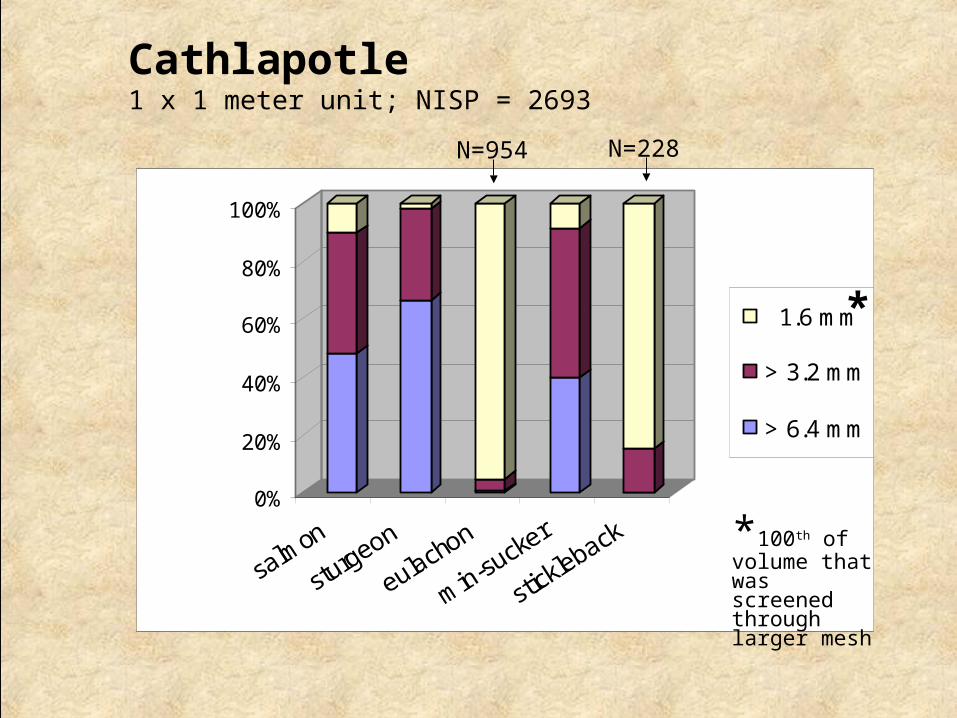
Cathlapotle1 x 1 meter unit; NISP = 2693
0%
20%
40%
60%
80%
100%
salmon
sturgeon
eulachon
min-sucker
stickleback
1.6 mm
> 3.2 mm
> 6.4 mm
N=954 N=228
*
*100th of volume that was screened through larger mesh
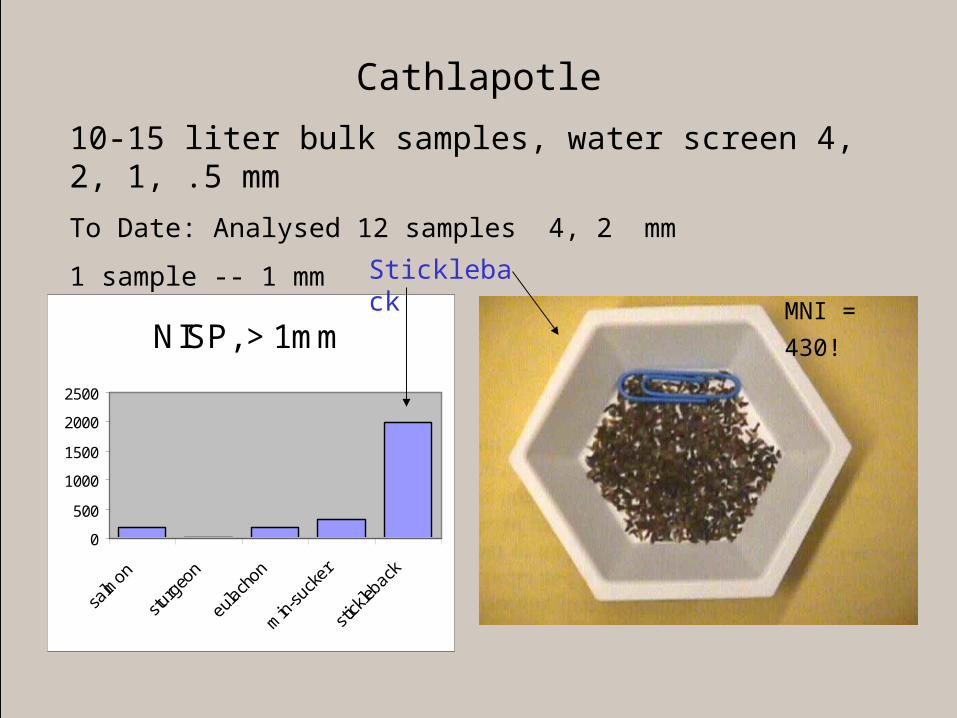
Cathlapotle
10-15 liter bulk samples, water screen 4, 2, 1, .5 mm
To Date: Analysed 12 samples 4, 2 mm
1 sample -- 1 mm
NISP, > 1mm
0
500
1000
1500
2000
2500
salm
on
sturg
eon
eula
chon
min-
suck
er
stick
leback
MNI =
430!
Stickleback
Osmeridae
Cottidae
Gaster
Cato
Cyp
Cypr/Cat
Acip
Salm
Per
cen
t80
60
40
20
0
Bulk Sample
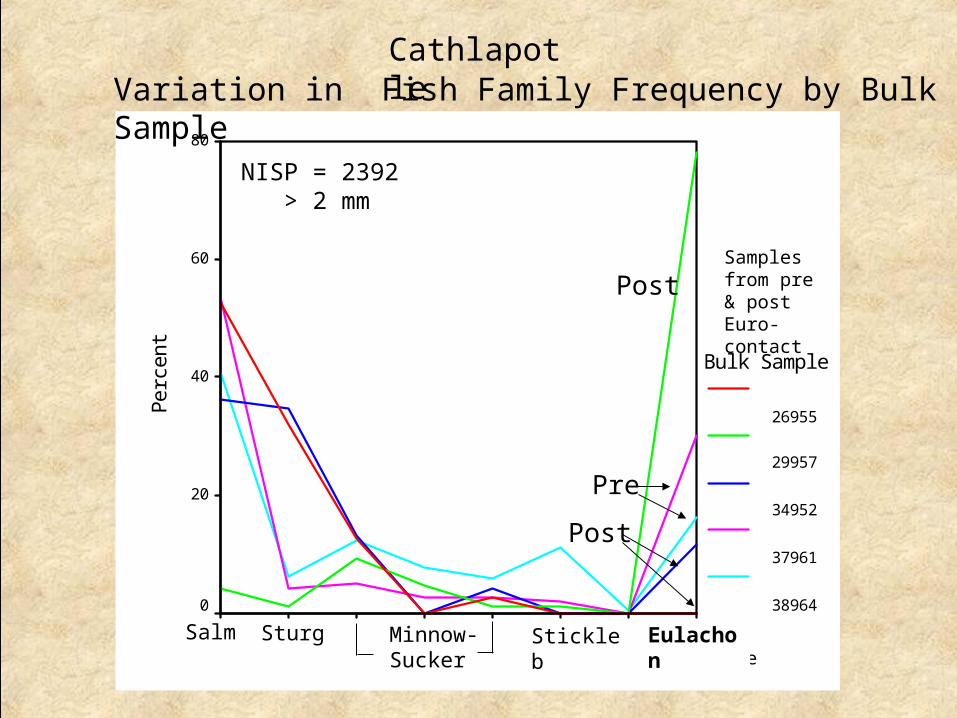
26955
29957
34952
37961
38964
Variation in Fish Family Frequency by Bulk Sample
Post
Post
Pre
NISP = 2392 > 2 mm
Salm Sturg Minnow-Sucker
Stickleb Eulachon
Cathlapotle
Samples from pre & post Euro-contact
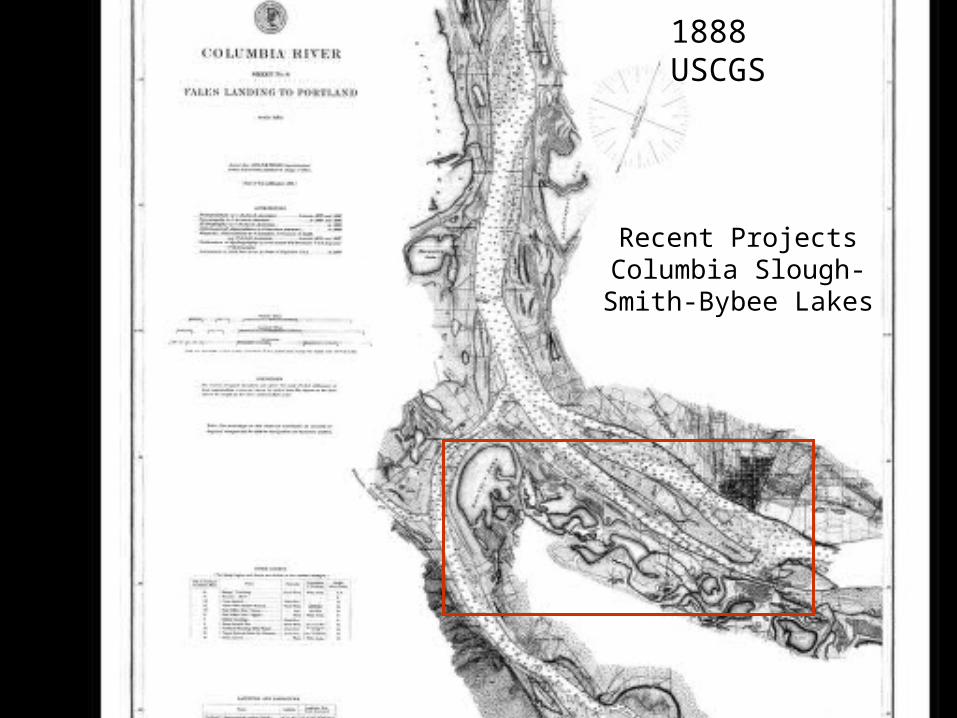
1888 USCGS
Recent Projects Columbia Slough-
Smith-Bybee Lakes
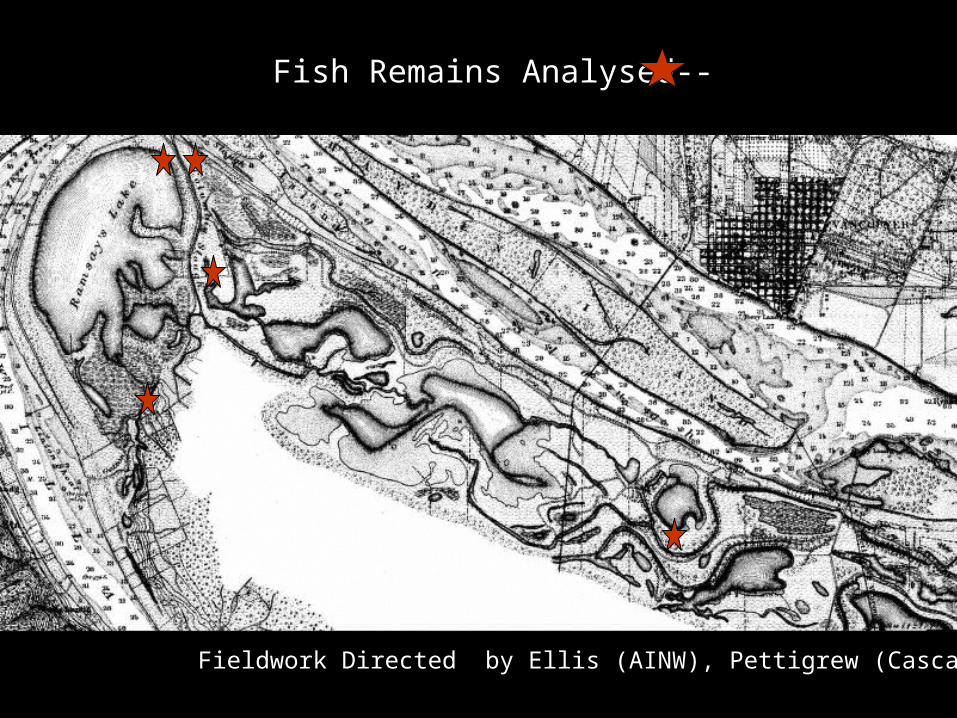
Fish Remains Analysed--
Fieldwork Directed by Ellis (AINW), Pettigrew (Cascadia)
0%
25%
50%
75%
100%
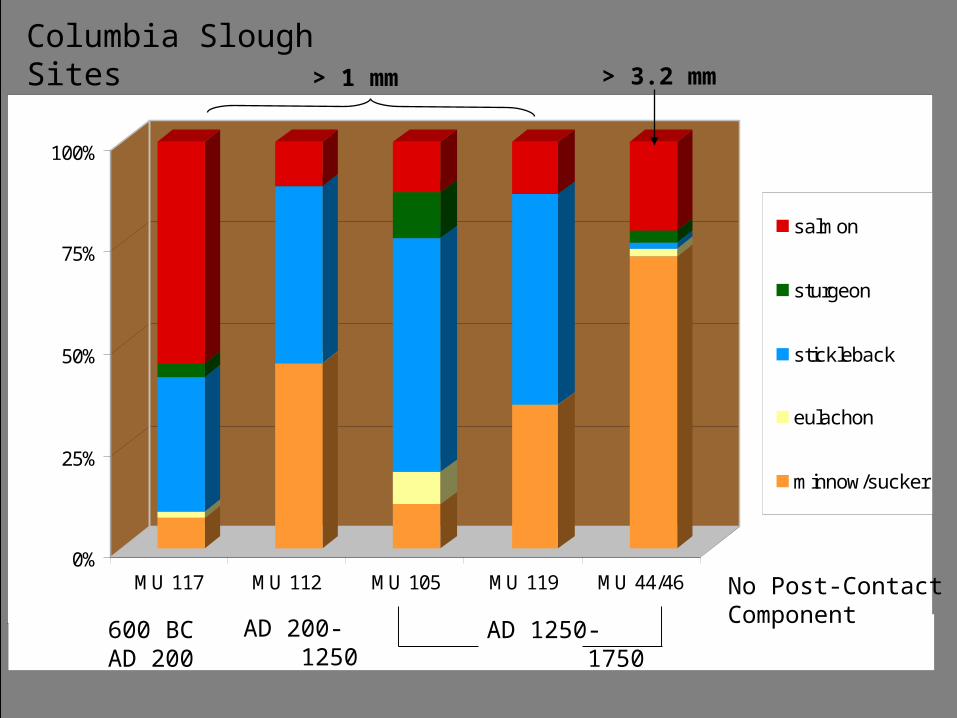
MU 117 MU 112 MU 105 MU 119 MU 44/46
salmon
sturgeon
stickleback
eulachon
minnow/sucker
AD 200- 1250
AD 1250- 1750
600 BCAD 200
> 3.2 mm
Columbia Slough Sites> 1 mm
No Post-Contact Component
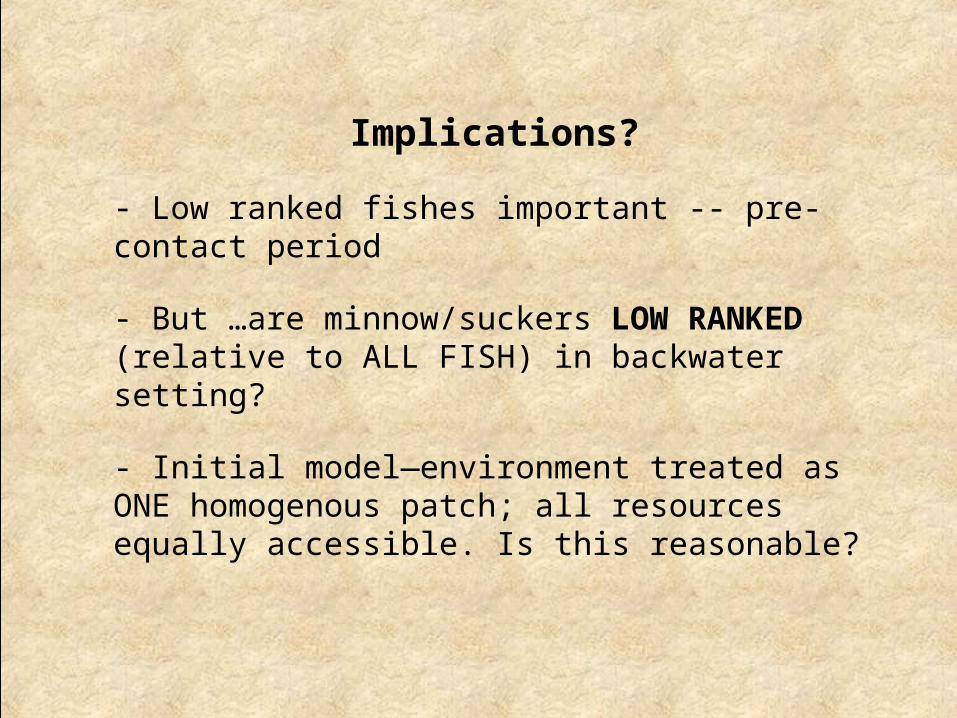
Implications?
- Low ranked fishes important -- pre-contact period
- But …are minnow/suckers LOW RANKED (relative to ALL FISH) in backwater setting?
- Initial model—environment treated as ONE homogenous patch; all resources equally accessible. Is this reasonable?
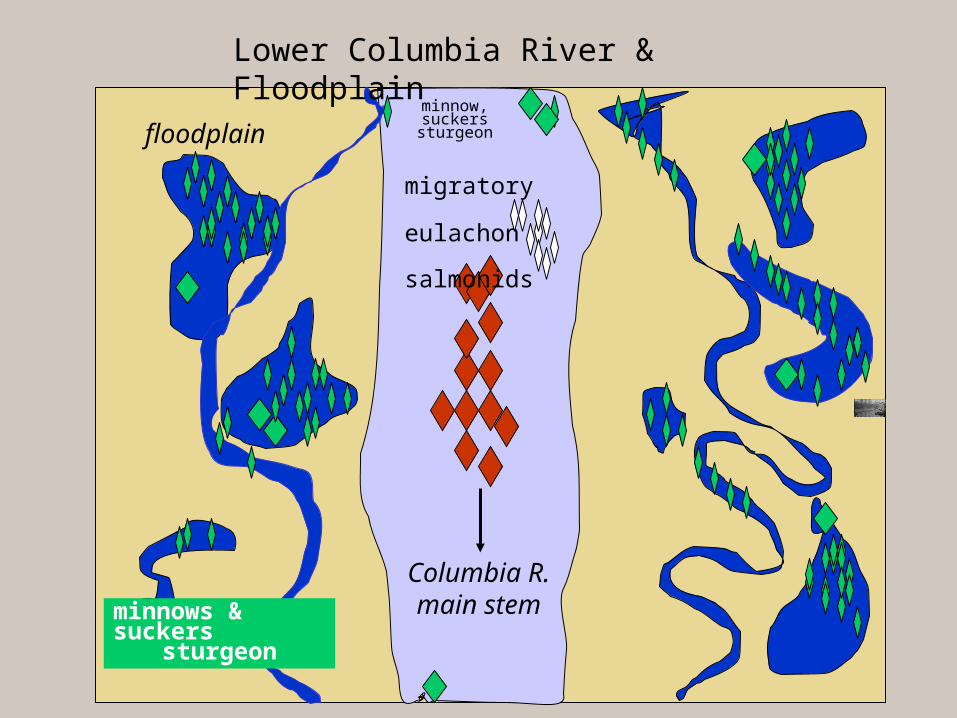
Columbia R. main
stem
migratory
eulachon
salmonids
floodplain
minnows & suckers
sturgeon
Lower Columbia River & Floodplain
minnow, suckerssturgeon
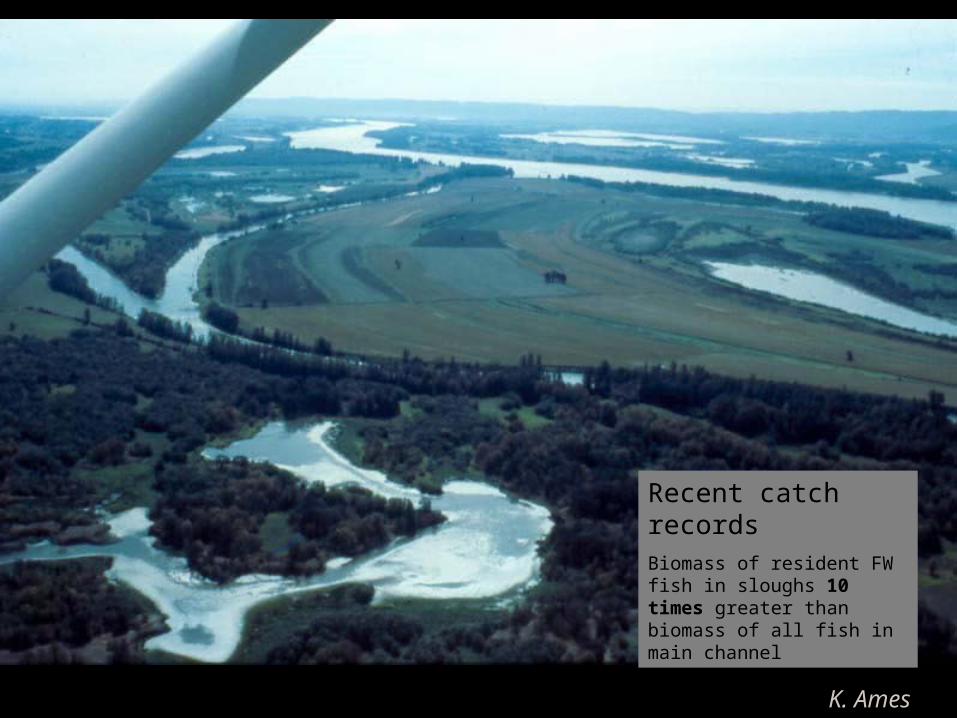
1888 Map showing extensive backwater sloughs
Recent catch recordsBiomass of resident FW fish in sloughs 10 times greater than biomass of all fish in main channel
K. Ames
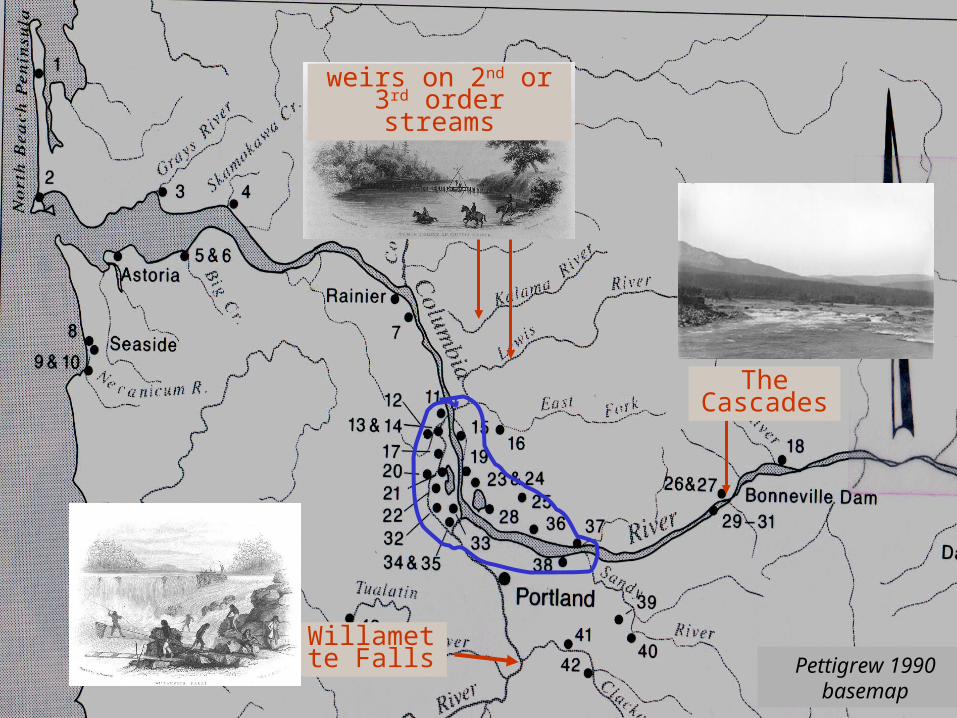
Willamette Falls
weirs on 2nd or 3rd order streams
The Cascades
Pettigrew 1990 basemap
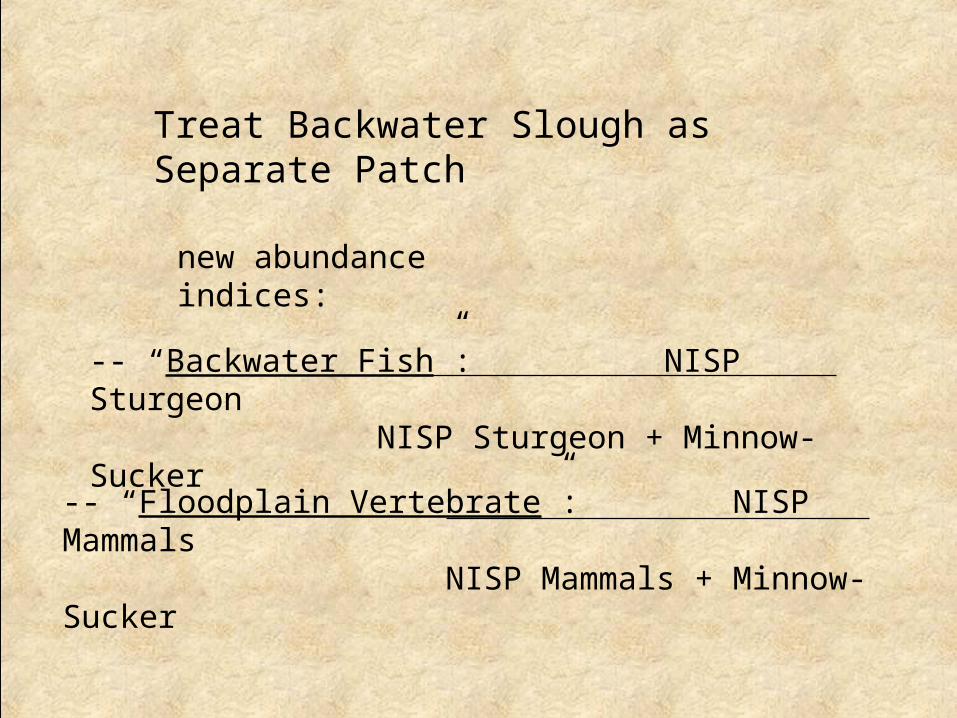
Treat Backwater Slough as Separate Patch
-- “Backwater Fish”: NISP SturgeonNISP Sturgeon + Minnow-Sucker
new abundance indices:
-- “Floodplain Vertebrate”: NISP MammalsNISP Mammals + Minnow-Sucker
sturg/sturg+minsucker
0
0.2
0.4
0.6
0.8
1
0 1 2 3 4 5600 BCAD 200
AD 200- 1250
AD 1250- 1750
AD 1750- 1835
NIS
P S
t ur g
eon/S
turg
eon &
Min
-Suc k
er
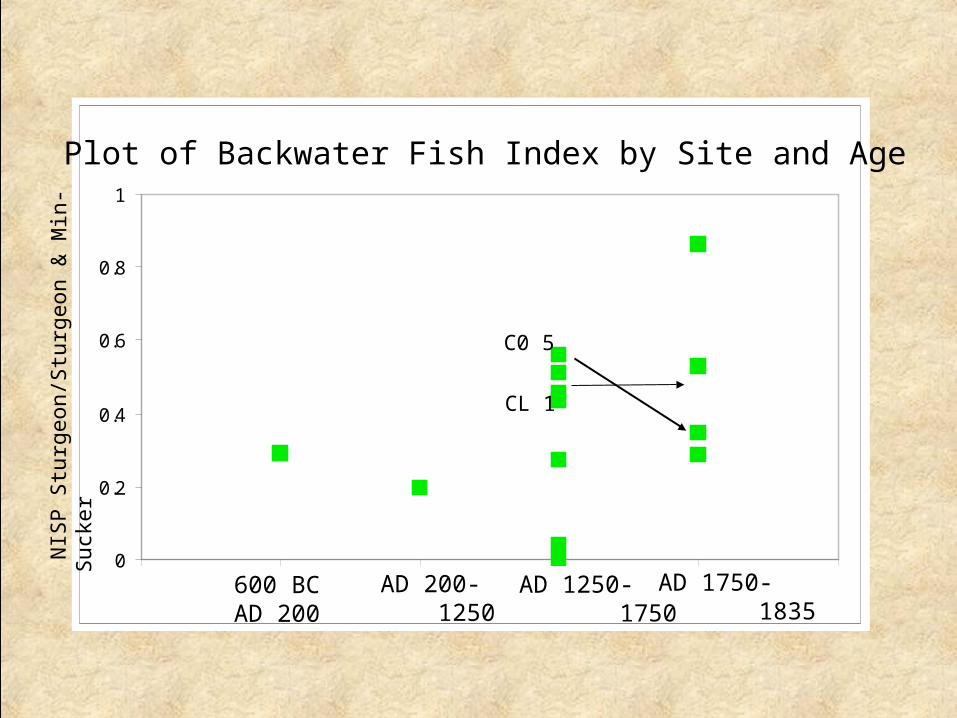
Plot of Backwater Fish Index by Site and Age
CL 1
C0 5
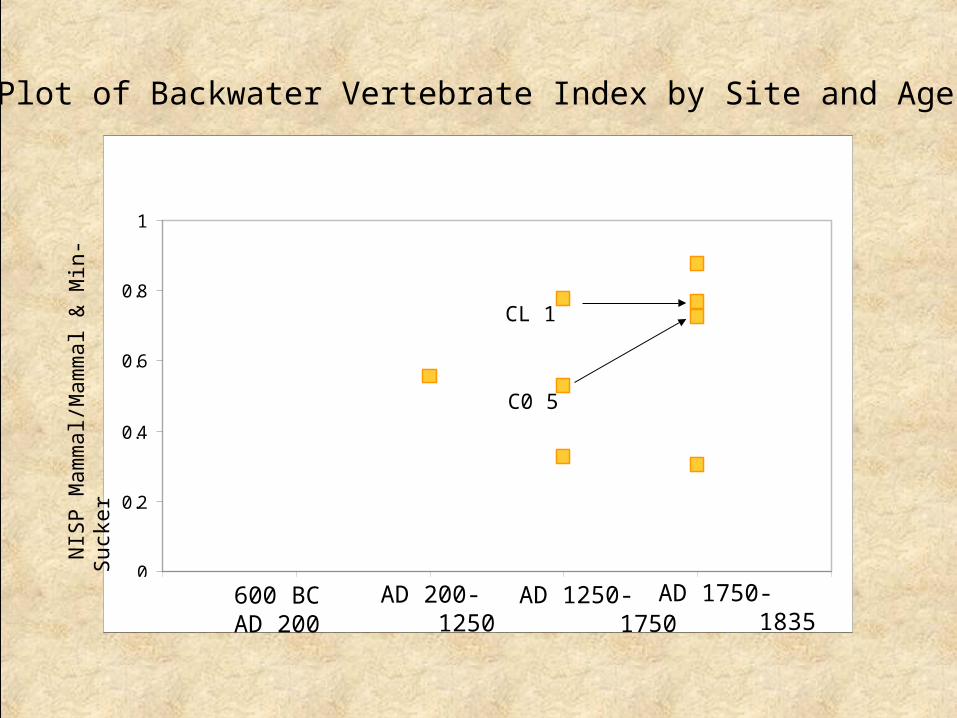
mams/mam+minnowsucker
0
0.2
0.4
0.6
0.8
1
0 1 2 3 4 5
Plot of Backwater Vertebrate Index by Site and Age N
ISP M
am
mal/M
am
mal &
Min
-Suc k
er
600 BCAD 200
AD 200- 1250
AD 1250- 1750
AD 1750- 1835
CL 1
C0 5
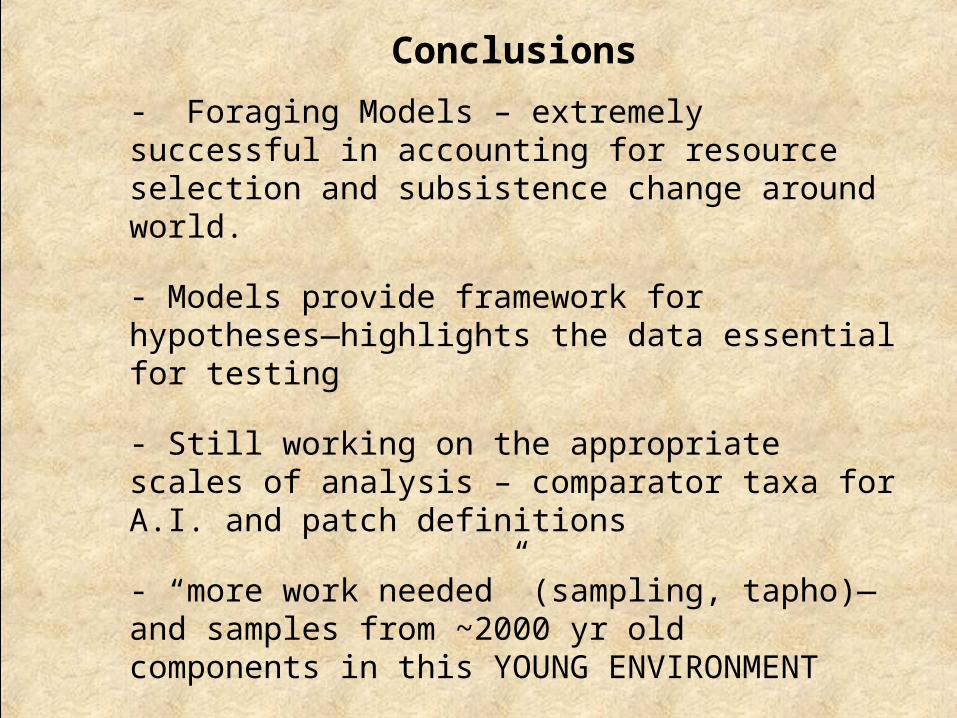
Conclusions
- Foraging Models – extremely successful in accounting for resource selection and subsistence change around world.
- Models provide framework for hypotheses—highlights the data essential for testing
- Still working on the appropriate scales of analysis – comparator taxa for A.I. and patch definitions
- “more work needed” (sampling, tapho)—and samples from ~2000 yr old components in this YOUNG ENVIRONMENT
- But we’re making progress…