Embed Size (px)
Citation preview
ON ESTIMATING ALLOCATIVE
ANALYSIS OF PRODUCTION EFFICIENCY IN CROSS-SECTIONAL
J. R. ANDERSON and JOHN L. DILLON* University of New England
In a recent reappraisal of evidence adduced for allocative efficiency in traditional agricultures, Dillon and Anderson empbyed a method based on a combination of traditional economic aspects and statistical aspects of estimated p r o d u h n functions. However, their reappraisal involved using marginal rather than the (appropriate) joint distributions of the regression coefficients. This paper investigates the emor associated with using the inappopriate marginal distribution in a reassessment of allocative efficiency in wool growing in the Australian pastoral zone.
The questioning of efficiency of resource use in the framework of static equilibrium analysis has been a popular field of research for agricultural economists over the last two decades [4]. Over recent years, particular attention has been focused on examining the hypothesis of Schultz 181 that there are few inefficiencies in the allocation of the factors of production in traditional agriculture. Most of the cross- sectional production functions for farming recently reported in the agricultural economics literature relate to production in developing economies [ 11.
Almost invariably, these studies of efficiency have been couched in terms of profit maximization. Putting aside questions of the relevance of maximizing profits, this paper reiterates that the methods traditionally used for examining resource-use efficiency have not been very appro- priate. An alternative approach presented by Dillon and Anderson [ 11 which does not rely on arbitrary statistical judgements is applied to an Australian study of economic efficiency in extensive wool growing, and account is taken of the errors involved in using a commonly available but inappropriate distribution for the regression coefficients.
Approaches to Studying A llocative Eficiency Efficiency has usually been judged by comparing estimated single-
valued marginal value products (MVP’s) with the relevant marginal factor costs (MFC’s) for the factors of production employed. The typical approach [4, Ch. 71 has been to estimate a Cobb-Douglas type production function, with elasticities denoted by b,, and then make some statistical sampling theory test of equality between the estimated MVP$ and MFC, based on the point estimates of the hi's. A common procedure has been to compute b*, such that MVP$ equals MFC, at geometric mean input levels and then, under the usual assumptions, to use the test statistic t = 16, - b*,I/SE, to assess the statistical significance of the difference between the ratio MVPJMFC, and unity.
* In undertaking this work, constructive criticism was received from J. H. Duloy, B. J. Phillips, T. W. Schultz and P. A. Yotopoulos to whom the authors are most grateful without sharing responsibility for residual errors.
146
1971 ESTIMATING ALLOCATIVE EFFICIENCY 147 Dillon and Anderson [I], in their survey of economic efficiency in
traditional agricultures, noted the lack of economic content in the arbitrary statistical judgements entailed in such procedures and pro- posed an alternative method for measuring economic efficiency in cross-sectional studies. This method was based on the concept of ex- pected opportunity loss-a central concept of the modem branch of statistics generally known at Bayesian statistics. Opportunity loss was defined as: - bi - bi (1) L = b o ( I I X i - I I X , ) where 6, and the b, ( i = 1, 2, ..., k) are the least squares regression estimates of the level and elasticities, respectively, of the Cobb-Douglas production function, and Xi are the levels of the factor inputs with a tilde denoting optimal levels and a bar denoting (geometric) mean levels, and II denotes the muItiple product operator.
The measure proposed to judge efficiency of resource use was the expectation of the loss L when the elasticities bi and therefore also the Xi , are regarded as random variables. That is, expectations are taken over the 6, while bo, the prices, and the X ( are held fixed at their sample estimates'. In such terms, for any estimated production function, the loss is a (non-linear) function of the random variables bc denoted by L(b l , b2 ..., b k ) . If the joint probability distribution of the b,'s i s denoted by f(6,, b2, ..., b k ) , the expected loss is
Y
- _ -
(2) EL = sf-.-p [L(b1, bz, ..., b k ) f(61, b ~ , ..., bk) dbl db, ... dbk]. Because of the algebraic form of L(bl , bz, ..., b k ) , it is computa-
tionally expedient to make approximate estimates of EL through a Monte Carlo evaluation rather than trying to use (2) as it stands. The procedure used by Dillon and Anderson was based on the usual assumptions of normal disturbances and the consequently multivariate normal distribution of the hi's. Computer implementation used the method of generating pseudo-random normal vectors described by Scheuer and Stoller [7]. The procedure adopted was to sample the hi's, truncate these symmetrically so that the sampled elasticities were strictly
positive, determine the corresponding X, levels and compute and accu- mulate the conditional losses. In this manner, the average loss over many repetitions of the process approaches the expected loss stochas- tically. It was found that an average loss computed from 1,000 replications gave a reasonably stable estimate of the EL and did not cost too much to compute.
However, for the studies reviewed and reassessed by Dillon and Anderson, it was not possible to obtain the variance-covariance matrices for the regression coefficients reported. Unfortunately, this is a situation encountered all too frequently in the literature of estimating production functions and is an example of a common problem of not reporting sufficient statistics. Raiff a and Schlaifer [ 61 have observed
The expected loss as defined pertains to the efficiency of the geometric mean producer. A referee suggested that an additional integration of expected loss over the sample space of farms would be of somewhat more interest. We guess that such an estimate would considerably exceed the presently defined expected loss but would raise some difficulties-particularly about the relevance of the estimated elasticities for other than the geometric mean producer.
w
148 AUSTRALIAN JOURNAL OF AGRICULTURAL ECONOMICS DEC.
that this problem pervades the whole of science and will be increasingly recognized as a problem with the wider adoption of Bayesian statistical methods.
A set of sufficient statistics for the normal multiple regression case includes9 the vector of regression coefficients ( b ) , the error mean square (s2), the moment matrix ( X ’ X ) or its inverse, and the number of observations ( n ) . Of course, sufficient statistics can be derived from a complete listing of the data used. However, it is not sufficient to report only the regression coefficients and their standard errors (or ‘t’ values). The Appendix outlines how the standard errors, error mean square, and the zero-order correlation matrix of the regressors can be employed to reconstruct the inverse moment matrix, ( X ’ X ) - I . In terms of the notation introduced, the variance-covariance matrix attached to b is ss ( X ’ X ) -I, (Johnston [ 5 ] ) . Goldberger [3] has demonstrated that this matrix is, in fact, required to compute unbiased estimates of the conditional mean response for a CobbDouglas function.
For the Dillon-Anderson study, the failure of production economists to report either the moment matrix or its inverse or the variance- covariance matrix or the correlation matrix meant that in the estimation of expected loss through ( 2 ) , the marginal rather than the joint distri- bution of the b;s had to be used. In this note an estimate is given of the extent of error in this approximate procedure through an empirical assessment of an Australian production function.
Empirical Comparisons of Expected Losses-Joint and Marginal The production functions chosen for empirical study were those
presented by Duloy [2] in his study of allocative efficiency in pastoral zone wool growing in New South Wales (N.S.W.) and Queensland during 1954-55. This choice arose out of a general interest in the economics of pastoral zone wool production and that Duloy’s production functions are the only pertinent functions available. Thus, although they are rather dated now for purposes of current or future policy, they are useful for the present methodological purpose since it was possible to reconstruct the required variance-covariance matrices.
In contrast to most studies of traditional agriculture, Duloy found considerable divergence between the estimated MVPi’s and the implicit MFCts for N.S.W. and Queensland. In particular, his results implied a shift of resources from labour and ma- chinery inputs into capital expenditure on water and fencing improvements. The observed disequilibria could be explained to some extent by institutional and risk considerations. However, he em- phasized that the extent of maladjustment was probably not as great as was suggested by the differences in MVP’s, and the differences between observed and ‘optimal’ resource mixes, because of the fairly small gains in profit from optimal (fixed-outlay constraint) recombination of non- land resources. He assessed these gains at 3 . 6 and 14.2 per cent for N.S.W. and Queensland respectively. These cases thus coincide with the more general observation of Trifon [9] that such implied adjust-
2Sufficient statistics are those that summarize all the information from a sample concerning the parameters, so that any additional statistics are unin- f onnativc.
1971 ESTIMATING ALLOCATIVE EFFICIENCY 149
ments are generally non-marginal in physical terms but sometimes economically insignificant.
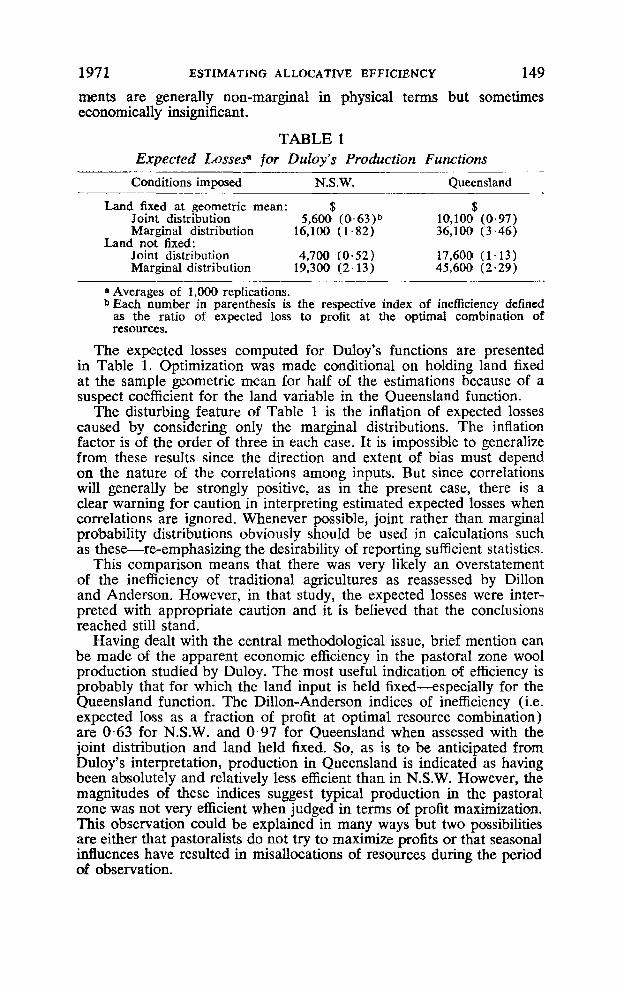
TABLE 1 Expected LosseP for Duloy’s Production Functions
Conditions imposed N.S.W. Queensland
Land fixed at geometric mean: $ $
Land not fixed:
Joint distribution 5,600 ( 0 . 6 3 ) b 10,100 (0.97) Margin a1 distribution 16,100 (1.82) 36,100 (3.46)
Joint distribution 4,700 (0 .52) 17,600 ( 1 . 1 3 ) Marginal distribution 19,300 (2.13) 45,600 (2.29)
a Averages of 1,OOO replications. b Each number in parenthesis is the respective index of inefficiency defined as the ratio of expected loss to profit at the optimal combination of resources.
The expected losses computed for Duloy’s functions are presented in Table 1. Optimization was made conditional on holding land fixed at the sample geometric mean for half of the estimations because of a suspect coefficient for the land variable in the Queensland function.
The disturbing feature of Table 1 is the inflation of expected losses caused by considering onIy the marginal distributions. The inflation factor is of the order of three in each case. It is impossible to generalize from these results since the direction and extent of bias must depend on the nature of the correlations among inputs. But since correlations will generally be strongly positive, as in the present case, there is a clear warning for caution in interpreting estimated expected losses when correlations are ignored. Whenever possible, joint rather than marginal probability distributions obviously should be used in calculations such as these-re-emphasizing the desirability of reporting sufficient statistics.
This comparison means that there was very likely an overstatement of the inefficiency of traditional agricultures as reassessed by Dillon and Anderson. However, in that study, the expected losses were inter- preted with appropriate caution and it is believed that the conclusions reached still stand.
Having dealt with the central methodological issue, brief mention can be made of the apparent economic efficiency in the pastoral zone wool production studied by Duloy. The most useful indication of efficiency is probably that for which the land input is held fixed---especially for the Queensland function. The Dillon-Anderson indices of inefficiency (i.e. expected loss as a fraction of profit at optimal resource combination) are 0.63 for N.S.W. and 0.97 for Queensland when assessed with the joint distribution and land held fixed. So, as is to be anticipated from Duloy’s interpretation, production in Queensland is indicated as having been absolutely and relatively less efficient than in N.S.W. However, the magnitudes of these indices suggest typical production in the pastoral zone was not very efficient when judged in terms of profit maximization. This observation could be explained in many ways but two possibilities are either that pastoralists do not try to maximize profits or that seasonal influences have resulted in misallocations of resources during the period of observation.
150 AUSTRALIAN JOURNAL OF AGRICULTURAL ECONOMICS DEC.
Ref ererzces [ l l Dillon, J . L., and J. R. Anderson, ‘Allocative Efficiency, Traditional Agri-
culture and Risk‘, A m . J . Agric. Econ., 53(1): 26-32, 1971. [2] DpIoy, J. H., ‘The Allocation of Resources in the Australian Sheep Industry’,
unpub. Ph.D. thesis, University of Sydney, 1963. [31 Goldberger, A. S., ‘The Interpretation and Estimation of Cobb-Douglas
Functions’, Econornetrica, 36(3-4) : 464-472, 1948. [4] Heady, E. O., and J. L. Dillon, Agricultural Production Functions, Ames:
Iowa State University Press, 1961. [S] Johnston, J., Econometric Methods, New York: Mc-Graw-Hill, 1963. [6] Raiffa, H., and R. Schlaifer, Applied Sfatistical Decision Theory, Boston:
Harvard Business School, 1961. [7] Scheuer, E. M., and D. S. Stoller, ‘On the Generation of Normal Random
Vectors’, Technornetrics, 4 ( 2 ) : 278-81, 1962. [8] Schultz, T. W., Transforming Traditional Agriculture, New Haven: Yale
University Press, 1964. [9] Trifon, R., ‘Tests of Economic Significance and Validity in the Use of
Aggregative Production Functions’, Res. Rept. No. 19, Dept. Agric. Econ., University of Manitoba, 1961.
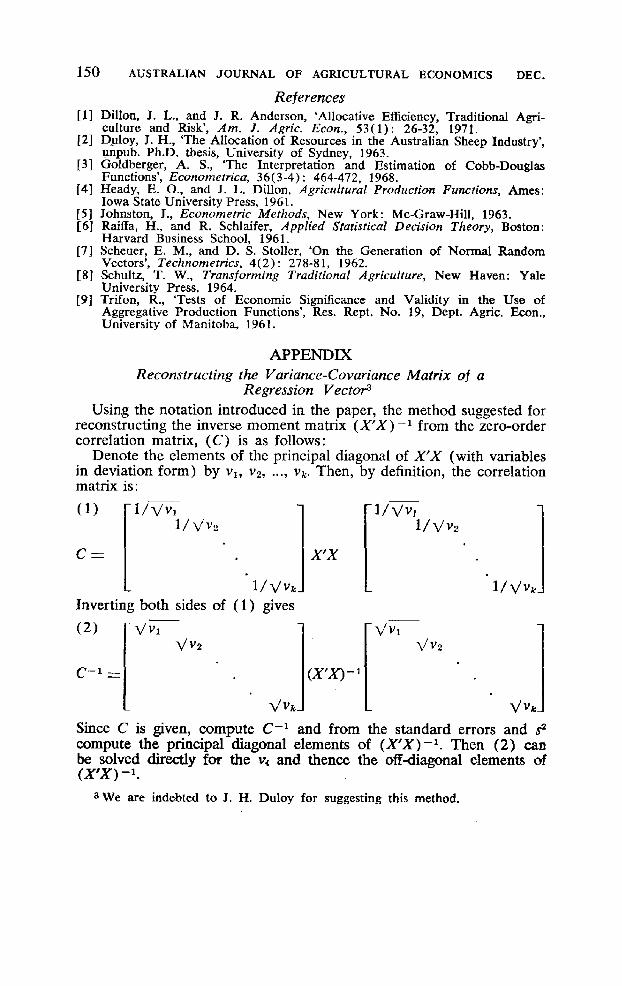
APPENDIX Reconstructing the Variance-Covariance Matrix of a
Regression Vectol3 Using the notation introduced in the paper, the method suggested for
reconstructing the inverse moment matrix (X’X) - l from the zero-order correlation matrix, (C) is as follows:
Denote the elements of the principal diagonal of X’X (with variables in deviation form) by vl, v2, ..., vk. Then, by definition, the correlation matrix is:
( 1 )
C =
l / V V Z
U V V k
Inverting both sides of (1) gives -
X‘X
Since C is given, compute C-l and from the standard errors and s2 compute the principal diagonal elements of ( X ’ X ) - l . Then (2) can be solved directly for the v4 and thence the offdiagonal elements of (X’X) -1.
3We are indebted to J. H. Duloy for suggesting this method.