Embed Size (px)
Citation preview

On-Demand Reporting Question and Answer Guide
June 27, 2016

Copyright Copyright 2009, 2016 Voya Institutional Plan Services, LLC.
All rights reserved. No part of this work may be produced or used in any form or by any means without the express written permission of the copyright owner.
All information in this document has been included for its instructional value. While every precaution has been taken with its preparation, the copyright owner does not offer any warranties or representations, nor does it accept any liability with respect to the information contained herein.

On-Demand Reporting Q& A Guide
June 23, 2016 Page i
Contents Introduction .......................................................................................................................... 1
What is On-Demand Reporting? ................................................................................... 1 How do I access the On-Demand Reporting application? ........................................... 1 What components are available to create, edit and run reports? ................................ 2 What are the Toolbar and Side Panel? ........................................................................ 2 What is a Universe? ...................................................................................................... 2 What is a Query? ........................................................................................................... 3 What is a Prompt? ......................................................................................................... 3
How do I select prompt values? .............................................................................. 3
Dashboard Reports ............................................................................................................. 4 What are dashboard reports? ....................................................................................... 4 How do I access dashboard reports? ........................................................................... 4
Standard Reports ................................................................................................................ 5 What are standard reports? .......................................................................................... 5 How do I run a standard report? ................................................................................... 6 How do I modify a standard report?.............................................................................. 7
Custom Reports .................................................................................................................. 8 How do I create a custom report? ................................................................................. 8
Formatting a Report .......................................................................................................... 14 How do I change the report title? ................................................................................ 14 How do I format the report layout? ............................................................................. 14
Working with Charts .......................................................................................................... 16 How do I add a chart to a report? ............................................................................... 16 How do I modify a chart? ............................................................................................ 17 How do I remove a chart? ........................................................................................... 17
Working with Reports ........................................................................................................ 18 How do I perform calculations on the report?............................................................. 18 How do I schedule a report to run automatically? ...................................................... 18 How do I view the report history?................................................................................ 19
Saving and Exporting Reports .......................................................................................... 20 How do I save a report? .............................................................................................. 20 How do I export a report to a different format?........................................................... 20

On-Demand Reporting Q& A Guide
June 23, 2016 Page 1
Introduction What is On-Demand Reporting?
The On-Demand Reporting application is an easy-to-use, state-of-the art reporting tool to help better monitor and manage your plan(s). With online report-generation capabilities, you can view or download specific information about your plan(s) with just a few clicks and build robust custom reports with ease. Voya On-Demand Reporting is your single source for summaries of operational metrics and historical trend analysis to help analyze plan data.
How do I access the On-Demand Reporting application? Reporting is a function of the Sponsor Web and requires that you log into this application first.
1. In the Plan Summary page, click Reports on the top menu, and then click On-Demand Reporting. The On-Demand Reporting page displays in a new window.
Note: If multiple plans are available, the Select Your Plan page displays. You must click the plan name to launch the Plan Summary page.
On-Demand Reporting Page
2. Click Launch On-Demand Reporting. The On-Demand Reporting application displays. You can use the application to report on ALL plans for which you have participant-level access.
Note: If you have restricted access to specific payroll locations (Div/Subs), only the data associated with those locations display on the reports run from the On-Demand Reporting application.

On-Demand Reporting Q& A Guide
June 23, 2016 Page 2
What components are available to create, edit and run reports? The following components are available for creating, editing and running reports.
• Toolbar and Side Panel
• Universe
• Query Filters
• Prompts
What are the Toolbar and Side Panel? The toolbar appears at the top of the application and allows you to open, save, print, add filters to reports, and more. The toolbar displays additional tabs and sub tabs in Design mode.
The Side Panel displays to the left and includes panes based on the mode in which you are viewing the document. The panel can include the following panes:
• Navigation Map pane – Lists all the reports in a document.
• User Prompt pane – Lists the default values for a prompt. You can also enter text in the values text box. Multiple items are separated by a semi-colon (;). provides different views of the current report and provides access to objects and prompts you can use in the report.
• Available Objects pane – Lists the objects available for inclusion in reports.
• Document Structure and Filters pane – Displays the structure of the document in a tree view, and displays filters applied to different report elements.
Toolbar and Side Panel
Note: You can point to the icons on the toolbar to view descriptions.
What is a Universe? A Universe is a logical group of data that contain the information needed for a report. Universe types include:
• Participant Universe – Used to run ad-hoc queries on participant-level data. Updated on a monthly basis including demographics, balances, loan and beneficiary information.
• Participant Daily – Participant-level data updated on a daily basis including demographics, balances, loan and, beneficiary information (if data is available).
• Client and Plan Summaries Universe (Historical) – Used to run ad-hoc queries on client- and plan-level trending data.

On-Demand Reporting Q& A Guide
June 23, 2016 Page 3
What is a Query? A query allows you to set criteria to limit the information corresponding to your specific needs using the Query Panel dialog box. You can use objects or user pre-defined filters, custom filters, quick filters or prompts to set up queries.
The following objects and filter appear in a folder structure in the Query panel and are available for use in queries. Each object is indicated with a symbol and you can point to the object for more information.
Dimension – Indicates objects you would group data by, such as Fund ID, Participant Status or Attained Age.
Measures – Indicates numerical data that is the result of calculations, such as Before Tax Deferral $ Current or Transfers In.
Filter – Indicates an element that you can use to narrow the repot data, such as a balance range or contribution amount range.
What is a Prompt? A prompt is a question or message that display so you can answer by either typing or selecting pre-defined values. You can build a prompt in the Query Panel dialog box.
How do I select prompt values? 1. Click the report you want to run. If the report has a prompt query filter, the Prompts dialog box
displays.
Prompts Dialog Box
2. You can select values by either entering a value or selecting a pre-defined value from the list.
Note: You can also use the Prompt dialog box to create, modify or delete a prompt variant. Prompt variant are commonly used values you can set to use when creating or running a query. To save the values from each prompt as a new prompt variant, click the Create Prompt Variant icon . To save any updates made to a prompt variant, click
the Save icon . To delete a prompt variant, click the Delete icon .
3. Click OK.
On-Demand Reporting Q& A Guide
June 23, 2016 Page 4
Dashboard Reports What are dashboard reports?
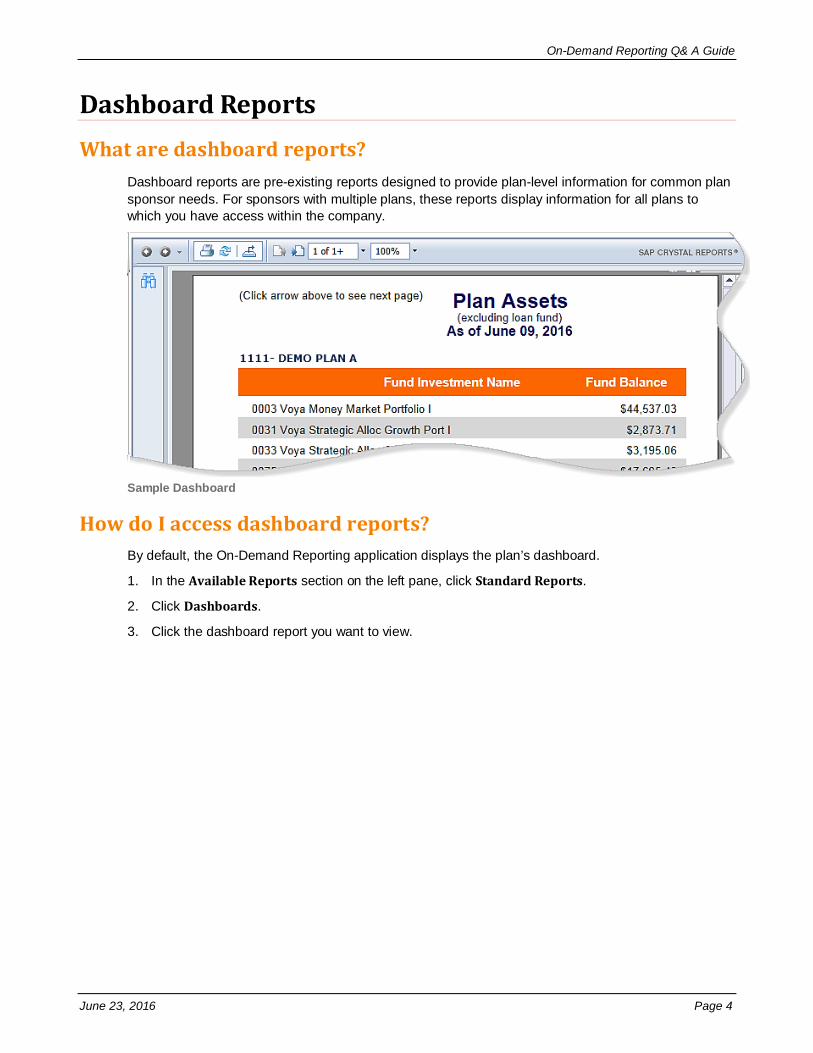
Dashboard reports are pre-existing reports designed to provide plan-level information for common plan sponsor needs. For sponsors with multiple plans, these reports display information for all plans to which you have access within the company.
Sample Dashboard
How do I access dashboard reports? By default, the On-Demand Reporting application displays the plan’s dashboard.
1. In the Available Reports section on the left pane, click Standard Reports.
2. Click Dashboards.
3. Click the dashboard report you want to view.

On-Demand Reporting Q& A Guide
June 23, 2016 Page 5
Standard Reports What are standard reports?
Standard reports are pre-existing reports designed for common plan administration needs. These reports are based on most conventional reporting needs. Standard reports are categorized according to business need.
• Balances reports – Focuses on participant balances.
• Counts reports – Returns counts of various data parameters.
• Data reports – Focuses on participants with missing data fields.
• Loans reports – Focuses on participant loan information.
Reports are stored in a folder tree structure. You can click the folder name to show and hide the reports. You can run, modify, and export standard reports to a different format.
Standard Report Categories

On-Demand Reporting Q& A Guide
June 23, 2016 Page 6
How do I run a standard report? 1. In the Standard Reports folder, click the folder that has the report you want to run.
2. Click the report title. The report displays on the right pane.
Standard Reports
3. If the report has a prompt query filter, the Prompt dialog box displays to either enter a value or select a pre-defined value from the list. For example, clicking the Participant Balance Count Between X and Y displays the Prompt dialog box to enter the minimum and maximum amounts. For more information about Prompts, see the What is a Prompt? section.
Prompts Dialog Box
4. Click OK. The report displays on the right pane.
Sample Standard Report

On-Demand Reporting Q& A Guide
June 23, 2016 Page 7
How do I modify a standard report? You must first make a copy and save the report to a plan-level folder to modify based on your requirements. For more information on saving a report or document, see the How do I save a report? section.
1. In the plan-level folder, click the report you want to modify. The report displays on the right pane.
Note: If a report requires additional filter information, the Prompt dialog box displays. You can select values by either entering a value or selecting a pre-defined value from the list. For example, clicking the “Participant Balance Count Between X and Y” report displays the Prompt dialog box to enter the minimum and maximum amounts. For more information about Prompts, see the What is a Prompt? section.
2. Click Design to view the report in Design mode.
3. Modify the report as necessary. You can drag and drop elements from the left pane and use the toolbar to modify the report as necessary. You can also make changes directly on the right pane by dragging to move cells, and select and press [DELETE] key to remove cells from tables.
Note: When clicking and dragging objects from the Available Objects section, the pointer displays a + icon indicating that you can drop the object to the area you want.
Modifying a Report – Moving Cells
4. Click the File tab and click Save.

On-Demand Reporting Q& A Guide
June 23, 2016 Page 8
Custom Reports You can create a new report with objects and different types of query filters such as pre-defined custom, quick filters and prompts. You can also format the reports based on your requirements and save in other formats such as Excel, CSV and PDF.
How do I create a custom report? 1. Click Create New Report. Web Intelligence page displays.
Create New Report Option
2. Do one of the following:
• In the Reading mode, click the New icon on the toolbar. The Create a document dialog box displays.
• In the Design mode, click the File tab and then click New icon on the toolbar. The Create a document dialog box displays.
New Document Icon

On-Demand Reporting Q& A Guide
June 23, 2016 Page 9
3. Click Universe. The Universe dialog box displays.
Create a Document Dialog Box
4. Click OK. The Universe dialog box displays.
Universe Dialog Box

On-Demand Reporting Q& A Guide
June 23, 2016 Page 10
5. Select a universe. For more information about the universe option, see the What is a Universe? section.
6. Click OK. The Query Panel dialog box displays.
7. Select objects based on the data you want to include in the report. Drag and drop the object to the Result Objects section or click the Arrow icon to the left of the Result Objects section.
Adding Result Objects
8. Change the order of the objects by selecting the object and then clicking the Move Left and Move
Right icons to the top right of the Result Objects section.
Re-Organizing Result Objects

On-Demand Reporting Q& A Guide
June 23, 2016 Page 11
9. Select pre-defined filters ( ) or objects you want to add as filter criteria in the report. Drag and drop to the Query Filters section or click the Arrow icon to the left of the Query Filters section.
Setting Query Filters
Note: Alternatively, you can click the Add a Filter icon in the Result Objects section.
10. Click the filters to specify the values you want or click Prompt to define a message to display so users can enter a value or choice when the report is opened or refreshed. For more information, see the What is a Prompt? section.
Note: You can click Refresh in the Data Preview section to preview the report created.
11. Click Run Query. The report displays in the right pane.
Note: If the report has pre-defined prompts, the Prompts dialog box displays allowing you to enter or select values.
New Report

On-Demand Reporting Q& A Guide
June 23, 2016 Page 12
12. Format the report as necessary. For more information on formatting a report, see the Formatting a Report section.
13. Do one of the following to save the document to a plan level folder.
• In the Reading mode, click the arrow next to the Save icon and then click Save As.
• In the Design mode, click the File tab, click the arrow next to the Save icon and then click Save As.
Saving a Custom Report
14. Enter the necessary information and click Save. For more information about saving a report, see the How do I save a report? section. The report displays on the right pane.
Sample Custom Report

On-Demand Reporting Q& A Guide
June 23, 2016 Page 13
15. Click Back to return to the On-Demand Reporting tool home page.
Returning to the On-Demand Reporting Tool Home Page
Note: A message displays to confirm the action. If you click Stay, you will remain on the Web Intelligence page. If you click Leave, the system does not exit you from On-Demand Reporting; but brings you back to the home page.

On-Demand Reporting Q& A Guide
June 23, 2016 Page 14
Formatting a Report How do I change the report title?
1. Click the report you want to rename. The report displays on the right pane.
2. Click Design to view the report in Design mode.
3. Click the Page Setup tab.
4. Right-click the Report tab, and click Rename Report.
Renaming a Report
5. Enter the report name.
6. Click outside the Report tab and click the Save icon on the toolbar.
How do I format the report layout? You can format a report and report elements to present the report in a preferred style. You can add color background, corporate images, add and delete cells, and more.
1. Click the report you want to format. The report displays on the right pane.
2. Click Design to view the report in Design mode.
3. Click any cell, column or row you want to modify. To format multiple cells, columns, or rows, press the [CTRL] key while making your selections.

On-Demand Reporting Q& A Guide
June 23, 2016 Page 15
4. Use the formatting options in the toolbar to format the report as needed. You can also right-click the report, header, footer, report section, table, one or more cells and select the applicable format option from the menu.
Formatting Toolbar and Formatting Menu
5. Click Save to save the changes.

On-Demand Reporting Q& A Guide
June 23, 2016 Page 16
Working with Charts The On-Demand reporting application supports many types of charts that you can use to display your data.
How do I add a chart to a report? 1. Click the report you want. The report displays on the right pane.
2. Click Design to view the report in Design mode.
3. Do one of the following to add a chart.
• Click the Reports Elements tab, Chart sub tab, a chart icon, and then click in the report. Drag and drop the dimensions and measures you want into the chart from the Available Objects pane.
• Right-click anywhere on the report, click Insert and then click the chart type you want.
• Select a table you want to turn into a chart and do one of the following:
− Click the Tools sub tab, click Turn Into, and then click a chart type.
− Right-click the table and click Turn Into, and then click a chart type.
Dragging Objects to Chart
Sample Pie Chart

On-Demand Reporting Q& A Guide
June 23, 2016 Page 17
How do I modify a chart? 1. Click the report you want. The report displays on the right pane.
2. Click Design to view the report in Design mode.
3. Select or insert a chart.
4. Do one of the following to format the chart.
• Click the Formatting tab, Chart Style sub tab, Palette Style and then click the required option.
• Right-click the chart area and click Format Chart. The Format chart dialog box displays. Click the Palette and style tab and make necessary changes.
Format Chart Dialog Box
5. Click OK.
How do I remove a chart? 1. Click the report you want. The report displays on the right pane.
2. Click Design to view the report in Design mode.
3. Do one of the following to remove the chart.
• Click the Document Structure and Filters icon in the side panel. Right-click the chart name and click Delete.
• Select the chart. Click the File tab and then click the Delete icon .
• Right-click the chart frame and click Delete.

On-Demand Reporting Q& A Guide
June 23, 2016 Page 18
Working with Reports How do I perform calculations on the report?
You can use standard calculation functions to make quick calculations on data in the report. When you apply standard calculations to table columns, the calculation results appear in footers. One footer is added to the table for each calculation.
Note: If standard calculations are not sufficient, you can use the formula language to build custom calculations.
1. Click the report you want to use. The report displays on the right pane.
2. Click Design to view the report in Design mode.
3. Click any column or row you want to use for the calculation.
4. Click the Analysis tab, and then click the Functions tab.
5. Click any of the standard calculation options available.
Standard Calculation Functions
How do I schedule a report to run automatically? 1. Click the folder that has the report you want to schedule.
Scheduling a Report
2. Click the Schedule Report icon next to the report. The Schedule Report dialog box displays on the right pane.

On-Demand Reporting Q& A Guide
June 23, 2016 Page 19
3. Enter the report name, output and schedule options.
Schedule Report Page
How do I view the report history? 1. Click the folder that has the report you want.
Report History
2. Click the Report History icon next to the report. The previous run report instances display on the right pane.
Report History Details Page

On-Demand Reporting Q& A Guide
June 23, 2016 Page 20
Saving and Exporting Reports You can save a document to the repository, or export a report or document to a different format and save it to your computer. The supported formats include PDF, XLS, XLSX, CSV or TXT.
Note: You cannot use Save As to save the document or report as a text, Excel or PDF file, however you can export documents or reports in those formats to your computer or another location.
How do I save a report? 1. Click the report you want to use. The report displays on the right pane.
2. Do one of the following:
• In the Reading mode, click the arrow next to the Save icon and then click Save As.
• In the Design mode, click the File tab, click the arrow next to the Save icon and then click Save As.
3. Select the folder in which you want to save the report or document.
4. In the Filename box, type the name of the report or document.
5. Click the Expand/Toggle icon to display additional report or document options.
6. (Optional) In the Description box, type a description about the report or document.
7. (Optional) In the Keywords box, type keywords that you or other users can use to search for the report or document.
8. (Optional) In the Assign Category box, click the categories you want to associate with the report or document.
9. (Optional) Select Refresh on open to refresh the report or document each time it is opened.
10. (Optional) Select Permanent regional formatting to preserve the document regional formatting with the report or document.
11. Click Save.
Note: If you are not allowed to save the report to the selected folder, an error message displays. You must select your plan level folder to save the report.
How do I export a report to a different format? 1. Click the folder that has the report you want to export.
2. Do one of the following:
• In the Reading mode, click the arrow next to the Export icon on the toolbar.
• In the Design mode, click the File tab and then click the arrow next to the Export icon on the toolbar.

On-Demand Reporting Q& A Guide
June 23, 2016 Page 21
3. Click one of the following options.
• Export Document As – Exports data for all of the report’s worksheets.
• Export Current Report As – Exports only the data in the current report to the selected format.
• Export Data to CSV – Exports the raw data in the report to CSV format.
4. Click Save as in the File Download dialog box and navigate to the folder where you want to save the file.
Displayed below are some examples of various formats:
Excel
Excel Report Format
CSV
CSV Report Format

On-Demand Reporting Q& A Guide
June 23, 2016 Page 22
PDF Report Format
Note: To export a report to PDF format, you must have Adobe Reader available on your computer. For more information on downloading Adobe Reader, go to get.adobe.com/reader.