Embed Size (px)
Citation preview
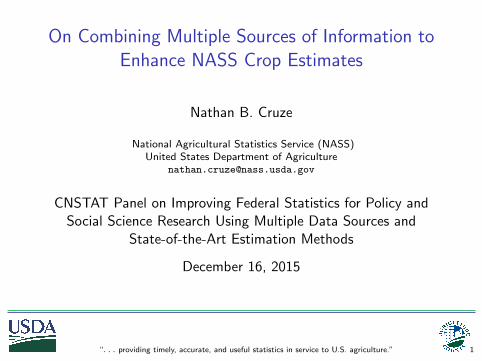
On Combining Multiple Sources of Information toEnhance NASS Crop Estimates
Nathan B. Cruze
National Agricultural Statistics Service (NASS)United States Department of Agriculture
CNSTAT Panel on Improving Federal Statistics for Policy andSocial Science Research Using Multiple Data Sources and
State-of-the-Art Estimation Methods
December 16, 2015
“. . . providing timely, accurate, and useful statistics in service to U.S. agriculture.” 1
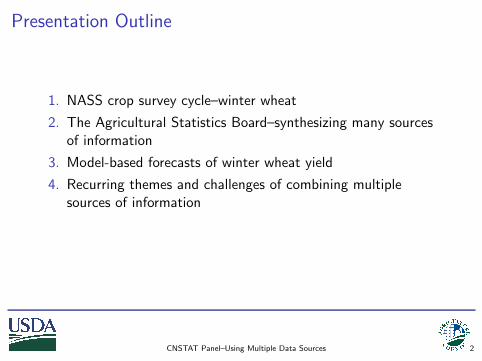
Presentation Outline
1. NASS crop survey cycle–winter wheat
2. The Agricultural Statistics Board–synthesizing many sourcesof information
3. Model-based forecasts of winter wheat yield
4. Recurring themes and challenges of combining multiplesources of information
CNSTAT Panel–Using Multiple Data Sources 2
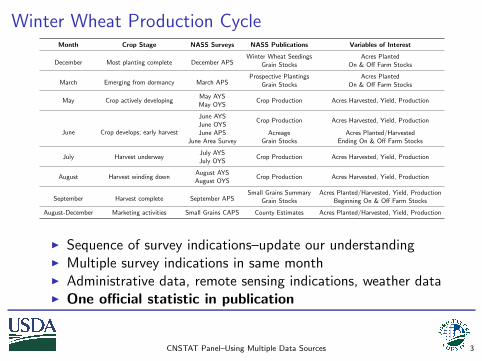
Winter Wheat Production CycleMonth Crop Stage NASS Surveys NASS Publications Variables of Interest
December Most planting complete December APSWinter Wheat Seedings Acres Planted
Grain Stocks On & Off Farm Stocks
March Emerging from dormancy March APSProspective Plantings Acres Planted
Grain Stocks On & Off Farm Stocks
May Crop actively developingMay AYS
Crop Production Acres Harvested, Yield, ProductionMay OYS
June Crop develops; early harvest
June AYSCrop Production Acres Harvested, Yield, Production
June OYSJune APS Acreage Acres Planted/Harvested
June Area Survey Grain Stocks Ending On & Off Farm Stocks
July Harvest underwayJuly AYS
Crop Production Acres Harvested, Yield, ProductionJuly OYS
August Harvest winding downAugust AYS
Crop Production Acres Harvested, Yield, ProductionAugust OYS
September Harvest complete September APSSmall Grains Summary Acres Planted/Harvested, Yield, Production
Grain Stocks Beginning On & Off Farm Stocks
August-December Marketing activities Small Grains CAPS County Estimates Acres Planted/Harvested, Yield, Production
I Sequence of survey indications–update our understandingI Multiple survey indications in same monthI Administrative data, remote sensing indications, weather dataI One official statistic in publication
CNSTAT Panel–Using Multiple Data Sources 3
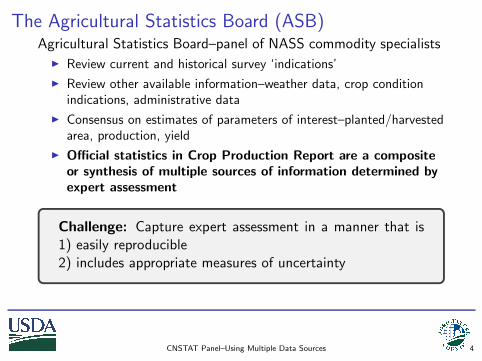
The Agricultural Statistics Board (ASB)Agricultural Statistics Board–panel of NASS commodity specialists
I Review current and historical survey ‘indications’
I Review other available information–weather data, crop conditionindications, administrative data
I Consensus on estimates of parameters of interest–planted/harvestedarea, production, yield
I Official statistics in Crop Production Report are a compositeor synthesis of multiple sources of information determined byexpert assessment
Challenge: Capture expert assessment in a manner that is1) easily reproducible2) includes appropriate measures of uncertainty
CNSTAT Panel–Using Multiple Data Sources 4
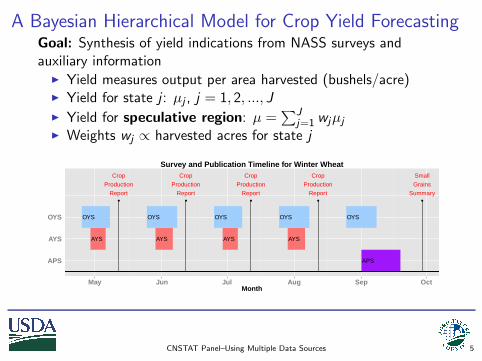
A Bayesian Hierarchical Model for Crop Yield ForecastingGoal: Synthesis of yield indications from NASS surveys andauxiliary information
I Yield measures output per area harvested (bushels/acre)I Yield for state j : µj , j = 1, 2, ..., JI Yield for speculative region: µ =
∑Jj=1 wjµj
I Weights wj ∝ harvested acres for state j
APS
AYSAYSAYSAYS
OYSOYSOYSOYSOYS
● ● ● ● ●
Crop
Production
Report
Crop
Production
Report
Crop
Production
Report
Crop
Production
Report
Small
Grains
Summary
APS
AYS
OYS
May Jun Jul Aug Sep OctMonth
Survey and Publication Timeline for Winter Wheat
CNSTAT Panel–Using Multiple Data Sources 5
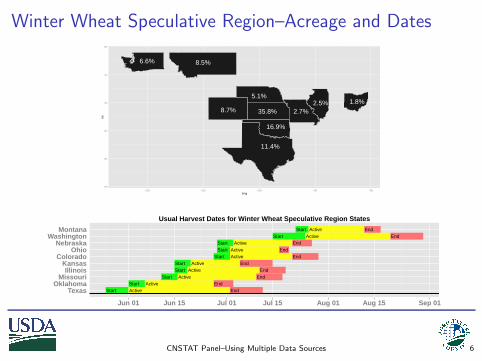
Winter Wheat Speculative Region–Acreage and Dates
1.8%2.5%2.7%
5.1%
8.7% 35.8%
16.9%
11.4%
8.5%6.6%
25
30
35
40
45
50
−120 −110 −100 −90 −80long
lat
StartStart
StartStartStart
StartStartStart
StartStart
ActiveActive
ActiveActive
ActiveActiveActive
ActiveActive
Active
EndEnd
EndEnd
EndEnd
EndEnd
EndEnd
TexasOklahoma
MissouriIllinois
KansasColorado
OhioNebraska
WashingtonMontana
Jun 01 Jun 15 Jul 01 Jul 15 Aug 01 Aug 15 Sep 01
Usual Harvest Dates for Winter Wheat Speculative Region States
CNSTAT Panel–Using Multiple Data Sources 6
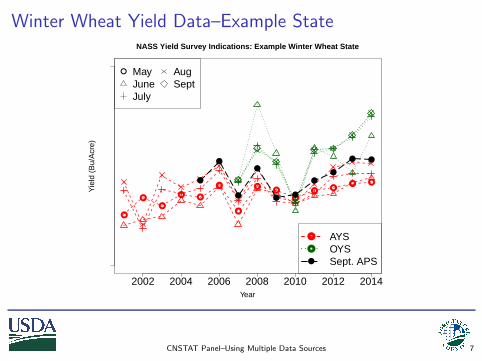
Winter Wheat Yield Data–Example State
●
●
●
● ●
●
●
●●
●● ●
● ●
NASS Yield Survey Indications: Example Winter Wheat State
Year
Yie
ld (
Bu/
Acr
e)
2002 2004 2006 2008 2010 2012 2014
●
●
●
●
●●
●
●
● ●
●
●
●
AYSOYSSept. APS
● MayJuneJuly
AugSept
CNSTAT Panel–Using Multiple Data Sources 7
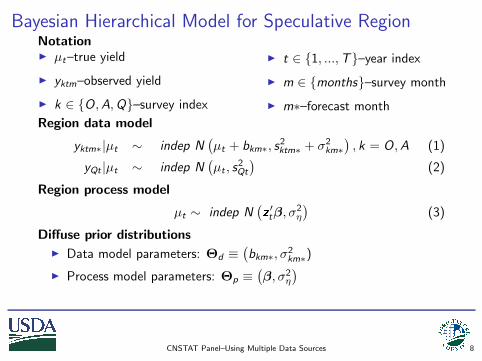
Bayesian Hierarchical Model for Speculative RegionNotationI µt–true yield
I yktm–observed yield
I k ∈ {O,A,Q}–survey index
I t ∈ {1, ...,T}–year index
I m ∈ {months}–survey month
I m∗–forecast month
Region data model
yktm∗|µt ∼ indep N(µt + bkm∗, s
2ktm∗ + σ2
km∗), k = O,A (1)
yQt |µt ∼ indep N(µt , s
2Qt
)(2)
Region process model
µt ∼ indep N(z′tβ, σ
2η
)(3)
Diffuse prior distributions
I Data model parameters: Θd ≡(bkm∗, σ
2km∗)
I Process model parameters: Θp ≡(β, σ2
η
)
CNSTAT Panel–Using Multiple Data Sources 8
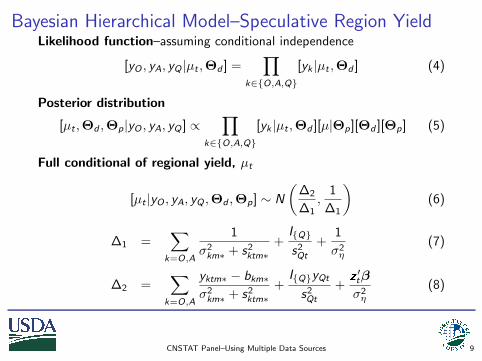
Bayesian Hierarchical Model–Speculative Region YieldLikelihood function–assuming conditional independence
[yO , yA, yQ |µt ,Θd ] =∏
k∈{O,A,Q}
[yk |µt ,Θd ] (4)
Posterior distribution
[µt ,Θd ,Θp|yO , yA, yQ ] ∝∏
k∈{O,A,Q}
[yk |µt ,Θd ][µ|Θp][Θd ][Θp] (5)
Full conditional of regional yield, µt
[µt |yO , yA, yQ ,Θd ,Θp] ∼ N
(∆2
∆1,
1
∆1
)(6)
∆1 =∑
k=O,A
1
σ2km∗ + s2ktm∗
+I{Q}s2Qt
+1
σ2η
(7)
∆2 =∑
k=O,A
yktm∗ − bkm∗σ2km∗ + s2ktm∗
+I{Q}yQt
s2Qt
+z′tβ
σ2η
(8)
CNSTAT Panel–Using Multiple Data Sources 9
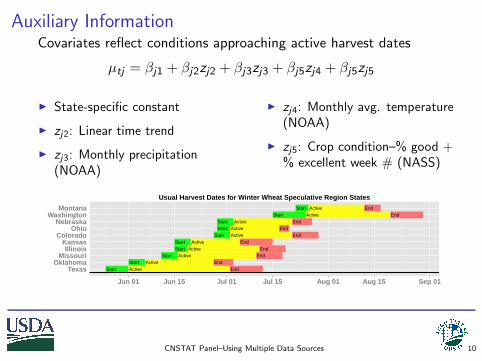
Auxiliary InformationCovariates reflect conditions approaching active harvest dates
µtj = βj1 + βj2zj2 + βj3zj3 + βj5zj4 + βj5zj5
I State-specific constant
I zj2: Linear time trend
I zj3: Monthly precipitation(NOAA)
I zj4: Monthly avg. temperature(NOAA)
I zj5: Crop condition–% good +% excellent week # (NASS)
StartStart
StartStartStart
StartStartStart
StartStart
ActiveActive
ActiveActive
ActiveActiveActive
ActiveActive
Active
EndEnd
EndEnd
EndEnd
EndEnd
EndEnd
TexasOklahoma
MissouriIllinois
KansasColorado
OhioNebraska
WashingtonMontana
Jun 01 Jun 15 Jul 01 Jul 15 Aug 01 Aug 15 Sep 01
Usual Harvest Dates for Winter Wheat Speculative Region States
CNSTAT Panel–Using Multiple Data Sources 10
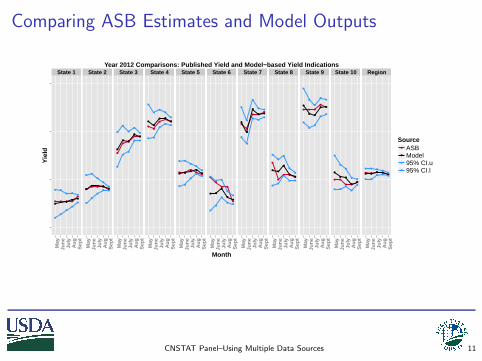
Comparing ASB Estimates and Model Outputs
State 1 State 2 State 3 State 4 State 5 State 6 State 7 State 8 State 9 State 10 Region
●
●●●●●●
●●●
●●●
●●
●
●
●
●
●
●●●●
● ●●●●
●●
●
●
●●
●●
●
●
●
●●
●●
●
●●
●●
●
●
●
●
●
●
●●
●●
●
●●
●
●●
●
●●
●
●
●
●●
●
●
●●
●
●●
●●
●●● ●
●●●●
●
●●
●●
●●
●
●●
●
●●
●
●
●●
●
●●●
●
●●
●
●●
●
●
●
●●●
●
●
●●
●
●
●
●●
●
●
●
●●
●
●
●
●●●
●
●
●●
●
●●●
●
●
●
●
●●
●
●●
●●
●●●●●
●●
●
●●
●
●
●
●●
●●
●
●●●
●●●
●
●●
●
●●
●
●
●
●
●
●●●
● ● ● ●●● ●
● ●●
● ● ●●
●
● ●
● ● ●
May
June
July
Aug
Sep
t
May
June
July
Aug
Sep
t
May
June
July
Aug
Sep
t
May
June
July
Aug
Sep
t
May
June
July
Aug
Sep
t
May
June
July
Aug
Sep
t
May
June
July
Aug
Sep
t
May
June
July
Aug
Sep
t
May
June
July
Aug
Sep
t
May
June
July
Aug
Sep
t
May
June
July
Aug
Sep
t
Month
Yie
ld
Source●
●
●
●
ASBModel95% CI.u95% CI.l
Year 2012 Comparisons: Published Yield and Model−based Yield Indications
CNSTAT Panel–Using Multiple Data Sources 11
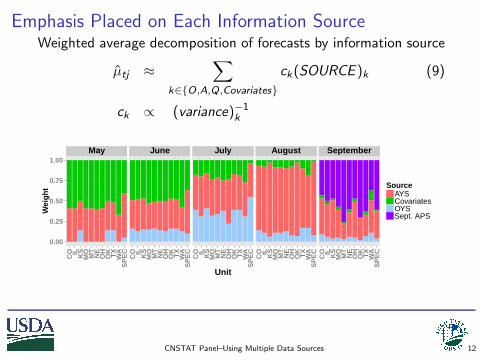
Emphasis Placed on Each Information SourceWeighted average decomposition of forecasts by information source
µ̂tj ≈∑
k∈{O,A,Q,Covariates}
ck(SOURCE )k (9)
ck ∝ (variance)−1k
May June July August September
0.00
0.25
0.50
0.75
1.00
CO IL KS
MO
MT
NE
OH
OK TX
WA
SP
EC
CO IL KS
MO
MT
NE
OH
OK TX
WA
SP
EC
CO IL KS
MO
MT
NE
OH
OK TX
WA
SP
EC
CO IL KS
MO
MT
NE
OH
OK TX
WA
SP
EC
CO IL KS
MO
MT
NE
OH
OK TX
WA
SP
EC
Unit
Wei
ght Source
AYS Covariates OYS Sept. APS
CNSTAT Panel–Using Multiple Data Sources 12
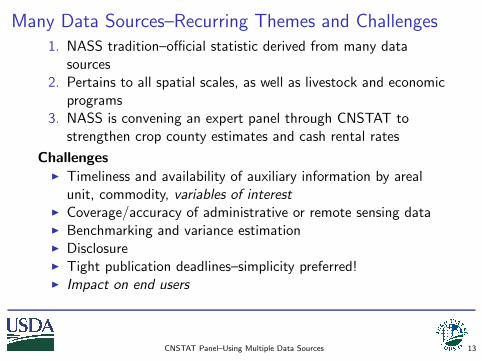
Many Data Sources–Recurring Themes and Challenges1. NASS tradition–official statistic derived from many data
sources2. Pertains to all spatial scales, as well as livestock and economic
programs3. NASS is convening an expert panel through CNSTAT to
strengthen crop county estimates and cash rental rates
ChallengesI Timeliness and availability of auxiliary information by areal
unit, commodity, variables of interestI Coverage/accuracy of administrative or remote sensing dataI Benchmarking and variance estimationI DisclosureI Tight publication deadlines–simplicity preferred!I Impact on end users
CNSTAT Panel–Using Multiple Data Sources 13
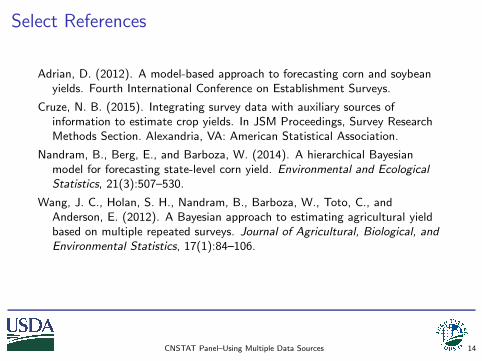
Select References
Adrian, D. (2012). A model-based approach to forecasting corn and soybeanyields. Fourth International Conference on Establishment Surveys.
Cruze, N. B. (2015). Integrating survey data with auxiliary sources ofinformation to estimate crop yields. In JSM Proceedings, Survey ResearchMethods Section. Alexandria, VA: American Statistical Association.
Nandram, B., Berg, E., and Barboza, W. (2014). A hierarchical Bayesianmodel for forecasting state-level corn yield. Environmental and EcologicalStatistics, 21(3):507–530.
Wang, J. C., Holan, S. H., Nandram, B., Barboza, W., Toto, C., andAnderson, E. (2012). A Bayesian approach to estimating agricultural yieldbased on multiple repeated surveys. Journal of Agricultural, Biological, andEnvironmental Statistics, 17(1):84–106.
CNSTAT Panel–Using Multiple Data Sources 14