Embed Size (px)
Citation preview
I R V I N G F I S H E R C O M M I T T E E
O N C E N T R A L - B A N K S TAT I S T I C S
ifc Bulletin
Contents
Follow-up of the application for
Section status within ISI
IFC Conference Basel, 2004
Participation in ISI Session Syney, 2005
Discussants’ comments
Berlin 2003
Extended Papers
Berlin 2003
No. 17 • February 2004
The Irving Fisher Committee is part
of the International Statistical Institute
Contents
NEWS .................................................................................................5Short Report of the IFC Administrative Meeting,
Berlin, 15 August 2003 ...............................................................5The response of the ISI General Assembly to the IFC’s
application for Section status ......................................................9The follow-up of the IFC’s application for Section status
within the ISI .............................................................................10IFC Conference in Basel (2004) ..................................................11Participation of the IFC in ISI Session, Sydney, 2005..................14
BERLIN 2003
DISCUSSANTS’ COMMENTS
The use of hedonic methods for quality-adjusted prices,John Astin ..................................................................................15
Use of statistics in developing monetary policy,Alfred De Marco ........................................................................18
Use of statistics in developing monetary policy,Diwa C. Guinigundo .................................................................22
EXTENDED PAPERS
The role of statistics in the conduct of monetary policyin Albania, Shelquim Cani and Gramos Kolasi .......................25
Measuring Tourism in the context of International Tradein Services, Antonio Massieu ...................................................39
FATS statistics: Multinational enterprises, the globalizationprocess and BoP data, Frédéric Boccara, François Renard .....44
Implementing the Manual on Statistics of International Tradein Services: Are we progressing? William Cave .......................62
Travel in Balance of Payments tatistics, Branimir Gruiæ andIgor Jemriæ ................................................................................67
Multidimensional insights on Italy’s outbound business travel,Giovanni Giuseppe Ortolani and Andrea Alivernini ................74
Sample surveys at the Bank of Italy, Raffaele Tartaglia Polcini .87
Irving Fisher Committee
on Central-Bank Statistics
Chair:Paul van den Bergh
Executive Body:Paul van den Bergh
Almut Steger
Rudi Acx
Radha Binod Barman
Carol S. Carson
Kenneth Coates
Bart Meganck
Marius van Nieuwkerk
Hans van Wijk
IFC Secretariat:Rudi Acx
National Bank of Belgium
De Berlaimontlaan 14
1000 Brussels, Belgium
Tel.: +32-2-221 2403
Fax: +32-2-221 3230
E-mail: [email protected]
IFC-Bulletin
Editor:Hans van Wijk
Editorial Address:Burg. s’Jacoblaan 63
1401 BP Bussum
The Netherlands
Tel./Fax: +31-35-6931532
E-mail: [email protected]
The IFC-Bulletin ispublished at irregular intervals.
Subscriptions are available free of charge.Send requests to the IFC Office.
ifc BulletinNo 17 – February 2004
What is the IFC?
The Irving Fisher Committee (IFC) is a forum for dis-cussion on statistical issues that are of interest to centralbanks. The Committee, which derives its name from thegreat American economist and statistician Irving Fisher,is part of the International Statistical Institute (ISI).
Objectives
By providing a forum for discussion, the IFC aims at:• participating in the discussion on adapting statistical
systems to changing requirements;• promoting the adoption of international statistical
standards and methodologies;• sharing experience on the development of new statis-
tics and the implementation of new methods of col-lecting, compiling and disseminating statistical infor-mation;
• exchanging views between central bankers and aca-demics on statistical methods and techniques;
• facilitating personal contacts between central-bankstatisticians.
Strategy
To achieve its objectives, the IFC organizes confer-ences, which take place both inside and outside theframework of the ISI’s biennial Sessions. The first “out-side” conference – on the challenges to central bank sta-tistical activities – is scheduled for summer 2002 at theBank for International Settlements in Basle.
The conferences are supported by the publication ofthe IFC Bulletin, which contains the conference papersand other articles.
The IFC has a Web site (http://www.ifcommittee.org), on which an electronic version of the IFC Bulletincan be found.
What kind of topics are discussed?
Any kind of theoretical or practical statistical subjectthat has a relationship with the activities of central bankscan be considered for discussion. The subjects willmostly be in the area of monetary, financial and balanceof payments statistics.
Membership and Structure
In principle, the IFC has no personal members. Centralbanks and other institutions interested in statistical sys-tems and statistical techniques that have a bearing on thecollection, compilation and distribution of central-bankstatistics can become members by simple application.
So far, more than 60 central banks and a number of otherinstitutions have applied for membership. Members areentitled to appoint delegates to participate in the IFC’sactivities and to contribute to its conferences by present-ing papers.
The prime decision-taking body is the assembly ofmembers’ delegates at the “administrative meetings”that are organized during the conferences. Here theIFC’s strategy is determined. At these meetings an Ex-ecutive Body is elected, which is charged with the com-mittee’s day-to-day business and with the preparation ofthe “administrative meetings”. Likewise, at the “admin-istrative meetings” topics are proposed for future con-ferences, and a Programme Committee is elected tochoose from these topics and to organize the confer-ences.
A Short History
The Irving Fisher Committee (IFC) was established onthe initiative of a number of central banks statisticianswho were attending the ISI Corporate Members Meet-ing at the 1995 ISI Session in Beijing.
In 1997, during the 51st ISI Sessions in Istanbul, theIFC held its inaugural meeting. At the “administrativemeeting” held during that Session an Executive Bodywas established and it was decided to start publishingthe IFC Bulletin devoted to the activities of the IFC.Two years later, at the 52nd ISI Session in Helsinki, theIFC’s presence was further strengthened. In 2001, at the53rd ISI Session in Seoul, the IFC presented aprogramme comprising an invited papers meeting on“Financial Stability Statistics” and several contributedpapers meetings.
In 2002, a conference on “Challenges to CentralBank Statistical Activities” was organised in co-opera-tion with the Bank for International Settlements, whichhosted it at its premises in Basle. 160 statisticians repre-senting 73 countries participated. Some 50 papers werepresented.
In 2003, at the 54th ISI Session in Berlin, the IFC par-ticipated with nearly 40 papers, presented in two InvitedPapers Meetings and three Contributed Papers Meet-ings. The General Assembly of the ISI accorded to theIFC the Status of an independent ISI Section on a provi-sional basis up to the 55th ISI Session (Sydney, April2005), when a final decision shall be taken.
IFC Bulletin
The IFC Bulletin is the official periodical of the IrvingFisher Committee. The Bulletin contains articles andthe text of papers presented within the framework of theISI Conferences. It also sees as its task the recording ofinteresting events concerning Fisher’s life. Institutionsand individuals active in the field of central-bank statis-tics can subscribe to the Bulletin free of charge.
NEWS
Short Report of the IFC AdministrativeMeeting, Berlin, 15 August 2003
The President of the Irving Fisher Committee, Almut Steger, opened the Administrative Meeting at11:15.
Agenda
The agenda for the meeting, which had been distributed in advance, was adopted.
Report on the developments in the past two years
The Secretary, Rudi Acx, gave a short account of the major activities and events since the 53rd ISISession (Seoul, 2001):• the organisation of the IFC Conference held in Basel in August 2002.
This conference, hosted by the Bank for International Settlements (BIS) and attended by morethan 160 statisticians representing 73 countries and a number of international organisations,marked the beginning of a new tradition in which the IFC could schedule an “independent”event, at the BIS or elsewhere, in the years between the biennial ISI Sessions.
• the preparation of the contribution of the IFC to the ISI Session in Berlin.The IFC participates with nearly 40 papers, presented in two Invited Papers Meetings and threeContributed Papers Meetings.
• the preparation of the application of the IFC for Section status within the ISI (see below).
The future role of the IFC
The President recalled that the IFC, at its Administrative Meeting in Seoul (2001), had supportedthe proposal of Marius van Nieuwkerk to apply for the status of an independent Section within theISI. A first demand for Section status was introduced in July 2002. The ISI Executive Committeeformulated a number of remarks at its London meeting in September 2002. These formed the trig-ger for further reflection on the areas of interest and on the organisation of the Committee, as wellas on financial issues, which resulted in a new version of the application in January 2003. The Ex-ecutive Body of the IFC formulated a more elaborated mission statement in which the remit of theCommittee was broadened to all sorts of financial statistics and to introduce an active policy to ex-tend its membership beyond central banks. Possibilities for close co-operation with existing ISISections were identified. Representatives of the IFC Executive Body were invited to the Voorburgmeeting of the ISI Executive Committee in March 2003 to present the objectives of the IFC withinthe ISI. The Executive Committee gave unanimously a positive recommendation to the ISI Coun-cil. Following the meeting with the ISI Executive Committee, a slightly modified application letterwas addressed to the ISI Council in July 2003.
Almut Steger noted that, at a meeting of the Outgoing ISI Executive Council earlier that day, adelegation of the IFC Executive Body had been offered the opportunity to amplify on the applica-tion. On that occasion, it became apparent that part of the members of the ISI Council was con-cerned about possible overlaps between the areas of interest of the IFC and the IAOS or were not
NEWS
IFC Bulletin 17 — February 2004 5
fully convinced that the IFC was organisationally already in a position to assume Section status. Inthis light, the Council decided to propose to the ISI General Assembly to accord IFC the desiredstatus only on a provisional basis up to the 55th ISI Session (Sydney, April 2005), after which tran-sitional period a final decision should be taken. In the meantime, the IFC should prove its ability tobroaden its field of interest to financial statistics beyond those which were presently understood ascentral-bank statistics, to lessen its dependence on central bank institutional membership, to attracta convincing number of individual members, to continue to reach world-wide representation and,depending on the subjects treated, to co-operate with other ISI Sections and Committees. Further-more, the IFC was expected to prepare statutes, to be approved by the ISI.
The members of the Executive Body who had attended the ISI Council meeting thought thatthis outcome was the best that could be expected and were confident that the General Assembly, on18 August, would take a decision in accordance with the proposal of the Council.
Almut Steger emphasised that irrespective of the final outcome of the application procedurethe IFC would aim at formally extending its field of action to other kinds of financial statistics. Shenoted that, in order to give expression to the new status and the broadened activities, the Commit-tee’s name could be changed into “Irving Fisher Society for Monetary and Financial Statistics(IFS)”.
Answering questions from the floor, Almut Steger confirmed that individual membershipwould be opened up for statisticians from central banks as well as for statisticians with a non-cen-tral bank background, and that the assumption of new competencies would be a step-by-step ap-proach. Marius van Nieuwkerk noted that for a number of countries the extension of the IFC’s areaof interest to activities like supervision would not represent a radical change as their central bankshad already responsibilities in those fields.
Some participants saw both advantages and disadvantages in a broadening of scope. It was ob-served that opening up the IFC to other professional groups and tackling issues that might be of in-terest to non-central bankers could be a promising strategy, provided that the Committee’s identitywas safeguarded to such an extent that central bankers would keep a keen interest in it; centralbanks should keep a firm position as institutional members.
Almut Steger noted that the IFC Executive Body had been urged by the ISI to prepare draft stat-utes prior to the Berlin ISI Session. In fact a first draft had been presented to the ISI Permanent Of-fice, and it was intended to distribute it at the Administrative Meeting. However, in the light of thediscussion at the ISI Council meeting, it seemed more appropriate to profit first from suggestionsand remarks put forward at the Administrative Meeting and taking into consideration the specialremarks of the Permanent Office. This feedback would be used to draft a new version of the stat-utes, on which the approval of the institutional members would be sought by means of a writtenprocedure.
Almut Steger noted that the first draft of the statutes contained provisions about membershipfees. The institution of fees would be unavoidable given the fact that Sections were expected to paycontributions to the ISI.
Another important item in the draft statutes concerned the characteristics of the Committee’smeetings. In order to serve the IFC’s aim to extend its field of action, the following pattern was en-visaged:• Bi-annual meetings in the context of the ISI Sessions, which would be more science-oriented
and conducted in co-operation with other ISI Sections or Committees.• “In-between meetings”, which would be more pro-active concerning the improvement of
user-oriented statistics to the benefit of the central-banking community.
Almut Steger explained that the “in-between meetings” would not necessarily be fully-fledgedconferences on a broad spectre of topics as had been the case in 2002. In future, they could have thecharacter of work shops or seminars, possibly in co-operation with other ISI Sections. Paul van denBergh added that it could be contemplated to create ad-hoc groups on some topics.
Almut Steger noted that the Executive Body saw an advantage in establishing specialprogramme committees for each event, which would offer a better opportunity to make use of themost experienced persons to treat the various subjects.
As regards the tasks of the organs of the Committee and the election procedure of its officers,Almut Steger explained that the draft statutes had followed the example of other ISI Sections.
Mandate for an action plan
The President sought and obtained the support of the Administrative Meeting for the finalisation ofthe discussions with the ISI and the drafting of statutes following the suggested lines.
6 IFC Bulletin 17 — February 2004
IRVING FISHER COMMITTEE
Answering questions, Almut Steger confirmed that the fee for individual members would beconsiderably lower than that for institutional members, though no concrete ideas had as yet beendeveloped on the exact amounts.
Conferences in the next years
Basel 2004
The President noted that it seemed to be possible to hold a second “in-between meeting” in Baselnext year thanks to the willingness of the BIS to conduct it again on their premises. Possible topicslike “Statistical impacts of the Basel II-accord”, “Accounting systems and their impact on statis-tics” or “Management information systems and statistics” were still on the agenda. There might bean additional impact from a discussion started up by David Dodge, Governor of the Central Bankof Canada, on the improvement and international comparability of statistics for monetary and eco-nomic policy purposes, which might result in some new ideas. Any further proposals from themembers would be most welcome.
Several additional topics were proposed:“The role of central banks in the field of statistics”,“New ways of reaching users of statistics”,“Central bank statistics as a service to financial markets”,“A more scientific approach to the implementation of statistical methods”,“ICT in central bank statistics”.
Responding to a question by Paul van den Bergh about the most preferred way of organising the“in-between meetings”, some members remarked that they would prefer fewer presentation andmore discussion, and that they expected that the meetings might benefit from users being invited toexpound their needs.
Sydney 2005
The President noted that, following suggestions made by members, the Executive Body had provi-sionally proposed the following subjects:
“The development of quarterly accounts by institutional sector”,“Optimal methods for data improvement in financial statistics”,“Financial soundness indicators”.
In the newly formed ISI General Topics Committee for the 55th ISI Session discussions on theprogramme were still in progress. One of the ideas being considered was the introduction of“theme days”.
The President urged the members to propose additional topics before 18 August.
Furthermore, the meeting was informed about a proposal received from Nick Fisher, chairman ofthe Committee on Statistics for Business and Industry, to organise a satellite meeting of his com-mittee jointly with the IFC directly after the Sydney Session. The Executive Body had positivelyreacted to this proposal.
Organisational matters
The President recalled that, following the decision of the last Administrative Meeting in Basel, theterm of the acting Chairperson would end in Berlin. Therefore, the Executive Body proposed ascandidate for this office: Paul van den Bergh, Head of Information, Statistics and Administration,Monetary and Economic Department of the BIS.
This nomination was carried unanimously.
Paul van den Bergh said that he hoped to meet the expectations. He thanked Almut Steger for thestate in which she had left the Committee at the moment of stepping down and especially for herpreparations to acquire Section status. He also thanked the Executive Body for its efforts to extendthe role of the IFC. He saw three main challenges in the period ahead:
NEWS
IFC Bulletin 17 — February 2004 7
• improving the Committee’s internal organisation, getting the statutes adopted, adapting thecomposition of the Programme Committee to the subjects treated and establishing an EditorialBoard responsible for the content of the IFC Bulletin;
• settling the IFC status within the ISI framework and, at the same time, taking steps to meet therequirements of central bankers as voiced by Governor Dodge;
• preparing the IFC Conference in Basel and the contribution of the IFC to the ISI Session in Syd-ney.
He emphasised that the success of the IFC depended primarily on the contributions of its members.
The President proposed to postpone any other elections of officers until the IFC had adopted itsstatutes.
Any other business
There was no other business to be discussed.
The President closed the meeting at 13:00.
New members of the IFC
In recent months the central banks of Korea and Israel have joined the Irving Fisher Committee.
8 IFC Bulletin 17 — February 2004
IRVING FISHER COMMITTEE
The response of theISI General Assembly to
the IFC’s application for Section status
On 18 August 2003, the ISI General Assembly defined its position with respect to the “Proposal togrant transitional Sector Status to the Irving Fisher Society on Monetary and Financial Statistics”.
The ISI President introduced this item by giving an account of the preceding application proce-dure and of the discussion on this matter in the ISI Council. The Council had recognised some dan-ger of overlap with existing Sections but had also discovered some elements of strength in theIFC’s request. It had agreed on proposing to the General Assembly to accord Section status to theIFC on a provisional basis for the transitional period up to the 55th ISI Session in Sydney (April2005), which would give the IFC an opportunity to prove its capability to fulfil a number of condi-tions, including the extension of its area of interest to all kinds of financial statistics, the introduc-tion of individual membership in addition to the present institutional membership and the attrac-tion of a convincing number of individual members with a non-central bank background.
Almut Steger, as President of the IFC, addressed the General Assembly, summarizing the con-siderations that had led to the application and emphasizing that the IFC was willing to co-operateactively with the ISI and its existing Sections and Committees, and to fulfil the specified condi-tions.
From the floor, several ISI members raised objections, which were not primarily directed at theIFC as a candidate for Section status, but which rather arose out of a feeling of uncertainty aboutthe general strategy of the ISI with respect to the admission of new Sections. There were also somedoubts expressed about the effects of creating more Sections on organisational matters like the fill-ing-in of topics in the general conference programme of the ISI and the sharing of existing confer-ence capacity. Furthermore, there should be guarantees that new Sections were neutral in politicsand not associated with business interests.
On the other hand, a number of speakers welcomed the idea that a group of enthusiastic statisti-cians working on a statistical area of increasing relevance would strengthen the overall position ofthe ISI. Some members emphasized that, though in theory there might be reasons to expect over-laps with the activities of existing Sections, there were no indications that serious overlaps wouldoccur in practice.
A vote was taken, which resulted in a clear majority in favour of adoption of the proposal.
NEWS
IFC Bulletin 17 — February 2004 9

The follow-upof the IFC’s application forSection status within the ISI
In the months following “Berlin”, the IFC Executive Body has discussed various scenarios for acredible adaptation of the IFC to the terms and conditions specified by the ISI governing bodies inresponse to the Committee’s application for Section status. The Executive Body has concludedthat it is not yet in a position to give the ISI Executive a definitive clue on how the IFC intends toproceed, and it has decided to embark on an extensive consultation round with the IFC members(i.e. the central banks) prior to taking any further steps, such as changing the statutes. The Chairand Secretariat will review the list of members and draft a questionnaire to seek further feedbackfrom the membership on specific proposals. This survey could be carried out in the spring of 2004and would also allow the list of members to be brought up to date.
Furthermore, it has been decided that, on the basis of the feedback of the membership, ahigh-level meeting of the Heads of (Research and) Statistics of central banks in G10 countries andother systemically important economies should explore options for more active central statisticalcooperation through the IFC. This meeting will be held in the margin of the IFC conference whichis being organised at the BIS on 9-10 September 2004.
After these consultations, the Executive Body of the IFC will be in a better position to discusshow the requirements for becoming a specialised ISI Section can be met. Some progress on thisshould hopefully have been made prior to the Sydney 2005 event.The Executive Body has agreedthat the Chair would draft a letter to the ISI Executive indicating the need for further internal con-sultation on the proposals by the ISI. The Chair has already informally mentioned the need for in-ternal consultation to the ISI Permanent Office, which has indicated that this would be perfectlyacceptable and has understood that this might take some time.
Meanwhile, the Executive Body remains fully committed to the project of becoming an autono-mous part of the ISI. It is well aware of the positive interest in this project that the IFC Administra-tive Meeting repeatedly manifested, most recently in Berlin. The Chair and Secretariat will startcontacting the relevant other sections and committees to explore areas for cooperation and to inviterepresentatives from these groups to the 2004 independent meeting. Similarly, representatives ofthe ISI Executive and the ISI Permanent Office will be invited to Basel.
Various IFC members have already confirmed that they see significant value in a more activecooperation of the IFC with other sections and committees of the ISI, which is in line with ISI’sstated objective to stimulate discussions across statistical experts from different domains. The Ex-ecutive Body is confident that the IFC will be able to continue to operate under the ISI umbrellaand to make an active contribution to ISI activities in the future. At the same time, the ExecutiveBody sees as its responsibility to ensure that it can consolidate the achievements that the IFC, as arelatively young organisation, has made in establishing ongoing cooperation amongst its mem-bers.
10 IFC Bulletin 17 — February 2004
IRVING FISHER COMMITTEE
IFC Conference in Basel, 2004
Themes and possible topics for papersfor the conference of the
Irving Fisher Committee on Central-Bank Statistics
Thursday–Friday, 9–10 September 2004
In August 2002 the Bank for International Settlements (BIS) sponsored a conference of the IrvingFisher Committee on Central-Bank Statistics on the general theme of “Challenges to Central BankStatistical Activities”. The conference was attended by more than 160 participants from about 80central banks. More than 50 papers were presented in the various plenary sessions and workshopsof the 2002 conference. The papers, as well as the discussions at the meeting, helped to identify anumber of topics, in the domains of monetary as well as financial stability, that might merit furtherdiscussions amongst central bank statistical experts. Some of these will be on the agenda of theforthcoming conference of the IFC, which the BIS will be pleased to host in Basel on 9-10th Sep-tember 2004.
List of selected themes for the conference and possible topics for papers
1. Measuring prices
Possible topics:
CPI and PPI methodology, including international harmonisation;measurement bias in CPI;indices for financial services prices (banking, insurance);measures of asset prices, including property prices;measures of headline vs core inflation;use of different statistical indices, incl. hedonic and chain indices.
2. Output, capacity and productivity
Possible topics:
GDP methodology, including implementation of SNA 93;measuring key components of GDP data;size and impact of revisions in GDP;monthly and flash estimates of GDP;identifying peaks and troughs in business cycles;capacity utilisation and similar indicators;capital stock measures;estimates of output gaps;productivity methodology, including international harmonisation;labour vs multifactor productivity;international comparison of productivity (levels and growth);productivity gains from use of ICT;sectoral productivity measures (particularly services sector).
NEWS
IFC Bulletin 17 — February 2004 11
3. Financial accounts (flow of funds) data from a monetary andfinancial stability perspective
Possible topics:
financial accounts methodology, including international harmonisation;measures of financial positions of household and non-financial corporate sector (debt and debtservicing levels, leverage ratios, profits);linking financial accounts with economic activity (national accounts);linking financial accounts with BOP, portfolio investment and external debt positions;impact of expected changes in international accounting practices on financial accounts.
On the basis of the response to the invitation to the meeting and the call for papers, it could be deter-mined which format particular parts of the meeting would take (e.g. plenary sessions, panel discus-sions or workshops). As there are a number of issues on the agenda that might interest other ISISections and Committees, particularly the International Association for Official Statistics (IAOS),efforts will be made to actively involve their representatives at the meeting in the discussions.
12 IFC Bulletin 17 — February 2004
IRVING FISHER COMMITTEE
NEWS
IFC Bulletin 17 — February 2004 13
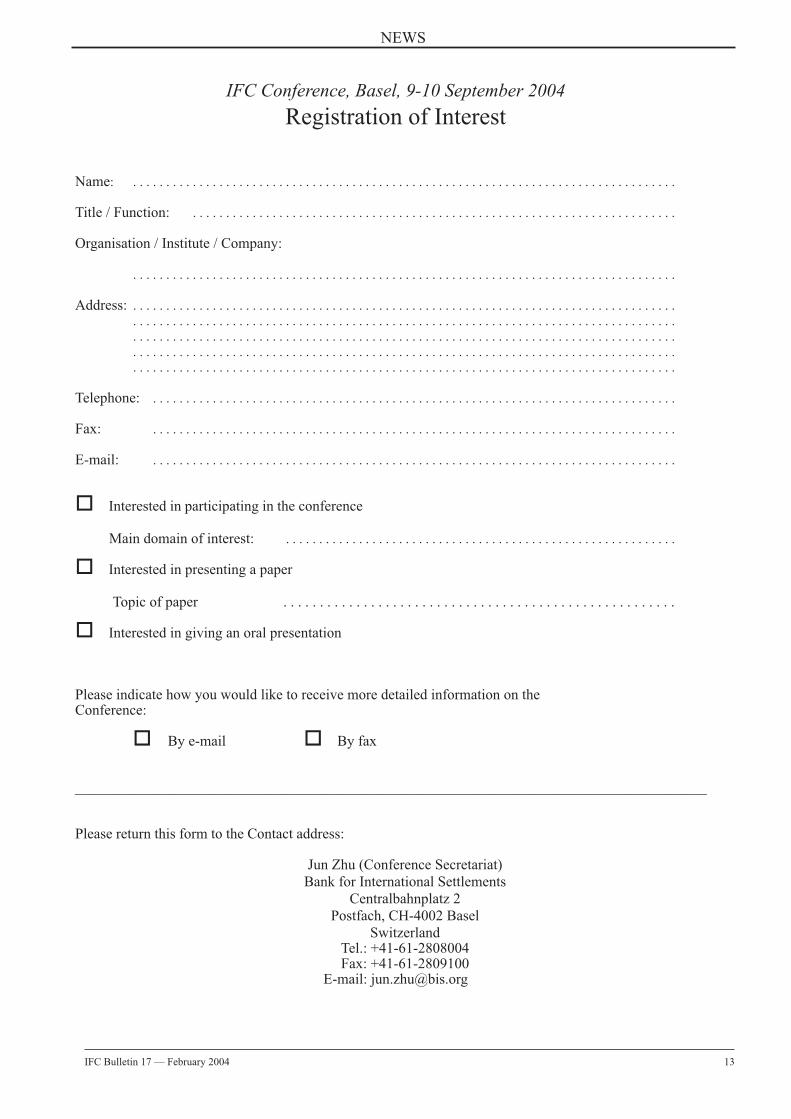
IFC Conference, Basel, 9-10 September 2004
Registration of Interest
Name: . . . . . . . . . . . . . . . . . . . . . . . . . . . . . . . . . . . . . . . . . . . . . . . . . . . . . . . . . . . . . . . . . . . . . . . . . . . . . . . . . .
Title / Function: . . . . . . . . . . . . . . . . . . . . . . . . . . . . . . . . . . . . . . . . . . . . . . . . . . . . . . . . . . . . . . . . . . . . . . . . .
Organisation / Institute / Company:
. . . . . . . . . . . . . . . . . . . . . . . . . . . . . . . . . . . . . . . . . . . . . . . . . . . . . . . . . . . . . . . . . . . . . . . . . . . . . . . . . .
Address: . . . . . . . . . . . . . . . . . . . . . . . . . . . . . . . . . . . . . . . . . . . . . . . . . . . . . . . . . . . . . . . . . . . . . . . . . . . . . . . . . .. . . . . . . . . . . . . . . . . . . . . . . . . . . . . . . . . . . . . . . . . . . . . . . . . . . . . . . . . . . . . . . . . . . . . . . . . . . . . . . . . .. . . . . . . . . . . . . . . . . . . . . . . . . . . . . . . . . . . . . . . . . . . . . . . . . . . . . . . . . . . . . . . . . . . . . . . . . . . . . . . . . .. . . . . . . . . . . . . . . . . . . . . . . . . . . . . . . . . . . . . . . . . . . . . . . . . . . . . . . . . . . . . . . . . . . . . . . . . . . . . . . . . .. . . . . . . . . . . . . . . . . . . . . . . . . . . . . . . . . . . . . . . . . . . . . . . . . . . . . . . . . . . . . . . . . . . . . . . . . . . . . . . . . .
Telephone: . . . . . . . . . . . . . . . . . . . . . . . . . . . . . . . . . . . . . . . . . . . . . . . . . . . . . . . . . . . . . . . . . . . . . . . . . . . . . . .
Fax: . . . . . . . . . . . . . . . . . . . . . . . . . . . . . . . . . . . . . . . . . . . . . . . . . . . . . . . . . . . . . . . . . . . . . . . . . . . . . . .
E-mail: . . . . . . . . . . . . . . . . . . . . . . . . . . . . . . . . . . . . . . . . . . . . . . . . . . . . . . . . . . . . . . . . . . . . . . . . . . . . . . .
� Interested in participating in the conference
Main domain of interest: . . . . . . . . . . . . . . . . . . . . . . . . . . . . . . . . . . . . . . . . . . . . . . . . . . . . . . . . . . .
� Interested in presenting a paper
Topic of paper . . . . . . . . . . . . . . . . . . . . . . . . . . . . . . . . . . . . . . . . . . . . . . . . . . . . . .
� Interested in giving an oral presentation
Please indicate how you would like to receive more detailed information on theConference:
� By e-mail � By fax
_______________________________________________________________________________________________
Please return this form to the Contact address:
Jun Zhu (Conference Secretariat)Bank for International Settlements
Centralbahnplatz 2Postfach, CH-4002 Basel
SwitzerlandTel.: +41-61-2808004Fax: +41-61-2809100
E-mail: [email protected]
14 IFC Bulletin 17 — February 2004
IRVING FISHER COMMITTEE
Participation of the IFC inISI Session,
Sydney, 2005
There has been steady progress in the preparation for the 55th ISI Session, scheduled for April2005 in Sydney. Finally, the ISI has retained four Invited Paper Meetings (IPMs) proposed by theIFC:• Cost, Quality and Relevance of Financial Statistics (chair to be determined),• Accounting Standards and their Impact on Financial Statistics (chair to be determined);• Financial Soundness Indicators (chair: Sean Craig, IMF);• The Development of National Quarterly Accounts by Institutional Sector
(chair: Richard Walton, Bank of England).
The first three IPMs would be part of the special Theme Day on Finance and Statistics.
The topic of Optimal Methods for Data Quality Improvements in Financial Statistics (chair: LuigiFederico Signorini, Bank of Italy) has been retained as Contributed Paper Meeting.
The Chair will contact the chairs of the Organising and General Topics Committee as well as theReserve Bank of Australia in order to identify any topics the IFC could help to sponsor. One possi-bility would be for the Reserve Bank to propose an additional CPM topic that might be of particularinterest to them. IFC members will be also encouraged to attend the satellite meeting with Statis-tics in Business and Industry in Cairns, Australia, after the ISI Session.

DISCUSSANTS’ COMMENTS
The use of hedonic methodsfor quality-adjusted prices
John Astin
Papers for discussion:
1) D. Fenwick and A. Ball: “Conceptual and measurement issues relating to hedonic methods
of quality adjustment of prices: the UK experience and some practical proposals”1
2) G. Kenny and H. Ahnert: “Quality adjustment of European price data: what role for
hedonics?”2
3) P. Konijn, D. Moch and J. Dalen: “Comparison of hedonic functions for PCs across EU
countries”3
4) O.W. Winkler: “A Different approach to changes in product quality and price”4
First let me apologise for not being able to be with you in Berlin today. I am most grateful for BartMeganck’s offer to read my discussant notes on my behalf. Naturally, it is I who remains responsi-ble for what he reads – always assuming he reads it accurately!
We have in front of us four contrasting and complementary papers. One written by data producers;one by researchers; one by users and a fourth from an academic looking at these quality issues froma wider standpoint. So I am sure there will be a lively discussion, and, I hope, one which will edgeus all just a little further forward in this continually tricky area of CPI construction. I say CPI be-cause that is what all four papers concentrate on, but of course issues of quality change in price in-dices affect other series such as producer price indices. There should be cross-fertilisation betweenthe experts of different price indices – especially CPIs and PPIs – and I am pleased to see that this isbeginning to happen.
Let me begin first at the coalface: the producers’ paper of Fenwick and Ball. I understand that thepaper was originally submitted at a time when the research was still in progress, and that the au-thors may want to modify some of their views.
I thought there were some very pertinent issues raised in this paper. I have to admit that I havenever been a convinced hedonist, having seen too many papers that describe the results of hedonicregressions which seem to have sometimes been applied too hastily to data sets which just happento be available: good data in this field are not as common as some may believe. The report pub-lished by the Schultze Panel, which is mentioned in the paper, was slightly critical of the focus ofthe BLS’s use of hedonics, claiming that “the work may not always have centred on the most pro-ductive expenditure items”. It felt that “the best candidates for hedonic analysis are categories of
IFC Bulletin 17 — February 2004 15
1 IFC Bulletin No. 16, July 2003, pp. 11-15.2 IFC Bulletin No. 16, July 2003, pp. 16-22.3 IFC Bulletin No. 16, July 2003, pp. 23-26.4 IFC Bulletin No. 16, July 2003, pp. 27-30.
goods for which quality change is frequent but incremental, and for which the characteristicchanges are easy to measure. For example, PCs are an obvious candidate, whilst cars and clothesare seen as problematical”.
The Fenwick and Ball paper sensibly heeds these warnings, and rather than presenting pages oftables of hedonic results, provides some specific cautions and queries resulting from theirhedonics work. For example, they raise the important issue of market conditions. In fact most mar-kets are highly imperfect, even when the conditions for perfection are almost achievable. For in-stance, consumers could make highly rational decisions in the PC market using the vast amount ofdata available in computer magazines and websites. But this takes time and a certain degree of in-genuity which the typical consumer probably doesn’t have. Even so, as the Schultze Panel said, thePC market is relatively perfect and is indeed a suitable case for hedonics treatment. But Fenwickand Ball rightly caution against using hedonics in markets that don’t appear to be very competitive.
One increasing problem is that services have already overtaken goods as consumer items inmany advanced economies. But hedonics are particularly difficult to apply in services because ofthe lack of quantifiable data. I think price statisticians should try to tackle this issue head-on. Totake one example alone: the budget airline industry, at least in the UK, is now taking a major shareof the airline market, and is ultra-competitive. How do you quality-adjust Ryanair’s ticket pricesfor the complete absence of, say, refreshments, – and, many would say, the complete absence ofany level of customer service at all? I think the answer is not to run away from the problem but toconsider ways of getting the necessary data, such as from consumer panels.
Konijn and his colleagues working on the European Hedonic Centre project have reported on re-sults obtained in the field of – guess what? – PCs. I have not, of course, seen the latest version of thepaper which is due to be available at this conference. I am not going to go into detailed technicalcomment on these results – the authors are themselves far more experienced than I am in these mat-ters. But what is especially interesting in this research is that it combines data from several differ-ent countries – or perhaps I should say markets. A fundamental issue is whether it is possible tocombine results from several markets into a single hedonic function. The paper suggests, quite rea-sonably, that if PC markets and consumer preferences are similar across countries, then thehedonic functions should also be similar. The first results of their analysis lends some – but onlysome – support to this thesis, although a health warning should be attached to the fact that onlythree countries were covered, and moreover that they are the largest and probably the most com-puter-sophisticated markets in Europe. Even so, the authors point to some significant differencesin both PC markets and apparent consumer preferences in the three countries.
This is pioneering work, and it should be continued. What would be an interesting next stepwould be to carry out similar hedonic studies in the same three countries, but in a different productsector. Maybe the familiar refrigerator market would be a relatively straightforward candidate.The aim would be to try and decompose the many dimensions in this research, so as, for example,to show that the problems of combining country data into a single hedonic function are due more(or maybe less) to differences in markets and consumer preferences than to differences in the datachosen or the hedonic techniques used. Success in this research could have long-term benefits inthe potential for quality-adjusting the HICPs at an EU-wide level, at least as long as the basic dataare provided separately by each member state.
The ECB authors, Kenny and Ahnert, are to be congratulated on providing us with an excellent ex-position of the QA problem in general, how it is currently dealt with in Europe, and what the futurerole may be for hedonics. There is a useful annex for easy reference to the various methods used forquality adjustment. This will be familiar stuff to all my former colleagues in the Eurostat HICPWorking Group, but may be less familiar to others.
It is good to note that the ECB lends its enthusiastic support to the continued improvement ofQA methods, while they adopt a more careful and qualified support for hedonics. As the main cli-ent for the HICP, they are aware of the need for openness in methods, and sound a note of cautionagainst using any CPI methods that lack transparency. My own view is that it would be wrong forofficial price statisticians to avoid using certain techniques simply because they are difficult to ex-plain. The main priority is to have CPIs of top quality and if this involves the use of technically ab-struse methods, the task of the statistician is to find explanations of these methods for the laymanwhich are simple but not misleading. Other professionals manage this: why shouldn’t we?
I had expected to see a little more in this paper on the economics of quality adjustment, espe-cially on the economic implications for central banks of adjusting CPIs for quality change. I knowHenning is aware of my concerns here. To put it very simply, though I obviously accept the need forQA in the limited sphere of a Laspeyres-type CPI, I am less sure of its validity in the context ofmonetary policy. PCs are the main example of a product where, over the years, the nominal price
16 IFC Bulletin 17 — February 2004
BERLIN 2003
has tended to remain fairly static or fall only slowly, whereas the quality-adjusted price has plum-meted. With cars, presumably maximum speed is a key hedonic variable. So a car capable of 400kph would have its price quality-adjusted down, despite the fact that it could never be driven atsuch a speed. One can find similar examples in the PC market: how many consumers use more than10% of the possible facilities in Word or Excel? However, in all these cases consumers are still pay-ing the non-quality-adjusted prices and this is the cash which circulates in the economy. Isn’t itcash which the bankers are concerned with? Isn’t it cash which is relevant to interest rates? I wouldlike to hear some discussion on this – and hopefully to be proved wrong!
Finally I come to the Winkler paper. This challenges the whole basis of the traditional approach toCPI construction and provides a welcome respite from the usual type of CPI paper which takesmost things for granted. Winkler takes nothing for granted. I find much to agree with, but, I’mafraid, quite a lot to disagree with. I have only a short time left for comment so I will be brief. First, Imuch appreciated his opening comments about Laspeyres. I have often remarked that theLaspeyres index would not have been invented if the great man himself had been born 100 yearslater. In his day, indeed, markets were far simpler and less dynamic than today. But if he would nothave proposed the index which bears his name, what sort of index would he have proposed? I justdon’t think it would have been the PLI which Winkler suggests. PLIs are in fact currently producedin the field of purchasing power parities (PPPs), where they are necessary for comparing price lev-els at various degrees of aggregation between countries. They can be used – with care – for suchcomparisons, but it is a different matter entirely to use them to measure temporal price change. Ithink at root it all comes down to the question of aggregation. PLIs – which seem to be similar toUnit Value Indices – could, I believe, be used (and I think they are in some countries) at a basiclevel where there is a high degree of homogeneity and stability of products. It does indeed getround some of the problems of QA. But it cannot be right to assume away all quality change:Winkler is breaking his own rule that “price statistics should deal with what actually is”.
But I hope someone will write a critique of this paper, because at the very least the two paperswould serve as a primer in the fundamental issues of price index construction.
John Astin
DISCUSSANTS’ COMMENTS
IFC Bulletin 17 — February 2004 17
Use of statistics in developingmonetary policy
Part I
Alfred De Marco (Central Bank of Malta)
Papers for discussion:
1) Phousnith Khay, “Development and use of statistics for monetary policy in Cambodia”1
2) Shelquim Cani and Gramos Kolasi, “The role of statistics in the conduct of monetary policy
in Albania”2
Introduction
As discussant for this part of the meeting I would like to commence my contribution by congratu-lating the authors of the two papers for their candid and well elucidated views on the state of statis-tical collection and compilation in their countries particularly where this applies to monetary pol-icy.
Both countries have gradually emerged from centrally planned economic systems which werecharacterised by the limited availability of meaningful statistical information. Considering thesecircumstances both countries have made tremendous progress in developing their statistical struc-tures particularly in the field of financial statistics. Of course much remains to be done to broadenand enhance the statistical data base that will enable the authorities in these countries to assessmore accurately economic conditions before implementing the appropriate macroeconomic poli-cies.
I will consider each paper separately and focus on some of the monetary policy related issuesthat have been highlighted in the two papers. In discussing these issues I will make some referenceto the situation in my country, Malta, which over the last decade has carried out a number of re-forms in the statistical field to improve the quality of macroeconomic data and strengthen the cred-ibility of the national agencies involved in the statistical compilation process.
I will commence my remarks with reference to the paper presented by Phousnith Khay of the Na-tional Bank of Cambodia (“Development and use of statistics for monetary policy in Cambodia”).The paper first describes the monetary policy framework, which is formulated and implemented inthe context of the IMF supported programme. It is evident, from this description, that the ability ofthe National Bank to pursue an effective monetary policy is severely constrained by the high levelof currency substitution and the absence of market driven interest rates. The paper says that due tothe unavailability of information on the amount of foreign currencies in circulation it is difficult toestimate correctly such indicators as the money multiplier and the velocity of money. Similarly it isdifficult to arrive at an indicative short term interest rate in the absence of money market instru-ments, particularly treasury bills. In this regard therefore it is encouraging to note that under thegovernment’s Vision and Financial Sector Development Plan steps will be taken to establish asound market based banking system and money and capital markets. These should certainly in-spire more confidence in the domestic currency and the emergence of a market driven interest rate.This will then facilitate the National Bank’s efforts to pursue a market oriented monetary policy.
18 IFC Bulletin 17 — February 2004
BERLIN 2003
1 IFC Bulletin No, 16, July 2003, pp. 31-34.2 IFC Bulletin No, 16, July 2003, pp. 35-37.
With reference to my country, Malta, I would like to say that until the late eighties the financialsystem was rigidly controlled. It was only after a newly elected government de-nationalised thecommercial banks, removed controls on interest rates and developed a capital and money marketthat the Central Bank was able to formulate and implement a market-oriented monetary policy.Consequently, despite the small size of the financial market the Central Bank is today able to carryout open market operations in line with its monetary policy objectives.
The paper then focuses in detail on the development of statistics for monetary policy. It stressesthe important role played by the National Bank in collecting and compiling monetary and balanceof payments statistics. This is a function undertaken by many central banks including my own.However, the paper also highlights the significant steps that are also being taken to strengthenco-ordination and co-operation among the relevant agencies that produce economic and financialstatistics. This is an important point since decisions on monetary policy can only be made effectiveif the policy makers have complete information on developments in the economy and the financialsystem. In many instances a central bank, which has to take these decisions, has to rely on other es-sential macroeconomic indicators, such as GDP data, producer and consumer price movementsand fiscal data, which it does not collect or compile directly itself. It is therefore necessary that thecentral bank and other statistical agencies within the country, particularly national statistical of-fices, co-operate actively and provide each other with statistical information.
The paper indicates that the collection of monetary statistics, which are key indicators for mon-etary policy, has progressed efficiently and the National Bank appears to enjoy the full co-opera-tion of the depository corporations. This is another essential pre-requisite for developing the statis-tical infrastructure for monetary policy. The banking system provides almost all the input on mon-etary aggregates and their counterparts. In my country it is the banking institutions which not onlyprovide timely and regular information on the monetary sector but also on the balance of payments(on a cash basis). In the case of the National Bank of Cambodia it is therefore important that contin-uous contacts are maintained with the depository corporations to ensure their effective co-opera-tion. In this regard the National Bank could reciprocate by taking the initiative to organise semi-nars and training courses for the staff of the corporations involved in the collection of the raw data,in order to enhance their knowledge and understanding of the reporting requirements of the Na-tional Bank.
In highlighting the limited potential of monetary policy in the current Cambodian environmentthe paper observes that the use of statistics for monetary policy is likewise limited in scope. Muchattention in fact is given to the exchange rate as a policy instrument since this has important impli-cations for inflation. This notwithstanding it appears that on the basis of the regularly availablemonetary indicators the authorities are able to put in place a fairly accurate picture of develop-ments in the economy. In fact the paper says that in recent years the inflation rate has been low, im-plying that the National Bank has achieved its main policy objective, and that GDP grew at the pro-jected rate. It is only with regard to broad money that targets have not been reached but in the highlydollarised Cambodian economy, this can be expected given the unreliability of measures related tothe velocity of money.
The significant problem that dollarisation poses is clearly emphasised in the last part of the pa-per. Since this is a matter of a lack of confidence in the domestic currency the government of Cam-bodia, quite rightly, adopts a gradual approach to the de-dollarisation of the economy. In this re-gard the recommended initiatives, that is, maintenance of macroeconomic stability and the intro-duction of attractive domestic investment products will surely contribute to a reversal of this trend.
Finally, as I referred to earlier, the government’s strategy for developing the financial sectorwill surely lead to long term benefits. In this regard the National Bank, in its role as the banking su-pervisory authority, has a vital role to play to ensure that the government’s plans to implement in-stitutional reforms in the financial sector are accompanied by the establishment of a sound and sta-ble banking system.
The paper presented by Shelquim Cani and Gramos Kolasi of the National Bank of Albania (“Therole of statistics in the conduct of monetary policy in Albania”) gives an interesting account of thedevelopment of statistical output since the early nineties when the country abandoned a centrallyplanned economic system and gradually transformed itself into a market economy. The progressachieved in first constructing, and then upgrading, its statistical system over the years was re-flected in Albania’s decision to accept the obligations of membership in the Fund’s GDDS.
Albania’s monetary policy has also continued to evolve over the years. Price stability was im-mediately recognised as the ultimate goal of the National Bank’s monetary policy and the imple-mentation of such a policy developed from one based on direct controls to a more market orientedsystem. The monetary policy regime is now being refined further with the adoption of an inflationtargeting strategy that has inflation as both its ultimate and intermediate objective.
DISCUSSANTS’ COMMENTS
IFC Bulletin 17 — February 2004 19
While acknowledging the desire of the National Bank to continue to evolve and upgrade its ap-proach to monetary policy I would venture to ask, at this juncture, whether the adoption of this newstrategy by the National Bank may be premature given (i) the still early stage of development of thecountry and (ii) the fact that an important pre-requisite for the successful implementation of thismore sophisticated approach is a steady flow of reliable economic and financial data. In fact the pa-per clearly highlights the weakness of some of the statistical output. Thus, while it appears that fi-nancial statistics and consumer price data are timely and accurate, statistics on real economy indi-cators, such as the national accounts, GDP growth and unemployment, are generally unreliable.There are also long lags in the publication of data on the fiscal accounts and the balance of pay-ments which, in addition, are only published on a quarterly basis.
To a large extent the paper acknowledges that an inflation targeting regime can only be imple-mented effectively if certain deficiencies in the statistical infrastructure are addressed. In this re-gard it mentions a list of work priorities which should be undertaken to establish the appropriateenvironment for the implementation of an inflation targeting strategy. I will elaborate briefly onsome of these priorities:1. The first one focuses on the need for a clearly recognised policy making body which should be
recognised as the authority on statistics. This certainly would be a positive step forward. Here Iwould like to refer to my country’s experience in this regard. In 2000 Malta reformed its statis-tics law and established the Malta Statistics Authority as an independent institution responsiblefor all matters related to the collection, compilation and publication of official statistics. TheAuthority not only ensures that official statistics are produced in accordance with internationalstandards but is also ultimately responsible for all matters related to methodologies. It thereforemonitors all statistical agencies in Malta, where statistical issues are concerned, including theCentral Bank and the National Statistics Office. There is no doubt in Malta that the setting up ofthis Authority has inspired more public confidence in the reliability of official statistics and hasthus encouraged greater use of such information. The Authority is run by a board which in-cludes representatives of bodies and organisations that have an interest in statistics. These in-clude trade unions, organisations representing private enterprise, the university, the centralbank and the financial community.
2. This brings me to the second priority point mentioned in the paper, which is the lack of privatesector co-operation, in Albania, in providing raw data to the statistical agencies because of pub-lic distrust in the agencies and a suspicion that the information will be used for other purposes.This is typical of many countries especially those in Southern Europe and the Mediterranean!As I mentioned above in the Malta case the appointment of an independent authority with rep-resentatives of the private sector sitting on the Board has, to some extent, assured private sectorproviders of statistical information that the data submitted is treated with the utmost confi-dence and secrecy. While the legislation itself ensures co-operation in a forceful way, that is,through the imposition of fines and penalties, the attitude of private sector reporting agents inrecent years has been generally positive and co-operative. This has reflected a new found con-fidence in the official statistical agency following its change of status. In the Albanian context,another possible way of addressing this lack of public trust in the statistical agencies could be toassign a greater role, in the collection and compilation of statistics, to the National Bank of Al-bania, which presumably enjoys public esteem in matters related to finance and the economy.There are many countries where central banks are substantially involved in the statistical pro-cess, an example being the National Bank of Belgium. Of course this will necessitate astrengthening of resources in the National Bank of Albania to cope with this additional respon-sibility.
3. The problems of conducting surveys are well brought out in this section of the paper, particu-larly the difficulties encountered in estimating the magnitude of the informal market. In Maltathe statistical agencies have conducted a number of surveys but due to the small size of thecountry these may sometimes give erratic results due to the relatively large margin of error ofthe samples. This notwithstanding the authorities have persisted with the use of sample surveysfor obtaining data on a number of variables as the information collected through this method istimely and cost effective. The Central Bank of Malta also conducts a regular survey on businessperceptions in order to assess economic activity and expectations in the private corporate sec-tor. I would therefore encourage the Albanian statistical agencies to persevere with surveymethods of collecting data in order to build up a time series of data, which, despite a lack of ac-curacy at this stage, will provide them with a historical data base for future use in the construc-tion of econometric models that could be used for macroeconomic analysis and projections.
20 IFC Bulletin 17 — February 2004
BERLIN 2003
4. In an important final point the paper focuses on the dissemination process. Conveying statisti-cal information to the user in the shortest time possible and at regular intervals is a matter of ut-most importance. The issue of an advance calendar and the shortening of the time between theprocessing of final data and their release are two objectives that should be pursued with ur-gency. The achievement of these objectives will surely enhance the reputation of the producersof the statistics and encourage greater use by the interested parties. Of course a lot can beachieved through the use of the web sites of the agencies responsible for the issue of official sta-tistics. While, at this stage, use of the internet may be limited there is no doubt that cheapercosts and rapid innovation in technology will lead to greater access to internet sources of infor-mation. No doubt this is already happening in Albania and so the authorities there should beencouraged to continue to develop this form of dissemination of statistical information.
On this same subject I would like to conclude my contribution by extending my congratulations tothe National Bank of Albania for their attractive web site it has set up. I visited this web site in re-cent weeks to learn more about the Bank and its monetary policy. I must say I found it to be veryuser friendly and informative. I certainly would encourage the Bank to continue to develop this im-portant source of information which is easily accessible to users both inside and outside the coun-try.
Finally I would like to thank most sincerely the organisers of this meeting, in particular, MsArmida San José, who kindly invited me to express some views on this interesting topic. Unfortu-nately I was not able to attend due to pressing work commitments.
Alfred De MarcoDeputy General Manager – Economics DivisionCentral Bank of Malta
DISCUSSANTS’ COMMENTS
IFC Bulletin 17 — February 2004 21
Use of statistics in developingmonetary policy
Part II
Diwa C. Guinigundo (Central Bank of the Philippines)
Papers for discussion:
1) Ivan Matalik and Josef Arlt, “Use of Statistics in the Monetary Policy of the Czech National
Bank”1
2) Craig Lindsay and Robin Lynch, “Use of statistics in developing UK monetary policy”2
3) Stefan Brunken, “Statistics on euro area banks’ deposit and lending rates – Analytical use,
concept and implementation at the Bundesbank”3
First of all, let me stress the obvious responsibility of statistical authorities, including the centralbanks, and this is to ensure that the system of economic indicators in their respective countries aretimely, accurate and reliable, coherent, as well as comprehensive. These goals are beautifully em-bodied and addressed in the three conference papers, which individually underscore the impor-tance of having timely, accurate and comprehensive economic statistical information as a prereq-uisite to successful monetary policy. We cannot disagree with that.
Secondly, I also wish to keep our feet on the ground. Statistical priorities must always bematched with the amount of resources at the disposal of statistical authorities. Resource con-straints, whether in terms of funding, manpower, and equipment, are a genuine problem in the caseof developing countries, where statistical concerns generally yield to more pressing socialsafety-net programs of the public sector. Priority funding during fiscal budgeting exercises ishighly skewed away from statistical programs to achieve greater accuracy and reliability of statis-tics made available in the public domain. Thus, it is fair to say that the range of available statisticalinformation in a given country often reflects not only the breadth of demand from end-user but alsothe amount of resources available to statistical agencies. But having said that, we should not losesight of the fact that the papers made us aware that there lies a great deal in existing and perhapssoon-to-be collected statistics. The paper on the analytical use of euro interest rates is a good exam-ple of how rich is the analysis that can be derived from existing for some countries, and perhapssoon-to-be collected statistics for the rest, on interest rate margins. This is also true of the rich ana-lytical value of labor market statistics, as discussed by the UK paper. No doubt, many of these sta-tistics are not currently available in many developing countries. But to the extent that they areavailable, a good number of important inferences on monetary transmission can already be derivedfrom them.
Having said these general principles, let me take the pleasure of briefly commenting on the threeexcellent papers. With regard to the paper by Ivan Matalik and Josef Arlt (“Use of Statistics in theMonetary Policy of the Czech National Bank”), we believe that the experience of countries in tran-sition such as the Czech Republic holds useful lessons for developing countries. For example,changes in the institutional setup and the structure of the economy pose considerable challenges tostatistical authorities in terms of responding to new data requirements. Transition countries alsoshare the developing countries’ need for capacity-building in the production and dissemination of
22 IFC Bulletin 17 — February 2004
BERLIN 2003
1 IFC Bulletin No. 16, July 2003, pp. 38-48.2 IFC Bulletin No. 16, July 2003, pp. 49-52.3 IFC Bulletin No. 16, July 2003, pp. 53-56.
economic statistics to enable them to expand the economic database and lengthening the availabletime series. The experience of the Czech Republic in seeing a decline in importance of monetaryaggregates and growing use of financial market data is not uncommon. We can expect to see moreof these experiences as new financial innovations, products and services are put on stream, and inthe process, alter the existing patterns of money demand in the economy. Parenthetically, as a wayof side comment, the decision to shift to IT, to me, is something that one must decide if the presentmode of monetary policy formulation is no longer effective in capturing the monetary transmis-sion process, rather than the presence or absence of a high-frequency, reliable information set. Ifmonetary targeting, for instance, is no longer relevant, and statistics are not up to IT requirements,something has to be done to improve on statistics while preparing to go into IT. In the Philippines,for example, financial innovation and its subsequent impact on the money–price level relationshipwas one of the main factors that led to the decision to adopt inflation targeting. We shifted to infla-tion targeting in January 2002 by announcing that both 2002 and 2003 inflation targets are transi-tional targets considering that monetary policy works with a long and variable lag. Since then, theconduct of monetary policy in the Philippines has been both more significantly transparent andforward-looking. This has added to the urgency of having more reliable, more coherent, and morecomprehensive data sets, many of which are completely new. Inflation targeting has made it im-portant to have a wide array of information about the state of the economy in order to arrive at anaccurate assessment of price and output conditions as a basis for a forward-looking monetary re-sponse. The Czech Republic’s increasing demand for data on the real economy first, then on publicbudgets is a classic example. It will be useful to know if in the context of inflation targeting, theCNB measures and includes the output gap in its policy reaction function. Including this importantcomponent in our experience has significantly improved our inflation forecast and needless to sayhas helped sharpen the calibration of monetary response. (Of course, this is hardly universal.)
With regard to the paper by Craig Lindsay and Robin Lynch (“Use of statistics in developing UKmonetary policy”), we find commendable the continuing efforts of UK statistical authorities toalign their priorities with the needs of users, particularly policymakers such as the Bank of Eng-land. Ensuring the coherence of existing economic statistics is an important step towards comingup with a reliable system of indicator variables for monetary policy. But this will always be diffi-cult especially on those statistics that involve the labor market, and this is particularly so in the caseof developing countries. Statistical authorities in developing economies continue to face consider-able challenges in compiling statistical information on key areas such as labor market activity, andhave a great deal to learn from their industrial country counterparts. A large portion of our labormarket remains unorganized. Gathering data on unfilled job vacancies, labor demand, skills short-ages and even worker inactivity in the expected level of disaggregation will be a continuing chal-lenge. It will be useful to learn from our UK authorities a few details as to the specific methodologyfor measuring NAIRU and what sort of information provides us with the options for validating orcounter-checking the estimates produced by the Bank of England.
In my country, the Philippines, authorities have also begun initial efforts in using business atti-tude surveys as an input to the monetary policy decision-making process. The Bangko Sentral ngPilipinas (BSP) conducts a quarterly Business Expectations Survey (BES), which solicits percep-tions of business and industry executives on short-term prospects of the economy to providepolicymakers with indicators on the current and prospective business outlook. By next year, we ex-pect to expand this beyond Metropolitan Manila to include all the key cities in the country. We alsointend to cover consumer sentiments as additional basis for judging the prospects of effective de-mand in the country. Over the medium term, we also hope to implement a comprehensive systemof leading indicators that would tell us the likely path of business and consumer activity in the Phil-ippines.
Lastly, concerning the paper by Stefan Brunken (“Statistics on euro area banks’ deposit and lend-ing rates – Analytical use, concept and implementation at the Bundesbank”), we wish to commentthat the efforts to produce harmonized interest rate statistics for the euro area will be particularlyuseful for the analysis of prevailing monetary conditions as well as monetary policy transmissionin both the euro area as a whole and in the individual member countries. The absolute size of thepopulation of financial institutions in industrial countries presents significant challenges in aggre-gation. Thus, emerging markets are in that sense fortunate because their jurisdiction includes onlya smaller population of reporting institutions. Volume weighting of interest rates would be in gen-eral an easier process. Nevertheless, it remains a challenge for emerging markets to be able to comeup with detailed breakdowns of the reporting framework to allow for the determination of systemicdifferences in transmission for various products and economic sectors. For instance, it will be auseful statistic to see how banks react quantitatively by instrument to changes in the policy rates, or
DISCUSSANTS’ COMMENTS
IFC Bulletin 17 — February 2004 23
how their market share influences their price and quantity reactions. Finally, on another issue, wewould argue that while the interest margin between deposit and lending rates can indicate pricecompetition, we should also recognize that other factors might also be at work in influencing finan-cial intermediation, including regulatory policies.
Diwa C. GuinigundoManaging Director, in charge of ResearchBangko Sentral ng Pilipinas
24 IFC Bulletin 17 — February 2004
BERLIN 2003
EXTENDED PAPERS
USE OF STATISTICS IN DEVELOPINGMONETARY POLICY
The role of statistics in the conduct ofmonetary policy in Albania
Shelquim Cani and Gramos Kolasi (Bank of Albania)
Sound policies are driven by sound statistical support, specially in the case of transition economieswhere changes are ongoing and frequent. The same is true for Albania, being a transition country,where maintaining an accurate and reliable database has become a key issue in conducting eco-nomic policies.
This paper tries to give an overview of the statistical information available in Albania pointingout main problems with their collection and compilation. Furthermore, it describes the use of thestatistics in formulating economic policies in the country, with a focus on monetary policy. A briefhistory of monetary policy and plans for the future are also described in order to give a full pictureof the context in which monetary policy is conducted in Albania.
1. Introduction
Albania, like many other transition countries, started the huge detachment from the centralizedeconomy at the beginning of `90s. The start of the difficult transition did not save anything com-prising statistics contributing to a fast and deep degeneration in the process of data collection, dataprocessing and data dissemination. Even though the central statistical unit in Albania never put itsexistence into doubt, in the early ‘90s, that unit was not anymore capable of providing any valuablepiece of statistical information to decision-making bodies.
For many reasons, during 1990-1993, the statistical output was very poor, due to the incapabil-ity of authorities to monitor, measure and publish the main macroeconomic statistics categories,the low degree of coverage of the private sector of the economy, numerous delays in preparationand publication, etc.
The initial serious efforts to install and use an up-to-date output system of macroeconomic sta-tistics in Albania date back to year-end 1992. For the first time, due to the assistance provided bythe IMF Statistics Department, such statistical outputs as the balance of payments, money andbanking statistics, consumer price index, etc., were conceived and presented. Since that time on-wards, although during the transition period Albania experienced various twists, the overall statis-tics compilation process in general, has progressed continuously.
In September 1996 the money and banking statistics produced by the Bank of Albania wereconsidered complete, reliable and appropriate to be included in the Albanian page at the IFS. Theprogress picked up 1998 when the Albanian authorities approved the country’s membership to theInternational Monetary Fund’s General Data Dissemination System (GDDS). On May 22, 2000,Albania joined eight other developing countries as the first set of countries included when the
IFC Bulletin 17 — February 2004 25
GDDS site was officially launched. It should be mentioned that Albania was selected by the IMF asa pilot country to prepare a set of information on the national statistical practices (metadata). Itsmetadata were used as a model not only for Europe, but also for many other countries.
At present, the aforementioned statistics are produced by three different institutions: Bank ofAlbania, INSTAT and Ministry of Finance.
The Bank of Albania (the central bank) is responsible for producing and publishing monetaryand banking statistics on monthly basis and balance of payments statistics on quarterly basis. Insome cases the BoA has financed several statistical projects, especially surveys which aim to cap-ture the performance of separate economic sectors.
INSTAT (statistical institute, government body), being the national statistical agency, is respon-sible not only for producing and disseminating statistics on national accounts and demography, butalso has the legal right1 to formulate and implement policies on compilation and management ofstatistics in Albania.
The Ministry of Finance is responsible for production and dissemination of government fi-nance statistics on quarterly basis.
2. Macroeconomic Statistics in Albania
In a transition country, there is need for timely and accurate statistics in order to be able to take ap-propriate policies in reaction to rapid changes in the economic environment Therefore, the demandfor statistical information has increased both in terms of the type of information and in terms ofquality. Over the past years, the collection of statistics by the authorities in Albania has improvedas new information which was not available in the past is being obtained. Now, data on monetaryaggregates, the banking system, balance of payments, and major data from the real sector are avail-able. On the other hand, accuracy of the data has increased, thus adding to the reliability of this in-formation. The processing of the statistical data is based on internationally standard methodolo-gies, allowing also for comparison among countries. In addition, specially in the case of monetarydata and CPI, the set of data is suitable for application of various statistical analyses and economet-ric methods which assist the monetary policy decision making.
However, the decision making process in Albania still cannot fully rely on the statistical infor-mation available. Despite the major improvements with regards to the collection and processing ofthis information, macroeconomic statistics still face some crucial problems.
The data coverage is not complete. With an exception of monetary statistics and consumerprice indices (which are produced on a monthly basis), all other groups of statistics have a rela-tively longer periodicity (mostly three months). The timeliness of data availability is also of a bigconcern. In most cases, data are disseminated with a lag of three to four months after the end of thereporting period. In short, the weaknesses can be summarized in the following key areas:• lack of satisfactory national accounts data;• insufficient account of the private or informal sector activities;• need for improving various surveys and estimation procedures;• inadequate legal and institutional framework for statistic;• low degree of statistical information exchange;• short time series that date back to the beginning of the ’90s, with recurrent interruptions because
of methodological changes.
It is important to stress that weakness of the system of data collection, processing, compilation andpublication are already identified. The responsible institutions are also committed to eliminatethese weaknesses as soon as possible. We believe that the challenges facing the Albanian authori-ties in the coming two to three years will be to ensure that significant efforts are made in improvingthe governance of the statistics sector. In that respect, we would like to list the work priorities asfollows:
1. Build a clear and unambiguous policy-making body. Although, according to the existinglaw, the highest authority is the Council of Statistics, it should be noted that de facto it plays only anadvisory role. It remains unclear who is responsible for the decision making process with regard tostatistics in Albania. Although this problem has been identified long ago, unfortunately, no solu-tion has yet been found to this legal vacuum. The draft law which is foreseen to be approved by theend of this year will settle this issue.
2. Increase data coverage to include all private sector. The private sector accounts for almost75% of GDP in the country, but few data are collected from this sector. A major reason for this is
26 IFC Bulletin 17 — February 2004
BERLIN 2003
1 These rights are expressed controversially and thus this topic is subject to strong disputes.
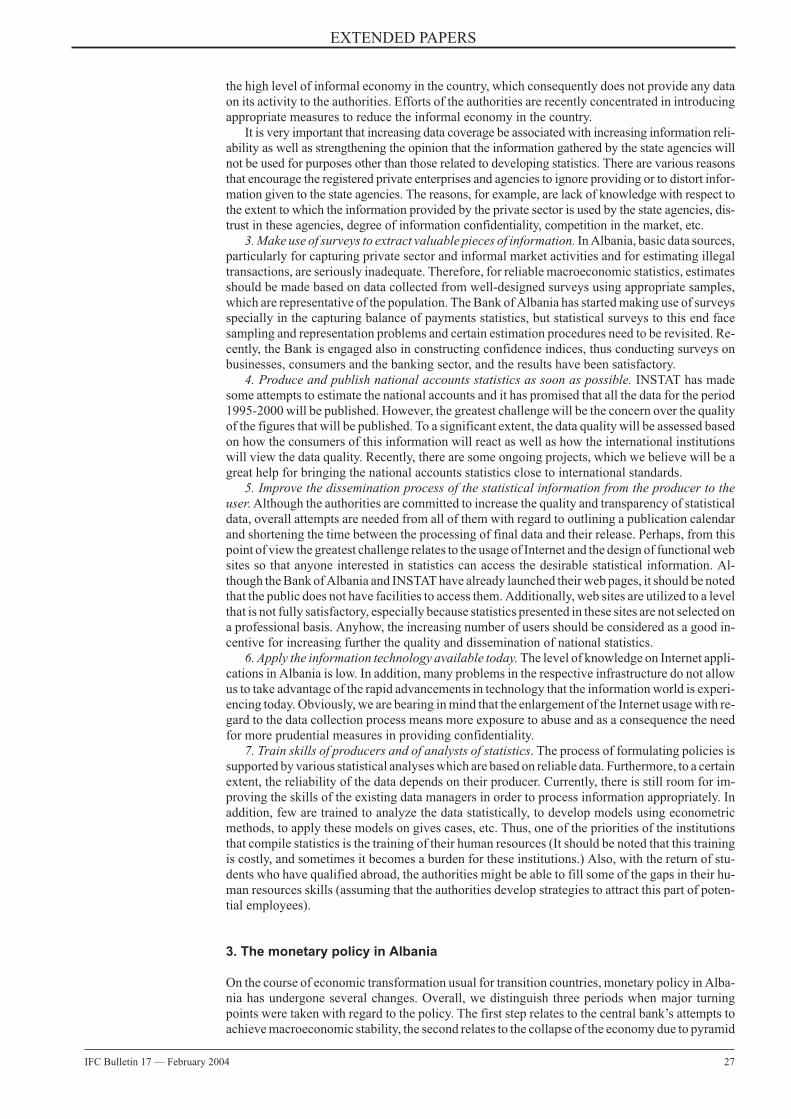
the high level of informal economy in the country, which consequently does not provide any dataon its activity to the authorities. Efforts of the authorities are recently concentrated in introducingappropriate measures to reduce the informal economy in the country.
It is very important that increasing data coverage be associated with increasing information reli-ability as well as strengthening the opinion that the information gathered by the state agencies willnot be used for purposes other than those related to developing statistics. There are various reasonsthat encourage the registered private enterprises and agencies to ignore providing or to distort infor-mation given to the state agencies. The reasons, for example, are lack of knowledge with respect tothe extent to which the information provided by the private sector is used by the state agencies, dis-trust in these agencies, degree of information confidentiality, competition in the market, etc.
3. Make use of surveys to extract valuable pieces of information. In Albania, basic data sources,particularly for capturing private sector and informal market activities and for estimating illegaltransactions, are seriously inadequate. Therefore, for reliable macroeconomic statistics, estimatesshould be made based on data collected from well-designed surveys using appropriate samples,which are representative of the population. The Bank of Albania has started making use of surveysspecially in the capturing balance of payments statistics, but statistical surveys to this end facesampling and representation problems and certain estimation procedures need to be revisited. Re-cently, the Bank is engaged also in constructing confidence indices, thus conducting surveys onbusinesses, consumers and the banking sector, and the results have been satisfactory.
4. Produce and publish national accounts statistics as soon as possible. INSTAT has madesome attempts to estimate the national accounts and it has promised that all the data for the period1995-2000 will be published. However, the greatest challenge will be the concern over the qualityof the figures that will be published. To a significant extent, the data quality will be assessed basedon how the consumers of this information will react as well as how the international institutionswill view the data quality. Recently, there are some ongoing projects, which we believe will be agreat help for bringing the national accounts statistics close to international standards.
5. Improve the dissemination process of the statistical information from the producer to theuser. Although the authorities are committed to increase the quality and transparency of statisticaldata, overall attempts are needed from all of them with regard to outlining a publication calendarand shortening the time between the processing of final data and their release. Perhaps, from thispoint of view the greatest challenge relates to the usage of Internet and the design of functional websites so that anyone interested in statistics can access the desirable statistical information. Al-though the Bank of Albania and INSTAT have already launched their web pages, it should be notedthat the public does not have facilities to access them. Additionally, web sites are utilized to a levelthat is not fully satisfactory, especially because statistics presented in these sites are not selected ona professional basis. Anyhow, the increasing number of users should be considered as a good in-centive for increasing further the quality and dissemination of national statistics.
6. Apply the information technology available today. The level of knowledge on Internet appli-cations in Albania is low. In addition, many problems in the respective infrastructure do not allowus to take advantage of the rapid advancements in technology that the information world is experi-encing today. Obviously, we are bearing in mind that the enlargement of the Internet usage with re-gard to the data collection process means more exposure to abuse and as a consequence the needfor more prudential measures in providing confidentiality.
7. Train skills of producers and of analysts of statistics. The process of formulating policies issupported by various statistical analyses which are based on reliable data. Furthermore, to a certainextent, the reliability of the data depends on their producer. Currently, there is still room for im-proving the skills of the existing data managers in order to process information appropriately. Inaddition, few are trained to analyze the data statistically, to develop models using econometricmethods, to apply these models on gives cases, etc. Thus, one of the priorities of the institutionsthat compile statistics is the training of their human resources (It should be noted that this trainingis costly, and sometimes it becomes a burden for these institutions.) Also, with the return of stu-dents who have qualified abroad, the authorities might be able to fill some of the gaps in their hu-man resources skills (assuming that the authorities develop strategies to attract this part of poten-tial employees).
3. The monetary policy in Albania
On the course of economic transformation usual for transition countries, monetary policy in Alba-nia has undergone several changes. Overall, we distinguish three periods when major turningpoints were taken with regard to the policy. The first step relates to the central bank’s attempts toachieve macroeconomic stability, the second relates to the collapse of the economy due to pyramid
EXTENDED PAPERS
IFC Bulletin 17 — February 2004 27
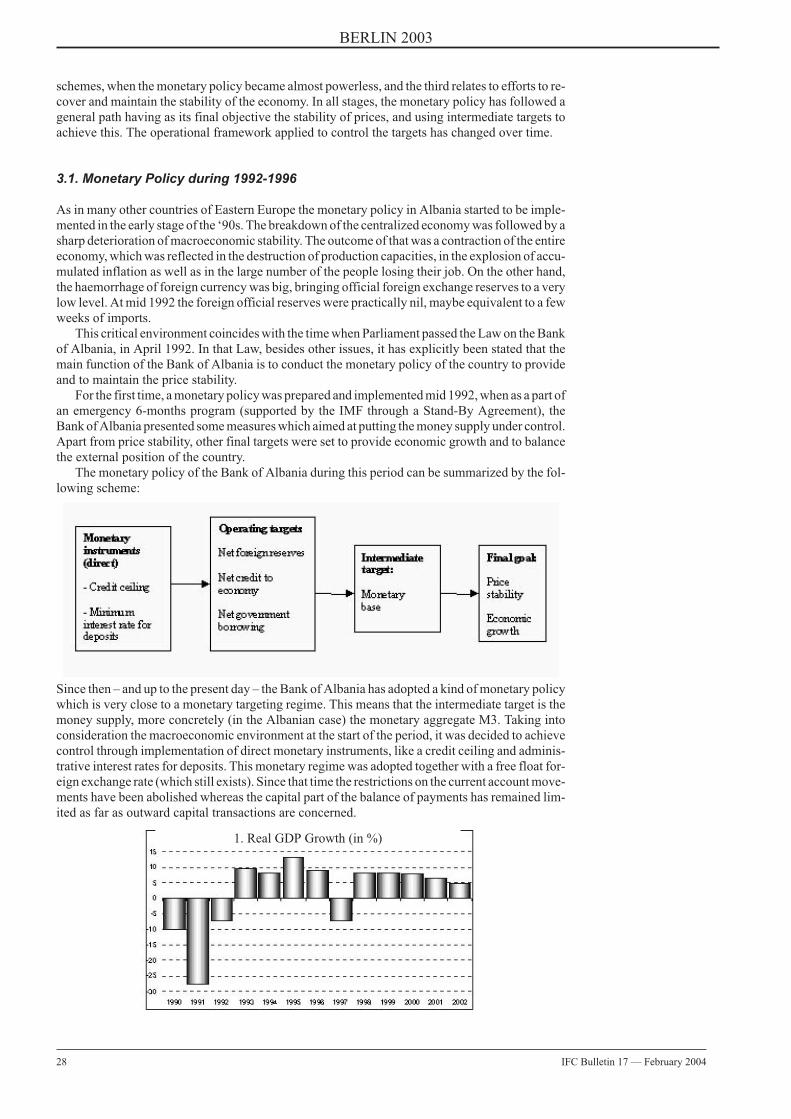
schemes, when the monetary policy became almost powerless, and the third relates to efforts to re-cover and maintain the stability of the economy. In all stages, the monetary policy has followed ageneral path having as its final objective the stability of prices, and using intermediate targets toachieve this. The operational framework applied to control the targets has changed over time.
3.1. Monetary Policy during 1992-1996
As in many other countries of Eastern Europe the monetary policy in Albania started to be imple-mented in the early stage of the ‘90s. The breakdown of the centralized economy was followed by asharp deterioration of macroeconomic stability. The outcome of that was a contraction of the entireeconomy, which was reflected in the destruction of production capacities, in the explosion of accu-mulated inflation as well as in the large number of the people losing their job. On the other hand,the haemorrhage of foreign currency was big, bringing official foreign exchange reserves to a verylow level. At mid 1992 the foreign official reserves were practically nil, maybe equivalent to a fewweeks of imports.
This critical environment coincides with the time when Parliament passed the Law on the Bankof Albania, in April 1992. In that Law, besides other issues, it has explicitly been stated that themain function of the Bank of Albania is to conduct the monetary policy of the country to provideand to maintain the price stability.
For the first time, a monetary policy was prepared and implemented mid 1992, when as a part ofan emergency 6-months program (supported by the IMF through a Stand-By Agreement), theBank of Albania presented some measures which aimed at putting the money supply under control.Apart from price stability, other final targets were set to provide economic growth and to balancethe external position of the country.
The monetary policy of the Bank of Albania during this period can be summarized by the fol-lowing scheme:
Since then – and up to the present day – the Bank of Albania has adopted a kind of monetary policywhich is very close to a monetary targeting regime. This means that the intermediate target is themoney supply, more concretely (in the Albanian case) the monetary aggregate M3. Taking intoconsideration the macroeconomic environment at the start of the period, it was decided to achievecontrol through implementation of direct monetary instruments, like a credit ceiling and adminis-trative interest rates for deposits. This monetary regime was adopted together with a free float for-eign exchange rate (which still exists). Since that time the restrictions on the current account move-ments have been abolished whereas the capital part of the balance of payments has remained lim-ited as far as outward capital transactions are concerned.
28 IFC Bulletin 17 — February 2004
BERLIN 2003
1. Real GDP Growth (in %)
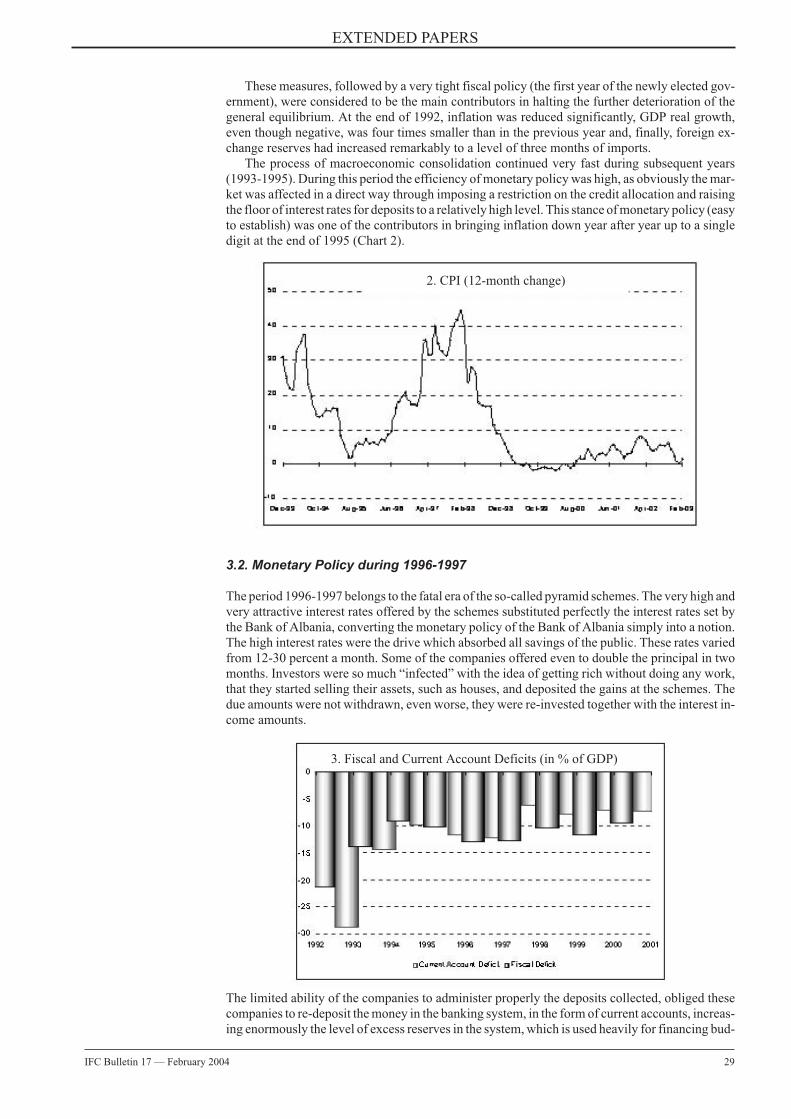
These measures, followed by a very tight fiscal policy (the first year of the newly elected gov-ernment), were considered to be the main contributors in halting the further deterioration of thegeneral equilibrium. At the end of 1992, inflation was reduced significantly, GDP real growth,even though negative, was four times smaller than in the previous year and, finally, foreign ex-change reserves had increased remarkably to a level of three months of imports.
The process of macroeconomic consolidation continued very fast during subsequent years(1993-1995). During this period the efficiency of monetary policy was high, as obviously the mar-ket was affected in a direct way through imposing a restriction on the credit allocation and raisingthe floor of interest rates for deposits to a relatively high level. This stance of monetary policy (easyto establish) was one of the contributors in bringing inflation down year after year up to a singledigit at the end of 1995 (Chart 2).
3.2. Monetary Policy during 1996-1997
The period 1996-1997 belongs to the fatal era of the so-called pyramid schemes. The very high andvery attractive interest rates offered by the schemes substituted perfectly the interest rates set bythe Bank of Albania, converting the monetary policy of the Bank of Albania simply into a notion.The high interest rates were the drive which absorbed all savings of the public. These rates variedfrom 12-30 percent a month. Some of the companies offered even to double the principal in twomonths. Investors were so much “infected” with the idea of getting rich without doing any work,that they started selling their assets, such as houses, and deposited the gains at the schemes. Thedue amounts were not withdrawn, even worse, they were re-invested together with the interest in-come amounts.
The limited ability of the companies to administer properly the deposits collected, obliged thesecompanies to re-deposit the money in the banking system, in the form of current accounts, increas-ing enormously the level of excess reserves in the system, which is used heavily for financing bud-
EXTENDED PAPERS
IFC Bulletin 17 — February 2004 29
3. Fiscal and Current Account Deficits (in % of GDP)
2. CPI (12-month change)
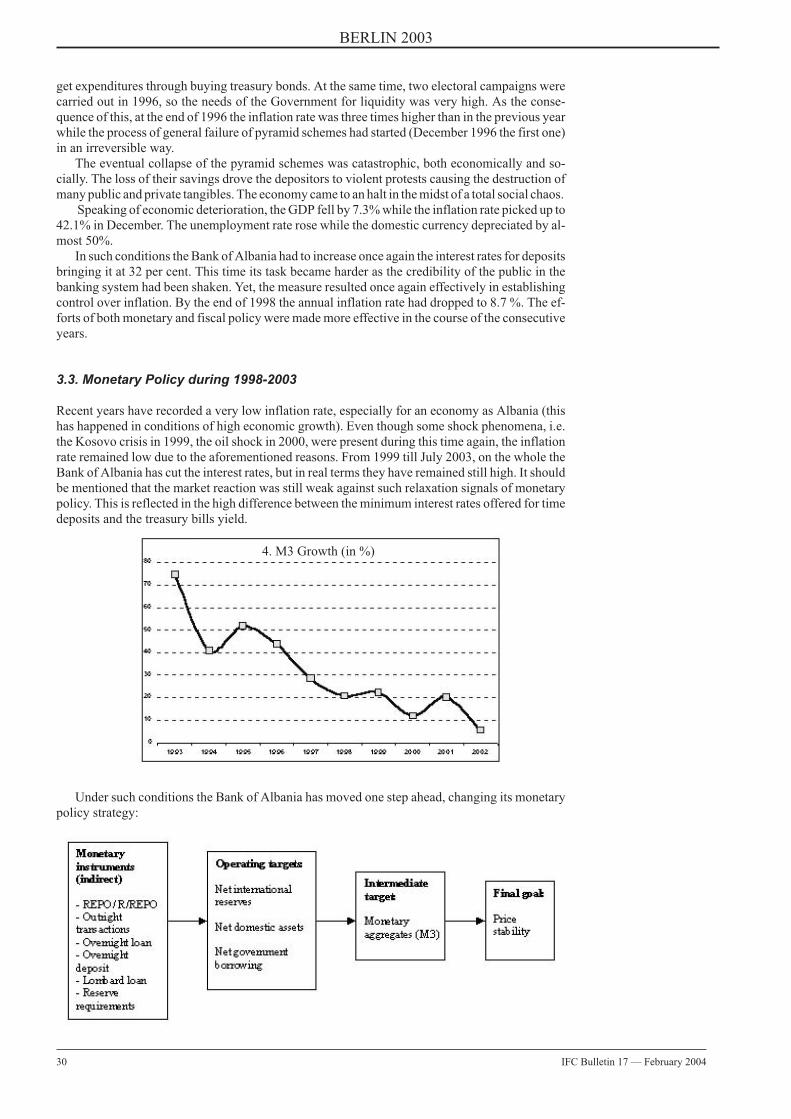
get expenditures through buying treasury bonds. At the same time, two electoral campaigns werecarried out in 1996, so the needs of the Government for liquidity was very high. As the conse-quence of this, at the end of 1996 the inflation rate was three times higher than in the previous yearwhile the process of general failure of pyramid schemes had started (December 1996 the first one)in an irreversible way.
The eventual collapse of the pyramid schemes was catastrophic, both economically and so-cially. The loss of their savings drove the depositors to violent protests causing the destruction ofmany public and private tangibles. The economy came to an halt in the midst of a total social chaos.
Speaking of economic deterioration, the GDP fell by 7.3% while the inflation rate picked up to42.1% in December. The unemployment rate rose while the domestic currency depreciated by al-most 50%.
In such conditions the Bank of Albania had to increase once again the interest rates for depositsbringing it at 32 per cent. This time its task became harder as the credibility of the public in thebanking system had been shaken. Yet, the measure resulted once again effectively in establishingcontrol over inflation. By the end of 1998 the annual inflation rate had dropped to 8.7 %. The ef-forts of both monetary and fiscal policy were made more effective in the course of the consecutiveyears.
3.3. Monetary Policy during 1998-2003
Recent years have recorded a very low inflation rate, especially for an economy as Albania (thishas happened in conditions of high economic growth). Even though some shock phenomena, i.e.the Kosovo crisis in 1999, the oil shock in 2000, were present during this time again, the inflationrate remained low due to the aforementioned reasons. From 1999 till July 2003, on the whole theBank of Albania has cut the interest rates, but in real terms they have remained still high. It shouldbe mentioned that the market reaction was still weak against such relaxation signals of monetarypolicy. This is reflected in the high difference between the minimum interest rates offered for timedeposits and the treasury bills yield.
Under such conditions the Bank of Albania has moved one step ahead, changing its monetarypolicy strategy:
30 IFC Bulletin 17 — February 2004
BERLIN 2003
4. M3 Growth (in %)
It has removed all direct instruments for controlling the money supply, aiming to explore a newway: that of ensuring monetary control through the market. Starting from the third quarter of 2000,the Bank of Albania is using the repo rates as the main instrument for achieving its monetary goals.
4. Statistics and the decision-making process
Despite the achievement scored in the last 10-12 years, it should be mentioned that the deci-sion-taking process has not been an easy one. Considering a significant degree of absence of statis-tical information, particularly national accounts data, the BoA’s decision-taking process basicallyhas relied on the usage of monetary statistics.
This truth does not stand only for the Bank of Albania decision-making but for the entire deci-sion-making process. However, undoubtedly, money and banking statistics have significantlybeen the basic nourishment for monetary policy.
Utilization of monetary and banking statistics
During the recent decade, monetary policy has undergone some changes. Since its starting pointuntil the present day, the selected regime, with money as the intermediate objective, has remainedunchanged. However, due to recurrent agreements with the IMF, the Bank of Albania constantlyhas to achieve its ultimate targets through the meeting of some quantitative restrictions on somemonetary indicators (for more details, see the Annex).
This policy framework that is simple to a certain degree, enabled the money and banking statis-tics to be a sufficient statistical feedback for effective decision-making. The publication of suchstatistical documents as the monetary survey and monetary authority accounts, along with otherdata on financial markets and inflation, were deemed sufficient in considering any possible changeof interest rate1.
In the beginning of the 2000s, a kind of ineffectiveness of the above-mentioned policy instru-ments was evidenced. Therefore, after eliminating the credit restrictions in 1999, a year later (au-tumn of 2000) the monetary control was based merely on market instruments. To this end, a weeklyrepo auction was introduced, the market rate of which won the attribution of the basic percentagein the economy. Since that time, the Bank of Albania started to announce the desired figure of fu-ture inflation, fixing an interval of 2-4 per cent.
Unfortunately, the change in the operational framework is not associated with an enrichment ofstatistical information. Maybe, the only change rests on the fact that the statistical set availablecontinues to increase the number of observations, manifesting a slight improvement on their qual-ity.
Utilization of real sector statistics
Even currently, the statistical scarcity continues in the field of real economic indicators. Currentlywe have a new basket2 of CPI, updated and enriched with additional articles, but, nevertheless, thatdoes not mean a lot, as far as it remains the only qualitative development of the last three years. Onthe other hand, we have not yet a fully reliable statistical set of national accounts. The country’seconomic growth3 still constitutes an estimation of a relatively low degree of confidence, while aGDP composition according to sectors or measured by expenditure or income, does not yet exist.Furthermore, the frequency of updating the GDP growth is low, at about 6 months.
The figures concerning the labor market are another story of statistical ineffectiveness in Alba-nia. Even though it is claimed that the unemployment rate is measured in conformity with interna-tional standards, yet there exists a general idea that it conveys deviations from reality and that itsutility is low. The large migrating movements from rural to urban areas or abroad make the mea-surement of employment indicators more difficult, damaging in this way the overall deci-sion-making process.
Utilization of fiscal sector statistics
As aforementioned, it is the responsibility of the Ministry of Finance to compile and to disseminatethe fiscal statistics. Currently, in Albania, though there has existed an independent local govern-ment for about one decade, yet its financial independence from the central government is very low.For this reason the balance is consolidated and part of the central fiscal balance published by the
EXTENDED PAPERS
IFC Bulletin 17 — February 2004 31
1 During 90’s the administrative interest rates on deposits in home currency, placed in state owned banks, played a keyrole in economy, some times 3-month deposits rate and some times 12-months maturity deposits rates.
2 The previous basket consisted in 241 articles, and it composed based on households consumption survey of 1993.3 The estimation of GDP growth is based on some indicators like cement and electricity consumptions, prices of foreign
partner countries, etc.
Ministry of Finance. It should be stressed that despite the long time passed the periodicity of data isstill once a quarter, while the release period takes three other months after the end of the referenceperiod. However, considering the fact that the BoA and the banking system in general are havingGovernment accounts, it is much easier for monetary policy to identify with a degree of accuracythe liquidity needs of the Government (naturally in very short-terms). This becomes especially im-portant under conditions when the Bank of Albania is obliged1 to partially cover the budgetary def-icit with direct credit, as stipulated by law.
Statistics at the Bank of Albania
Undoubtedly, two more mature statistical categories are those that have to do with financial statis-tics and with the balance of payments. Both categories are produced since 1992 and in fact theyconstitute the basic information for the policy decision-making process at the Bank of Albania.
The balance of payments statistics are produced on a quarterly basis, with a lag of 3 months af-ter the end of the reference period. However, some important parts of it, like foreign trade figures,services, remittances etc., are prepared on a monthly basis making it easy for us to have a better fill-ing of the developments on the current account.
Currently, the Bank of Albania produces in parallel the complete financial statistics in compli-ance with the old and new statistical manual compiled by the IMF. In fact, the statistical input forthe Bank of Albania decision-making consists of the statistical input produced pursuant to the pre-vious IMF manual that was called money and banking statistics. More concretely, this statisticalinput includes:• monetary authority accounts;• Bank of Albania NFA;• the deposit money banks consolidated balance;• the monetary survey;• performance criteria;• interest rates and volume of transactions in financial markets (repo rates, interbank rates, trea-
sury bills yields, lending and deposits rate);• foreign exchange records; etc.
These data are produced on a monthly basis and recently the statistics department is taking steps toimprove the method for calculating and presenting these data according to the new instructions ofthe IMF. Financial and banking statistics are published monthly and their release is notified in ad-vance. In addition, daily and weekly information is obtained with regards to the interbank market,the money market, the forex market, and other operational information.
Other sources of information that the Bank of Albania is using recently to feed its monetarypolicy are constituted by surveys. Surveys with regard to the balance of payments face the prob-lems of sampling and representation, and they are currently under review. However, since over ayear ago, the BoA is involved also in building confidence indices and the surveys conducted ap-pear reliable. More concretely, surveys are conducted quarterly on businesses, consumers andbanks2. The results of these surveys are not published yet, as we are still trying to be fully con-vinced of the accuracy of the results, and also try to have a longer series of indices in order to beable to compare. It should be noted that the surveys are similar to confidence surveys conducted byother countries; therefore, in the future, figures could be compared across countries.
The combination of all this information, i.e. financial statistics3 with CPI data and with datafrom the liquidity situation in the banking system, etc., forms the basic statistical input from themonetary and financial point of view, on which the decision on the next stance of interest rates isdrawn.
In more detail, the Monetary Policy Department every month compiles and submits to the Su-pervisory Council the monetary policy report, a document in which proposals for future possiblepolicy actions are specified. This report explains primarily the main developments on inflation andmoney, expectations and various forecasting methods on monetary aggregates, the exchange rate,and inflation. This document is subject to the Supervisory Council’s judgement, which, at the endcomes up with a conclusion whether it should be changed; to what direction and to what extent.
32 IFC Bulletin 17 — February 2004
BERLIN 2003
1 Conform Bank of Albania Law, the Bank of Albania is enforced to finance the fiscal deficit to a certain amount, which isequal to the 5 percent of the average fiscal revenues realized in the last three years.
2 Surveys on businesses and consumers are conducted in cooperation with INSTAT, which has the appropriate meansand information to do the field work.
3 The statistical information is available monthly on 25th of the following month.
Forecasting at the Bank of Albania
On the whole, the Bank of Albania’s forecasting of monetary indicators is identified with the ap-proach of the IMF that is known as monetary programming. According to this approach, thechange: in net foreign assets1, in the fiscal deficit2, and in credit3 to the economy, under the assump-tion of other assets remaining unchanged, is equal with the money supply growth. On the otherhand, recently, we have started to use statistical information for econometric analysis. Also withthe assistance of foreign experts, we are applying econometric methods to build models whichmight apply to our economic structure and trying to find and test linkages among macroeconomicindicators (it must be mentioned that as yet few series are long enough for such analyses.)
Since our main objective is price stability, the Bank of Albania has been more concerned withmonitoring and controlling the process of inflation. Therefore, we have developed two very simpleequations, aiming at inflation forecasting. In short, they consist of:• an empirical approach on the historical inflation trend, where the highest importance is put to the
most recent years and where the historical periods with considerable spikes on inflation, like1997, are excluded;
• a more analytical approach, which considers those factors assessed to impact more significantlyon inflation, measured as a monthly change of the consumer price index P.
where m is the monthly stock of monetary aggregate M1, seasonally adjusted, with three laggedperiods and e the Nominal Effective Exchange Rate, seasonally adjusted with one lagged pe-riod.
The need to set up inflation forecasting models became concrete at the beginning of the 2000s,when it was verified that under conditions of meeting the quantitative targets of performance crite-ria, the money supply stock, many times recorded substantial deviations from programmed valueswhile inflation4 itself did not manifest such deviations.
However, the above-mentioned forecasting models are considered to have many limitations,especially from the point of view of the employment of econometric techniques. Therefore, it is be-ing worked out in parallel to set up a more reliable model, on a quarterly basis, which has as its fo-cus the division of the CPI into tradables and non-tradables. Similar analyses are also being madewith regard to measuring the imported inflation and core inflation.
Finally, it should be mentioned that, based on the research made by the IMF Technical Assis-tance Mission in cooperation with experts of the Research and Monetary Policy Department, workhas started a long time ago on the identification of the future monetary policy regime, trying tocome up with an answer whether or not a change in the repo rate at a certain moment and to a certaindegree has the desired impact on inflation.
5. The future: Inflation targeting or…?
Answering the above question, the Bank of Albania has presently taken a decision that essentiallyimplies the adoption of an Inflation Targeting Regime (IT). The Bank has already understood thatIT is a successful strategy if, on the one hand, it finds a sound macroeconomic and institutional en-vironment and, on the other hand, it faces an audience (economic agents, individuals, general pub-lic) that understands and welcomes it.
In this regard, the Albanian reality, despite the impressive macroeconomic consolidation, canbe assessed as still being far removed from the end of the long road towards a free market.
5.1. Macroeconomic aspect
Inflation: In general, the literature recommends that the step to an inflation targeting regimeshould only be taken after a period of two to three years of low inflation5. As a low rate is consid-
EXTENDED PAPERS
IFC Bulletin 17 — February 2004 33
ttttt emPP ���� ���������� )1(3)3(2)1(1
1 The information issued from the Balance of Payments statistics.2 The information issued from the Government accounts statistics.3 Credit to economy, according to the data of year-end 2002 is still in very low figures, at about 8 per cent of GDP or
around 10 per cent of the banking system total assets. This implies an item not very difficult to be predicted.4 The final monetary policy target consists in holding the headline annual inflation at the end of the year within the inter-
val of 2-4 per cent.5 Yet, countries like Czech Republic, Poland and other have adopted this regime in circumstances when inflation rate
varied from 6 to 10 per cent.
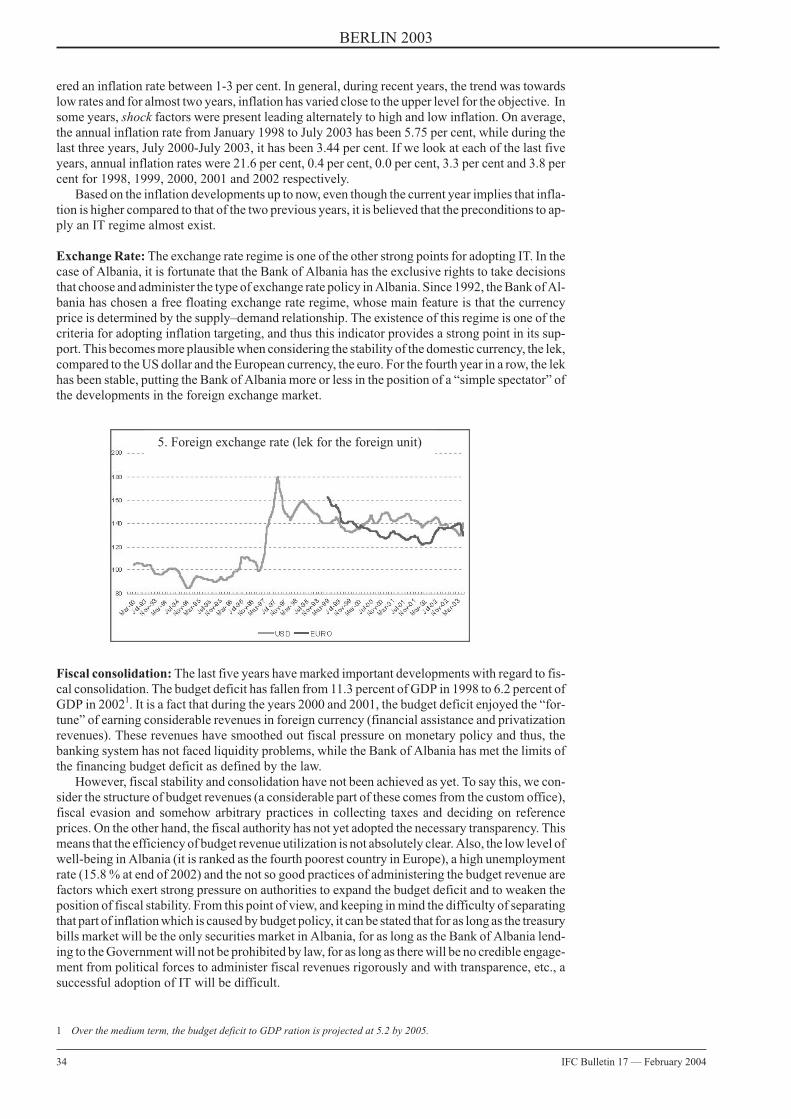
ered an inflation rate between 1-3 per cent. In general, during recent years, the trend was towardslow rates and for almost two years, inflation has varied close to the upper level for the objective. Insome years, shock factors were present leading alternately to high and low inflation. On average,the annual inflation rate from January 1998 to July 2003 has been 5.75 per cent, while during thelast three years, July 2000-July 2003, it has been 3.44 per cent. If we look at each of the last fiveyears, annual inflation rates were 21.6 per cent, 0.4 per cent, 0.0 per cent, 3.3 per cent and 3.8 percent for 1998, 1999, 2000, 2001 and 2002 respectively.
Based on the inflation developments up to now, even though the current year implies that infla-tion is higher compared to that of the two previous years, it is believed that the preconditions to ap-ply an IT regime almost exist.
Exchange Rate: The exchange rate regime is one of the other strong points for adopting IT. In thecase of Albania, it is fortunate that the Bank of Albania has the exclusive rights to take decisionsthat choose and administer the type of exchange rate policy in Albania. Since 1992, the Bank of Al-bania has chosen a free floating exchange rate regime, whose main feature is that the currencyprice is determined by the supply–demand relationship. The existence of this regime is one of thecriteria for adopting inflation targeting, and thus this indicator provides a strong point in its sup-port. This becomes more plausible when considering the stability of the domestic currency, the lek,compared to the US dollar and the European currency, the euro. For the fourth year in a row, the lekhas been stable, putting the Bank of Albania more or less in the position of a “simple spectator” ofthe developments in the foreign exchange market.
Fiscal consolidation: The last five years have marked important developments with regard to fis-cal consolidation. The budget deficit has fallen from 11.3 percent of GDP in 1998 to 6.2 percent ofGDP in 20021. It is a fact that during the years 2000 and 2001, the budget deficit enjoyed the “for-tune” of earning considerable revenues in foreign currency (financial assistance and privatizationrevenues). These revenues have smoothed out fiscal pressure on monetary policy and thus, thebanking system has not faced liquidity problems, while the Bank of Albania has met the limits ofthe financing budget deficit as defined by the law.
However, fiscal stability and consolidation have not been achieved as yet. To say this, we con-sider the structure of budget revenues (a considerable part of these comes from the custom office),fiscal evasion and somehow arbitrary practices in collecting taxes and deciding on referenceprices. On the other hand, the fiscal authority has not yet adopted the necessary transparency. Thismeans that the efficiency of budget revenue utilization is not absolutely clear. Also, the low level ofwell-being in Albania (it is ranked as the fourth poorest country in Europe), a high unemploymentrate (15.8 % at end of 2002) and the not so good practices of administering the budget revenue arefactors which exert strong pressure on authorities to expand the budget deficit and to weaken theposition of fiscal stability. From this point of view, and keeping in mind the difficulty of separatingthat part of inflation which is caused by budget policy, it can be stated that for as long as the treasurybills market will be the only securities market in Albania, for as long as the Bank of Albania lend-ing to the Government will not be prohibited by law, for as long as there will be no credible engage-ment from political forces to administer fiscal revenues rigorously and with transparence, etc., asuccessful adoption of IT will be difficult.
34 IFC Bulletin 17 — February 2004
BERLIN 2003
5. Foreign exchange rate (lek for the foreign unit)
1 Over the medium term, the budget deficit to GDP ration is projected at 5.2 by 2005.
Financial Stability: If we look at the financial system crises, it seems that Albania has not gonethrough major ones. This holds true for that part of the economy, which is called “formal”. In Alba-nia, despite the establishment of five new insurance institutions, the de facto financial system canbe identified with the banking one. On the other hand, we should not forget that the 1997 crisis,though it was not caused by the banking system, still was a typical financial phenomenon, the out-come of which on the main macroeconomic indicators, production, inflation, unemployment, bal-ance of payments, etc., was unmeasurable.
In this context, the question arises: Which can be an immunity system protecting Albaniaagainst financial crisis? Despite the continuous attempts to strengthen banking supervision, yetour banking system is underdeveloped and offers a low level of intermediation. It shows large con-centration and it operates in conditions where the risk is high (the whole spectrum from the politi-cal to the operational one), regulations are incomplete and where there are problems with imple-menting the rules, etc. One example of a combination of all this dates back to just one year agowhen the financial stability of the banking system in Albania was threatened by the deposit with-drawals that took place during the period March-April 2002. The main subject of these withdraw-als were the two largest banks. The reason behind this panic was purely psychological caused by amisinterpretation of the law for deposit insurance and the announced privatization of the SavingsBank, the largest and the only state owned bank in Albania. This panic materialized in 19.7 billionlek deposit withdrawals, from which 13.8 billion were in domestic currency and 5.9 billion in for-eign currency. The fast increase in the currency outside banks, which faced an annual growth of35.6 percent, was re-stabilized in the following months by the monetary policy of the Bank of Al-bania, whose main aim was restoring financial stability.
Apart from the banking market, other markets and financial institutions are almost inactive.They are newly born and the level of exposure is high.
An informal economy is still present and, despite the bitter experience, there are hints that bor-rowing activity in this market still continues, though to a low extent. According to the latest surveyon businesses conducted by the Bank of Albania, the demand for credit in the informal market hasfallen.
As might be noticed, a defensive mechanism of Albania towards financial crises suffers frommany problems and although they are known for quite a while, it is not possible to eliminate them.The weak immunity system causes the Albanian economy to have a relatively high degree of expo-sure and consequently an important condition of an IT regime is not met.
5.2. Institutional aspect
While from a macroeconomic point of view there are factors that favor the choice of an IT regimeas a monetary policy regime, it is believed that from an institutional point of view there are moredisadvantageous points, which weaken this choice.
Central Bank independence: The law offers an independent position for the central bank, but inreality central bank independence is far removed from legal independence and under threat. Itseems that other authorities have no intention to fully respect central bank independence. On theother hand, there is not sufficient guarantee that independence as granted by the existing law (all ofit or specific aspects of it) will not be subject to later changes.
Central Bank transparency: Also, it is assessed that the central bank not yet fully applies trans-parency, especially on explaining the decision-making process with regard to monetary policy.
Central Bank credibility: It cannot be mentioned that the Bank of Albania enjoys full credibilityin the public. On the other hand, adopting an IT regime weakens central bank credibility if the bankis shifting away from its objective.
Central Bank accountability: It is estimated that accountability should increase. The Bank of Al-bania has taken on to respect all the reporting requirements, but the quality of these reports is sub-ject to further improvements that are expected to increase the Bank of Albania’s accountability.
Not so good relationships with the Fiscal Authority: The coordination between the fiscal andmonetary authorities is not at levels required by an IT regime. In practice, this lack of coordinationhinders the Bank of Albania to implement efficiently the instruments to complete monetary policy.
Overall, the institutional aspect is considered a weak point in adopting inflation targeting
EXTENDED PAPERS
IFC Bulletin 17 — February 2004 35

5.3. The level of understanding from the public
Albanians took the first practical lessons of what inflation is at the beginnings of the ‘90s. As yearspassed by, everybody understood that more or less, price increases erode their income and savings,however few understand that the difficult mission of keeping stable prices belongs to an institutionnamed Bank of Albania. In fact, Albanians learned one thing; “short-term sacrifices can reaplong-term rewards”. Both main political forces called out this statement when each of them cameto power. Despite this, they could not understand the mechanism that can take one from the devas-tated present to a richer and safer future. An evidence of this is the unending period of transitionand the many failures during this period (mostly for subjective reasons). A limited number of peo-ple are able to explain why serious reforms are needed while some remain disappointed and themajority accepts them indifferently.
In this context, it is hard to believe that the Bank of Albania will find “suitable” partners on theother side that can rightly understand and perceive its decisions. When the public understands andwelcomes central bank policy, then the public and its expectations of inflation (guided by the ob-jective for inflation) turn into a factor that determines future inflation rates.
In fact, public awareness, its familiarity with policies, banking, etc. improvements in the insti-tutional framework are today’s tasks and they do not need to wait for the completion of other pre-liminary conditions. Some of the issues which need to be looked at are as following:
1. Increasing the Bank of Albania’s transparency. For this reason, the central bank has increasedthe number of its publications, specially the explanatory ones, presentations with media, contactswith the public, meetings and seminars and has also approved a strategy and regulation on trans-parency which is in line with the Code of Good Practices in Monetary Policy approved by the IMF.Following this regulation, the decisions of the governing body of the Bank of Albania are not onlypublished but also explained giving the context in which they are taken. Monetary policy reportsare published on regular frequencies, and their release is made known to the public in advance. Sta-tistical data produced by the BoA are fully explained in appendices. Currently, the methodologyfor compiling monetary and financial statistics (IMF’s) is being published in Albanian.
The BoA has started the practice of organizing an annual conference with a different topic re-lated to the BoA or economic and monetary policies and statistics (the conference of 2000 was ded-icated to statistics only), which aim at bringing academics and experts together and in contact withthe audience the BoA is trying to get attention of. Representatives of the governing body of theBoA have been engaged in meetings with students from Economic Departments, trying to pointout the importance of role of the central bank in the economy and sharing the experiences in formu-lating policies.
2. Improving relationships with other state institutions. For this purpose, the Bank of Albania hasadopted an intensive approach towards all international organizations (integration in EU, StabilityPact, and discussions of documents such as development strategies for SMEs). The most notable isthe participation in the debt committee.
3. Increasing accountability. The Bank of Albania has increased its contacts and reports with andto the Parliament trying to expand on explanations about decision-making.
4. Increasing credibility. Apart from achieving the objectives and making these known, the Bankof Albania is trying to win the public and establish a regular communication with it. The bank is or-ganizing campaigns (on lending), it is approaching businesses to understand the latter’s expecta-tions, etc.
5. Achieving education. The importance of training skills was also mentioned when discussing thesteps to improve on statistics. Thus, the process of education has involved also the Bank of Albaniaitself, apart from other authorities and the public. The Bank of Albania has also offered financialsupport for this. The most recent example of training at the BoA is the 6-month school of Profes-sional Education in Applied Statistics and Econometrics offered to its employees through the Uni-versity of Tirana with the joint financial support from USAID.
6. Increasing central bank independence.
7. Getting involved in other issues which are not the Bank of Albania’s direct concerns, but whichaffect the existence of required conditions to adopt IT. An example of this is the representation inthe team responsible for the project of improvement of statistics and full implementation of GDDS
36 IFC Bulletin 17 — February 2004
BERLIN 2003
criteria. Annual contracts are signed with INSTAT, the national statistical agency, to facilitate thedistribution of statistical data to users and to improve the quality of these data. Seminars andtrainings are organized in cooperation with regard to real sector data (responsibility of INSTAT).
In order to comply with or improve each of the above-mentioned preconditions, a period of 2-3years or more is needed. This time interval is based above all on the Bank of Albania’s uncertaintyabout the commitment of other authorities to adopt this regime and about public reaction; on theneed to build a macroeconomic model (including a trial period); on the increase of financial marketefficiency with regard to absorbing informal assets, on further strengthening banking supervision,on the ability to collect new reliable statistical information and to increase the existing time seriesaccurately; on improving the money market so that an efficient instrument to control money be-comes available, etc.
6. Conclusions
The availability of a full set of statistical information which is timely and accurate is gaining greatimportance, as economic policies are being challenged to respond to the more complicated eco-nomic structures that are shaping the transition countries today. Unfortunately, in the case of Alba-nia, there is still much to be done with respect to the provision of appropriate statistics. Focusing onmonetary policy, this policy can rely only on monetary and banking statistics, produced by thebank. Improvements have been made with regard to the compilation and presentation of statisticsbringing them close to international standards (IMF’s) and thus ensuring a degree of comparisonwith other countries. Encouraging steps are taken regarding the forecasting techniques, which in-volve testing models by using econometric methods. Research work has been expanded in thisarea. All this has helped the governing bodies to formulate an adequate monetary policy overrecent years. So far, the monetary policy followed by the Bank of Albania has been able to serve thebank’s main objective, i.e. price stability. The inflation rate over the past year has been at around 3per cent.
However, we have seen that the development of monetary policy, its transition from using di-rect instruments to indirect instruments, and the contemplation to change to an inflation target re-gime, put pressure on the demand for statistics, and such on the necessity to improve those further.The importance of this gains even more weight by our long term ambition to join the EU, and thusto bring our statistics at that level. As we have exposed our priorities how to reach there, we havealso argued that it is a hard way.
Shelquim Cani and Gramos Kolasi (Bank of Albania)
EXTENDED PAPERS
IFC Bulletin 17 — February 2004 37
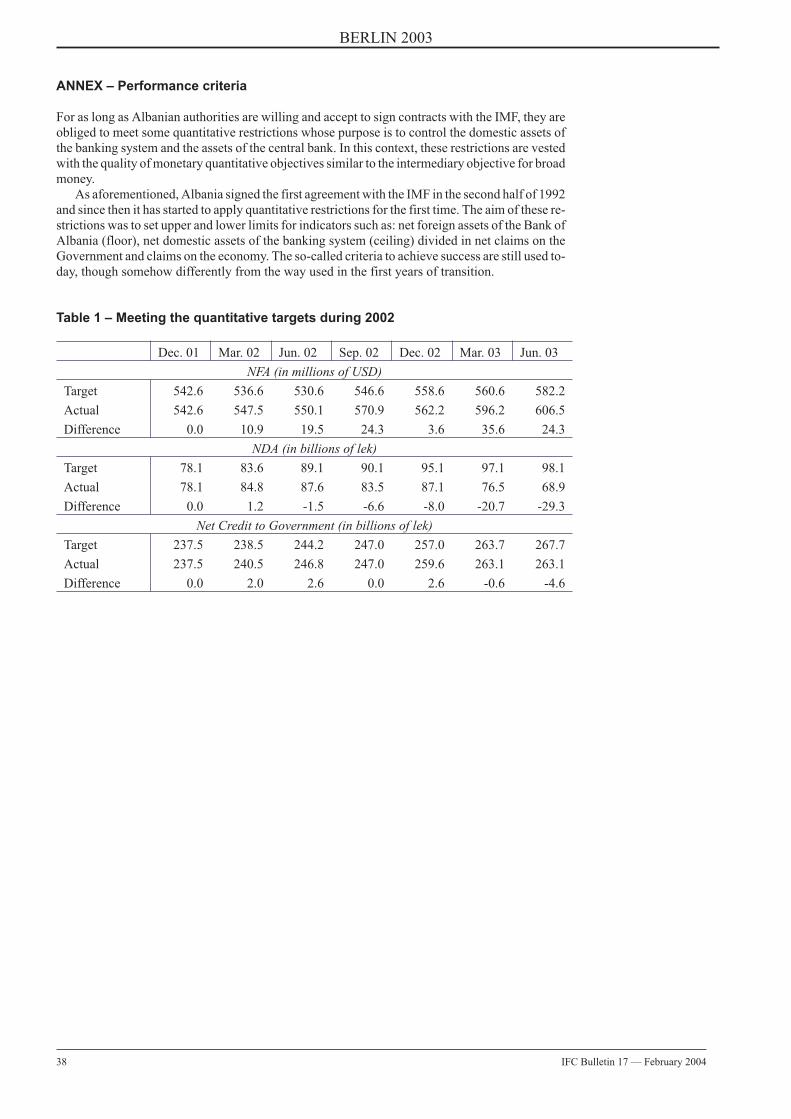
ANNEX – Performance criteria
For as long as Albanian authorities are willing and accept to sign contracts with the IMF, they areobliged to meet some quantitative restrictions whose purpose is to control the domestic assets ofthe banking system and the assets of the central bank. In this context, these restrictions are vestedwith the quality of monetary quantitative objectives similar to the intermediary objective for broadmoney.
As aforementioned, Albania signed the first agreement with the IMF in the second half of 1992and since then it has started to apply quantitative restrictions for the first time. The aim of these re-strictions was to set upper and lower limits for indicators such as: net foreign assets of the Bank ofAlbania (floor), net domestic assets of the banking system (ceiling) divided in net claims on theGovernment and claims on the economy. The so-called criteria to achieve success are still used to-day, though somehow differently from the way used in the first years of transition.
Table 1 – Meeting the quantitative targets during 2002
Dec. 01 Mar. 02 Jun. 02 Sep. 02 Dec. 02 Mar. 03 Jun. 03
NFA (in millions of USD)
Target 542.6 536.6 530.6 546.6 558.6 560.6 582.2
Actual 542.6 547.5 550.1 570.9 562.2 596.2 606.5
Difference 0.0 10.9 19.5 24.3 3.6 35.6 24.3
NDA (in billions of lek)
Target 78.1 83.6 89.1 90.1 95.1 97.1 98.1
Actual 78.1 84.8 87.6 83.5 87.1 76.5 68.9
Difference 0.0 1.2 -1.5 -6.6 -8.0 -20.7 -29.3
Net Credit to Government (in billions of lek)
Target 237.5 238.5 244.2 247.0 257.0 263.7 267.7
Actual 237.5 240.5 246.8 247.0 259.6 263.1 263.1
Difference 0.0 2.0 2.6 0.0 2.6 -0.6 -4.6
38 IFC Bulletin 17 — February 2004
BERLIN 2003
TRADE IN SERVICES
Measuring Tourism in the context ofInternational Trade in Services
Antonio Massieu (World Tourism Organization)
1. Introduction
Services transactions are increasing in importance, the impact of international trade in services ongrowth is now an area of particular interest for economic and policy analysis. The statistical mea-surement of international trade in services is also a subject of interest for trade policy analysts andinternational trade-in-services negotiators in the context of the General Agreement on Trade inServices (GATS). Among internationally traded services, “Tourism” is an area of special interestfor a number of reasons. There are many economies in which the expenditure of international “vis-itors” is an important source of foreign exchange earnings and one that contributes substantially toemployment and capital investment in the economy.
This paper will be concerned with the statistical measurement of the expenditure of interna-tional “visitors” within the larger picture of the domestic production of services and internationaltrade in services. It will examine the concept of Tourism developed for the framework of the Tour-ism Satellite Accounts (TSA) in the context of the well-established and more traditional analyticalframeworks such as the production accounts of the System of National Accounts and the Balanceof Payments. It will explain the relationship between the concept of “visitors” developed for thenew TSA framework and the main sources of available data to measure their expenditures, such asthe Balance of Payments. For analytical purposes it is necessary to measure the number of visitorsand other travellers who cross the border as well as the value of goods and services purchased bythem. It is of interest to monitor the impact of their demand on the supply of those goods and ser-vices and the extent of import leakages, as well as the impact on GDP and GNP, on employment,capital investment and government revenues in the receiving countries, as well as the countriesfrom which they travel.
Some mention will also be made of the use of the measurement of Tourism in the context of theGATS negotiations. Of the four modes of supply of services, mode 2 is “consumption abroad” andrefers to the fact that international trade in services can occur by persons moving across borders topurchase and consume services in another economy. The expenditure of international “visitors”and other travellers, on services, is the most important component of mode 2. However, to the ex-tent that they purchase the international transportation services of carriers belonging to countriesother than the one in which they reside, the supply of these services are treated as mode 1.
2. Tourism, the TSA and other analytical frameworks
The production accounts of the System of National Accounts provide a framework to display theproduction or supply of products (both goods and services) by industries. They also display vari-ous categories of demand for those products, namely, intermediate demand for those products bybusinesses and final demand. Final demand is composed of the demand for products, by persons,by government, for fixed capital formation, and for exports. As demand when first compiled is forboth domestically produced and imported products, in order to equate demand with domestic pro-duction, it is necessary to deduct imports.
The concept of Tourism can be related to the production accounts and the System of NationalAccounts. It can be approached from the demand side of the equation, “visitor” expenditure consti-tutes a sub-set of demand and international visitor expenditure is a sub-set of exports and imports.For purposes of Tourism analysis and to measure its contribution to the economy, the TSA hasidentified a set of Tourism characteristic products which in turn leads to the identification of a set
EXTENDED PAPERS
IFC Bulletin 17 — February 2004 39
of Tourism characteristic industries for whom, visitor expenditure (domestic and international) ac-counts for a large proportion of their revenue.
The Balance of Payments is the most important source of information about international tradein services. Data collected and compiled for the Balance of Payments provides the data for the ex-ports and imports of services in the production accounts of the System of National accounts. Goodsand services produced within an economy are domestically consumed or exported. When interna-tional visitors and other travellers consume the domestic production of the economy to which theytravel, the goods and services they consume are exports of that economy and are measured as partof the Balance of Payments. The fifth edition of the Balance of Payments Manual (BPM5) containsa Classification of International Transactions in Services, particular components of which can berelated to the expenditure of “visitors” and other travellers.
The new Manual on Statistics of International Trade in Services (MSITS) has expanded theclassification of services transactions contained in the fifth edition of the Balance of PaymentsManual (BPM5) into the Extended Balance of Payments Services (EBOPS) classification. It hasalso expanded the concept of international trade in services and its measurement, to cover theGATS concept of modes of supply. It therefore adds to international trade in services the concept of“commercial presence” as a mode of supply and recommends the collection of Foreign AffiliateTrade Statistics. Possible approaches to the measurement of the GATS concept of “presence of nat-ural persons” are suggested.
Given that the Balance of Payments is compiled world-wide, and it is expected that countrieswill start compiling EBOPS, it is useful to examine whether and how BOP and EBOPS data can beused in the analysis of Tourism.
3. Visitors and travellers
Tourism in the Tourism Satellite Account is defined as “the activities of persons travelling to andstaying in places outside their usual environment for not more than one consecutive year for lei-sure, business and other purposes not related to the exercise of an activity remunerated from withinthe place visited”. The persons referred to in the definition of tourism are termed “visitors”. Theymay travel to destinations within the geographic boundaries of their own country or they maytravel internationally. Their activity is measured in terms of their expenditure on goods and ser-vices. In the context of international trade in services it is the expenditures of “international visi-tors” that is relevant.
“Travellers” for purposes of the Balance of Payments and International Trade in Services are“individuals staying for less than a year in an economy of which they are not residents for any pur-pose other than (i) being stationed on a military base or being an employee (including diplomatsand other embassy personnel) of an agency of his or her government (ii) being an accompanyingdependent of an individual mentioned under (i) or (ii) undertaking a productive activity directly foran entity that is a resident of that economy”. However, for purposes of the Balance pf Payments,currently, the one-year rule does not apply to students and medical patients, who are regarded as re-maining residents of their economies of origin, even if the length of stay in another economy is formore than one year. Thus “international visitors” are a sub-set of “travellers”.
The concept of “international visitors” covers the expenditures of tourists and same day visi-tors. It does not include expenditures of the following categories of persons included under travel-lers in the Balance of Payments. Commuters and seasonal workers, or students, persons travellingfor medical treatment and ship’s crews, travelling for periods of more than a year.
For the purposes of measuring the expenditure of “visitors”, the TSA also includes consumptionactivity in anticipation of trips (such as purchases of luggage or travel insurance) and after theyhave returned home (such as having film developed for pictures taken during the trip). However, asthese expenditures are undertaken in the country of residence, they do not enter into the measure-ment of international trade.
4. Tourism and the standard components of the Balance of Payments
Travel
“Travel” is one of the standard components of the Balance of Payments. The overall definition andcontent of Travel in the Manual on Statistics of International Trade in Services, is the same as in theBalance of Payments. The consumer (traveller) moves to the location of the provider (residents of
40 IFC Bulletin 17 — February 2004
BERLIN 2003
the economy) for the goods and services desired by the traveller. In the context of the GATS this isdescribed as the second mode of delivery of services namely “consumption abroad”.
Travel is different from the other services components of international trade in services be-cause it is measured in terms of and includes the expenditure on both goods and services acquiredby “travellers”, from the economy to which they have travelled.
Estimates made for the Travel component of the Balance of payments is relevant for the mea-surement of international “visitor” expenditure for Tourism analysis.
However, as explained above, the Balance of Payments estimate has to be adjusted by the re-moval of the expenditures of commuters and seasonal workers, and the expenditures of studentsand persons travelling for medical treatment for more than a year and ship’s crews.
In order for the concept of international “visitors” and “travellers” to coincide, the concept oftravellers in the Balance of Payments (and international trade in services) would have to drop theexemption of the one year rule for students, persons travelling for medical treatment and ship’screws and exclude commuters and seasonal workers.
Passenger transportation
Travel is not the only component of the Balance of Payments relevant for Tourism analysis. The in-ternational carriage of travellers, namely “Passenger transportation” is also of concern for the sta-tistical measurement of international visitor expenditure for Tourism analysis. Even though pas-senger transportation services provided to non-residents by resident carriers within the residenteconomies and cruise fares are included under Travel, excluded from Travel is the internationalcarriage of travellers. This is covered under “passenger services” under “Transportation”, which isa separate component the BOP classification of services transactions in BPM5 and in the EBOPSclassification.
The standard component of the Balance of Payments “Transportation” covers all transporta-tion (sea, air and other-including land, internal waterway, space and pipeline) services that are per-formed by residents of one economy for those of another. Of relevance to the analysis of Tourism ispart of “Transportation” namely “Passenger Transportation” that is the carriage of passengers,rentals (charters) of carriers with crew and related supporting and auxiliary services used by visi-tors.
The convention of the Balance of Payments, also adopted for Tourism analysis is that passen-gers travelling abroad on a domestic transportation carriers e.g. airlines are treated as purchasing adomestic service whereas passengers travelling abroad on a foreign transportation carrier e.g., air-lines are treated as purchasing a service from the country in which the foreign airline is registered.
Under the GATS concept of modes of supply, estimates of Travel are the main component ofmode 2. However, the supply of international transportation services by domestic carriers to for-eign visitors, is the direct supply of a service by mode 1.
Purpose of visit or travel
It is useful and necessary to distinguish travel in terms of the purpose of travel, and to make a dis-tinction between those whose purpose of travel is business or personal, because for the productionaccounts of the System of National Accounts, business travel is an intermediate expense.
The Balance of Payments recommends a breakdown of travel into business travel and personaltravel. MSITS recommends a further breakdown of business travel into expenditure by seasonaland border workers and all other business travel. The former includes the acquisition of goods andservices for personal use by seasonal, border and other workers who are not resident in the econ-omy in which they are employed and whose employer is resident in that economy. The latter in-cludes the goods and services acquired for personal use by those travellers, whose main purpose isbusiness, and covers goods and services acquired for their own use (including those for which theyare reimbursed by employers) but not the sales or purchases that they may conclude on behalf ofthe enterprises that they represent.
Personal travel covers goods and services acquired by travellers going abroad for purposesother than business such as holidays, participation in recreational and cultural activities, visits withfriends and relations, pilgrimage and education and health related purposes. The MSITS recom-mends a breakdown of personal travel into three sub-components, health-related expenditure, edu-cation-related expenditure and all other personal travel expenditure.
The further breakdowns are useful to be able to arrive at the expenditures required for the anal-ysis of “Tourism”.
EXTENDED PAPERS
IFC Bulletin 17 — February 2004 41
Expenditures on services, of travellers, travelling abroad for business purposes, for less than ayear, that are part of Travel and Transportation, are part of intermediate expenses in the productionaccounts of the System of National Accounts. They are also part of imports. They can be used torepresent part of mode 2 and mode 1 of the GATS, respectively.
Incidentally, the value of services rendered by persons travelling for business purposes are ex-ported services and would be included elsewhere in the Balance of Payments, they are not part ofTravel or Transportation. They would be classified as exports of services in the relevant standardcomponent including Other business services in the Classification of International Transactions inServices. Payments for these services are part of mode 1 and mode 4 for the GATS. Mode 4 covers“the movement of natural persons” which includes the value of the service rendered by persons,crossing the border to another economy to deliver a service. For the GATS, in principle, exports ofbusiness services would have to be split between mode 1 and mode 4, depending upon the amountof time spent delivering the professional service from within the country and abroad.
Goods and services purchased
In order to analyse the economic impact of travel on the economy it is of interest to measure travelin terms of the goods and services purchased by travellers. The BOP states “All goods and servicesacquired by travellers … from the economies in which they are travelling and for their own use arerecorded under travel, These goods and services may be paid for by the traveller, paid for on his orher behalf, or provided to him or her without a quid pro quo (e.g. free room and board received byofficial visitors or by friends and relatives)… The most common goods and services entered intravel are lodging, food and beverages, entertainment, and transportation within the economy vis-ited – all of which are consumed in the providing economy – and gifts, souvenirs and articles (irre-spective of value) purchased for travellers own use and taken out of the economy visited.” MSITSrecommends an alternative disaggregation for travel services that separates expenditure on goods,expenditure on accommodation and food and beverage services and all other travel expenditure.This goes some way towards the greater disaggregation recommended for purposes of Tourismanalysis. For Tourism analysis the aggregate must cover all the goods and services purchased byinternational visitors but detail down to the groups of Tourism characteristic products is recom-mended in the TSA.
As both the aggregate for Travel and that for international visitor expenditure includes expen-diture on both goods and services, for use in the statistical representation of the modes of supply forthe GATS, expenditure on goods has to be removed from these aggregates.
Foreign affiliate trade statistics (FATS)
MSITS describes the fact that in order to collect data to measure mode 3, commercial presence,countries will need to start collecting and compiling Foreign Affiliate Trade Statistics. Collectionof FATS is just beginning. Once countries begin to collect such data, analysis of the extent to whichTourism services are delivered through commercial presence, will depend upon the extent towhich Tourism characteristic industries as listed in the TSA are reflected in the data collection. Ho-tels and Restaurants are a recommended industry grouping for the collection of FATS.
Presence of natural persons
This is a concept of the GATS; it is the fourth mode of supply. For the GATS it is measured both interms of the number of persons moving across the border temporarily to deliver a service and thevalue of services delivered. The number of international visitors whose purpose of travel is to de-liver professional services in their own capacity or as employees of businesses delivering services,will be useful for a part of the measure of mode 4, if additional information about them were col-lected such as the industry to which they belonged, according to industry groups of the Interna-tional Standard Industrial Classification, as well information about the occupational group towhich they belonged.
42 IFC Bulletin 17 — February 2004
BERLIN 2003

5. Conclusion
Data compiled for the Balance of Payments and EBOPS, are necessary and useful in the measure-ment and analysis of international Tourism. Greater convergence between the concepts of the BOPand EBOPS and the Tourism Satellite Account would be mutually beneficial, in that similarsources and methods of data collection and compilation could be adopted to serve the needs of allthree, which would contribute to enhancing the quality of data in all three frameworks and go to-wards meeting some of the needs for measurement of the modes of supply of the GATS.
Acknowledgement
The contribution of Shaila Nijhowne, Consultant, in the preparation of this paper is gratefully ac-knowledged.
References
Balance of Payments Manual, Fifth Edition, 1993, International Monetary Fund.
Manual on Statistics of International Trade in Services, Statistical Papers Series M No 86,ST/ESA/STAT/SER.M/86 2002 Department of Economic and Social Affairs, Statistics Division, UnitedNations et al.
System of National Accounts 1993, Department of Economic and Social Information and Policy Analysis,Statistical Division, United Nations et al.
Tourism Satellite Account: Recommended Methodological Framework, 2001, Statistics Division, UnitedNations et al.
Antonio MassieuChief, Statistics and Economic Measurement of TourismWorld Tourism Organization (WTO)Capitán Haya, 4228020 Madrid, [email protected]
EXTENDED PAPERS
IFC Bulletin 17 — February 2004 43
TRADE IN SERVICES
FATS statistics:Multinational enterprises,
the globalization process and BoP data
Lessons from the French experience1
Frédéric Boccara and François Renard (Banque de France)
Introduction
Foreign Affiliates Trade Statistics (FATS) are developing in order to measure the role of multina-tional enterprises (MNEs) in the globalization of the world economy, that is the increased eco-nomic interactions and interdependencies among nations.
Foreign Direct Investments (FDI) represent the financial flows and stocks at the origin of the set-ting-up and of the development of MNEs. But it is necessary to go beyond this purely financialfacet and to articulate it with the whole activity and structure of MNEs2.
FATS provide a general and internationally agreed framework for achieving some of theseneeds. They aim at providing a measure of the activity and of the structure of the foreign-controlledaffiliates of the parent companies in the compiling country (inward), and of the controlled affiliatesabroad (outward).
The focus of FATS statistics has been primarily put on trade in services, as the transactions relatingto these “products” take on different channels or modes of supply; the sales through affiliates takean important role among these channels, as for a large part of services are international transac-tions, there is a need of a commercial presence to meet the needs of the consumer. In fact however,the concept of FATS applies to the whole of sectors, including manufacturing, and corresponds toan organization of the production and of the markets which extends beyond the borders of nationaleconomies.
This paper intends to illustrate the importance of FATS for the understanding of some new eco-nomic trends, taking the example of the work which is presently done in France. It aims at present-ing the measure and the practical use which is done with a first set of FATS indicators, and the chal-lenges which are still pending to get an accurate view of the role of MNEs in the globalization.
The paper is organized along four parts:• The first part is devoted to the definition of FATS and to the institutional arrangements which are
taken for their compilation.• The second one is devoted to the way FATS are compiled in practice. French experience is taken
as an example.• The next part is devoted to the use of FATS. The intent is to show that the topics covered by this
concept are very wide, as through FATS and among other matters (a) one can analyze the differ-ent features of the globalization of the economies, (b) one can analyze the role of foreign con-
44 IFC Bulletin 17 — February 2004
BERLIN 2003
1 Paper presented at the 54th ISI session (Berlin 2003), Contributed Papers Meeting 91, “Trade in Services – A Chal-lenge for Statisticians”. Thanks to C. Griffoul and M. Coutant who worked on the database, and to Cl. Peyroux whogave an expert advice on a first draft.
2 These needs and this double aspect have been raised for many years, see among others Hymer (1960), Kindleberger(1970), Caves (1971), Dunning (1990), Lipsey (2001), and CEIES (2003).
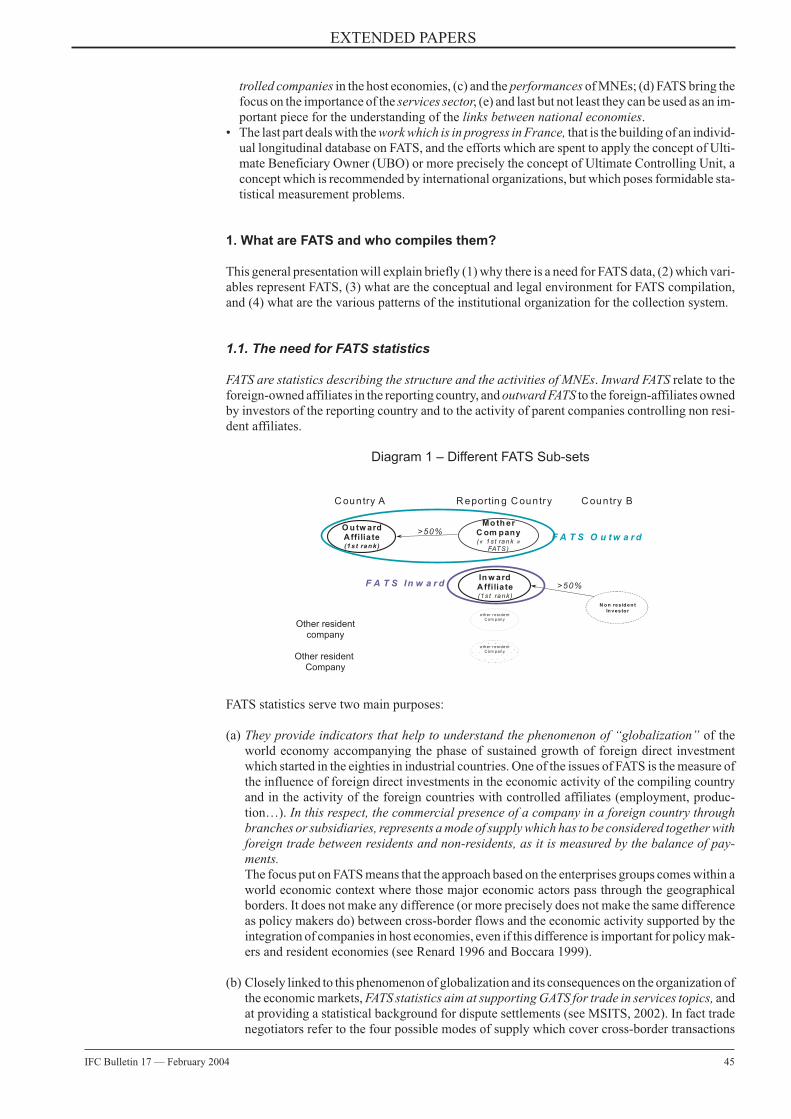
trolled companies in the host economies, (c) and the performances of MNEs; (d) FATS bring thefocus on the importance of the services sector, (e) and last but not least they can be used as an im-portant piece for the understanding of the links between national economies.
• The last part deals with the work which is in progress in France, that is the building of an individ-ual longitudinal database on FATS, and the efforts which are spent to apply the concept of Ulti-mate Beneficiary Owner (UBO) or more precisely the concept of Ultimate Controlling Unit, aconcept which is recommended by international organizations, but which poses formidable sta-tistical measurement problems.
1. What are FATS and who compiles them?
This general presentation will explain briefly (1) why there is a need for FATS data, (2) which vari-ables represent FATS, (3) what are the conceptual and legal environment for FATS compilation,and (4) what are the various patterns of the institutional organization for the collection system.
1.1. The need for FATS statistics
FATS are statistics describing the structure and the activities of MNEs. Inward FATS relate to theforeign-owned affiliates in the reporting country, and outward FATS to the foreign-affiliates ownedby investors of the reporting country and to the activity of parent companies controlling non resi-dent affiliates.
Diagram 1 – Different FATS Sub-sets
FATS statistics serve two main purposes:
(a) They provide indicators that help to understand the phenomenon of “globalization” of theworld economy accompanying the phase of sustained growth of foreign direct investmentwhich started in the eighties in industrial countries. One of the issues of FATS is the measure ofthe influence of foreign direct investments in the economic activity of the compiling countryand in the activity of the foreign countries with controlled affiliates (employment, produc-tion…). In this respect, the commercial presence of a company in a foreign country throughbranches or subsidiaries, represents a mode of supply which has to be considered together withforeign trade between residents and non-residents, as it is measured by the balance of pay-ments.The focus put on FATS means that the approach based on the enterprises groups comes within aworld economic context where those major economic actors pass through the geographicalborders. It does not make any difference (or more precisely does not make the same differenceas policy makers do) between cross-border flows and the economic activity supported by theintegration of companies in host economies, even if this difference is important for policy mak-ers and resident economies (see Renard 1996 and Boccara 1999).
(b) Closely linked to this phenomenon of globalization and its consequences on the organization ofthe economic markets, FATS statistics aim at supporting GATS for trade in services topics, andat providing a statistical background for dispute settlements (see MSITS, 2002). In fact tradenegotiators refer to the four possible modes of supply which cover cross-border transactions
EXTENDED PAPERS
IFC Bulletin 17 — February 2004 45
N o n res id en t
In vesto r
O u tw ardAffilia te(1s t rank )
Mo th erC om pany(« 1s t rank »
FATS )
In w ardAffilia te(1s t rank )
C ountry A R eportin g C ountry C ountry B
other res identCom pany
other res identCom pany
>50%
>50%F A T S O u t w a r d
F A T S In w a r d
Other residentcompany
Other residentCompany
(exports and imports), but also consumption of services abroad, the presence of natural personsin the country where the services have to be supplied, and the commercial presence through asubsidiary (sales in the invested country or in a third country). This last channel is particularlyimportant when considering trade in services which needs in most of the cases a close relation-ship between the producer and the consumer.
1.2. The content of FATS statistics
The domain which is covered by FATS statistics is at the crossroad of business statistics (domesticeconomic activity data), balance of payments (data on FDI flows, exports and imports of goods andof services) and International Investment Position statistics (IIP or FDI stocks).
(a) FATS statistics apply to a subset of the FDI companies, as these data cover only those affiliatesthat are directly controlled (majority-owned) by a foreign direct investor; as an example an in-ward affiliate is a resident enterprise of which more than 50% of the ordinary shares is directly1
held by a foreign investor.
(b) The choice of variables representing the economic activity of multinationals is primarily basedon the needs of GATS regarding transactions on services but also on the need to analyze theprocess of globalization, whatever the economic sector under consideration.
The basic variables are the number of companies, sales or turnover, value added, employment inthe affiliates, exports and imports of goods and services.• The number of companies is asked for at least two objectives: a comparison with the total num-
ber of firms making transactions in the economy, in order to measure the degree of penetration ofthe economies by foreign entities; a calculation of various ratios (such as the number of employ-ees per company), which aims at comparing related performances with domestically ownedcompanies.
• Sales or turnover measure the activity of affiliates within the host country and with third coun-tries (exports). The local sales represent the GATS mode 3.
• The value added provides the contribution of foreign affiliates to host country gross domesticproduct (GDP).
• Total exports and imports of goods and services provide information on the linkages with BOPdata. They need a geographical breakdown (with a focus to be put on the country of the parentcompanies), and a distinction which will have to be done between trade with related and tradewith unrelated companies, as the former transactions have specific characteristics (for instancethe use of transfer prices to value the transactions).
• Employment is used to determine the share of foreign-controlled companies in host country em-ployment, and helps to analyze if multinational affiliates employment complements or substi-tutes employment by domestic firms; it is used to determine companies performances per head.
• The industry classification of the affiliates2.
Other variables of interest are compensation of employees, gross fixed capital formation, gross op-erating surplus, and research and development expenditures (as the latter are considered as a vec-tor for the creation of new products and a vector of technological transfers).
Rules to be used for attribution of FATS data:• Since FATS statistics cover affiliates that are fully controlled, whatever is the holding rate
(above 50%), 100% of the amount of the variable has to be allocated to the affiliate.• The report of FATS variables has to be classified by activity. All activities are covered, but the
focus is put on services.• The geographical allocation of the owner of the inward affiliates has in principle to be done on
the country of the ultimate beneficiary owner (UBO); the country of the first foreign parent isused in practice in most of the cases. The host country of affiliates is used for the attribution ofoutward FATS.
46 IFC Bulletin 17 — February 2004
BERLIN 2003
1 Progress is being made on the account of indirect control (see below and for a detailed presentation see OECD(2003b), pp 22-35.
2 And not the one of the whole enterprise group, as it is not yet clearly defined
1.3. The legal environment
FATS data are compiled within a conceptual and legal framework which has been designed by in-ternational organizations as the principal aim of comparing countries fosters the need for interna-tional harmonization of concepts and definitions.
(a) The Manual on Statistics of International Trade in Services (MSITS) (and the Compilation Guidewhich is in preparation) describes the rationale of FATS, gives the standardized definitions of theconceptual issues and some guidelines for the collection and the compilation of the data.
(b) A joint OCDE-Eurostat questionnaire aims at collecting on a yearly basis from MS data onFATS with a double breakdown: (1) turnover, value added, total exports and imports of affili-ates broken down by economic sector1 and (2) turnover and employment of main sectors of af-filiates broken down by geographical area2, together with (3) a questionnaire on the activity ofall firms in the reporting country, in order to calculate EU aggregates.
(c) An output oriented regulation, which is discussed with representatives of EU National CentralBanks (NCBs) and National Statistical Institutes (NSIs), on the way to be implemented, andwhose purpose is “to establish a common framework for the systematic production of Commu-nity statistics on FATS”, will impose a common level playing field for all EU MS, with a com-mon conceptual framework and a minimum common request.
1.4. Institutional organization
Depending on the country, the compilation of FATS data is done either by NCB alone, by NSI alone,by NCB and NSI together, or by a specialized institution.
In order to take profit of the whole statistical system, and taking account of the heterogeneous na-ture of FATS statistics, it has been decided in France to ensure a cooperation between different in-stitutions:
(a) There is a close cooperation between Banque de France and INSEE for inward FATS. TheFrench NSI brings its knowledge of the French multinationals networks and the indicators onthe activity of the whole of French companies through business statistics framework; the Cen-tral Bank brings its knowledge of the FDI stocks statistics and of the related FATS variables.
(b) The Banque de France is in charge of the outward FATS, which are a subset of the survey onoutward FDI stock statistics. A cooperation has started with the Department of Foreign Eco-nomic Relations (DREE) of the Ministry of Finances, as the latter organization collects inter-esting information on the activities of foreign subsidiaries of French companies through its em-bassies network.
2. The compilation of FATS data
The MSITS gives some guidelines on the compilation of FATS data, which will be reminded be-fore a presentation of the French collection system.
2.1. General guidelines
FATS are basically statistics which have a close link with FDI, of which they represent the exten-sion. The process of compilation needs (a) the identification of relevant companies and (b) the ex-traction of FATS variables.
(a) The identification of majority-owned companies has to be done from the use of an extendedbusiness register including the characteristics of individual companies, tagging those of them
EXTENDED PAPERS
IFC Bulletin 17 — February 2004 47
1 The economic sector of the affiliate is deemed to be the one of the mother company when considering the outward FATS;it is the activity sector of the affiliate itself when considering the inward FATS (for example: wholesale trade, even if theaffiliate belongs to a car building services enterprise group).
2 The geographical allocation corresponds to the one used for FDI: FATS are attributed to the immediate investing coun-try (inward) or the immediate host country (outward).
which are foreign direct investors (outward) or invested (inward). The organization of this da-tabase depends on the way the compilation of direct investments is done (FDI transactionsand/or position). Whatever the organization, this database has to include the ownership crite-rion from which it is possible to determine if a company is foreign controlled, and especially tospot majority-owned companies.
(b) The compilation of FATS data is generally different when considering inward and outwarddata.• Inward data are in most of the cases a subset of business statistics on resident enterprises, ofwhich basic data are in the hands of NSI and / or in the hands of Central Banks.• Turning to outward data, the solution which is generally used is the recourse to a survey, get-ting the data from the mother company located in the compiling country, as there are legal ob-stacles to get the information directly from foreign affiliates of resident companies. It is obvi-ous that this approach could encounter difficulties of implementation.
2.2. The French case
Statistics on FATS in France have been provided and produced by the Banque de France BOP Di-rectorate since 1995 as a reference year, following the requests of the OECD-Eurostat commonquestionnaire. The compilation relies mainly on the combination of various already existingsources, matched by the use of the unique company’s identification number, taken from the Gen-eral Business Register which is under the responsibility of the French NSI (INSEE). This combina-tion of sources needs an important effort of comparison, rectification and harmonization, to be puton the data which are provided by companies.
(a) The selection of majority-owned resident or foreign companies, which correspond to the FATSuniverse, is an extract of the FDI stocks surveys database carried out by the BOP Directorate ona yearly basis. This database covers the whole economic sectors, but it is focused on the directcontrol. Inward and outward subsets of companies include at least 9000 units (for each of themand depending of the reference year) with at least 2000 French mother companies.Another database (called Lifi, that is a database on the financial links between companies),which is under the responsibility of the French NSI and which covers the sole resident compa-nies, takes account of direct and indirect links of these companies with other firms. This data-base will be used to tackle FATS statistics by taking account of the indirect ownership and theUltimate Beneficiary Owner (UBO) (or, better, the controlling unit) in an inward perspective.It can be supplemented by the information taken from the Banque de France companies data-base called FIBEN, which contains data on the financial links between companies.
(b) The sources which are used to compile inward FATS are (1) a database covering the accounts of alarge number of companies, which is under the responsibility of the Banque de France BusinessDirectorate (value added, employment, sales), (2) specific databases for banks and insurance(sales and employment), (3) BOP flows (exports and imports of goods and services), (4) businesssector aggregates relating to the total economy to be compared to FATS variables (NSI).
(c ) Outward FATS are compiled through an adding question on the turnover of the affiliates to theexisting survey on outward FDI stocks. The scarcity of data relating to outward FATS is ex-plained by the fact that affiliates of French multinational companies are indirectly surveyedthrough the mother company located in France.
(d) France has chosen to adopt a step by step approach to enrich the basic data which are presentlycompiled.• A first piece of work which is on the go is the integration of indirect control for inward FATS,matching the FDI and Lifi databases (see developments below).• Another work which is in progress is the building of a database on FATS, putting together thecharacteristics of individual companies with their identification number and the associatedFATS variables. This database will permit to make an in depth analysis of FATS over time, tak-ing account of the changes in ownership intervening in the population of companies whichcould hamper the interpretation of the indicators.• A third piece of work, which will be done as soon as possible, is the enlargement of the set ofvariables which are reported (employment for outward FATS, exports and imports between re-lated companies, profits, investment, assets…).
48 IFC Bulletin 17 — February 2004
BERLIN 2003
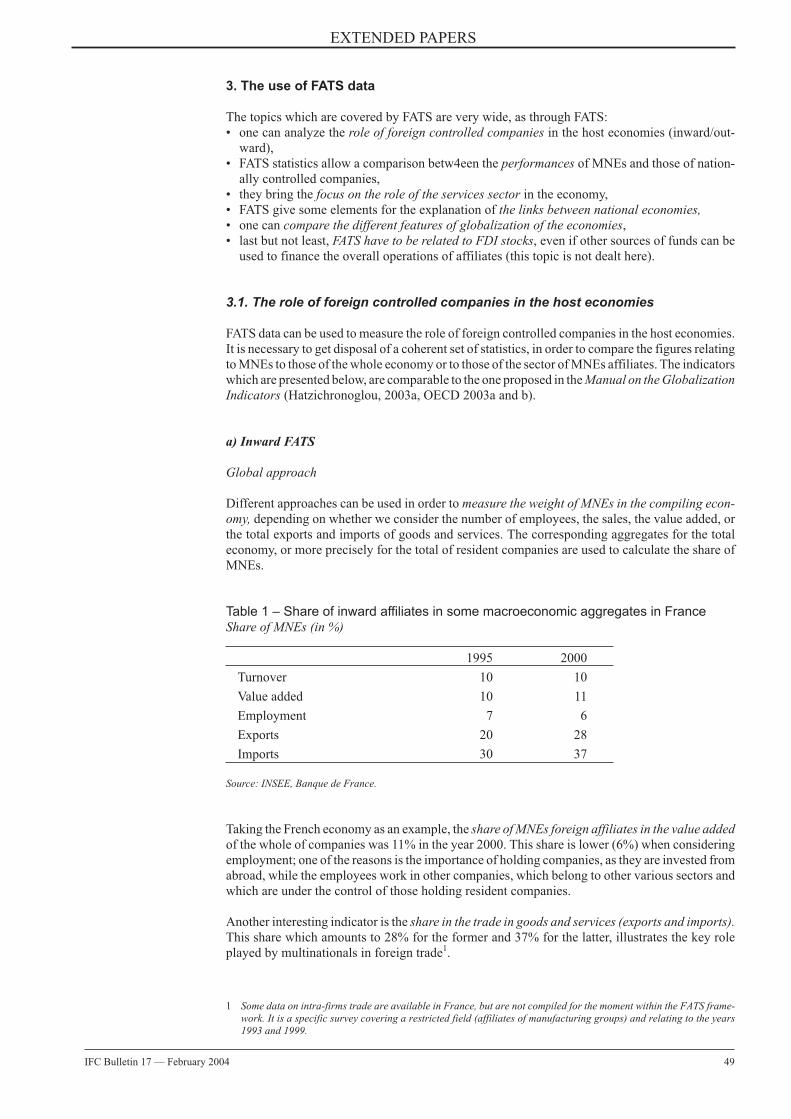
3. The use of FATS data
The topics which are covered by FATS are very wide, as through FATS:• one can analyze the role of foreign controlled companies in the host economies (inward/out-
ward),• FATS statistics allow a comparison betw4een the performances of MNEs and those of nation-
ally controlled companies,• they bring the focus on the role of the services sector in the economy,• FATS give some elements for the explanation of the links between national economies,• one can compare the different features of globalization of the economies,• last but not least, FATS have to be related to FDI stocks, even if other sources of funds can be
used to finance the overall operations of affiliates (this topic is not dealt here).
3.1. The role of foreign controlled companies in the host economies
FATS data can be used to measure the role of foreign controlled companies in the host economies.It is necessary to get disposal of a coherent set of statistics, in order to compare the figures relatingto MNEs to those of the whole economy or to those of the sector of MNEs affiliates. The indicatorswhich are presented below, are comparable to the one proposed in the Manual on the GlobalizationIndicators (Hatzichronoglou, 2003a, OECD 2003a and b).
a) Inward FATS
Global approach
Different approaches can be used in order to measure the weight of MNEs in the compiling econ-omy, depending on whether we consider the number of employees, the sales, the value added, orthe total exports and imports of goods and services. The corresponding aggregates for the totaleconomy, or more precisely for the total of resident companies are used to calculate the share ofMNEs.
Table 1 – Share of inward affiliates in some macroeconomic aggregates in FranceShare of MNEs (in %)
1995 2000
Turnover
Value added
Employment
Exports
Imports
10
10
7
20
30
10
11
6
28
37
Source: INSEE, Banque de France.
Taking the French economy as an example, the share of MNEs foreign affiliates in the value addedof the whole of companies was 11% in the year 2000. This share is lower (6%) when consideringemployment; one of the reasons is the importance of holding companies, as they are invested fromabroad, while the employees work in other companies, which belong to other various sectors andwhich are under the control of those holding resident companies.
Another interesting indicator is the share in the trade in goods and services (exports and imports).This share which amounts to 28% for the former and 37% for the latter, illustrates the key roleplayed by multinationals in foreign trade1.
EXTENDED PAPERS
IFC Bulletin 17 — February 2004 49
1 Some data on intra-firms trade are available in France, but are not compiled for the moment within the FATS frame-work. It is a specific survey covering a restricted field (affiliates of manufacturing groups) and relating to the years1993 and 1999.
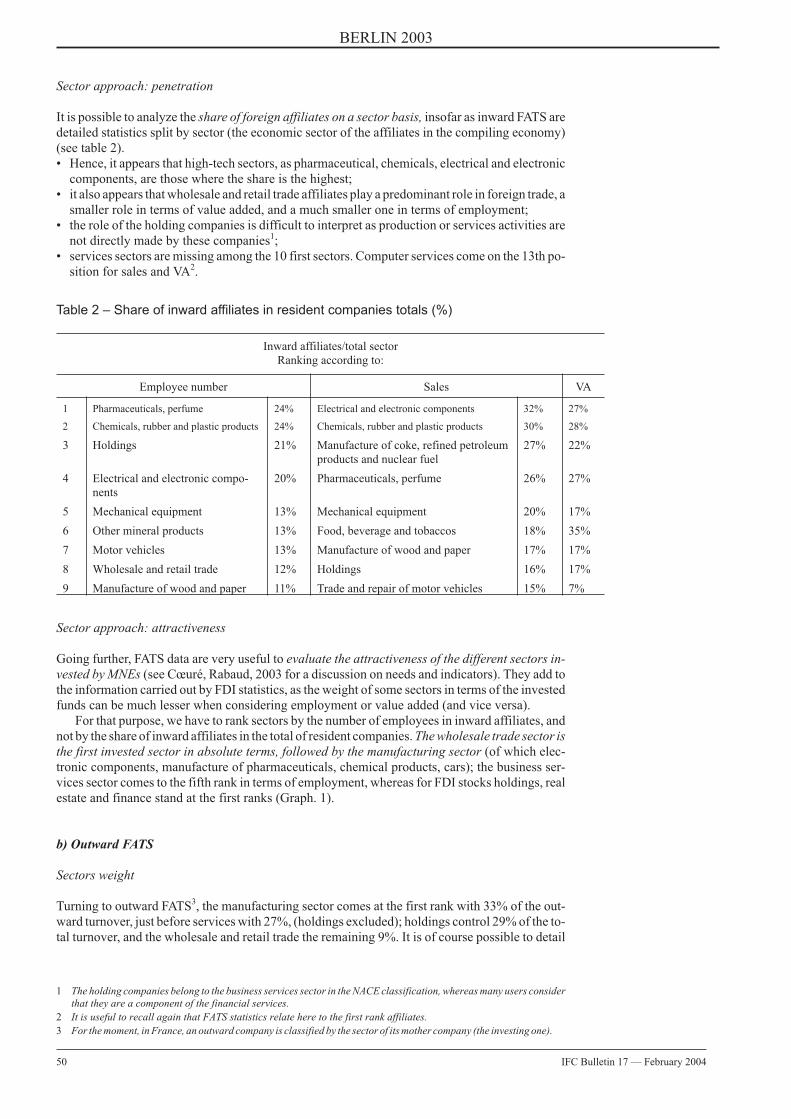
Sector approach: penetration
It is possible to analyze the share of foreign affiliates on a sector basis, insofar as inward FATS aredetailed statistics split by sector (the economic sector of the affiliates in the compiling economy)(see table 2).• Hence, it appears that high-tech sectors, as pharmaceutical, chemicals, electrical and electronic
components, are those where the share is the highest;• it also appears that wholesale and retail trade affiliates play a predominant role in foreign trade, a
smaller role in terms of value added, and a much smaller one in terms of employment;• the role of the holding companies is difficult to interpret as production or services activities are
not directly made by these companies1;• services sectors are missing among the 10 first sectors. Computer services come on the 13th po-
sition for sales and VA2.
Sector approach: attractiveness
Going further, FATS data are very useful to evaluate the attractiveness of the different sectors in-vested by MNEs (see Cœuré, Rabaud, 2003 for a discussion on needs and indicators). They add tothe information carried out by FDI statistics, as the weight of some sectors in terms of the investedfunds can be much lesser when considering employment or value added (and vice versa).
For that purpose, we have to rank sectors by the number of employees in inward affiliates, andnot by the share of inward affiliates in the total of resident companies. The wholesale trade sector isthe first invested sector in absolute terms, followed by the manufacturing sector (of which elec-tronic components, manufacture of pharmaceuticals, chemical products, cars); the business ser-vices sector comes to the fifth rank in terms of employment, whereas for FDI stocks holdings, realestate and finance stand at the first ranks (Graph. 1).
b) Outward FATS
Sectors weight
Turning to outward FATS3, the manufacturing sector comes at the first rank with 33% of the out-ward turnover, just before services with 27%, (holdings excluded); holdings control 29% of the to-tal turnover, and the wholesale and retail trade the remaining 9%. It is of course possible to detail
50 IFC Bulletin 17 — February 2004
BERLIN 2003
Table 2 – Share of inward affiliates in resident companies totals (%)
Inward affiliates/total sectorRanking according to:
Employee number Sales VA
1 Pharmaceuticals, perfume 24% Electrical and electronic components 32% 27%
2 Chemicals, rubber and plastic products 24% Chemicals, rubber and plastic products 30% 28%
3 Holdings 21% Manufacture of coke, refined petroleumproducts and nuclear fuel
27% 22%
4 Electrical and electronic compo-nents
20% Pharmaceuticals, perfume 26% 27%
5 Mechanical equipment 13% Mechanical equipment 20% 17%
6 Other mineral products 13% Food, beverage and tobaccos 18% 35%
7 Motor vehicles 13% Manufacture of wood and paper 17% 17%
8 Wholesale and retail trade 12% Holdings 16% 17%
9 Manufacture of wood and paper 11% Trade and repair of motor vehicles 15% 7%
1 The holding companies belong to the business services sector in the NACE classification, whereas many users considerthat they are a component of the financial services.
2 It is useful to recall again that FATS statistics relate here to the first rank affiliates.3 For the moment, in France, an outward company is classified by the sector of its mother company (the investing one).
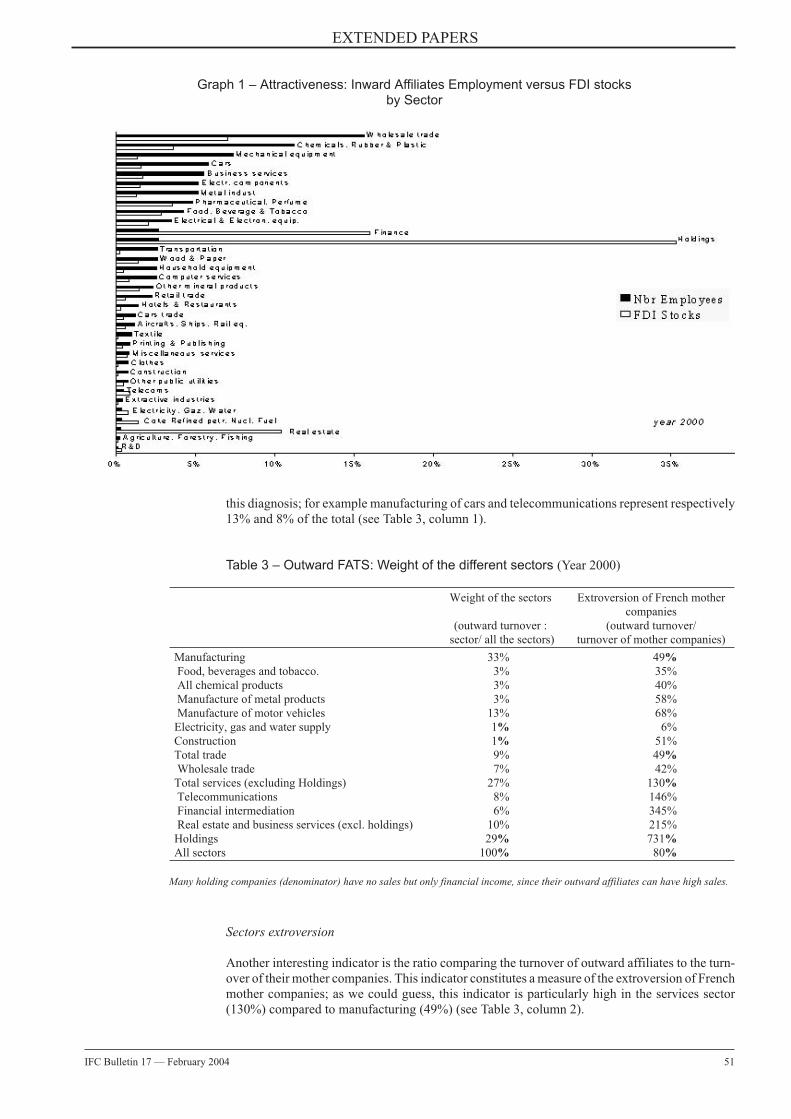
this diagnosis; for example manufacturing of cars and telecommunications represent respectively13% and 8% of the total (see Table 3, column 1).
Table 3 – Outward FATS: Weight of the different sectors (Year 2000)
Sectors extroversion
Another interesting indicator is the ratio comparing the turnover of outward affiliates to the turn-over of their mother companies. This indicator constitutes a measure of the extroversion of Frenchmother companies; as we could guess, this indicator is particularly high in the services sector(130%) compared to manufacturing (49%) (see Table 3, column 2).
EXTENDED PAPERS
IFC Bulletin 17 — February 2004 51
Weight of the sectors
(outward turnover :sector/ all the sectors)
Extroversion of French mothercompanies
(outward turnover/turnover of mother companies)
Manufacturing 33% 49%
Food, beverages and tobacco. 3% 35%All chemical products 3% 40%Manufacture of metal products 3% 58%Manufacture of motor vehicles 13% 68%Electricity, gas and water supply 1% 6%Construction 1% 51%Total trade 9% 49%
Wholesale trade 7% 42%Total services (excluding Holdings) 27% 130%
Telecommunications 8% 146%Financial intermediation 6% 345%Real estate and business services (excl. holdings) 10% 215%Holdings 29% 731%
All sectors 100% 80%
Many holding companies (denominator) have no sales but only financial income, since their outward affiliates can have high sales.
Graph 1 – Attractiveness: Inward Affiliates Employment versus FDI stocksby Sector
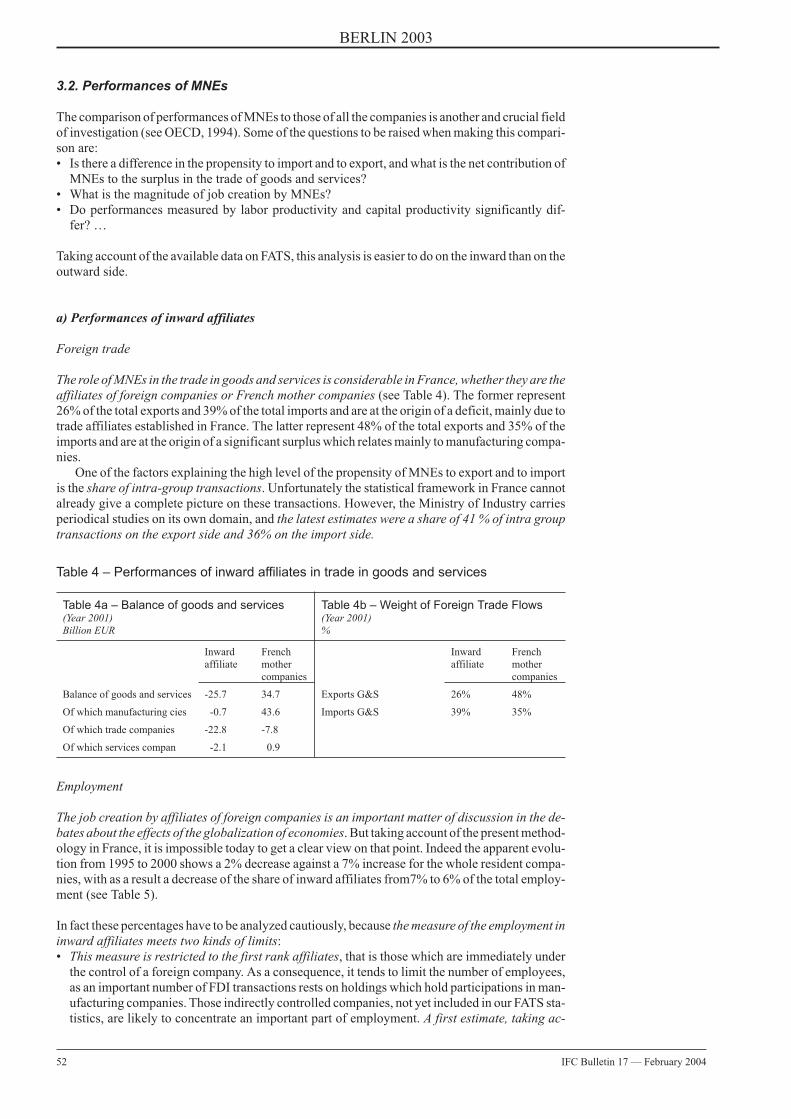
3.2. Performances of MNEs
The comparison of performances of MNEs to those of all the companies is another and crucial fieldof investigation (see OECD, 1994). Some of the questions to be raised when making this compari-son are:• Is there a difference in the propensity to import and to export, and what is the net contribution of
MNEs to the surplus in the trade of goods and services?• What is the magnitude of job creation by MNEs?• Do performances measured by labor productivity and capital productivity significantly dif-
fer? …
Taking account of the available data on FATS, this analysis is easier to do on the inward than on theoutward side.
a) Performances of inward affiliates
Foreign trade
The role of MNEs in the trade in goods and services is considerable in France, whether they are theaffiliates of foreign companies or French mother companies (see Table 4). The former represent26% of the total exports and 39% of the total imports and are at the origin of a deficit, mainly due totrade affiliates established in France. The latter represent 48% of the total exports and 35% of theimports and are at the origin of a significant surplus which relates mainly to manufacturing compa-nies.
One of the factors explaining the high level of the propensity of MNEs to export and to importis the share of intra-group transactions. Unfortunately the statistical framework in France cannotalready give a complete picture on these transactions. However, the Ministry of Industry carriesperiodical studies on its own domain, and the latest estimates were a share of 41 % of intra grouptransactions on the export side and 36% on the import side.
Employment
The job creation by affiliates of foreign companies is an important matter of discussion in the de-bates about the effects of the globalization of economies. But taking account of the present method-ology in France, it is impossible today to get a clear view on that point. Indeed the apparent evolu-tion from 1995 to 2000 shows a 2% decrease against a 7% increase for the whole resident compa-nies, with as a result a decrease of the share of inward affiliates from7% to 6% of the total employ-ment (see Table 5).
In fact these percentages have to be analyzed cautiously, because the measure of the employment ininward affiliates meets two kinds of limits:• This measure is restricted to the first rank affiliates, that is those which are immediately under
the control of a foreign company. As a consequence, it tends to limit the number of employees,as an important number of FDI transactions rests on holdings which hold participations in man-ufacturing companies. Those indirectly controlled companies, not yet included in our FATS sta-tistics, are likely to concentrate an important part of employment. A first estimate, taking ac-
52 IFC Bulletin 17 — February 2004
BERLIN 2003
Table 4 – Performances of inward affiliates in trade in goods and services
Table 4a – Balance of goods and services(Year 2001)Billion EUR
Table 4b – Weight of Foreign Trade Flows(Year 2001)%
Inwardaffiliate
Frenchmothercompanies
Inwardaffiliate
Frenchmothercompanies
Balance of goods and services -25.7 34.7 Exports G&S 26% 48%
Of which manufacturing cies -0.7 43.6 Imports G&S 39% 35%
Of which trade companies -22.8 -7.8
Of which services compan -2.1 0.9
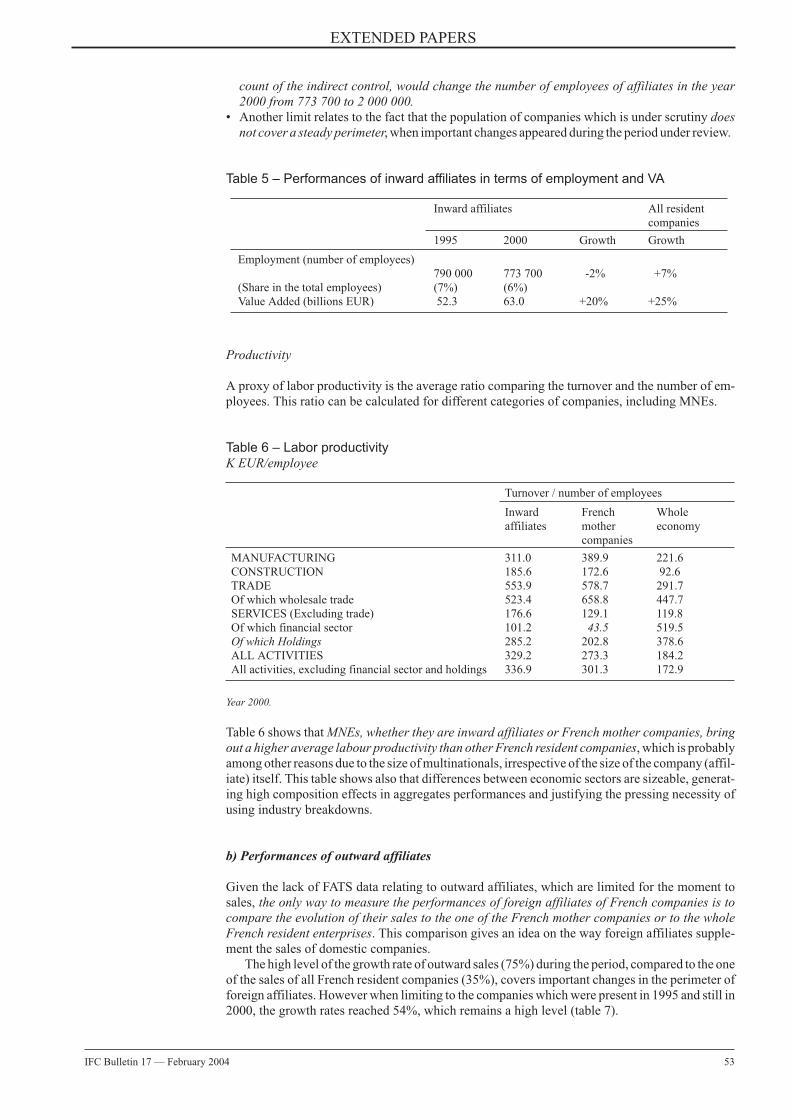
count of the indirect control, would change the number of employees of affiliates in the year2000 from 773 700 to 2 000 000.
• Another limit relates to the fact that the population of companies which is under scrutiny doesnot cover a steady perimeter, when important changes appeared during the period under review.
Table 5 – Performances of inward affiliates in terms of employment and VA
Inward affiliates All residentcompanies
1995 2000 Growth Growth
Employment (number of employees)790 000 773 700 -2% +7%
(Share in the total employees) (7%) (6%)Value Added (billions EUR) 52.3 63.0 +20% +25%
Productivity
A proxy of labor productivity is the average ratio comparing the turnover and the number of em-ployees. This ratio can be calculated for different categories of companies, including MNEs.
Table 6 – Labor productivityK EUR/employee
Turnover / number of employees
Inwardaffiliates
Frenchmothercompanies
Wholeeconomy
MANUFACTURING 311.0 389.9 221.6CONSTRUCTION 185.6 172.6 92.6TRADE 553.9 578.7 291.7Of which wholesale trade 523.4 658.8 447.7SERVICES (Excluding trade) 176.6 129.1 119.8Of which financial sector 101.2 43.5 519.5Of which Holdings 285.2 202.8 378.6ALL ACTIVITIES 329.2 273.3 184.2All activities, excluding financial sector and holdings 336.9 301.3 172.9
Year 2000.
Table 6 shows that MNEs, whether they are inward affiliates or French mother companies, bringout a higher average labour productivity than other French resident companies, which is probablyamong other reasons due to the size of multinationals, irrespective of the size of the company (affil-iate) itself. This table shows also that differences between economic sectors are sizeable, generat-ing high composition effects in aggregates performances and justifying the pressing necessity ofusing industry breakdowns.
b) Performances of outward affiliates
Given the lack of FATS data relating to outward affiliates, which are limited for the moment tosales, the only way to measure the performances of foreign affiliates of French companies is tocompare the evolution of their sales to the one of the French mother companies or to the wholeFrench resident enterprises. This comparison gives an idea on the way foreign affiliates supple-ment the sales of domestic companies.
The high level of the growth rate of outward sales (75%) during the period, compared to the oneof the sales of all French resident companies (35%), covers important changes in the perimeter offoreign affiliates. However when limiting to the companies which were present in 1995 and still in2000, the growth rates reached 54%, which remains a high level (table 7).
EXTENDED PAPERS
IFC Bulletin 17 — February 2004 53
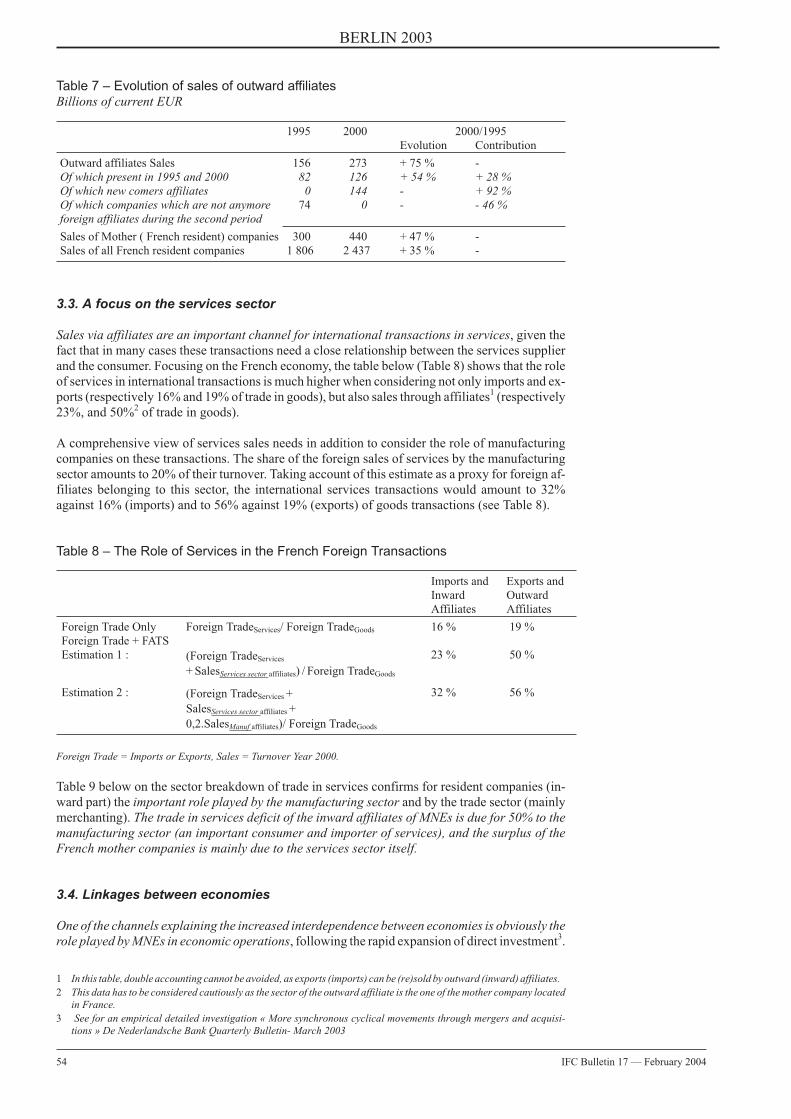
Table 7 – Evolution of sales of outward affiliatesBillions of current EUR
1995 2000 2000/1995Evolution Contribution
Outward affiliates Sales 156 273 + 75 % -Of which present in 1995 and 2000 82 126 + 54 % + 28 %Of which new comers affiliates 0 144 - + 92 %Of which companies which are not anymoreforeign affiliates during the second period
74 0 - - 46 %
Sales of Mother ( French resident) companies 300 440 + 47 % -Sales of all French resident companies 1 806 2 437 + 35 % -
3.3. A focus on the services sector
Sales via affiliates are an important channel for international transactions in services, given thefact that in many cases these transactions need a close relationship between the services supplierand the consumer. Focusing on the French economy, the table below (Table 8) shows that the roleof services in international transactions is much higher when considering not only imports and ex-ports (respectively 16% and 19% of trade in goods), but also sales through affiliates1 (respectively23%, and 50%2 of trade in goods).
A comprehensive view of services sales needs in addition to consider the role of manufacturingcompanies on these transactions. The share of the foreign sales of services by the manufacturingsector amounts to 20% of their turnover. Taking account of this estimate as a proxy for foreign af-filiates belonging to this sector, the international services transactions would amount to 32%against 16% (imports) and to 56% against 19% (exports) of goods transactions (see Table 8).
Table 8 – The Role of Services in the French Foreign Transactions
Imports andInwardAffiliates
Exports andOutwardAffiliates
Foreign Trade Only Foreign TradeServices/ Foreign TradeGoods 16 % 19 %Foreign Trade + FATSEstimation 1 : (Foreign TradeServices
+ SalesServices sector affiliates) / Foreign TradeGoods
23 % 50 %
Estimation 2 : (Foreign TradeServices +
SalesServices sector affiliates +
0,2.SalesManuf affiliates)/ Foreign TradeGoods
32 % 56 %
Foreign Trade = Imports or Exports, Sales = Turnover Year 2000.
Table 9 below on the sector breakdown of trade in services confirms for resident companies (in-ward part) the important role played by the manufacturing sector and by the trade sector (mainlymerchanting). The trade in services deficit of the inward affiliates of MNEs is due for 50% to themanufacturing sector (an important consumer and importer of services), and the surplus of theFrench mother companies is mainly due to the services sector itself.
3.4. Linkages between economies
One of the channels explaining the increased interdependence between economies is obviously therole played by MNEs in economic operations, following the rapid expansion of direct investment3.
54 IFC Bulletin 17 — February 2004
BERLIN 2003
1 In this table, double accounting cannot be avoided, as exports (imports) can be (re)sold by outward (inward) affiliates.2 This data has to be considered cautiously as the sector of the outward affiliate is the one of the mother company located
in France.3 See for an empirical detailed investigation « More synchronous cyclical movements through mergers and acquisi-
tions » De Nederlandsche Bank Quarterly Bulletin- March 2003
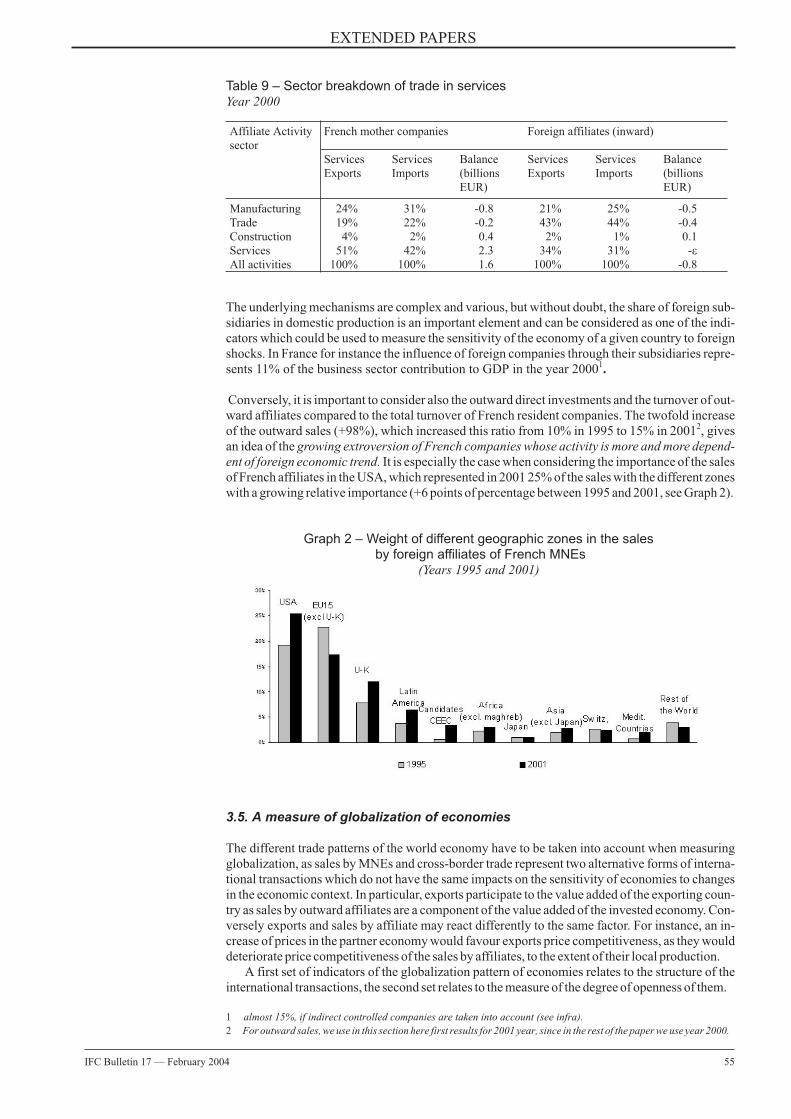
The underlying mechanisms are complex and various, but without doubt, the share of foreign sub-sidiaries in domestic production is an important element and can be considered as one of the indi-cators which could be used to measure the sensitivity of the economy of a given country to foreignshocks. In France for instance the influence of foreign companies through their subsidiaries repre-sents 11% of the business sector contribution to GDP in the year 20001
.
Conversely, it is important to consider also the outward direct investments and the turnover of out-ward affiliates compared to the total turnover of French resident companies. The twofold increaseof the outward sales (+98%), which increased this ratio from 10% in 1995 to 15% in 20012, givesan idea of the growing extroversion of French companies whose activity is more and more depend-ent of foreign economic trend. It is especially the case when considering the importance of the salesof French affiliates in the USA, which represented in 2001 25% of the sales with the different zoneswith a growing relative importance (+6 points of percentage between 1995 and 2001, see Graph 2).
Graph 2 – Weight of different geographic zones in the salesby foreign affiliates of French MNEs
(Years 1995 and 2001)
3.5. A measure of globalization of economies
The different trade patterns of the world economy have to be taken into account when measuringglobalization, as sales by MNEs and cross-border trade represent two alternative forms of interna-tional transactions which do not have the same impacts on the sensitivity of economies to changesin the economic context. In particular, exports participate to the value added of the exporting coun-try as sales by outward affiliates are a component of the value added of the invested economy. Con-versely exports and sales by affiliate may react differently to the same factor. For instance, an in-crease of prices in the partner economy would favour exports price competitiveness, as they woulddeteriorate price competitiveness of the sales by affiliates, to the extent of their local production.
A first set of indicators of the globalization pattern of economies relates to the structure of theinternational transactions, the second set relates to the measure of the degree of openness of them.
EXTENDED PAPERS
IFC Bulletin 17 — February 2004 55
Table 9 – Sector breakdown of trade in servicesYear 2000
Affiliate Activitysector
French mother companies Foreign affiliates (inward)
ServicesExports
ServicesImports
Balance(billionsEUR)
ServicesExports
ServicesImports
Balance(billionsEUR)
Manufacturing 24% 31% -0.8 21% 25% -0.5Trade 19% 22% -0.2 43% 44% -0.4Construction 4% 2% 0.4 2% 1% 0.1Services 51% 42% 2.3 34% 31% -�All activities 100% 100% 1.6 100% 100% -0.8
1 almost 15%, if indirect controlled companies are taken into account (see infra).2 For outward sales, we use in this section here first results for 2001 year, since in the rest of the paper we use year 2000.
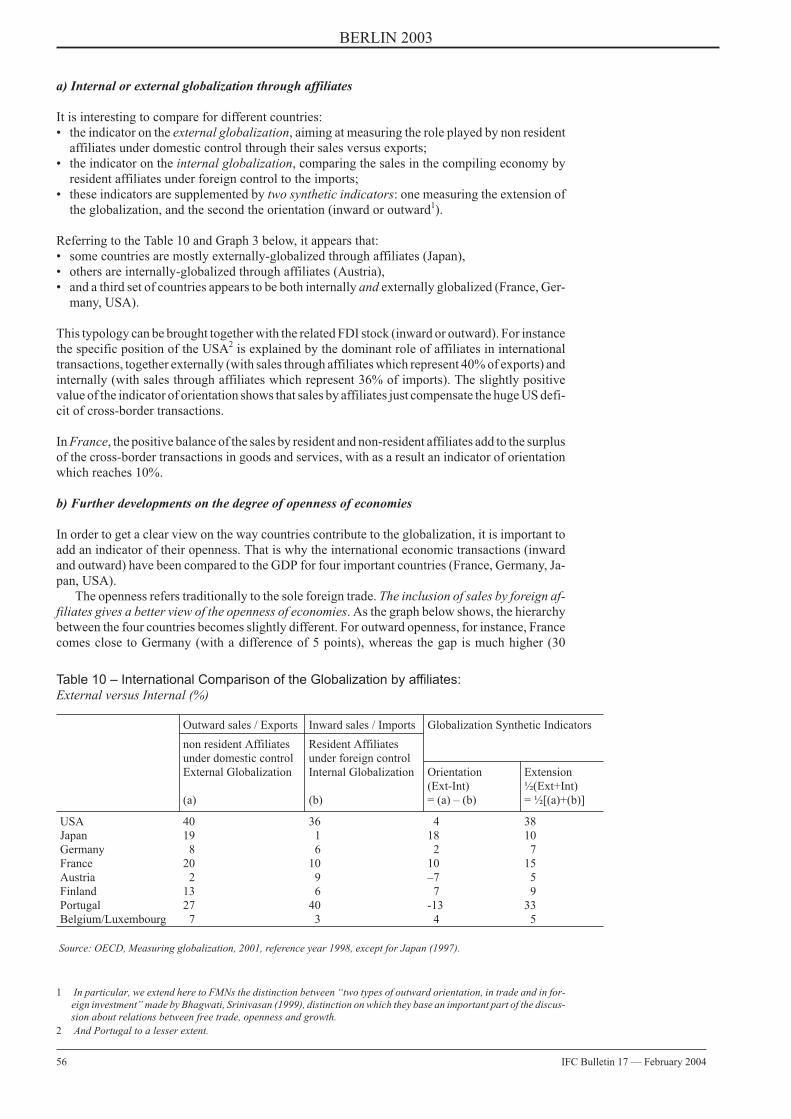
a) Internal or external globalization through affiliates
It is interesting to compare for different countries:• the indicator on the external globalization, aiming at measuring the role played by non resident
affiliates under domestic control through their sales versus exports;• the indicator on the internal globalization, comparing the sales in the compiling economy by
resident affiliates under foreign control to the imports;• these indicators are supplemented by two synthetic indicators: one measuring the extension of
the globalization, and the second the orientation (inward or outward1).
Referring to the Table 10 and Graph 3 below, it appears that:• some countries are mostly externally-globalized through affiliates (Japan),• others are internally-globalized through affiliates (Austria),• and a third set of countries appears to be both internally and externally globalized (France, Ger-
many, USA).
This typology can be brought together with the related FDI stock (inward or outward). For instancethe specific position of the USA2 is explained by the dominant role of affiliates in internationaltransactions, together externally (with sales through affiliates which represent 40% of exports) andinternally (with sales through affiliates which represent 36% of imports). The slightly positivevalue of the indicator of orientation shows that sales by affiliates just compensate the huge US defi-cit of cross-border transactions.
In France, the positive balance of the sales by resident and non-resident affiliates add to the surplusof the cross-border transactions in goods and services, with as a result an indicator of orientationwhich reaches 10%.
b) Further developments on the degree of openness of economies
In order to get a clear view on the way countries contribute to the globalization, it is important toadd an indicator of their openness. That is why the international economic transactions (inwardand outward) have been compared to the GDP for four important countries (France, Germany, Ja-pan, USA).
The openness refers traditionally to the sole foreign trade. The inclusion of sales by foreign af-filiates gives a better view of the openness of economies. As the graph below shows, the hierarchybetween the four countries becomes slightly different. For outward openness, for instance, Francecomes close to Germany (with a difference of 5 points), whereas the gap is much higher (30
56 IFC Bulletin 17 — February 2004
BERLIN 2003
Table 10 – International Comparison of the Globalization by affiliates:External versus Internal (%)
Outward sales / Exports Inward sales / Imports Globalization Synthetic Indicators
non resident Affiliatesunder domestic control
Resident Affiliatesunder foreign control
External Globalization
(a)
Internal Globalization
(b)
Orientation(Ext-Int)= (a) – (b)
Extension½(Ext+Int)= ½[(a)+(b)]
USA 40 36 4 38Japan 19 1 18 10Germany 8 6 2 7France 20 10 10 15Austria 2 9 –7 5Finland 13 6 7 9Portugal 27 40 -13 33Belgium/Luxembourg 7 3 4 5
Source: OECD, Measuring globalization, 2001, reference year 1998, except for Japan (1997).
1 In particular, we extend here to FMNs the distinction between “two types of outward orientation, in trade and in for-eign investment” made by Bhagwati, Srinivasan (1999), distinction on which they base an important part of the discus-sion about relations between free trade, openness and growth.
2 And Portugal to a lesser extent.
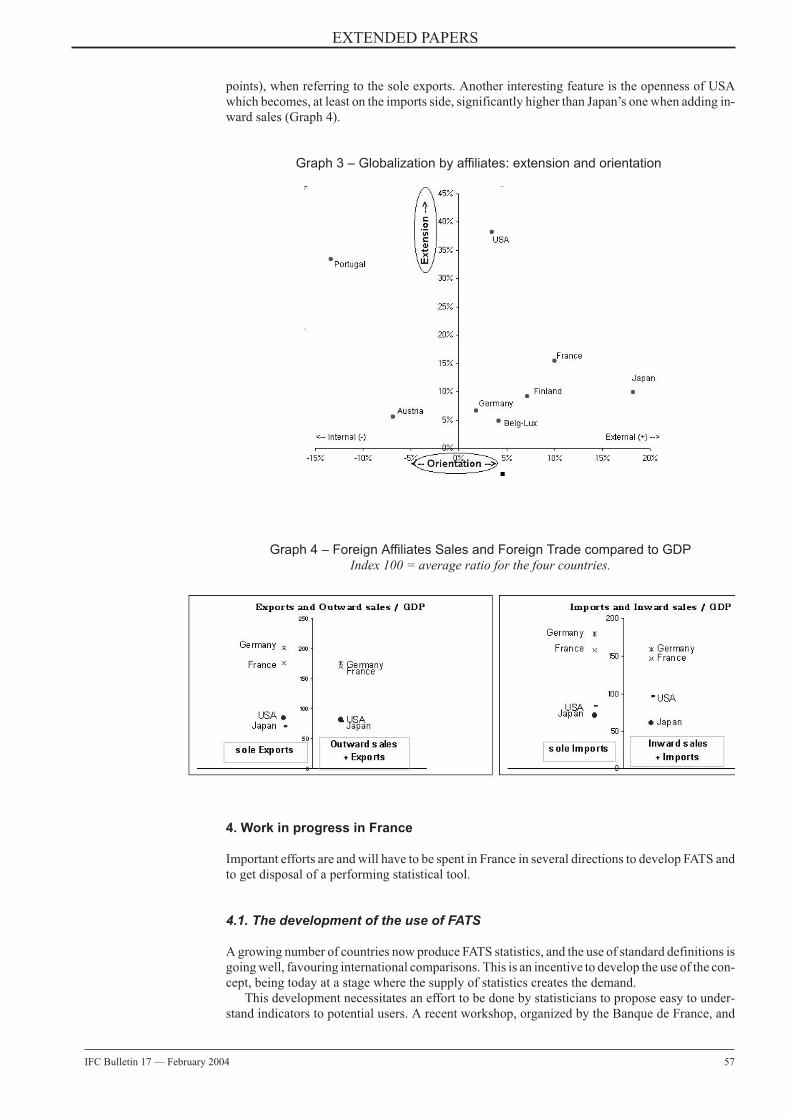
points), when referring to the sole exports. Another interesting feature is the openness of USAwhich becomes, at least on the imports side, significantly higher than Japan’s one when adding in-ward sales (Graph 4).
Graph 3 – Globalization by affiliates: extension and orientation
Graph 4 – Foreign Affiliates Sales and Foreign Trade compared to GDPIndex 100 = average ratio for the four countries.
4. Work in progress in France
Important efforts are and will have to be spent in France in several directions to develop FATS andto get disposal of a performing statistical tool.
4.1. The development of the use of FATS
A growing number of countries now produce FATS statistics, and the use of standard definitions isgoing well, favouring international comparisons. This is an incentive to develop the use of the con-cept, being today at a stage where the supply of statistics creates the demand.
This development necessitates an effort to be done by statisticians to propose easy to under-stand indicators to potential users. A recent workshop, organized by the Banque de France, and
EXTENDED PAPERS
IFC Bulletin 17 — February 2004 57
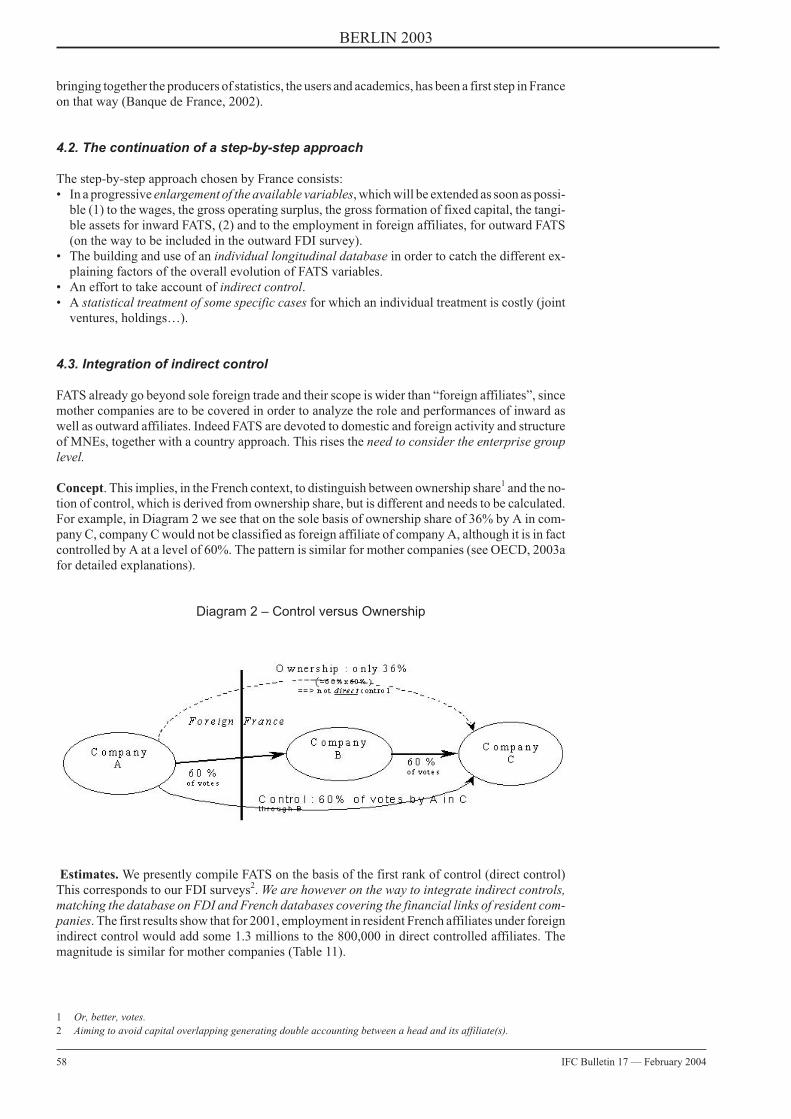
bringing together the producers of statistics, the users and academics, has been a first step in Franceon that way (Banque de France, 2002).
4.2. The continuation of a step-by-step approach
The step-by-step approach chosen by France consists:• In a progressive enlargement of the available variables, which will be extended as soon as possi-
ble (1) to the wages, the gross operating surplus, the gross formation of fixed capital, the tangi-ble assets for inward FATS, (2) and to the employment in foreign affiliates, for outward FATS(on the way to be included in the outward FDI survey).
• The building and use of an individual longitudinal database in order to catch the different ex-plaining factors of the overall evolution of FATS variables.
• An effort to take account of indirect control.• A statistical treatment of some specific cases for which an individual treatment is costly (joint
ventures, holdings…).
4.3. Integration of indirect control
FATS already go beyond sole foreign trade and their scope is wider than “foreign affiliates”, sincemother companies are to be covered in order to analyze the role and performances of inward aswell as outward affiliates. Indeed FATS are devoted to domestic and foreign activity and structureof MNEs, together with a country approach. This rises the need to consider the enterprise grouplevel.
Concept. This implies, in the French context, to distinguish between ownership share1 and the no-tion of control, which is derived from ownership share, but is different and needs to be calculated.For example, in Diagram 2 we see that on the sole basis of ownership share of 36% by A in com-pany C, company C would not be classified as foreign affiliate of company A, although it is in factcontrolled by A at a level of 60%. The pattern is similar for mother companies (see OECD, 2003afor detailed explanations).
Diagram 2 – Control versus Ownership
Estimates. We presently compile FATS on the basis of the first rank of control (direct control)This corresponds to our FDI surveys2. We are however on the way to integrate indirect controls,matching the database on FDI and French databases covering the financial links of resident com-panies. The first results show that for 2001, employment in resident French affiliates under foreignindirect control would add some 1.3 millions to the 800,000 in direct controlled affiliates. Themagnitude is similar for mother companies (Table 11).
58 IFC Bulletin 17 — February 2004
BERLIN 2003
1 Or, better, votes.2 Aiming to avoid capital overlapping generating double accounting between a head and its affiliate(s).
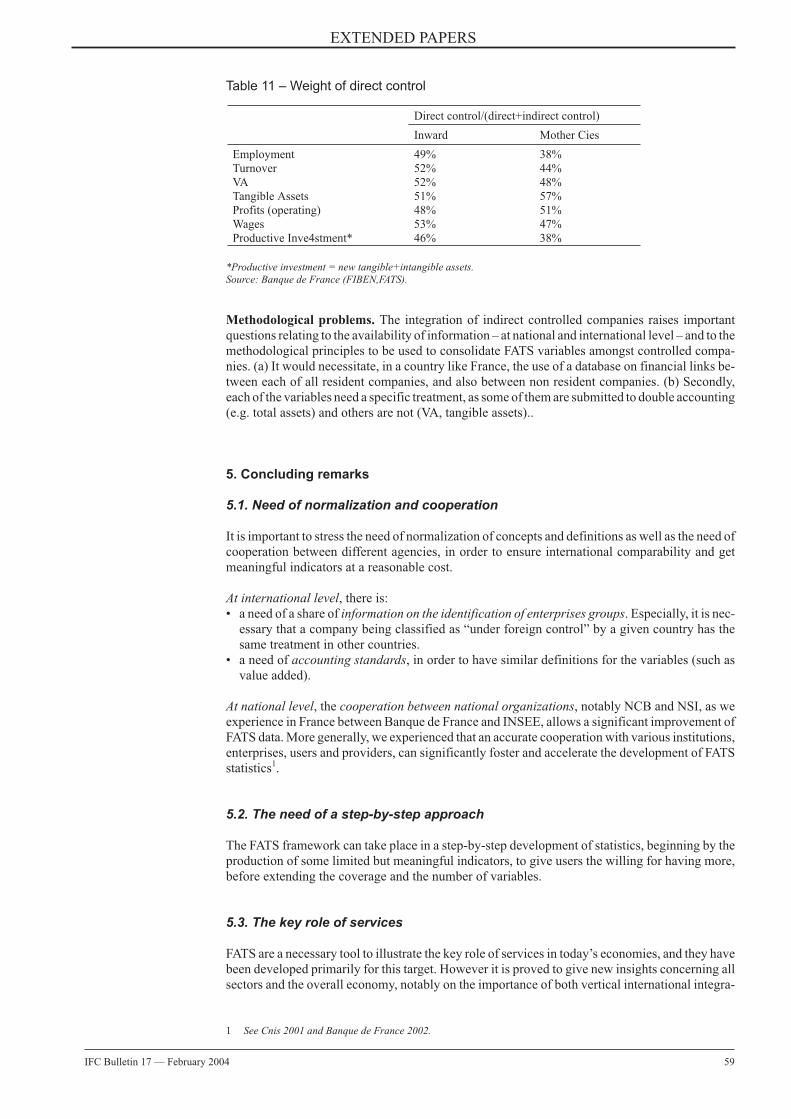
Methodological problems. The integration of indirect controlled companies raises importantquestions relating to the availability of information – at national and international level – and to themethodological principles to be used to consolidate FATS variables amongst controlled compa-nies. (a) It would necessitate, in a country like France, the use of a database on financial links be-tween each of all resident companies, and also between non resident companies. (b) Secondly,each of the variables need a specific treatment, as some of them are submitted to double accounting(e.g. total assets) and others are not (VA, tangible assets)..
5. Concluding remarks
5.1. Need of normalization and cooperation
It is important to stress the need of normalization of concepts and definitions as well as the need ofcooperation between different agencies, in order to ensure international comparability and getmeaningful indicators at a reasonable cost.
At international level, there is:• a need of a share of information on the identification of enterprises groups. Especially, it is nec-
essary that a company being classified as “under foreign control” by a given country has thesame treatment in other countries.
• a need of accounting standards, in order to have similar definitions for the variables (such asvalue added).
At national level, the cooperation between national organizations, notably NCB and NSI, as weexperience in France between Banque de France and INSEE, allows a significant improvement ofFATS data. More generally, we experienced that an accurate cooperation with various institutions,enterprises, users and providers, can significantly foster and accelerate the development of FATSstatistics1.
5.2. The need of a step-by-step approach
The FATS framework can take place in a step-by-step development of statistics, beginning by theproduction of some limited but meaningful indicators, to give users the willing for having more,before extending the coverage and the number of variables.
5.3. The key role of services
FATS are a necessary tool to illustrate the key role of services in today’s economies, and they havebeen developed primarily for this target. However it is proved to give new insights concerning allsectors and the overall economy, notably on the importance of both vertical international integra-
EXTENDED PAPERS
IFC Bulletin 17 — February 2004 59
Table 11 – Weight of direct control
Direct control/(direct+indirect control)
Inward Mother Cies
Employment 49% 38%Turnover 52% 44%VA 52% 48%Tangible Assets 51% 57%Profits (operating) 48% 51%Wages 53% 47%Productive Inve4stment* 46% 38%
*Productive investment = new tangible+intangible assets.Source: Banque de France (FIBEN,FATS).
1 See Cnis 2001 and Banque de France 2002.

tion (integration of services and industry) and horizontal integration (integration of services andservices, see Markusen, Maskus, 1999).
5.4. The need of developing new economic concepts
Together with FATS, new concepts are developing in parallel with the globalization of economies.It is the case of the concept of trade balance based on the notion of ownership, which can be com-bined with the trade balance based on the residency (De Anne, 1990, Landefeld, Lowe, Wichard,1993, Lowe, 2002). It is also the case of the balance of MNEs international operations (see Hymer1960). Other concepts will probably be necessary in order to take account of the MNEs use of do-mestic funds for international investment (see Boccara 2003), or to describe the contribution ofMNEs to the connection between GDP and Gross National Income.
The aim with these new concepts is to go further into our understanding of the articulation be-tween world economy, MNEs and national economies given by BoP and IIP statistics.
Frédéric BoccaraInsee economist, Balance of Payments DirectorateBanque de [email protected]
François RenardDeputy Director, Balance of Payments DirectorateBanque de [email protected]
References
Arkell Julian (2002), Stats on FATS, Mark Twain Institute, 38 p.
Banque de France (2002), Les investissements directs de la France dans la globalisation: mesure et enjeux,Proceedings of the CNIS-Banque de France seminar, edited by Boccara F., Nivat D., 145 p.
Bhagwati Jagdish, Srinivasan T. N. (1999), “Outward Orientation and Development: Are RevisionistsRight?”, Working Papers of Yale university, 44 p.
Boccara Frédéric (1999), “Enterprises and globalization: multinationalization and factors of national growthin France”, Proceedings of ‘99 New Economic Realities, http://www.statcan.ca, Statistic Canada, 10 p.
Boccara Frédéric (2003), “Réorientation française vers les PECO et entreprises multinationales : état deslieux, structuration, apports à l’économie française – Vers une grille systémique d’analyse de laglobalisation”, Meeting of the Association Française de Sciences Économiques, May,http://www.univ-lille1.fr/afsemedee/communications/frederic_boccara.pdf, 18 p.
Calvet Sylvie (1999), “Les statistiques sur l’activité des entreprises sous contrôle étranger en 1995 et 1996 ouFATS”, Bulletin de la Banque de France, n° 63, Mars, p. 1-26.
Caves Richard E. (1971), “International Corporations:The Industrial Economics of Foreign Investment”,Economica 38, February, p. 1-27.
CEIES (2003), “Statistics and Economic Globalization”, 22nd seminar, June 2nd-3rd, Eurostat.
CNIS (2001), “Foreign Direct Investment in France”, english summary of the 64th Report of the Conseil Na-tional de l’Information Statistique, edited by Mucchielli J.-L., Thollon-Pommerol V., Nivat D., 18 p.
Cœuré Benoît, Rabaud Isabelle (2003), “Attractivité de la France : analyse, perception et mesure“, Économieet Statistique n° 363-364-365, forthcoming, Insee.
De Anne Julius ( 1990), Global Companies and Public Policy, Council on Foreign Relations Press.
Dunning John H. (1990), “The Eclectic Paradigm of International Production: a Personnal Perspective”, inThe Nature of the Transnational Firm, Christos N. Pitelis & Roger Sugden (eds), Routledge, p. 117-136.
Dutch National Bank (2003), “More synchronous cyclical movements through mergers and acquisitions?”,Quaterly Bulletin, March, p. 49-56.
Eurostat (2003), BoP VadeMeCum, Questionnaires Y9 and Y10, pp 147-167, update March.
Hatzichronoglou Thomas (2003a), Manual on Globalization Indicators, draft, spring 2003, OECD.
Hatzichronoglou Thomas (2003b), “Harmonized Methodological Framework for Economic Globalization”,Copenhagen, 22nd CEIES Seminar, “Statistics and Economic Globalization”, June 2nd-3rd, Eurostat.
Hymer Stephen (1960), The international Operations of National Firms: a Study of Direct Investment, PhDThesis, MIT, published by MIT Press in 1976.
60 IFC Bulletin 17 — February 2004
BERLIN 2003
I Haaland Jan, Navaretti Giorgio Barba, Venables Anthony (2002), Multinational Corporations and GlobalProduction Networks: The Implications for Trade Policy, report for the European Commission, DG forTrade, CEPR, 88 p.
Kindleberger Charles P. (ed) (1970), The international corporation: A Symposium, MIT Press.
Lipsey Robert E. (2001), “FDI and the operations of Multinational Firms: Concepts, History, and Data”,NBER Working papers 8665, December, NBER, 56p.
Landefeld J. Steven, Lowe Jeffrey H, Wichard Obie G. (1993), “Alternative Frameworks for US InternationalTransactions”, Survey of Current Business, December, BEA, US Department of Commerce.
Markusen James R., Maskus Keith E. (1999), “Discriminating among Alternative Theories of the Multina-tional Entreprise”, NBER Working Paper, n° 7164, 19 p.
Steven, Lowe Jeffrey H (2002), “An ownership-based framework of the current-account, 1989-99”, Survey ofCurrent Business, April, BEA, US Department of Commerce.Mataloni Raymond J. Jr (1997), “RealGross Product of US companies’ Majority-Owned Foreign Affiliates in Manufacturing”, Survey of Cur-rent Business, April, p. 8-37, BEA, US Department of Commerce.
OECD (1994), The Performance of Foreign Affiliates in OECD Countries, OCDE, 184 p.
OECD (2001), Measuring Globalization – The role of multinationals in OECD Economies, OCDE.
OECD (2003a), “Preliminary Draft Indicators or Trade in Services by Modes of Supply”, Room Document ofthe meeting of experts in Trade in Services, spring 2003.
OCDE (2003b), Manual on economic globalization indicators, working party on statistics,DSTI/EAS/IND/SWP(2002)3/Rev1, July, 61p.
Passerini Paolo (2003), “EU affiliates in non EU countries: sales of services doubled between 1997 and1999”, Statistics in Focus, Theme 2, 21/2003, Eurostat, 4 p.
Peyroux Claude, Belli Styliani (1999), “Les FATS: une nouvelle source d’information sur les investissementsdirects étrangers dans le secteur tertiaire”, Economie et Statistique n° 326-327, Insee.
Renard François (1992), “L’internationalisation des entreprises et ses conséquences sur la balance despaiements”, miméo, Banque de France.
United Nations, European Commission, IMF, OECD, UNCTAD, WTO (2002), Manual on Statistics of Inter-national Trade in Services, 176 p.
Wichard Obie (2003), “Measuring Globalization: The Experience of the United States of America”, Copen-hagen, 22nd CEIES Seminar, “Statistics and Economic Globalization”, Department of Commerce, Wash-ington DC, June.
EXTENDED PAPERS
IFC Bulletin 17 — February 2004 61
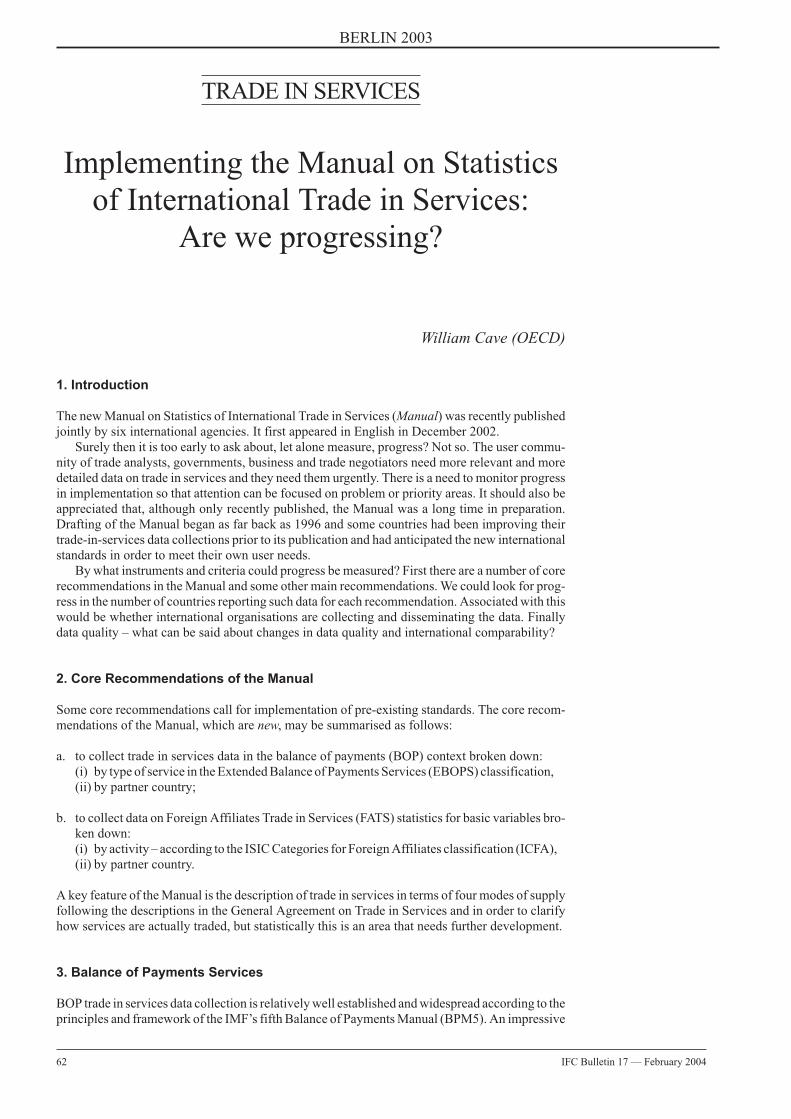
TRADE IN SERVICES
Implementing the Manual on Statisticsof International Trade in Services:
Are we progressing?
William Cave (OECD)
1. Introduction
The new Manual on Statistics of International Trade in Services (Manual) was recently publishedjointly by six international agencies. It first appeared in English in December 2002.
Surely then it is too early to ask about, let alone measure, progress? Not so. The user commu-nity of trade analysts, governments, business and trade negotiators need more relevant and moredetailed data on trade in services and they need them urgently. There is a need to monitor progressin implementation so that attention can be focused on problem or priority areas. It should also beappreciated that, although only recently published, the Manual was a long time in preparation.Drafting of the Manual began as far back as 1996 and some countries had been improving theirtrade-in-services data collections prior to its publication and had anticipated the new internationalstandards in order to meet their own user needs.
By what instruments and criteria could progress be measured? First there are a number of corerecommendations in the Manual and some other main recommendations. We could look for prog-ress in the number of countries reporting such data for each recommendation. Associated with thiswould be whether international organisations are collecting and disseminating the data. Finallydata quality – what can be said about changes in data quality and international comparability?
2. Core Recommendations of the Manual
Some core recommendations call for implementation of pre-existing standards. The core recom-mendations of the Manual, which are new, may be summarised as follows:
a. to collect trade in services data in the balance of payments (BOP) context broken down:(i) by type of service in the Extended Balance of Payments Services (EBOPS) classification,(ii) by partner country;
b. to collect data on Foreign Affiliates Trade in Services (FATS) statistics for basic variables bro-ken down:(i) by activity – according to the ISIC Categories for Foreign Affiliates classification (ICFA),(ii) by partner country.
A key feature of the Manual is the description of trade in services in terms of four modes of supplyfollowing the descriptions in the General Agreement on Trade in Services and in order to clarifyhow services are actually traded, but statistically this is an area that needs further development.
3. Balance of Payments Services
BOP trade in services data collection is relatively well established and widespread according to theprinciples and framework of the IMF’s fifth Balance of Payments Manual (BPM5). An impressive
62 IFC Bulletin 17 — February 2004
BERLIN 2003
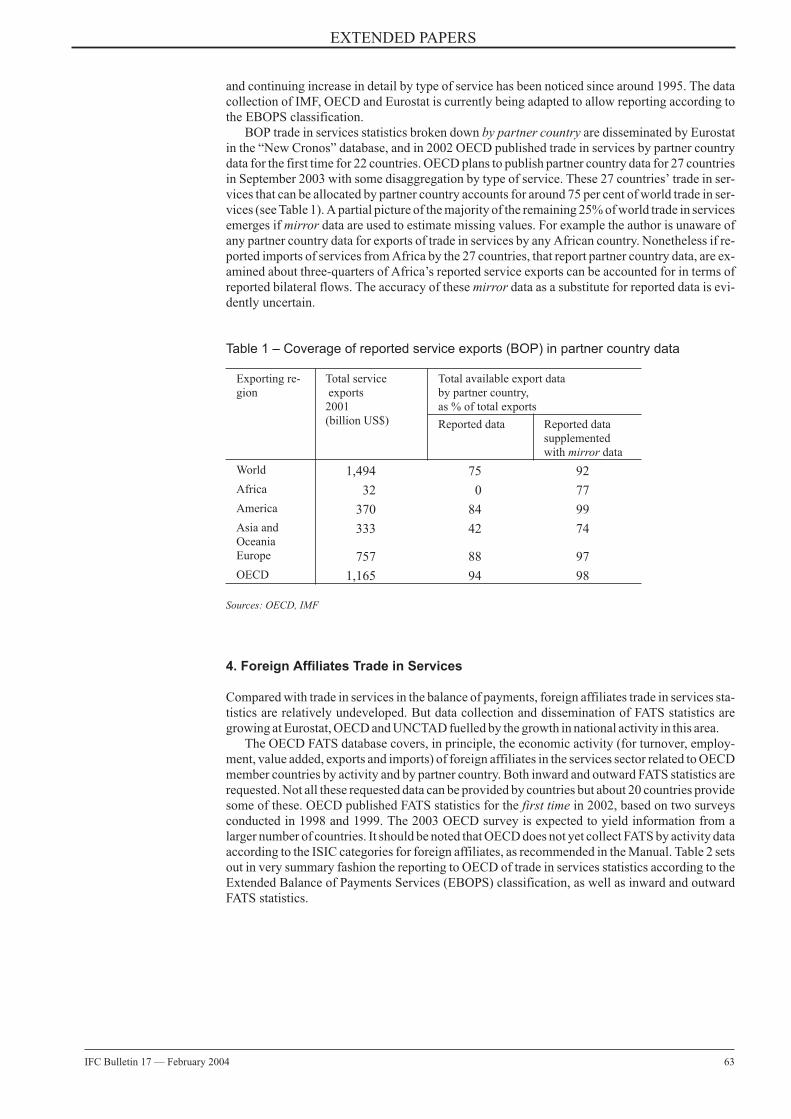
and continuing increase in detail by type of service has been noticed since around 1995. The datacollection of IMF, OECD and Eurostat is currently being adapted to allow reporting according tothe EBOPS classification.
BOP trade in services statistics broken down by partner country are disseminated by Eurostatin the “New Cronos” database, and in 2002 OECD published trade in services by partner countrydata for the first time for 22 countries. OECD plans to publish partner country data for 27 countriesin September 2003 with some disaggregation by type of service. These 27 countries’ trade in ser-vices that can be allocated by partner country accounts for around 75 per cent of world trade in ser-vices (see Table 1). A partial picture of the majority of the remaining 25% of world trade in servicesemerges if mirror data are used to estimate missing values. For example the author is unaware ofany partner country data for exports of trade in services by any African country. Nonetheless if re-ported imports of services from Africa by the 27 countries, that report partner country data, are ex-amined about three-quarters of Africa’s reported service exports can be accounted for in terms ofreported bilateral flows. The accuracy of these mirror data as a substitute for reported data is evi-dently uncertain.
Table 1 – Coverage of reported service exports (BOP) in partner country data
Exporting re-gion
Total serviceexports2001(billion US$)
Total available export databy partner country,as % of total exports
Reported data Reported datasupplementedwith mirror data
World 1,494 75 92
Africa 32 0 77
America 370 84 99
Asia andOceania
333 42 74
Europe 757 88 97
OECD 1,165 94 98
Sources: OECD, IMF
4. Foreign Affiliates Trade in Services
Compared with trade in services in the balance of payments, foreign affiliates trade in services sta-tistics are relatively undeveloped. But data collection and dissemination of FATS statistics aregrowing at Eurostat, OECD and UNCTAD fuelled by the growth in national activity in this area.
The OECD FATS database covers, in principle, the economic activity (for turnover, employ-ment, value added, exports and imports) of foreign affiliates in the services sector related to OECDmember countries by activity and by partner country. Both inward and outward FATS statistics arerequested. Not all these requested data can be provided by countries but about 20 countries providesome of these. OECD published FATS statistics for the first time in 2002, based on two surveysconducted in 1998 and 1999. The 2003 OECD survey is expected to yield information from alarger number of countries. It should be noted that OECD does not yet collect FATS by activity dataaccording to the ISIC categories for foreign affiliates, as recommended in the Manual. Table 2 setsout in very summary fashion the reporting to OECD of trade in services statistics according to theExtended Balance of Payments Services (EBOPS) classification, as well as inward and outwardFATS statistics.
EXTENDED PAPERS
IFC Bulletin 17 — February 2004 63
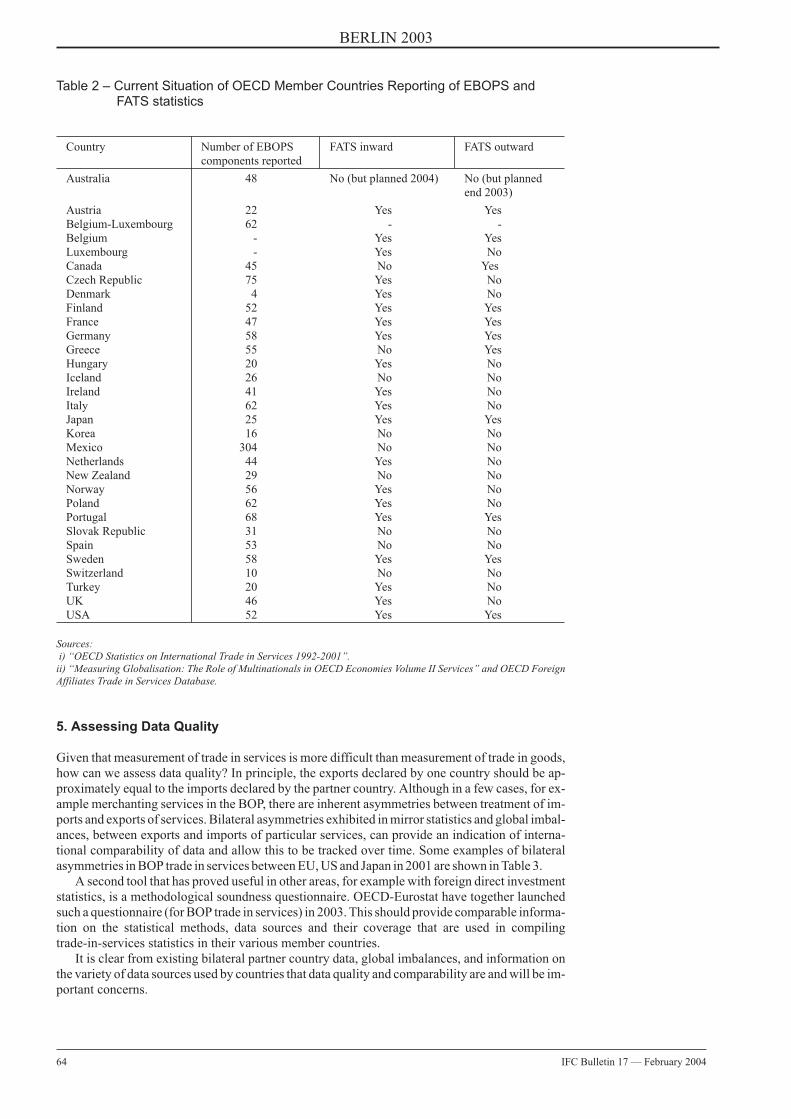
Table 2 – Current Situation of OECD Member Countries Reporting of EBOPS andFATS statistics
Country Number of EBOPScomponents reported
FATS inward FATS outward
Australia 48 No (but planned 2004) No (but plannedend 2003)
Austria 22 Yes YesBelgium-Luxembourg 62 - -Belgium - Yes YesLuxembourg - Yes NoCanada 45 No YesCzech Republic 75 Yes NoDenmark 4 Yes NoFinland 52 Yes YesFrance 47 Yes YesGermany 58 Yes YesGreece 55 No YesHungary 20 Yes NoIceland 26 No NoIreland 41 Yes NoItaly 62 Yes NoJapan 25 Yes YesKorea 16 No NoMexico 304 No NoNetherlands 44 Yes NoNew Zealand 29 No NoNorway 56 Yes NoPoland 62 Yes NoPortugal 68 Yes YesSlovak Republic 31 No NoSpain 53 No NoSweden 58 Yes YesSwitzerland 10 No NoTurkey 20 Yes NoUK 46 Yes NoUSA 52 Yes Yes
Sources:i) “OECD Statistics on International Trade in Services 1992-2001”.
ii) “Measuring Globalisation: The Role of Multinationals in OECD Economies Volume II Services” and OECD ForeignAffiliates Trade in Services Database.
5. Assessing Data Quality
Given that measurement of trade in services is more difficult than measurement of trade in goods,how can we assess data quality? In principle, the exports declared by one country should be ap-proximately equal to the imports declared by the partner country. Although in a few cases, for ex-ample merchanting services in the BOP, there are inherent asymmetries between treatment of im-ports and exports of services. Bilateral asymmetries exhibited in mirror statistics and global imbal-ances, between exports and imports of particular services, can provide an indication of interna-tional comparability of data and allow this to be tracked over time. Some examples of bilateralasymmetries in BOP trade in services between EU, US and Japan in 2001 are shown in Table 3.
A second tool that has proved useful in other areas, for example with foreign direct investmentstatistics, is a methodological soundness questionnaire. OECD-Eurostat have together launchedsuch a questionnaire (for BOP trade in services) in 2003. This should provide comparable informa-tion on the statistical methods, data sources and their coverage that are used in compilingtrade-in-services statistics in their various member countries.
It is clear from existing bilateral partner country data, global imbalances, and information onthe variety of data sources used by countries that data quality and comparability are and will be im-portant concerns.
64 IFC Bulletin 17 — February 2004
BERLIN 2003
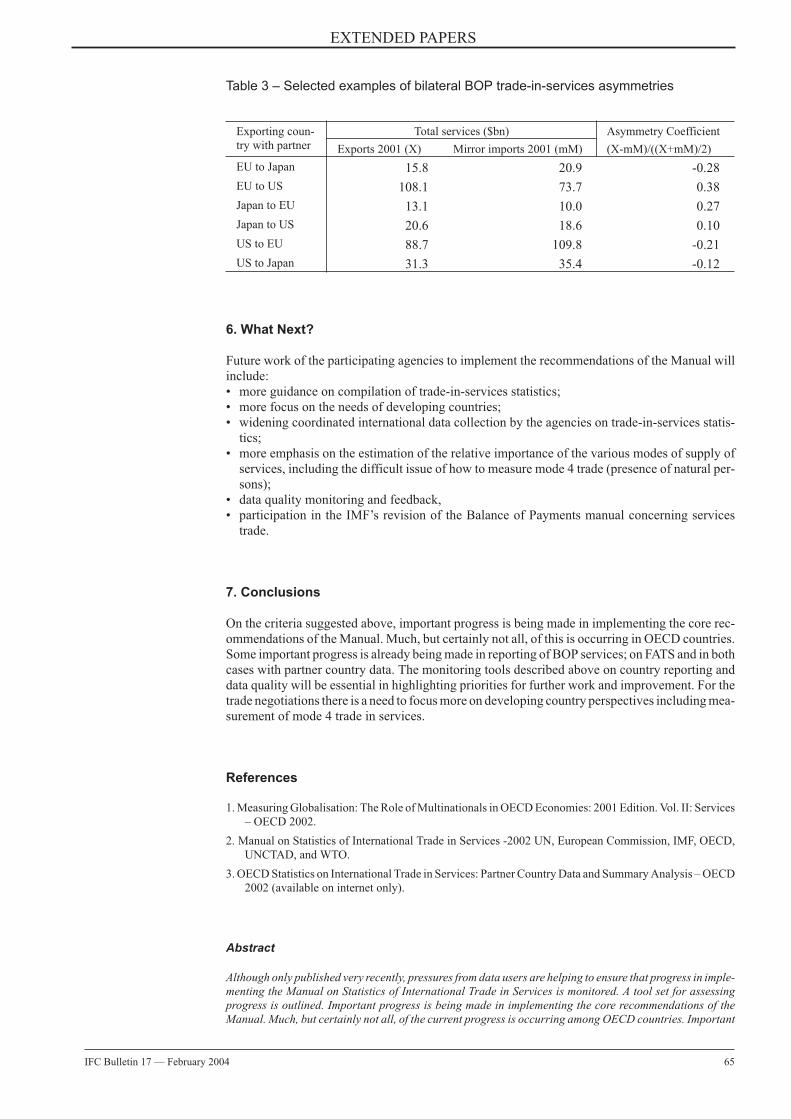
Table 3 – Selected examples of bilateral BOP trade-in-services asymmetries
Exporting coun-try with partner
Total services ($bn) Asymmetry Coefficient
Exports 2001 (X) Mirror imports 2001 (mM) (X-mM)/((X+mM)/2)
EU to Japan 15.8 20.9 -0.28
EU to US 108.1 73.7 0.38
Japan to EU 13.1 10.0 0.27
Japan to US 20.6 18.6 0.10
US to EU 88.7 109.8 -0.21
US to Japan 31.3 35.4 -0.12
6. What Next?
Future work of the participating agencies to implement the recommendations of the Manual willinclude:• more guidance on compilation of trade-in-services statistics;• more focus on the needs of developing countries;• widening coordinated international data collection by the agencies on trade-in-services statis-
tics;• more emphasis on the estimation of the relative importance of the various modes of supply of
services, including the difficult issue of how to measure mode 4 trade (presence of natural per-sons);
• data quality monitoring and feedback,• participation in the IMF’s revision of the Balance of Payments manual concerning services
trade.
7. Conclusions
On the criteria suggested above, important progress is being made in implementing the core rec-ommendations of the Manual. Much, but certainly not all, of this is occurring in OECD countries.Some important progress is already being made in reporting of BOP services; on FATS and in bothcases with partner country data. The monitoring tools described above on country reporting anddata quality will be essential in highlighting priorities for further work and improvement. For thetrade negotiations there is a need to focus more on developing country perspectives including mea-surement of mode 4 trade in services.
References
1. Measuring Globalisation: The Role of Multinationals in OECD Economies: 2001 Edition. Vol. II: Services– OECD 2002.
2. Manual on Statistics of International Trade in Services -2002 UN, European Commission, IMF, OECD,UNCTAD, and WTO.
3. OECD Statistics on International Trade in Services: Partner Country Data and Summary Analysis – OECD2002 (available on internet only).
Abstract
Although only published very recently, pressures from data users are helping to ensure that progress in imple-menting the Manual on Statistics of International Trade in Services is monitored. A tool set for assessingprogress is outlined. Important progress is being made in implementing the core recommendations of theManual. Much, but certainly not all, of the current progress is occurring among OECD countries. Important
EXTENDED PAPERS
IFC Bulletin 17 — February 2004 65
progress is being made on BOP services; on FATS and in both cases with partner country data. The monitor-ing tools described above on country reporting and data quality will be essential in highlighting priorities forfurther improvement.
William CaveOECD Statistics Directorate([email protected]
66 IFC Bulletin 17 — February 2004
BERLIN 2003
TRADE IN SERVICES
Travel in Balance of PaymentsStatistics
Branimir Gruiæ and Igor Jemriæ
(Croatian National Bank)
1. Introduction
As part of the international economic relations statistics, the Croatian National Bank (CNB) is re-sponsible for the Balance of Payments (BOP) Statistics. The BOP statistics are based on officialdata sources (like those from the Croatian Bureau of Statistics (CBS)) and data compiled inside theCNB (from the International Transactions Reporting System (ITRS), specialised statistical sur-veys, data on reserves assets etc.). Having in mind the importance of tourism for Croatia, the CNBin co-operation with other agencies conduct the Survey on expenditures of foreign tourists inCroatia and Croatian travellers abroad (the Survey).
This text concentrates on the Survey methodology and data sources used for the estimation oftravel revenues in the BOP. Concepts and definitions on which the Survey is based are presented inthe first part of the text that is followed by an overview of the methodology of the Survey. Afterthat, the Survey sample and allocation to stratums are defined. Finally, the text concludes with theidentification of problems and possible solutions that should be applied in the following years.
2. International guidelines
Eurostat defines a traveller as a person travelling to a place other than that of his/her usual environ-ment for less than twelve consecutive months and whose main purpose of travel is other than theexercise of an activity remunerated from within the place visited. An international traveller travelsoutside his/her country of residence. A tourist is a visitor who stays at least one night in an accom-modation, while same-day visitors do not spend any night in the country visited.
It is defined in the EC and Eurostat manual that in order to gather accurate data needed for theestimation of travel revenues/expenses, the population of travellers should be divided into homog-enous groups with similar characteristics (country of residence, way of travel etc.). These groupsare called stratums, so surveys on travellers should be based on stratified samples. Besides simplestratified sampling, systematic or even multistage stratified sampling can be used.
According to the IMF, all travellers expenditures made during travel should be regarded astravel-related, even if a traveller buys a car and drives it back home. Only goods purchased inplaces of travel, as gifts to residents of the country of travel, should be reclassified to the goods ac-count.
BOP standard components separately treat business and personal travel, the later divided intoeducation, health-related, and other personal travel. It is obvious that this distribution is based onthe motives of travel.
3. The concept of the Survey
Prior to the introduction of the Survey, there were no data sources that were able to cover travel ex-penditure during the whole year, or that covered all tourists that spent a night in Croatia. Further-more, same-day travellers were completely left out from the official data sources, as well as for-eign tourists that stayed in their own vacation houses or non-commercial accommodation (mostlywith friends and relatives).
EXTENDED PAPERS
IFC Bulletin 17 — February 2004 67
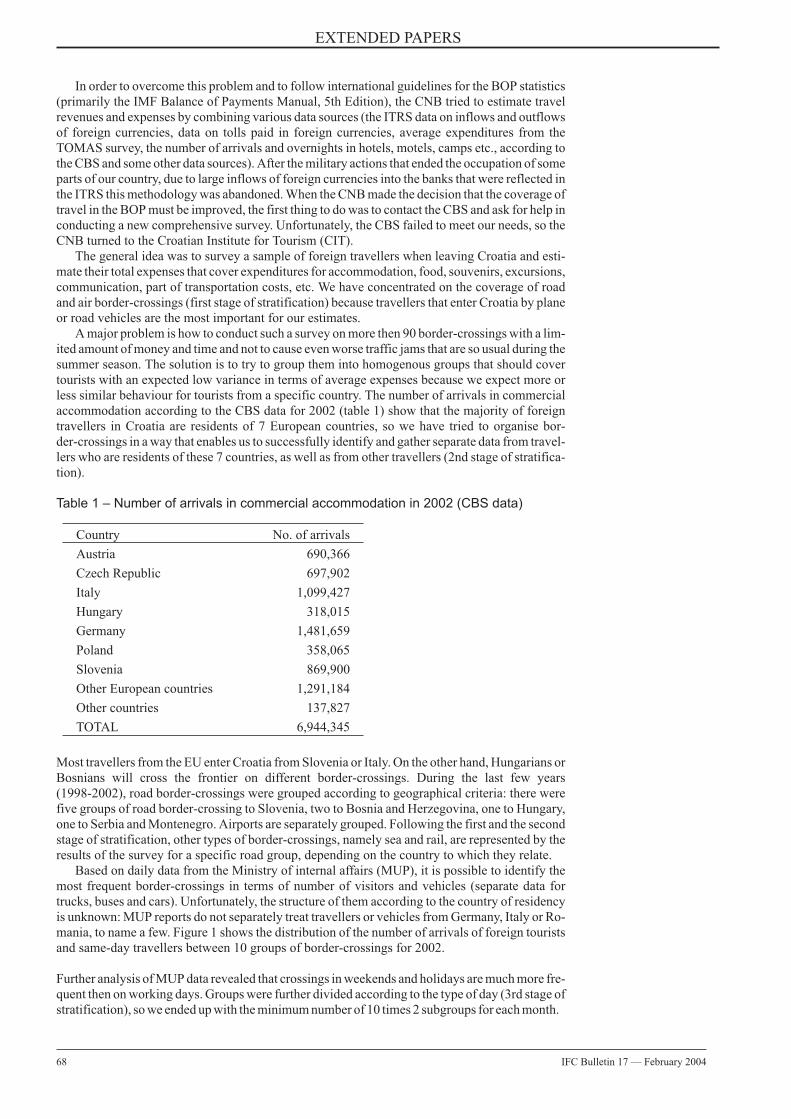
In order to overcome this problem and to follow international guidelines for the BOP statistics(primarily the IMF Balance of Payments Manual, 5th Edition), the CNB tried to estimate travelrevenues and expenses by combining various data sources (the ITRS data on inflows and outflowsof foreign currencies, data on tolls paid in foreign currencies, average expenditures from theTOMAS survey, the number of arrivals and overnights in hotels, motels, camps etc., according tothe CBS and some other data sources). After the military actions that ended the occupation of someparts of our country, due to large inflows of foreign currencies into the banks that were reflected inthe ITRS this methodology was abandoned. When the CNB made the decision that the coverage oftravel in the BOP must be improved, the first thing to do was to contact the CBS and ask for help inconducting a new comprehensive survey. Unfortunately, the CBS failed to meet our needs, so theCNB turned to the Croatian Institute for Tourism (CIT).
The general idea was to survey a sample of foreign travellers when leaving Croatia and esti-mate their total expenses that cover expenditures for accommodation, food, souvenirs, excursions,communication, part of transportation costs, etc. We have concentrated on the coverage of roadand air border-crossings (first stage of stratification) because travellers that enter Croatia by planeor road vehicles are the most important for our estimates.
A major problem is how to conduct such a survey on more then 90 border-crossings with a lim-ited amount of money and time and not to cause even worse traffic jams that are so usual during thesummer season. The solution is to try to group them into homogenous groups that should covertourists with an expected low variance in terms of average expenses because we expect more orless similar behaviour for tourists from a specific country. The number of arrivals in commercialaccommodation according to the CBS data for 2002 (table 1) show that the majority of foreigntravellers in Croatia are residents of 7 European countries, so we have tried to organise bor-der-crossings in a way that enables us to successfully identify and gather separate data from travel-lers who are residents of these 7 countries, as well as from other travellers (2nd stage of stratifica-tion).
Table 1 – Number of arrivals in commercial accommodation in 2002 (CBS data)
Country No. of arrivals
Austria 690,366
Czech Republic 697,902
Italy 1,099,427
Hungary 318,015
Germany 1,481,659
Poland 358,065
Slovenia 869,900
Other European countries 1,291,184
Other countries 137,827
TOTAL 6,944,345
Most travellers from the EU enter Croatia from Slovenia or Italy. On the other hand, Hungarians orBosnians will cross the frontier on different border-crossings. During the last few years(1998-2002), road border-crossings were grouped according to geographical criteria: there werefive groups of road border-crossing to Slovenia, two to Bosnia and Herzegovina, one to Hungary,one to Serbia and Montenegro. Airports are separately grouped. Following the first and the secondstage of stratification, other types of border-crossings, namely sea and rail, are represented by theresults of the survey for a specific road group, depending on the country to which they relate.
Based on daily data from the Ministry of internal affairs (MUP), it is possible to identify themost frequent border-crossings in terms of number of visitors and vehicles (separate data fortrucks, buses and cars). Unfortunately, the structure of them according to the country of residencyis unknown: MUP reports do not separately treat travellers or vehicles from Germany, Italy or Ro-mania, to name a few. Figure 1 shows the distribution of the number of arrivals of foreign touristsand same-day travellers between 10 groups of border-crossings for 2002.
Further analysis of MUP data revealed that crossings in weekends and holidays are much more fre-quent then on working days. Groups were further divided according to the type of day (3rd stage ofstratification), so we ended up with the minimum number of 10 times 2 subgroups for each month.
68 IFC Bulletin 17 — February 2004
EXTENDED PAPERS
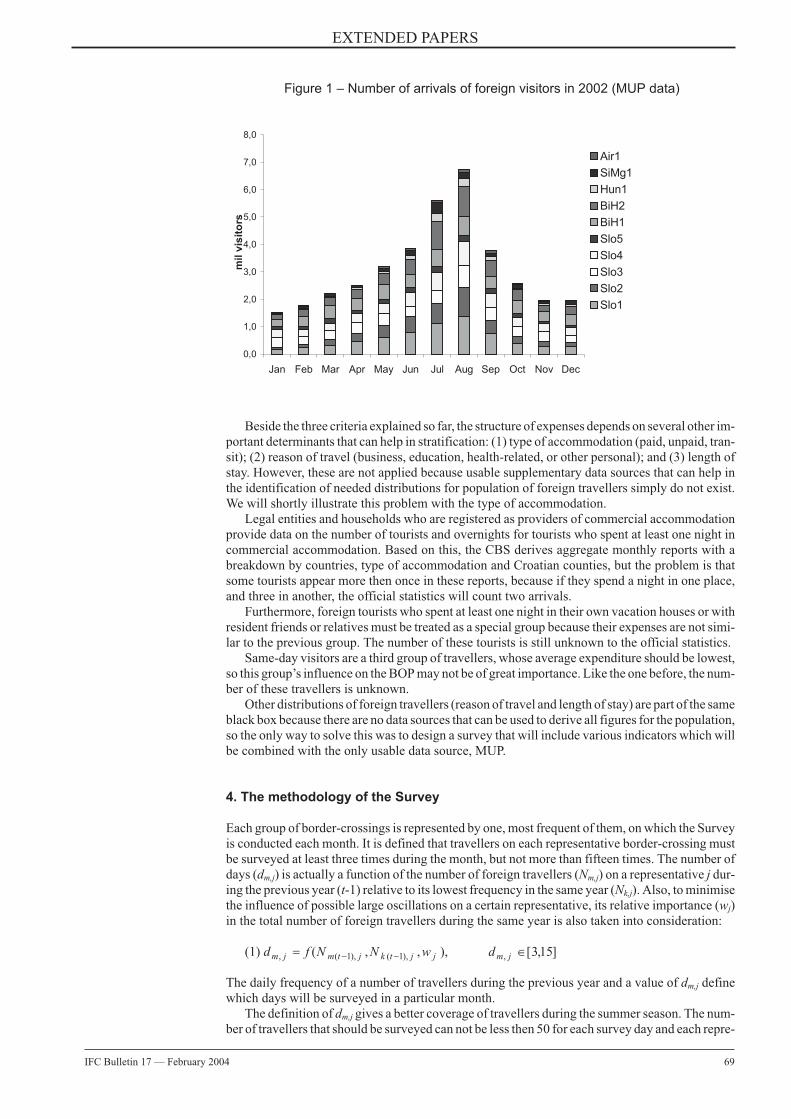
Beside the three criteria explained so far, the structure of expenses depends on several other im-portant determinants that can help in stratification: (1) type of accommodation (paid, unpaid, tran-sit); (2) reason of travel (business, education, health-related, or other personal); and (3) length ofstay. However, these are not applied because usable supplementary data sources that can help inthe identification of needed distributions for population of foreign travellers simply do not exist.We will shortly illustrate this problem with the type of accommodation.
Legal entities and households who are registered as providers of commercial accommodationprovide data on the number of tourists and overnights for tourists who spent at least one night incommercial accommodation. Based on this, the CBS derives aggregate monthly reports with abreakdown by countries, type of accommodation and Croatian counties, but the problem is thatsome tourists appear more then once in these reports, because if they spend a night in one place,and three in another, the official statistics will count two arrivals.
Furthermore, foreign tourists who spent at least one night in their own vacation houses or withresident friends or relatives must be treated as a special group because their expenses are not simi-lar to the previous group. The number of these tourists is still unknown to the official statistics.
Same-day visitors are a third group of travellers, whose average expenditure should be lowest,so this group’s influence on the BOP may not be of great importance. Like the one before, the num-ber of these travellers is unknown.
Other distributions of foreign travellers (reason of travel and length of stay) are part of the sameblack box because there are no data sources that can be used to derive all figures for the population,so the only way to solve this was to design a survey that will include various indicators which willbe combined with the only usable data source, MUP.
4. The methodology of the Survey
Each group of border-crossings is represented by one, most frequent of them, on which the Surveyis conducted each month. It is defined that travellers on each representative border-crossing mustbe surveyed at least three times during the month, but not more than fifteen times. The number ofdays (dm,j) is actually a function of the number of foreign travellers (Nm,j) on a representative j dur-ing the previous year (t-1) relative to its lowest frequency in the same year (Nk,j). Also, to minimisethe influence of possible large oscillations on a certain representative, its relative importance (wj)in the total number of foreign travellers during the same year is also taken into consideration:
(1) d f N N w dm j m t j k t j j m j, ( ), ( ), ,( , , ), [ , ]� �� �1 1 315
The daily frequency of a number of travellers during the previous year and a value of dm,j definewhich days will be surveyed in a particular month.
The definition of dm,j gives a better coverage of travellers during the summer season. The num-ber of travellers that should be surveyed can not be less then 50 for each survey day and each repre-
EXTENDED PAPERS
IFC Bulletin 17 — February 2004 69
Figure 1 – Number of arrivals of foreign visitors in 2002 (MUP data)
0,0
1,0
2,0
3,0
4,0
5,0
6,0
7,0
8,0
Jan Feb Mar Apr May Jun Jul Aug Sep Oct Nov Dec
mil
vis
ito
rs
Air1
SiMg1
Hun1
BiH2
BiH1
Slo5
Slo4
Slo3
Slo2
Slo1
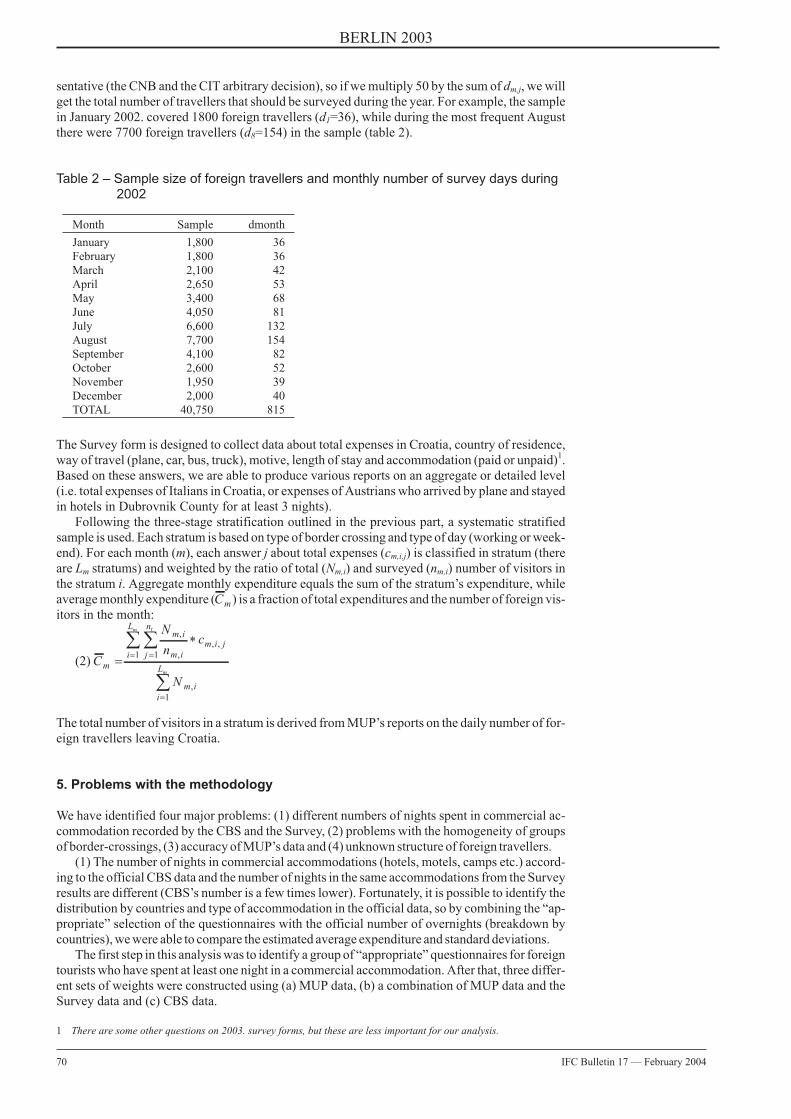
sentative (the CNB and the CIT arbitrary decision), so if we multiply 50 by the sum of dm,j, we willget the total number of travellers that should be surveyed during the year. For example, the samplein January 2002. covered 1800 foreign travellers (d1=36), while during the most frequent Augustthere were 7700 foreign travellers (d8=154) in the sample (table 2).
Table 2 – Sample size of foreign travellers and monthly number of survey days during2002
Month Sample dmonth
January 1,800 36February 1,800 36March 2,100 42April 2,650 53May 3,400 68June 4,050 81July 6,600 132August 7,700 154September 4,100 82October 2,600 52November 1,950 39December 2,000 40TOTAL 40,750 815
The Survey form is designed to collect data about total expenses in Croatia, country of residence,way of travel (plane, car, bus, truck), motive, length of stay and accommodation (paid or unpaid)1.Based on these answers, we are able to produce various reports on an aggregate or detailed level(i.e. total expenses of Italians in Croatia, or expenses of Austrians who arrived by plane and stayedin hotels in Dubrovnik County for at least 3 nights).
Following the three-stage stratification outlined in the previous part, a systematic stratifiedsample is used. Each stratum is based on type of border crossing and type of day (working or week-end). For each month (m), each answer j about total expenses (cm,i,j) is classified in stratum (thereare Lm stratums) and weighted by the ratio of total (Nm,i) and surveyed (nm,i) number of visitors inthe stratum i. Aggregate monthly expenditure equals the sum of the stratum’s expenditure, whileaverage monthly expenditure (Cm) is a fraction of total expenditures and the number of foreign vis-itors in the month:
(2) C
N
nc
Nm
m i
m im i j
j
n
i
L
m ii
L
Lm
m
�
�
��
�
,
,, ,
,
11
1
The total number of visitors in a stratum is derived from MUP’s reports on the daily number of for-eign travellers leaving Croatia.
5. Problems with the methodology
We have identified four major problems: (1) different numbers of nights spent in commercial ac-commodation recorded by the CBS and the Survey, (2) problems with the homogeneity of groupsof border-crossings, (3) accuracy of MUP’s data and (4) unknown structure of foreign travellers.
(1) The number of nights in commercial accommodations (hotels, motels, camps etc.) accord-ing to the official CBS data and the number of nights in the same accommodations from the Surveyresults are different (CBS’s number is a few times lower). Fortunately, it is possible to identify thedistribution by countries and type of accommodation in the official data, so by combining the “ap-propriate” selection of the questionnaires with the official number of overnights (breakdown bycountries), we were able to compare the estimated average expenditure and standard deviations.
The first step in this analysis was to identify a group of “appropriate” questionnaires for foreigntourists who have spent at least one night in a commercial accommodation. After that, three differ-ent sets of weights were constructed using (a) MUP data, (b) a combination of MUP data and theSurvey data and (c) CBS data.
70 IFC Bulletin 17 — February 2004
BERLIN 2003
1 There are some other questions on 2003. survey forms, but these are less important for our analysis.
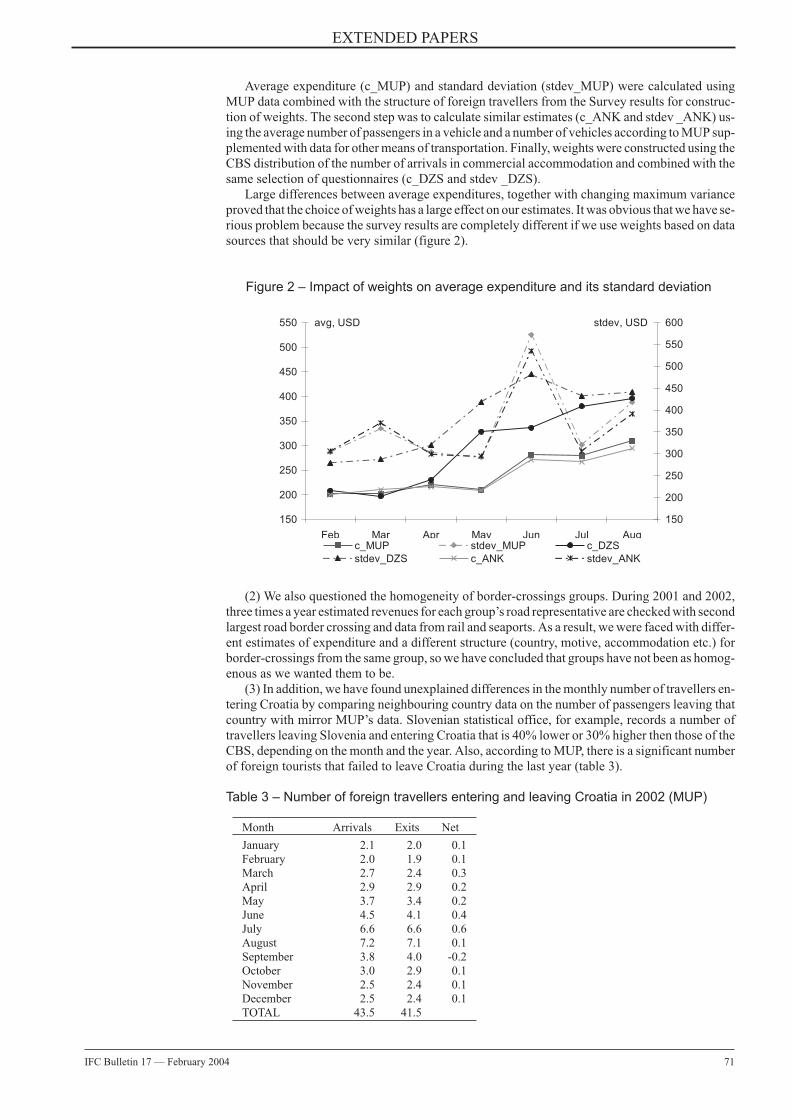
Average expenditure (c_MUP) and standard deviation (stdev_MUP) were calculated usingMUP data combined with the structure of foreign travellers from the Survey results for construc-tion of weights. The second step was to calculate similar estimates (c_ANK and stdev _ANK) us-ing the average number of passengers in a vehicle and a number of vehicles according to MUP sup-plemented with data for other means of transportation. Finally, weights were constructed using theCBS distribution of the number of arrivals in commercial accommodation and combined with thesame selection of questionnaires (c_DZS and stdev _DZS).
Large differences between average expenditures, together with changing maximum varianceproved that the choice of weights has a large effect on our estimates. It was obvious that we have se-rious problem because the survey results are completely different if we use weights based on datasources that should be very similar (figure 2).
Figure 2 – Impact of weights on average expenditure and its standard deviation
(2) We also questioned the homogeneity of border-crossings groups. During 2001 and 2002,three times a year estimated revenues for each group’s road representative are checked with secondlargest road border crossing and data from rail and seaports. As a result, we were faced with differ-ent estimates of expenditure and a different structure (country, motive, accommodation etc.) forborder-crossings from the same group, so we have concluded that groups have not been as homog-enous as we wanted them to be.
(3) In addition, we have found unexplained differences in the monthly number of travellers en-tering Croatia by comparing neighbouring country data on the number of passengers leaving thatcountry with mirror MUP’s data. Slovenian statistical office, for example, records a number oftravellers leaving Slovenia and entering Croatia that is 40% lower or 30% higher then those of theCBS, depending on the month and the year. Also, according to MUP, there is a significant numberof foreign tourists that failed to leave Croatia during the last year (table 3).
Table 3 – Number of foreign travellers entering and leaving Croatia in 2002 (MUP)
Month Arrivals Exits Net
January 2.1 2.0 0.1February 2.0 1.9 0.1March 2.7 2.4 0.3April 2.9 2.9 0.2May 3.7 3.4 0.2June 4.5 4.1 0.4July 6.6 6.6 0.6August 7.2 7.1 0.1September 3.8 4.0 -0.2October 3.0 2.9 0.1November 2.5 2.4 0.1December 2.5 2.4 0.1TOTAL 43.5 41.5
EXTENDED PAPERS
IFC Bulletin 17 — February 2004 71
150
200
250
300
350
400
450
500
550
Feb Mar Apr May Jun Jul Aug
avg, USD
150
200
250
300
350
400
450
500
550
600stdev, USD
c_MUP stdev_MUP c_DZS
stdev_DZS c_ANK stdev_ANK
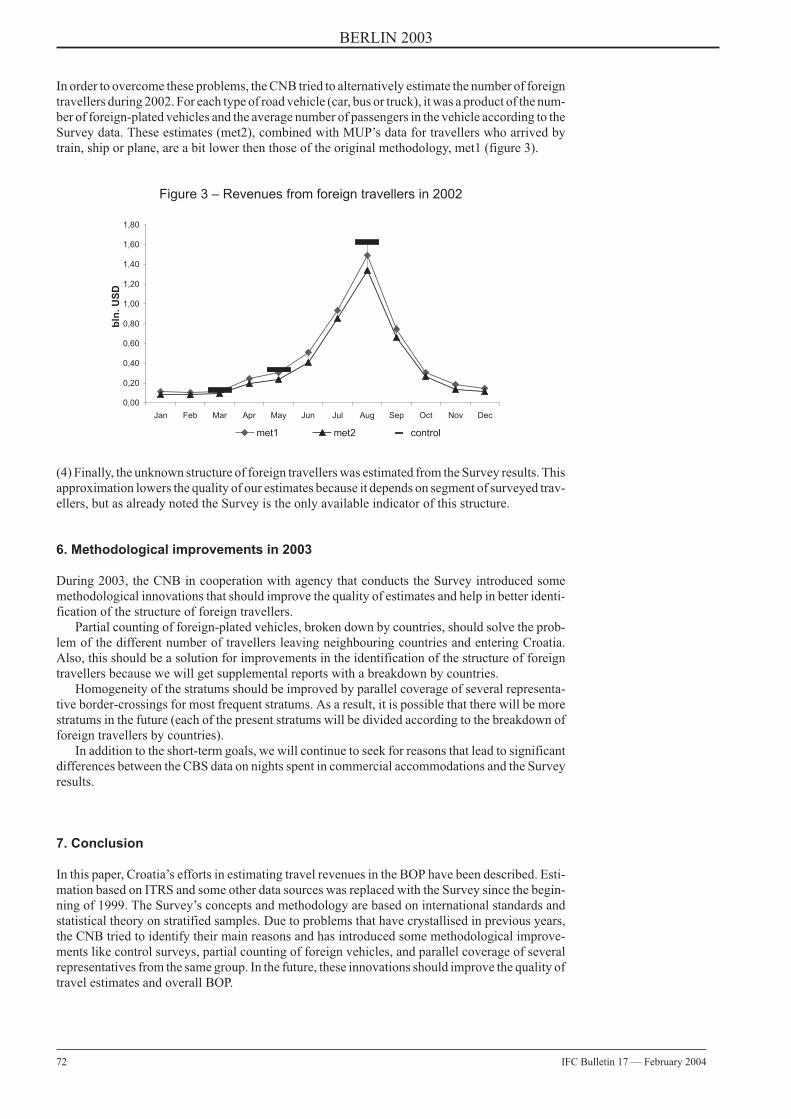
In order to overcome these problems, the CNB tried to alternatively estimate the number of foreigntravellers during 2002. For each type of road vehicle (car, bus or truck), it was a product of the num-ber of foreign-plated vehicles and the average number of passengers in the vehicle according to theSurvey data. These estimates (met2), combined with MUP’s data for travellers who arrived bytrain, ship or plane, are a bit lower then those of the original methodology, met1 (figure 3).
Figure 3 – Revenues from foreign travellers in 2002
(4) Finally, the unknown structure of foreign travellers was estimated from the Survey results. Thisapproximation lowers the quality of our estimates because it depends on segment of surveyed trav-ellers, but as already noted the Survey is the only available indicator of this structure.
6. Methodological improvements in 2003
During 2003, the CNB in cooperation with agency that conducts the Survey introduced somemethodological innovations that should improve the quality of estimates and help in better identi-fication of the structure of foreign travellers.
Partial counting of foreign-plated vehicles, broken down by countries, should solve the prob-lem of the different number of travellers leaving neighbouring countries and entering Croatia.Also, this should be a solution for improvements in the identification of the structure of foreigntravellers because we will get supplemental reports with a breakdown by countries.
Homogeneity of the stratums should be improved by parallel coverage of several representa-tive border-crossings for most frequent stratums. As a result, it is possible that there will be morestratums in the future (each of the present stratums will be divided according to the breakdown offoreign travellers by countries).
In addition to the short-term goals, we will continue to seek for reasons that lead to significantdifferences between the CBS data on nights spent in commercial accommodations and the Surveyresults.
7. Conclusion
In this paper, Croatia’s efforts in estimating travel revenues in the BOP have been described. Esti-mation based on ITRS and some other data sources was replaced with the Survey since the begin-ning of 1999. The Survey’s concepts and methodology are based on international standards andstatistical theory on stratified samples. Due to problems that have crystallised in previous years,the CNB tried to identify their main reasons and has introduced some methodological improve-ments like control surveys, partial counting of foreign vehicles, and parallel coverage of severalrepresentatives from the same group. In the future, these innovations should improve the quality oftravel estimates and overall BOP.
72 IFC Bulletin 17 — February 2004
BERLIN 2003
0,00
0,20
0,40
0,60
0,80
1,00
1,20
1,40
1,60
1,80
Jan Feb Mar Apr May Jun Jul Aug Sep Oct Nov Dec
met1 met2 control
bln
.U
SD
References
1. Croatian Institute for Tourism, Annual Report on Results of the Survey of Foreign Travellers in Croatia andCroatian Travellers Abroad, various issues.
2. European Commission, EUROSTAT (2000), Methodological manual on the design and implementation ofsurveys on inbound tourism, Luxembourg.
3. International Monetary Fund (1993), Balance of Payments Manual, 5th Editions, Washington.
4. OECD (1996), OECD Tourism Statistics: Design and Application for Policy, Paris.
5. PULS, 2002 Annual Report on Results of the Survey of Foreign Travellers in Croatia and Croatian Travel-lers Abroad.
Résumé
Dans cet article on présente la méthodologie et des problèmes d’estimation des revenues enregistrés dans labalance des paiements sous “voyages”. On identifie des problèmes de groupement des passages routières dela frontière, de choix des représentants des groupes, les différences entre les nombres officiels des touristes etles résultats de l’enquête. On a introduit une nouvelle méthode selon laquelle on a augmenté le nombre des re-présentants de chaque groupe pour contrôler les groupes qui existent déjà et pour créer des nouvelles grou-pes. La numération de contrôle de la circulation rendra possible une meilleure estimation de la structure destouristes selon les pays d’origines.
Branimir Gruiæ
Croatian National Bank, Statistics DepartmentP.O. Box 60310000 Zagreb, [email protected]
Igor Jemriæ
Croatian National Bank, Statistics DepartmentP.O. Box 60310000 Zagreb, [email protected]
EXTENDED PAPERS
IFC Bulletin 17 — February 2004 73
TRADE IN SERVICES
Multidimensional insights onItaly’s outbound business travel
Giovanni Giuseppe Ortolani and Andrea Alivernini(Ufficio Italiano dei Cambi) 1
1. Introduction2
This paper analyses Italy’s outbound business travel, which is defined as the economic and socialphenomenon constituted by the activities of Italian residents travelling abroad for professional rea-sons.
Considering both the business and non-business segment, the dimension of outgoing travel hassignificantly increased in Italy over the last two decades. The expenditure of Italian travellersabroad, which remained constantly around the level of 0.5% of country’s GDP in the period1970-1985, sharply increased in following years, reaching a level around 1.5% of GDP. Amongthe factors that supported this fast growth, a relevant role was played by the lift of exchange con-trols, completed in the second half of the 80s, the deregulation of air transport and the consequentreduction of average fares, a general spread of a positive attitude towards international travelling.
Business travel is an essential component of Italy’s outbound travel, both in monetary and inphysical terms. In 2001 the expenditures carried out by residents travelling for professional rea-sons accounted for 41% of the total outbound travel expenditure. In physical terms, 31% of resi-dents who travelled abroad in the same year, undertook the trips for professional reasons.
Business travel is considered a strategic segment. It is characterised by some positive features,the most relevant of which are:1. the average daily per capita expenditure of a business traveller is generally significantly larger
than that of leisure travellers. This gives rise to a more intense impact on the economy visitedfor a given level of exploitation of the resources (infrastructures, environment, etc.) and moreopportunities to generate value added.
2. the seasonal pattern of business travel is clearly opposed to that of personal travel: the formerslows down in summer and during weekends, when the latter is at its maximum. Thiscomplementarity implies that an appropriate mix of business and non-business travel is essen-tial to ensure an optimal utilisation of tourist fixed assets (accommodation establishments, car-riers, travel agencies, etc.).Nevertheless, the number of studies on business travel is less than proportional to the relative
size of the segment. Partially as a consequence of the reduced attention of researchers to the sub-ject, the elaboration of a theoretical paradigm is less progressed in the business travel area than inother areas of tourism demand.
2. Objectives and method of the study
The objective of this paper is to contribute with a study on Italy’s outbound business travel, an areaof the tourism sector that is still relatively neglected by researchers, compared to its magnitude.
As far as the method of the study is concerned, three points are essential:
74 IFC Bulletin 17 — February 2004
BERLIN 2003
1 Ufficio Italiano dei Cambi, Statistics Department. The views expressed in this paper are those of the authors and do notinvolve the responsibility of the Ufficio Italiano dei Cambi.
2 Although the overall responsibility for the paper is shared by the two authors, Giovanni Giuseppe Ortolani has writtenparagraphs 1, 2, and 3, while Andrea Alivernini has written paragraph 4. The authors are especially grateful toAntonello Biagioli and Pietro Mascelloni, of UIC’s Statistics Department, for useful discussions and comments at dif-ferent stages of the research.
a) The recognition of the lack of an acceptable theoretical paradigm, i.e. the practical unavailabil-ity of a model to test, led to the decision to use descriptive / exploratory tools rather than ex-planatory tools.
b) One of the basic assumptions is that business travel is not homogeneous, as motivations, ex-penditure patterns and behaviours differ from one sub-segment of the market to the other. Amulti-factor feature of the phenomenon is, therefore, also assumed: it suggested the adoptionof multidimensional approaches.
c) Consequently, the feasibility of the study relies on the availability of relevant and highlydisaggregated data. The source of data is constituted by the results of the Italian border surveyon international tourism. This extensive survey is carried out by the Ufficio Italiano dei Cambi(UIC) on a continuous basis through around 150,000 annual face-to-face interviews of a repre-sentative sample of both residents travelling abroad and non-residents travelling in Italy. Thisdatabase allows an in-depth investigation, thanks to the availability of a large number of obser-vations (around 900,000 face-to-face interviews from the start of the survey in 1996 until theend of 2001) on numerous qualitative and quantitative attributes, analytically describing thecharacteristics of travellers and their behaviour.
The study consists of two parts, both addressing the common objective of an exploratory and mul-tidimensional analysis of Italy’s outbound business travel market, but relying on two different sta-tistical tools and approaches. The reiteration of the analysis with different methods allows, throughthe cross-comparison of results, to point out the findings that appear more stable.
The specific objective of the first part is the identification of the essential features of the phe-nomenon. This is carried out by highlighting the most relevant relationships between the attributesdescribing travellers’ characteristics (e.g. sex, age, profession) and behaviour (e.g. length of stay,accommodation used, countries visited, Italian area of origin, level of expenditure). The microdatadrawn from the border survey are used as the input of a multiple correspondence analysis, whosemain outcome is a low-dimensional graphical representation of the large number of qualitative andquantitative attributes available in the UIC database.
The second part aims at identifying homogeneous groups of travellers according to the coun-tries of destination. To this end, hierarchical clustering analysis is used. Following a strategy com-monly followed with this type of statistical methods, various aggregation criteria are implementedin order to verify the robustness of the results.
The two approaches are generally classified in a common and specific category of statisticaltechniques, named data analysis. In the case of economics and other social sciences, data analysismethods realise a reduction of the complexity, through the elaboration of a synthesis.
The methods consist in a process of extraction, from a data matrix representing the phenome-non under investigation, of the main dimensions, structures of associations, relationships of prox-imity / opposition among the variables.
3. Application of multiple correspondence analysis
In investigating a given phenomenon, researchers very often treat data in the form of a two-dimen-sion matrix, in which rows represent the investigation units (or observations) and columns repre-sent the qualitative variables (or attributes) observed on the investigation units. Qualitative, ratherthan quantitative variables (that can be transformed into variables of the first type, by convertingcontinuous or discrete values into classes) are indicated here to generalise the applicability of thisdata structure.
Multiple correspondence analysis (MCA), which is an extension of (simple) correspondenceanalysis (CA) to the case of three or more attributes, was introduced with the specific objective oftackling the problem of the exploration of the relationships “hidden” in such data matrices. Thepurpose of MCA is in fact essentially that of allowing a simultaneous view on a set I of observa-tions and/or a set J of attributes. In other words, the approach aims at putting in geometric form thesystem of relationships existing:a) among the elements of one set (I) and the elements of the other set (J)
and / orb) among the elements of set I
and / orc) among the elements of set J.
EXTENDED PAPERS
IFC Bulletin 17 — February 2004 75
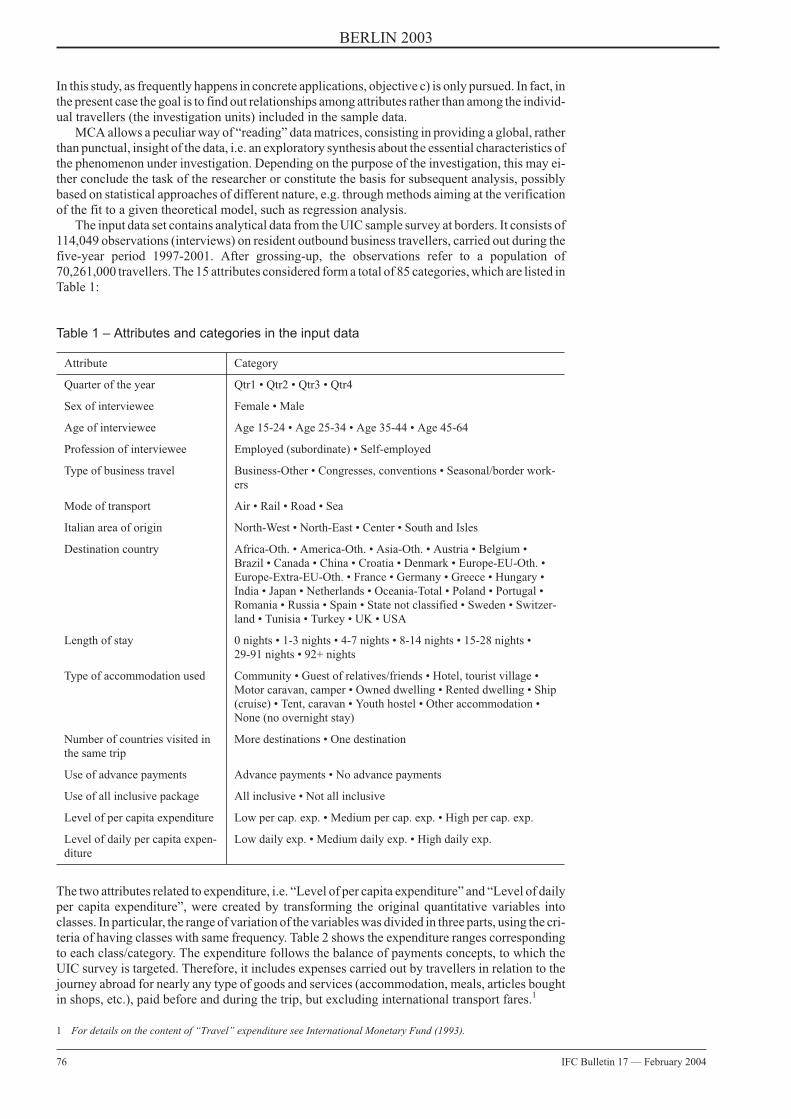
In this study, as frequently happens in concrete applications, objective c) is only pursued. In fact, inthe present case the goal is to find out relationships among attributes rather than among the individ-ual travellers (the investigation units) included in the sample data.
MCA allows a peculiar way of “reading” data matrices, consisting in providing a global, ratherthan punctual, insight of the data, i.e. an exploratory synthesis about the essential characteristics ofthe phenomenon under investigation. Depending on the purpose of the investigation, this may ei-ther conclude the task of the researcher or constitute the basis for subsequent analysis, possiblybased on statistical approaches of different nature, e.g. through methods aiming at the verificationof the fit to a given theoretical model, such as regression analysis.
The input data set contains analytical data from the UIC sample survey at borders. It consists of114,049 observations (interviews) on resident outbound business travellers, carried out during thefive-year period 1997-2001. After grossing-up, the observations refer to a population of70,261,000 travellers. The 15 attributes considered form a total of 85 categories, which are listed inTable 1:
Table 1 – Attributes and categories in the input data
Attribute Category
Quarter of the year Qtr1 • Qtr2 • Qtr3 • Qtr4
Sex of interviewee Female • Male
Age of interviewee Age 15-24 • Age 25-34 • Age 35-44 • Age 45-64
Profession of interviewee Employed (subordinate) • Self-employed
Type of business travel Business-Other • Congresses, conventions • Seasonal/border work-ers
Mode of transport Air • Rail • Road • Sea
Italian area of origin North-West • North-East • Center • South and Isles
Destination country Africa-Oth. • America-Oth. • Asia-Oth. • Austria • Belgium •Brazil • Canada • China • Croatia • Denmark • Europe-EU-Oth. •Europe-Extra-EU-Oth. • France • Germany • Greece • Hungary •India • Japan • Netherlands • Oceania-Total • Poland • Portugal •Romania • Russia • Spain • State not classified • Sweden • Switzer-land • Tunisia • Turkey • UK • USA
Length of stay 0 nights • 1-3 nights • 4-7 nights • 8-14 nights • 15-28 nights •29-91 nights • 92+ nights
Type of accommodation used Community • Guest of relatives/friends • Hotel, tourist village •Motor caravan, camper • Owned dwelling • Rented dwelling • Ship(cruise) • Tent, caravan • Youth hostel • Other accommodation •None (no overnight stay)
Number of countries visited inthe same trip
More destinations • One destination
Use of advance payments Advance payments • No advance payments
Use of all inclusive package All inclusive • Not all inclusive
Level of per capita expenditure Low per cap. exp. • Medium per cap. exp. • High per cap. exp.
Level of daily per capita expen-diture
Low daily exp. • Medium daily exp. • High daily exp.
The two attributes related to expenditure, i.e. “Level of per capita expenditure” and “Level of dailyper capita expenditure”, were created by transforming the original quantitative variables intoclasses. In particular, the range of variation of the variables was divided in three parts, using the cri-teria of having classes with same frequency. Table 2 shows the expenditure ranges correspondingto each class/category. The expenditure follows the balance of payments concepts, to which theUIC survey is targeted. Therefore, it includes expenses carried out by travellers in relation to thejourney abroad for nearly any type of goods and services (accommodation, meals, articles boughtin shops, etc.), paid before and during the trip, but excluding international transport fares.1
76 IFC Bulletin 17 — February 2004
BERLIN 2003
1 For details on the content of “Travel” expenditure see International Monetary Fund (1993).

Table 2 – Ranges used for the conversion of per capita and daily per capitaexpenditure into classes
Level of per capita expenditure Low per cap. exp. Less than 465 eurosMedium per cap. exp. 465 – 1402 eurosHigh per cap. exp. More than 1402 euros
Level of daily per capita expenditure Low daily exp. Less than 39 eurosMedium daily exp. 39 – 140 eurosHigh daily exp. More than 140 euros
We then start the analysis of the MCA output by looking at the inertia explained by each dimension(Table 3). With MCA, the maximum number of dimensions is given by c-k, where c is the numberof the columns (categories) of the binary matrix and k is the number of attributes: in our case it is 85– 15 = 70. Table 3 only reports 29 dimensions because of the use of the method of adjustment of theinertia of factors proposed in Benzécri (1979) in order to take into account the distinctive featuresof MCA compared to CA.
The adjusted inertia appears to be strongly concentrated on factor 1, which takes into accountby itself 87.8% of the total. This indicates that the association between categories is almost one-di-mensional. The first two factors explain together 93.9% of the variability of the phenomenon. Thissuggests to limit the analysis to these two dimensions, as the first factor plane will represent mostof the variability and, consequently, will allow a good approximation of the real spatial relation-ships between points.
In order to interpret the nature of these two dimensions, we first find out the categories that con-tribute most to the inertia of the factors. An abstract of the full list of indicators that aid the interpre-tation, tailored to the specific need of interpreting the character of factors, is reported in Table 4 andTable 5. They show, respectively, for dimension 1 and dimension 2 the ten categories with the larg-est partial contributions, along with the signs of their co-ordinates on the same dimensions.
From Table 4 we then derive that the direction of axis 1 is mostly determined by the oppositionof two groups of travellers, characterised by one or more of the following characteristics:• on the negative side, people who do not spend the night in the country visited (excursionists),
visiting Switzerland, with a low daily per capita expenditure;• on the positive side, people travelling by air, paying part of their expenses in advance to the jour-
ney, staying in hotels, with a medium-high level of expenditure.
It seems therefore that dimension 1 essentially opposes excursionists to high-spenders / overnightvisitors.
Table 5 suggests that factor 2 is mainly created by the opposition of the following two othergroups of travellers:• on the negative side of the axis, people who stay abroad for a relatively short period (1-3 nights),
coming from the North-East of Italy, using “Other accommodation” (in many cases a dwellingoffered for free by a firm abroad) and visiting Germany and Austria;
• on the positive side of the axis, people with a high expenditure per person, travelling by air, visit-ing the United States, staying abroad for a relatively long period (29-91 nights), of female sex.
Hence, dimension 2 seems to oppose, in the sub-segment of overnight stays, short to long dis-tance/duration trips. However, some justifications are required to explain the presence of the cate-gories “North-East”, “Other accommodation” and “Female”. In the case of the first two categoriesthe explanation of their crucial location on the negative part of dimension 2 comes from the associ-ation of these categories with short stays (1-3 nights).1 The relevant influence of “Female” on thepositive side is instead explained by the higher average length of stay for women, in the segment ofovernight visitors (15.3 nights, against 10.1 for men).
On the basis of this first hints we proceed with the analysis by looking at Figure 1, that showsthe plot of the point-categories on the first factor plane, in order to pursue the interpretation of di-mensions and the understanding of the overall structure of the cloud of points. To this end, the basicplot generated by the MCA algorithm has been integrated with two additional graphical aids, as itis illustrated in the following.
EXTENDED PAPERS
IFC Bulletin 17 — February 2004 77
1 The analysis of input data, i.e. the crosstabulation of the attributes ‘Italian area of origin’ and ‘Length of stay’ indicatesthat people coming from the North-East spend 1-3 nights abroad in 35.1% of the cases, against an average of 20.7%.Similarly, the crosstabulation of the attributes ‘Type of accommodation’ and ‘Length of stay’ indicates that people us-ing ‘Other accommodation’ stay there for 1-3 nights in 66.3% of the cases.
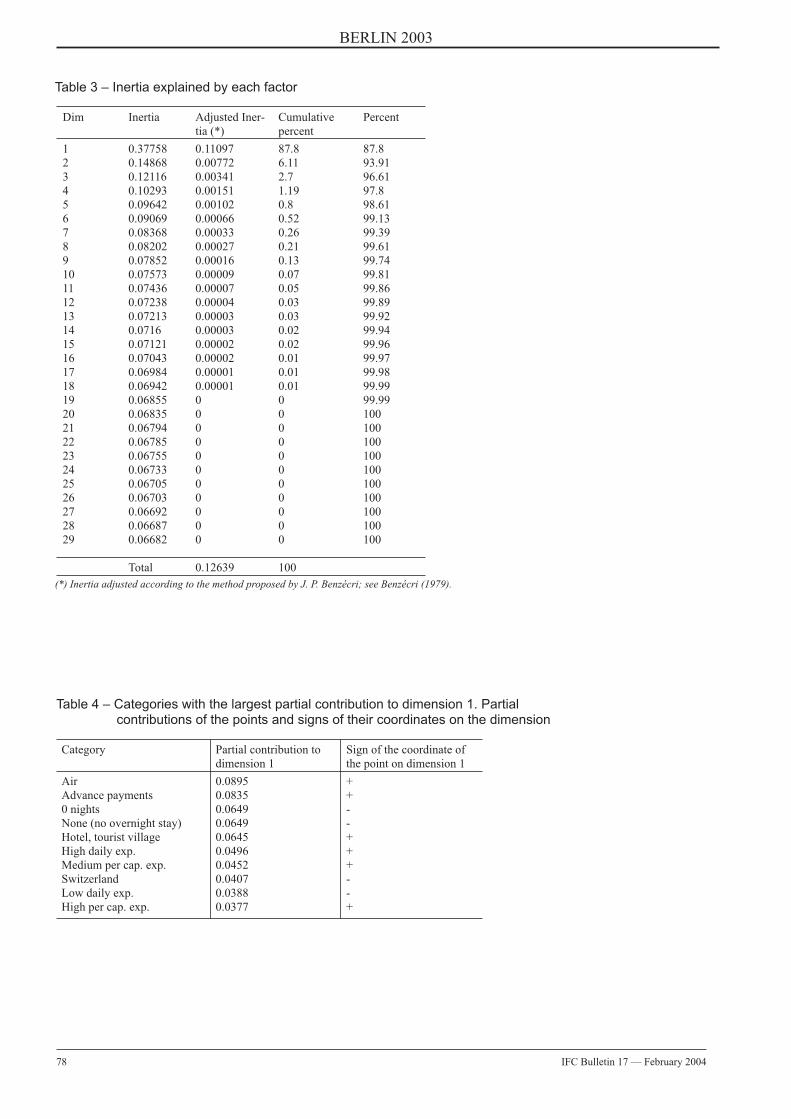
Table 4 – Categories with the largest partial contribution to dimension 1. Partialcontributions of the points and signs of their coordinates on the dimension
Category Partial contribution todimension 1
Sign of the coordinate ofthe point on dimension 1
Air 0.0895 +Advance payments 0.0835 +0 nights 0.0649 -None (no overnight stay) 0.0649 -Hotel, tourist village 0.0645 +High daily exp. 0.0496 +Medium per cap. exp. 0.0452 +Switzerland 0.0407 -Low daily exp. 0.0388 -High per cap. exp. 0.0377 +
78 IFC Bulletin 17 — February 2004
BERLIN 2003
Table 3 – Inertia explained by each factor
Dim Inertia Adjusted Iner-tia (*)
Cumulativepercent
Percent
1 0.37758 0.11097 87.8 87.82 0.14868 0.00772 6.11 93.913 0.12116 0.00341 2.7 96.614 0.10293 0.00151 1.19 97.85 0.09642 0.00102 0.8 98.616 0.09069 0.00066 0.52 99.137 0.08368 0.00033 0.26 99.398 0.08202 0.00027 0.21 99.619 0.07852 0.00016 0.13 99.7410 0.07573 0.00009 0.07 99.8111 0.07436 0.00007 0.05 99.8612 0.07238 0.00004 0.03 99.8913 0.07213 0.00003 0.03 99.9214 0.0716 0.00003 0.02 99.9415 0.07121 0.00002 0.02 99.9616 0.07043 0.00002 0.01 99.9717 0.06984 0.00001 0.01 99.9818 0.06942 0.00001 0.01 99.9919 0.06855 0 0 99.9920 0.06835 0 0 10021 0.06794 0 0 10022 0.06785 0 0 10023 0.06755 0 0 10024 0.06733 0 0 10025 0.06705 0 0 10026 0.06703 0 0 10027 0.06692 0 0 10028 0.06687 0 0 10029 0.06682 0 0 100
Total 0.12639 100
(*) Inertia adjusted according to the method proposed by J. P. Benzécri; see Benzécri (1979).
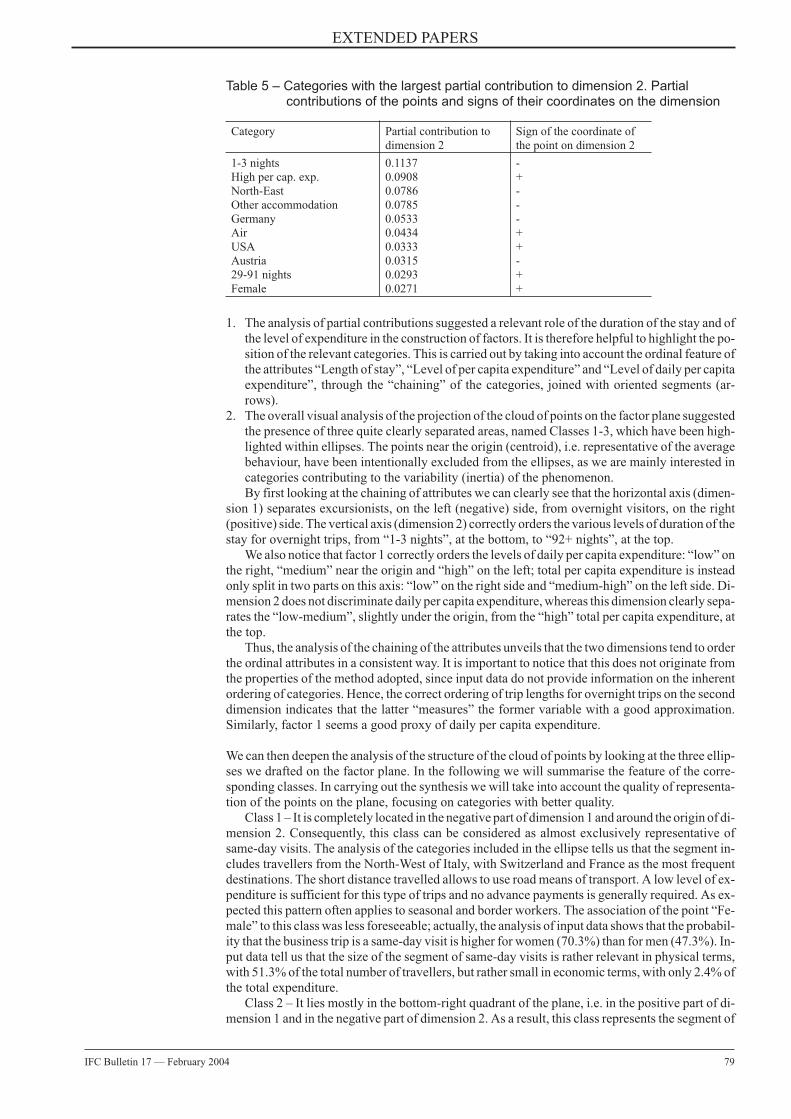
Table 5 – Categories with the largest partial contribution to dimension 2. Partialcontributions of the points and signs of their coordinates on the dimension
Category Partial contribution todimension 2
Sign of the coordinate ofthe point on dimension 2
1-3 nights 0.1137 -High per cap. exp. 0.0908 +North-East 0.0786 -Other accommodation 0.0785 -Germany 0.0533 -Air 0.0434 +USA 0.0333 +Austria 0.0315 -29-91 nights 0.0293 +Female 0.0271 +
1. The analysis of partial contributions suggested a relevant role of the duration of the stay and ofthe level of expenditure in the construction of factors. It is therefore helpful to highlight the po-sition of the relevant categories. This is carried out by taking into account the ordinal feature ofthe attributes “Length of stay”, “Level of per capita expenditure” and “Level of daily per capitaexpenditure”, through the “chaining” of the categories, joined with oriented segments (ar-rows).
2. The overall visual analysis of the projection of the cloud of points on the factor plane suggestedthe presence of three quite clearly separated areas, named Classes 1-3, which have been high-lighted within ellipses. The points near the origin (centroid), i.e. representative of the averagebehaviour, have been intentionally excluded from the ellipses, as we are mainly interested incategories contributing to the variability (inertia) of the phenomenon.By first looking at the chaining of attributes we can clearly see that the horizontal axis (dimen-
sion 1) separates excursionists, on the left (negative) side, from overnight visitors, on the right(positive) side. The vertical axis (dimension 2) correctly orders the various levels of duration of thestay for overnight trips, from “1-3 nights”, at the bottom, to “92+ nights”, at the top.
We also notice that factor 1 correctly orders the levels of daily per capita expenditure: “low” onthe right, “medium” near the origin and “high” on the left; total per capita expenditure is insteadonly split in two parts on this axis: “low” on the right side and “medium-high” on the left side. Di-mension 2 does not discriminate daily per capita expenditure, whereas this dimension clearly sepa-rates the “low-medium”, slightly under the origin, from the “high” total per capita expenditure, atthe top.
Thus, the analysis of the chaining of the attributes unveils that the two dimensions tend to orderthe ordinal attributes in a consistent way. It is important to notice that this does not originate fromthe properties of the method adopted, since input data do not provide information on the inherentordering of categories. Hence, the correct ordering of trip lengths for overnight trips on the seconddimension indicates that the latter “measures” the former variable with a good approximation.Similarly, factor 1 seems a good proxy of daily per capita expenditure.
We can then deepen the analysis of the structure of the cloud of points by looking at the three ellip-ses we drafted on the factor plane. In the following we will summarise the feature of the corre-sponding classes. In carrying out the synthesis we will take into account the quality of representa-tion of the points on the plane, focusing on categories with better quality.
Class 1 – It is completely located in the negative part of dimension 1 and around the origin of di-mension 2. Consequently, this class can be considered as almost exclusively representative ofsame-day visits. The analysis of the categories included in the ellipse tells us that the segment in-cludes travellers from the North-West of Italy, with Switzerland and France as the most frequentdestinations. The short distance travelled allows to use road means of transport. A low level of ex-penditure is sufficient for this type of trips and no advance payments is generally required. As ex-pected this pattern often applies to seasonal and border workers. The association of the point “Fe-male” to this class was less foreseeable; actually, the analysis of input data shows that the probabil-ity that the business trip is a same-day visit is higher for women (70.3%) than for men (47.3%). In-put data tell us that the size of the segment of same-day visits is rather relevant in physical terms,with 51.3% of the total number of travellers, but rather small in economic terms, with only 2.4% ofthe total expenditure.
Class 2 – It lies mostly in the bottom-right quadrant of the plane, i.e. in the positive part of di-mension 1 and in the negative part of dimension 2. As a result, this class represents the segment of
EXTENDED PAPERS
IFC Bulletin 17 — February 2004 79
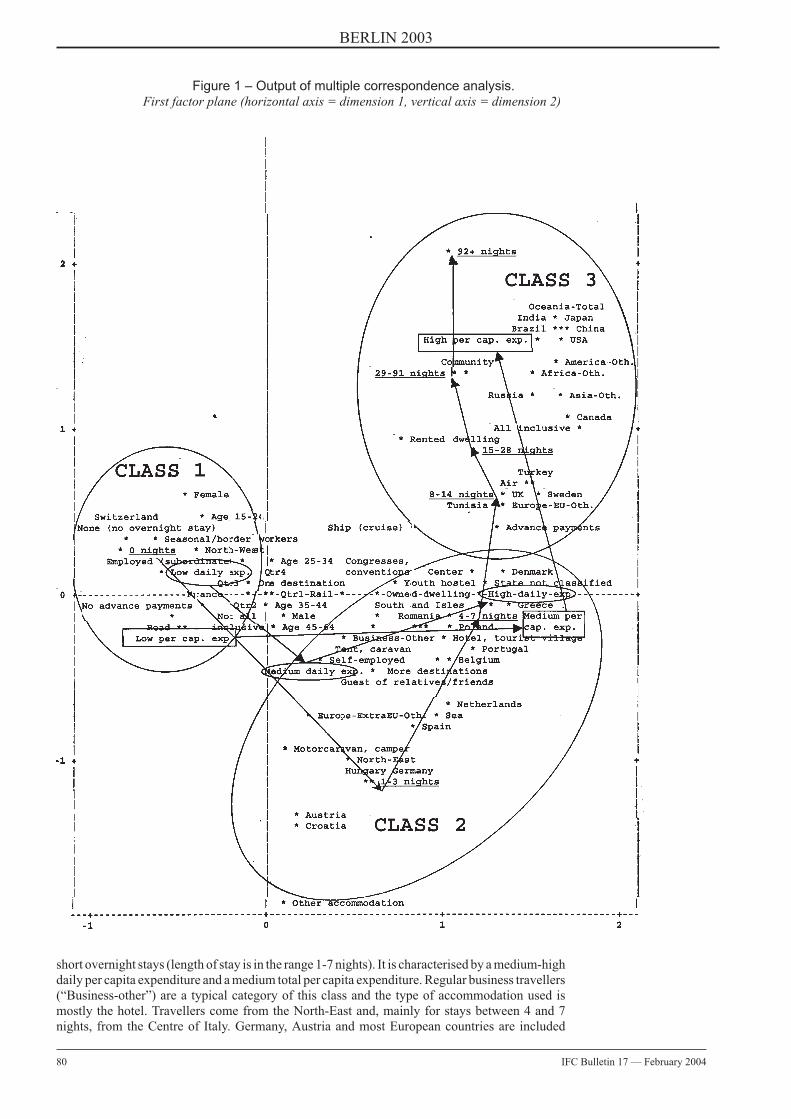
short overnight stays (length of stay is in the range 1-7 nights). It is characterised by a medium-highdaily per capita expenditure and a medium total per capita expenditure. Regular business travellers(“Business-other”) are a typical category of this class and the type of accommodation used ismostly the hotel. Travellers come from the North-East and, mainly for stays between 4 and 7nights, from the Centre of Italy. Germany, Austria and most European countries are included
80 IFC Bulletin 17 — February 2004
BERLIN 2003
Figure 1 – Output of multiple correspondence analysis.First factor plane (horizontal axis = dimension 1, vertical axis = dimension 2)
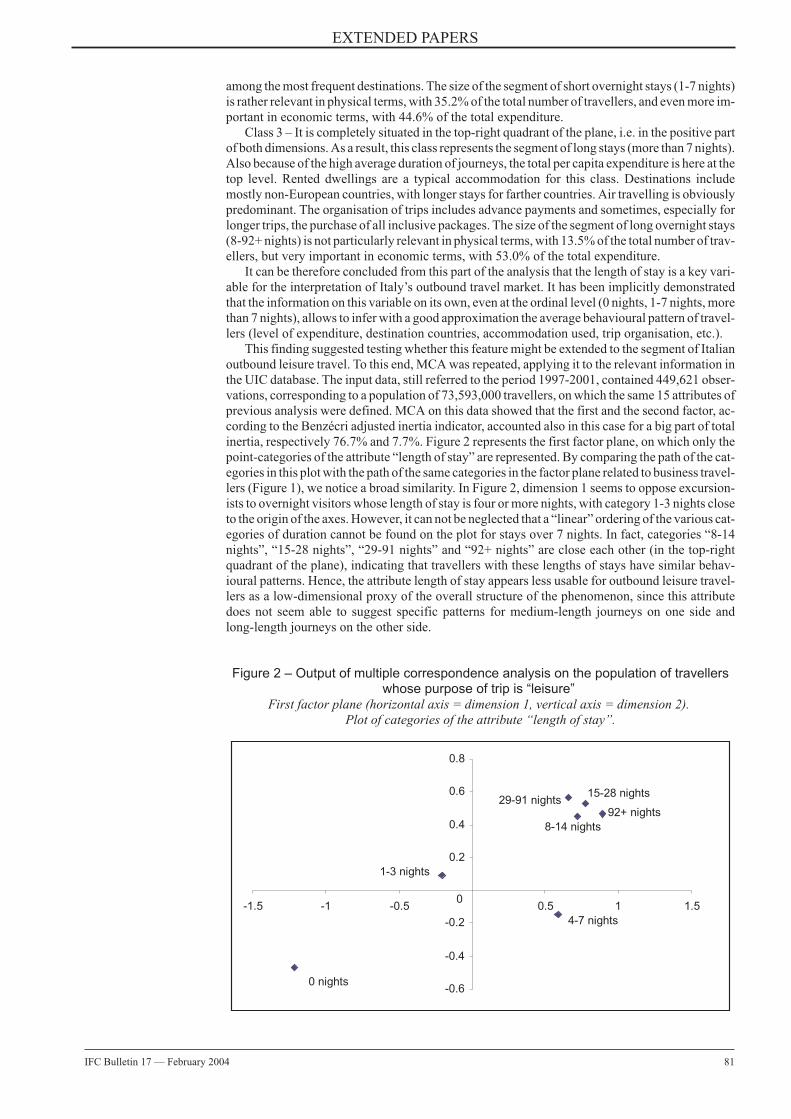
among the most frequent destinations. The size of the segment of short overnight stays (1-7 nights)is rather relevant in physical terms, with 35.2% of the total number of travellers, and even more im-portant in economic terms, with 44.6% of the total expenditure.
Class 3 – It is completely situated in the top-right quadrant of the plane, i.e. in the positive partof both dimensions. As a result, this class represents the segment of long stays (more than 7 nights).Also because of the high average duration of journeys, the total per capita expenditure is here at thetop level. Rented dwellings are a typical accommodation for this class. Destinations includemostly non-European countries, with longer stays for farther countries. Air travelling is obviouslypredominant. The organisation of trips includes advance payments and sometimes, especially forlonger trips, the purchase of all inclusive packages. The size of the segment of long overnight stays(8-92+ nights) is not particularly relevant in physical terms, with 13.5% of the total number of trav-ellers, but very important in economic terms, with 53.0% of the total expenditure.
It can be therefore concluded from this part of the analysis that the length of stay is a key vari-able for the interpretation of Italy’s outbound travel market. It has been implicitly demonstratedthat the information on this variable on its own, even at the ordinal level (0 nights, 1-7 nights, morethan 7 nights), allows to infer with a good approximation the average behavioural pattern of travel-lers (level of expenditure, destination countries, accommodation used, trip organisation, etc.).
This finding suggested testing whether this feature might be extended to the segment of Italianoutbound leisure travel. To this end, MCA was repeated, applying it to the relevant information inthe UIC database. The input data, still referred to the period 1997-2001, contained 449,621 obser-vations, corresponding to a population of 73,593,000 travellers, on which the same 15 attributes ofprevious analysis were defined. MCA on this data showed that the first and the second factor, ac-cording to the Benzécri adjusted inertia indicator, accounted also in this case for a big part of totalinertia, respectively 76.7% and 7.7%. Figure 2 represents the first factor plane, on which only thepoint-categories of the attribute “length of stay” are represented. By comparing the path of the cat-egories in this plot with the path of the same categories in the factor plane related to business travel-lers (Figure 1), we notice a broad similarity. In Figure 2, dimension 1 seems to oppose excursion-ists to overnight visitors whose length of stay is four or more nights, with category 1-3 nights closeto the origin of the axes. However, it can not be neglected that a “linear” ordering of the various cat-egories of duration cannot be found on the plot for stays over 7 nights. In fact, categories “8-14nights”, “15-28 nights”, “29-91 nights” and “92+ nights” are close each other (in the top-rightquadrant of the plane), indicating that travellers with these lengths of stays have similar behav-ioural patterns. Hence, the attribute length of stay appears less usable for outbound leisure travel-lers as a low-dimensional proxy of the overall structure of the phenomenon, since this attributedoes not seem able to suggest specific patterns for medium-length journeys on one side andlong-length journeys on the other side.
Figure 2 – Output of multiple correspondence analysis on the population of travellerswhose purpose of trip is “leisure”
First factor plane (horizontal axis = dimension 1, vertical axis = dimension 2).Plot of categories of the attribute “length of stay”.
EXTENDED PAPERS
IFC Bulletin 17 — February 2004 81
-0.6
-0.4
-0.2
0
0.2
0.4
0.6
0.8
-1.5 -1 -0.5 0.5 1 1.5
0 nights
1-3 nights
8-14 nights
15-28 nights
4-7 nights
29-91 nights92+ nights
In the following paragraph the results related to business travellers will be further tested, by apply-ing a different method and focusing on the variable “destination country”. The continuation of thestudy will provide a more in-depth insight on this variable, which could not be represented in detailon the factor plane illustrated in this paragraph. In fact, apart from biggest partners (Switzerland,Germany, USA), point-countries showed a quite low quality of representation.
4. The cluster analysis approach
4.1. Overview
Classification problems are frequent in most behavioural analysis: reality is not always easy tosynthesise, particularly in absence of an interpretative model to apply to data. In addition, when thenumber of classification variables is large (this is the general case of socio-economic sciences),difficulty strongly increases. Cluster analysis is the main statistical method attempting to solveclassification problems with many variables. The grouping is only dependent on data, without anydistribution hypothesis.
In this section of the paper, a hierarchical clustering method is used, in order to assess the iden-tification of homogeneous groups of Italian business travellers according to the visited countries.The analysis should bear out the results found in the correspondence analysis issued in the previ-ous paragraph, particularly the dependence of Italian business travellers’ patterns of behaviourmainly on the length of stay and its correlated characteristics. A graphical representation of hierar-chical cluster analysis results, called dendrogram, is produced. In a two-dimensional plane, aggre-gations between statistical units and aggregation distance levels are plotted on the two axes, up tothe making of one only cluster.
4.2. Cluster analysis: the adopted method
The purpose of cluster analysis is to place observations into groups or clusters suggested by thedata, not defined a priori, such that observations in a given cluster tend to be similar to each other insome sense – whose meaning may be vague – and observations in different clusters tend to be dis-similar.
The degree of similarity is given by a distance measure: groups are formed by observationshaving minimum distance among themselves. Among the several methods of the cluster analysisavailable, Ward’s method is preferable in this work for these reasons:• the distance between two clusters – in Ward’s method – is the ANOVA sum of squares between
the two clusters added up over all the variables. At each generation, the within-cluster sum ofsquares is minimised over all partitions obtainable by merging two clusters from the previousgeneration. At the starting point, when each observation makes up one cluster, the be-tween-clusters deviance is 0; on the contrary, when all the units are joined in one cluster, be-tween deviance is maximum (equal to the total sum of squares of the observations). Dividing thewithin-clusters sum of squares by the overall sum of squares, proportion of variance explained(R2) is obtained.
• Ward’s method tends to join clusters with a small number of observations; for this reason (theanalysis aims at pointing out groups of countries rather than single states) it is preferable com-pared with other cluster analysis methods.
4.3. Input data
The analysis is based on a transformation of the binary matrix used in the previous paragraph forthe application of MCA. The binary matrix has been first converted in the form of a Burt table. TheBurt table is a matrix, also two-dimensional, containing all pairs of crosstabulations among the setof attributes in raw data (in our case, all the categorical variables). In order to obtain consistent re-sults – i.e. studying the behaviour of Italian travellers according to the state of destination – theBurt table has been modified in this way:• only rows referred to countries of destination were maintained;1
• columns referred to countries were eliminated.
82 IFC Bulletin 17 — February 2004
BERLIN 2003
1 The category ‘State not classified’ has been dropped from the analysis for its scarce operational significance.
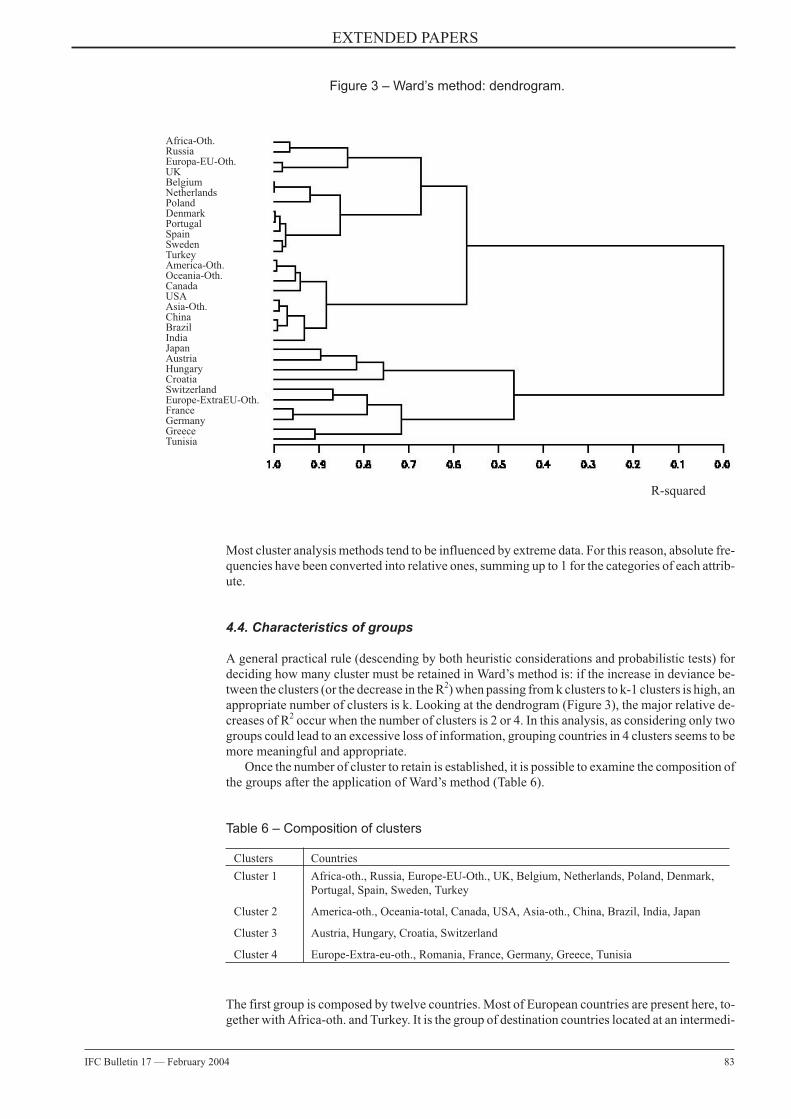
Most cluster analysis methods tend to be influenced by extreme data. For this reason, absolute fre-quencies have been converted into relative ones, summing up to 1 for the categories of each attrib-ute.
4.4. Characteristics of groups
A general practical rule (descending by both heuristic considerations and probabilistic tests) fordeciding how many cluster must be retained in Ward’s method is: if the increase in deviance be-tween the clusters (or the decrease in the R2) when passing from k clusters to k-1 clusters is high, anappropriate number of clusters is k. Looking at the dendrogram (Figure 3), the major relative de-creases of R2 occur when the number of clusters is 2 or 4. In this analysis, as considering only twogroups could lead to an excessive loss of information, grouping countries in 4 clusters seems to bemore meaningful and appropriate.
Once the number of cluster to retain is established, it is possible to examine the composition ofthe groups after the application of Ward’s method (Table 6).
Table 6 – Composition of clusters
Clusters Countries
Cluster 1 Africa-oth., Russia, Europe-EU-Oth., UK, Belgium, Netherlands, Poland, Denmark,Portugal, Spain, Sweden, Turkey
Cluster 2 America-oth., Oceania-total, Canada, USA, Asia-oth., China, Brazil, India, Japan
Cluster 3 Austria, Hungary, Croatia, Switzerland
Cluster 4 Europe-Extra-eu-oth., Romania, France, Germany, Greece, Tunisia
The first group is composed by twelve countries. Most of European countries are present here, to-gether with Africa-oth. and Turkey. It is the group of destination countries located at an intermedi-
EXTENDED PAPERS
IFC Bulletin 17 — February 2004 83
Figure 3 – Ward’s method: dendrogram.
R-squared
Africa-Oth.RussiaEuropa-EU-Oth.UKBelgiumNetherlandsPolandDenmarkPortugalSpainSwedenTurkeyAmerica-Oth.Oceania-Oth.CanadaUSAAsia-Oth.ChinaBrazilIndiaJapanAustriaHungaryCroatiaSwitzerlandEurope-ExtraEU-Oth.FranceGermanyGreeceTunisia
ate distance from Italy (neighbouring countries are clustered in other groups). As it is shown in Ta-ble 7, group 1 is characterised by a high level of average length of stay and per capita expenditure,and by a medium-low daily per capita expenditure. There are almost only overnight visitors in thiscluster (see Table 8). The analysis of input data shows that more than two thirds of Italian travellersof this cluster visit Spain, UK and Africa.
Table 7 – Characteristics of clusters: expenditure (global, per capita and daily),number of travellers, number of nights and average length of stay. Italianoutbound business travellers, years 1997-2001
Clusters Expendi-ture(mln.euros)
Number oftravellers(x1000)
Number ofnights(x1000)
Averagelength ofstay (days)
Per capitaexpenditure(euros)
Daily per capitaexpenditure(euros)
Cluster 1 7,848 8,282 100,945 12.2 947.54 77.74
Cluster 2 12,317 5,577 94,270 16.9 2208.54 130.66
Cluster 3 2,446 29,336 36,740 1.3 83.37 66.57
Cluster 4 8,591 26,936 130,509 4.8 318.92 65.82
Total 31,201 70,132 362,464 5.2 444.90 86.08
The second cluster includes nine elements, exclusively extra-European countries or zones at thelargest distance from Italy. In this cluster, the countries in which Italian travellers stay and spendthe most are present, both in absolute and in average terms. Input data reveal that this is especiallytrue for Japan and China. The group presents the highest percentage of self-employed and maletravellers. Obviously, excursionists are not included.
However, excluding the length of stay and the expenditure, the difference between the first andsecond cluster is rather small. Travellers in the two groups are characterised by almost the samedistribution as regards profession, sex and type of visitor. This is confirmed by the proximity of thetwo clusters in the dendrogram: the union between 1st and 2nd cluster is the next union after fourclusters.
Table 8 – Percentage composition of travellers by profession, sex and type of visitor.Italian outbound business travellers, years 1997-2001
Profession Sex Type of visitor
Employed(subordinate)
Self-employed
Male Female Excursionist Overnightvisitor
Cluster 1 69.3% 30.7% 90.2% 9.8% 0.3% 99.7%
Cluster 2 66.6% 33.4% 91.0% 9.0% 0.0% 100.0%
Cluster 3 74.6% 25.4% 76.5% 23.5% 18.0% 82.0%
Cluster 4 67.9% 32.1% 89.0% 11.0% 3.3% 96.7%
Total 70.8% 29.2% 84.1% 15.9% 2.4% 97.6%
The third cluster is composed by four European countries, neighbouring or relatively near Italy. Itis the cluster with the largest number of travellers and the lowest global expenditure. Input datashow that most travellers in this group go to Switzerland and a relevant part of them are excursion-ists. It is also the cluster with the highest frequency of subordinate workers and women.
The peculiarity of the fourth cluster is its hybrid composition. It merges five European coun-tries – including among the others “big” destinations as France and Germany – and Tunisia. Frominput data it is derived that the weight of travellers towards France, Germany and Slovenia is pre-vailing, with the last country included in “Europe-Extra-eu-oth.” The countries are therefore allrelatively close to Italy: this allows the possibility of having excursionists in the group. The coun-tries of this cluster are somewhat heterogeneous. Therefore, in this case the group seems to origi-nate from an average of different situations rather than from homogeneous patterns. This is evidentfrom the dendrogram: with the exception of France and Germany, countries of cluster 4 aggregateat a relatively high level.
84 IFC Bulletin 17 — February 2004
BERLIN 2003

4.5. Robustness of results
In order to test the stability and the robustness of the analysis, three other hierarchicalagglomerative clustering methods have been applied to the data. The objective of this paragraph isto show that the change of clustering method does not radically alter the composition of the fourclusters found with Ward’s method.
In Table 9 below, the countries included in the four clusters with each method are reported. It isclear how single and average methods tend to group observations in chain, forming one big cluster(including most countries) and several clusters consisting of few observations. Nevertheless, it ispossible to judge the robustness of the clustering method adopted, looking at the composition ofclusters produced by each method.
It is quite clear that the structure of the partition obtained with Ward’s method is as well trace-able when other clustering methods are adopted, i.e. countries grouped in the same cluster with theformer method tend to be joined together if another clustering method is applied: the robustness ofthe analysis can be inferred.
Table 9 – Country composition of clusters by method of clustering
5. Conclusions
The first part of the study, through the application of the multiple correspondence analysis ap-proach, suggests that the multidimensional structure of the Italian outbound business travel marketcan be efficiently summarised in its fundamental features by a single variable: the length of stay.This finding implies relevant operative applications, as the information on the length of stay, evenat the ordinal level (0 nights, 1-7 nights, more than 7 nights), would make possible to deduce thewhole behavioural pattern of travellers (level of expenditure, destination countries, accommoda-tion used, trip organisation, etc.), with a loss of precision still acceptable in specific domains. Theanalysis also shows that the major role of this variable seems to be specific of the business travelsegment, as for leisure travel its “explanatory” potentiality appears to be weaker.
EXTENDED PAPERS
IFC Bulletin 17 — February 2004 85
Ward Complete Average Single
Cluster 1 Africa-oth., Russia,Europe-EU-oth.,UK, Belgium,Netherlands, Poland,Denmark, Portugal,Spain, Sweden,Turkey
Africa-oth., Russia,Europe-EU-oth.,UK, Belgium,Netherlands, Poland,Denmark, Portugal,Spain, Sweden,Turkey, Greece,Tunisia
Africa-oth., Russia,Europe-EU-oth.,UK, Belgium,Netherlands,Denmark, Portugal,Spain, Sweden,Turkey,America-oth.,Oceania-total,Asia-oth., China,Brazil, India,Canada, USA, Japan
Africa-oth., Russia,Europe-EU-oth., UK,Belgium,Netherlands, Poland,Denmark, Portugal,Spain, Sweden,Turkey,America-oth.,Oceania-total,Canada, USA,Asia-oth., China,Brazil, India, Japan,Europe-Extra EU-oth,Romania, France,Germany, Greece,Tunisia
Cluster 2 America-oth.,Oceania-total,Canada, USA,Asia-oth., China,Brazil, India, Japan
Romania, France,Germany,Europe-Extra EU-oth.
Europe-Extra EU-oth.,France, Germany,Romania, Greece,Tunisia
Croatia
Cluster 3 Austria, Hungary,Croatia, Switzerland
America-oth.,Oceania-total,Canada, USA,Asia-oth., China,Brazil, India, Japan
Austria, Hungary,Croatia
Austria, Hungary
Cluster 4 Europe-Extra EU-oth.,Romania, France,Germany, Greece,Tunisia
Austria, Hungary,Croatia, Switzerland
Switzerland Switzerland
The major importance of the variable “length of stay”, and consequently the distance of foreigncountries from Italy, seems to be confirmed by the application of cluster analysis in the second partof the study. In most clusters, countries having similar physical distance are grouped. Moreover,the aggregation between countries geographically close each other occurs at the lowest levels ofdistance. The choice of the number of clusters is studied from a methodological point of view. Bothheuristic and probabilistic reasons suggest the adoption of four clusters. The robustness of themethod adopted is checked through the analysis of the different composition of clusters producedwith the various clustering methods. The methods applied confirm that the partition induced byWard’s clustering algorithm is substantially stable.
These findings may be further developed. A first direction of study could consist in the testingof the role of the variable ‘length of stay’ for other market segments, i.e. inbound business travel,outbound business travel of other countries, etc. Alternatively, still in the domain of outboundbusiness travel, the classification of countries of destinations could be used in a study of the deter-minants of the country’s global business travel expenditure from a macro-economic standpoint.Business travel expenditure could be explained by variables such as GDP, foreign direct invest-ments, goods and services import/export of both origin and destination areas. The latter could beclassified according to the clusters identified in this research, rather than by individual country, inorder to increase the significance of the model.
References
Benzécri, J.P. (1973), L’Analyse des Données: Tome 2, l’Analyse des Correspondances, Paris.
Benzécri, J.P. (1979), “Sur le Calcul des taux d’inertie dans l’analyse d’un questionaire”, Cahiers del’Analyse des Données, 4, 377-378.
Greenacre, M.J. (1984), Theory and Applications of Correspondence Analysis, London.
Hoffman, D.L. and Franke, G.R. (1986), “Correspondence Analysis: Graphical Representation of Categori-cal Data in Marketing Research,” Journal of Marketing Research, 23, 213-227.
International Monetary Fund (1993), Balance of Payments Manual – Fifth Edition, Washington DC.
Litteljohn, D. (2001), “Business Travel Markets: New Paradigms, New Information Needs?” in J.J. Lennon(ed), Tourism Statistics. International Perspectives and Current Issues, 105-124.
Ward, J.H. (1963), “Hierarchical Grouping to Optimize an Objective Function,” Journal of the American Sta-tistical Association, 58, 236-244.
Abstract
Business tourism is a relevant segment of Italy’s outbound tourism. This paper attempts to outline its funda-mental features by exploiting the potentialities of statistical tools for multidimensional analysis.
The lack of a theoretical framework suggested the adoption of exploratory – rather than explanatory –statistical tools. The source of data is constituted by the results of the extensive UIC (Ufficio Italiano deiCambi) inbound-outbound border survey on international tourism.
In the first part of the paper, data are submitted to a multiple correspondence analysis. This allows theidentification of the essential features of the phenomenon, leading to the conclusion that the multidimensionalstructure of the Italian outbound business travel market can be efficiently summarised in its fundamental fea-tures by a single variable: the length of stay.
The second part aims at identifying homogeneous groups of travellers according to the countries of desti-nation. To this end, Ward’s hierarchical clustering technique is used (the application of other clustering meth-ods verifies the robustness of the results). The analysis confirms that the duration of the stay is the key variableof the phenomenon.
Giovanni Giuseppe [email protected]
Andrea [email protected]
Ufficio Italiano dei Cambi, Statistics DepartmentVia delle Quattro Fontane, 12300184, Roma, Italy
86 IFC Bulletin 17 — February 2004
BERLIN 2003
THE USE OF SURVEYS INFINANCIAL STATISTICS
Sample surveys at the Bank of Italy
Raffaele Tartaglia Polcini (Banca d’Italia) 1
1. Description of the surveys conducted by the Bank’s Research Department
The Research Department of the Bank of Italy is directly responsible for the implementation ofsome regular surveys on households and businesses. These surveys complement the other sourcesof financial data available from the databases on the credit sector.
(i) Survey of Household Income and Wealth (SHIW)
The survey is carried on since 1965 (micro-data are available from 1977 on) with the purpose of ac-quiring information on the economic behaviour of households. The main topics investigated areincome, wealth, consumption, means of payment. This survey was conducted on an annual basisuntil 1984, then every two years (with the exception of 1998). The sample consists of 8,000 house-holds living in 300 municipalities, drawn by a population of approximately 19 million households.Data are collected from the households by a market research firm by means of personal interviews(using CAPI). A report containing the main results of the survey is published. Anonymizedmicrodata and a full documentation are also provided to the public (through a CD-ROM and theInternet2) for research purposes only.
Recent economic studies based on this survey cover: the household real and financial assetsalso from a historical point of view; risk aversion, wealth and financial market imperfections; thedynamics of household wealth accumulation; payment systems used by the households; geograph-ical gaps in interest rates; tax evasion. The financial section of the survey has been extensively ex-ploited also for studies on the financial structure of the Italian economy.
(ii) Survey of the investments of industrial firms
The survey is carried on since 1984 on an annual basis (in Spring) with the aim of acquiring preciseinformation on the economic behaviour of enterprises. Main topics are investments, turnover, em-ployment and information on the financial structure of the firms, including self-financing.
Until 1999 only enterprises in the manufacturing industry with 50+ employees were inter-viewed. In the most recent years the sample has grown from 1,000 to 2,800 units, both to allowmore precise estimates at the sub-area level and to include “small” enterprises (20-49 employees).Thus we limit our interest to firms with 20+ employees, for evident reasons of timing and re-sources.
The sample is one-stage, stratified by size (no. of employees) and sector of economic activity.The technique used to build up the sample is modelled on Neyman’s optimal allocation to strata,where the size of each stratum is taken proportional both to the sampling fraction and to the vari-ability within the stratum. The Bank branches directly collect data. The main results are publishedin the Bank’s Annual Report.
Main economic studies based on this survey cover: the financial structure of the borrowing ofthe firms, credit rationing, trade credits; investments and demand uncertainty; time, labour andwage flexibility in the Italian industrial sector.
IFC Bulletin 17 — February 2004 87
EXTENDED PAPERS
1 The opinions expressed in this paper are the author’s own and do not necessarily reflect those of the Bank of Italy.2 http://www.bancaditalia.it.
(iii) Survey of the services sector
This survey started in 2003 as we felt the growing importance of the service sector and needed tostart handling also microdata of services firms to meet our economists’ research needs. Bank andinsurance services, social services (health, schooling) are excluded from the survey. Also in thiscase we limit our focus to firms with 20+ employees. The sample comprises initially some 1,000sampling units.
This new survey is run under the same scheme as the survey of industrial firms (one-stage strat-ified with Neyman’s allocation). Also in this case the Bank branches directly collect data. Themain results are published in the Bank’s Annual Report.
(iv) Survey on the short-term economic outlook
The survey is carried on since 1992 on a annual basis (in Autumn) with the aim of acquiring infor-mation on the short-term trends of exports, investments, prices, turnover, demand, profits, wagesand employment. This survey contains only qualitative questions, most of them on short-term ex-pectations, so that analysis tables contain exclusively percentages.
The original sample was of some 600 industrial firms; in the last three years it grew up to 2,600and from 2003 it is fully coincident with the sum of the samples used for the surveys of industrialand services businesses (ca. 3,800 firms). This survey can thus be seen as a “fast update” of the re-sults of those surveys (the interviews of which take place in Spring instead).
Results are made available to our researchers in two weeks’ time from the end of the interviews(conducted by our branches through telephone interviews) and are published and analysed in adedicated box on the Fall edition of the Bank of Italy’s Economic Bulletin.
(v) Survey on expectations of inflation and growth
The survey is conducted quarterly from 1999 in co-operation with “Il Sole 24 Ore” (the most im-portant Italian financial newspaper). Information are collected on consumer inflation expectations(both in Italy and in the Euro area), on the expected variations of the firm prices and further aspectsof the short-term expected evolution of the economy. The sample includes 450 firms of both manu-facturing and service sector. Data are collected by a market research firm by means of fax/tele-phone interviews or by e-mail/internet. A report containing the results of the survey is made avail-able on the web.
(vi) Survey of the infrastructure sector
This survey started in Fall 2002 with the aim of monitoring orders and investments for state-fi-nanced building projects. The survey is conducted twice a year on a quota sample. Interviews arecarried out by the Bank branches.
(vii) Special purpose surveys
The Surveys and Statistical Methods Division conducts also on-purpose surveys, driven by the re-search interests of the Bank. In recent times, a survey on information and communication technol-ogy and a survey on the use of trade credits have been completed.
2. Methodological issues and research
The research activity is devoted both to economic applications (see paragraph 1) and statisticalmethods1: quality of estimates and of microdata is in the focus of most recent methodological re-search. Main research topics include: robust estimates of investments; non-sampling errors (un-der-reporting and other measurement errors; non-response); outliers detection and analysis; selec-tive editing; small area estimators; techniques of deflation of investments and of revenues.
88 IFC Bulletin 17 — February 2004
BERLIN 2003
1 See also the References.
3. Organisational aspects
The unit responsible for the surveys conducted by the Research department consists of eight mem-bers. The choice of conducting these surveys in-house can be thus considered very cost-effective.The network of the Bank’s branches is strongly involved in data collection, with specificallytrained resources. Moreover, internality allows for a strong co-operation with the other units of theResearch department, both in the preparation of the questionnaires and in the analysis of data. Weassign a particular importance to this interaction; in fact we believe that the statistical functionmust be strictly linked to the economic analysis. We strongly believe that this must be based on adeep knowledge of the data and their limits. The Surveys Division provides assistance on statisti-cal methods and on the use of data from our surveys.
We are not part of the National Statistical System and this implies that participation to our surveysis not compulsory1. Our function is not to be intended as a substitute of official statistics, since in-stitutional aims are distinct for the two bodies. Historically the surveys at the Bank of Italy havefilled a lack of information sources in some topics relevant for monetary policy. Today the quest forquality microdata on some specific economic behaviour and the need for timely economic infor-mation drive the surveying activity. Causality models require integration of macro- and microdata:in-house surveys allow access to tailor-made microdata structures that can be crucial for research.Also monetary policymaking may benefit from having speedy access to relevant economic indica-tors. In some cases, results of the surveys could be used to robustify some financial statistics.
There is a wide co-operation with the National Statistical Institute (ISTAT) on methodological is-sues. It is not rare that our proposals, in terms of questions or fields of research, are included in themore systematic surveys carried out by ISTAT.
References
Bank of Italy, Annual Report – various years.
Bank of Italy, Bollettino Economico – various issues.
Bank of Italy (2002), Italian households budget in 2000, in: Supplement to the Statistical Bulletin: Method-ological Notes and Statistical Information – New series, Year XII n. 6 - 18 January 2002.
Battipaglia, P. (2000), Robust Estimates of Investments from the Bank of Italy’s Business Survey, LondonSchool of Economics Statistics Research Report, April.
Battipaglia, P. (2002), Selective editing to increase efficiency in survey data processing – An application tothe Bank of Italy’s Business Survey on Industrial Firms, Irving Fisher Committee Bulletin No. 13, De-cember.
Battistin E., R. Miniaci, and G. Weber (2003), What do we learn from recall consumption data? Bancad’Italia, Temi di discussione No. 466, February.
Biancotti, C., G. D’Alessio, and A. Neri (2003), Errori di misura nell’indagine sui bilanci delle famiglieitaliane, Banca d’Italia, mimeo, May.
Brandolini, A., R. Cappariello, and P. Casadio (1999), Job creation and destruction in Italy: evidence from arepresentative sample of manufacturing firms, 1984-1998, Banca d’Italia, mimeo.
Brandolini, A., L. Cannari et al. (2003), Household Wealth Distribution in Italy in the 1990s, Banca d’Italia,mimeo.
Cannari, L., and G. D’Alessio (2003), La distribuzione del reddito e della ricchezza nelle regioni italiane,Banca d’Italia, Temi di discussione No. 482, June..
Casadio, P. (1999), Diffusione dei premi di risultato e differenziali retributivi territoriali nell’industria,Lavoro e Relazioni Industriali, n. 1, January-June, pp. 57-81.
Casadio, P., and L. D’Aurizio (2000), Orari di lavoro pro capite, flessibilità ed efficienza produttivadell’industria manifatturiera italiana tra il 1986 e il 1998, Rivista Italiana degli economisti, n. 3-anno V,December, pp. 413-448.
Casadio, P., and L. D’Aurizio (2001), Flessibilità oraria, occupazionale e retributiva nell’industria:complementi o sostituti?, Economia e lavoro, n. 3-Anno XXXV, September-December.
D’Alessio, G., L. D’Aurizio, and I. Faiella (2001), Metodi di stima degli investimenti industriali a livellosub-nazionale nell’indagine Invind, Banca d’Italia, mimeo, July.
IFC Bulletin 17 — February 2004 89
EXTENDED PAPERS
1 On the other hand, the Bank as a data collector is strictly bounded by law to guaranteeing privacy. As a reward to thosewho accept to participate, we send to respondents, in due course, a report of the main result of the survey.
D’Alessio, G., and I. Faiella (2002), Non-response behaviour in the Bank of Italy’s Survey of Household In-come and Wealth, Banca d’Italia, Temi di discussione No. 462, December.
D’Aurizio, L., and R. Tartaglia Polcini (2003), Use of deflators in the Bank of Italy’s business surveys , Bancad’Italia, mimeo, July.
De Blasio, G., and S. Di Addario (2002), Labor market pooling: evidence from Italian industrial districts,Temi di discussione No. 453, October.
Guiso, L., and P. Angelini (1997), Credit-Constrained Firms. Why, When, How Many and for How Long?Banca d’Italia, mimeo.
Guiso, L., and T. Jappelli (1991), “Intergenerational Transfers and Capital Market Imperfections. Evidencefrom an Italian Cross-Section”, European Economic Review, 31, pp. 103-20.
Guiso, L., and T. Jappelli (2002), “Household Portfolios in Italy”, in L. Guiso, M. Haliassos and T. Jappelli(eds.), Household Portfolios, pp. 251-87. Cambridge, Mass.: MIT Press.
Guiso, L., T. Jappelli and D. Terlizzese (1994), “Why Is Italy’s Saving Rate So High?”, in Ando et al. (eds.),Savings and the Accumulation of Wealth. Essays on Italian Households and Government Saving Behav-iour. Cambridge: Cambridge University Press, pp. 23-69.
Guiso L., and M. Paiella (2003), Risk Aversion, wealth and background risk, Banca d’Italia, Temi didiscussione No. 483, September.
Guiso, L., and G. Parigi (1996), Investment and Demand Uncertainty, Discussion Paper, Centre for EconomicPolicy Research, n. 1497, November, pp. 1-35.
Jappelli T., and L. Pistaferri (2000), The Dynamics of Household Wealth Accumulation, in Italy FiscalStudies n. 21, June.
Jappelli T., and L. Pistaferri (2000), Risparmio e scelte intertemporali, Bologna: Il Mulino.
Magri, S. (2002), Italian households’ debt: determinants of demand and supply. Banca d’Italia, Temi diDiscussione No. 454, October.
Marchetti D. J., and G. Parigi (1998), Energy consumption, survey data and the prediction of industrial pro-duction in Italy, Journal of Forecasting, Vol. 19 (5), pp. 419-440; Temi di Discussione No. 342, Decem-ber.
Paiella, M. (2001), “Demand for Housing, Saving Behavior and Wealth Allocation”, Banca d’Italia, mimeo.
Paiella, M. (2002), “Recent Trends in Italian Household Net Worth. Is There Evidence of Wealth Effects onConsumption?”, Banca d’Italia, mimeo.
Rossi, F., and P. Sestito (2000), Contrattazione aziendale, struttura negoziale e determinazione decentrata delsalario, Rivista di Politica Economica, October-November, pp. 129-184.
Abstract
The Bank of Italy carries out several surveys in full autonomy. Advantages of in-house sample surveys in-clude: speedy access to economic information relevant for monetary policy, access to microdata on house-holds and businesses that are crucial for economic research, the opportunity of a closer relationship with theeconomists of the Bank’s Research Department, in order to integrate data collection, estimation, and eco-nomic interpretation. In many cases the Bank branches play a key role both in carrying out the interviews andin analysing results also at the local level. The research activity is devoted both to economic applications andstatistical methods. Quality of estimates and of microdata, non-sampling errors are in the focus of most recentmethodological research.
Raffaele Tartaglia PolciniBank of Italy, Research Department,via Nazionale 91, 00184 Rome, [email protected].
90 IFC Bulletin 17 — February 2004
BERLIN 2003