Embed Size (px)
Citation preview

On Bidirectional Testing of Unreinforced Masonry Walls
Kiarash M. Dolatshahi Department of Civil, Structural and Environmental Engineering, University at Buffalo – The
State University of New York, NY, USA ([email protected])
Amjad J. Aref Department of Civil, Structural and Environmental Engineering, University at Buffalo – The
State University of New York, NY, USA ([email protected])
SUMMARY:
This paper aims at investigating the bidirectional behavior of unreinforced masonry (URM) walls and also providing
validation of material models and algorithms derived by the authors. Moreover, different boundary conditions have
been used for testing the walls to investigate the influence of boundary condition on the dominant failure mode of
URM walls. Accordingly, two URM walls have been tested with various loading protocols and boundary conditions.
First a monotonic (displacement controlled) in-plane load has been applied to the wall to identify the in-plane
characteristics. Then for the second wall the in-plane load has been applied while a load was continuously applied in
the out-of-plane direction. Three different types of specimen tests have been considered for each wall to identify the
properties of mortar and bricks. These tests included tensile and shear to identify the properties of mortar, and
compression test on a masonry prism to identify the compressive properties of bricks. Each test has been repeated
three times and the average of the results has been considered for the final result.
The bidirectional testing of URM walls provided essential validation to proposed elements and material models that
have been coupled with ABAQUS, and have led to derivation of interaction curves dealing with in-plane and out-of-
plane response.
Keywords: URM walls, experimental, three dimensional, bidirectional test
1. INTRODUCTION
Masonry structures have been used for many years in building construction. The poor behavior of masonry buildings
under earthquake excitations has been observed over the years; however, masonry buildings are still in demand.
Although novel structural technologies are utilized in new buildings, masonry components are not omitted from
structural usage, and masonry components are still used especially for infill walls, whereby they provide a
significant stiffness enhancement to the buildings in earthquakes. Therefore, it is necessary to well understand the
behavior of URM walls, especially the behavior of the walls in three dimensional loading cases.
A significant amount of work has been focused on understanding the micro material behavior of masonry
components (bricks and mortar) and the macro-behavior of masonry walls by conducting experimental studies.
Pluijm (Pluijm and Vermeltfoort 1991; Pluijm 1992; Pluijm 1993) conducted a series of experimental studies to
identify the behavior of joints in the monotonic tensile and shear displacement. Stavridis (Stavridis 2009; Stavridis
and Shing 2010) presented a mathematical model for the material behavior of mortar joints and bricks in masonry
walls, where a wall was comprised of either concrete or clay bricks. The study (Stavridis 2009; Stavridis and Shing
2010) presented a typical range for each mathematical parameter.
Da Porto et al. (Da Porto, Grendene et al. 2009) performed a number of in-plane cyclic tests to develop an analytical
hysteretic model for masonry walls. A number of cyclic testing was performed on the out-of-plane direction of
unreinforced masonry walls by Griffith et al. (Griffith, Vaculik et al. 2007). He showed the effect of the opening on

the cyclic behavior of the masonry walls. In addition, the work highlighted the influence of the connection of the
perpendicular walls in the out-of-plane behavior.
Similar to experimental researches which mostly cover two dimensional behavior of URM walls, many researchers
have developed numerical procedures to understand the two dimensional behavior of masonry structures (Lourenco
1996; Oliveira and Lourenco 2003; Dolatshahi and Aref 2011; Dolatshahi 2012). However, a few numerical and
experimental works have focused on understanding the bidirectional behavior of masonry wall. This paper assesses
the behavior of URM walls under three dimensional loadings cases. In the following the experimental results of two
walls tested with different loading cases are presented.
2. TESTING WALL 1
Figure 1 presents the general view of wall 1, in addition to the instrumentation of the wall. As shown in Figure 1, the
wall was instrumented with four string potentiometers. SP2 and SP3 measured the out-of-plane (OP) deformations
of the wall and SP1 and SP4 measured the in-plane (IP) deformations of the top and bottom of the wall, respectively.
In the first step of loading the axial load was applied on the top of the wall (22 kips (98 kN) including the weight of
the top beam), using two vertical actuators with identical loads. Afterward, while keeping the axial load constant, a
deformation-controlled load was applied horizontally at top of the wall. Due to the imposed boundary conditions,
the top beam was allowed to rotate while the horizontal load was applied. This boundary condition represents an
URM wall in a building with a flexible diaphragm.
(a) Experimental view(b) Instrumentation - Four string pots
Figure 1. Instrumentation of the walls
Figure 2 (a) presents the in-plane deformation-controlled loading protocol that was used for the first wall. The
imposed deformation controlled loading led to the load-displacement curve of Figure 2 (b). The wall initially started
to behave elastically and after the onset of cracking in the bottom of the wall (see Figure 3), the nonlinear behavior
followed a rocking failure mode. In this test the failure was concentrated in the first row of the brick and no
nonlinearity was observed in the rest of the wall (Figure 3).
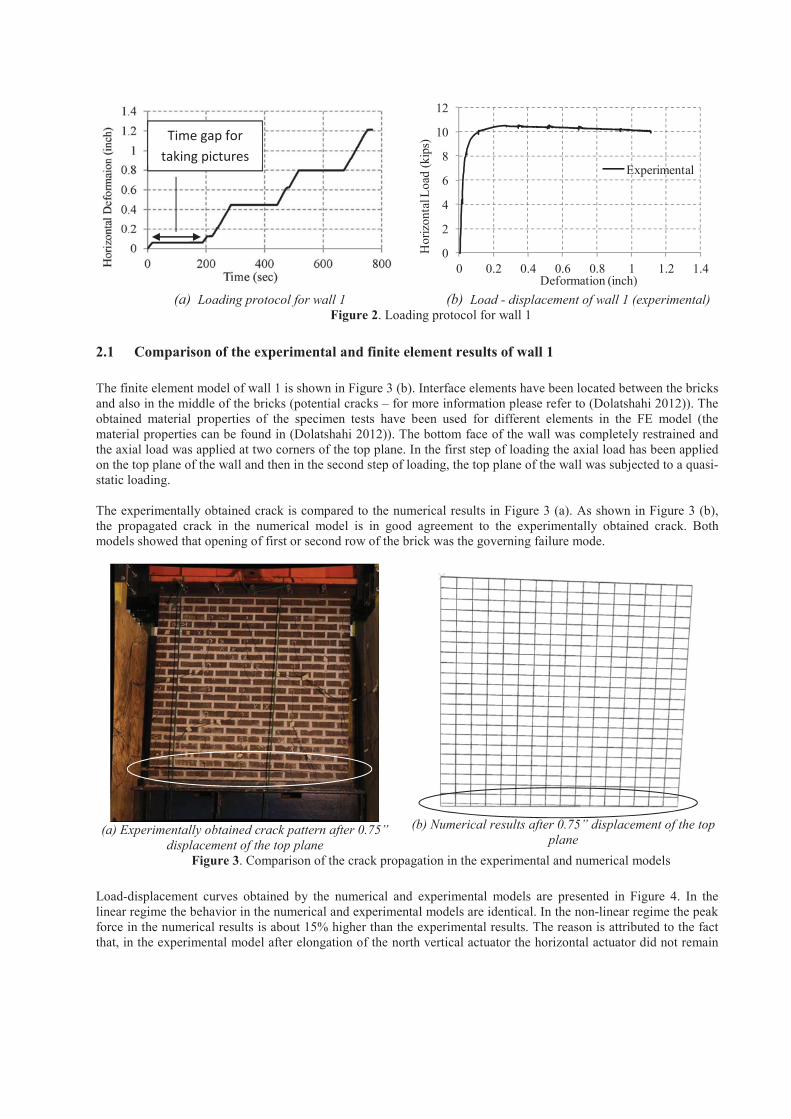
(a) Loading protocol for wall 1 (b) Load - displacement of wall 1 (experimental)
Figure 2. Loading protocol for wall 1
2.1 Comparison of the experimental and finite element results of wall 1
The finite element model of wall 1 is shown in Figure 3 (b). Interface elements have been located between the bricks
and also in the middle of the bricks (potential cracks – for more information please refer to (Dolatshahi 2012)). The
obtained material properties of the specimen tests have been used for different elements in the FE model (the
material properties can be found in (Dolatshahi 2012)). The bottom face of the wall was completely restrained and
the axial load was applied at two corners of the top plane. In the first step of loading the axial load has been applied
on the top plane of the wall and then in the second step of loading, the top plane of the wall was subjected to a quasi-
static loading.
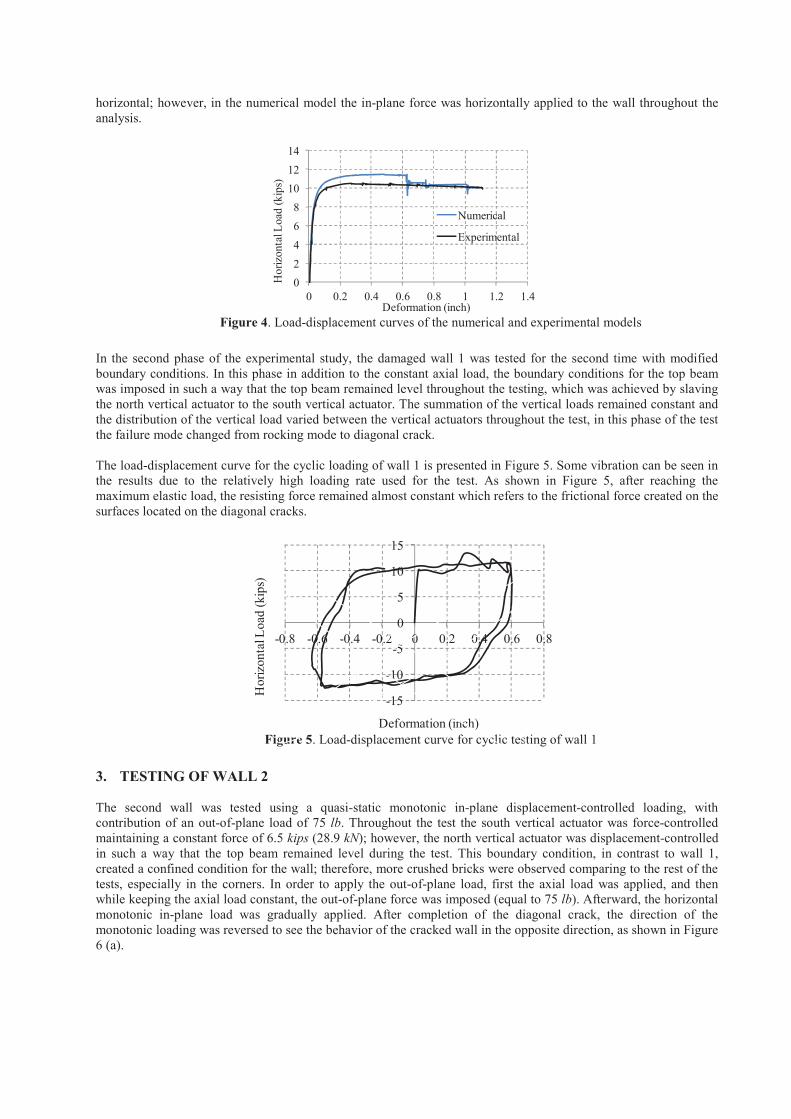
The experimentally obtained crack is compared to the numerical results in Figure 3 (a). As shown in Figure 3 (b),
the propagated crack in the numerical model is in good agreement to the experimentally obtained crack. Both
models showed that opening of first or second row of the brick was the governing failure mode.
(a) Experimentally obtained crack pattern after 0.75”
displacement of the top plane
(b) Numerical results after 0.75” displacement of the top
plane
Figure 3. Comparison of the crack propagation in the experimental and numerical models
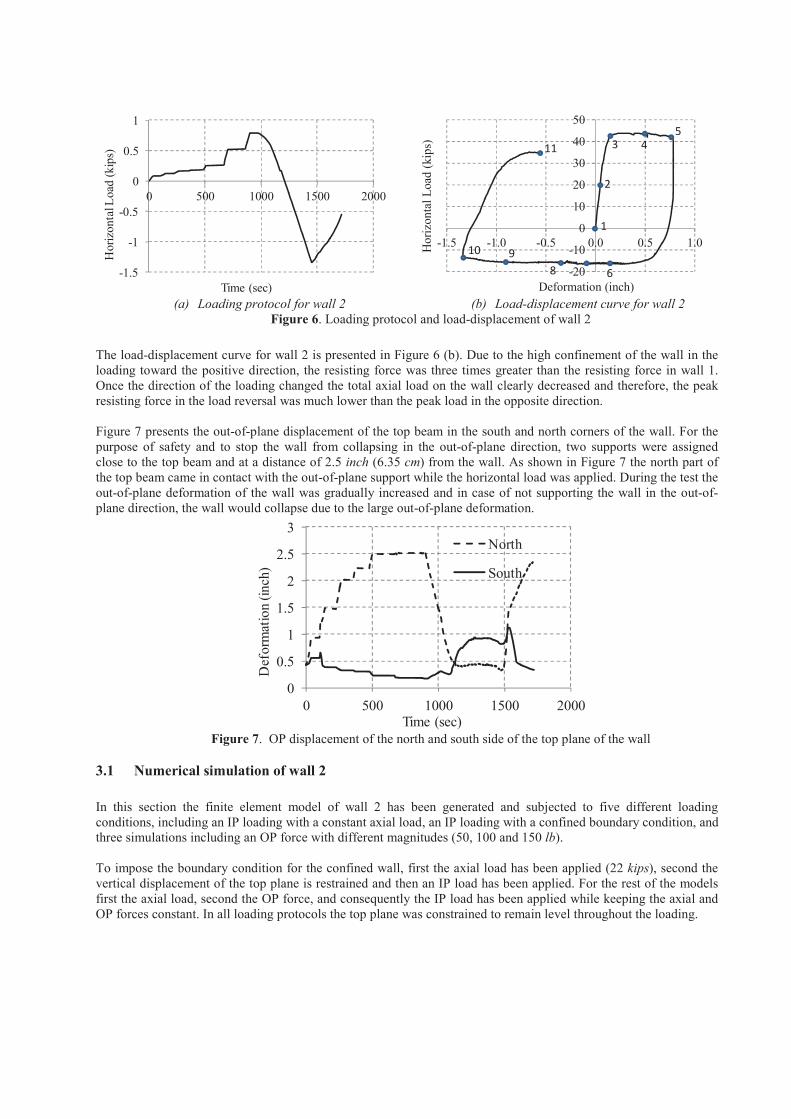
Load-displacement curves obtained by the numerical and experimental models are presented in Figure 4. In the
linear regime the behavior in the numerical and experimental models are identical. In the non-linear regime the peak
force in the numerical results is about 15% higher than the experimental results. The reason is attributed to the fact
that, in the experimental model after elongation of the north vertical actuator the horizontal actuator did not remain
0
2
4
6
8
10
12
0 0.2 0.4 0.6 0.8 1 1.2 1.4
Ho
rizo
nta
l Lo
ad (
kip
s)
Deformation (inch)
Experimental
Time gap for
taking pictures
horizontal; however, in the numerical model the in-plane force was horizontally applied to the wall throughout the
analysis.
Figure 4. Load-displacement curves of the numerical and experimental models
In the second phase of the experimental study, the damaged wall 1 was tested for the second time with modified
boundary conditions. In this phase in addition to the constant axial load, the boundary conditions for the top beam
was imposed in such a way that the top beam remained level throughout the testing, which was achieved by slaving
the north vertical actuator to the south vertical actuator. The summation of the vertical loads remained constant and
the distribution of the vertical load varied between the vertical actuators throughout the test, in this phase of the test
the failure mode changed from rocking mode to diagonal crack.
The load-displacement curve for the cyclic loading of wall 1 is presented in Figure 5. Some vibration can be seen in
the results due to the relatively high loading rate used for the test. As shown in Figure 5, after reaching the
maximum elastic load, the resisting force remained almost constant which refers to the frictional force created on the
surfaces located on the diagonal cracks.
Figure 5. Load-displacement curve for cyclic testing of wall 1
3. TESTING OF WALL 2
The second wall was tested using a quasi-static monotonic in-plane displacement-controlled loading, with
contribution of an out-of-plane load of 75 lb. Throughout the test the south vertical actuator was force-controlled
maintaining a constant force of 6.5 kips (28.9 kN); however, the north vertical actuator was displacement-controlled
in such a way that the top beam remained level during the test. This boundary condition, in contrast to wall 1,
created a confined condition for the wall; therefore, more crushed bricks were observed comparing to the rest of the
tests, especially in the corners. In order to apply the out-of-plane load, first the axial load was applied, and then
while keeping the axial load constant, the out-of-plane force was imposed (equal to 75 lb). Afterward, the horizontal
monotonic in-plane load was gradually applied. After completion of the diagonal crack, the direction of the
monotonic loading was reversed to see the behavior of the cracked wall in the opposite direction, as shown in Figure
6 (a).
0
2
4
6
8
10
12
14
0 0.2 0.4 0.6 0.8 1 1.2 1.4
Ho
rizo
nta
l Load
(k
ips)
Deformation (inch)
Numerical
Experimental
-15
-10
-5
0
5
10
15
-0.8 -0.6 -0.4 -0.2 0 0.2 0.4 0.6 0.8
Hori
zon
tal L
oad
(kip
s)
Deformation (inch)
(a) Loading protocol for wall 2 (b) Load-displacement curve for wall 2
Figure 6. Loading protocol and load-displacement of wall 2
The load-displacement curve for wall 2 is presented in Figure 6 (b). Due to the high confinement of the wall in the
loading toward the positive direction, the resisting force was three times greater than the resisting force in wall 1.
Once the direction of the loading changed the total axial load on the wall clearly decreased and therefore, the peak
resisting force in the load reversal was much lower than the peak load in the opposite direction.
Figure 7 presents the out-of-plane displacement of the top beam in the south and north corners of the wall. For the
purpose of safety and to stop the wall from collapsing in the out-of-plane direction, two supports were assigned
close to the top beam and at a distance of 2.5 inch (6.35 cm) from the wall. As shown in Figure 7 the north part of
the top beam came in contact with the out-of-plane support while the horizontal load was applied. During the test the
out-of-plane deformation of the wall was gradually increased and in case of not supporting the wall in the out-of-
plane direction, the wall would collapse due to the large out-of-plane deformation.
Figure 7. OP displacement of the north and south side of the top plane of the wall
3.1 Numerical simulation of wall 2
In this section the finite element model of wall 2 has been generated and subjected to five different loading
conditions, including an IP loading with a constant axial load, an IP loading with a confined boundary condition, and
three simulations including an OP force with different magnitudes (50, 100 and 150 lb).
To impose the boundary condition for the confined wall, first the axial load has been applied (22 kips), second the
vertical displacement of the top plane is restrained and then an IP load has been applied. For the rest of the models
first the axial load, second the OP force, and consequently the IP load has been applied while keeping the axial and
OP forces constant. In all loading protocols the top plane was constrained to remain level throughout the loading.
-1.5
-1
-0.5
0
0.5
1
0 500 1000 1500 2000
Hori
zon
tal L
oad
(k
ips)
Time (sec)
-20
-10
0
10
20
30
40
50
-1.5 -1.0 -0.5 0.0 0.5 1.0
Ho
rizo
nta
l L
oad
(kip
s)
Deformation (inch)
1
2
3 4
5
11
10 9
8 6
0
0.5
1
1.5
2
2.5
3
0 500 1000 1500 2000
Def
orm
atio
n (
inch
)
Time (sec)
North
South
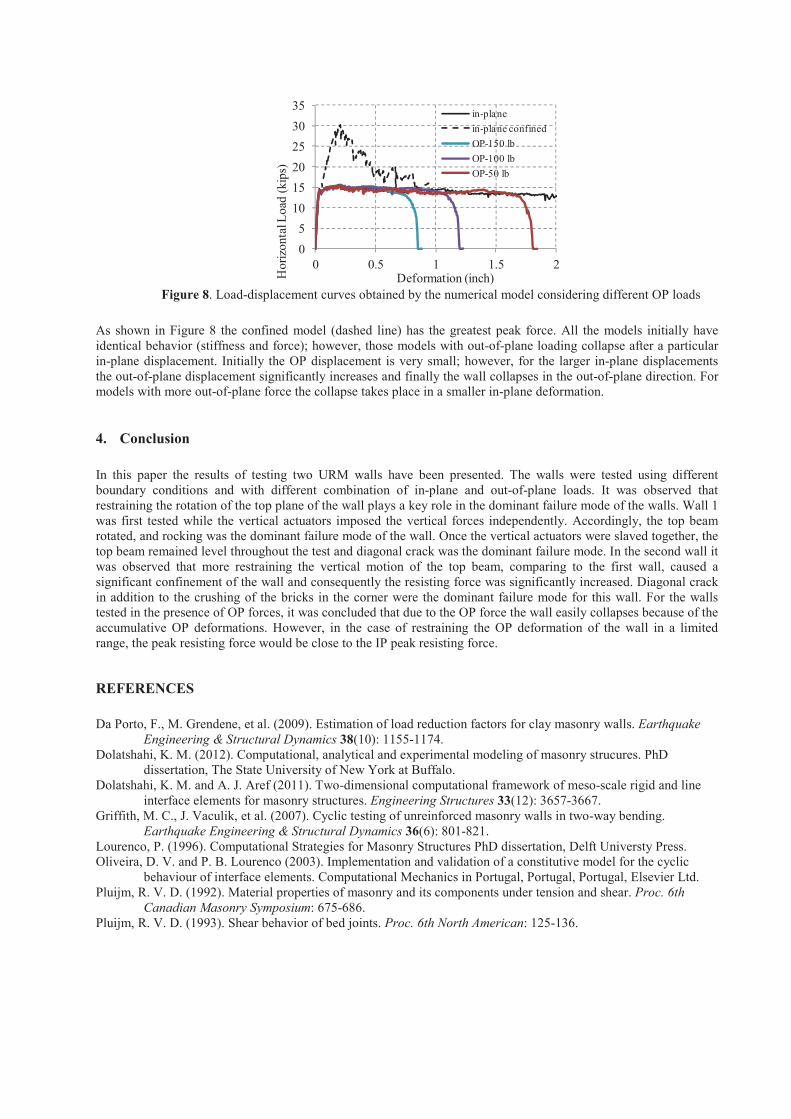
Figure 8. Load-displacement curves obtained by the numerical model considering different OP loads
As shown in Figure 8 the confined model (dashed line) has the greatest peak force. All the models initially have
identical behavior (stiffness and force); however, those models with out-of-plane loading collapse after a particular
in-plane displacement. Initially the OP displacement is very small; however, for the larger in-plane displacements
the out-of-plane displacement significantly increases and finally the wall collapses in the out-of-plane direction. For
models with more out-of-plane force the collapse takes place in a smaller in-plane deformation.
4. Conclusion
In this paper the results of testing two URM walls have been presented. The walls were tested using different
boundary conditions and with different combination of in-plane and out-of-plane loads. It was observed that
restraining the rotation of the top plane of the wall plays a key role in the dominant failure mode of the walls. Wall 1
was first tested while the vertical actuators imposed the vertical forces independently. Accordingly, the top beam
rotated, and rocking was the dominant failure mode of the wall. Once the vertical actuators were slaved together, the
top beam remained level throughout the test and diagonal crack was the dominant failure mode. In the second wall it
was observed that more restraining the vertical motion of the top beam, comparing to the first wall, caused a
significant confinement of the wall and consequently the resisting force was significantly increased. Diagonal crack
in addition to the crushing of the bricks in the corner were the dominant failure mode for this wall. For the walls
tested in the presence of OP forces, it was concluded that due to the OP force the wall easily collapses because of the
accumulative OP deformations. However, in the case of restraining the OP deformation of the wall in a limited
range, the peak resisting force would be close to the IP peak resisting force.
REFERENCES
Da Porto, F., M. Grendene, et al. (2009). Estimation of load reduction factors for clay masonry walls. Earthquake
Engineering & Structural Dynamics 38(10): 1155-1174.
Dolatshahi, K. M. (2012). Computational, analytical and experimental modeling of masonry strucures. PhD
dissertation, The State University of New York at Buffalo.
Dolatshahi, K. M. and A. J. Aref (2011). Two-dimensional computational framework of meso-scale rigid and line
interface elements for masonry structures. Engineering Structures 33(12): 3657-3667.
Griffith, M. C., J. Vaculik, et al. (2007). Cyclic testing of unreinforced masonry walls in two-way bending.
Earthquake Engineering & Structural Dynamics 36(6): 801-821.
Lourenco, P. (1996). Computational Strategies for Masonry Structures PhD dissertation, Delft Universty Press.
Oliveira, D. V. and P. B. Lourenco (2003). Implementation and validation of a constitutive model for the cyclic
behaviour of interface elements. Computational Mechanics in Portugal, Portugal, Portugal, Elsevier Ltd.
Pluijm, R. V. D. (1992). Material properties of masonry and its components under tension and shear. Proc. 6th
Canadian Masonry Symposium: 675-686.
Pluijm, R. V. D. (1993). Shear behavior of bed joints. Proc. 6th North American: 125-136.
0
5
10
15
20
25
30
35
0 0.5 1 1.5 2
Ho
rizo
nta
l Lo
ad (
kip
s)Deformation (inch)
in-plane
in-plane confined
OP-150 lb
OP-100 lb
OP-50 lb

Pluijm, R. V. D. and A. T. Vermeltfoort (1991). Deformation controlled tension and compression tests in units,
mortar and masonry. Netherlands, TNO-Bouw, Delft.
Stavridis, A. (2009). Analytical and Experimental Study of Seismic Performance of Reinforced Concrete Frames
Infilled with Masonry Walls. PhD, University of California, San Diego.
Stavridis, A. and P. B. Shing (2010). Finite-element modeling of nonlinear behavior of masonry-infilled RC frames.
Journal of Structural Engineering 136(Compendex): 285-296.