Embed Size (px)
Citation preview
8/6/2019 On Any Given Night - Homelessness in Hamilton
http://slidepdf.com/reader/full/on-any-given-night-homelessness-in-hamilton 1/16
ON ANYGIVENNIGHT
Homelessness Indicators ReportMay 2010 EDITION
8/6/2019 On Any Given Night - Homelessness in Hamilton
http://slidepdf.com/reader/full/on-any-given-night-homelessness-in-hamilton 2/16
HomelessnessIndicators Report
Quick Facts:
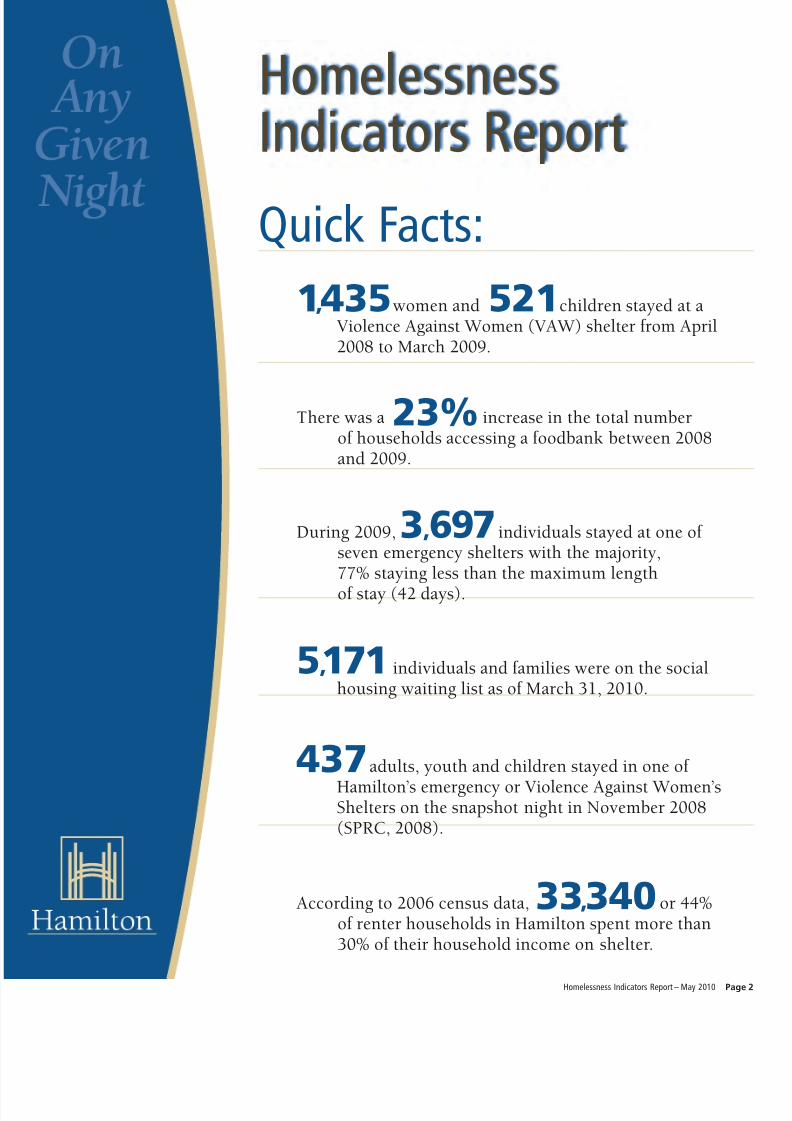
women and children stayed at aViolence Against Women (VAW) shelter from April2008 to March 2009.
1,435 521
individuals and families were on the socialhousing waiting list as of March 31, 2010.
5,171
There was a increase in the total numberof households accessing a foodbank between 2008and 2009.
23%
During 2009, individuals stayed at one of seven emergency shelters with the majority,77% staying less than the maximum length
of stay (42 days).
According to 2006 census data, or 44%of renter households in Hamilton spent more than30% of their household income on shelter.
3,697
33,340
adults, youth and children stayed in one of
Hamilton’s emergency or Violence Against Women’sShelters on the snapshot night in November 2008(SPRC, 2008).
437
Homelessness Indicators Report – May 2010 Pag
8/6/2019 On Any Given Night - Homelessness in Hamilton
http://slidepdf.com/reader/full/on-any-given-night-homelessness-in-hamilton 3/16
Building on extensive community consultation, the City of Hamilton
developed a three-year plan, Everyone has a Home: A Strategic Plan to
Address Homelessness (2007).
In order to achieve this shared vision, the City of Hamilton’s plan to address
homelessness identifies five outcomes:
• The entire community is engaged to address homelessness;
• A continuum of affordable housing that helps residents
achieve their potential;
• Increase supports to help people obtain and maintain housing;
• Access to an adequate income; and,
• Efficient and effective use of community resources
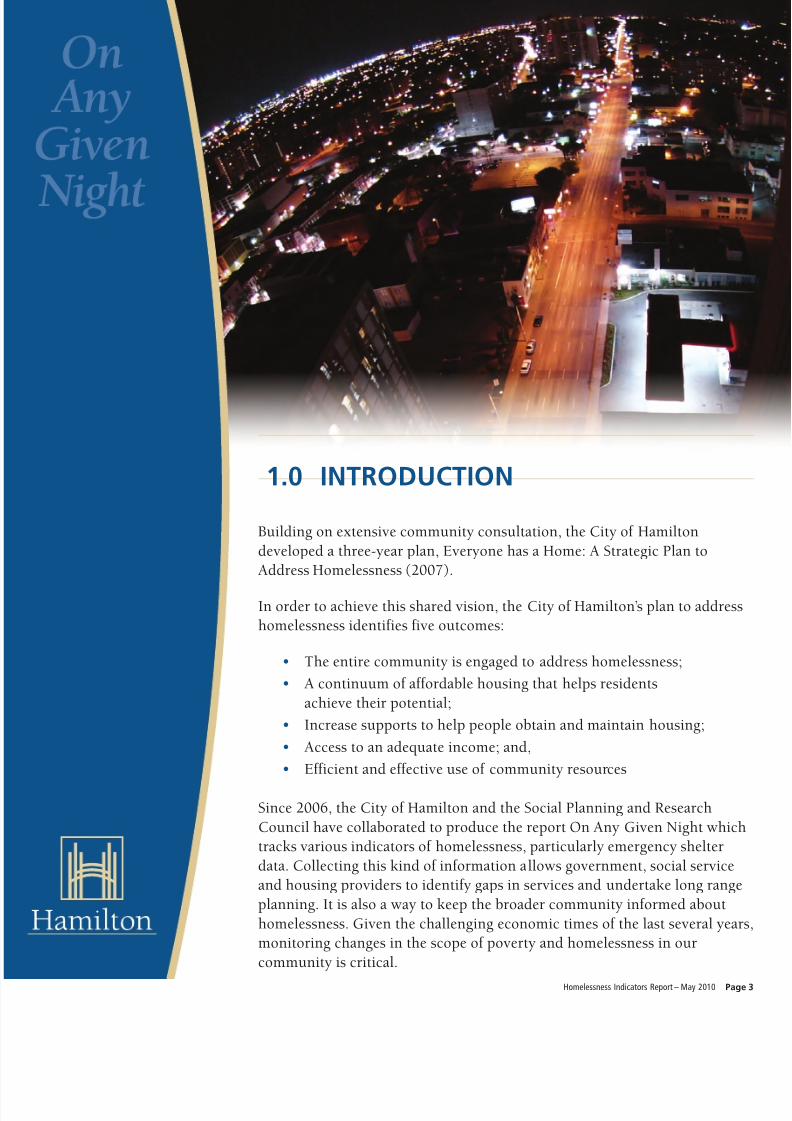
Since 2006, the City of Hamilton and the Social Planning and Research
Council have collaborated to produce the report On Any Given Night which
tracks various indicators of homelessness, particularly emergency shelter
data. Collecting this kind of information allows government, social service
and housing providers to identify gaps in services and undertake long range
planning. It is also a way to keep the broader community informed about
homelessness. Given the challenging economic times of the last several year
monitoring changes in the scope of poverty and homelessness in our
community is critical.
Homelessness Indicators Report – May 2010 Pag
1.0 INTRODUCTION
8/6/2019 On Any Given Night - Homelessness in Hamilton
http://slidepdf.com/reader/full/on-any-given-night-homelessness-in-hamilton 4/16
2.0 UNDERSTANDING HOMELESSNESS
There are many concepts and indicators to be considered in understanding
homelessness, some of which are touched upon in this report.
The three broad categories to consider in defining homelessness include:• Those who are sleeping outside, in a public place, or in a shelter;
absolute homelessness;
• Those who are staying with friends or family; hidden homelessness;
• And those at risk of homelessness including those who are
inadequately housed.
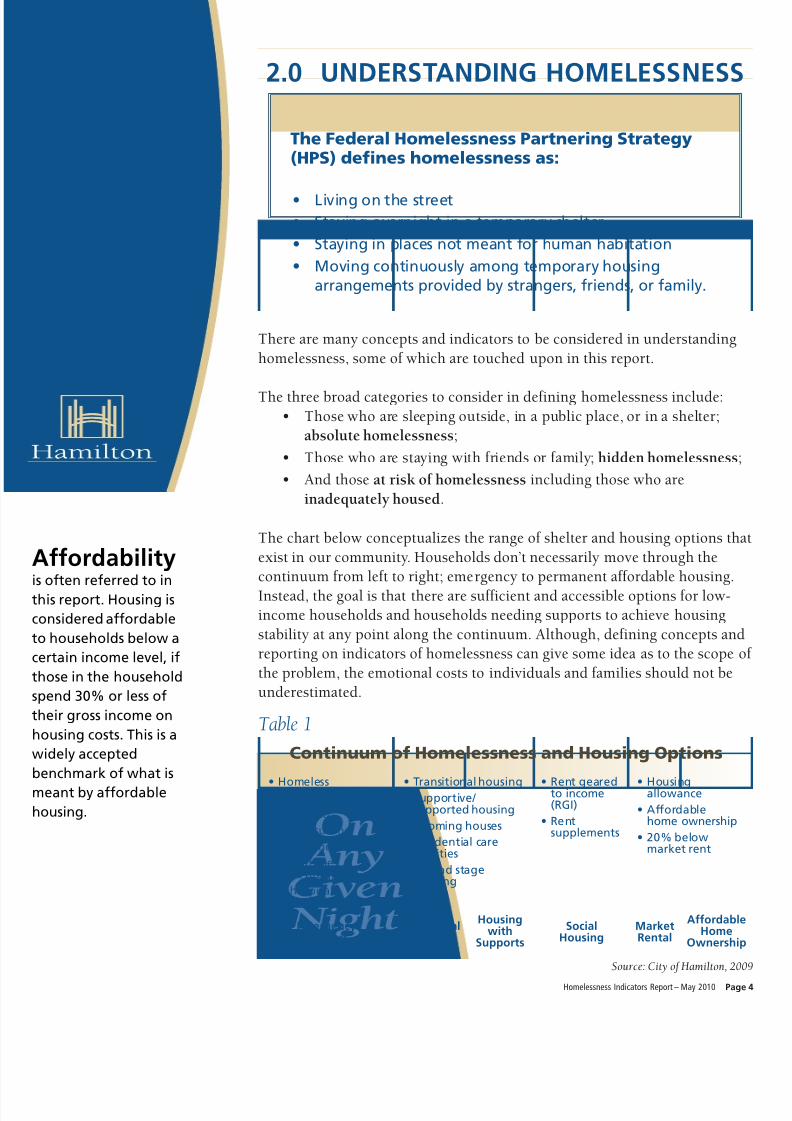
The chart below conceptualizes the range of shelter and housing options tha
exist in our community. Households don’t necessarily move through the
continuum from left to right; emergency to permanent affordable housing.
Instead, the goal is that there are sufficient and accessible options for low-
income households and households needing supports to achieve housing
stability at any point along the continuum. Although, defining concepts and
reporting on indicators of homelessness can give some idea as to the scope o
the problem, the emotional costs to individuals and families should not be
underestimated.
Source: City of Hamilton, 20
Affordabilityis often referred to in
this report. Housing is
considered affordable
to households below a
certain income level, if
those in the household
spend 30% or less of
their gross income on
housing costs. This is a
widely accepted
benchmark of what is
meant by affordable
housing.
• Living on the street• Staying overnight in a temporary shelter
• Staying in places not meant for human habitation
• Moving continuously among temporary housing
arrangements provided by strangers, friends, or family.
• Homeless• Living on the street
• Squatting
• Couch surfing
• Emergency shelters
• Out of theCold program
• In hospital
EmergencyShelters
TransitionalHousing
SocialHousing
MarketRental
AffordablHome
Ownershi
Housingwith
Supports
• Transitional housing• Supportive/
supported housing
• Rooming houses
• Residential carefacilities
• Second stagehousing
• Rent gearedto income(RGI)
• Rentsupplements
• Housingallowance
• Affordablehome ownership
• 20% belowmarket rent
The Federal Homelessness Partnering Strategy(HPS) defines homelessness as:
Table 1
Continuum of Homelessness and Housing Options
Homelessness Indicators Report – May 2010 Pag
8/6/2019 On Any Given Night - Homelessness in Hamilton
http://slidepdf.com/reader/full/on-any-given-night-homelessness-in-hamilton 5/16
3.0 EMERGENCY SHELTER SYSTEMIN HAMILTON
3.1 The Shelter System and Information Collection
One indicator of absolute homelessness in our community is shelter usage.Homelessness Individuals and Families Information System (HIFIS) is the
federal government’s electronic database system used by communities to
collect and report on data specific to people who are homeless. All
emergency shelters in Hamilton collect data using HIFIS. This includes
shelters that are funded by the City of Hamilton that serve men, women,
families and youth. Violence Against Women (VAW) shelters which are
funded by the Province of Ontario collect information using a different
system and are therefore not included in the HIFIS data presented.
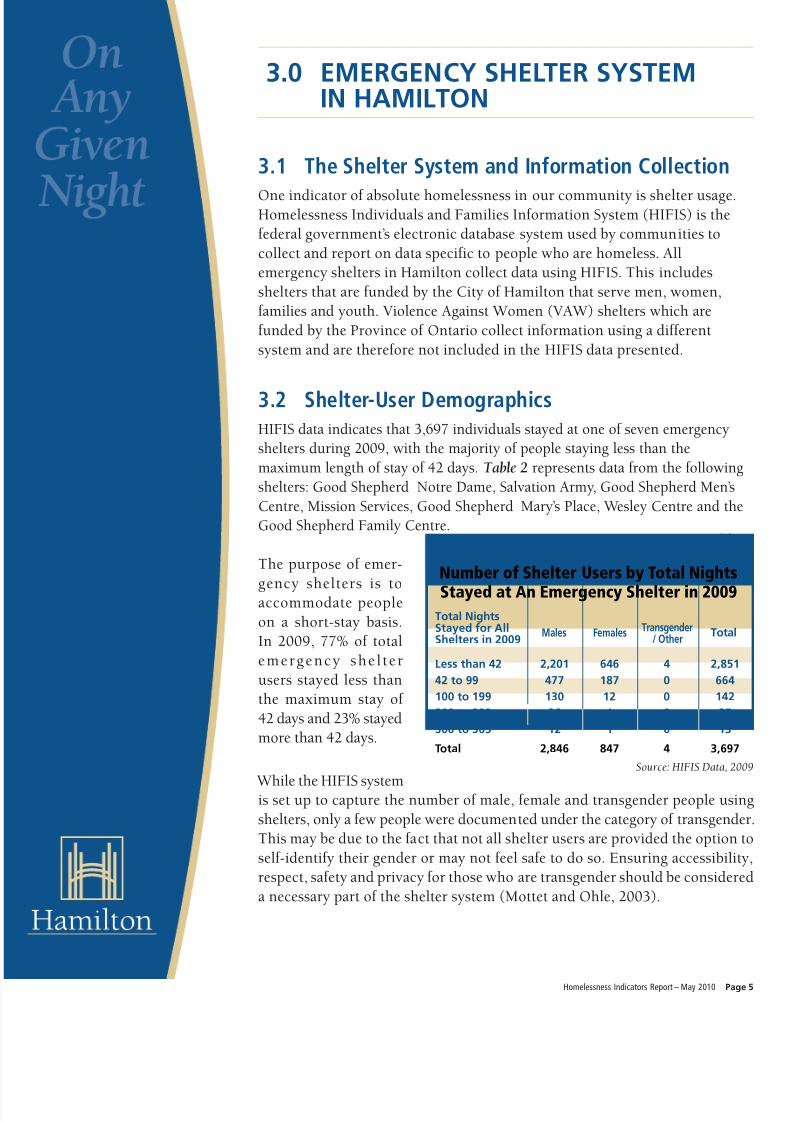
3.2 Shelter-User DemographicsHIFIS data indicates that 3,697 individuals stayed at one of seven emergency
shelters during 2009, with the majority of people staying less than the
maximum length of stay of 42 days. Table 2 represents data from the following
shelters: Good Shepherd Notre Dame, Salvation Army, Good Shepherd Men’s
Centre, Mission Services, Good Shepherd Mary’s Place, Wesley Centre and the
Good Shepherd Family Centre.
While the HIFIS systemis set up to capture the number of male, female and transgender people usin
shelters, only a few people were documented under the category of transgende
This may be due to the fact that not all shelter users are provided the option
self-identify their gender or may not feel safe to do so. Ensuring accessibilit
respect, safety and privacy for those who are transgender should be considere
a necessary part of the shelter system (Mottet and Ohle, 2003).
The purpose of emer-
gency shelters is toaccommodate people
on a short-stay basis.
In 2009, 77% of total
emergency shel ter
users stayed less than
the maximum stay of
42 days and 23% stayed
more than 42 days.
Homelessness Indicators Report – May 2010 Pag
Source: HIFIS Data, 20
Less than 42 2,201 646 4 2,851
42 to 99 477 187 0 664
100 to 199 130 12 0 142
200 to 299 26 1 0 27
300 to 365 12 1 0 13
Total 2,846 847 4 3,697
Males Females Total
Total NightsStayed for AllShelters in 2009
Table
Number of Shelter Users by Total Nights
Stayed at An Emergency Shelter in 2009
Transgender/ Other
8/6/2019 On Any Given Night - Homelessness in Hamilton
http://slidepdf.com/reader/full/on-any-given-night-homelessness-in-hamilton 6/16
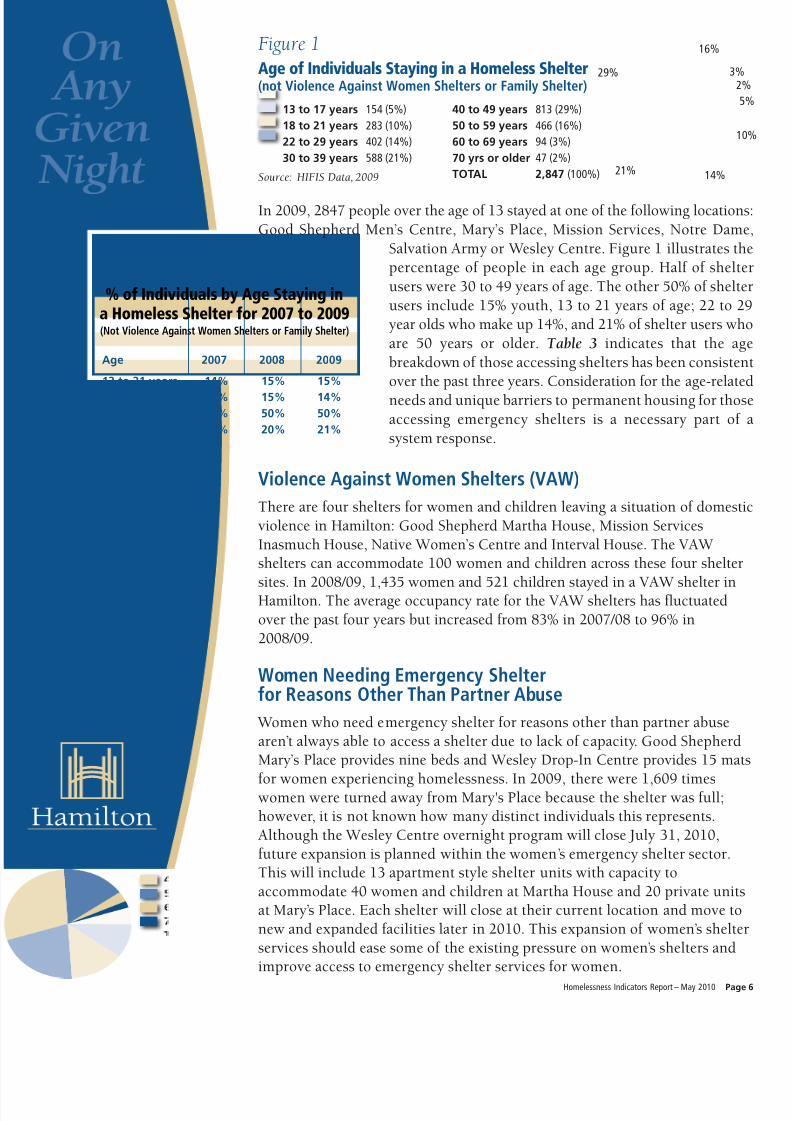
In 2009, 2847 people over the age of 13 stayed at one of the following location
Good Shepherd Men’s Centre, Mary’s Place, Mission Services, Notre Dam
Salvation Army or Wesley Centre. Figure 1 illustrates th
percentage of people in each age group. Half of shelt
users were 30 to 49 years of age. The other 50% of shelt
users include 15% youth, 13 to 21 years of age; 22 to 2
year olds who make up 14%, and 21% of shelter users wh
are 50 years or older. Table 3 indicates that the ag
breakdown of those accessing shelters has been consiste
over the past three years. Consideration for the age-relate
needs and unique barriers to permanent housing for tho
accessing emergency shelters is a necessary part of
system response.
13 to 21 years 14% 15% 15%
22 to 29 years 14% 15% 14%
30 to 49 years 53% 50% 50%
50 yrs & over 19% 20% 21%
Age 2007 2008 2009
Table 3
% of Individuals by Age Staying ina Homeless Shelter for 2007 to 2009(Not Violence Against Women Shelters or Family Shelter)
Age of Individuals Staying in a Homeless Shelter(not Violence Against Women Shelters or Family Shelter)
Violence Against Women Shelters (VAW)
There are four shelters for women and children leaving a situation of domest
violence in Hamilton: Good Shepherd Martha House, Mission Services
Inasmuch House, Native Women’s Centre and Interval House. The VAWshelters can accommodate 100 women and children across these four shelter
sites. In 2008/09, 1,435 women and 521 children stayed in a VAW shelter inHamilton. The average occupancy rate for the VAW shelters has fluctuated
over the past four years but increased from 83% in 2007/08 to 96% in
2008/09.
Women Needing Emergency Shelterfor Reasons Other Than Partner Abuse
Women who need emergency shelter for reasons other than partner abuse
aren’t always able to access a shelter due to lack of capacity. Good ShepherdMary’s Place provides nine beds and Wesley Drop-In Centre provides 15 ma
for women experiencing homelessness. In 2009, there were 1,609 timeswomen were turned away from Mary's Place because the shelter was full;however, it is not known how many distinct individuals this represents.
Although the Wesley Centre overnight program will close July 31, 2010,
future expansion is planned within the women’s emergency shelter sector.This will include 13 apartment style shelter units with capacity to
accommodate 40 women and children at Martha House and 20 private unitsat Mary’s Place. Each shelter will close at their current location and move to
new and expanded facilities later in 2010. This expansion of women’s shelte
services should ease some of the existing pressure on women’s shelters andimprove access to emergency shelter services for women.
Figure 1
Source: HIFIS Data, 2009
1
14%21%
29%
16%
3%2
13 to 17 years 154 (5%)
18 to 21 years 283 (10%)
22 to 29 years 402 (14%)
30 to 39 years 588 (21%)
40 to 49 years 813 (29%)
50 to 59 years 466 (16%)
60 to 69 years 94 (3%)
70 yrs or older 47 (2%)
TOTAL 2,847 (100%)
Homelessness Indicators Report – May 2010 Pag
8/6/2019 On Any Given Night - Homelessness in Hamilton
http://slidepdf.com/reader/full/on-any-given-night-homelessness-in-hamilton 7/16
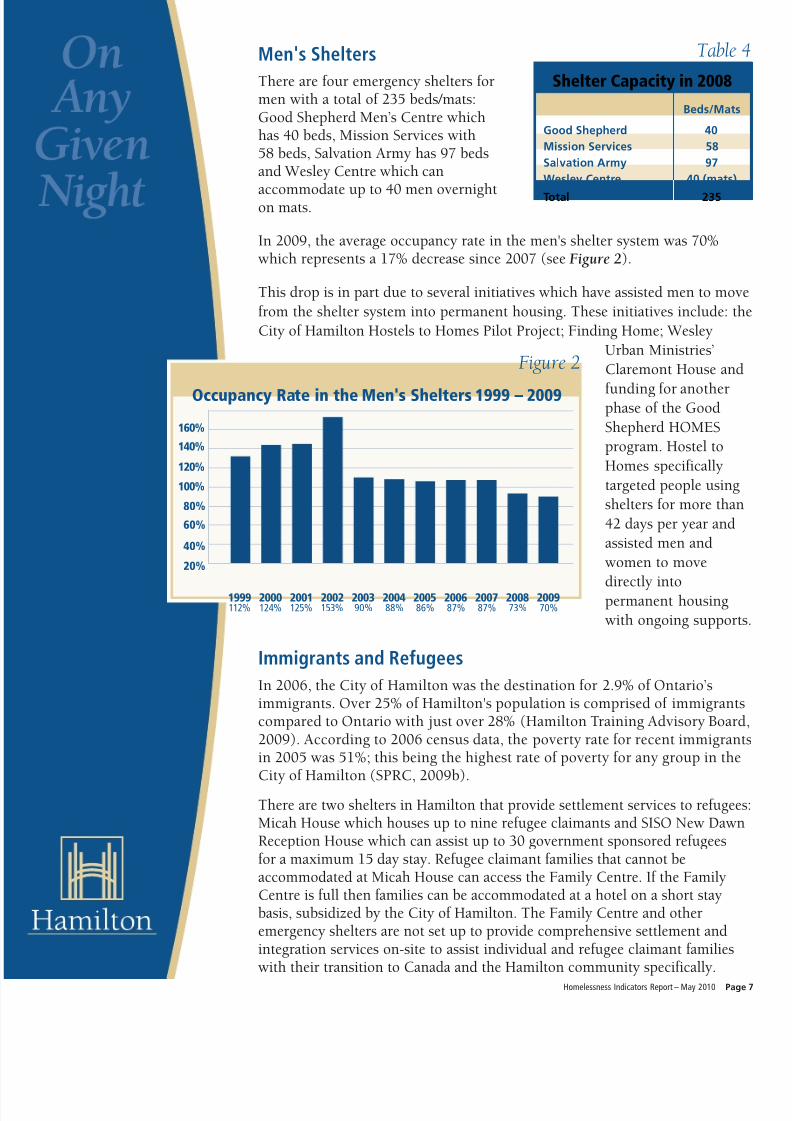
Men's Shelters
There are four emergency shelters formen with a total of 235 beds/mats:Good Shepherd Men’s Centre whichhas 40 beds, Mission Services with58 beds, Salvation Army has 97 bedsand Wesley Centre which can
accommodate up to 40 men overnighton mats.
In 2009, the average occupancy rate in the men's shelter system was 70%which represents a 17% decrease since 2007 (see Figure 2).
This drop is in part due to several initiatives which have assisted men to mov
from the shelter system into permanent housing. These initiatives include: th
City of Hamilton Hostels to Homes Pilot Project; Finding Home; Wesley
Urban Ministries’
Claremont House and
funding for anotherphase of the Good
Shepherd HOMES
program. Hostel to
Homes specifically
targeted people using
shelters for more than
42 days per year and
assisted men and
women to move
directly intopermanent housing
with ongoing support
Immigrants and Refugees
In 2006, the City of Hamilton was the destination for 2.9% of Ontario’simmigrants. Over 25% of Hamilton's population is comprised of immigrantscompared to Ontario with just over 28% (Hamilton Training Advisory Board2009). According to 2006 census data, the poverty rate for recent immigranin 2005 was 51%; this being the highest rate of poverty for any group in theCity of Hamilton (SPRC, 2009b).
There are two shelters in Hamilton that provide settlement services to refugeeMicah House which houses up to nine refugee claimants and SISO New DawnReception House which can assist up to 30 government sponsored refugeesfor a maximum 15 day stay. Refugee claimant families that cannot beaccommodated at Micah House can access the Family Centre. If the FamilyCentre is full then families can be accommodated at a hotel on a short staybasis, subsidized by the City of Hamilton. The Family Centre and otheremergency shelters are not set up to provide comprehensive settlement andintegration services on-site to assist individual and refugee claimant familieswith their transition to Canada and the Hamilton community specifically.
Good Shepherd 40
Mission Services 58
Salvation Army 97
Wesley Centre 40 (mats)
Total 235
Beds/Mats
Table
Shelter Capacity in 2008
160%
140%
120%
100%
80%
60%
40%
20%
1999112%
200970%
200873%
200787%
200687%
200586%
200488%
200390%
2000124%
2001125%
2002153%
Occupancy Rate in the Men's Shelters 1999 – 2009
Homelessness Indicators Report – May 2010 Pag
Figure 2
8/6/2019 On Any Given Night - Homelessness in Hamilton
http://slidepdf.com/reader/full/on-any-given-night-homelessness-in-hamilton 8/16
Urban Aboriginal Homelessness
In Canada’s large urban areas, it is estimated that Aboriginal people compris20% to 50% of the total homeless population (Ontario Off-Reserve HousingTrust Report, 2008). The Aboriginal community in Hamilton has beengrowing steadily reaching 13,735 in 2006, up 55% since 1996 (SPRC,2009a). In 2006, the percentage of Aboriginal individuals within Hamilton'spopulation is 2.8%. (Ibid). The Hamilton Aboriginal population is much
younger than the general population with more than 40% of people underthe age of 24 (Hamilton Training Advisory Board, 2009). Although, reliableHIFIS data pertaining to the Aboriginal status of shelter users is notavailable, some conclusions can be drawn from broader statistical data onurban centres in Canada. Aboriginal people are overrepresented within thehomeless population as a result of poverty, discrimination and other barriersto safe, quality, culturally appropriate and affordable housing (Ontario Off-Reserve Housing Trust Report).
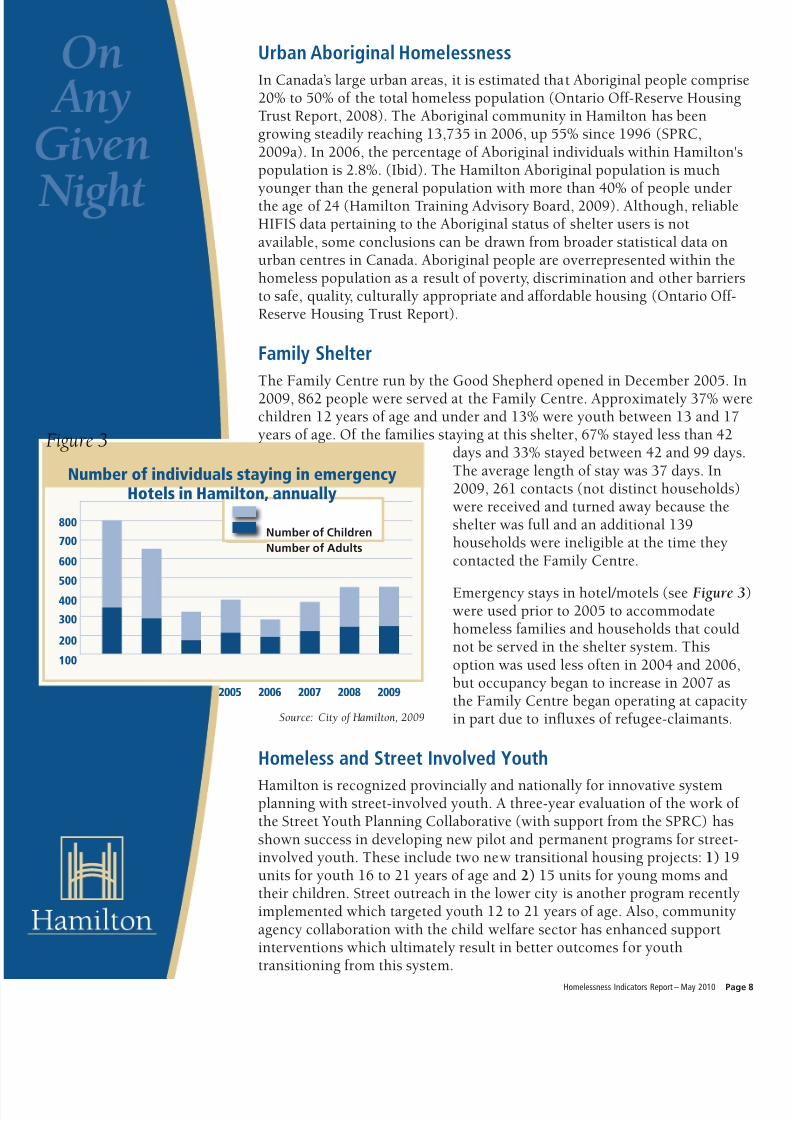
Family Shelter
The Family Centre run by the Good Shepherd opened in December 2005. In2009, 862 people were served at the Family Centre. Approximately 37% wechildren 12 years of age and under and 13% were youth between 13 and 17years of age. Of the families staying at this shelter, 67% stayed less than 42
days and 33% stayed between 42 and 99 daysThe average length of stay was 37 days. In2009, 261 contacts (not distinct households)were received and turned away because theshelter was full and an additional 139households were ineligible at the time theycontacted the Family Centre.
Emergency stays in hotel/motels (see Figure 3were used prior to 2005 to accommodatehomeless families and households that couldnot be served in the shelter system. Thisoption was used less often in 2004 and 2006,but occupancy began to increase in 2007 asthe Family Centre began operating at capacityin part due to influxes of refugee-claimants.
Homeless and Street Involved Youth
Hamilton is recognized provincially and nationally for innovative systemplanning with street-involved youth. A three-year evaluation of the work of the Street Youth Planning Collaborative (with support from the SPRC) hasshown success in developing new pilot and permanent programs for street-involved youth. These include two new transitional housing projects: 1) 19units for youth 16 to 21 years of age and 2) 15 units for young moms andtheir children. Street outreach in the lower city is another program recentlyimplemented which targeted youth 12 to 21 years of age. Also, communityagency collaboration with the child welfare sector has enhanced supportinterventions which ultimately result in better outcomes for youthtransitioning from this system.
800
700
600
500
400
300
200
100
20092008200720062005200420032002
Number of individuals staying in emergencyHotels in Hamilton, annually
Figure 3
Source: City of Hamilton, 2009
Number of Children
Number of Adults
Homelessness Indicators Report – May 2010 Pag
8/6/2019 On Any Given Night - Homelessness in Hamilton
http://slidepdf.com/reader/full/on-any-given-night-homelessness-in-hamilton 9/16
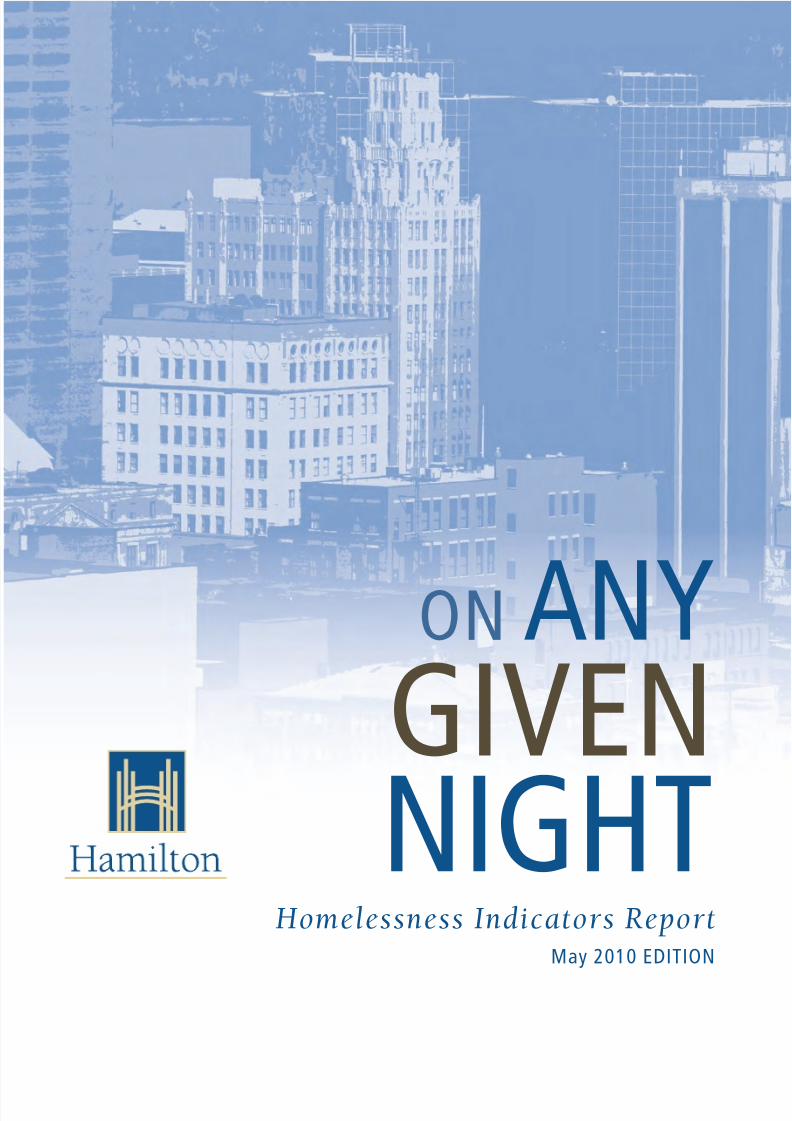
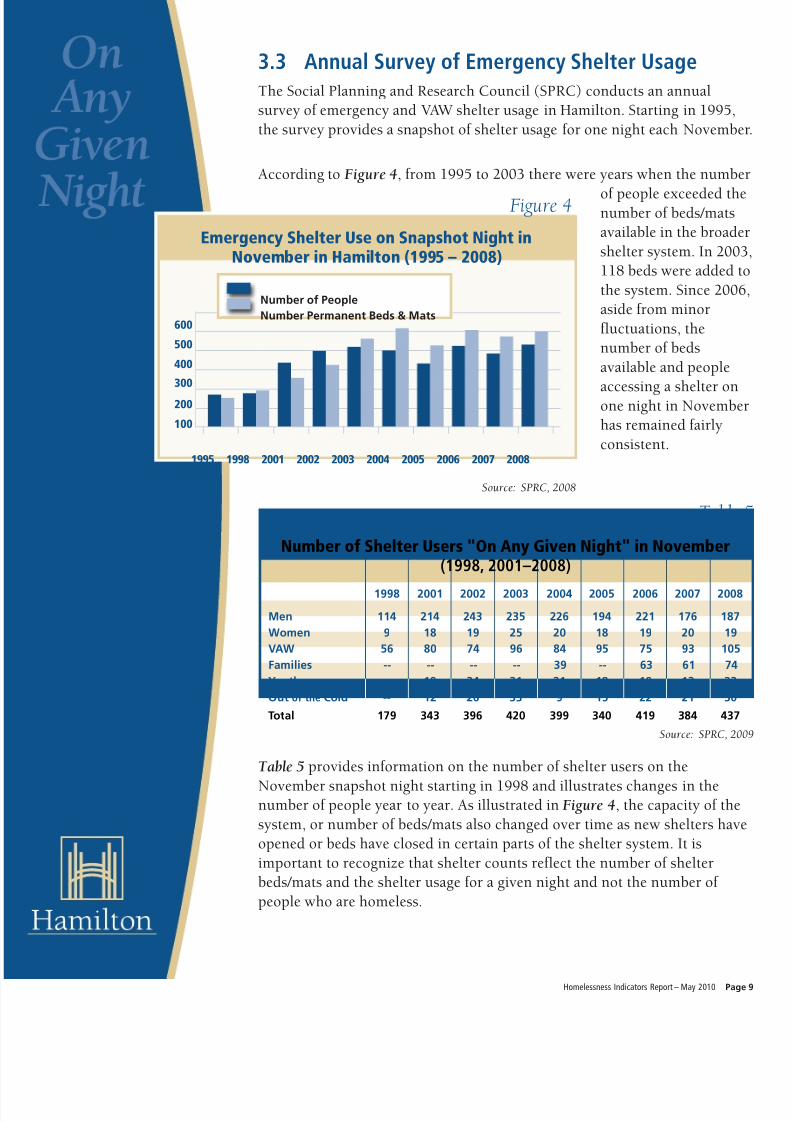
According to Figure 4, from 1995 to 2003 there were years when the numbe
of people exceeded thenumber of beds/mats
available in the broade
shelter system. In 200
118 beds were added t
the system. Since 2006
aside from minor
fluctuations, the
number of beds
available and people
accessing a shelter onone night in Novembe
has remained fairly
consistent.
3.3 Annual Survey of Emergency Shelter UsageThe Social Planning and Research Council (SPRC) conducts an annual
survey of emergency and VAW shelter usage in Hamilton. Starting in 1995,
the survey provides a snapshot of shelter usage for one night each Novembe
Table 5 provides information on the number of shelter users on the
November snapshot night starting in 1998 and illustrates changes in thenumber of people year to year. As illustrated in Figure 4, the capacity of the
system, or number of beds/mats also changed over time as new shelters hav
opened or beds have closed in certain parts of the shelter system. It is
important to recognize that shelter counts reflect the number of shelter
beds/mats and the shelter usage for a given night and not the number of
people who are homeless.
Source: SPRC, 20
Table
Number of Shelter Users "On Any Given Night" in November(1998, 2001–2008)
Men 114 214 243 235 226 194 221 176 187
Women 9 18 19 25 20 18 19 20 19
VAW 56 80 74 96 84 95 75 93 105
Families -- -- -- -- 39 -- 63 61 74
Youth -- 19 34 31 21 18 19 13 22
Out of the Cold -- 12 26 33 9 15 22 21 30
Total 179 343 396 420 399 340 419 384 437
1998 2001 2002 2003 2004 2005 2006 2007 2008
600
500
400
300
200
100
2005200420032002 200820072006200119981995
Emergency Shelter Use on Snapshot Night inNovember in Hamilton (1995 – 2008)
Figure 4
Source: SPRC, 2008
Number of People
Number Permanent Beds & Mats
Homelessness Indicators Report – May 2010 Pag
8/6/2019 On Any Given Night - Homelessness in Hamilton
http://slidepdf.com/reader/full/on-any-given-night-homelessness-in-hamilton 10/16
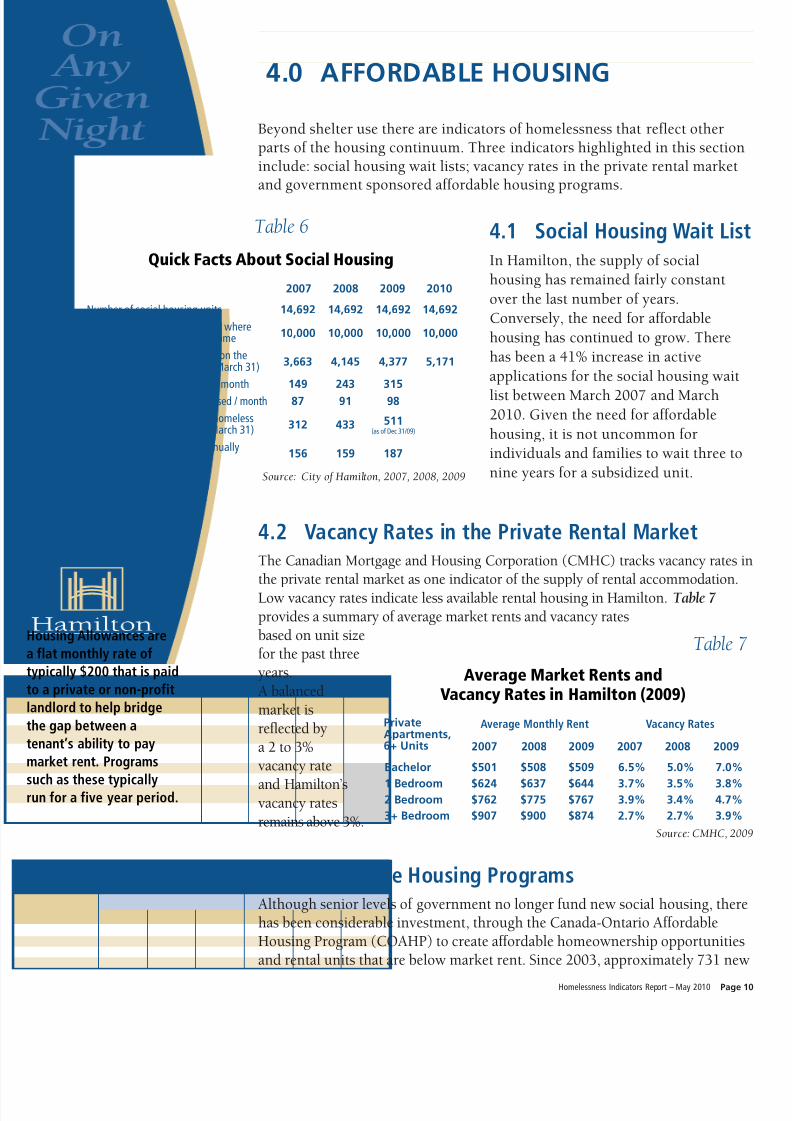
4.0 AFFORDABLE HOUSING
Beyond shelter use there are indicators of homelessness that reflect otherparts of the housing continuum. Three indicators highlighted in this sectioninclude: social housing wait lists; vacancy rates in the private rental marketand government sponsored affordable housing programs.
4.1 Social Housing Wait LisIn Hamilton, the supply of social
housing has remained fairly constant
over the last number of years.
Conversely, the need for affordable
housing has continued to grow. There
has been a 41% increase in active
applications for the social housing wait
list between March 2007 and March2010. Given the need for affordable
housing, it is not uncommon for
individuals and families to wait three to
nine years for a subsidized unit.
4.2 Vacancy Rates in the Private Rental MarketThe Canadian Mortgage and Housing Corporation (CMHC) tracks vacancy rates the private rental market as one indicator of the supply of rental accommodation.
Low vacancy rates indicate less available rental housing in Hamilton. Table 7provides a summary of average market rents and vacancy ratesbased on unit sizefor the past threeyears.A balancedmarket isreflected bya 2 to 3%vacancy rate
and Hamilton’svacancy rates
remains above 3%.
4.3 Affordable Housing ProgramsAlthough senior levels of government no longer fund new social housing, therhas been considerable investment, through the Canada-Ontario AffordableHousing Program (COAHP) to create affordable homeownership opportunitieand rental units that are below market rent. Since 2003, approximately 731 ne
Homelessness Indicators Report – May 2010 Page
Housing Allowances are
flat monthly rate of
ypically $200 that is paid
o a private or non-profit
andlord to help bridge
he gap between a
enant’s ability to pay
market rent. Programs
uch as these typicallyun for a five year period.
Number of social housing units 14,692 14,692 14,692 14,692
Number of social housing units wheretenants pay rent geared to income 10,000 10,000 10,000 10,000
Number of active applications on thesocial housing wait list (as of March 31) 3,663 4,145 4,377 5,171
Number of new applicants per month 149 243 315
Average number of people housed / month 87 91 98
Number of people who have homeless 511status on the wait list (as of March 31) 312 433
(as of Dec 31/09)
Number of people housed annuallywho have homeless status 156 159 187
2007 2008 2009 2010
Table 6
Quick Facts About Social Housing
Source: City of Hamilton, 2007, 2008, 2009
Source: CMHC, 20
Bachelor $501 $508 $509 6.5% 5.0% 7.0%
1 Bedroom $624 $637 $644 3.7% 3.5% 3.8%2 Bedroom $762 $775 $767 3.9% 3.4% 4.7%
3+ Bedroom $907 $900 $874 2.7% 2.7% 3.9%
2007 2008 2009 2007 2008 2009
Average Monthly Rent Vacancy Rates
Average Market Rents andVacancy Rates in Hamilton (2009)
PrivateApartments,6+ Units
Table 7
8/6/2019 On Any Given Night - Homelessness in Hamilton
http://slidepdf.com/reader/full/on-any-given-night-homelessness-in-hamilton 11/16
Lack of an adequate income and an insufficient supply of affordable housing
are the two main reasons people become homeless. Housing is the single
greatest cost for most households. For people whose income is low or fixed
the cost of rent plus utilities can consume a large part of that income. This
section continues to examine indicators of homelessness related to poverty.
rental units, at 20% below market rent, have been built or are underconstruction. Of this number, 622 units are occupied and 109 units areunderway. The City of Hamilton through participation in the COAHPHomeownership program has provided 197 eligible low and moderate incomerenter households with down payment assistance to buy a home.
Housing allowances are another key strategy the federal and provincialgovernments have invested in. Phase 1 and II of the program provided 440
Hamilton households with more affordable rents.
5.0 ACCESS TO AN ADEQUATE INCOME
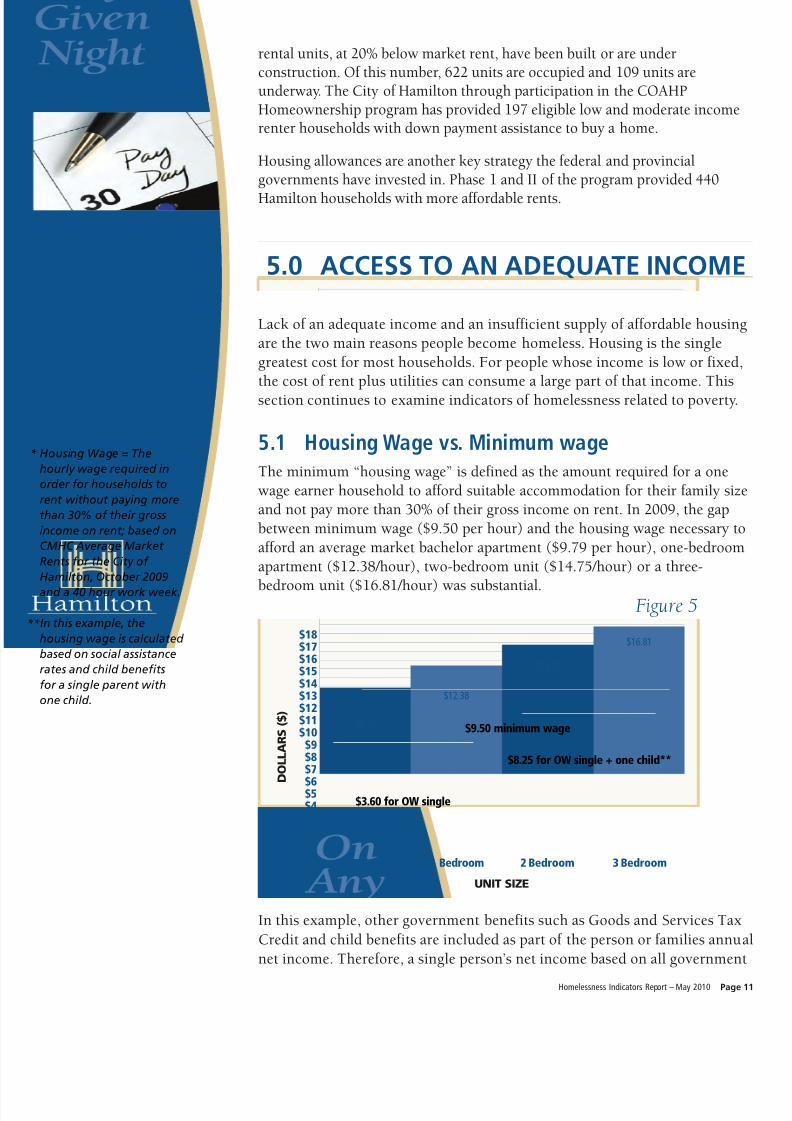
5.1 Housing Wage vs. Minimum wageThe minimum “housing wage” is defined as the amount required for a one
wage earner household to afford suitable accommodation for their family siz
and not pay more than 30% of their gross income on rent. In 2009, the gap
between minimum wage ($9.50 per hour) and the housing wage necessary to
afford an average market bachelor apartment ($9.79 per hour), one-bedroom
apartment ($12.38/hour), two-bedroom unit ($14.75/hour) or a three-
bedroom unit ($16.81/hour) was substantial.
* Housing Wage = The
hourly wage required in
order for households to
rent without paying more
than 30% of their gross
income on rent; based on
CMHC Average Market
Rents for the City of
Hamilton, October 2009
and a 40 hour work week.
*In this example, the
housing wage is calculated
based on social assistance
rates and child benefits
for a single parent with
one child.
Homelessness Indicators Report – May 2010 Page
$18$17$16$15$14$13$12$11$10$9$8$7
$6$5$4$3$2$1$0
3 Bedroom2 Bedroom1 Bedroom
UNIT SIZE
D O L L A R S ( $ )
Bachelor
$3.60 for OW single
$9.50 minimum wage
$8.25 for OW single + one child**
Figure 5
$9.79
$12.38
$14.75
$16.81
In this example, other government benefits such as Goods and Services Tax
Credit and child benefits are included as part of the person or families annu
net income. Therefore, a single person’s net income based on all governmen
8/6/2019 On Any Given Night - Homelessness in Hamilton
http://slidepdf.com/reader/full/on-any-given-night-homelessness-in-hamilton 12/16
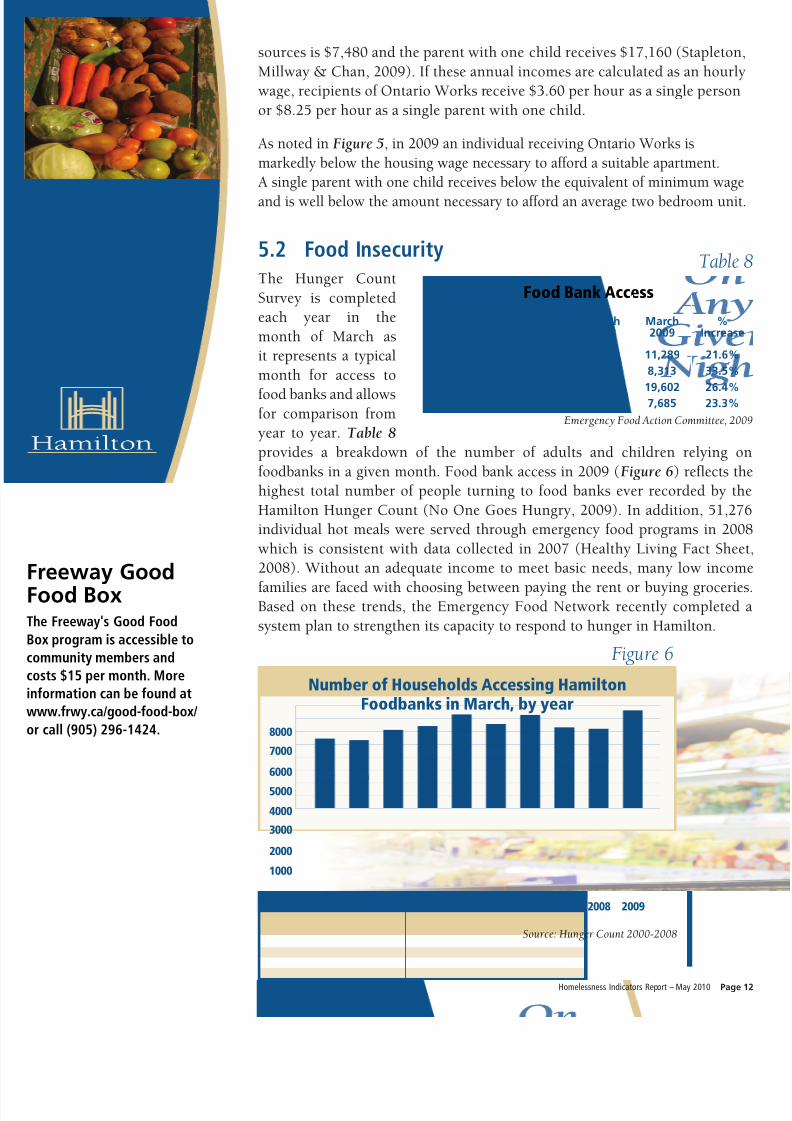
5.2 Food InsecurityThe Hunger Count
Survey is completed
each year in the
month of March as
it represents a typical
month for access to
food banks and allowsfor comparison from
year to year. Table 8
provides a breakdown of the number of adults and children relying o
foodbanks in a given month. Food bank access in 2009 (Figure 6) reflects th
highest total number of people turning to food banks ever recorded by th
Hamilton Hunger Count (No One Goes Hungry, 2009). In addition, 51,27
individual hot meals were served through emergency food programs in 200
which is consistent with data collected in 2007 (Healthy Living Fact Shee
2008). Without an adequate income to meet basic needs, many low incom
families are faced with choosing between paying the rent or buying grocerieBased on these trends, the Emergency Food Network recently completed
system plan to strengthen its capacity to respond to hunger in Hamilton.
6000
7000
8000
5000
4000
3000
2000
1000
2006200520042003 200920082007200220012000
5470 5300
60726401
7392
6597
7357
6388 6234
7685
Number of Households Accessing HamiltonFoodbanks in March, by year
Figure 6
Source: Hunger Count 2000-2008
Emergency Food Action Committee, 20
Adults 9,284 11,289 21.6%
Children 6,227 8,313 33.5%
Total People 15,511 19,602 26.4%Total Households 6,234 7,685 23.3%
March March %2008 2009 Increase
Table
Food Bank Access
Homelessness Indicators Report – May 2010 Page
he Freeway's Good Food
Box program is accessible to
ommunity members and
osts $15 per month. More
nformation can be found at
www.frwy.ca/good-food-box/
r call (905) 296-1424.
Freeway GoodFood Box
sources is $7,480 and the parent with one child receives $17,160 (Stapleton
Millway & Chan, 2009). If these annual incomes are calculated as an hourly
wage, recipients of Ontario Works receive $3.60 per hour as a single person
or $8.25 per hour as a single parent with one child.
As noted in Figure 5, in 2009 an individual receiving Ontario Works is
markedly below the housing wage necessary to afford a suitable apartment.
A single parent with one child receives below the equivalent of minimum wage
and is well below the amount necessary to afford an average two bedroom unit
8/6/2019 On Any Given Night - Homelessness in Hamilton
http://slidepdf.com/reader/full/on-any-given-night-homelessness-in-hamilton 13/16
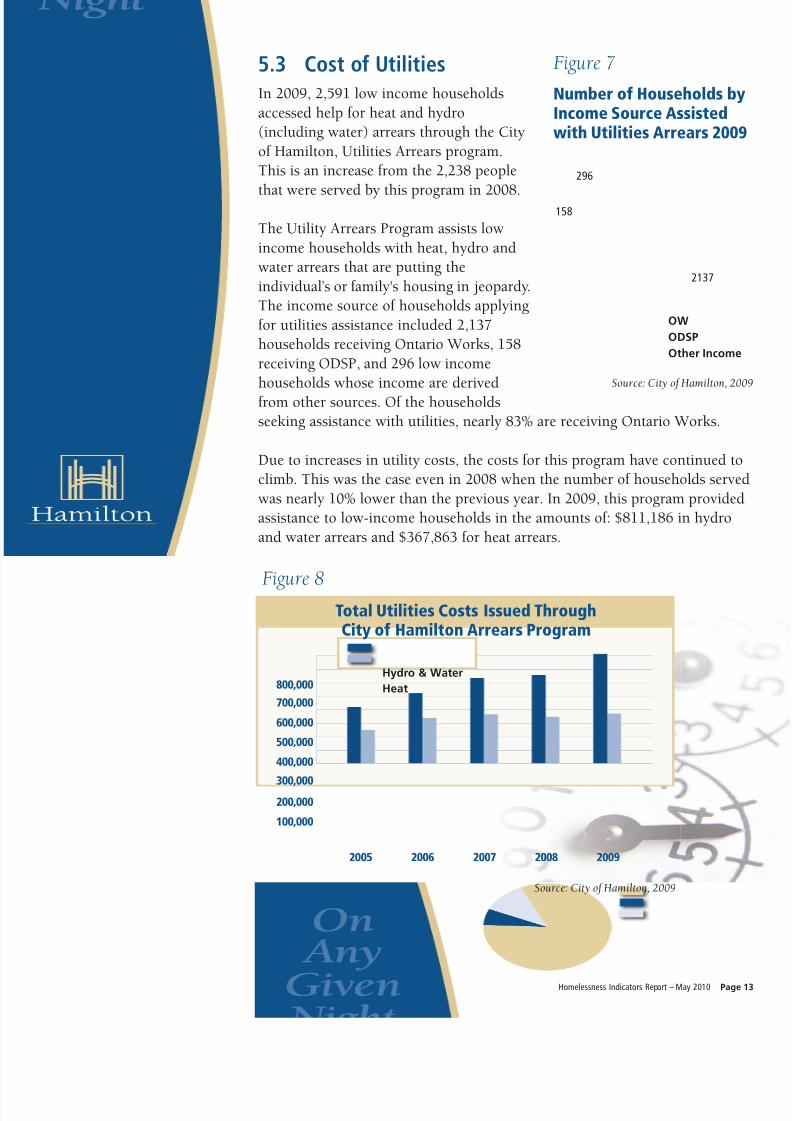
5.3 Cost of UtilitiesIn 2009, 2,591 low income households
accessed help for heat and hydro
(including water) arrears through the City
of Hamilton, Utilities Arrears program.
This is an increase from the 2,238 people
that were served by this program in 2008.
The Utility Arrears Program assists low
income households with heat, hydro and
water arrears that are putting the
individual’s or family's housing in jeopardy.
The income source of households applying
for utilities assistance included 2,137
households receiving Ontario Works, 158
receiving ODSP, and 296 low income
households whose income are derived
from other sources. Of the households
seeking assistance with utilities, nearly 83% are receiving Ontario Works.
Due to increases in utility costs, the costs for this program have continued to
climb. This was the case even in 2008 when the number of households serve
was nearly 10% lower than the previous year. In 2009, this program provided
assistance to low-income households in the amounts of: $811,186 in hydro
and water arrears and $367,863 for heat arrears.
Number of Households byIncome Source Assistedwith Utilities Arrears 2009
Figure 7
296
158
2137
OW
ODSP
Other Income
600,000
500,000
700,000
800,000
400,000
300,000200,000
100,000
2005 2009200820072006
Total Utilities Costs Issued ThroughCity of Hamilton Arrears Program
Figure 8
Source: City of Hamilton, 2009
Source: City of Hamilton, 20
Hydro & Water
Heat
Homelessness Indicators Report – May 2010 Page
8/6/2019 On Any Given Night - Homelessness in Hamilton
http://slidepdf.com/reader/full/on-any-given-night-homelessness-in-hamilton 14/16
5.4 Eviction Prevention• Hamilton Housing Help Centre provides free information, assistance an
advocacy for people with low incomes and people who are homeless or in
danger of becoming homeless. In addition, Hamilton Community Legal
Clinic provide a range of free legal services to low-income tenants. This
includes providing legal information and advice up to providing full
representation at the Landlord & Tenant Board. The clinic also works witthe community to advocate for systemic changes and law reform that wil
help their clients to obtain and retain safe, secure, adequate, accessible
and affordable housing.
• The Rent Bank is a provincial government program that the Housing
Help Centre administers on behalf of the City of Hamilton. In 2009, the
Rent Bank assisted 308 households facing eviction due to rent arrears. Th
average amount of one-time assistance per household to stabilize housing
was $745.31.
• As the largest social housing provider, CityHousing Hamilton togetherwith community partners has taken a lead role in developing an eviction
prevention policy. Since 2006, this policy has been in place to assist in
preventing evictions for economic reasons from CityHousing Hamilton’s
rent-geared-to-income and market rate rental units. The eviction rate from
CityHousing Hamilton’s approximately 6,000 units is less than 1% annually
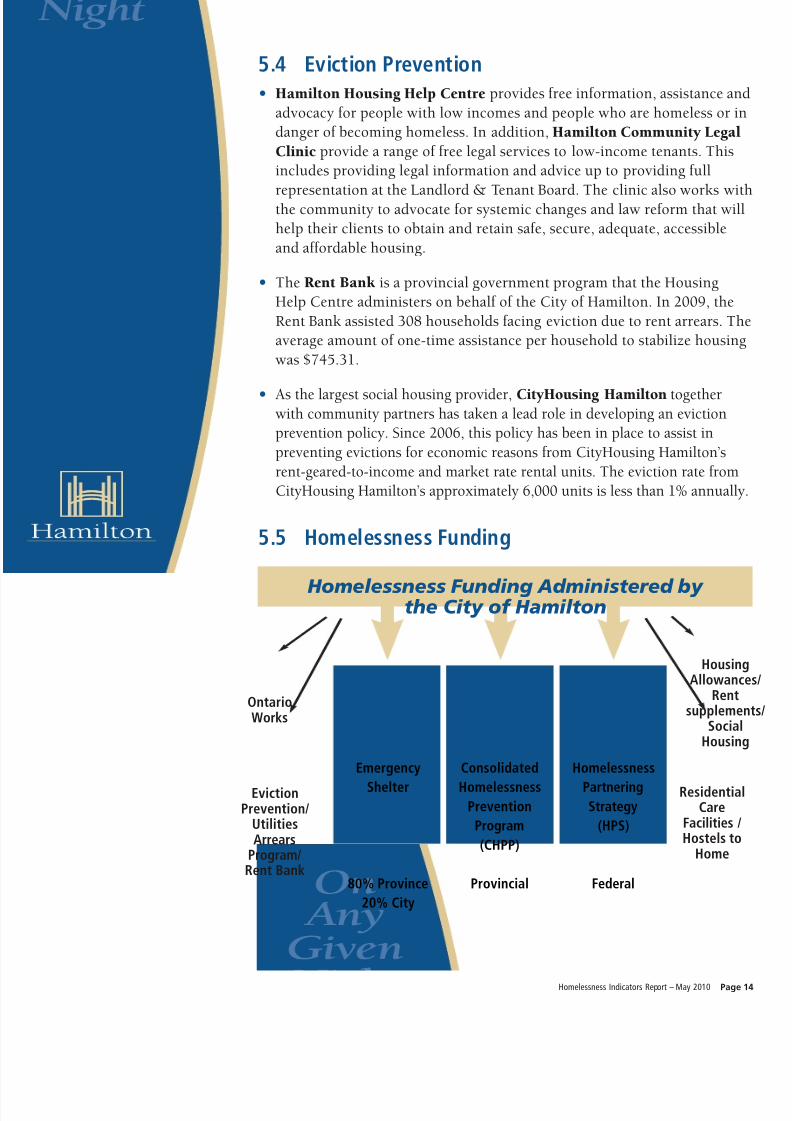
5.5 Homelessness Funding
Homelessness Funding Administered by the City of Hamilton
Emergency
Shelter
80% Province
20% City
OntarioWorks
HousinAllowanc
Rentsuppleme
SociaHousin
EvictionPrevention/
UtilitiesArrears
Program/Rent Bank
ResidentiaCare
Facilities /Hostels to
Home
Consolidated
HomelessnessPrevention
Program
(CHPP)
Provincial
Homelessness
PartneringStrategy
(HPS)
Federal
Homelessness Indicators Report – May 2010 Page
8/6/2019 On Any Given Night - Homelessness in Hamilton
http://slidepdf.com/reader/full/on-any-given-night-homelessness-in-hamilton 15/16
5.6 What’s New?In the past several years, the “Housing First” model has been integrated withthe men's emergency shelter system. The goal is to assist those staying in ashelter to move to permanent housing as quickly as possible and providesupport services to ensure housing stability. This is a departure from acontinuum of care model that is based on the assumption people need to gainnecessary skills or receive treatment before moving along the pathway to
permanent housing. The Hostels to Homes initiative which was profiled in theOn Any Given Night 2007 report has proven to be a successful model based ontenant satisfaction feedback and improved housing stability for long-stay sheltusers. With the Hostels to Homes pilot winding down, a new Integrated MobilCase Management Team, Transitions to Home, is underway. This team willoperate on the best practices established by pre-existing programs such as theMental Health Outreach Team, the HOMES program, Finding Home,Claremont House and the Hostels to Homes Pilot Project.
The Blueprintfor EmergencyShelter Services
he City of Hamilton and
ocal men’s emergency
helter providers are
ndertaking a two yearlan to improve basic
helter services and assist
eople to move into
ermanent housing with
upports. Now in the
mplementation phase the
ey strategies are to:
Reduce the number of
emergency shelter beds
for men due to decliningoccupancy rates
Offer 24/7 access
to all shelters
Implement shared
service standards
Assist long-term shelter
residents to move into
permanent housing with
supports through the
introduction of a mobilecase management team,
Transitions to Home (T2H)
6.0 LIMITATIONS
On Any Given Night is an annual report made available to the communitybased on data collected from various information sources. The report hasseveral biases and limitations worth noting. The focus of this report is rentehouseholds and not low-income homeowners as a high proportion of renterhouseholds in major cities across Canada, particularly those on socialassistance, face severe affordability issues (Jackson, 2004). Also, this reporthighlights a number of indicators and is not intended to provide in-depthanalysis of any one issue. Further, there are other groups affected by poverty
and homelessness such as seniors, people with disabilities and single parenthouseholds who are not profiled in this edition of the report.
7.0 REFERENCES
Jackson, Andrew. (2004). Home Truths: Why the Housing System Matters to All Canadians. Ottawa: Canadian.Centre for Policy Alternatives and the Canadian Housing Renewal Association.
Mayo, Sara and Don Jaffray (2009a). Hamilton’s Social Landscape: A Report of Important Trends, 1996-2006.Social Planning and Research Council of Hamilton.
Mayo, Sara and Mark Fraser. (2009b). Incomes and Poverty in Hamilton. Social Planning and Research Council oHamilton.
Mottet, L., and J. Ohle. (2003). Transitioning Our Shelters: A Guide to Making Homeless Shelters Safe forTransgender People. New York: The National Coalition for the Homeless and the National Gay and Lesbian TaskForce Policy Institute. http://www.thetaskforce.org/downloads/reports/reports/TransitioningOurShelters.pdf
Ontario Federation of Indian Friendship Centres (OFIFC), the Métis Nation of Ontario (MNO) and the OntarioNative Women’s Association (ONWA). (2009). Ontario Off-Reserve Aboriginal Housing Trust Report.http://www.onwabay.ca/PDF%20Files/Forms/March%203%20Revised%20Final%20OAHT%20Report-FINAL.pd
Stapleton, John; James Millway and Katherine Chan. (2009). Time for a “Made in Ontario” Working Income TaxBenefit. Institute for Competitveness & Properity/Open Policy Ontario.
Travis, J. (March 2009). Top 2009: Planning for Prosperity. Hamilton Training & Advisory Board.
Homelessness Indicators Report – May 2010 Page
8/6/2019 On Any Given Night - Homelessness in Hamilton
http://slidepdf.com/reader/full/on-any-given-night-homelessness-in-hamilton 16/16
The Social Planning and Research Council is recognized for their important
contribution to this edition of On Any Given Night. The information and
insightful feedback from community partners made this edition possible.
For this report and other research on homelessness please see the
City of Hamilton’s website at www.hamilton.ca/homelessness
For more information please contact:
Suzanne Swanton
Social Policy Analyst, Community Services
City of Hamilton, [email protected]
or
Molly Elliott
Senior Policy Analyst, Community Services
City of Hamilton, [email protected]