Embed Size (px)
Citation preview

Subscriber access provided by UNIV ILLINOIS URBANA
Nano Letters is published by the American Chemical Society. 1155 SixteenthStreet N.W., Washington, DC 20036
Letter
Current-Phase Relationship, Thermal and QuantumPhase Slips in Superconducting Nanowires Made
on a Scaffold Created Using Adhesive TapeMyung-Ho Bae, Robert C. Dinsmore III, Thomas Aref, Matthew Brenner, and Alexey Bezryadin
Nano Lett., Article ASAP • DOI: 10.1021/nl803894m • Publication Date (Web): 03 April 2009
Downloaded from http://pubs.acs.org on April 10, 2009
More About This Article
Additional resources and features associated with this article are available within the HTML version:
• Supporting Information• Access to high resolution figures• Links to articles and content related to this article• Copyright permission to reproduce figures and/or text from this article
Current-Phase Relationship, Thermaland Quantum Phase Slips inSuperconducting Nanowires Made on aScaffold Created Using Adhesive TapeMyung-Ho Bae,* Robert C. Dinsmore III, Thomas Aref, Matthew Brenner,and Alexey Bezryadin
Department of Physics, UniVersity of Illinois at Urbana-Champaign,Urbana 61801, Illinois
Received December 24, 2008; Revised Manuscript Received February 22, 2009
ABSTRACT
Quantum phase slippage (QPS) in a superconducting nanowire is a new candidate for developing a quantum bit [Mooij et al. New J. Phys.2005, 7, 219; Mooij et al. Nat. Phys. 2006, 2, 169; Khlebnikov http://arxiv.org/abs/quant-ph/0210019 2007]. It has also been theoretically predictedthat the occurrence of QPS significantly changes the current-phase relationship (CPR) of the wire due to the tunneling between topologicallydifferent metastable states [Khlebnikov Phys. Rev. B 2008, 78, 014512]. We present studies on the microwave response of the superconductingnanowires to reveal their CPRs. First, we demonstrate a simple nanowire fabrication technique, based on commercially available adhesivetapes, which allows making thin superconducting wire from different metals. We compare the resistance vs temperature curves of Mo76Ge24
and Al nanowires to the classical and quantum models of phase slips. In order to describe the experimentally observed microwave responsesof these nanowires, we use the McCumber-Stewart model [McCumber J. Appl. Phys. 1968, 39, 3113; Stewart Appl. Phys. Lett. 1968, 12, 277],which is generalized to include either classical or quantum CPR.
Superconducting nanowires (SNWs) have acquired a lot ofattention recently due to their potential application in photondetectors5 and in quantum bits.1,2 The fundamental interestin SNWs is motivated by the observation of quantum phaseslip (QPS) in them.6-10 The supercurrent in a SNW isdetermined by the phase difference φ between two ends ofthe SNW, and the relationship is known as the current-phaserelationship (CPR). Although it has been assumed for manydecades that CPR of long wires is multivalued,11,12 recentanalysis of this problem that has taken QPS into accounthas shown that CPR must be single-valued.3,13 A useful wayto probe the CPR is to study the superconducting transportunder microwave (MW) radiation,14 which changes the phasedifference periodically and produces lock-in resonances,which occur as voltage plateaus on the voltage-current (V(I))curves, known as Shapiro steps (ShSs).15,16
In this letter, we investigate such resonant behaviors intwo different wires: Mo76Ge24 and Al nanowires. To fabricatethese nanowires, we have developed a simple method basedon adhesive tape scaffolds. We measure V(I) curves underMWs and observe voltage plateaus on them, which cor-respond to the phase lock-in resonances. Both Mo76Ge24 and
Al SNWs show half-integer resonances, at high enoughfrequencies (above ∼8 GHz). We model this phenomenonusing the McCumber-Stewart approach,4 by assuming anonsinusoidal CPR. The best agreement between the modelsand the data is obtained if we assume that transport propertiesof Mo76Ge24 wires are dominated by thermally activatedphase slips (TAPS) and long enough to have a multivaluedCPR. Yet, at the same time, R(T) curves of Mo76Ge24 wirescan be fit with theoretical curves originating from QPStheories.17,18 Thus the possibility of QPS effects influencingR(T) curves cannot be excluded. The Al wire sample alsoshows fractional Shapiro steps. This fact indicates that theCPR of the wire can not be a nonquantum shortwire limitCPR.11 We explain the results using quantum CPR due tothe work of Khlebnikov.3,13 Yet, the possibility that the wireis not short enough and thus its CPR is close to themultivalued case (i.e., in the intermediate regime) cannotbe excluded definitely.
We observe that when a piece of an adhesive tape isattached to a flat substrate with a trench19 and subsequentlypeeled off from the substrate as shown in Figure 1a, somepolymer nanostrings are suspended over the trench if thewidth of the trench is sufficiently small, i.e., a few microme-ters wide or less [see also the Supporting Information]. Figure1b shows a scanning electron microscope (SEM) image of* Corresponding author. E-mail: [email protected].
NANOLETTERS
XXXXVol. xx, No. x
-
10.1021/nl803894m CCC: $40.75 XXXX American Chemical Society
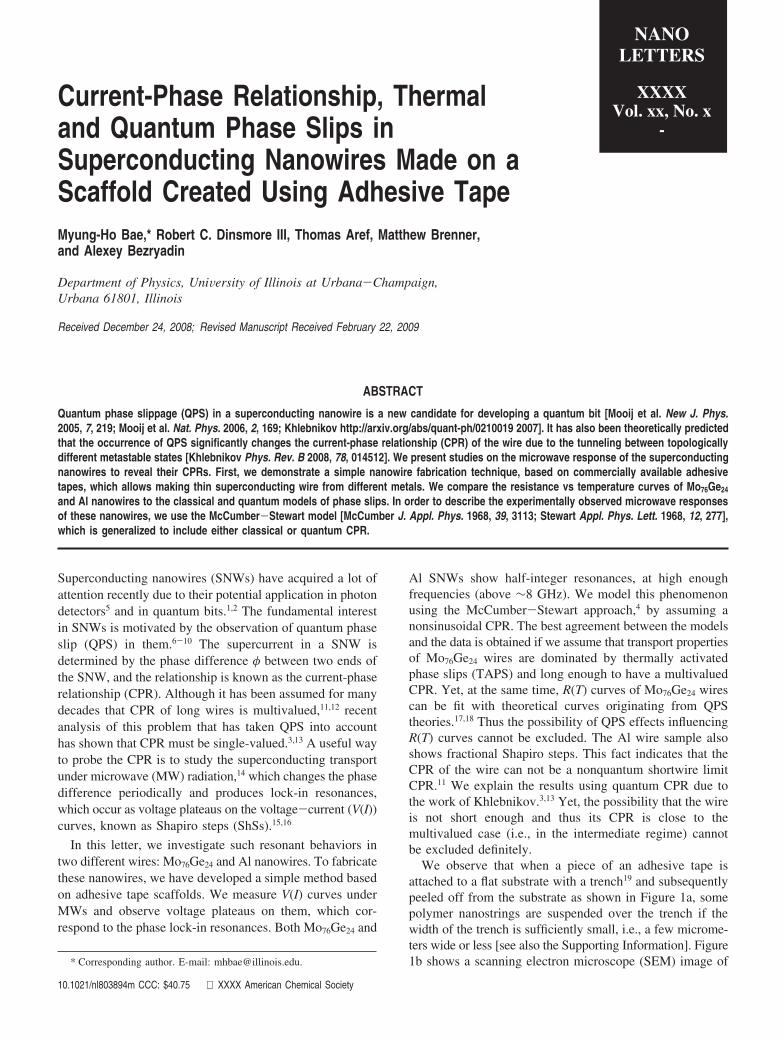
two parallel representative polymer nanostrings suspendedover a trench after the “tape-peel-off” process, where thewidth of the trench is ∼1.2 µm. The widths of both stringsare ∼45 nm. We noticed that narrower trenches gave smallerwidths. For example, 20 nm-wide strings have been obtainedover an 80-nm-wide trench (Figure 1e).
We sputtered amorphous Mo76Ge24 alloy to the substratehaving nanostrings under a pressure of 1 × 10⁻⁷ Torr at roomtemperature. Samples for a high-resolution transmissionelectron microscope (TEM) imaging were prepared bydepositing polymer nanostrings on TEM compatible slits asshown in Figure 1a. Figure 1c shows a high-resolution TEMimage of part of the 12 nm-thick Mo76Ge24 nanowire on a0.8 µm-long nanostring template, where the width (w) ofthe nanostring is 28 nm. Figure S1d of the SupportingInformation shows the entire TEM image of the nanowireof Figure 1c. Figure S1e of the Supporting Information alsoshows that the metal connection from a thin film electrodeto the nanowire is very smooth. To perform electronictransport measurements, we fabricated an undercut-trenchsubstrate as shown in Figure 1d, where the undercuts formingat the SiO2 layer are indicated by arrows. After the formationof the nanostrings over the undercut-trench, we used a PDMS(polydimethylsiloxane) contact mask to define thin-filmelectrodes. Figure 1e shows an SEM image of many Alnanowires in parallel, after sputtering a 25 nm-thick layerof Al metal, where all nanowires show nearly the same widthof 20 nm. We cut all nanowires, except one, by a focusedion beam and got a sample with one nanowire across theelectrodes as shown in the lower inset of Figure 2a. In thesample preparation process with polymer nanostrings,we did not use any chemical process because polymers canbe easily damaged by chemical treatments.
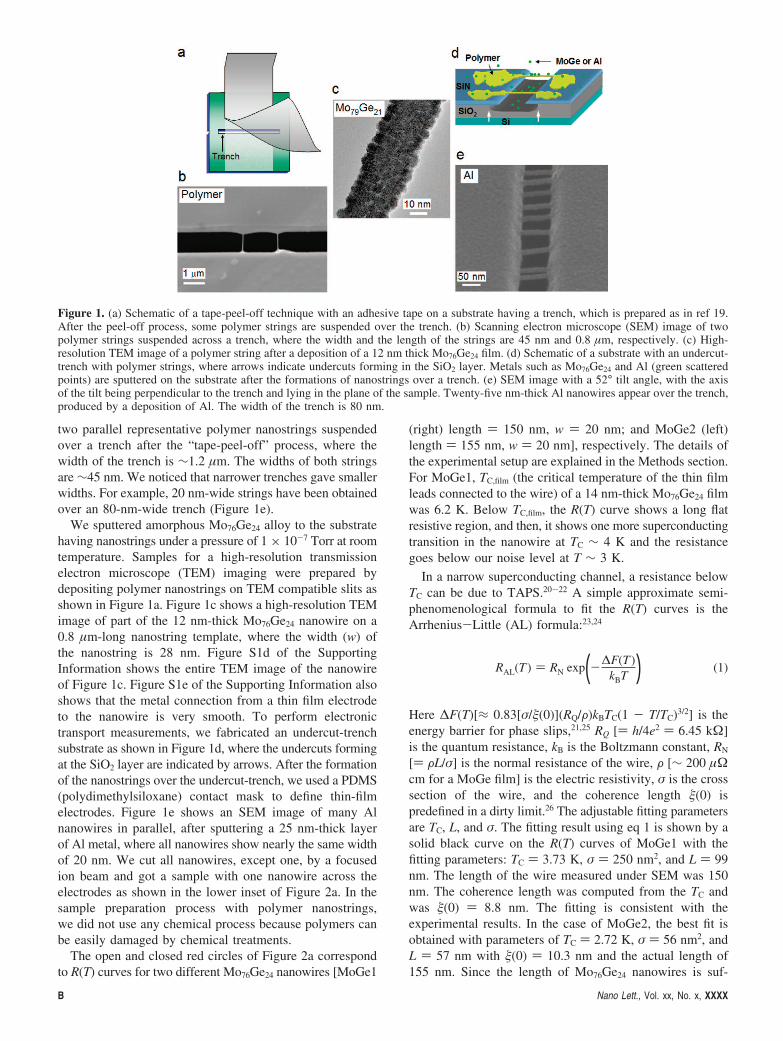
The open and closed red circles of Figure 2a correspondto R(T) curves for two different Mo76Ge24 nanowires [MoGe1
(right) length ) 150 nm, w ) 20 nm; and MoGe2 (left)length ) 155 nm, w ) 20 nm], respectively. The details ofthe experimental setup are explained in the Methods section.For MoGe1, TC,film (the critical temperature of the thin filmleads connected to the wire) of a 14 nm-thick Mo76Ge24 filmwas 6.2 K. Below TC,film, the R(T) curve shows a long flatresistive region, and then, it shows one more superconductingtransition in the nanowire at TC ∼ 4 K and the resistancegoes below our noise level at T ∼ 3 K.
In a narrow superconducting channel, a resistance belowTC can be due to TAPS.20-22 A simple approximate semi-phenomenological formula to fit the R(T) curves is theArrhenius-Little (AL) formula:23,24
Here ∆F(T)[≈ 0.83[σ/(0)](RQ/F)kBTC(1 - T/TC)3/2] is theenergy barrier for phase slips,21,25 RQ [) h/4e2 ) 6.45 kΩ]is the quantum resistance, kB is the Boltzmann constant, RN
[) FL/σ] is the normal resistance of the wire, F [∼ 200 µΩcm for a MoGe film] is the electric resistivity, σ is the crosssection of the wire, and the coherence length (0) ispredefined in a dirty limit.26 The adjustable fitting parametersare TC, L, and σ. The fitting result using eq 1 is shown by asolid black curve on the R(T) curves of MoGe1 with thefitting parameters: TC ) 3.73 K, σ ) 250 nm2, and L ) 99nm. The length of the wire measured under SEM was 150nm. The coherence length was computed from the TC andwas (0) ) 8.8 nm. The fitting is consistent with theexperimental results. In the case of MoGe2, the best fit isobtained with parameters of TC ) 2.72 K, σ ) 56 nm2, andL ) 57 nm with (0) ) 10.3 nm and the actual length of155 nm. Since the length of Mo76Ge24 nanowires is suf-
Figure 1. (a) Schematic of a tape-peel-off technique with an adhesive tape on a substrate having a trench, which is prepared as in ref 19.After the peel-off process, some polymer strings are suspended over the trench. (b) Scanning electron microscope (SEM) image of twopolymer strings suspended across a trench, where the width and the length of the strings are 45 nm and 0.8 µm, respectively. (c) High-resolution TEM image of a polymer string after a deposition of a 12 nm thick Mo76Ge24 film. (d) Schematic of a substrate with an undercut-trench with polymer strings, where arrows indicate undercuts forming in the SiO2 layer. Metals such as Mo76Ge24 and Al (green scatteredpoints) are sputtered on the substrate after the formations of nanostrings over a trench. (e) SEM image with a 52° tilt angle, with the axisof the tilt being perpendicular to the trench and lying in the plane of the sample. Twenty-five nm-thick Al nanowires appear over the trench,produced by a deposition of Al. The width of the trench is 80 nm.
RAL(T ) ) RN exp(-∆F(T )kBT ) (1)
B Nano Lett., Vol. xx, No. x, XXXX
ficiently longer than (0) and σ < 4.4, these wires are ina quasi-one-dimensional long wire limit.11,20,21
On the other hand, the R(T) curve of the Al nanowire [Al-1, length ) 80 nm, w ) 20 nm; the nominal thickness is 25nm] in Figure 2b shows a long resistance tail, occurring atT < TC,film. The AL fit (a black curve) shows a deviationfrom data below T ) 1.62 K because the measured tail hasa positive curvature. The AL fit always has a negativecurvature (in the log-linear plot) because the thermal activa-tion is governed by Arrhenius-type exponential term, likein Figure 2a. In addition, the coherence length 3.5 nmestimated from the TAPS fitting (i.e., using the AL fit) ismuch shorter than the computed length of (50 ( 20) nm ina dirty limit with 0 ) 1.6 µm and l ) (2 ( 1) nm for a∼25 nm thick Al film.27 Following previous experiments onAl wires,10 we attempt to explain the results using a notionof QPS. In these events the phase slips by 2π through a QPSprocess. The R(T) curve, considering the dissipation by QPSin the Golubev-Zaikin (GZ) theory,28,10 is
where SQPS [) A(RQ/RN)(L/(T))] is the effective action andB and A are adjustable parameters. The dashed green curvein Figure 2b is the best fit to eq 2, with (0) ) 60 nm, wherethe adjustable parameters were TC ) 1.81 K, RN ) 1.37 kΩ,L ) 80 nm, B ) 5.1, and A ) 3. Note that in this case wefit the data using only the QPS term, without including theTAPS term.10 The Al-1 fit in Figure 2b is in good agreementwith the data, which indicates that the resistance tail couldoriginate from the QPS. Now we compare our results to theexperiment of Zgirski et al.29 Their R(T) measurements showthat homogeneous wires which are thinner than ∼15 nm indiameter can show a pronounced QPS behavior. Homoge-neous wires which are thicker than that, say ∼17 nm indiameter, show only signatures of thermally activated phase
slips. Yet non-Arrhenius tails can be observed quite fre-quently in as-produced Al wires, even in those which havecomparatively large diameter of e.g. ∼70 nm. Clearly suchtails are due to weak links, the presence of which greatlyincreases the probability of TAPS and possibly QPS.
Since our wire is ∼20-25 nm in diameter, most probablythe tail we observe is due to some narrow spot in the wire.Yet this narrow segment itself constitutes a weak link whichcan be analyzed in order to determine whether its resistanceis due to TAPS or QPS. On the other hand, since a resistancetail can also originate from external noise or the inhomo-geneity of the nanowire,30 one should be careful in theanalysis with R(T) curves.
Recently, some theories have predicted that superconduct-ing wires in the QPS regime can show a sharp (Arrhenius-type) decrease of the resistance with decreasing tempera-ture.17,18 We compare the experimental R(T) curves to sucha theory. It was developed by Khlebnikov,18 and it is validwhen the QPS rate is low. The resistance as a function oftemperature is given by RKQPS(T) ) RN exp[-(π2RQ∆(T))/(4RNT) tanh(∆(T)/2T)],18 where ∆(T) is the BCS (Bardeen-Cooper-Schrieffer) superconducting gap energy. The fits areshown by sold blue lines in Figure 2. The best fittingparameters were TC ) 3.6 K and RN ) 1.7 kΩ for MoGe1,TC ) 2.32 K and RN ) 3.6 kΩ for MoGe2, and TC ) 1.83K and RN ) 3.2 kΩ for Al-1. The fits agree well with theMoGe wire data but not with the Al wire data, probably dueto a high fugacity of QPS in our Al sample or the presenceof weak links. Now we discuss MoGe samples. Themeasured values for the normal resistance were RN ) 2.5and 4.3 kΩ for MoGe1 and MoGe2, respectively. Thus wefind that RN used in the KQPS fits is in approximateagreement (same order of magnitude) with the measured RN.These fits, as well as those done by Meiden et al.,17 suggesta possibility that QPS (possibly thermally assisted QPS), notTAPS, explain the resistance of nanowires at temperatures
Figure 2. (a) R(T) curves of two Mo76Ge24 nanowires (MoGe1, open circles, and MoGe2, closed circles). The solid black line on each R(T)curve is the best fit produced by the Arrhenius-Little (AL) formula RAL(T) (eq 1), which is due to TAPS, with the three fitting parameterslisted in the text. The solid blue lines are obtained from the Khlebnikov QPS theory (KQPS), RKQPS(T).3,13 (upper inset): SEM image ofwire MoGe1. The scale bar is 200 nm. (lower inset): Schematic for the transport measurement setup. The lower nanowire, drawn in Figure1d, is removed. A focused ion beam is used to remove unwanted nanowires. (b) R(T) curve of an Al nanowire (Al-1, scattered points). Thedashed green curve is the prediction of the Golubev-Zaikin QPS theory (RGZQPS(T))28 with five fitting parameters (listed in the text), andthe solid black curve corresponds to the phenomenological AL fit (RAL(T)).23 The solid blue line is the best fit predicted by KQPS theory.
RGZQPS(T) ) BRQSQPS(L/(T)) exp[-SQPS] (2)
Nano Lett., Vol. xx, No. x, XXXX C
comparable to TC. But, since the AL fit works also quitewell, the possibility of TAPS being the dominant phenom-enon cannot be ruled out. Qualitatively different experiments,therefore, are needed to establish whether the TAPS or theQPS is the main contributor to the measured resistance.Below we describe one such experiment, which involvesmicrowave radiation.
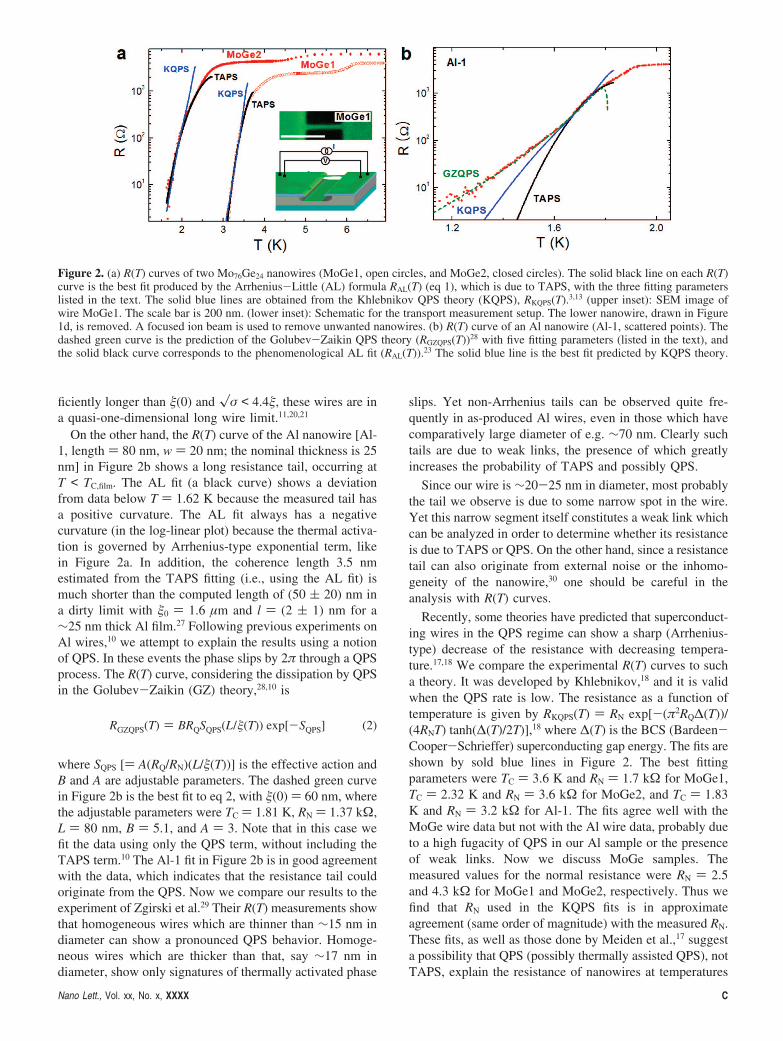
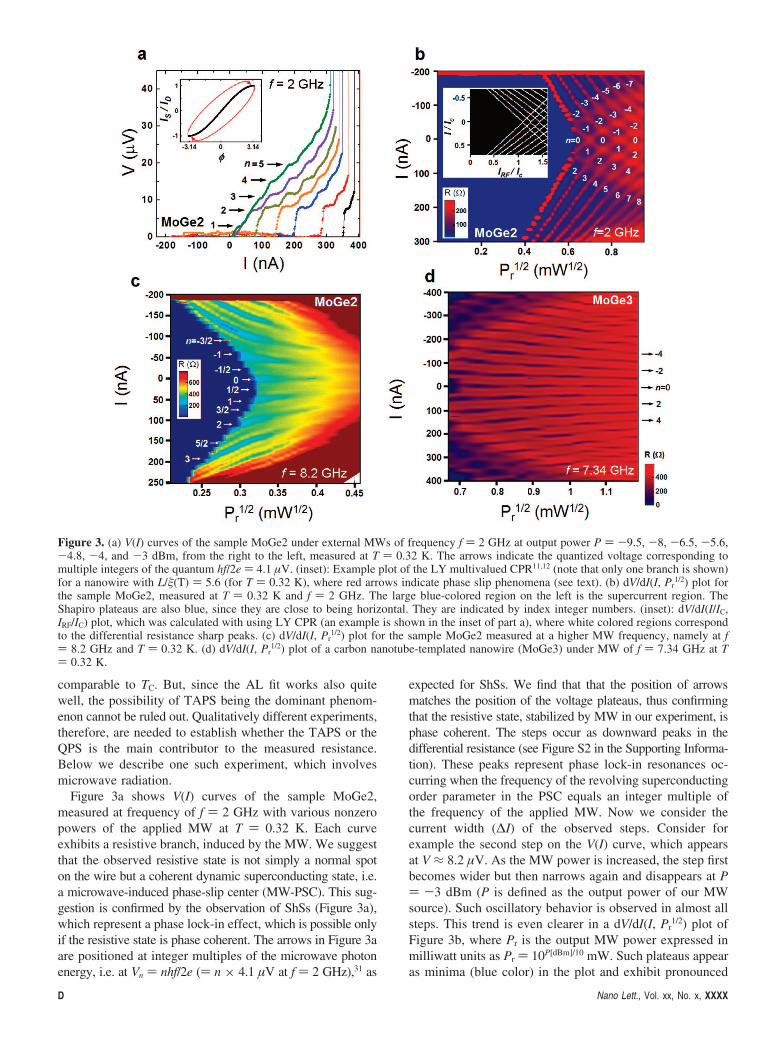
Figure 3a shows V(I) curves of the sample MoGe2,measured at frequency of f ) 2 GHz with various nonzeropowers of the applied MW at T ) 0.32 K. Each curveexhibits a resistive branch, induced by the MW. We suggestthat the observed resistive state is not simply a normal spoton the wire but a coherent dynamic superconducting state, i.e.a microwave-induced phase-slip center (MW-PSC). This sug-gestion is confirmed by the observation of ShSs (Figure 3a),which represent a phase lock-in effect, which is possible onlyif the resistive state is phase coherent. The arrows in Figure 3aare positioned at integer multiples of the microwave photonenergy, i.e. at Vn ) nhf/2e () n × 4.1 µV at f ) 2 GHz),31 as
expected for ShSs. We find that that the position of arrowsmatches the position of the voltage plateaus, thus confirmingthat the resistive state, stabilized by MW in our experiment, isphase coherent. The steps occur as downward peaks in thedifferential resistance (see Figure S2 in the Supporting Informa-tion). These peaks represent phase lock-in resonances oc-curring when the frequency of the revolving superconductingorder parameter in the PSC equals an integer multiple ofthe frequency of the applied MW. Now we consider thecurrent width (∆I) of the observed steps. Consider forexample the second step on the V(I) curve, which appearsat V ≈ 8.2 µV. As the MW power is increased, the step firstbecomes wider but then narrows again and disappears at P) -3 dBm (P is defined as the output power of our MWsource). Such oscillatory behavior is observed in almost allsteps. This trend is even clearer in a dV/dI(I, Pr
1/2) plot ofFigure 3b, where Pr is the output MW power expressed inmilliwatt units as Pr ) 10P[dBm]/10 mW. Such plateaus appearas minima (blue color) in the plot and exhibit pronounced
Figure 3. (a) V(I) curves of the sample MoGe2 under external MWs of frequency f ) 2 GHz at output power P ) -9.5, -8, -6.5, -5.6,-4.8, -4, and -3 dBm, from the right to the left, measured at T ) 0.32 K. The arrows indicate the quantized voltage corresponding tomultiple integers of the quantum hf/2e ) 4.1 µV. (inset): Example plot of the LY multivalued CPR11,12 (note that only one branch is shown)for a nanowire with L/(T) ) 5.6 (for T ) 0.32 K), where red arrows indicate phase slip phenomena (see text). (b) dV/dI(I, Pr
1/2) plot forthe sample MoGe2, measured at T ) 0.32 K and f ) 2 GHz. The large blue-colored region on the left is the supercurrent region. TheShapiro plateaus are also blue, since they are close to being horizontal. They are indicated by index integer numbers. (inset): dV/dI(I/IC,IRF/IC) plot, which was calculated with using LY CPR (an example is shown in the inset of part a), where white colored regions correspondto the differential resistance sharp peaks. (c) dV/dI(I, Pr
1/2) plot for the sample MoGe2 measured at a higher MW frequency, namely at f) 8.2 GHz and T ) 0.32 K. (d) dV/dI(I, Pr
1/2) plot of a carbon nanotube-templated nanowire (MoGe3) under MW of f ) 7.34 GHz at T) 0.32 K.
D Nano Lett., Vol. xx, No. x, XXXX
“diamond” structures. Each diamond is marked with aninteger number, corresponding to the order of the resonance.The presence of the diamond structure shows explicitly thequasi-periodic oscillation of the current widths of the voltageplateaus in the corresponding V(I) curves (Figure 3a).
Now, we suggest a model to describe the data of the typeshown in Figure 3b. In a long wire limit, Likharev andYakobson (LY) predicted that the CPR of the nanowirebecomes multivalued at L/(T) g 3.6.11,12,32 Such LY CPRhas a form of IS(φ) ) IC(φ(T)/LS)[1 -(φ(T)/LS)2], whichis illustrated in the inset of Figure 3a (a black solid curve)for the MoGe2 wire with L/(0.3 Κ) ∼ 5.6 for - 3.23 e φ
e 3.23, which has a multivalued CPR, and (T) ) (0)(1 -T/TC)-1/2. In the LY CPR exemplified in Figure 3a, the phaseslip by +2π must occur at φm ) 3.23, for a forward currentsweep direction, and at φm ) -3.23 (by -2π), for abackward current sweep direction, where the φm pointscorrespond to the maximum supercurrent. The phase slipprocesses are indicated by red arrows in the inset of Figure3a. Using this CPR for the phase slip events, we numericallycalculated the differential resistance of the wire as a functionof a DC current and an AC current (dV/dI(I/IC, IRF/IC)), usingthe McCumber-Stewart mode4 at a reduced frequency Ω) 0.08 in a resistively shunted case [see the Methodssection], where IRF is proportional to Pr
1/2. The result is shownin the inset of Figure 3b. It is qualitatively consistent withexperimental results in the main panel of Figure 3b.
With increasing frequency, dV/dI vs 2eV/hf (differentialconductance vs normalized voltage) curves start to show half-integer steps at f ) 8.2 GHz as shown in Figure S2a of theSupporting Information.33 Figure 3c shows the dV/dI(I, Pr
1/2)plot measured at f ) 8.2 GHz on MoGe2 at T ) 0.32 K,where half-integer steps with integer steps are shown. Atthis high frequency, we observe a new feature: cyan-coloredareas surrounding the yellow regions, which correspond tothe voltage plateaus and do not cross and there is nodiamonds structure. The oscillation amplitude of ∆I (∆I isthe vertical height of a cyan-colored region in Figure 3c, ata fixed power value) with increasing power is also very weakor absent. To check whether these observations are consistentwith the multivalued LY CPR in a long wire limit, wenumerically calculated dV/dI(I/IC, IRF/IC) plots correspondingto three different situations: a short wire case with L/(0) ,1 (using a single-valued nonsinusoidal CPR suggested byKulik and Omelyanchuk;34 Figure S3a) and two long wirecases (multivalued nonsinusoidal LY CPRs) of L/(0) ) 5.6(Figure S3b) and L/(0) ) 5.9 (Figure S3c) at Ω ) 0.8 inthe Supporting Information. The frequency Ω was tuned tomatch the apparent highest order of fractional resonances inthe data (Figure 3c and d). In the calculation, the currentwidths corresponding to each voltage plateau in the threecases considered above oscillate with power but do not goto zero at any power. Therefore, this nonzero behavior in∆I is a common property of these nonsinusoidal CPRs (wechecked explicitly that ∆I does go to zero at certain valuesof the MW power if the CPR is sinusoidal). In the simulation,δImin, the minimum of the current width corresponding tothe interval between two resistance peaks for the n ) 0
Shapiro steps, gets larger with increasing L/ (see FigureS3c). Thus, the apparent nonzero δImin with increasing powerby Pr
1/2 ) 0.4 mW1/2 in Figure 3c could be related to thismultivalued CPR. However, in Figure 3c, the oscillationbehavior, predicted by computations (Figure S3c), is notvisible. Our explanation is that the examined power is toostrong to show a pronounced oscillation behavior, i.e., thissystem goes to a noncoherent resistive state without reso-nance steps just above Pr
1/2 ∼ 0.45 mW1/2. To verify that ∆I(P) can show oscillations with increasing power (as ournumerical simulation predicts), we prepared another longwire (MoGe3) using a different method, namely the fluor-inated-carbon-nanotube-templating method.19 The MoGe3sample was also made of Mo76Ge24 alloy. The length of thewire was ∼100 nm. Figure 3d shows MWs response (f )7.34 GHz) of the MoGe3. The plot is rich in details. Theblue color represents the minima of the differential resistance,i.e. corresponds to various orders of lock-in resonances. Inparticular, half-integer steps are visible as thin blue linesbetween the thick blue lines corresponding to integerresonances. Most importantly, the width of the integer ShSremains larger than zero for all measured powers, manifestedby the fact that the corresponding blue lines do not exhibitinterruptions. The ∆I in current steps corresponding to n )0, 1, 2, and 3 shows weak oscillation behavior with increasingpower (as is observed in Figure 3d), which is consistent withcalculations in Figure S3c computed for a multivalued CPRin a long wire limit. Thus, we obtain evidence that the QPSrate in MoGe wires is low enough so that CPR remainsmultivalued, i.e. the QPS rate is much smaller than theapplied MW frequency.
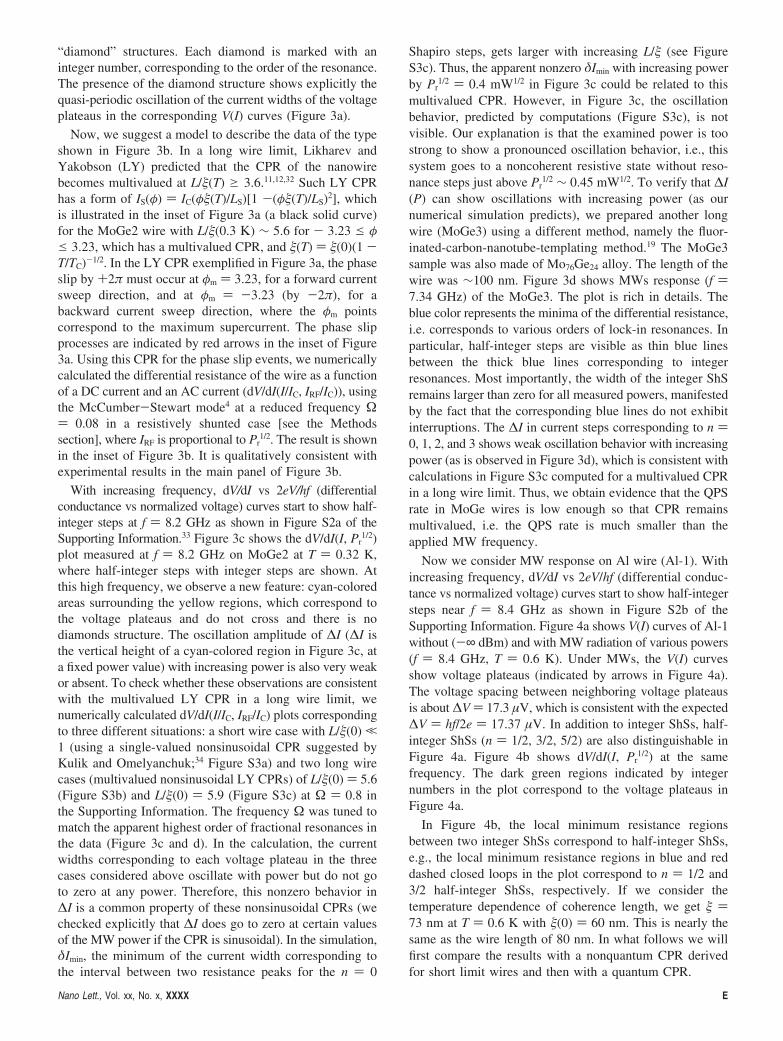
Now we consider MW response on Al wire (Al-1). Withincreasing frequency, dV/dI vs 2eV/hf (differential conduc-tance vs normalized voltage) curves start to show half-integersteps near f ) 8.4 GHz as shown in Figure S2b of theSupporting Information. Figure 4a shows V(I) curves of Al-1without (-∞ dBm) and with MW radiation of various powers(f ) 8.4 GHz, T ) 0.6 K). Under MWs, the V(I) curvesshow voltage plateaus (indicated by arrows in Figure 4a).The voltage spacing between neighboring voltage plateausis about ∆V ) 17.3 µV, which is consistent with the expected∆V ) hf/2e ) 17.37 µV. In addition to integer ShSs, half-integer ShSs (n ) 1/2, 3/2, 5/2) are also distinguishable inFigure 4a. Figure 4b shows dV/dI(I, Pr
1/2) at the samefrequency. The dark green regions indicated by integernumbers in the plot correspond to the voltage plateaus inFigure 4a.
In Figure 4b, the local minimum resistance regionsbetween two integer ShSs correspond to half-integer ShSs,e.g., the local minimum resistance regions in blue and reddashed closed loops in the plot correspond to n ) 1/2 and3/2 half-integer ShSs, respectively. If we consider thetemperature dependence of coherence length, we get )73 nm at T ) 0.6 K with (0) ) 60 nm. This is nearly thesame as the wire length of 80 nm. In what follows we willfirst compare the results with a nonquantum CPR derivedfor short limit wires and then with a quantum CPR.
Nano Lett., Vol. xx, No. x, XXXX E
In the case of TC ∼ TC,film, we can use the Likharevnonquantum (LNQ) short-wire CPR11,35 as IS
LSW ) IC[1 +1/15(L/(T))2] sin φ - 1/30(L/(T))2 sin 2φ. An exampleof this CPR is plotted in the inset of Figure S4 of theSupporting Information for L/ ) 1.09. It shows only a slightdeviation from the sinusoidal CPR. Figure S4 shows anumerically calculated dV/dI(I/IC, IRF/IC) based on the LNQCPR at Ω ) 0.6. The current width, ∆I, of the ShS as afunction of Pr
1/2 obtained from Figure S4 (blue curves) issimilar to the experimental result (closed circles) as is shownin Figure 4d.36 On the other hand, no half-integer ShSs havebeen found in the calculation (Figure S4). Yet, the experimentshows a pronounced half-integer ShSs in Figure 4a and b.Thus, we suggest that LNQ CPR does not apply to our Alwires. Therefore we consider the possibility that QPS isresponsible for some observed features. In particular, aresistance tail in Figure 2b suggests existence of QPS in theAl SNW. To incorporate the effect of QPS in the CPR, weuse Klebnikov quantum theoretical CPR (KQT CPR) for aQPS-dominated wire, based on the theory of refs 3 and 13,IS ) (ICφ/π) - (2R2/4π3IC)(φ/[1 - (φ/π)2]2) for -π < φ <π, where R represents the bare QPS fugacity, which is muchsmaller than unity (also see the Supporting Information). The
inset of Figure 4a shows an example of KQT CPR with R) 0.1IC, which looks like a sawtooth. If R is increased, theCPR becomes closer to the sinusoidal one. Figure 4c showsa numerically calculated dV/dI(I/IC, IRF/IC) at Ω ) 0.6 basedon the quantum KQT CPR. The frequency value of Ω ischosen to make the ratio of the fractional ShS to the integerShS to be about the same as in the experiment (Figure 4b).Here, the value of R is also chosen to make the ratio ∆Iclose to the experimental values. The dark regions indicatedby integer numbers in the plot correspond to voltage plateausof integer ShSs. In the simulation (Figure 4c), half-integerShSs appear as regions of local minima of the differentialresistance (black color), between two neighboring integersteps. The origin of the half-integer ShS is the nonsinusoidal,roughly sawtooth shape of the quantum CPR. It is consistentwith the half-integer ShSs observed in the experiments asshown in Figures 4a and b. The consistency is alsomanifested in their ∆I as a function of Pr
1/2 plots in Figure4d. A generally good agreement between the theory andexperiment is found except for the case of n ) 0, due tolow rates of switching from the static superconducting regimeto the dynamic regime. On the other hand, the possibilitythat the wire is not short enough, i. g., in a case of (0) ≈
Figure 4. (a) V(I) curves of Al-1 under an external MW of f ) 8.4 GHz at P ) -∞, -11.8, -11, -9.5, -8, -7, -6, and -5 dBm fromright to left at T ) 0.6 K. The MW application induces voltage plateaus in V(I) curves. Arrows with integer index numbers (n ) 1, 2, 3,and 4) indicate voltage positions predicted by the AC Josephson relation, which match with the positions of the observed voltage plateaus.Half-integer Shapiro steps (n ) 1/2, 3/2, 5/2) are also visible. (inset) Example plot of a QPS-wire theoretical CPR (see text). (b) Differentialresistance as a function of a bias current and power, dV/dI(I, Pr
1/2) plotted for the Al wire, for f ) 8.4 GHz at T ) 0.6 K. Solid curves areraw data. The color-coding represents the interpolation of the data shown by the solid curves. The regions shown by dashed blue and redcurves indicate examples of half-integer ShS (n ) 1/2 for blue and n ) 3/2 for red). (c) dV/dI(I/IC, IRF/IC) plot, numerically calculated bythe McCumber-Stewart model, with Khlebnikov quantum theoretical CPR (plotted in the inset of a; also, see the Supporting Information).The integer numbers are index numbers of integer ShS. (d) Closed circles represent current width of voltage plateaus as a function of Pr
1/2
obtained from b. The red curves are obtained by numerical calculations of c, and the blue curves are obtained from Figure S4 (correspondingto classical short-wire CPR, IS
LSW(φ)11,35) for n ) 0,1, 2, and 3.
F Nano Lett., Vol. xx, No. x, XXXX
30 nm with l ≈ 1 nm and L ) 80 nm, and thus, its CPRbeing close to the multivalued (i.e., in the intermediateregime) case cannot be excluded definitely. In addition, sincethe comparison was done with only one sample for eachregime, further experimental evidence is needed.
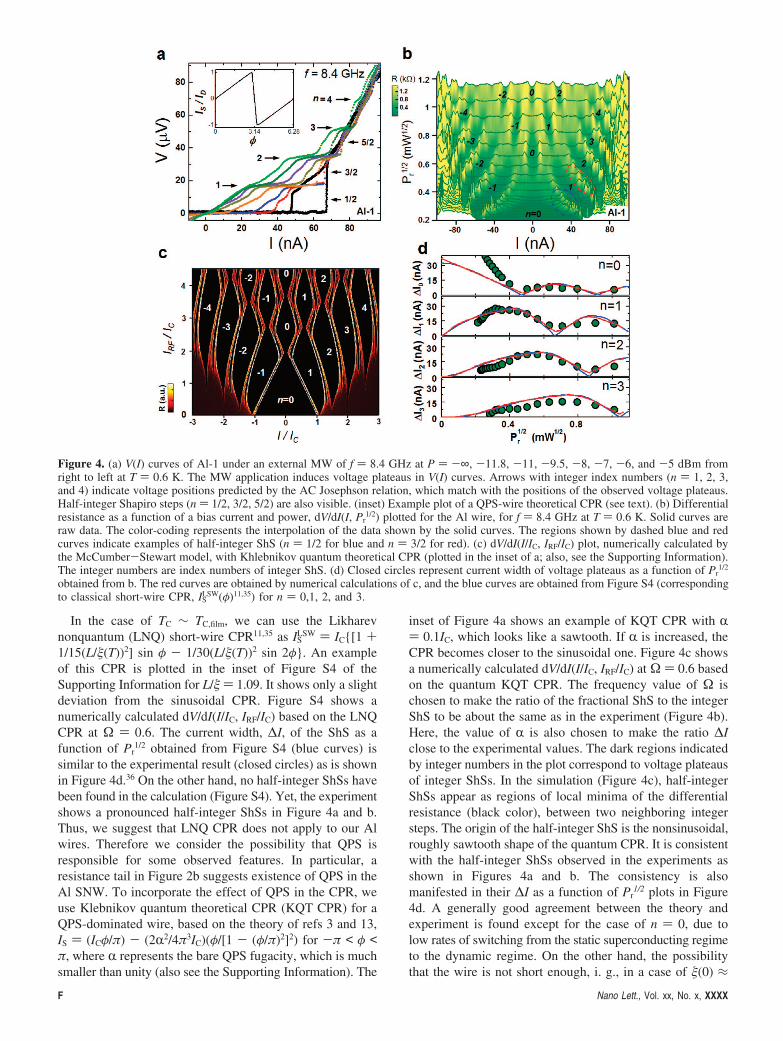
Since both cases of single-valued (see Figure 4c) andmultivalued CPRs (see Figure S3 in the Supporting Informa-tion) show the nonzero δImin, we plot δImin/IC vs φm byscattered solid circles in Figure 5 to compare the amplitudeof δImin with various CPRs in a simplified model version,for example, as shown in the inset of Figure 5. We foundthat the normalized δImin increases faster when φm is largerthan π, at which the system enters the regime of themultivalued CPR (the CPR is single-valued for φm < π). Thesolid triangles are obtained from Figure S3 based on exacttheories for the CPR (as opposed to our model CPR shownin the insert of Figure 5), which also shows a similar trendwith the results based on the simplified model CPRs. InFigure 5, an open square with error bars was obtained fromMoGe3 (with IC ∼ 50 nA estimated from Figure 2d),corresponding to δImin/IC ∼ 0.33. The position of this opensquare corresponds to the multivalued CPR regime. Thissuggests that the resistance in the MoGe3 could originatefrom TAPS. For the Klebnikov QPS theoretical CPR plottedin the inset of Figure 4a, δImin/IC ∼ 0.1 was obtained usingby Figure 4c, which is indicated by an arrow in Figure 5. Inthe case of Al SNW, since the noise level in dV/dI valueswas nearly the same a resistance dip between two peaks forδImin (not shown), it was difficult to define the value of δImin.However, we believe that further precise experiments withsufficiently long wires under MWs could reveal the existenceof QPS in SNWs, by using the type of analysis presentedhere.
In summary, we describe a fabrication method to prepareMo76Ge24 and Al nanowires using adhesive tapes on a
substrate with an ∼100 nm wide trench. The widths of thenanowires suspended on the ∼100 nm-wide trench areregularly ∼20 nm. In the case of the Mo76Ge24 nanowires,the phase-slip branch under MWs with a relatively highfrequency shows pronounced voltage plateaus correspondingto integer and half-integer ShSs, where power dependenceof the width of integer ShSs is explained by the multivaluednonsinusoidal CPR in a TAPS-dominated wire. In particularwe observe the step width does not go to zero on any MWpower, which indicates that the CPR is multivalued. Klheb-nikov theory of QPS indicated that if QPS is present thenthe CPR should be single-valued. Thus, we obtain evidencethat QPS is not present in the MoGe wires in the studiedregime. The Al wire under MWs also shows integer ShSswith half-integer ShSs. We model the observed width usingKhlebnikov quantum CPR, which is expected in the QPS-dominated wire, although no direct proof of QPS is found.
Methods. Low-Noise Measurement Setup. The transportmeasurements were performed in four-terminal film-involv-ing configurations in a He3 cryostat with the base temperatureof 0.28 K. Copper powder-filled epoxy and silver-paste glueat cryogenic temperatures and π-filtering system at roomtemperature are used to suppress the high-frequency noise.All the voltage measurements were done with batterypowered preamplifiers (PAR113 and SR560). To measureR(T) curves, we have used a low-frequency bias current withthe amplitude of ∼10 nA and the frequency of 11 Hz andobtained zero-bias dV/dI by fitting a straight line to the linearregion of the V(I) curve. The microwave signal wasintroduced through a semirigid coaxial cable, with twoattenuators placed at 1 K-pot and a copper-helix antenna,which was placed in front of the sample in a Faraday cageand was of the order of 10 mm in size.
McCumber-Stewart Model Applied for Nanowires. As thephase slip center (PSC) develops in the wire, some nonzeronormal current can flow through the wire. Thus, theresistively shunted junction model of McCumber and Stewartcan be applied.4 In this case the phase of the superconductingorder parameter can be approximately described by thefollowing phase-evolution equation, dφ/dτ + IS(φ) ) IDC +IRF sin(Ωτ), where φ is a phase difference between twosuperconducting electrodes, τ [) 2πfct] is a dimensionlesstime variable, Ω [) f/fC] is the normalized frequency by thecharacteristic frequency fC ) 2eICR/h, R is the resistance ofthe resistive branch occurring as a result of PSC, and IDC
and IRF are dc bias current and ac bias current induced byan external MW normalized by IC. Thus the fitting parametersis Ω and the MW-induced ac-component of the bias currentIRF and the dc bias current are running parameters in thenumerical simulations. Here, a supercurrent, IS(φ) is deter-mined by a CPR of an examined wire, which depends on itsphysical property as well as the length scale of a wire, asexplained in the main text.
Acknowledgment. The authors appreciate valuable dis-cussion with S. Khlebnikov, J.-S. Ku, and M. Sahu. Thiswork was supported by DOE Grants No. DEFG02-07ER46453. We acknowledge the access to the fabricationfacilities at the Frederick Seitz Materials Research Labora-
Figure 5. (scattered solid circles) δImin/IC vs φm, which is obtainedby the numerical calculations with various nonsinusoidal CPRs,for example, as shown in the inset, where φm is the phase valuecorresponding to the critical current in their current vs phase plots.(solid triangles) Obtained by the numerical calculations based onFigure S3 in the Supporting Information. (inset) Example plots ofthe nonsinusoidal CPRs, where plots corresponding to φm ) 0.72and 1.16 represent a single-valued CPR and multivalued CPR,respectively.
Nano Lett., Vol. xx, No. x, XXXX G
tory. This work was also partially supported by the KoreaResearch Foundation Grants No. KRF-2006-352-C00020.
Supporting Information Available: Figures S1-S4 anddescription of the current-phase relation from the Mathieuequation in a QPS-dominated superconducting wire. Thismaterial is available free of charge via the Internet at http://pubs.acs.org.
References(1) (a) Mooij, J. E.; Harmans, C. J. P. New J. Phys. 2005, 7, 219. (b)
Mooij, J. E.; Nazarov, Y. V. Nat. Phys. 2006, 2, 169.(2) Khlebnikov S. Preprint at http://arxiv.org/abs/quant-ph/0210019, 2007.(3) Khlebnikov, S. Phys. ReV. B 2008, 78, 014512.(4) (a) McCumber, D. E. J. Appl. Phys. 1968, 39, 3113. (b) Stewart, W. C.
Appl. Phys. Lett. 1968, 12, 277.(5) Divochiy, A.; Marsili, F.; Bitauld, D.; Gaggero, A.; Leoni, R.; Mattioli,
F.; Korneev, A.; Seleznev, V.; Kaurova, N.; Minaeva, O.; Gol’tsman,G.; Lagoudakis, K. G.; Benkhaoul, M.; Levi, F.; Fiore, A. Nat. Photon.2008, 2, 302.
(6) (a) Leggett, A. J. J. Phys. (Paris) 1978, 39, C6–1264. (b) Caldeira,A. O.; Legget, A. J. Phys. ReV. Lett. 1981, 46, 211.
(7) Giordano, N. Phys. ReV. Lett. 1988, 61, 2137.(8) Lau, C. N.; Markovic, N.; Bockrath, M.; Bezryadin, A.; Tinkham, M.
Phys. ReV. Lett. 2001, 87, 217003.(9) Altomare, F.; Chang, A. M.; Melloch, M. R.; Hong, Y.; Tu, C. W.
Phys. ReV. Lett. 2006, 97, 017001.(10) Zgirski, M.; Riikonen, K.-P.; Touboltsev, V.; Arutyunov, K. Yu. Phys.
ReV. B 2008, 77, 054508.(11) Likharev, K. K. ReV. Mod. Phys. 1979, 51, 101, and references therein.(12) Golubov, A. A.; Kupriyanov, M.; Yu.; Il’ichev, E. ReV. Mod. Phys.
2004, 76, 411, and references therein.(13) Khlebnikov, S., private communication.(14) Sellier, H.; Baraduc, C.; Lefloch, F.; Calemczuk, R. Phys. ReV. Lett.
2004, 92, 257005.(15) Shapiro, S. J. Phys. ReV. Lett. 1963, 11, 80.(16) Anderson, P. W.; Dayem, A. H. Phys. ReV. Lett. 1964, 13–195.(17) Meidan, D.; Oreg, Y.; Refael, G. Phys. ReV. Lett. 2007, 98, 187001.(18) Khlebnikov, S. Phys. ReV. B 2008, 77, 014505.
(19) Bezryadin, A; Dekker, C. J. Vac. Sci. Technol. B 1997, 15, 793.(20) Little, W. A. Phys. ReV. 1967, 156, 396.(21) Langer, J. S.; Ambegaokar, V. Phys. ReV. 1967, 164, 498.(22) McCumber, D. E.; Halperin, B. I. Phys. ReV. B 1970, 1, 1054.(23) Bezryadin, A. J. Phys.: Condens. Matter 2008, 20, 043202.(24) Langer-Ambegaokar and McCumber-Halperin (LAMH)21,22 expres-
sions were used traditionally to fit this curves. Yet, it was pointed outthat the LAMH does not apply below 0.9TC.17 Therefore, we simplyuse the Arrhenius factor with RN as a prefactor, i.e., the Arrhenius-Little (AL) fit.
(25) Tinkham, M.; Lau, C. N. App. Phys. Lett. 2002, 80, 2946.(26) The coherence length at zero temperature (0) is given by 0.855(l0)1/2
in the dirty limit, where l is the electric mean free path, 0 [) pVF/π∆] and ∆ [) 1.76kBTC] are the BCS coherence length and the BCSsuperconducting gap energy, respectively.
(27) Steinberg, K.; Pressel, M. Phys. ReV. B 2008, 77, 214517.(28) (a) Golubev, D.; Zaikin, A. Phys. ReV. B 2001, 64, 014504. (b) Zaikin,
A.; Golubev, D.; Otterlo, A.; Zimanyi, G. T. Phys. ReV. Lett. 1997,78, 1552.
(29) (a) Zgirski, M.; Riikonen, K.-P.; Touboltsev, V.; Arutyunov, K. NanoLett. 2005, 5, 1029. (b) Zgirski, M.; Riikonen, K.-P.; Holmqvist, T.;Savolainen, M.; Touboltsev, V.; Arutyunov, K. Quantum Computingin Solid State Systems; Springer: New York, 2006; Chapter 9.
(30) (a) Bollinger, A. T; Rogachev, A.; Remeika, M.; Bezryadin, A. Phys.ReV. B 2004, 69, 180503(R). (b) Zgirski, M.; Arutyunov, K. Yu. Phys.ReV. B 2007, 75, 172509.
(31) (a) Gor’kov, L. P. J. Exptl. Theoret. Phys. (U.S.S.R.) 1958, 34, 735.(b) Josephson, B. D. Phys. Lett. 1962, 1, 251.
(32) Troeman, A. G.; Ploeg, S. H. W.; Il’Ichev, E.; Meyer, H.-G.; Golubov,A. A.; Kupriyanov, M. Yu.; Hilgenkamp, H. Phys. ReV. B 2008, 77,024509.
(33) Dinsmore, R. C.; Bae, M.-H.; Bezryadin, A. Appl. Phys. Lett. 2008,93, 192505.
(34) Kulik, I. O.; Omelyanchuk, A. N. Pis’ma Zh. Eksp. Teor. Fiz. 1975,21, 216. [JETP Lett. 1975, 21, 96].
(35) Likharev, K. K.; Yakobson, L. A. Zh. Tekhn. Fiz 1975, 45, 1503. [SoV.Phys. Tech. Phys. 1975, 20, 950].
(36) A scaling factor, b, for the power with the relation of IRF ) Pr1/2 and
IC are used as the two adjustable parameters.
NL803894M
H Nano Lett., Vol. xx, No. x, XXXX