Embed Size (px)
Citation preview

This article was downloaded by: [NUS National University of Singapore]On: 10 February 2015, At: 08:02Publisher: Taylor & FrancisInforma Ltd Registered in England and Wales Registered Number: 1072954 Registered office: Mortimer House,37-41 Mortimer Street, London W1T 3JH, UK
Click for updates
Computer Methods in Biomechanics and BiomedicalEngineeringPublication details, including instructions for authors and subscription information:http://www.tandfonline.com/loi/gcmb20
Comparison of hinge microflow fields of bileafletmechanical heart valves implanted in different sinusshape and downstream geometryYee Han Kuana, Foad Kabinejadiana, Vinh-Tan Nguyenb, Boyang Sua, Ajit P. Yoganathanc &Hwa Liang Leoa
a Department of Biomedical Engineering, National University of Singapore, Singaporeb Institute of High Performance Computing, A*STAR, Fusionopolis, Singaporec Walter H. Coulter Department of Biomedical Engineering, Georgia Institute of Technology,Atlanta, GA, USAPublished online: 24 Oct 2014.
To cite this article: Yee Han Kuan, Foad Kabinejadian, Vinh-Tan Nguyen, Boyang Su, Ajit P. Yoganathan & Hwa Liang Leo(2014): Comparison of hinge microflow fields of bileaflet mechanical heart valves implanted in different sinus shape anddownstream geometry, Computer Methods in Biomechanics and Biomedical Engineering, DOI: 10.1080/10255842.2014.964220
To link to this article: http://dx.doi.org/10.1080/10255842.2014.964220
PLEASE SCROLL DOWN FOR ARTICLE
Taylor & Francis makes every effort to ensure the accuracy of all the information (the “Content”) containedin the publications on our platform. However, Taylor & Francis, our agents, and our licensors make norepresentations or warranties whatsoever as to the accuracy, completeness, or suitability for any purpose of theContent. Any opinions and views expressed in this publication are the opinions and views of the authors, andare not the views of or endorsed by Taylor & Francis. The accuracy of the Content should not be relied upon andshould be independently verified with primary sources of information. Taylor and Francis shall not be liable forany losses, actions, claims, proceedings, demands, costs, expenses, damages, and other liabilities whatsoeveror howsoever caused arising directly or indirectly in connection with, in relation to or arising out of the use ofthe Content.
This article may be used for research, teaching, and private study purposes. Any substantial or systematicreproduction, redistribution, reselling, loan, sub-licensing, systematic supply, or distribution in anyform to anyone is expressly forbidden. Terms & Conditions of access and use can be found at http://www.tandfonline.com/page/terms-and-conditions

Comparison of hinge microflow fields of bileaflet mechanical heart valves implanted in differentsinus shape and downstream geometry
Yee Han Kuana, Foad Kabinejadiana, Vinh-Tan Nguyenb, Boyang Sua, Ajit P. Yoganathanc and Hwa Liang Leoa*aDepartment of Biomedical Engineering, National University of Singapore, Singapore; bInstitute of High Performance Computing,
A*STAR, Fusionopolis, Singapore; cWalter H. Coulter Department of Biomedical Engineering, Georgia Institute of Technology, Atlanta,GA, USA
(Received 5 May 2014; accepted 8 September 2014)
The characterization of the bileaflet mechanical heart valves (BMHVs) hinge microflow fields is a crucial step in heart valveengineering. Earlier in vitro studies of BMHV hinge flow at the aorta position in idealized straight pipes have shown that theaortic sinus shapes and sizes may have a direct impact on hinge microflow fields. In this paper, we used a numerical study tolook at how different aortic sinus shapes, the downstream aortic arch geometry, and the location of the hinge recess caninfluence the flow fields in the hinge regions. Two geometric models for sinus were investigated: a simplified axisymmetricsinus and an idealized three-sinus aortic root model, with two different downstream geometries: a straight pipe and asimplified curved aortic arch. The flow fields of a 29-mm St Jude Medical BMHVwith its four hinges were investigated. Thesimulations were performed throughout the entire cardiac cycle. At peak systole, recirculating flows were observed in curveddownsteam aortic arch unlike in straight downstream pipe. Highly complex three-dimensional leakage flow through thehinge gap was observed in the simulation results during early diastole with the highest velocity at 4.7m/s, whose intensitydecreased toward late diastole. Also, elevated wall shear stresses were observed in the ventricular regions of the hinge recesswith the highest recorded at 1.65 kPa. Different flow patterns were observed between the hinge regions in straight pipe andcurved aortic arch models. We compared the four hinge regions at peak systole in an aortic arch downstream model andfound that each individual hinge did not vary much in terms of the leakage flow rate through the valves.
Keywords: computational fluid dynamics; platelet activation; hemodynamics; aortic sinus; shear stresses
1. Introduction
In the past decades, over a dozen of artificial prosthetic
heart valve designs have been used in heart valve
replacement surgeries. Since the first heart valve
replacement in 1960, mechanical heart valve design has
emerged to be one of the more commonly implanted
artificial heart valves, largely due to its durability and bulk
flow characteristics (Vongpatanasin et al. 1996). Among
the various existing mechanical heart valves, bileaflet
mechanical heart valve (BMHV) has demonstrated better
hemodynamic performance with lower transvalvular
pressure drop, larger valve orifice area, and fewer regions
of flow stagnation (Yoganathan et al. 2005).
Despite numerous advantages, there were still draw-
backs associated with the BMHVs, which include platelet
activation, thromboembolic complications and hemolysis
(Dumont 2007). These complications were often associ-
ated with non-physiological high fluid shear stresses
imposed on the blood elements through the BMHVs,
particularly in the hinge recesses about which the leaflets
pivot (Ellis et al. 1996, 2000; Lu et al. 2001). Many in vitro
studies have been conducted to characterize the flow field
inside the hinge regions in order to better understand the
relationship between the thromboembolic complications
and hinge designs (Kelly et al. 1999; Ellis et al. 2000; Leo
et al. 2002). Many of these studies mainly captured two-
dimensional velocity fields at selected locations within the
hinge recess (Ellis et al. 1996; Saxena et al. 2003; Simon
et al. 2004). One major challenge faced by the
experimental studies was the limited optical access to
the small hinge regions, which was made worse by the
moving leaflet and opacity of the actual BMHV implants.
Therefore, in recent years computational fluid dynamics
(CFD) has emerged as a potentially promising alternative
to investigate the hinge microflow field.
An earlier CFD study conducted by Wang et al. (2001)
on a protruded hinge design was conducted on fixed and
fully open leaflets under steady flow. Small vortices were
observed behind the protruded stopper and reverse flow
was evident inside the hinge socket. In another compu-
tational simulation, the hinge flow field of a 25-mm
Advancing The Standards (ATS) Medical valve placed
under aortic flow condition was studied (Kelly et al. 1999).
Here, the authors assumed a simplified sinusoidal pulse
wave and modeled only the forward flow phase. In recent
years, more complex three-dimensional (3D) hinge
simulation studies were conducted: Simon et al. (2010)
studied the microflow field characteristics of one hinge of
q 2014 Taylor & Francis
*Corresponding author. Email: [email protected]
Computer Methods in Biomechanics and Biomedical Engineering, 2014
http://dx.doi.org/10.1080/10255842.2014.964220
Dow
nloa
ded
by [
NU
S N
atio
nal U
nive
rsity
of
Sing
apor
e] a
t 08:
02 1
0 Fe
brua
ry 2
015

an St. Jude Medical (SJM) valve at the aorta in a straight
pipe with an axisymmetric expansion sinus region, while
Yun et al. (2012) studied the blood damage in the hinge
area during diastolic phase in a straight pipe. The study
observed high reverse flow and elevated wall shear stress
in the hinge regions. In the survey of past hinge microflow
studies, we observed that most studies focused on one
hinge recess, which was based on the assumption of flow
symmetry across the valve. However, this assumption may
mask the actual variations in hinge microflow fields at the
different location of a BMHV.
All mechanical heart valve designs encounter leakage
flow upon valve closure. The space between the leaflets
and the valve housing is to ensure the leaflets can freely
open or close with minimal pressure difference across the
valve. However, this free space inadvertently becomes a
region of high leakage flow when the valve closes.
Experimental studies have shown that the BMHV hinge
regions were prone to high Reynolds shear stresses and
have blood flow velocity exceeding 4m/s. The observed
high Reynolds shear stress may predispose the valve to
higher incidence of hemolysis and platelet activation.
As such, the objective of this study is to provide a
detailed 3D flow simulation study in the hinge region of
an SJM Masters Series aortic BMHV with two different
aortic sinus shapes and downstream geometries. As far as
we are concerned, this study constituted the first attempt
to evaluate the flow fields of all four hinges in a single
BMHV (a, b, g and d), as shown in Figure 1(A). The
simulation results showed asymmetrical triple jet
structures in anatomical-straight and anatomical-arch
cases, with a velocity magnitude of 2m/s observed in
the hinge recess during systolic phase. During early
diastolic phase, high-speed leakage jets through the hinge
gap regions for all four cases were observed with a
maximum velocity of 4.7m/s. This also corresponded
with high wall shear stresses in all four cases. The results
of this work provided insights into impact of different
aortic sinus shape, the aortic arch geometry and the
location of the hinge recess on hinge microflow fields
during systolic and diastolic phase.
2. Methods
2.1 Flow solver
The flow in this study was modeled as an incompressible
viscous flow over a domain V, and governed by Navier–
Stokes (NS) equations.
7�u ¼ 0; in V; ð1Þ›ru
›tþ u�7ru ¼ 27rþ 7�ðm7uÞ þ f ; inV; ð2Þ
uðt ¼ 0Þ ¼ u0; in V; ð3Þ
where u is the velocity vector, r is the density, p is the
pressure, and m is the dynamic viscosity of the fluid. The
fluid was considered as Newtonian fluid of density
r ¼ 1025 kg/m3 and kinematic viscosity n ¼ 3.81 £ 10–
6m2/s. f is the body force and the total fluid stress tensor
including pressure and viscous force can be expressed as
s ¼ t2 pI; t ¼ mð7uþ 7uTÞ; ð4Þwhere t is the viscous stress.
The equations are closed with boundary conditions
imposed on the boundary of the domain G ¼ dV as
u ¼ �u; in GD; ð5Þs�n ¼ �t; in GD; ð6Þ
where G ¼ GN < GD�GN denotes a boundary where
Neumann conditions are applied in the form of
prescribed tractions (�t) and GD corresponds to a Dirichlet
boundary on which the velocity is imposed (Nguyen
et al. 2012). The governing equations were discretized in
space using a finite volume (FV) method where a finite
set of discrete equations was constructed on unstructured
hybrid grids to approximate the NS equations over the
arbitrary moving domain V bounded by closed surface Gas follows:
þG
n�u dS ¼ 0; ð7Þ
›
›t
ðV
ru dV þþG
n�rðu2 uSÞu dS
¼þG
n�ðm7uÞ dS2ðV
7r dV þðV
f dV ; ð8Þ
where n is the outward normal vector to the bounding
surface G and uS is the moving velocity of the surface.
As the boundary moves, the geometric conservation law
(Ferziger and Peric 1999) defines the conservation of
space with respect to the change in volume and boundary
velocity,
›
›t
ðV
dV 2
þG
n�uS dS ¼ 0: ð9Þ
The construction was performed by a cell-centered
FV approach where the FV discretization was based on
the integral form of the governing equations over a
polyhedral control volume. The computational domain
was subdivided into a set of non-overlapping polyhedral
elements.
In the simulation, a second-order Crank Nicholson
implicit time discretization was used with adjustable time-
step throughout the simulation with the average time-step
in the magnitude of 1025 s, The time-step was dependent
Y.H. Kuan et al.2
Dow
nloa
ded
by [
NU
S N
atio
nal U
nive
rsity
of
Sing
apor
e] a
t 08:
02 1
0 Fe
brua
ry 2
015
on the maximum Courant–Friedrichs–Lewy number ¼ 1.
The Courant number mean was about 0.08. In the
unsteady, time-accurate, moving boundary simulation,
the Spalart–Almaras (SA) turbulent model was used
and implemented using the OpenFOAM package. In the
SA model (Spalart 2000), kinematic eddy viscosity is
modeled as
y t ¼ ~y f y 1 ; f y 1 ¼x3
x3 þ c3y 1; x ¼ ~y
y; ð10Þ
Where ~y is the modified kinematic viscosity.
Inlet View
A
B
C
Top View
Top View
(i) (ii) (iii) (iv)
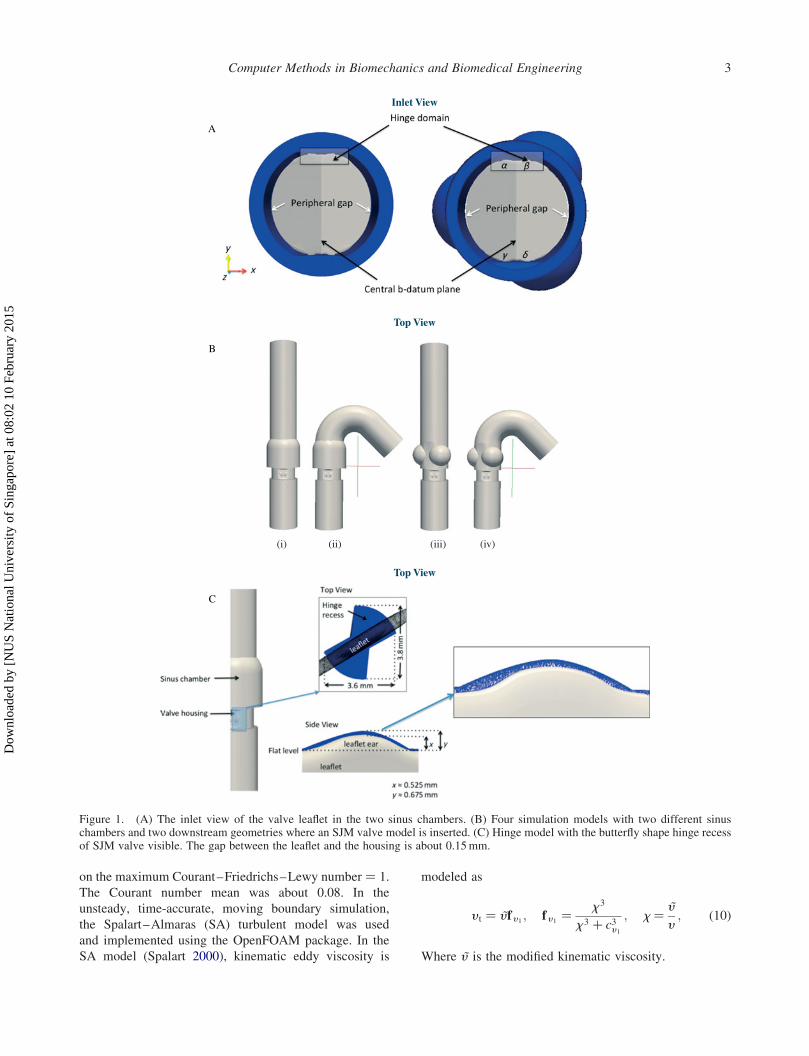
Figure 1. (A) The inlet view of the valve leaflet in the two sinus chambers. (B) Four simulation models with two different sinuschambers and two downstream geometries where an SJM valve model is inserted. (C) Hinge model with the butterfly shape hinge recessof SJM valve visible. The gap between the leaflet and the housing is about 0.15mm.
Computer Methods in Biomechanics and Biomedical Engineering 3
Dow
nloa
ded
by [
NU
S N
atio
nal U
nive
rsity
of
Sing
apor
e] a
t 08:
02 1
0 Fe
brua
ry 2
015
The transport equation for eddy viscosity is deduced
from
›k
›tþ �uj
›k
›xj¼ tij
›ui›xj
2 e þ ›
›xjy þ y t
sk
� �›k
›xj
� �; ð11Þ
which leads to
› ~y
›tþ �uj
› ~y
›xj¼ cb1
~S ~y 2 cw1fw
~y
d
� �2
þ 1
sk
›
›xjðy þ ~y Þ › ~y
›xj
� �
þ cb2sk
› ~y
›xj
› ~y
›xj;
ð12Þwhere d is the distance from the closest surface. The
standard SA model includes eight closure coefficients:
cb1 ¼ 0:1335; cb2 ¼ 0:622; cv1 ¼ 7:1; sk ¼ 2
3; ð13Þ
cw1¼ cb1
k2þ ð1þ cb2Þ
sk
; cw2¼ 0:3; cw3
¼ 2;
k ¼ 0:41:
ð14Þ
Various forms of SA models can be found in Spalart
(2000).
To handle the movement of the heart valves, an
arbitrary Lagrangian Eulerian (ALE) formulation was
used to discretize the system. The moving mesh velocity,
uS at the interface must be equal to the boundary velocity,
uG, for the prescribed movement of fixed boundaries. The
movement of the boundaries causes the computational
mesh to deform and unable to preserve its quality.
A moving mesh solver is necessary to deform the mesh and
move the internal points in order to maintain the quality of
the mesh and avoid solution degeneration due to mesh
validity. A dynamic mesh solver, mesquite Smoother, was
used in OpenFOAM to address this issue. The method was
applied for simulation of pulsatile flows over BMHV with
prescribed leaflet motions in the cardiac cycle and
simulated for two cycles. The details of this methodology
were discussed in our previous work (Nguyen et al. 2012).
2.2 Hinge model and flow domain
The valve geometry in this study was based on the design of
a 29-mmSJMMasters Series BMHV. In order to investigate
the effects of sinus and aortic geometries on the flow fields,
we have modeled four different cases in this study, as
follows: (i) a simplified axisymmetric sinus in a straight
downstream pipe (simple-straight), (ii) a simplified axisym-
metric sinus in a downstream curved aortic arch (simple-
arch), (iii) a three-sinus aortic root model in a straight
downstreampipe (three sinus-straight), and (iv) a three-sinus
aortic root model in a simplified downstream curved aortic
arch (three sinus-arch), as shown in Figure 1(B). In this
study, all the four hinges were modeled together with the
entire valve geometry. The hinge gap width was the distance
between the tip of the leaflet ear and the bottom of the hinge
recess, defined as (y–x), as shown in Figure 1(C). In the
model, the leaflet ear was placed within the butterfly-shaped
depression (hinge recess) with a hinge gap width of 150mm,
as observed in clinical valves (Simon et al. 2010). In the first
case, the BMHV was inserted into a simplified aorta model
consisting of a straight pipe with axisymmetric sinus and
three-sinus aortic root. In the second case, the BMHV was
inserted into a simplified curved aortic arch with the
axisymmetric sinus and three-sinus aortic root in an
anatomical position.
The centerline of the aorta followed the curvature of
the normal diameters for the thoracic aorta of adults
obtained by helical computed tomography (Hager et al.
2002). However, the three branches on the top were
excluded to minimize the complexity of the flow
simulation. To minimize the computational time, the
normal model under steady-state was selected for mesh
independence test. Models with 2.5 £ 106, 3.6 £ 106, 4.5
£ 106, and 5.6 £ 106 elements were simulated, and the one
with 3.6 £ 106 elements was chosen based on the criterion
that the relative difference between the maximum velocity
with respect to the one with 5.6 £ 106 elements was
,0.5%. The computational fluid domain of each of the
four cases, namely simple-straight, three sinus-straight,
simple-arch, and three sinus-arch was subdivided into an
unstructured mesh of approximately 3.6 million tetrahe-
dral elements. The grid contained approximately 100,000
nodes with resolution of 7–8mm in the 150-mmgap. During systolic phase, the valve was fully opened
at an angle of 858 between the leaflet and the X–Y plane.
After valve closure, the fully closed SJM leaflets formed a
358 angle.
2.3 Boundary conditions
The BMHV was subjected to physiologic conditions and
the velocity profile was obtained from the experimental
data of the left ventricle study published by Lim et al.
(2001). The prescribed periodic condition started at a fully
open position where the ejecting velocity increased from 0
to a peak velocity of 1.35m/s. The data points for aorta
outlet pressure–time profile corresponded to the aortic
blood pressure (Nichols and O’Rouke 2005) and the peak
flow rate was set at approximately 22 l/min. The full
cardiac cycle was 0.86 s, which corresponded to a heart
rate of about 70 beats/min. At the inlet and outlet of the
simulation cases, the velocity and pressure were
prescribed using the given waveforms, shown in Figure 2.
No-slip boundary condition was imposed at the channel
walls, the leaflet walls, and all body surfaces. The cardiac
Y.H. Kuan et al.4
Dow
nloa
ded
by [
NU
S N
atio
nal U
nive
rsity
of
Sing
apor
e] a
t 08:
02 1
0 Fe
brua
ry 2
015

cycle was divided into systolic and diastolic phases such
that the valves were fully opened for 0.30 s during
the systolic phase and fully closed for 0.48 s during the
diastolic phase. In between the two cardiac phases, the
leaflets took 0.04 s to move from fully opened to fully
closed and vice versa. In total, four time points were
investigated for each model at peak systole (t ¼ 0.115 s),
early diastole (t ¼ 0.340 s), mid-diastole (t ¼ 0.58 s), and
end diastole (t ¼ 0.82 s). The leaflets rotated from 858 intheir fully opened position to 358 at fully closed position.
3. Results
The terminologies used to describe the hinge recess
geometry and flow patterns are shown in Figure 1. The flat
level of the leaflet was used as the plane of reference. The
vertical direction was the direction perpendicular to the
flat level and parallel to the leaflet axis. The direction
parallel to the main flow was the axial direction while the
direction from the b-datum plane to the valve housing was
the transverse direction.
3.1 Hinge microflow fields during systole
The velocity contour plot for the two hinges, a and b, foreach model is shown in Figure 3(A). Generally, the flow
velocity was higher at the outer face of the leaflet ears from
the center plane than that at the inner face of the leaflet
ears. The flow velocity throughout the hinge recess
followed closely the magnitude of the valvular flow rate in
all the four simulation cases with the maximum velocity
magnitude within the hinge recess reaching approximately
2m/s during peak systole. No significant differences in
velocity magnitude were observed at the hinge region
when comparing between the straight pipe models
(Figure 3(A(i),(iii))) and between the simplified aortic
arch models (Figure 3(A(ii),(iv))). However, velocity
differences were observed in the inner flow circled region
between the straight pipe and aortic arch models. The flow
velocities in hinge b of aortic arch models were lower
compared to those in the straight pipe models. The flow
fields between the two hinges (a and b) were not
symmetrical in the aortic arch models. To investigate
further, the hinge flow fields for all four hinges (a, b, gand d) in the three sinus-arch model were compared.
Figure 3(B) compares the velocity contours in all of the
four hinges in the three sinus-arch model at peak systole.
The flow patterns were different among the four hinges
and they were not identical. The flow fields for the other
three cases exhibited similar asymmetric flow patterns
during peak systole (not shown here). The velocity values
at the inner face region of the four hinges were different
from each other especially at the outer face and the trailing
edge regions. The flow velocity in hinge a at the inner face
Figure 2. Inlet velocity and outlet pressure wave profile. Four time points were analyzed at peak systole 0.115 s, early diastole 0.34 s,mid-diastole 0.58 s, and late diastole 0.82 s.
Computer Methods in Biomechanics and Biomedical Engineering 5
Dow
nloa
ded
by [
NU
S N
atio
nal U
nive
rsity
of
Sing
apor
e] a
t 08:
02 1
0 Fe
brua
ry 2
015

region was higher than the other three hinges. At the
leading edge of the leaflet regions, hinges g and d appearedto have smaller regions of high velocity flow compared to
a and b.
3.2 Hinge microflow fields during diastole
Figure 4(A) compares the velocity fields at early diastolic
phase for hinges a and b, for all the four cases. The generaltrend of the flow within the hinge recess was similar across
all four cases at the near wall regions, except with higher
velocity observed at the trailing edge region when
compared to the leading edge region of the hinge recess.
Nevertheless, the differences were not prominent and can
be ignored. Also, no significant differences in velocity
magnitude were observed in the hinge regions between the
straight pipe and aortic arch models during early diastole.
Figure 4(B) compares the flow field among the four hinges
in the three sinus-arch model. In the circled region of the
outer face of the leaflets for hinge a, the velocity appearedto be slightly lower than the other three hinges b, g and d.The leakage flow rates observed in the 29-mm SJM
BMHVat early diastole are shown in Table 1. The average
leakage flow rate for the four models was found to
be 0.457 ^ 0.001 l/min. This leakage rate was observed
to be between that of the high leakage prototype
(0.490 ^ 0.021 l/min) and low leakage prototype valves
(0.049 ^ 0.001 l/min) reported by Leo et al. (2006).
Comparing the leakage rates through each individual
hinge, the difference between the highest and lowest flow
rate for the cases were 2.80% (simple-straight), 2.62%
(simple-arch), 2.35% (three sinus-straight), and 3.06%
(three sinus-arch).
3.3 Hinge flow fields in anatomical-arch model
Figure 5 shows the flow fields within hinges b during
diastole phase. High-velocity jets were observed at the
Figure 3. (A) Flow fields at hinge a and b for (i) simple-straight, (ii) simple-arch, (iii) three sinus-straight, and (iv) three sinus-arch atpeak systole. (B) Hinge flow fields for all four hinges a, b, g, and d for three sinus-arch at peak systole.
Y.H. Kuan et al.6
Dow
nloa
ded
by [
NU
S N
atio
nal U
nive
rsity
of
Sing
apor
e] a
t 08:
02 1
0 Fe
brua
ry 2
015

position c and d at early diastole. These high-velocity
leakage jets had large out-of-plane velocity components
with a maximum velocity of 4.7m/s. Figure 5 (A) shows
the six planes, which were 100mm apart from each other
starting from the flat level. High reverse velocities were
observed in all planes within the hinge recess. The leakage
flow between the leaflets at the hinge housing was
observed at the side view. The strong and highly 3D flow
structures showed the complexity of the flow in the hinge
regions during early diastole. There were not much flow
variations among the four simulation cases during early
diastole.
At mid-diastole in Figure 5(B), high-velocity jets were
also observed at the position c and d but at comparatively
lower velocity magnitudes of 0.46m/s. The highest
leakage flow velocity was also observed at the area
between of the tip of the leaflet ears and the hinge recess at
100mm from the flat level (point e). The flow leakage was
also observed between the hinge and the leaflet ear. The
highest leakage velocity was 0.076m/s in the backflow
direction through the gap between the leaflet ear and the
hinge recess. Figure 5(C) shows the flow field at late
diastole when the flow was almost zero.
Figure 4. (A) Flow fields at hinge a and b for (i) simple-straight, (ii) simple-arch, (iii) three sinus-straight, and (iv) three sinus-arch atearly diastole. (B) Hinge flow fields for all four hinges a, b, g, and d for three sinus-arch at early diastole.
Table 1. Leakage flow rate through the hinge regions.
Hingea
(l/min)
Hingeb
(l/min)
Hingeg
(l/min)
Hinged
(l/min)
Totalflowrate
(l/min)
Simple-straight 0.1134 0.1166 0.1139 0.1145 0.4584Simple-arch 0.1155 0.1135 0.1125 0.1149 0.4564Three sinus-straight 0.1122 0.1149 0.1138 0.1147 0.4556Three sinus-arch 0.1161 0.1139 0.1126 0.1146 0.4572
Computer Methods in Biomechanics and Biomedical Engineering 7
Dow
nloa
ded
by [
NU
S N
atio
nal U
nive
rsity
of
Sing
apor
e] a
t 08:
02 1
0 Fe
brua
ry 2
015

3.4 Wall shear stress distribution
At peak systole, the wall shear stress magnitude at the
hinge recess for all four cases was approximately 270 Pa.
High wall shear stress magnitude was typically observed
during early diastole phase (with the maximum level at
1.6 kPa in hinge b). There were slight variations in the wallshear stress distribution among the four cases largely
because the velocity profiles near the wall of the leaflets
were largely similar. However, only the three sinus-arch
results for hinge b at peak systolic and early diastolic
phase will be presented (Figure 6). In general, the wall
shear stress levels within the hinge recess during peak
systole were lower compared to those during the early
diastole as shown in Figure 6(A). At early diastole, the
high wall shear stress region was coincident with the
region of high-velocity leakage jets, as shown at positions
f and g in Figure 6(B). The wall shear stress in the hinge
recess cavity at peak systole was about the same
magnitude at 270 Pa as seen in Figure 6(C). On the other
hand, the hinge recess cavity demonstrated a slightly
higher wall shear stress magnitude of approximately
1.65 kPa when compared to the hinge area during early
diastole. Elevated wall shear stress was also observed in
regions h and j at the upstream of the flow, during early
diastolic phase in Figure 6(D). In mid-diastole and late
diastole, the wall shear stress was observed in the same
location but with smaller magnitude.
4. Discussions
In this study, we have performed a 3D, time accurate flow
simulation of an SJM valve under physiological flow
conditions. All the four hinges were modeled in order to
identify the flow differences within these pivot recess
regions. Four types of geometries were performed to
understand the effects of the sinus shape on the hinge
recess flow. Simulations based on a section of the cardiac
cycle, such as the forward flow phase (Kelly et al. 1999) or
limited to just steady flow conditions (Wang et al. 2001)
are not able to capture the flow unsteadiness accurately.
As such, we imposed physiological flow conditions so as
to observe these flow characteristics in the hinge flow
fields, as recommended by Simon et al. (2010) too. It is
important to model the flow based on physiological
boundary conditions in order to access the performance of
the hinge design. The prescribed motion of the leaflets was
performed with a constant angular velocity and a closing
time equal to that of the opening time.
The currentmodel uses anALEmethod so that themesh
is deforming with time as the leaflets are rotating from
their fully open position (858) to valve closure (358). Theuse of ALEmethod has many advantages, although it relies
on the continuous regeneration of mesh while maintaining
goodmesh quality. By applying a constant angular velocity,
we may not be able to capture the flow field accurately
during the hinge movement. However, during the four time
A Top View
B Top View
C
Side View
Side View
Figure 5. Hinge flow fields along six different planes within the hinge recess at (A) early diastole, (B) mid-diastole, and (C) late diastolefor three sinus-arch. The six planes shown here are 100mm apart from each plane starting from the flat level. Leakage flow can beobserved at the side view.
Y.H. Kuan et al.8
Dow
nloa
ded
by [
NU
S N
atio
nal U
nive
rsity
of
Sing
apor
e] a
t 08:
02 1
0 Fe
brua
ry 2
015

points that we observed in the simulation (peak systole,
early diastole, mid diastole, and late diastole), the time-
varying nature of the angular velocity of the leaflets is not as
critical. As such, imposing a constant velocity movement
was conducted. We analyzed the flow field during peak
systole, when the leaflets are fully open withmajority of the
bulk flow through the open valve and the early,mid, and late
diastole when the leaflets are fully closed.
The rotation angle is determined based on the pressure
and the velocity flow at both the inlet and outlet. The
resistance offered to the flow by the hinges and the
peripheral gap is also dependent on the dimensions and
geometry of these gaps. To achieve optimal spatial
resolution while managing the computational resources,
each element was about 7–8mm in size in the 150-mmgap, as observed in clinical valves.
Figure 6. Wall shear stress along six different planes within the flow domain in hinge recess for three sinus-arch. The six planes shownhere are 100mm apart from each plane starting from the flat level at (A) peak systole, (B) early diastole, wall shear stress of the hingerecess surface for three sinus-arch at (C) peak systole, (D) early diastole.
Computer Methods in Biomechanics and Biomedical Engineering 9
Dow
nloa
ded
by [
NU
S N
atio
nal U
nive
rsity
of
Sing
apor
e] a
t 08:
02 1
0 Fe
brua
ry 2
015

4.1 Sensitivity of hinge flow fields
Flow unsteadiness in the lateral and ventricular corners of
the hinge region was observed at peak systole and early
diastole. By investigating the four-hinge geometries in this
study, the results showed that the four hinges generally
exhibit slightly different flow fields. During systolic phase,
the shape of the sinus chambers appeared to have minimal
effect on the bulk flow through the fully open valve and the
hinge flow regions. However, the downstream shape
affected the flow in the hinge regions where lower
velocities were observed in the aortic arch downstream
models at peak systole.
Highly complex 3D flow fields were observed
throughout the diastolic phase with decreasing leakage
flow rate from early to late diastole. The backflow velocity
through the hinge regions was much higher at 4.7m/s
compared to the rest of the flow domain with average
velocities ranging from 0.042 to 0.156m/s. The high-
speed leakage jets could impact the level of hemolysis and
platelet activation at the ventricular corner, which may
potentially affect the performance of the valves. Our
simulation results are comparable to the backflow in the
simulations conducted in an earlier paper was 4.75m/s
(Simon et al. 2010).
4.2 The relative position of the hinge does not affecthinge flow leakage rate
The reported leakage rate between the various cases differs
by 2–3%. These results suggest that the difference
between the four cases may not be significant. Never-
theless, there is still merit to study the difference in the
various velocity contours in each of the four hinges as
shown earlier for three-sinus arch. The velocity contours
of the hinges were subtly different from each other,
especially when a non-symmetric sinus chamber was
modeled. A human native aorta bulges outward to form the
three sinuses (Ho 2009). The three sinus model was used in
the simulation to mimic the human native aortic sinus. Our
study demonstrated subtle differences in the hinge flow
fields contour between straight pipe and downstream aortic
arch at peak systole. Hinge flow patterns differences were
observed when we analyzed the flow fields in all four
hinges within the aortic arch model although the leakage
rate suggested similar rate. Using a model which closely
resembled geometry to the native aortic sinus would be a
better choice and hence a more accurate representation of
the hinge micro flow fields. As such, the hinges in
conjunction with a three-sinus aortic root geometry and
curved downstream aortic arch that closely resembled that
of native human model should be included in future hinge
flow contours study. It is not necessary to simulate all four
hinges if the research focuses on the leakage rate through
the valves and not the flow contours.
4.3 Elevated wall shear stress may lead to hemolysisand platelet activation
During the forward flow phase at peak systole, the highest
shear stress regions are located at the upstream and
downstream of the hinge and along the surface of the
leaflets. The shear rate recorded here is about 0.25 kPa,
which may potentially lead to thrombosis. On the other
hand, the simulations showed the maximum elevated wall
shear stress at the hinge recess during early diastole
recorded at 1.65 kPa at near wall regions, which include
the peripheral gap formed by the closed leaflet and the
valve housing, the tip of the leaflet ear and the hinge
recess, and the wall of the ventricular side of the hinge.
This suggests that during this phase, the blood elements
flowing through the hinge regions can lead to hemolysis as
a result of the high shear rates they experience.
The threshold level responsible for red blood cell
hemolysis to occur was found to be approximately 400 Pa,
below which a sub-lethal region of zero hemolysis was
observed (Sallam and Hwang 1984). Earlier studies also
reported that platelet activation and aggregation could
occur at shear stress as low as 5 Pa, and irreversible
platelet aggregation occurs at shear stress of 10 Pa (Hung
et al. 1976; Ramstack et al. 1979; Slack et al. 1993). The
blood elements experienced a higher rate of collision with
the valve wall due to the recirculation flow formed near the
wall as a result of turbulent flow. Such platelet activation
by high wall shear stresses may lead to thromboembolic
complications (King et al. 1996; Cheng et al. 2004). These
regions were associated with high wall shear stress, and
may lead to hemolysis and platelet activation. The large
wall shear stress during diastolic phase may be more
detrimental to blood elements compared to the systolic
phase. This observation is consistent with earlier studies
(Lamson et al. 1993; Maymir et al. 1997; Steegers et al.
1999; Ellis and Yoganathan 2000; Simon et al. 2010).
As a result, the design of the leaflet ear, the wall
curvature of the hinge recess and the upstream of the leaflet
edge may contribute significantly to the thromboembolic
risk in the BMHV. Higher wall shear stress was observed
during diastole phase compared to peak systole, which
suggests that diastole played a bigger role in causing
detrimental damage to the blood elements. Nevertheless,
through this numerical simulation, we can postulate that
the hinge design is important to minimize any unfavorable
flow features during the cardiac cycle. It can also be used
as an important tool to characterize potential thromboem-
bolic complications in regions which cannot be measured
experimentally due to the design and opacity of the hinge.
5. Limitations
The leaflet in the simulation model was limited to
prescribed rotation only, while in the actual scenario, the
leaflets are free to rotate and translate up and down along
Y.H. Kuan et al.10
Dow
nloa
ded
by [
NU
S N
atio
nal U
nive
rsity
of
Sing
apor
e] a
t 08:
02 1
0 Fe
brua
ry 2
015

the leaflet axis. The aortic wall in the simulation was
assumed to be rigid whereas in reality, the human aortic
wall is compliant. A compliant aorta is able to expand its
diameter compared to a rigid aorta. As the aorta expands,
the increase in pressure is determined by the compliance of
the aorta. Comparatively, a rigid wall will have higher
pressure variations during the systolic phase. Nevertheless,
the wall compliance does not qualitatively change the flow
characteristics compared to those of rigid walls (Wen et al.
2014). The blood was also modeled as an incompressible
single-phase Newtonian fluid (Ellis et al. 2000; Simon
et al. 2004; Leo et al. 2006; Yun et al. 2012). The blood
exhibits non-Newtonian properties in regions with low
velocity. However, because the flow rate in the aorta is
generally high, the differences induced in the flow due to
this assumption will be minimal. The downstream aorta
was simplified to omit the three branches at the arch and
coronary outlets due to the computational difficulties to set
multiple outlet boundary conditions with physiological
pressure waveforms. There may be low velocity flow at
those regions, which may affect the wall shear stress level.
6. Conclusions
In summary, this study presented the importance of hinge
microflow simulation to understand the complexity of the
leakage flow during diastolic phase. The 3D and unsteady
nature of the flowfields have highlighted the regions of high
wall shear stress which may cause platelet activation
leading to thromboembolic complications. There were
differences noted within the flow field profile of the four
hinges during peak systole of the three-sinus arch model.
The hinge microflow fields may yield a dynamically
complicated vortical flow structures and could impact the
level of hemolysis and platelet activation. However, each
individual hinge did not vary much in terms of the leakage
flow rate through the valves. As such, it is not necessary to
simulate all four hinges together. However, the hinge
should be simulated with a three-sinus aortic root geometry
and curved downstream aortic arch because this geometry
resembled that of native humanmodel. Thismaypotentially
determine the clinical performance of the valve. The
numerical simulation acted as a tool for thromboembolic
potential characterization to observe the physical viscous
stresses experienced by the blood elements and the
capability to refine the analysis to a level of spatial details
that would be hard to achieve experimentally. In our future
work, we will look into the implantation position of the
BMHVs with respect to the three-sinus aortic root chamber
to study its effect on the flow fields.
References
Cheng R, Lai YG, Chandran KB. 2004. Three-dimensional fluid-structure interaction simulation of bileaflet mechanical heartvalve flow dynamics. Ann Biomed Eng. 32(11):1471–1483.
Dumont K. 2007. Comparison of the hemodynamic andthrombogenic performance of two bileaflet mechanicalheart valve using a CFD/FSI model. J Biomech Eng.129:558–565.
Ellis JT, Healy TM, Fontaine AA, Saxena R, Yoganathan AP.1996. Velocity measurements and flow patterns within thehinge region of a medtronic parallel bileaflet mechanicalheart valve with clear housing. J Heart Valve Dis.5:591–599.
Ellis JT, Travis BR, Yoganathan AP. 2000. An in vitro study ofthe hinge and near-field forward flow dynamics of the St JudeMedical Regent bileaflet mechanical heart valve. AnnBiomed Eng. 28:524–532.
Ellis JT, Yoganathan AP. 2000. A comparison of the hinge andnear-hinge flow fields of the St Jude medical hemodynamicplus and regent bileaflet mechanical heart valves. J ThoracCardiovasc Surg. 119:83–93.
Ferziger JH, Peric M. 1999. Computational methods for fluiddynamics. 2nd ed. Berlin, Heidelberg: Springer-Verlag.
Hager A, Kaemmerer H, Rapp-Bernhardt U, Blucher S, Rapp K,Bernhardt TM, Galanski M, Hess J. 2002. Diameters of thethoracic aorta throughout life as measured with helicalcomputed tomography. J Thorac Cardiovasc Surg.123:1060–1066.
Ho SY. 2009. Structure and anatomy of the aortic root. Eur JEchocardiogr. 10:i3–i10.
Hung TC, Hochmuth RM, Joist JH, Sutera SP. 1976. Shear-induced aggregation and lysis of platelets. Trans Am SocArtif Intern Organs. 22:285–291.
Kelly SG, Verdonck PR, Vierendeels JAM, Riemslagh K, DickE, Van Nooten GG. 1999. A three-dimensional analysis offlow in the pivot regions of an ATS bileaflet Valve. Int J ArtifOrgans. 22:754–763.
King MJ, Gorden J, David T, Fisher J. 1996. A three-dimensional, time-dependent analysis of flow through abileaflet mechanical heart valve: comparison of experimentaland numerical results. J Biomech. 29(5):609–618.
Lamson TC, Rosenberg G, Geselowitz DB, Deutsch S,Stinebring DR, Frangos JA, Tarbell JM. 1993. Relativeblood damage in the three phases of a prosthetic heart valveflow cycle. ASAIO J. 39:M626–M633.
Leo HL, He Z, Ellis JT, Yoganathan AP. 2002. Microflow fieldsin the hinge region of the Carbomedics bileaflet mechanicalheart valve design. J Thorac Cardiovasc Surg. 124:561–574.
Leo HL, Simon HA, Dasi LP, Yoganathan AP. 2006. Effect ofhinge gap width on the microflow structures in 27mmbileaflet mechanical heart valve. J Heart Valve Dis.15:800–808.
Lim WL, Chew YT, Chew TC, Low HT. 2001. Pulsatile flowstudies of a porcine bioprosthetic aortic valve in vitro: PIVmeasurements and shear-induced blood damage. J Biomech.34(11):1417–1427.
Lu PC, Lai HC, Liu JS. 2001. A reevaluation and discussion onthe threshold limit for hemolysis in a turbulent shear flow.J Biomech. 34(10):1361–1364.
Maymir J-C, Deutsch S, Meyer RS, Geselowitz DB, Tarbell JM.1997. Effects of tilting disk heart valve gap width onregurgitant flow through an artificial heart valve. ArtifOrgans. 21:1014–1025.
Nguyen V-T, Kuan YH, Chen P-Y, Ge L, Sotiropoulos F,Yoganathan AP, Leo HL. 2012. Experimentally validatedhemodynamics simulations of mechanical heart valves inthree dimensions. Cardiovasc Eng Technol. 3(1):88–100.
Computer Methods in Biomechanics and Biomedical Engineering 11
Dow
nloa
ded
by [
NU
S N
atio
nal U
nive
rsity
of
Sing
apor
e] a
t 08:
02 1
0 Fe
brua
ry 2
015

Nichols WW, O’Rouke MF. 2005. McDonald’s blood flow inarteries: theoretical, experimental and clinical principles. 5thed. London: Hodder Arnold; p. 607.
Ramstack JM, Zuckerman L, Mockros LF. 1979. Shear-inducedactivation of platelets. J Biomech. 12(2):113–125.
Sallam AM, Hwang NH. 1984. Human red blood cell hemolysisin a turbulent shear flow: contribution of Reynolds shearstresses. Biorheology. 21(6):783–797.
Saxena R, Lemmon J, Ellis J, Yoganathan AP. 2003. An in vitroassessment by means of laser doppler velocimetry of themedtronic advantage bileaflet mechanical heart valve hingeflow. J Thorac Cardiovasc Surg. 126:90–98.
Simon HA, Ge L, Sotiropolous F, Yoganathan AP. 2010.Simulation of the three-dimensional hinge flow fields of abileaflet mechanical heart valve under aortic conditions. AnnBiomed Eng. 38(3):841–853.
Simon HA, Leo HL, Carberry J, Yoganathan AP. 2004.Comparison of the hinge flow fields of two bileafletmechanical heart valve under aortic and mitral conditions.Ann Biomed Eng. 32:1607–1617.
Slack SM, Cui Y, Turitto VT. 1993. The effects of flow on bloodcoagulation and thrombosis. Thromb Haemost.70(1):129–134.
Spalart PR. 2000. Trends in turbulence treatments. Am InstAeronautics Astronautics. 2000–2306.
Steegers A, Paul R, Reul H, Rau G. 1999. Leakage flow atmechanical heart valve prostheses: improved washout orincreased blood damage? J Heart Valve Dis. 8:312–323.
Vongpatanasin W, Hillis DL, Lange RA. 1996. Prosthetic heartvalves. New Engl J Med. 335:407–416.
Wang JW, Yao H, Lim CJ, Zhao Y, Yeo TJH, Hwang NHC.2001. Computational fluid dynamics study of a protruded-hinge bileaflet mechanical heart valve. J Heart Valve Dis.10:254–263.
Wen J, Ding G, JiangW, Zheng T. 2014. Numerical simulation ofcompliant artery bypass grafts using fluid structureinteraction framework. ASAIO J. 60(5):533–540.
Yoganathan AP, Chandran KB, Sotiropoulos F. 2005. Flow inprosthetic heart valves: state-of-the-art and future directions.Ann Biomed Eng. 33(12):1689–1694.
Yun BM, Wu J, Simon HA, Arjunon S, Sotiropoulos F, AidunCK, Yoganathan AP. 2012. A numerical invesigation ofblood damage in the hinge area of aortic bileaflet mechanicalheart valves during the leakage phase. Ann of Biomed Eng.40:1468–1485.
Y.H. Kuan et al.12
Dow
nloa
ded
by [
NU
S N
atio
nal U
nive
rsity
of
Sing
apor
e] a
t 08:
02 1
0 Fe
brua
ry 2
015


![arXiv:1605.08706v2 [physics.chem-ph] 5 Jul 2016 · discretization of time in practical implementations intro-duces a time-step (˝) error, the computational cost of which is proportional](https://img.pdfslide.us/doc/110x75/5fa4267a4b7eed5cbd4184b8/arxiv160508706v2-5-jul-2016-discretization-of-time-in-practical-implementations.jpg)