Embed Size (px)
Citation preview
OMV Exploration & Production
Determination of the I it P lIn-situ Polymer Viscosity from Fall-Off T tOff Tests
Ajana Laoroongroj, Imperial College*; Markus Zechner, OMV E&P; Torsten Clemens OMV E&P;Torsten Clemens, OMV E&P; Alain Gringarten, Imperial College
*Now with OMV E&P
Outline
Newtonian Versus Non-Newtonian Fluid Problem Statements Welltest Applications Fi ld I t d ti Field Introduction Workflow Results Results Summary and Conclusions
2
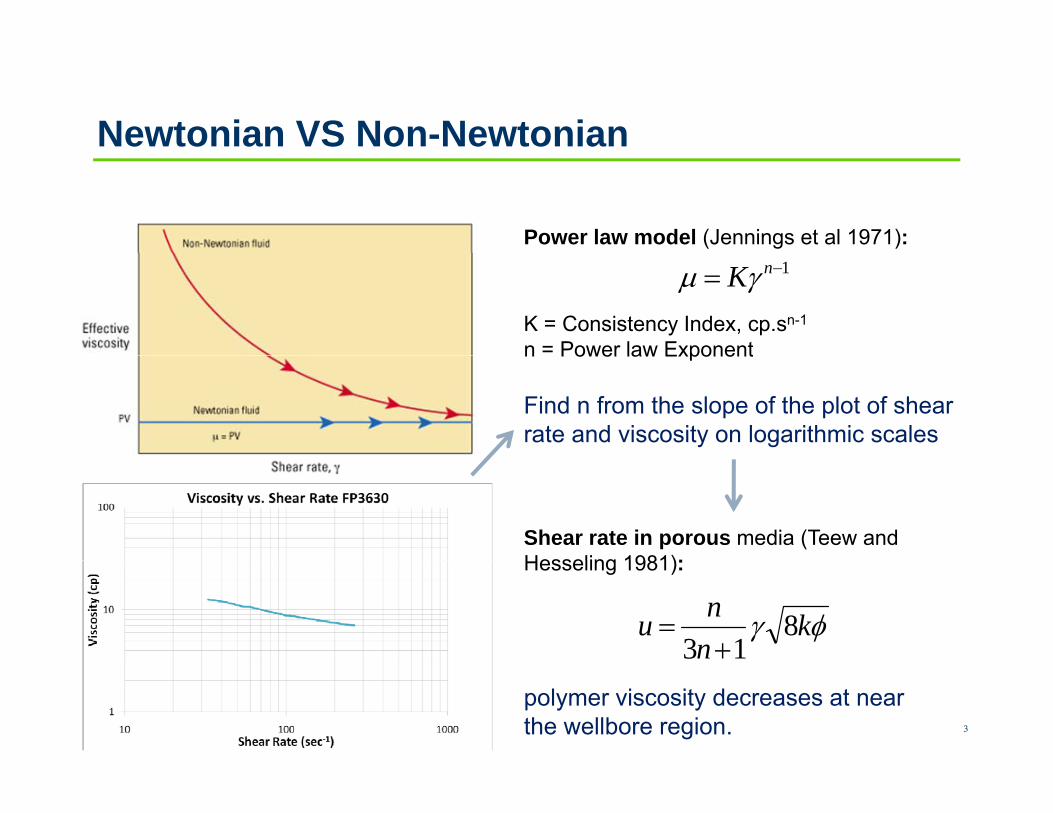
Newtonian VS Non-Newtonian
Power law model (Jennings et al 1971):1 nK
K = Consistency Index, cp.sn-1
n = Power law Exponentn Power law Exponent
Find n from the slope of the plot of shear rate and viscosity on logarithmic scales
Shear rate in porous media (Teew and Hesseling 1981):
knnu 8
13
Hesseling 1981):
3
polymer viscosity decreases at near the wellbore region.
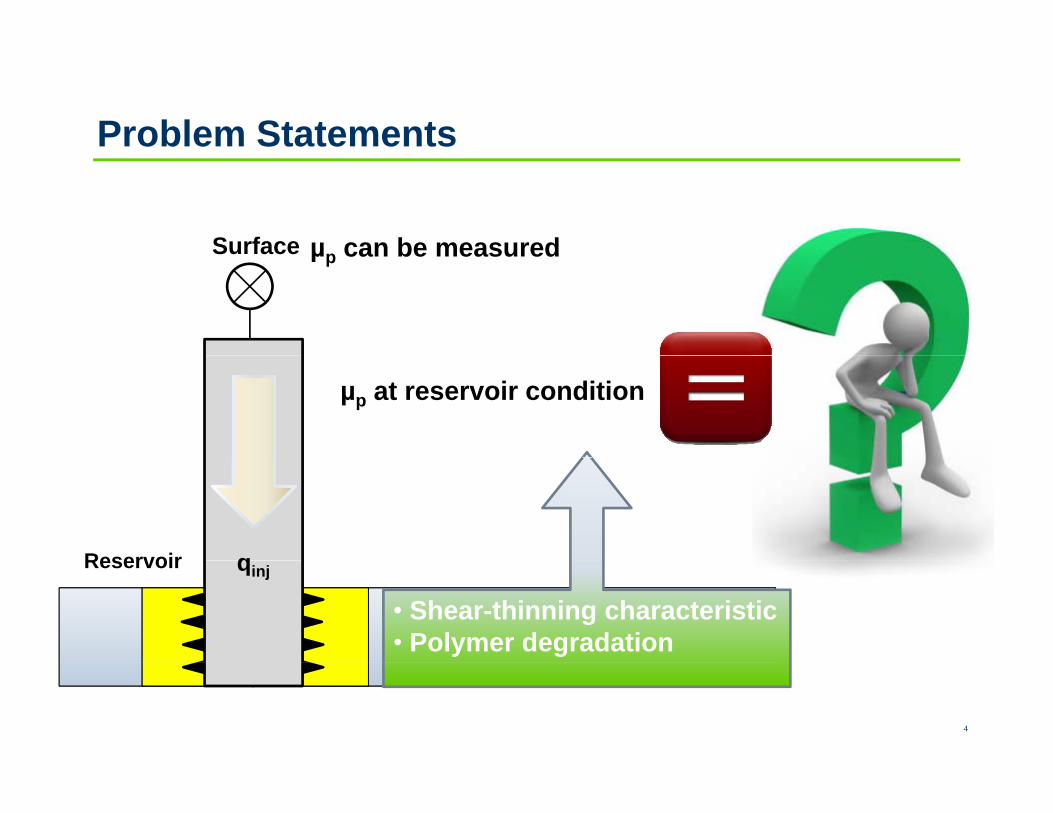
Problem Statements
Surface µ can be measuredSurface µp can be measured
µp at reservoir condition
Reservoir qReservoir qinj
• Shear-thinning characteristic• Polymer degradation
4
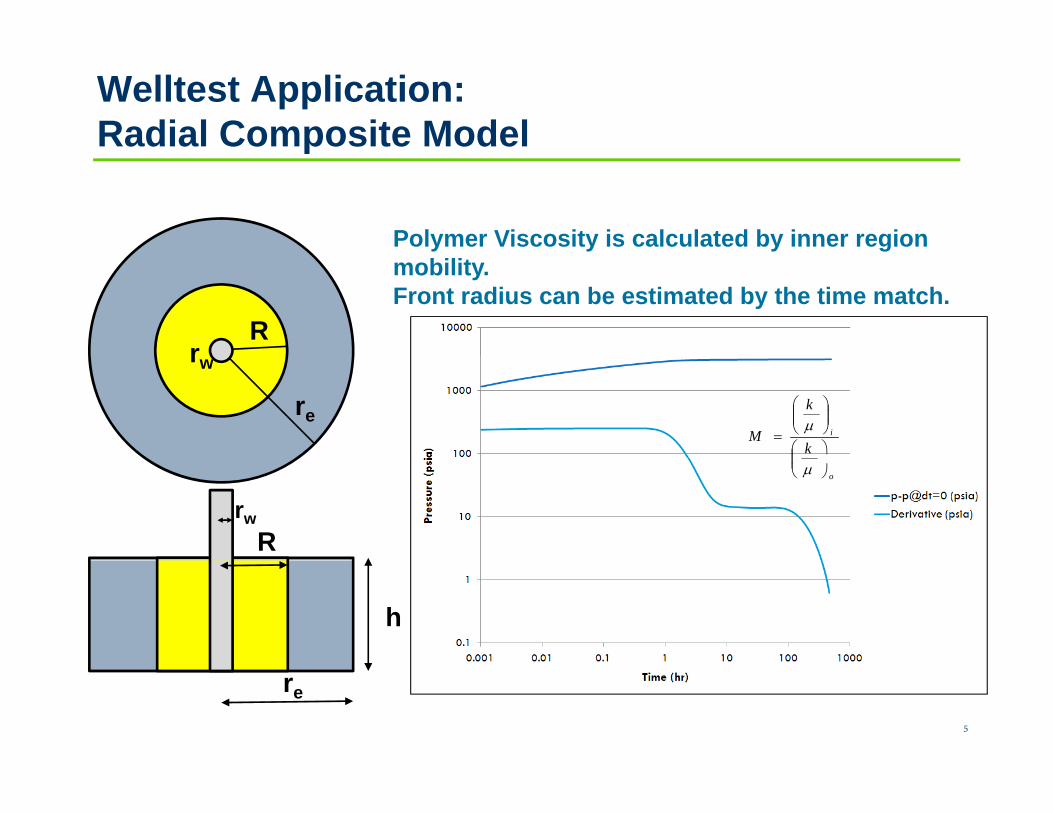
Welltest Application:Radial Composite Modelp
Polymer Viscosity is calculated by inner region
Rr
mobility. Front radius can be estimated by the time match.
re
rw
i
k
k
M
rwR
o
h
5
re
Field Introduction
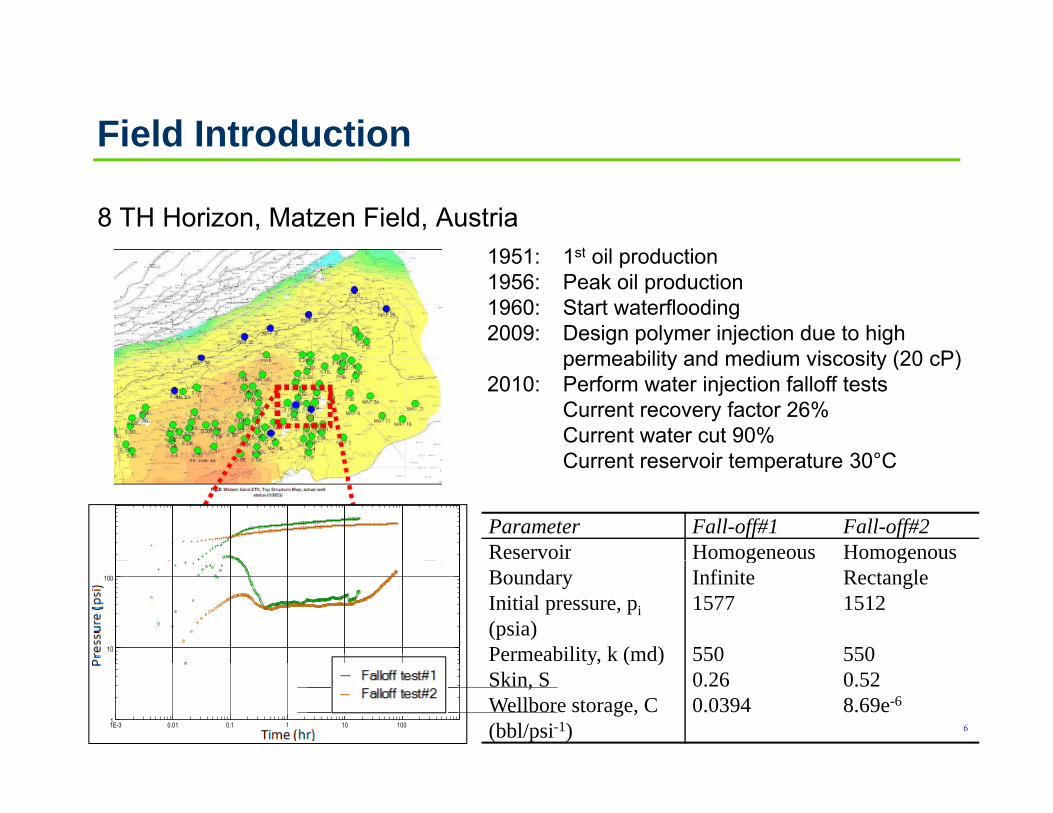
8 TH Horizon, Matzen Field, Austria1951: 1st oil production1951: 1st oil production1956: Peak oil production1960: Start waterflooding2009: Design polymer injection due to high
permeability and medium viscosity (20 cP)permeability and medium viscosity (20 cP)2010: Perform water injection falloff tests
Current recovery factor 26%Current water cut 90%Current reservoir temperature 30°CCurrent reservoir temperature 30°C
Parameter Fall-off#1 Fall-off#2Reservoir Homogeneous Homogenousg gBoundary Infinite RectangleInitial pressure, pi(psia)
1577 1512
Permeability, k (md) 550 55010
100
Pre
ssur
e [p
si]
10
6
y, ( )Skin, S 0.26 0.52Wellbore storage, C (bbl/psi-1)
0.0394 8.69e-61E-3 0.01 0.1 1 10 1001
Time [hr]
Falloff test#1 Falloff test#2
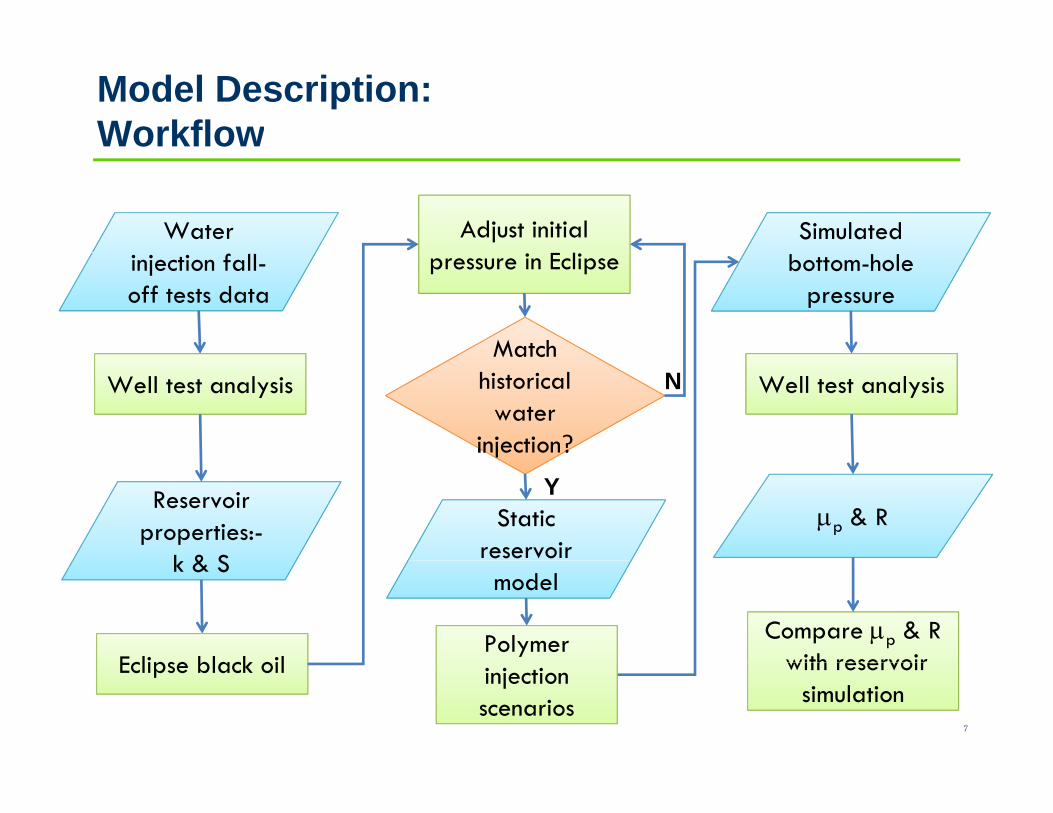
Model Description:Workflow
Water Simulated Adjust initial E linjection fall-
off tests databottom-hole
pressurepressure in Eclipse
Match Match Well test analysis Well test analysis
injection?
Match historical
water injection?
N
Reservoir properties:-
k & S
p & RStatic reservoir
Y
k & S
Eclipse black oilCompare p & R
with reservoir Polymer
model
7
Eclipse black oil with reservoir simulation
injection scenarios
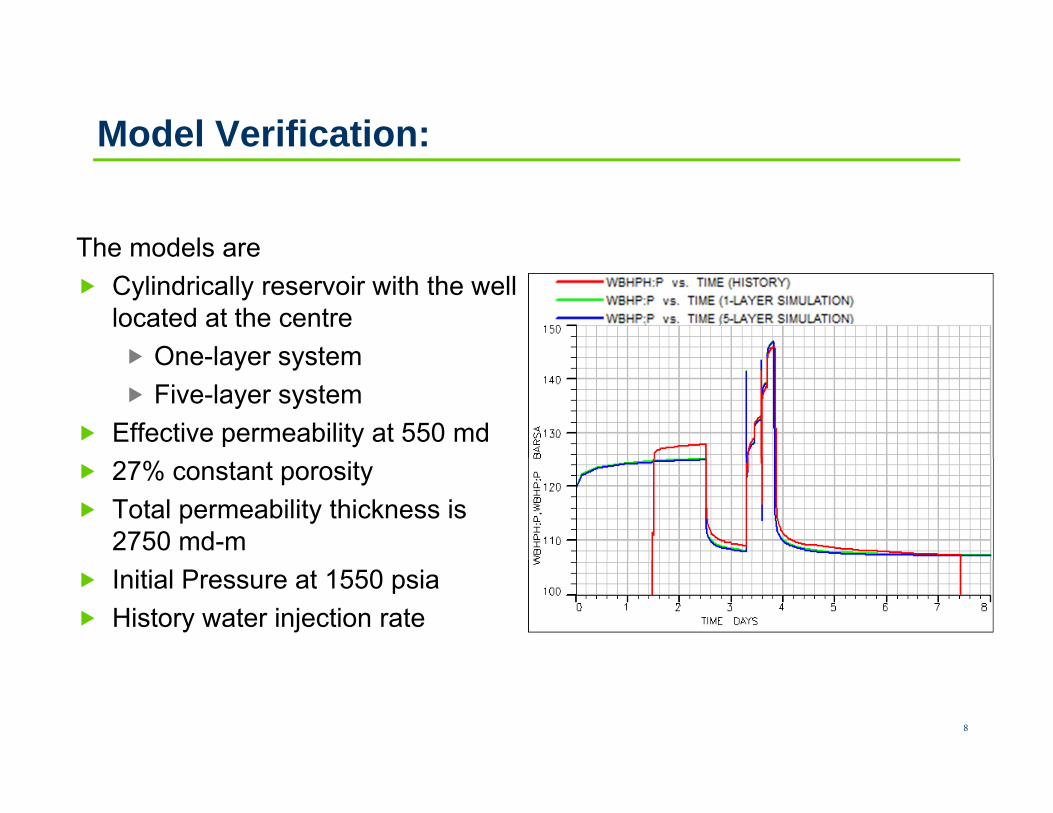
Model Verification:
The models areThe models are Cylindrically reservoir with the well
located at the centre One layer system One-layer system Five-layer system
Effective permeability at 550 md 27% constant porosity Total permeability thickness is
2750 md-m Initial Pressure at 1550 psia History water injection rate
8
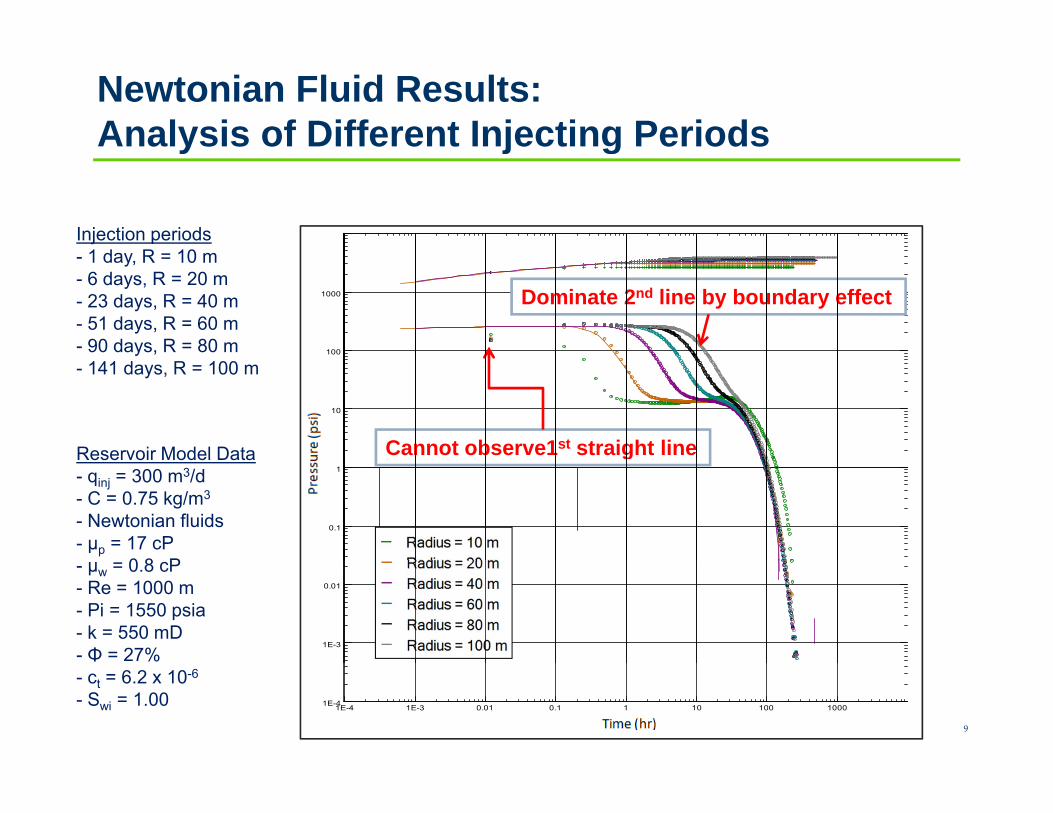
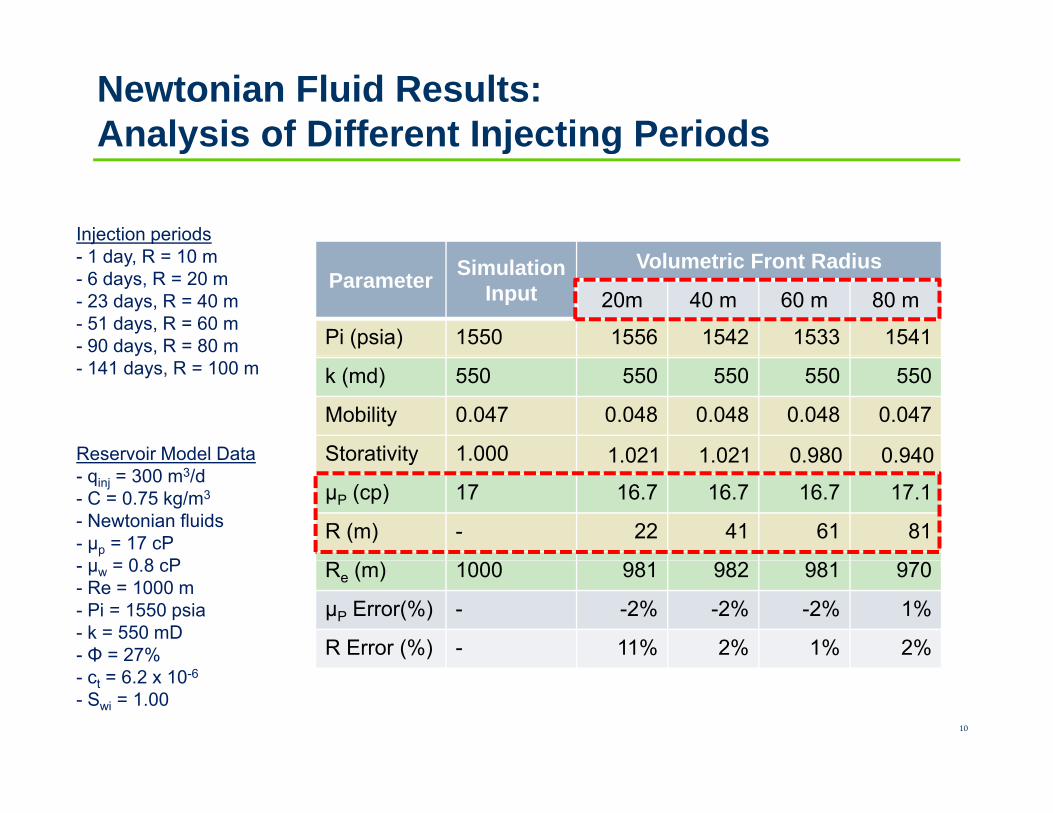
Newtonian Fluid Results:Analysis of Different Injecting Periodsy j g
Injection periods1 da R 10 m- 1 day, R = 10 m
- 6 days, R = 20 m- 23 days, R = 40 m- 51 days, R = 60 m- 90 days, R = 80 m 100
1000 Dominate 2nd line by boundary effect
y- 141 days, R = 100 m
10
Reservoir Model Data Cannot observe1st straight line
0.1
11Reservoir Model Data- qinj = 300 m3/d- C = 0.75 kg/m3
- Newtonian fluids- µp = 17 cP
0 8 P
g
1E-3
0.01
- µw = 0.8 cP- Re = 1000 m- Pi = 1550 psia- k = 550 mD- Φ = 27%
9
1E-4 1E-3 0.01 0.1 1 10 100 1000
Time [hr]
1E-4
- ct = 6.2 x 10⁻⁶
- Swi = 1.00
Newtonian Fluid Results:Analysis of Different Injecting Periodsy j g
Injection periods1 da R 10 m- 1 day, R = 10 m
- 6 days, R = 20 m- 23 days, R = 40 m- 51 days, R = 60 m- 90 days, R = 80 m
Parameter SimulationInput
Volumetric Front Radius
20m 40 m 60 m 80 m
Pi (psia) 1550 1556 1542 1533 1541y- 141 days, R = 100 m k (md) 550 550 550 550 550
Mobility 0.047 0.048 0.048 0.048 0.047
Storativity 1 000 1 021 1 021 0 980 0 940Reservoir Model Data Storativity 1.000 1.021 1.021 0.980 0.940
μP (cp) 17 16.7 16.7 16.7 17.1
R (m) - 22 41 61 81
Reservoir Model Data- qinj = 300 m3/d- C = 0.75 kg/m3
- Newtonian fluids- µp = 17 cP
0 8 P Re (m) 1000 981 982 981 970
μP Error(%) - -2% -2% -2% 1%
R Error (%) - 11% 2% 1% 2%
- µw = 0.8 cP- Re = 1000 m- Pi = 1550 psia- k = 550 mD- Φ = 27%
10
- ct = 6.2 x 10⁻⁶
- Swi = 1.00
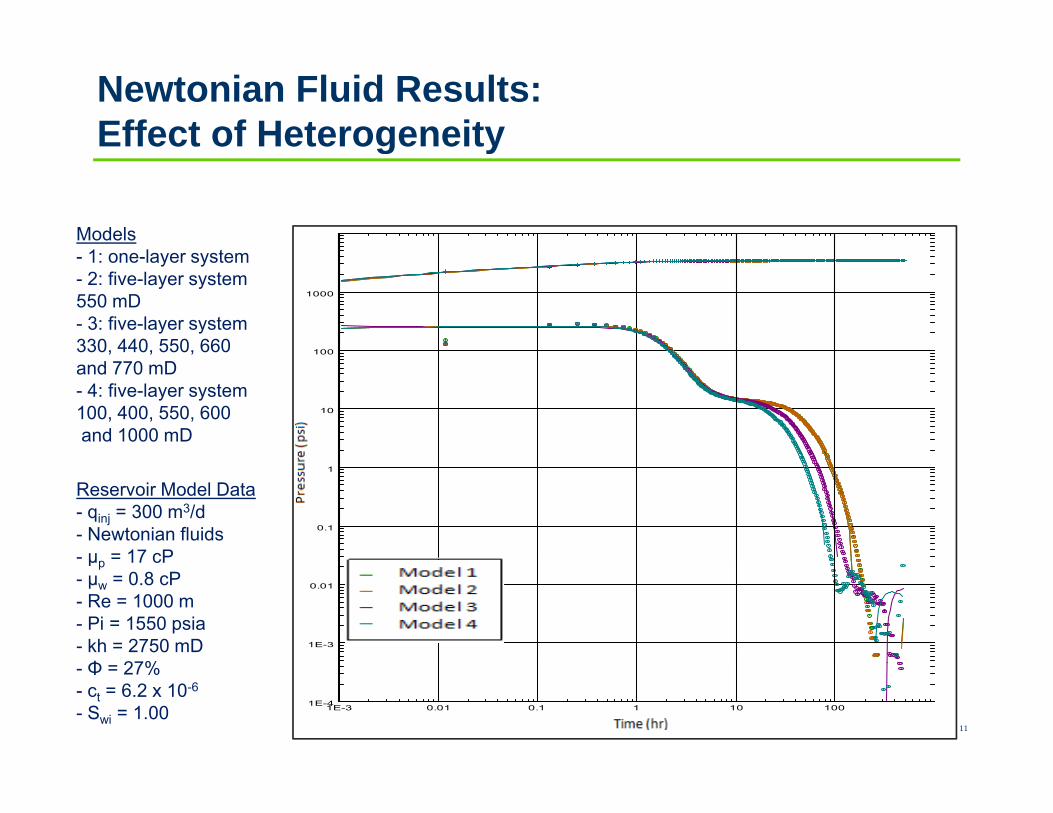
Newtonian Fluid Results:Effect of Heterogeneityg y
Models1 one la er s stem- 1: one-layer system
- 2: five-layer system550 mD - 3: five-layer system330, 440, 550, 660 100
1000
and 770 mD- 4: five-layer system100, 400, 550, 600and 1000 mD
10
Reservoir Model Data- qinj = 300 m3/d- Newtonian fluids- µ = 17 cP
0 1
1
0.1
µp 17 cP- µw = 0.8 cP- Re = 1000 m- Pi = 1550 psia- kh = 2750 mDΦ 27%
1E-3
0.01
11
- Φ = 27%- ct = 6.2 x 10⁻⁶
- Swi = 1.00 1E-3 0.01 0.1 1 10 100
Time [hr]
1E-4
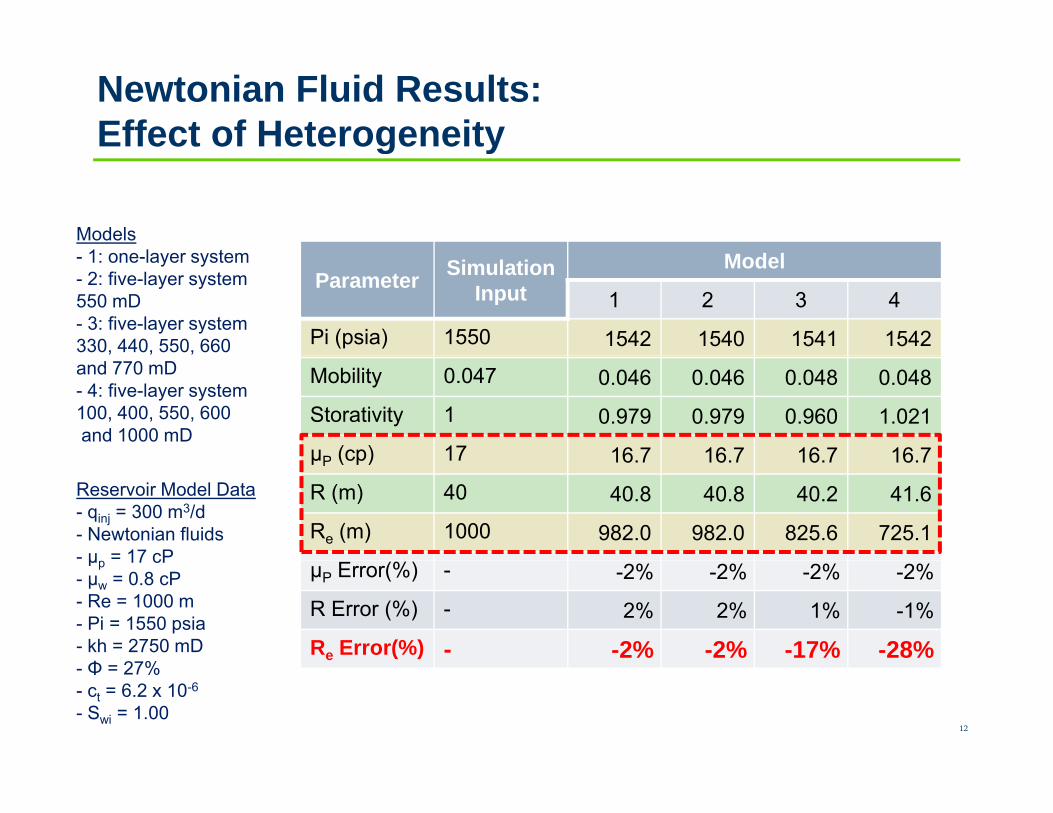
Newtonian Fluid Results:Effect of Heterogeneityg y
Models1 one la er s stem
Parameter SimulationInput
Model
1 2 3 4
Pi (psia) 1550 1542 1540 1541 1542
- 1: one-layer system- 2: five-layer system550 mD - 3: five-layer system330, 440, 550, 660
Mobility 0.047 0.046 0.046 0.048 0.048
Storativity 1 0.979 0.979 0.960 1.021
μP (cp) 17 16 7 16 7 16 7 16 7
and 770 mD- 4: five-layer system100, 400, 550, 600and 1000 mD
μP (cp) 17 16.7 16.7 16.7 16.7
R (m) 40 40.8 40.8 40.2 41.6
Re (m) 1000 982.0 982.0 825.6 725.1
Reservoir Model Data- qinj = 300 m3/d- Newtonian fluids- µ = 17 cP
μP Error(%) - -2% -2% -2% -2%
R Error (%) - 2% 2% 1% -1%
Re Error(%) - -2% -2% -17% -28%
µp 17 cP- µw = 0.8 cP- Re = 1000 m- Pi = 1550 psia- kh = 2750 mDΦ 27%
12
- Φ = 27%- ct = 6.2 x 10⁻⁶
- Swi = 1.00
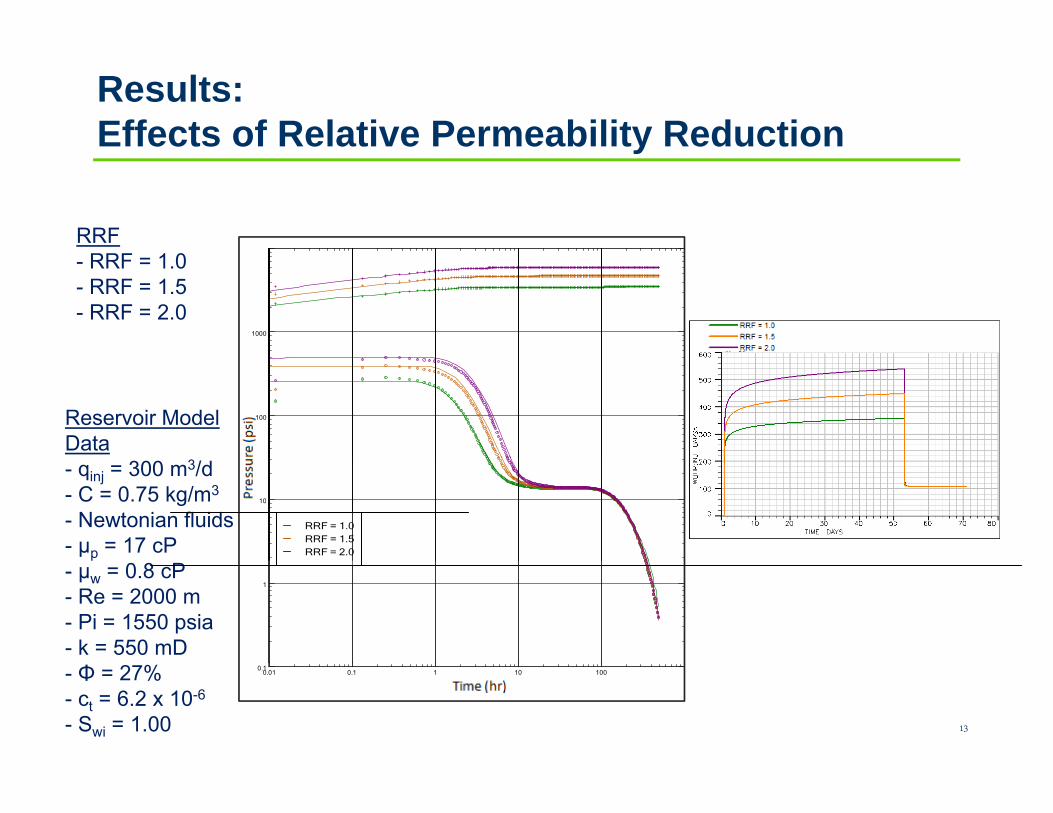
Results:Effects of Relative Permeability Reductiony
RRF- RRF = 1.0- RRF = 1.5- RRF = 2.0
1000
Reservoir ModelData
100
- qinj = 300 m3/d- C = 0.75 kg/m3
- Newtonian fluids- µp = 17 cP
1010
RRF = 1.0 RRF = 1.5 RRF = 2.0 p
- µw = 0.8 cP- Re = 2000 m- Pi = 1550 psia- k = 550 mD
1
13
- Φ = 27%- ct = 6.2 x 10⁻⁶
- Swi = 1.00
0.01 0.1 1 10 100
Time [hr]
0.1
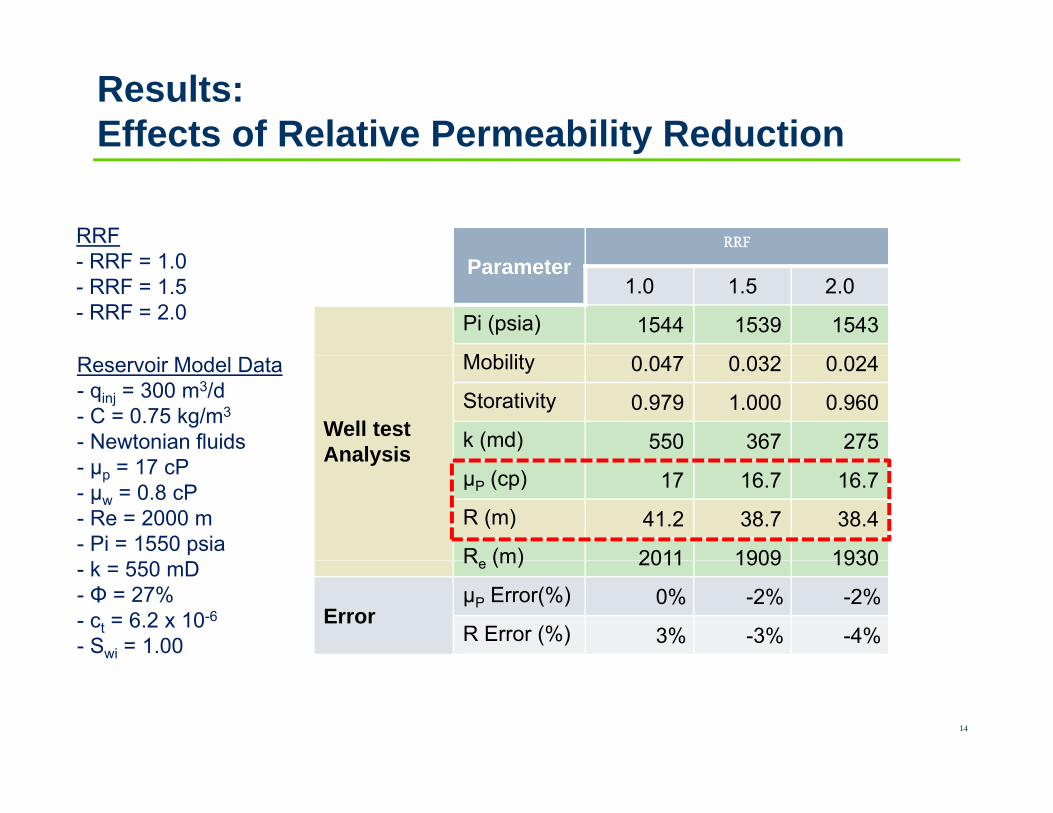
Results:Effects of Relative Permeability Reductiony
RRF RRF- RRF = 1.0- RRF = 1.5- RRF = 2.0
Parameter1.0 1.5 2.0
Pi (psia) 1544 1539 1543
M bilitReservoir Model Data- qinj = 300 m3/d- C = 0.75 kg/m3
- Newtonian fluids Well test Analysis
Mobility 0.047 0.032 0.024
Storativity 0.979 1.000 0.960
k (md) 550 367 275- µp = 17 cP- µw = 0.8 cP- Re = 2000 m- Pi = 1550 psia
AnalysisμP (cp) 17 16.7 16.7
R (m) 41.2 38.7 38.4
R (m) 2011 1909 1930- k = 550 mD- Φ = 27%- ct = 6.2 x 10⁻⁶
- Swi = 1.00
Re (m) 2011 1909 1930
ErrorμP Error(%) 0% -2% -2%
R Error (%) 3% -3% -4%
14
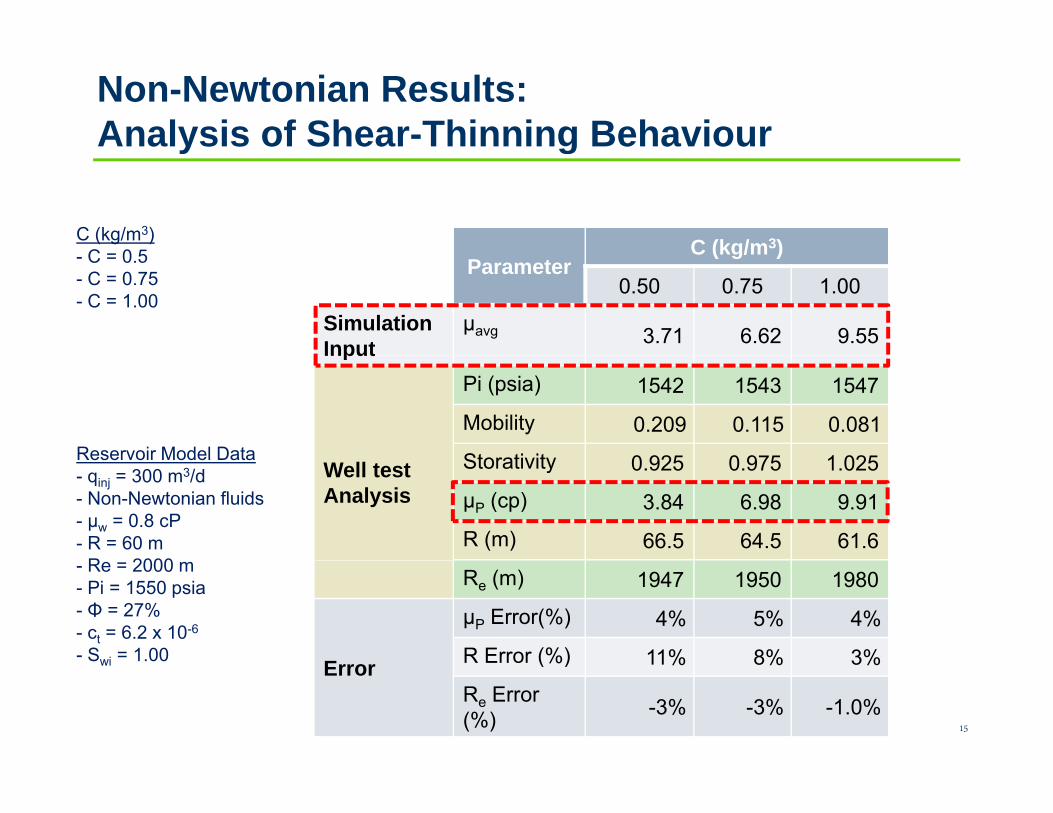
Non-Newtonian Results:Analysis of Shear-Thinning Behavioury g
C (kg/m3)C 0 5 C (kg/m3)- C = 0.5
- C = 0.75- C = 1.00
ParameterC (kg/m )
0.50 0.75 1.00
Simulation Input
μavg 3.71 6.62 9.55
Reservoir Model Data
InputPi (psia) 1542 1543 1547
Mobility 0.209 0.115 0.081
Storativity 0 925 0 975 1 025Reservoir Model Data- qinj = 300 m3/d- Non-Newtonian fluids- µw = 0.8 cP- R = 60 m
R 2000
Well test Analysis
Storativity 0.925 0.975 1.025
μP (cp) 3.84 6.98 9.91
R (m) 66.5 64.5 61.6- Re = 2000 m- Pi = 1550 psia- Φ = 27%- ct = 6.2 x 10⁻⁶
- Swi = 1.00
Re (m) 1947 1950 1980
E
μP Error(%) 4% 5% 4%
R Error (%) 11% 8% 3%
15
wi Error (%) 11% 8% 3%
Re Error (%) -3% -3% -1.0%
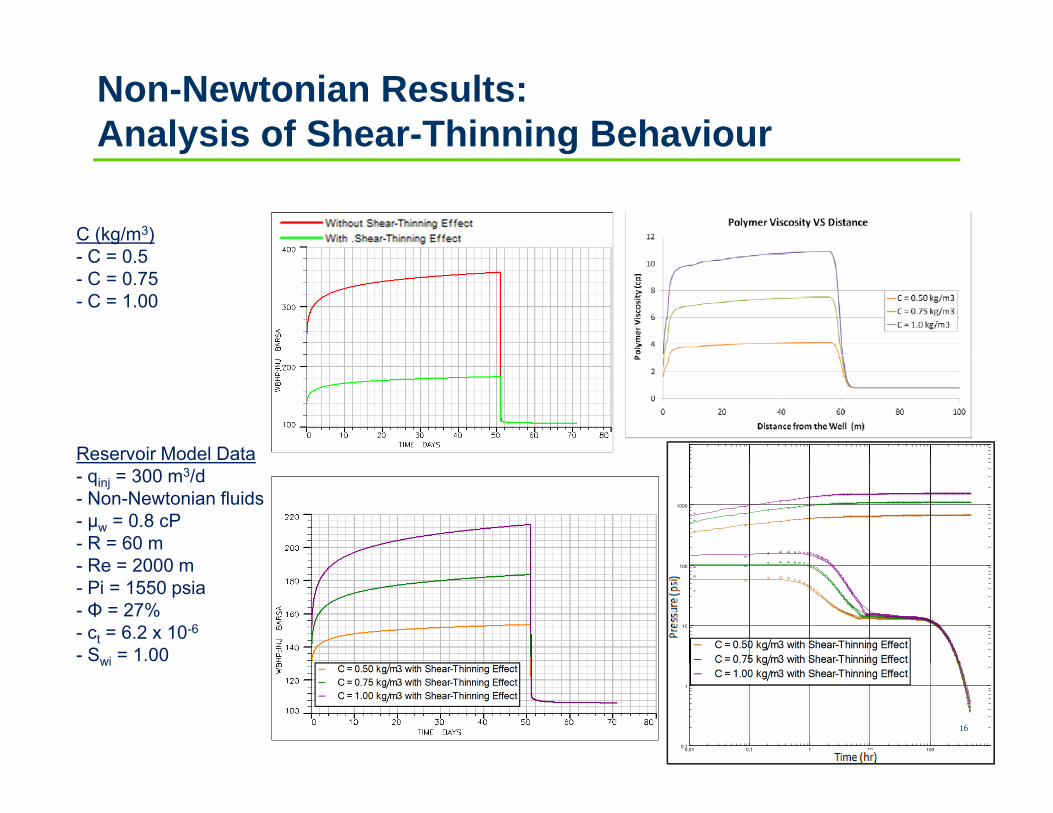
Non-Newtonian Results:Analysis of Shear-Thinning Behavioury g
C (kg/m3)C 0 5- C = 0.5
- C = 0.75- C = 1.00
Reservoir Model DataReservoir Model Data- qinj = 300 m3/d- Non-Newtonian fluids- µw = 0.8 cP- R = 60 m
R 2000
1000
- Re = 2000 m- Pi = 1550 psia- Φ = 27%- ct = 6.2 x 10⁻⁶
- Swi = 1.00
1010
100
16
wi
0.01 0.1 1 10 100
Time [hr]
0.1
1
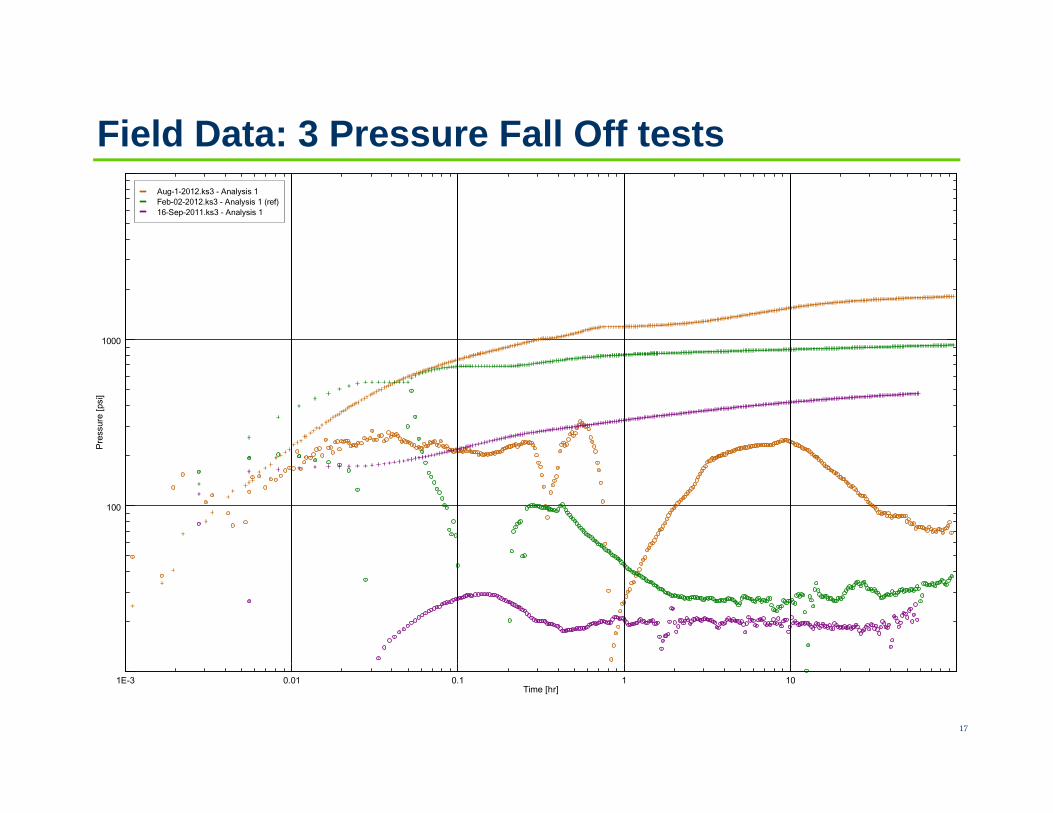
Field Data: 3 Pressure Fall Off testsAug-1-2012.ks3 - Analysis 1Feb-02-2012.ks3 - Analysis 1 (ref)16-Sep-2011.ks3 - Analysis 1
1000
Pre
ssur
e [p
si]
100
17
1E-3 0.01 0.1 1 10Time [hr]
Summary and conclusionsy
Polymer front radius and in-situ polymer viscosity can be determined by pressure transient analysis.
Shear-thinning fluid pressure transient analysis gives a good g p y g gestimate of the polymer fluid front and in-situ viscosity.
The reservoir uncertainty is reduced by performing water injection The reservoir uncertainty is reduced by performing water injection fall-off tests.
Multiple polymer injection fall off tests should be performed Multiple polymer injection fall-off tests should be performed.
18

Acknowledgements
OMV E&P for the permission to publish the paper.
Wei Chun Chu and Martin Kornberger for the discussions.
Gery Verient for the welltest data.
19

Q&A
20