Embed Size (px)
Citation preview

Comprehensive AnnuAl FinAnCiAl reportFor the FisCAl yeAr ending june 30, 2015
A Component Unit of Harford County, MarylandPrepared by the Division of Business Services Finance Department
Barbara P. Canavan, Superintendent of SchoolsA.A. Roberty Building 102 S. Hickory Avenue Bel Air, Maryland 21014

2014-2015 Board of Education of Harford County
COVER, FROM TOP LEFT TO BOTTOM RIGHT: The Patterson Mill Key Club collected more than 400 pairs of shoes, for those less fortunate, in partnership with the Shoes2Share charity organization; Meadowvale Elementary School fourth and fifth grade students toured Annapolis and met Governor Larry Hogan following their completion of the Patriot Program; Aberdeen High School students with Vice President Joe Biden; Caroline Hickam (front center), junior at C. Milton Wright High School and Girl Scouts of America Gold Award candidate, organized a heart disease awareness event that served as a fundraiser to help equip schools with CPR kits; Magnolia Middle School sixth and seventh grade students planted 270 trees as a part of the restoration tree planting program; The Harford County Branch of the American Association of University Women (AAUW) honored 12 Harford County high school junior female students at the annual Dr. Judith Resnik Awards Luncheon.
Cover design by Stephanie Williams, Graphic Design & Technical Specialist, HCPS Communications Office.
Francis F. “Rick” Grambo, IIIVice President
Elected MemberCouncilmanic District D
Nancy ReynoldsPresident
Appointed Member-at-Large
Alysson L. KrchnavyAppointed Member-at-Large
Joseph A. HauAppointed Member-at-Large
James D. ThorntonAppointed Member-at-Large
Thomas FitzpatrickAppointed Member-at-Large
Arthur F. Kaff, Esq.Appointed Member-at-Large
Robert L. FrischElected Member
Councilmanic District A
Cassandra R. Beverley, Esq.Elected Member
Councilmanic District B
Hannah E. JonesStudent Representative
Barbara P. CanavanSuperintendent of Schools
Comprehensive Annual Financial Report For the Fiscal Year ended June 30, 2015
Component Unit of Harford County, Maryland
Prepared by the Division of Business Services
Finance Department
102 South Hickory Avenue
Bel Air, Maryland 21014
Office of Civil Rights Statement for Harford County Public Schools The Harford County Public School System does not discriminate on the basis of race, color, sex, age, national origin, religion, sexual orientation, marital status, genetic identification, political affiliation, or disability in matters affecting employment or in providing access to programs to employees. Inquiries related to the policies of the Board of Education of Harford County should be directed to the Manager of Communications, 410-588-5203.
Harford County Public Schools
Student Contributors for Artwork:
Student Grade School Page
Elizabeth Moorman 9 Fallston High School 1
Ashley Chan 7 Southampton Middle School 4
Jasanveer Aulakh 5 Emmorton Elementary School 5
Maria Guadagno 11 C. Milton Wright High School 12
Samantha Graziano 12 C. Milton Wright High School 14
Amber Gonzalez-Torres 12 Harford Technical High School 30
Elisha Burkes 10 Aberdeen High School 65
Jace Williams 2 Red Pump Elementary School 68
Sasha Taylor K Riverside Elementary School 69
Shelby Gahler 11 Bel Air High School 76
Ambriel Deere 12 Harford Technical High 76
Lance Einfeld 10 Aberdeen High School 94
Daryese Fleming 4 Joppatowne Elementary School 97
Mary Kraczek 9 Bel Air High School 97
Elizabeth Moorman, Grade 9, Fallston High School
Teacher: Brenda McLeod
1
Harford County Public Schools Table of Contents Pages Introductory Section 4 Vision, Mission, and Goals 5 Board of Education of Harford County/HCPS Administration 6 Organization Chart of Administration 7 Transmittal Letter 8 - 12 Certificate of Achievement for Excellence in Financial Reporting 13 Financial Section 14 Report of Independent Public Accountants 15 - 17 Management’s Discussion and Analysis 18 - 30 Basic Financial Statements Government-Wide Financial Statements: Statement of Net Position Exhibit 1 31 Statement of Activities Exhibit 2 32 Fund Financial Statements: Balance Sheet – Governmental Funds Exhibit 3 33 Reconciliation of Governmental Funds Balance Sheet to the Statement of Net Position Exhibit 4 34 Statement of Revenues, Expenditures, and Changes In Fund Balances – Governmental Funds Exhibit 5 35 Reconciliation of the Governmental Funds Statement of Revenues, Expenditures, and Changes in Fund Balances to the Statement of Activities Exhibit 6 36 Statement of Revenues, Expenditures, and Changes in Fund Balance – Budget (Non-GAAP Basis) and Actual – General Fund Exhibit 7 37 Statement of Fiduciary Net Position Exhibit 8 38 Statement of Changes in Fiduciary Net Position Exhibit 9 39 Notes to Financial Statements 40 – 64 Required Supplemental Information 65 Schedule of Funding Progress 66 Schedule of Proportionate Share of Net Pension Liability 67 Schedule of Contributions 68
2
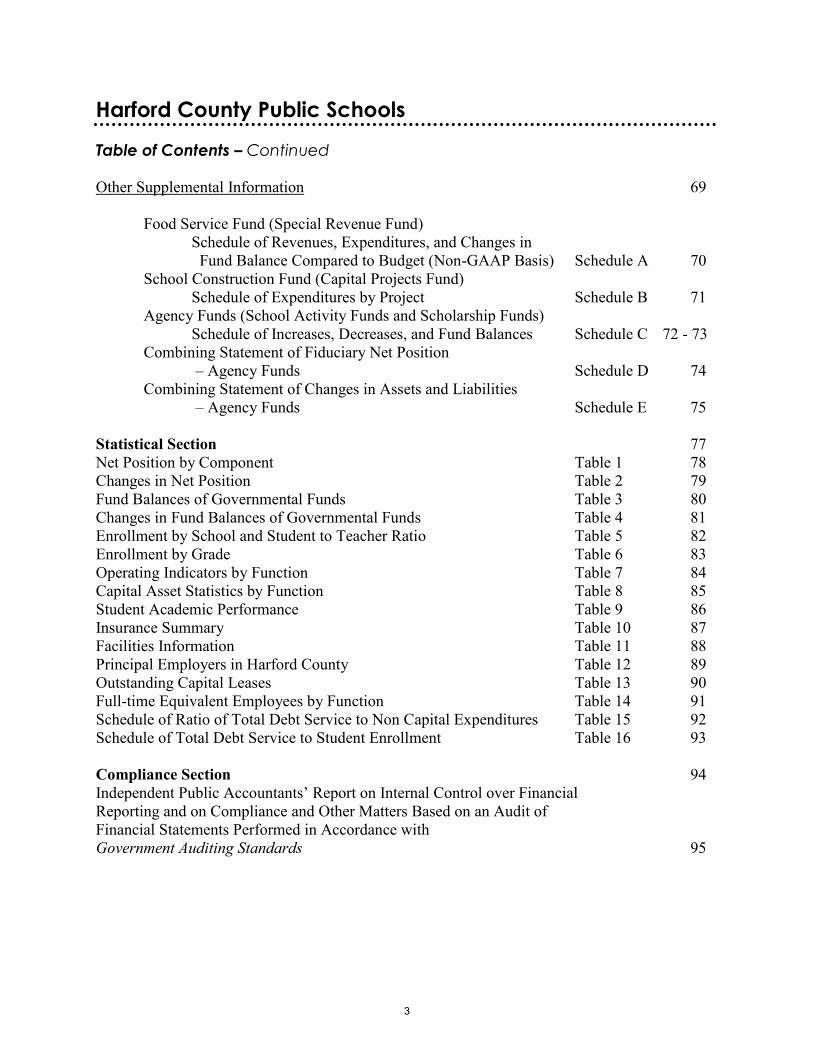
Harford County Public Schools Table of Contents – Continued
Other Supplemental Information 69
Food Service Fund (Special Revenue Fund) Schedule of Revenues, Expenditures, and Changes in Fund Balance Compared to Budget (Non-GAAP Basis) Schedule A 70
School Construction Fund (Capital Projects Fund) Schedule of Expenditures by Project Schedule B 71 Agency Funds (School Activity Funds and Scholarship Funds) Schedule of Increases, Decreases, and Fund Balances Schedule C 72 - 73
Combining Statement of Fiduciary Net Position – Agency Funds Schedule D 74
Combining Statement of Changes in Assets and Liabilities – Agency Funds Schedule E 75
Statistical Section 77 Net Position by Component Table 1 78 Changes in Net Position Table 2 79 Fund Balances of Governmental Funds Table 3 80 Changes in Fund Balances of Governmental Funds Table 4 81 Enrollment by School and Student to Teacher Ratio Table 5 82 Enrollment by Grade Table 6 83 Operating Indicators by Function Table 7 84 Capital Asset Statistics by Function Table 8 85 Student Academic Performance Table 9 86 Insurance Summary Table 10 87 Facilities Information Table 11 88 Principal Employers in Harford County Table 12 89 Outstanding Capital Leases Table 13 90 Full-time Equivalent Employees by Function Table 14 91 Schedule of Ratio of Total Debt Service to Non Capital Expenditures Table 15 92 Schedule of Total Debt Service to Student Enrollment Table 16 93 Compliance Section 94 Independent Public Accountants’ Report on Internal Control over Financial Reporting and on Compliance and Other Matters Based on an Audit of Financial Statements Performed in Accordance with Government Auditing Standards 95
3

Introductory Section
Ashley Chan, Grade 7, Southampton Middle School
Teacher: Sue Ellen North
4

Harford County Public Schools
Vision Harford County Public Schools will be a community of learners in which our public
schools, families, public officials, businesses, community organizations, and other citizens work collaboratively to prepare all of our students to succeed academically and socially in a diverse, democratic, change-oriented, and global society.
Mission The mission of Harford County Public Schools is to promote excellence in instructional
leadership and teaching and to provide facilities and instructional materials that support teaching and learning for the 21st century. The Harford County Board of Education will support this mission by fostering a climate for deliberate change and monitoring progress though measurable indicators.
Goals 1. To prepare every student for success in postsecondary education and a career. 2. To encourage and monitor engagement between the school system and the community to
support student achievement. 3. To hire and support skilled staff who are committed to increasing student achievement. 4. To provide safe, secure, and healthy learning environments that are conducive to
effective teaching and learning.
Brad Myers, Joppatowne High School, Grade 9
Jasanveer Aulakh, Grade 5, Emmorton Elementary School
Teacher: Carolyn Wolf
5
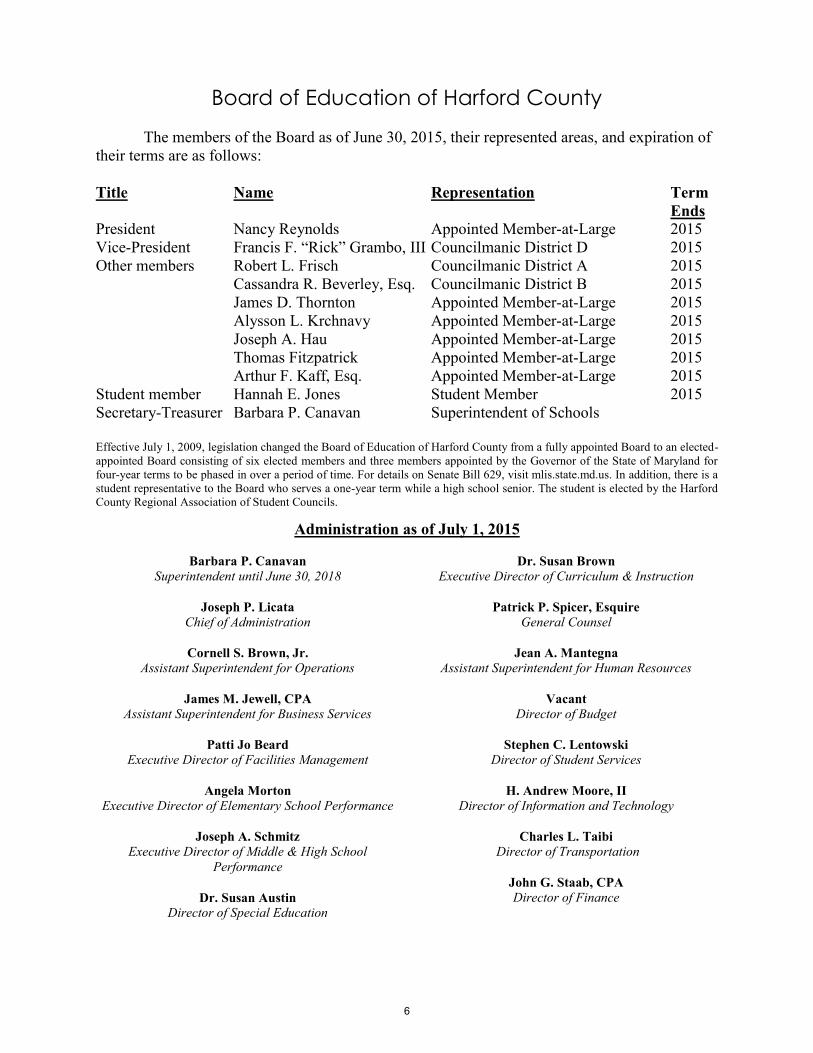
Board of Education of Harford County
The members of the Board as of June 30, 2015, their represented areas, and expiration of their terms are as follows:
Title Name Representation Term Ends President Nancy Reynolds Appointed Member-at-Large 2015 Vice-President Francis F. “Rick” Grambo, III Councilmanic District D 2015 Other members Robert L. Frisch Councilmanic District A 2015 Cassandra R. Beverley, Esq. Councilmanic District B 2015 James D. Thornton Appointed Member-at-Large 2015 Alysson L. Krchnavy Appointed Member-at-Large 2015 Joseph A. Hau Appointed Member-at-Large 2015 Thomas Fitzpatrick Appointed Member-at-Large 2015 Arthur F. Kaff, Esq. Appointed Member-at-Large 2015 Student member Hannah E. Jones Student Member 2015 Secretary-Treasurer Barbara P. Canavan Superintendent of Schools Effective July 1, 2009, legislation changed the Board of Education of Harford County from a fully appointed Board to an elected-appointed Board consisting of six elected members and three members appointed by the Governor of the State of Maryland for four-year terms to be phased in over a period of time. For details on Senate Bill 629, visit mlis.state.md.us. In addition, there is a student representative to the Board who serves a one-year term while a high school senior. The student is elected by the Harford County Regional Association of Student Councils.
Administration as of July 1, 2015
Barbara P. Canavan Superintendent until June 30, 2018
Joseph P. Licata
Chief of Administration
Dr. Susan Brown Executive Director of Curriculum & Instruction
Patrick P. Spicer, Esquire
General Counsel
Cornell S. Brown, Jr. Assistant Superintendent for Operations
James M. Jewell, CPA
Assistant Superintendent for Business Services
Patti Jo Beard Executive Director of Facilities Management
Angela Morton
Executive Director of Elementary School Performance
Joseph A. Schmitz Executive Director of Middle & High School
Performance
Dr. Susan Austin Director of Special Education
Jean A. Mantegna Assistant Superintendent for Human Resources
Vacant
Director of Budget
Stephen C. Lentowski Director of Student Services
H. Andrew Moore, II
Director of Information and Technology
Charles L. Taibi Director of Transportation
John G. Staab, CPA Director of Finance
6
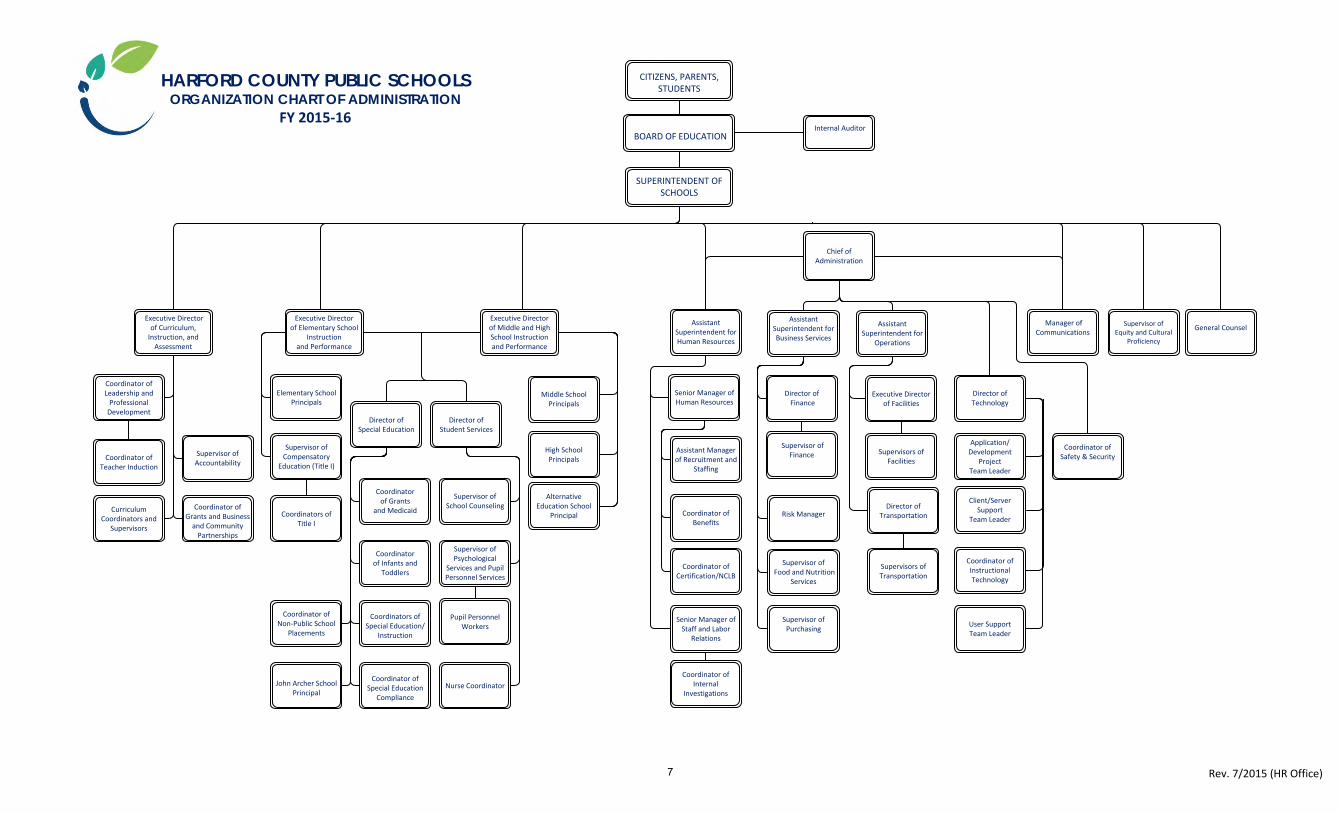
Chief of Administration
Assistant Superintendent for Human Resources
Senior Manager of Human Resources
Assistant Manager of Recruitment and
Staffing
Coordinator of Certification/NCLB
Coordinator of Benefits
Senior Manager of Staff and Labor
Relations
Coordinator of Internal
Investigations
Assistant Superintendent for
Operations
Director of Transportation
Executive Director of Facilities
Supervisors of Facilities
Director of Technology
Application/Development
Project Team Leader
Client/Server Support
Team Leader
User Support Team Leader
CITIZENS, PARENTS, STUDENTS
BOARD OF EDUCATION
SUPERINTENDENT OF
SCHOOLS
Coordinator of Leadership and Professional Development
Curriculum
Coordinators and Supervisors
Director of
Special Education
Coordinator of Infants and
Toddlers
Coordinator of
Non‐Public School Placements
John Archer SchoolPrincipal
Director of
Student Services
Nurse Coordinator
Supervisor of Psychological
Services and Pupil Personnel Services
Pupil Personnel
Workers
Supervisor of
School Counseling
Executive Director
of Elementary School Instruction
and Performance
Elementary School
Principals
Supervisor of Compensatory
Education (Title I)
Executive Director of Middle and High School Instruction and Performance
Middle School Principals
High SchoolPrincipals
Supervisor of Accountability
Coordinator of Grants and Business and Community Partnerships
Coordinator of
Teacher Induction
Coordinator of Grants
and Medicaid
Coordinators of Special Education/
Instruction
Coordinator of Special Education
Compliance
Internal Auditor
Supervisors of Transportation
Coordinator ofInstructional Technology
Coordinators of Title I
Executive Director of Curriculum, Instruction, and Assessment
Manager of Communications
Supervisor of
Equity and Cultural Proficiency
General Counsel
Assistant Superintendent for Business Services
Director of Finance
Risk Manager
Supervisor of Food and Nutrition
Services
Supervisor of Purchasing
Supervisor of Finance
HARFORD COUNTY PUBLIC SCHOOLSORGANIZATION CHART OF ADMINISTRATION
FY 2015‐16
Rev. 7/2015 (HR Office)
Coordinator of Safety & Security
Alternative
Education School Principal
7
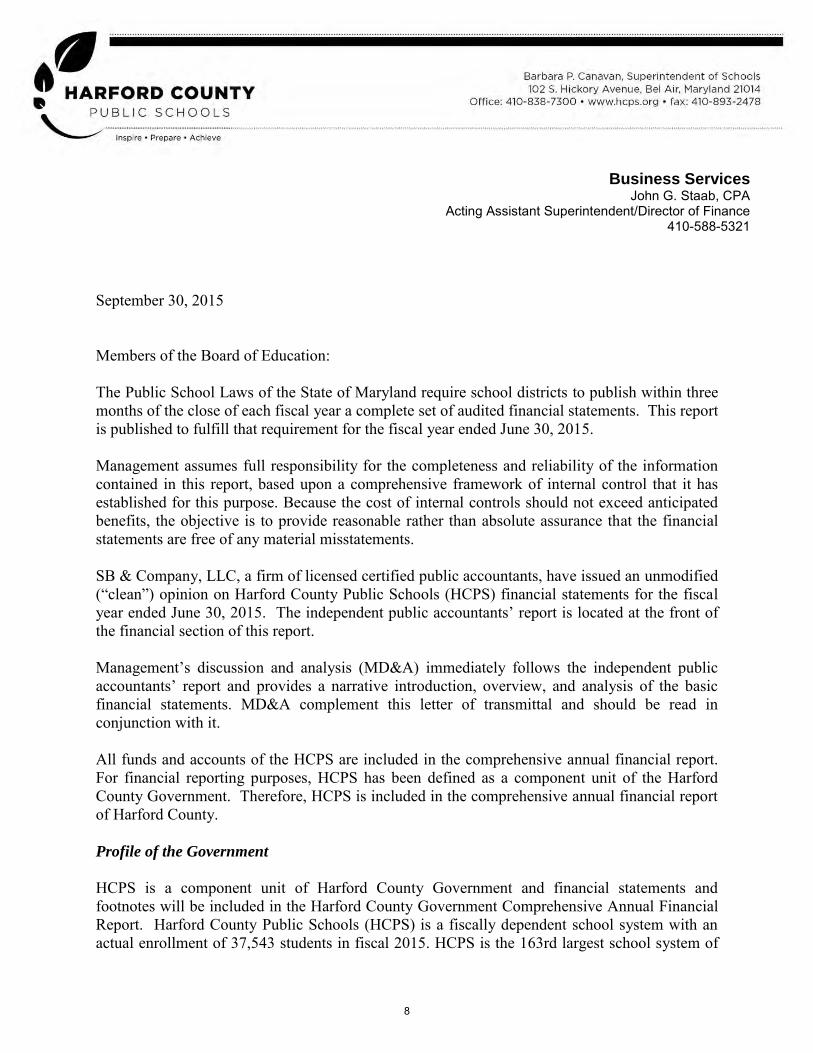
September 30, 2015 Members of the Board of Education: The Public School Laws of the State of Maryland require school districts to publish within three months of the close of each fiscal year a complete set of audited financial statements. This report is published to fulfill that requirement for the fiscal year ended June 30, 2015. Management assumes full responsibility for the completeness and reliability of the information contained in this report, based upon a comprehensive framework of internal control that it has established for this purpose. Because the cost of internal controls should not exceed anticipated benefits, the objective is to provide reasonable rather than absolute assurance that the financial statements are free of any material misstatements. SB & Company, LLC, a firm of licensed certified public accountants, have issued an unmodified (“clean”) opinion on Harford County Public Schools (HCPS) financial statements for the fiscal year ended June 30, 2015. The independent public accountants’ report is located at the front of the financial section of this report. Management’s discussion and analysis (MD&A) immediately follows the independent public accountants’ report and provides a narrative introduction, overview, and analysis of the basic financial statements. MD&A complement this letter of transmittal and should be read in conjunction with it. All funds and accounts of the HCPS are included in the comprehensive annual financial report. For financial reporting purposes, HCPS has been defined as a component unit of the Harford County Government. Therefore, HCPS is included in the comprehensive annual financial report of Harford County. Profile of the Government
HCPS is a component unit of Harford County Government and financial statements and footnotes will be included in the Harford County Government Comprehensive Annual Financial Report. Harford County Public Schools (HCPS) is a fiscally dependent school system with an actual enrollment of 37,543 students in fiscal 2015. HCPS is the 163rd largest school system of
Business Services John G. Staab, CPA
Acting Assistant Superintendent/Director of Finance 410-588-5321
8
the 13,515 regular school districts in the country when ranked by enrollment.1 This places HCPS in the top one percent of school districts by size. There are 24 school districts in the State of Maryland and HCPS is ranked 8th in size.2 The student body will be served by a projected 4,968 FTE faculty and staff positions for fiscal 2016. Citizens in the County have a choice of public or private schools. Harford County has 54 public schools and 46 non-public schools2 located within the County. The number of students attending private schools is unknown. The 2014 estimated population of Harford County was 248,8003. According to the U.S. Census Bureau, the school-age population in 2013 was 43,3344, of which 36,780 (HCPS enrollment less preschool and prekindergarten) or 84.9% attended public schools. School enrollment was 35,963 in 1994 and reached a peak of 40,212 in 2005. In 2009, the State legislature enacted changes to the Harford County Board of Education membership that would transition over time in order to expand the Board to nine members and one student member, with six of the members to be elected and three appointed by the governor. The Board membership transition is now complete with the Board seated July 1, 2015. County Government perspective on local economy5 Local economy: The revenue outlook for fiscal year 2015 remained challenging while preparing the fiscal year 2016 budget. A lagging national economy and unfunded mandates from the State of Maryland have resulted in lean budgets for 2016. The County’s largest revenue source remains real property taxes. The fiscal year 2015 taxable assessable base resulted in an increase over the fiscal year 2014 assessable base of 1.0 percent. The assessable base growth rate is expected to increase by 1.0 percent in fiscal year 2016. General Fund property tax revenues net, of interest, discounts and credits are estimated to increase by 1.0 percent from fiscal year 2015 to fiscal year 2016. The real estate market has experienced a modest recovery in property assessments, which have increased, albeit slightly, for the past two years after declining for the previous four years.
Income tax revenue, the second largest revenue source in the County, is directly affected by population growth, employment levels, and personal income. Income tax revenue has shown increases beginning in 2010 through 2015 using the modified accrual basis of accounting. The year over year increase for 2012 to 2013, 2013 to 2014 and 2014 to 2015 has been 2.3%, 3.7%, and 1.9%, respectively. Income tax is budgeted at $203.4 million for fiscal year 2016.
1U.S. Department of Education, National Center for Education Statistics, Common Core of Data(CCD), “Public Elementary/Secondary School Universe Survey,” 2012-2013, Table 214.10. 2 Maryland State Department of Education Fact Book for the Fiscal Year 2013-2014. 3 Harford County Department of Planning and Zoning. 4 United States Census Bureau, QuickFacts, Harford County, Maryland, Persons under 5 years/18 years, V2013 5 Excerpts from the Harford County Government Comprehensive Annual Financial Report for the year ended June 30, 2014.
9
Long-term financial planning for the school system
HCPS’ major funding sources, Harford County and the State of Maryland, have started recovery from the last few years of the economic downturn. However, this has not translated into an increase in funding from these entities. In addition, declining enrollment has resulted in declining revenue from the State of Maryland’s enrollment driven funding. Due to the prevailing low interest environment, investment earnings have provided a relatively negligible source of revenue. Sufficient resources from all funding sources were identified and reallocated with minimal impact to school-based programs or services. These factors continue to be a concern as we move forward and HCPS continues to examine ways to reduce costs and still maintain a higher level of service to our students and citizens. In the General Assembly Session of 2012, the State changed the Maintenance of Effort Law clearly defining the minimum local government funding. This change could affect future County contributions to education. The Maryland General Assembly enacted Chapter 288, Acts of 2002 – the Bridge to Excellence in Public Schools Act, which established new primary State education aid formulas based on adequacy cost studies using the professional judgment and successful schools method and other education finance analyses that were conducted in 2000 and 2001 under the purview of the Commission on Education Finance, Equity and Excellence. State funding to implement the Bridge to Excellence Act was phased-in over six years, reaching full implementation in fiscal 2008. Chapter 288 required a follow up study of the adequacy of education funding in the State to be undertaken approximately 10 years after its enactment. The study must include, at a minimum, adequacy cost studies that identify a base funding level for students without special needs and per pupil weights for students with special needs to be applied to the base funding level, and an analysis of the effects of concentrations of poverty on adequacy targets. The adequacy cost study will be based on the Maryland College and Career Ready Standards (MCCRS) adopted by the State Board of Education and include two years of results from new State assessments aligned with the standards, which are scheduled to be administered beginning in the 2014-2015 school year. There are several additional components mandated to be included in the study. These components include evaluations of: the impact of school size, the Supplemental Grants program, the use of Free and Reduced Price Meal eligibility as the proxy for identifying economic disadvantage, the federal Community Eligibility Program in Maryland, prekindergarten services and funding, the current wealth calculation, and the impact of increasing and decreasing enrollments on local school systems. The study must also include an update of the Maryland Geographic Cost of Education Index.
10
Relevant financial policies Primary funding is provided by the State of Maryland and Harford County Government. The budget is approved by the Board of Education and the Harford County Council in accordance with State laws. The Board has no authority to levy and collect taxes or increase the budget. Formal budgetary integration, including encumbrance accounting, is employed as a management control device during the year for the governmental fund types. Management is authorized to transfer funds within major categories of expenditure, as defined by statute. Transfers between categories of expenditures and supplemental appropriations during the fiscal year require approval of the Board of Education, Harford County Executive, and Harford County Council. By statute, in order to receive any increase in State basic school aid, each county must appropriate an amount equal to, or greater than, the prior year per pupil appropriation. Referred to as the ‘maintenance of effort’ calculation, it provides that if there is no enrollment growth, county funding will remain the same as that of the prior year in terms of total dollars. Counties often appropriate in excess of the minimum amount stipulated in the law. Capital projects are funded by Harford County Government and the State of Maryland. The Board of Education has no authority to issue general obligation debt. Funds are budgeted and appropriated on both a project and annual basis. Capital project funds do not lapse at the end of each year and may be expended until completion of the project. Budget transfers between projects require the approval of the Board of Education, Harford County Executive, and the Harford County Council. Awards and Acknowledgements
The Government Finance Officers Association of the United States and Canada (GFOA) awarded a Certificate of Achievement for Excellence in Financial Reporting to Harford County Public Schools for its comprehensive annual financial report for the fiscal year ended June 30, 2014. This was the tenth consecutive year that the school system has achieved this prestigious award. In order to be awarded a Certificate of Achievement, a school system must publish an easily readable and efficiently organized comprehensive annual financial report. This report must satisfy both accounting principles generally accepted in the United States of America and applicable legal requirements. A Certificate of Achievement is valid for a period of one year only. We believe our current comprehensive annual financial report continues to meet the Certificate of Achievement Program’s requirements and we are submitting it to the GFOA to determine its eligibility for another certificate. In addition, HCPS also received the GFOA’s Distinguished Budget Presentation Award for its annual budget document for the Year Beginning July 1, 2014. In order to qualify for the Distinguished Budget Presentation Award, the budget document was judged to be proficient in several categories, including as a policy document, a financial plan, an operations guide, and a communications device.
11
The preparation of this report would not have been possible without the services of the entire staff of the Finance Department under the direction of John G. Staab, CPA, Director of Finance, and the Office of Internal Audit under the direction of Jennifer A. Birkelien, CPA, Internal Auditor, and SB & Company, LLC. Many other offices in the system contributed to provide data for this report, including the students whose art work is published throughout the document. Our appreciation is extended to all who assisted in the timely closing of the school system’s financial records and in the preparation of this report. Credit must also be given to the Superintendent and Board of Education for their unfailing support for maintaining the highest standards of professionalism in the management of HCPS’ finances. Sincerely,
Barbara P. Canavan John G. Staab, CPA Superintendent Acting Assistant Superintendent/
Finance Director JGS/MJP
Maria Guadagno, Grade 11, C. Milton Wright High School
Teacher: Jana Thomas
12

13

Financial Section
Samantha Graziano, Grade 12, C. Milton Wright High School
Teacher: Carol Dunaway
14
200 International Circle • Suite 5500 • Hunt Valley • Maryland 21030 • P 410.584.0060 • F 410.584.0061
Report of Independent Public Accountants
Members of the Board of Education of Harford County Bel Air, Maryland Report on the Financial Statements We have audited the accompanying financial statements of the governmental activities, each major fund, and the aggregate remaining fund information of Harford County Public Schools (HCPS), a component unit of Harford County, Maryland as of and for the year ended June 30, 2015, and the related notes to the financial statements, which collectively comprise HCPS’ basic financial statements as listed in the table of contents. Management’s Responsibility for the Financial Statements HCPS’ management is responsible for the preparation and fair presentation of these financial statements in accordance with accounting principles generally accepted in the United States of America; this includes the design, implementation, and maintenance of internal control relevant to the preparation and fair presentation of financial statements that are free from material misstatement, whether due to fraud or error. Auditor’s Responsibility Our responsibility is to express an opinion on these financial statements based on our audit. We conducted our audit in accordance with auditing standards generally accepted in the United States of America and the standards applicable to financial audits contained in Government Auditing Standards, issued by the Comptroller General of the United States. Those standards require that we plan and perform the audit to obtain reasonable assurance about whether the financial statements are free from material misstatement. An audit involves performing procedures to obtain audit evidence about the amounts and disclosures in the financial statements. The procedures selected depend on the auditor’s judgment, including the assessment of the risks of material misstatement of the financial statements, whether due to fraud or error. In making those risk assessments, the auditor considers internal control relevant to the entity’s preparation and fair presentation of the financial statements in order to design audit procedures that are appropriate in the circumstances, but not for the purpose of expressing an opinion on the effectiveness of the entity’s internal control. Accordingly, we express no such opinion. An audit also includes evaluating the appropriateness of accounting policies used and the reasonableness of significant accounting estimates made by management, as well as evaluating the overall presentation of the financial statements. We believe that the audit evidence we have obtained is sufficient and appropriate to provide a basis for our audit opinions.
15
2
Opinions In our opinion, the financial statements referred to above present fairly, in all material respects, the respective financial position of the governmental activities, each major fund, and the aggregate remaining fund information of Harford County Public Schools, as of June 30, 2015, and the respective changes in financial position, where applicable, cash flows thereof, and statement of revenues, expenditures and changes in fund balances – budget (non-GAAP basis) and actual – general fund for the year then ended in accordance with accounting principles generally accepted in the United States of America. Other Matters Adoption of New Accounting Standards As discussed in Note 11 to the financial statements, in 2015, HCPS adopted the new accounting guidance from GASB statements No. 68, “Accounting and Financial Reporting for Pensions” and No.71, “Pension Transition for Contributions Made Subsequent to the Measurement Date”. Our opinions are not modified with respect to this matter. Required Supplementary Information Accounting principles generally accepted in the United States of America require that the management’s discussion and analysis and schedules of funding progress, proportionate share of net pension liability, and contributions, as listed in the accompanying table of contents, be presented to supplement the basic financial statements. Such information, although not a part of the basic financial statements, is required by the Governmental Accounting Standards Board who considers it to be an essential part of financial reporting for placing the basic financial statements in an appropriate operational, economic, or historical context. We have applied certain limited procedures to the required supplementary information in accordance with auditing standards generally accepted in the United States of America, which consisted of inquiries of management about the methods of preparing the information and comparing the information for consistency with management’s responses to our inquiries, the basic financial statements, and other knowledge we obtained during our audit of the basic financial statements. We do not express an opinion or provide any assurance on the information because the limited procedures do not provide us with sufficient evidence to express an opinion or provide any assurance. Other Supplementary Information Our audit was conducted for the purpose of forming opinions on the financial statements that collectively comprise HCPS’ basic financial statements. The accompanying food service fund schedule of revenues, expenditures and changes in fund balance compared to budget, school construction fund schedule of expenditures by project, school funds (agency funds) combining statement of increases, decreases, and fund balances, combining statement of fiduciary net position – agency funds and combining statement of changes in assets and liabilities – agency funds (collectively, the Supplemental Information) are presented for purposes of additional analysis and are not a required part of the basic financial statements.
16
3
The accompanying Supplemental Information is the responsibility of management and was derived from and relates directly to the underlying accounting and other records used to prepare the basic financial statements. Such information has been subjected to the auditing procedures applied in the audit of the basic financial statements and certain additional procedures, including comparing and reconciling such information directly to the underlying accounting and other records used to prepare the basic financial statements or to the basic financial statements themselves, and other additional procedures in accordance with auditing standards generally accepted in the United States of America. In our opinion, the Supplemental Information is fairly stated, in all material respects, in relation to the basic financial statements as a whole. Other Information The introductory and statistical sections as listed in the accompanying table of contents have not been subjected to the auditing procedures applied in the audit of the basic financial statements, and accordingly, we do not express an opinion or provide any assurance on it. Other Reporting Required by Government Auditing Standards In accordance with Government Auditing Standards, we have also issued our report dated September 17, 2015 on our consideration of HCPS’ internal control over financial reporting and on our tests of its compliance with certain provisions of laws, regulations, contracts, and grant agreements and other matters. The purpose of that report is to describe the scope of our testing of internal control over financial reporting and compliance and the results of that testing, and not to provide an opinion on internal control over financial reporting or on compliance. That report is an integral part of an audit performed in accordance with Government Auditing Standards in considering HCPS’ internal control over financial reporting and compliance. Hunt Valley, Maryland September 17, 2015
17
Harford County Public Schools
Management's Discussion and Analysis (MD&A)
June 30, 2015 As Management of the Harford County Public Schools (HCPS), we offer readers of the HCPS financial statements this narrative overview and analysis of the financial activities of HCPS for the fiscal year ended June 30, 2015. We encourage readers to consider the information presented here in conjunction with additional information that we have furnished in our letter of transmittal, which can be found on pages 8-12 of this report. Management's Discussion and Analysis (MD&A) is an element of the reporting model adopted by the Governmental Accounting Standards Board (GASB) in their Statement No. 34 Basic Financial Statements - and Management's Discussion and Analysis - for State and Local Governments issued June 1999. Certain comparative information between the current and prior fiscal years is required to be presented in the MD&A. The goal of MD&A is for the HCPS’ financial managers to present an objective and easily readable analysis of its financial activities based on currently known facts, decisions, or conditions. Financial Highlights
The assets for Harford County Public Schools exceeded its liabilities at the close of the most recent fiscal year by $349.3 million. Net Position as of June 30, 2014 was $365.5 million and decreased by $16.2 million for the year ended June 30, 2015.
Net Position as of June 30, 2014 was restated by $20.2 million as a result of HCPS’
adoption of GASB No. 68, accounting for pensions.
The HCPS total liabilities increased by $29.3 million during the current fiscal year. The key factor in this change was the increase of $29.2 million in the noncurrent liabilities consisting primarily of an increase of $32.0 million in Other Post-Employment Benefits (OPEB) Obligation.
The final Unrestricted General Fund budget increased by $2,436,566 (or 0.6%) during the
year from the originally adopted budget.
The General Fund unrestricted, unassigned fund balance on a budgetary basis increased from $3,281,858 to $6,999,944, an increase of $3,718,086 (or 113.3%). Maintaining an unassigned fund balance was a strategic decision to prepare for additional funding reductions or unexpected expenditures.
The unrestricted General Fund actual revenues were less than the final budget by $194,070
(or 0.05%), and expenditures were $8,662,156, (or 2.02%), under the final budget. Overview of the Financial Statements This discussion and analysis is intended to serve as an introduction to the Harford County Public Schools basic financial statements.
18
Harford County Public Schools
Management's Discussion and Analysis (MD&A)
June 30, 2015 Basic Financial Statements
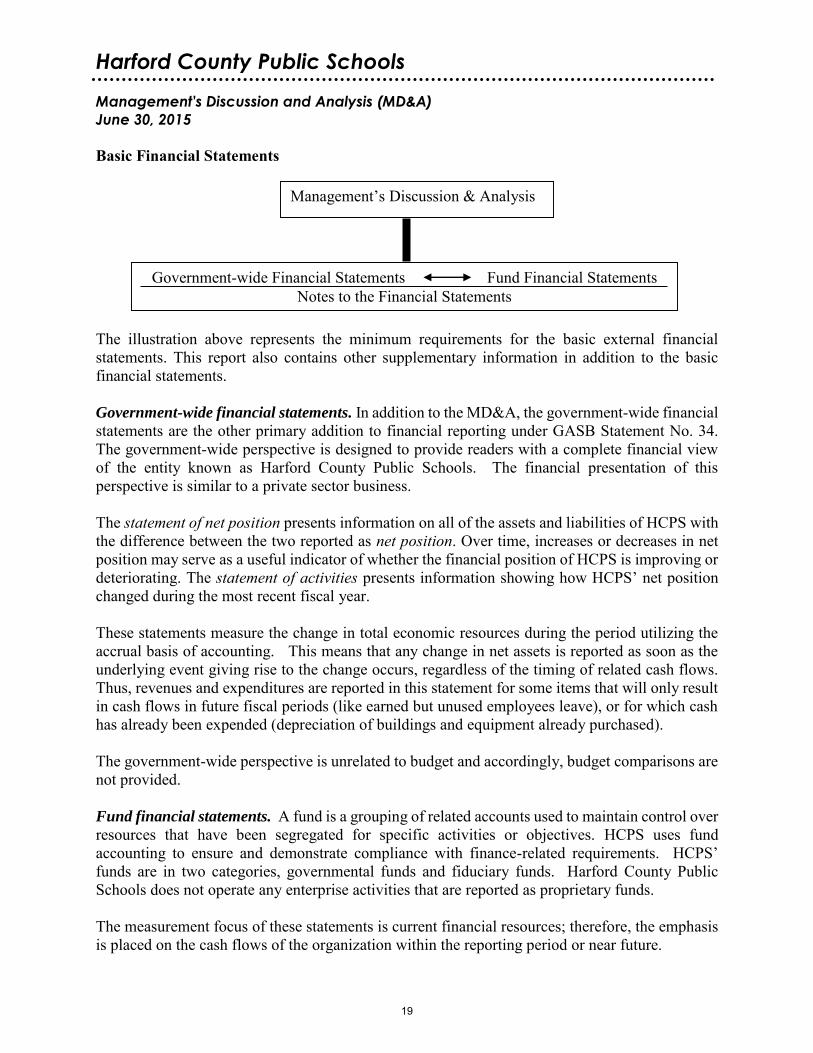
The illustration above represents the minimum requirements for the basic external financial statements. This report also contains other supplementary information in addition to the basic financial statements. Government-wide financial statements. In addition to the MD&A, the government-wide financial statements are the other primary addition to financial reporting under GASB Statement No. 34. The government-wide perspective is designed to provide readers with a complete financial view of the entity known as Harford County Public Schools. The financial presentation of this perspective is similar to a private sector business. The statement of net position presents information on all of the assets and liabilities of HCPS with the difference between the two reported as net position. Over time, increases or decreases in net position may serve as a useful indicator of whether the financial position of HCPS is improving or deteriorating. The statement of activities presents information showing how HCPS’ net position changed during the most recent fiscal year. These statements measure the change in total economic resources during the period utilizing the accrual basis of accounting. This means that any change in net assets is reported as soon as the underlying event giving rise to the change occurs, regardless of the timing of related cash flows. Thus, revenues and expenditures are reported in this statement for some items that will only result in cash flows in future fiscal periods (like earned but unused employees leave), or for which cash has already been expended (depreciation of buildings and equipment already purchased). The government-wide perspective is unrelated to budget and accordingly, budget comparisons are not provided. Fund financial statements. A fund is a grouping of related accounts used to maintain control over resources that have been segregated for specific activities or objectives. HCPS uses fund accounting to ensure and demonstrate compliance with finance-related requirements. HCPS’ funds are in two categories, governmental funds and fiduciary funds. Harford County Public Schools does not operate any enterprise activities that are reported as proprietary funds. The measurement focus of these statements is current financial resources; therefore, the emphasis is placed on the cash flows of the organization within the reporting period or near future.
Management’s Discussion & Analysis
Government-wide Financial Statements Fund Financial Statements Notes to the Financial Statements
19

Harford County Public Schools
Management's Discussion and Analysis (MD&A)
June 30, 2015 Accordingly, the modified accrual basis of accounting that measures these cash flows is used. In the case of Harford County Public Schools, open encumbrances are excluded from expenditures and the State of Maryland's contribution to the teachers’ retirement system is added to revenue and expenditures. Fund financial statements are also unrelated to budget and accordingly, budget comparisons are not provided in the presentation. Budgetary presentation of individual fund financial information utilizing the current financial resources measurement focus and the budgetary basis of accounting are presented as part of the fund financial statements as well. In these statements, available cash flows of HCPS itself are measured as well as the commitment to acquire goods or services with that cash. Open encumbrances at year-end are included in the expenditures. This is the legal basis upon which the budget is adopted so budget comparisons are provided. GASB Statement Number 34 requires that we present the original adopted budget as well as the final budget and discuss the changes between them.
Government-wide Statements
Fund Statements Budgetary Fund Statements
Measurement Focus Economic Resources Current Financial Resources
Current Financial Resources
Basis of Accounting Accrual Modified Accrual Cash and Commitments
Budget No No Yes The table above presents the differences in the presentation of the basic financial statements. Fiduciary responsibility – Retiree Health Plan Trust, Scholarship, and School Activity Funds (Exhibits 8 and 9). HCPS is the trustee, or fiduciary, for its retiree health plan trust, scholarship, and school activity funds. These funds are reported as separate agency and trust funds. We exclude these activities from Harford County Public Schools' other financial statements because the assets cannot be used to finance HCPS’ activities. We are responsible for ensuring that the assets reported in these funds are used for their intended purposes. Notes to the financial statements. The notes provide additional information that is essential to a full understanding of the data provided in the government-wide and fund financial statements. Other information. In addition to the basic financial statements and accompanying notes, this report also presents certain supplementary information immediately following the notes to the financial statements.
20
Harford County Public Schools
Management's Discussion and Analysis (MD&A)
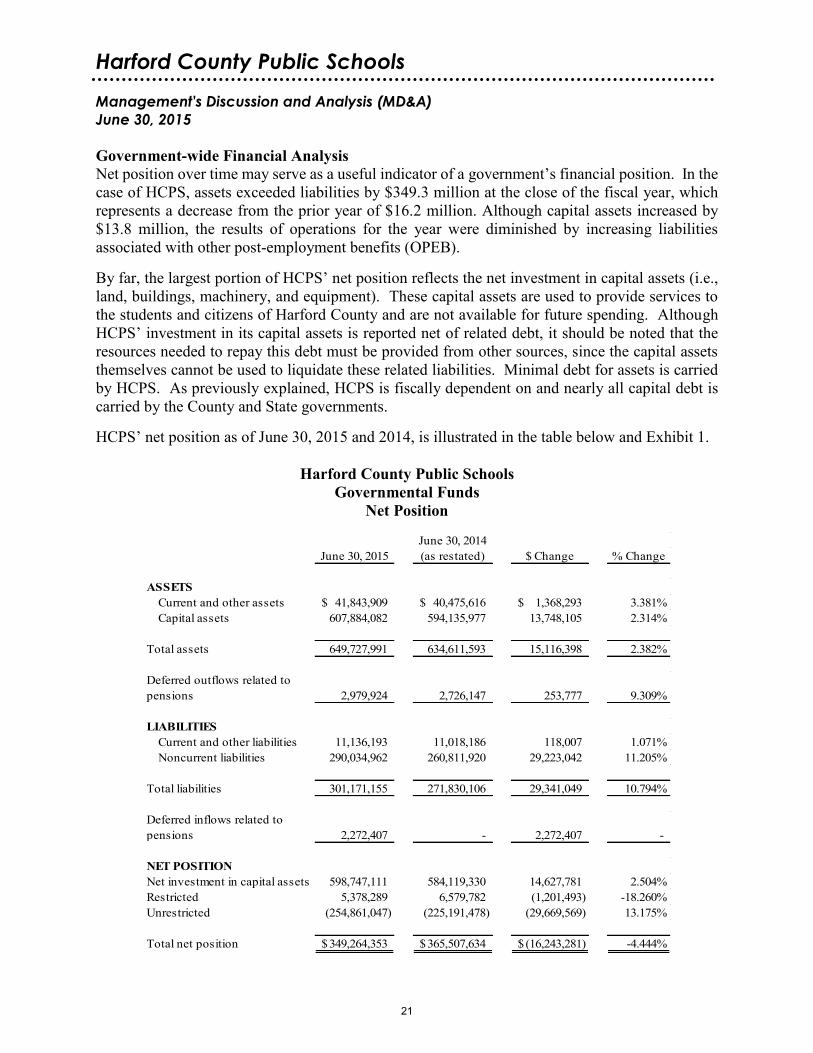
June 30, 2015 Government-wide Financial Analysis Net position over time may serve as a useful indicator of a government’s financial position. In the case of HCPS, assets exceeded liabilities by $349.3 million at the close of the fiscal year, which represents a decrease from the prior year of $16.2 million. Although capital assets increased by $13.8 million, the results of operations for the year were diminished by increasing liabilities associated with other post-employment benefits (OPEB). By far, the largest portion of HCPS’ net position reflects the net investment in capital assets (i.e., land, buildings, machinery, and equipment). These capital assets are used to provide services to the students and citizens of Harford County and are not available for future spending. Although HCPS’ investment in its capital assets is reported net of related debt, it should be noted that the resources needed to repay this debt must be provided from other sources, since the capital assets themselves cannot be used to liquidate these related liabilities. Minimal debt for assets is carried by HCPS. As previously explained, HCPS is fiscally dependent on and nearly all capital debt is carried by the County and State governments. HCPS’ net position as of June 30, 2015 and 2014, is illustrated in the table below and Exhibit 1.
Harford County Public Schools Governmental Funds
Net Position
June 30, 2014June 30, 2015 (as restated) $ Change % Change
ASSETSCurrent and other assets 41,843,909$ 40,475,616$ 1,368,293$ 3.381%Capital assets 607,884,082 594,135,977 13,748,105 2.314%
Total assets 649,727,991 634,611,593 15,116,398 2.382%
Deferred outflows related to pensions 2,979,924 2,726,147 253,777 9.309%
LIABILITIESCurrent and other liabilities 11,136,193 11,018,186 118,007 1.071%Noncurrent liabilities 290,034,962 260,811,920 29,223,042 11.205%
Total liabilities 301,171,155 271,830,106 29,341,049 10.794%
Deferred inflows related to pensions 2,272,407 - 2,272,407 -
NET POSITIONNet investment in capital assets 598,747,111 584,119,330 14,627,781 2.504%Restricted 5,378,289 6,579,782 (1,201,493) -18.260%Unrestricted (254,861,047) (225,191,478) (29,669,569) 13.175%
Total net position 349,264,353$ 365,507,634$ (16,243,281)$ -4.444%
21
Harford County Public Schools
Management's Discussion and Analysis (MD&A)
June 30, 2015 The unrestricted deficit as of June 30, 2015 of $254.9 million is the result of reducing the fund balance from the General Fund (Exhibit 3) of $23.8 million by the compensated absences long-term liabilities of $26.0 million, other post-employment benefits obligation of $231.9 million and net pension liability of $20.8 million. HCPS is committed by employee agreements to pay employees at retirement twenty-five percent (25%) of their earned but unused sick leave. For administrators, the limit is 300 days, all others are up to 200 days, plus any earned and unused vacation. The long-term portion is the amount we expect to pay beyond June 30, 2016. A total of $27.7 million exists as of June 30, 2015 with $4.9 million due within one year. The amount attributable to vacation leave is $4.7 million and $23.0 million for sick leave. Historically, this liability was funded on a "pay-as-you-go" basis from available current financial resources. This method is expected to continue. The remaining $9.6 million long-term liability balance represents our obligations under the capital lease for the construction of the administration building.
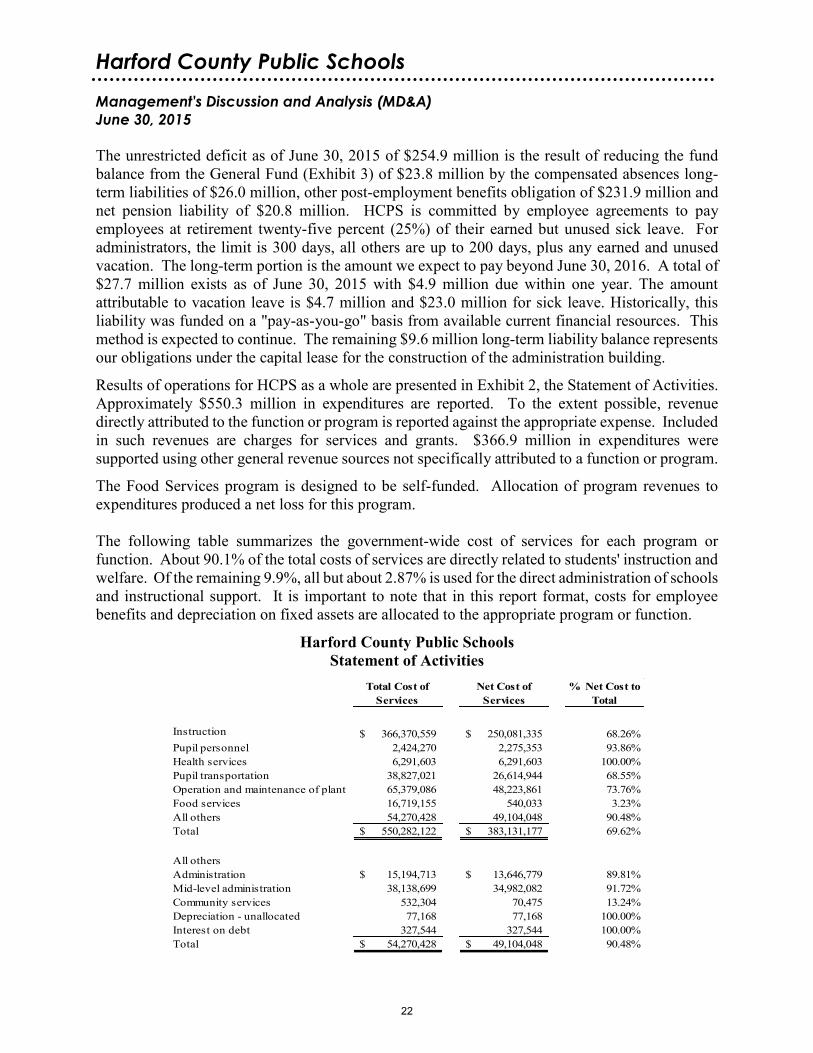
Results of operations for HCPS as a whole are presented in Exhibit 2, the Statement of Activities. Approximately $550.3 million in expenditures are reported. To the extent possible, revenue directly attributed to the function or program is reported against the appropriate expense. Included in such revenues are charges for services and grants. $366.9 million in expenditures were supported using other general revenue sources not specifically attributed to a function or program.
The Food Services program is designed to be self-funded. Allocation of program revenues to expenditures produced a net loss for this program. The following table summarizes the government-wide cost of services for each program or function. About 90.1% of the total costs of services are directly related to students' instruction and welfare. Of the remaining 9.9%, all but about 2.87% is used for the direct administration of schools and instructional support. It is important to note that in this report format, costs for employee benefits and depreciation on fixed assets are allocated to the appropriate program or function.
Harford County Public Schools Statement of Activities
Total Cost of Services
Net Cost of Services
% Net Cost to Total
Instruction 366,370,559$ 250,081,335$ 68.26%Pupil personnel 2,424,270 2,275,353 93.86%Health services 6,291,603 6,291,603 100.00%Pupil transportation 38,827,021 26,614,944 68.55%Operation and maintenance of plant 65,379,086 48,223,861 73.76%Food services 16,719,155 540,033 3.23%All others 54,270,428 49,104,048 90.48%Total 550,282,122$ 383,131,177$ 69.62%
All othersAdministration 15,194,713$ 13,646,779$ 89.81%Mid-level administration 38,138,699 34,982,082 91.72%Community services 532,304 70,475 13.24%Depreciation - unallocated 77,168 77,168 100.00%Interest on debt 327,544 327,544 100.00%Total 54,270,428$ 49,104,048$ 90.48%
22
Harford County Public Schools
Management's Discussion and Analysis (MD&A)
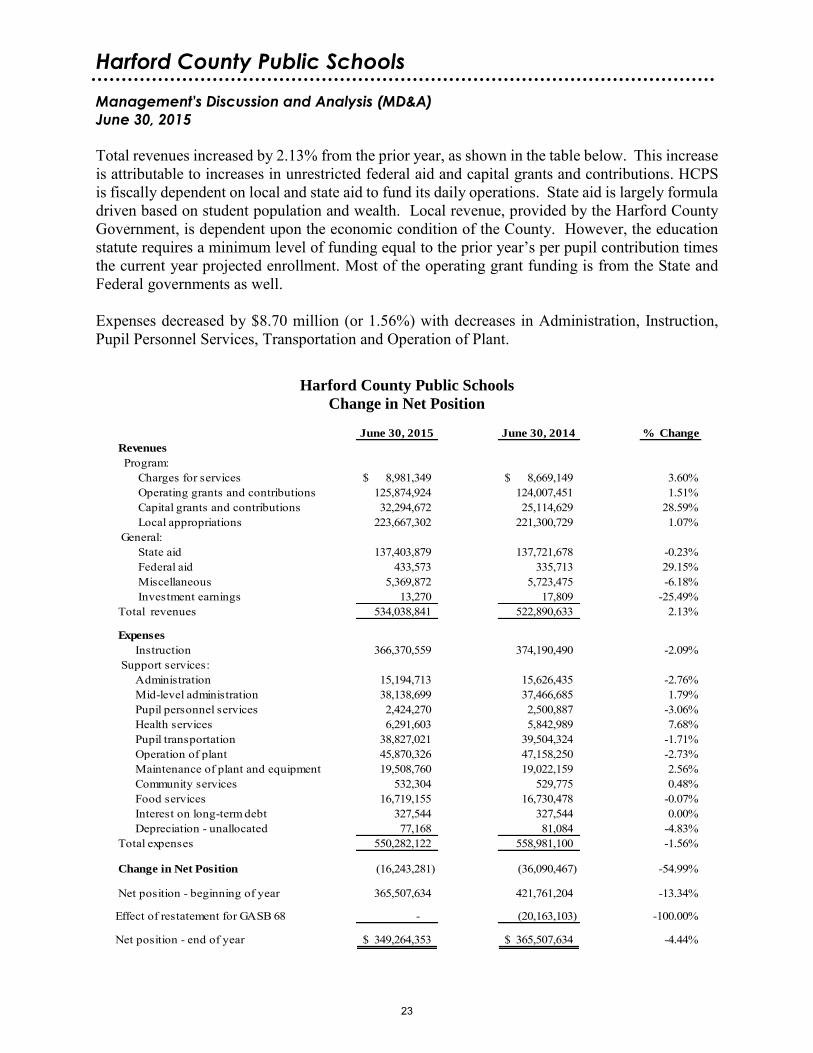
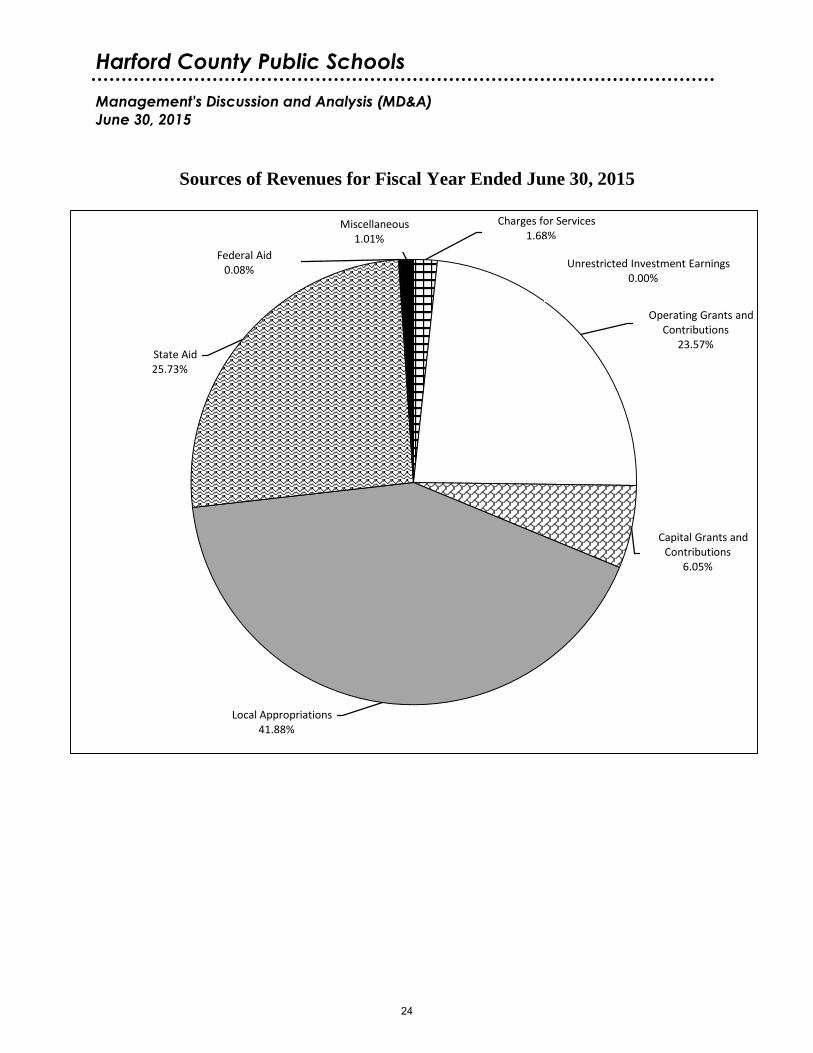
June 30, 2015 Total revenues increased by 2.13% from the prior year, as shown in the table below. This increase is attributable to increases in unrestricted federal aid and capital grants and contributions. HCPS is fiscally dependent on local and state aid to fund its daily operations. State aid is largely formula driven based on student population and wealth. Local revenue, provided by the Harford County Government, is dependent upon the economic condition of the County. However, the education statute requires a minimum level of funding equal to the prior year’s per pupil contribution times the current year projected enrollment. Most of the operating grant funding is from the State and Federal governments as well. Expenses decreased by $8.70 million (or 1.56%) with decreases in Administration, Instruction, Pupil Personnel Services, Transportation and Operation of Plant.
Harford County Public Schools
Change in Net Position
June 30, 2015 June 30, 2014 % Change
Revenues
Program: Charges for services 8,981,349$ 8,669,149$ 3.60% Operating grants and contributions 125,874,924 124,007,451 1.51% Capital grants and contributions 32,294,672 25,114,629 28.59% Local appropriations 223,667,302 221,300,729 1.07%
General: State aid 137,403,879 137,721,678 -0.23% Federal aid 433,573 335,713 29.15% Miscellaneous 5,369,872 5,723,475 -6.18% Investment earnings 13,270 17,809 -25.49%
Total revenues 534,038,841 522,890,633 2.13%
Expenses
Instruction 366,370,559 374,190,490 -2.09% Support services:
Administration 15,194,713 15,626,435 -2.76% Mid-level administration 38,138,699 37,466,685 1.79% Pupil personnel services 2,424,270 2,500,887 -3.06% Health services 6,291,603 5,842,989 7.68% Pupil transportation 38,827,021 39,504,324 -1.71% Operation of plant 45,870,326 47,158,250 -2.73% Maintenance of plant and equipment 19,508,760 19,022,159 2.56% Community services 532,304 529,775 0.48% Food services 16,719,155 16,730,478 -0.07% Interest on long-term debt 327,544 327,544 0.00% Depreciation - unallocated 77,168 81,084 -4.83%
Total expenses 550,282,122 558,981,100 -1.56%
Change in Net Position (16,243,281) (36,090,467) -54.99%
Net position - beginning of year 365,507,634 421,761,204 -13.34%
Effect of restatement for GASB 68 - (20,163,103) -100.00%
Net position - end of year 349,264,353$ 365,507,634$ -4.44%
23
Harford County Public Schools
Management's Discussion and Analysis (MD&A)
June 30, 2015
Sources of Revenues for Fiscal Year Ended June 30, 2015
Charges for Services1.68%
Operating Grants and Contributions
23.57%
Capital Grants and Contributions
6.05%
Local Appropriations 41.88%
State Aid 25.73%
Federal Aid 0.08%
Miscellaneous 1.01%
Unrestricted Investment Earnings 0.00%
24
Harford County Public Schools
Management's Discussion and Analysis (MD&A)
June 30, 2015
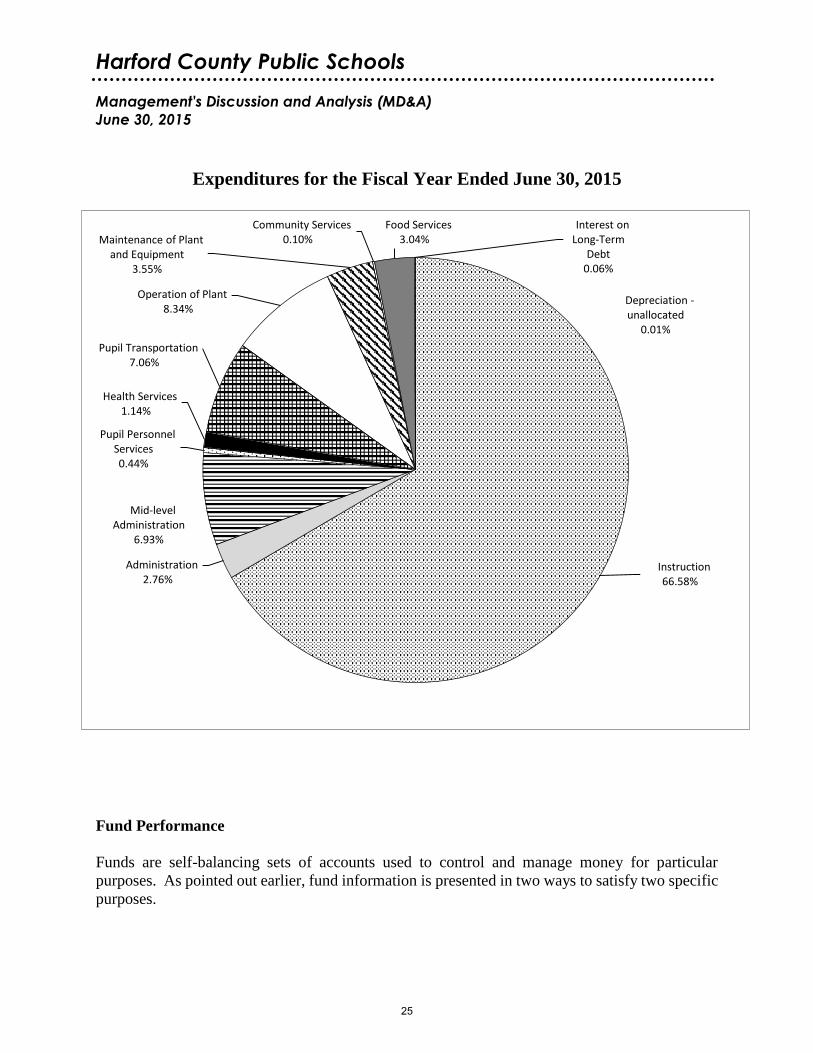
Expenditures for the Fiscal Year Ended June 30, 2015
Fund Performance
Funds are self-balancing sets of accounts used to control and manage money for particular
purposes. As pointed out earlier, fund information is presented in two ways to satisfy two specific
purposes.
Instruction 66.58%
Administration 2.76%
Mid-level Administration
6.93%
Pupil Personnel Services 0.44%
Health Services 1.14%
Pupil Transportation 7.06%
Operation of Plant 8.34%
Maintenance of Plant and Equipment
3.55%
Community Services 0.10%
Food Services 3.04%
Interest on Long-Term
Debt 0.06%
Depreciation -unallocated
0.01%
25
Harford County Public Schools
Management's Discussion and Analysis (MD&A)
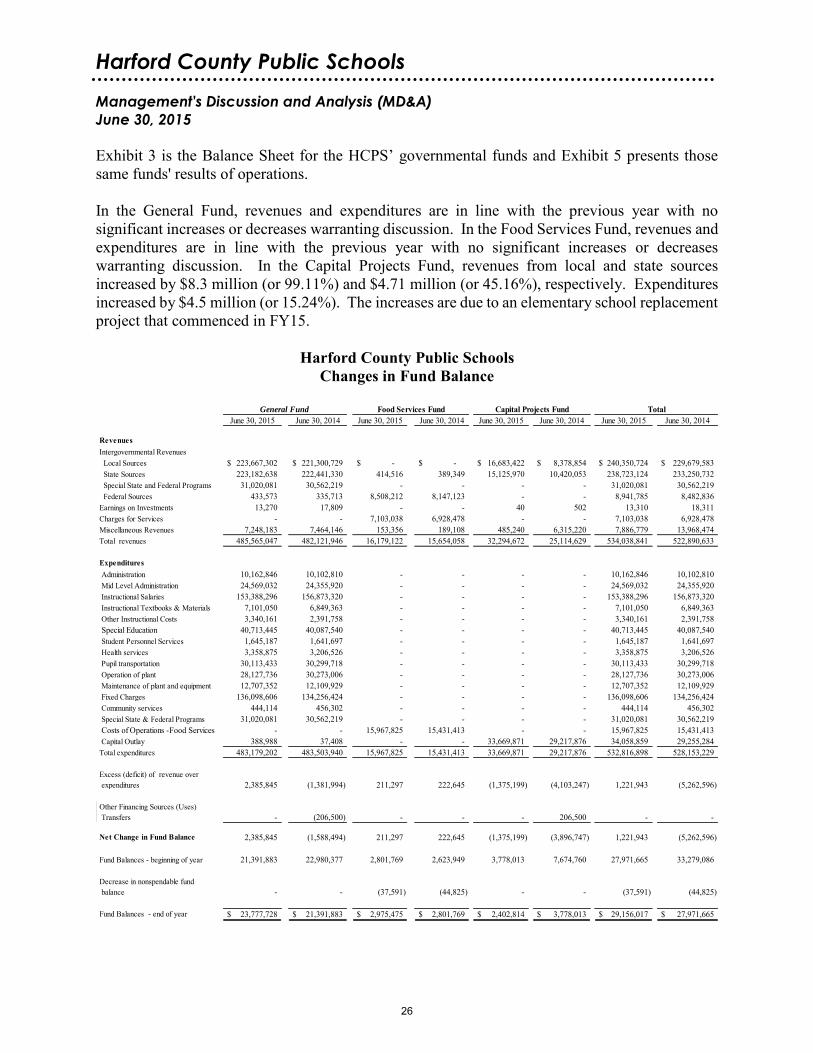
June 30, 2015 Exhibit 3 is the Balance Sheet for the HCPS’ governmental funds and Exhibit 5 presents those same funds' results of operations. In the General Fund, revenues and expenditures are in line with the previous year with no significant increases or decreases warranting discussion. In the Food Services Fund, revenues and expenditures are in line with the previous year with no significant increases or decreases warranting discussion. In the Capital Projects Fund, revenues from local and state sources increased by $8.3 million (or 99.11%) and $4.71 million (or 45.16%), respectively. Expenditures increased by $4.5 million (or 15.24%). The increases are due to an elementary school replacement project that commenced in FY15.
Harford County Public Schools Changes in Fund Balance
June 30, 2015 June 30, 2014 June 30, 2015 June 30, 2014 June 30, 2015 June 30, 2014 June 30, 2015 June 30, 2014
Revenues Intergovernmental Revenues Local Sources 223,667,302$ 221,300,729$ -$ -$ 16,683,422$ 8,378,854$ 240,350,724$ 229,679,583$ State Sources 223,182,638 222,441,330 414,516 389,349 15,125,970 10,420,053 238,723,124 233,250,732 Special State and Federal Programs 31,020,081 30,562,219 - - - - 31,020,081 30,562,219 Federal Sources 433,573 335,713 8,508,212 8,147,123 - - 8,941,785 8,482,836 Earnings on Investments 13,270 17,809 - - 40 502 13,310 18,311 Charges for Services - - 7,103,038 6,928,478 - - 7,103,038 6,928,478 Miscellaneous Revenues 7,248,183 7,464,146 153,356 189,108 485,240 6,315,220 7,886,779 13,968,474 Total revenues 485,565,047 482,121,946 16,179,122 15,654,058 32,294,672 25,114,629 534,038,841 522,890,633
Expenditures Administration 10,162,846 10,102,810 - - - - 10,162,846 10,102,810 Mid Level Administration 24,569,032 24,355,920 - - - - 24,569,032 24,355,920 Instructional Salaries 153,388,296 156,873,320 - - - - 153,388,296 156,873,320 Instructional Textbooks & Materials 7,101,050 6,849,363 - - - - 7,101,050 6,849,363 Other Instructional Costs 3,340,161 2,391,758 - - - - 3,340,161 2,391,758 Special Education 40,713,445 40,087,540 - - - - 40,713,445 40,087,540 Student Personnel Services 1,645,187 1,641,697 - - - - 1,645,187 1,641,697 Health services 3,358,875 3,206,526 - - - - 3,358,875 3,206,526 Pupil transportation 30,113,433 30,299,718 - - - - 30,113,433 30,299,718 Operation of plant 28,127,736 30,273,006 - - - - 28,127,736 30,273,006 Maintenance of plant and equipment 12,707,352 12,109,929 - - - - 12,707,352 12,109,929 Fixed Charges 136,098,606 134,256,424 - - - - 136,098,606 134,256,424 Community services 444,114 456,302 - - - - 444,114 456,302 Special State & Federal Programs 31,020,081 30,562,219 - - - - 31,020,081 30,562,219 Costs of Operations -Food Services - - 15,967,825 15,431,413 - - 15,967,825 15,431,413 Capital Outlay 388,988 37,408 - - 33,669,871 29,217,876 34,058,859 29,255,284 Total expenditures 483,179,202 483,503,940 15,967,825 15,431,413 33,669,871 29,217,876 532,816,898 528,153,229
Excess (deficit) of revenue over expenditures 2,385,845 (1,381,994) 211,297 222,645 (1,375,199) (4,103,247) 1,221,943 (5,262,596)
Other Financing Sources (Uses) Transfers - (206,500) - - - 206,500 - -
Net Change in Fund Balance 2,385,845 (1,588,494) 211,297 222,645 (1,375,199) (3,896,747) 1,221,943 (5,262,596)
Fund Balances - beginning of year 21,391,883 22,980,377 2,801,769 2,623,949 3,778,013 7,674,760 27,971,665 33,279,086
Decrease in nonspendable fund balance - - (37,591) (44,825) - - (37,591) (44,825)
Fund Balances - end of year 23,777,728$ 21,391,883$ 2,975,475$ 2,801,769$ 2,402,814$ 3,778,013$ 29,156,017$ 27,971,665$
General Fund Food Services Fund Capital Projects Fund Total
26
Harford County Public Schools
Management's Discussion and Analysis (MD&A)
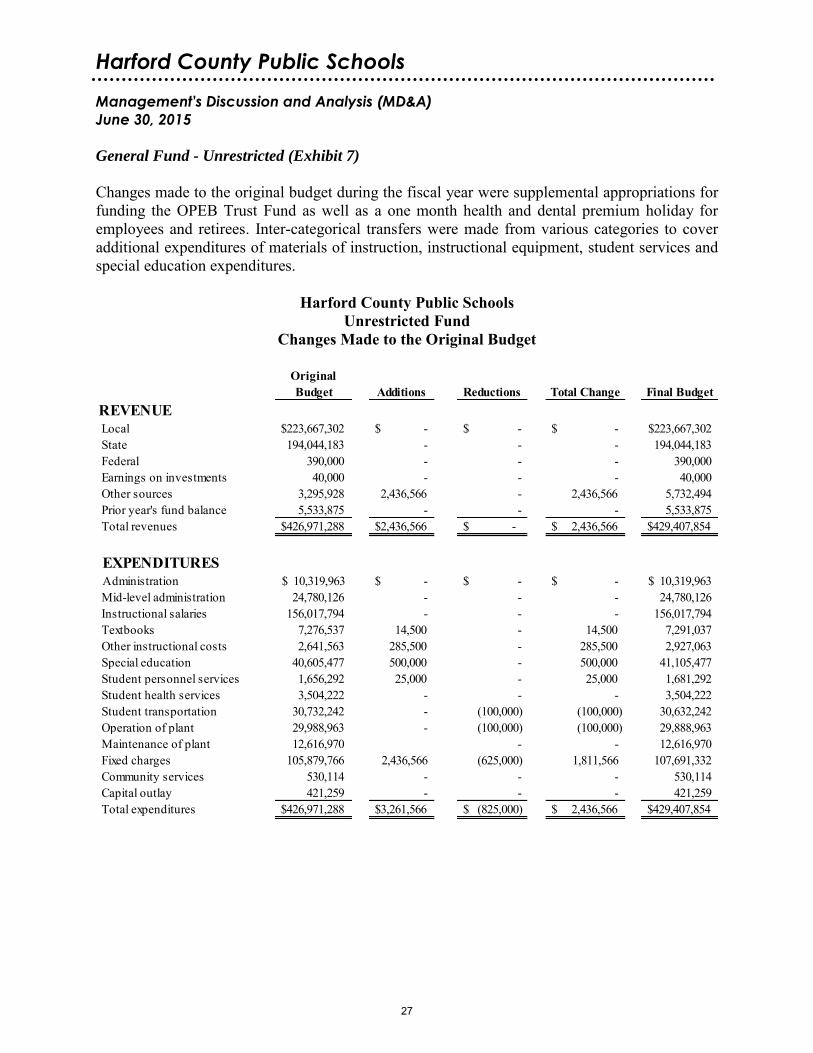
June 30, 2015 General Fund - Unrestricted (Exhibit 7)
Changes made to the original budget during the fiscal year were supplemental appropriations for funding the OPEB Trust Fund as well as a one month health and dental premium holiday for employees and retirees. Inter-categorical transfers were made from various categories to cover additional expenditures of materials of instruction, instructional equipment, student services and special education expenditures.
Harford County Public Schools Unrestricted Fund
Changes Made to the Original Budget
Original Budget Additions Reductions Total Change Final Budget
REVENUE Local $223,667,302 $ - $ - $ - 223,667,302$ State 194,044,183 - - - 194,044,183 Federal 390,000 - - - 390,000 Earnings on investments 40,000 - - - 40,000 Other sources 3,295,928 2,436,566 - 2,436,566 5,732,494 Prior year's fund balance 5,533,875 - - - 5,533,875 Total revenues $426,971,288 $2,436,566 $ - $ 2,436,566 $429,407,854
EXPENDITURES Administration 10,319,963$ $ - $ - $ - 10,319,963$
Mid-level administration 24,780,126 - - - 24,780,126 Instructional salaries 156,017,794 - - - 156,017,794 Textbooks 7,276,537 14,500 - 14,500 7,291,037 Other instructional costs 2,641,563 285,500 - 285,500 2,927,063 Special education 40,605,477 500,000 - 500,000 41,105,477 Student personnel services 1,656,292 25,000 - 25,000 1,681,292 Student health services 3,504,222 - - - 3,504,222 Student transportation 30,732,242 - (100,000) (100,000) 30,632,242 Operation of plant 29,988,963 - (100,000) (100,000) 29,888,963 Maintenance of plant 12,616,970 - - 12,616,970 Fixed charges 105,879,766 2,436,566 (625,000) 1,811,566 107,691,332 Community services 530,114 - - - 530,114 Capital outlay 421,259 - - - 421,259 Total expenditures $426,971,288 $3,261,566 $ (825,000) $ 2,436,566 $429,407,854
27
Harford County Public Schools
Management's Discussion and Analysis (MD&A)
June 30, 2015 It is critical for the reader to understand that local and state revenues account for 92.03% of the total General Fund unrestricted revenue. In the past, both had been stable and highly predictable; however, in the most recent few years, state and local revenues have declined with the general condition of the economy. Enrollment reductions have also contributed to the reduction of revenues.
Interest earnings continue to fall well below budget as a result of historic low rates and aggressive cash management by the County in matching our cash demands with their payment schedule to us.
Other revenue includes tuition, facility rental, e-rate rebates, Medicare Part D receipts, dividends from MABE’s insurance programs, and payments from health and dental insurance carriers. Major receipt amounts in the other revenue account are from the following:
Health/Dental Insurance rebates & settlements* $2,767,578 Medicare Part D* 1,197,527
*Part of the Contribution to the OPEB Investment Trust Fund appropriated for FY15
A record number of retirements/separations during the year ending June 30, 2014 contributed to turnover savings of approximately $3.6 million in salary and fixed charges expenditures in FY15.
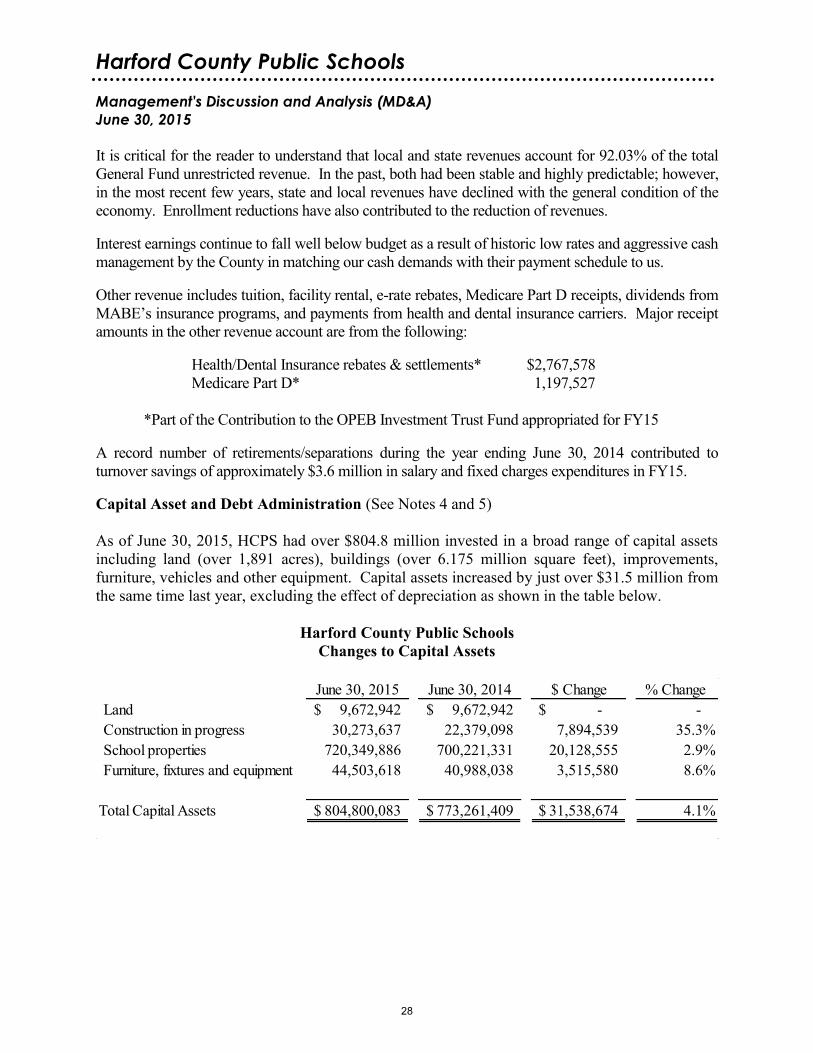
Capital Asset and Debt Administration (See Notes 4 and 5) As of June 30, 2015, HCPS had over $804.8 million invested in a broad range of capital assets including land (over 1,891 acres), buildings (over 6.175 million square feet), improvements, furniture, vehicles and other equipment. Capital assets increased by just over $31.5 million from the same time last year, excluding the effect of depreciation as shown in the table below.
Harford County Public Schools Changes to Capital Assets
June 30, 2015 June 30, 2014 $ Change % Change Land 9,672,942$ 9,672,942$ -$ -Construction in progress 30,273,637 22,379,098 7,894,539 35.3%School properties 720,349,886 700,221,331 20,128,555 2.9%Furniture, fixtures and equipment 44,503,618 40,988,038 3,515,580 8.6%
Total Capital Assets 804,800,083$ 773,261,409$ 31,538,674$ 4.1%
28

Harford County Public Schools
Management's Discussion and Analysis (MD&A)
June 30, 2015 School districts in Maryland are in the uncommon position of owning assets but not the debt associated with those facilities as they are fully fiscally dependent on the State and County governments. Accordingly, HCPS carries no bond rating, but has an approved debt policy for lease transactions. In FY 2012, HCPS refinanced the capital lease for the Administration Building from an interest rate of 4.974% to a lower rate of 3.27%, resulting in a savings of $1,146,908 in the remaining term of the debt, without extending the term of the debt. Current Issues The State of Maryland Bridge to Excellence in Public Schools and the Federal No Child Left Behind Acts established certain requirements for public school systems. These requirements include, but are not limited to: highly qualified teachers and paraprofessionals; expanded school choice options for parents; more frequent testing of students; certification and assessment requirements for paraprofessionals; and extensive data tracking and reporting requirements. Additionally, the State of Maryland has adopted the Common Core State Standards (CCSS) – a set of high quality academic expectations in English/language arts and mathematics that define the knowledge and skills all students should master by the end of each grade level. Along with the CCSS, Maryland fully implemented new assessments, the Partnership for Assessment of Readiness for College and Careers (PARCC), in the 2014-2015 school year. The PARCC assessments replace the former Maryland State Assessments and are computer based, aligned with the CCSS, and allow for tracking of student progress over time. All of these requirements have significant cost impacts. During FY15, HCPS implemented Governmental Accounting Standards Board (GASB) Statement No. 68, Accounting and Financial Reporting for Pension Plans, an amendment of GASB Statement No. 27, which resulted in a net pension liability of $20.8 million, and is reflected on the Statement of Net Position. GASB No. 68 is intended to improve accounting and financial reporting by state and local governments that provide pension benefits. Future Issues The school system must consider a multitude of factors as it prepares future budgets. Notable factors influencing future budgets are:
expected higher costs for state retirement due to the shift of a portion of the pension responsibility from the state to the school system;
increasing numbers of homeless students, those newly immigrated to this country, and growing socioeconomically eligible population require greater services;
the uncertain state of the federal budget affecting funding decisions at the state and local levels;
future capital budgets with funding for renovations and additions to existing schools, including major systemic renovations to many of the older school facilities as well as the construction of new schools;
29
Harford County Public Schools
Management's Discussion and Analysis (MD&A)
June 30, 2015
the need for salary increases in order to be competitive with surrounding school systems in attracting highly qualified employees; and
projected increases in the cost of employee health and dental benefits. The Governmental Accounting Standards Board (GASB) issued Statement No. 45, Accounting and Financial Reporting by Employers for Postemployment Benefits Other Than Pensions that addressed how state and local governments account for and report their costs and obligations related to postemployment healthcare and other non-pension benefits. Collectively, these benefits are commonly referred to as other postemployment benefits, or OPEB. HCPS made several policy changes with respect to benefits provided to retirees and committed to using excess monies in the health insurance rate stabilization account and federal Medicare Part D reimbursement to at least partially fund the OPEB liability. Currently, HCPS is participating in a multi-employer OPEB Investment Trust administered by the Maryland Association of Boards of Education (MABE). We believe this structure is unique in the country. While we have the vehicle to invest OPEB funds, the issue will be whether or not the County will fund OPEB contributions to meet our proposed 30 year timeframe to achieve full funding. The current economic climate has been, and is forecast to continue to be, prohibitive to this objective. Meanwhile the unfunded liability continues to grow. Contacting Harford County Public Schools' Financial Management Our financial report is designed to provide our citizens, taxpayers, parents, and students with a general overview of the HCPS’ finances and to demonstrate its accountability for the money it receives. If you have questions about this report or wish to request additional financial information, contact at John G. Staab, Acting Assistant Superintendent of Business Services/Director of Finance at (410) 588-5237; or by mail at Harford County Public Schools, Business Services, 102 South Hickory Avenue, Bel Air, Maryland 21014.
Amber Gonzalez-Torres, Grade 12, Harford Technical High School
Teacher: Judy Demond
30
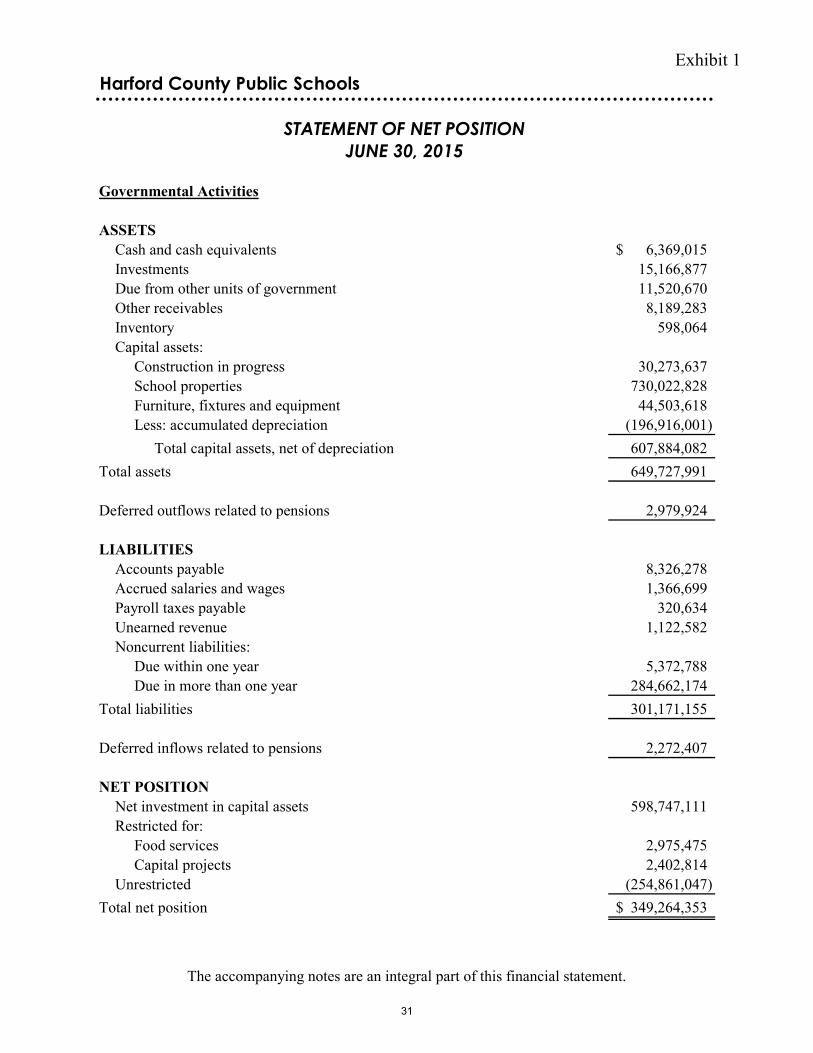
Exhibit 1
Cash and cash equivalents 6,369,015$ Investments 15,166,877 Due from other units of government 11,520,670 Other receivables 8,189,283 Inventory 598,064 Capital assets:
Construction in progress 30,273,637 School properties 730,022,828 Furniture, fixtures and equipment 44,503,618 Less: accumulated depreciation (196,916,001)
Total capital assets, net of depreciation 607,884,082 Total assets 649,727,991
Deferred outflows related to pensions 2,979,924
Accounts payable 8,326,278 Accrued salaries and wages 1,366,699 Payroll taxes payable 320,634 Unearned revenue 1,122,582 Noncurrent liabilities:
Due within one year 5,372,788 Due in more than one year 284,662,174
Total liabilities 301,171,155
Deferred inflows related to pensions 2,272,407
Net investment in capital assets 598,747,111 Restricted for:
Food services 2,975,475 Capital projects 2,402,814
Unrestricted (254,861,047) Total net position 349,264,353$
LIABILITIES
Governmental Activities
NET POSITION
Harford County Public Schools
STATEMENT OF NET POSITION
JUNE 30, 2015
ASSETS
The accompanying notes are an integral part of this financial statement.
31
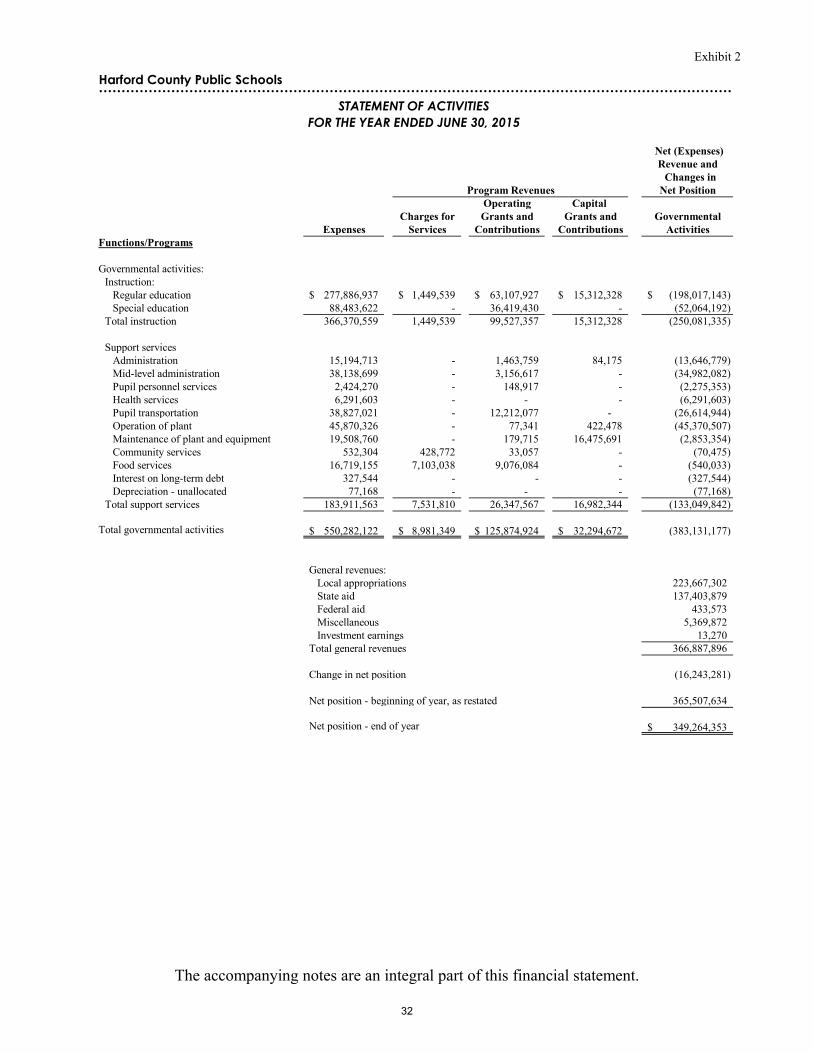
Exhibit 2
Harford County Public Schools
Net (Expenses) Revenue and Changes in Net Position
Operating Capital Charges for Grants and Grants and Governmental
Expenses Services Contributions Contributions ActivitiesFunctions/Programs
Governmental activities:Instruction:
Regular education 277,886,937$ 1,449,539$ 63,107,927$ 15,312,328$ (198,017,143)$ Special education 88,483,622 - 36,419,430 - (52,064,192)
Total instruction 366,370,559 1,449,539 99,527,357 15,312,328 (250,081,335)
Support servicesAdministration 15,194,713 - 1,463,759 84,175 (13,646,779) Mid-level administration 38,138,699 - 3,156,617 - (34,982,082) Pupil personnel services 2,424,270 - 148,917 - (2,275,353) Health services 6,291,603 - - - (6,291,603) Pupil transportation 38,827,021 - 12,212,077 - (26,614,944) Operation of plant 45,870,326 - 77,341 422,478 (45,370,507) Maintenance of plant and equipment 19,508,760 - 179,715 16,475,691 (2,853,354) Community services 532,304 428,772 33,057 - (70,475) Food services 16,719,155 7,103,038 9,076,084 - (540,033) Interest on long-term debt 327,544 - - - (327,544) Depreciation - unallocated 77,168 - - - (77,168)
Total support services 183,911,563 7,531,810 26,347,567 16,982,344 (133,049,842)
Total governmental activities 550,282,122$ 8,981,349$ 125,874,924$ 32,294,672$ (383,131,177)
General revenues: Local appropriations 223,667,302 State aid 137,403,879 Federal aid 433,573 Miscellaneous 5,369,872 Investment earnings 13,270 Total general revenues 366,887,896
Change in net position (16,243,281)
Net position - beginning of year, as restated 365,507,634
Net position - end of year 349,264,353$
Program Revenues
STATEMENT OF ACTIVITIES
FOR THE YEAR ENDED JUNE 30, 2015
The accompanying notes are an integral part of this financial statement.
32
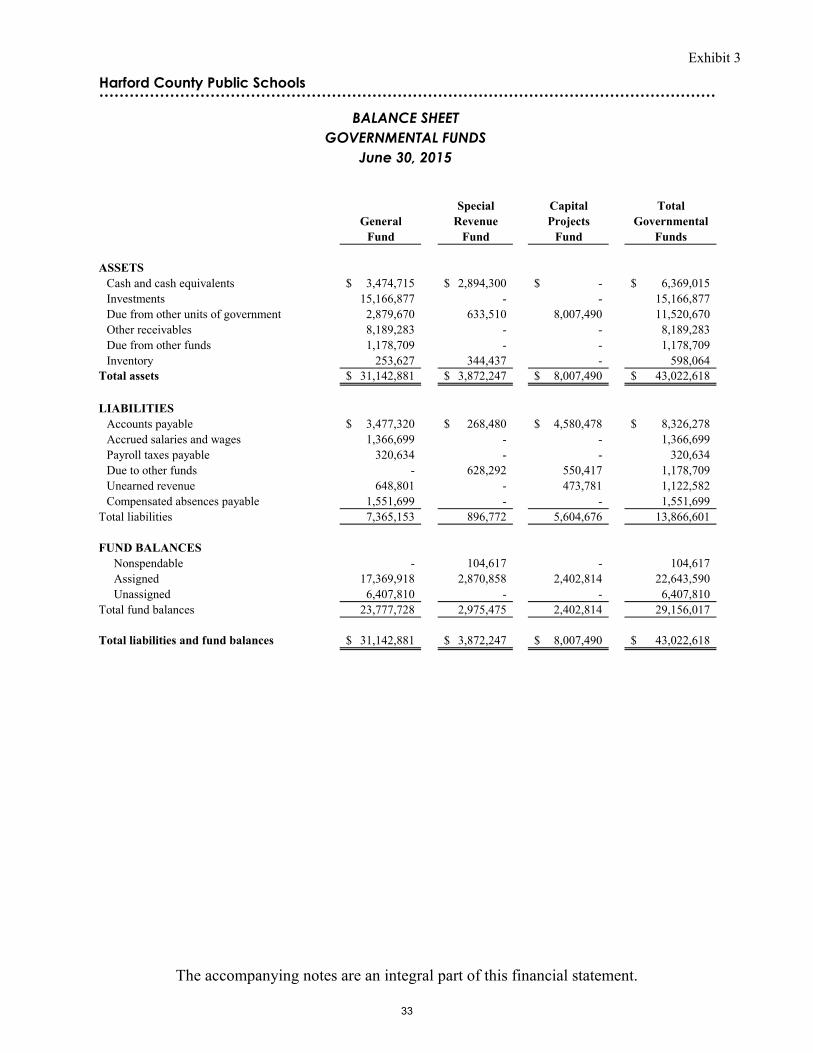
Exhibit 3
Special Capital TotalGeneral Revenue Projects Governmental
Fund Fund Fund Funds
Cash and cash equivalents 3,474,715$ 2,894,300$ -$ 6,369,015$ Investments 15,166,877 - - 15,166,877 Due from other units of government 2,879,670 633,510 8,007,490 11,520,670 Other receivables 8,189,283 - - 8,189,283 Due from other funds 1,178,709 - - 1,178,709 Inventory 253,627 344,437 - 598,064
Total assets 31,142,881$ 3,872,247$ 8,007,490$ 43,022,618$
Accounts payable 3,477,320$ 268,480$ 4,580,478$ 8,326,278$ Accrued salaries and wages 1,366,699 - - 1,366,699 Payroll taxes payable 320,634 - - 320,634 Due to other funds - 628,292 550,417 1,178,709 Unearned revenue 648,801 - 473,781 1,122,582 Compensated absences payable 1,551,699 - - 1,551,699
Total liabilities 7,365,153 896,772 5,604,676 13,866,601
Nonspendable - 104,617 - 104,617 Assigned 17,369,918 2,870,858 2,402,814 22,643,590 Unassigned 6,407,810 - - 6,407,810
Total fund balances 23,777,728 2,975,475 2,402,814 29,156,017
Total liabilities and fund balances 31,142,881$ 3,872,247$ 8,007,490$ 43,022,618$
LIABILITIES
FUND BALANCES
June 30, 2015
Harford County Public Schools
BALANCE SHEET
GOVERNMENTAL FUNDS
ASSETS
The accompanying notes are an integral part of this financial statement.
33
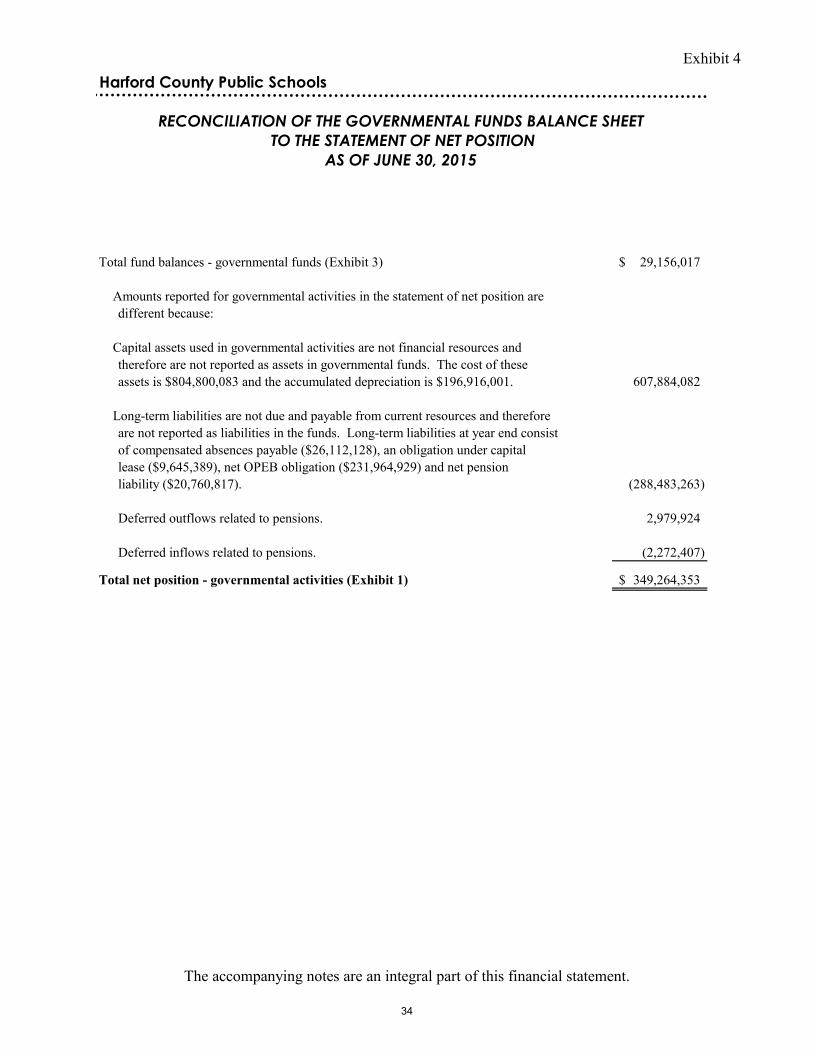
Exhibit 4
Total fund balances - governmental funds (Exhibit 3) 29,156,017$
Amounts reported for governmental activities in the statement of net position aredifferent because:
Capital assets used in governmental activities are not financial resources and therefore are not reported as assets in governmental funds. The cost of theseassets is $804,800,083 and the accumulated depreciation is $196,916,001. 607,884,082
Long-term liabilities are not due and payable from current resources and thereforeare not reported as liabilities in the funds. Long-term liabilities at year end consistof compensated absences payable ($26,112,128), an obligation under capital lease ($9,645,389), net OPEB obligation ($231,964,929) and net pensionliability ($20,760,817). (288,483,263)
Deferred outflows related to pensions. 2,979,924
Deferred inflows related to pensions. (2,272,407)
Total net position - governmental activities (Exhibit 1) 349,264,353$
AS OF JUNE 30, 2015
Harford County Public Schools
RECONCILIATION OF THE GOVERNMENTAL FUNDS BALANCE SHEET
TO THE STATEMENT OF NET POSITION
The accompanying notes are an integral part of this financial statement.
34
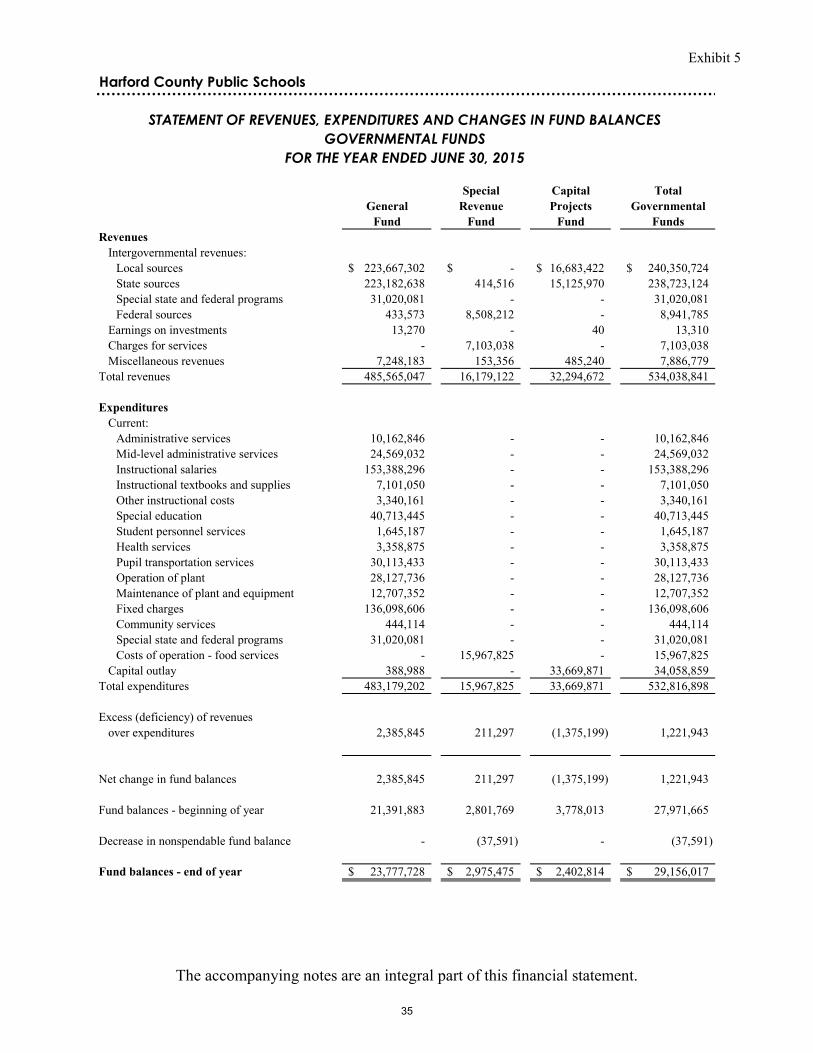
Exhibit 5
Special Capital TotalGeneral Revenue Projects Governmental
Fund Fund Fund FundsRevenues
Intergovernmental revenues:Local sources 223,667,302$ -$ 16,683,422$ 240,350,724$ State sources 223,182,638 414,516 15,125,970 238,723,124 Special state and federal programs 31,020,081 - - 31,020,081 Federal sources 433,573 8,508,212 - 8,941,785
Earnings on investments 13,270 - 40 13,310 Charges for services - 7,103,038 - 7,103,038 Miscellaneous revenues 7,248,183 153,356 485,240 7,886,779
Total revenues 485,565,047 16,179,122 32,294,672 534,038,841
ExpendituresCurrent:
Administrative services 10,162,846 - - 10,162,846 Mid-level administrative services 24,569,032 - - 24,569,032 Instructional salaries 153,388,296 - - 153,388,296 Instructional textbooks and supplies 7,101,050 - - 7,101,050 Other instructional costs 3,340,161 - - 3,340,161 Special education 40,713,445 - - 40,713,445 Student personnel services 1,645,187 - - 1,645,187 Health services 3,358,875 - - 3,358,875 Pupil transportation services 30,113,433 - - 30,113,433 Operation of plant 28,127,736 - - 28,127,736 Maintenance of plant and equipment 12,707,352 - - 12,707,352 Fixed charges 136,098,606 - - 136,098,606 Community services 444,114 - - 444,114 Special state and federal programs 31,020,081 - - 31,020,081 Costs of operation - food services - 15,967,825 - 15,967,825
Capital outlay 388,988 - 33,669,871 34,058,859 Total expenditures 483,179,202 15,967,825 33,669,871 532,816,898
Excess (deficiency) of revenuesover expenditures 2,385,845 211,297 (1,375,199) 1,221,943
Net change in fund balances 2,385,845 211,297 (1,375,199) 1,221,943
Fund balances - beginning of year 21,391,883 2,801,769 3,778,013 27,971,665
Decrease in nonspendable fund balance - (37,591) - (37,591)
Fund balances - end of year 23,777,728$ 2,975,475$ 2,402,814$ 29,156,017$
FOR THE YEAR ENDED JUNE 30, 2015
Harford County Public Schools
STATEMENT OF REVENUES, EXPENDITURES AND CHANGES IN FUND BALANCES
GOVERNMENTAL FUNDS
The accompanying notes are an integral part of this financial statement.
35
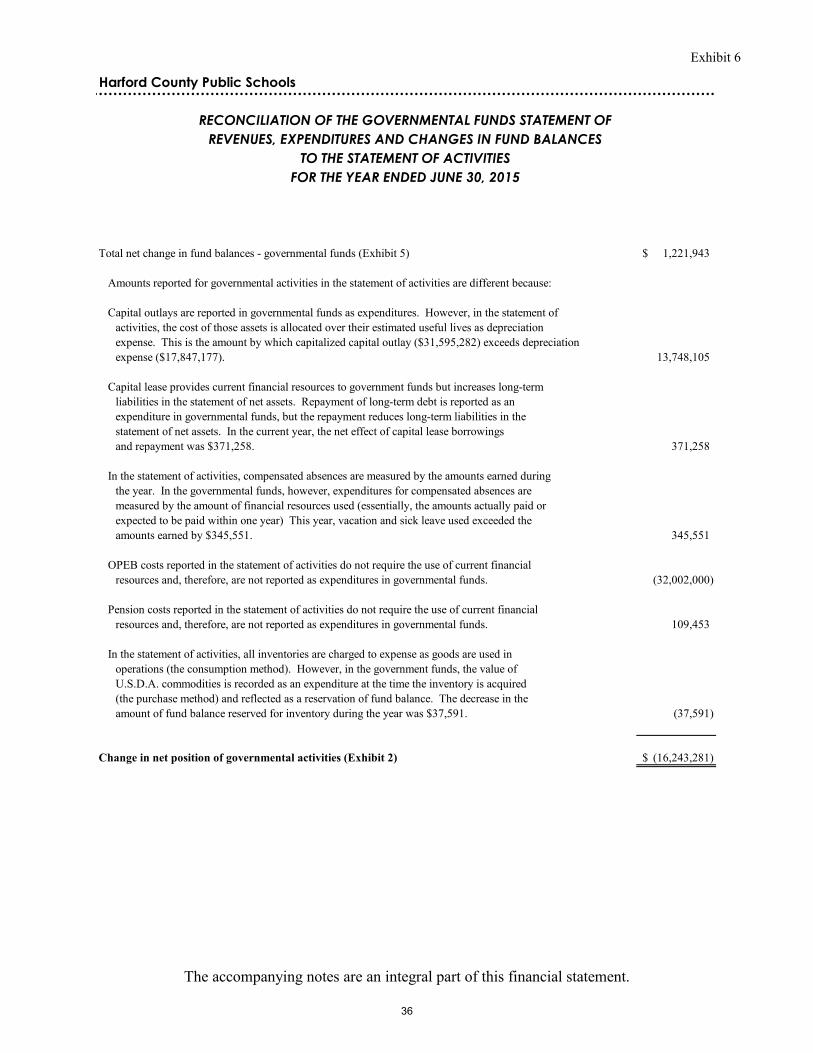
Exhibit 6
Total net change in fund balances - governmental funds (Exhibit 5) 1,221,943$
Amounts reported for governmental activities in the statement of activities are different because:
Capital outlays are reported in governmental funds as expenditures. However, in the statement ofactivities, the cost of those assets is allocated over their estimated useful lives as depreciationexpense. This is the amount by which capitalized capital outlay ($31,595,282) exceeds depreciationexpense ($17,847,177). 13,748,105
Capital lease provides current financial resources to government funds but increases long-term liabilities in the statement of net assets. Repayment of long-term debt is reported as an expenditure in governmental funds, but the repayment reduces long-term liabilities in the statement of net assets. In the current year, the net effect of capital lease borrowingsand repayment was $371,258. 371,258
In the statement of activities, compensated absences are measured by the amounts earned duringthe year. In the governmental funds, however, expenditures for compensated absences aremeasured by the amount of financial resources used (essentially, the amounts actually paid or expected to be paid within one year) This year, vacation and sick leave used exceeded theamounts earned by $345,551. 345,551
OPEB costs reported in the statement of activities do not require the use of current financial resources and, therefore, are not reported as expenditures in governmental funds. (32,002,000)
Pension costs reported in the statement of activities do not require the use of current financial resources and, therefore, are not reported as expenditures in governmental funds. 109,453
In the statement of activities, all inventories are charged to expense as goods are used inoperations (the consumption method). However, in the government funds, the value ofU.S.D.A. commodities is recorded as an expenditure at the time the inventory is acquired(the purchase method) and reflected as a reservation of fund balance. The decrease in theamount of fund balance reserved for inventory during the year was $37,591. (37,591)
Change in net position of governmental activities (Exhibit 2) (16,243,281)$
Harford County Public Schools
FOR THE YEAR ENDED JUNE 30, 2015
RECONCILIATION OF THE GOVERNMENTAL FUNDS STATEMENT OF
REVENUES, EXPENDITURES AND CHANGES IN FUND BALANCES
TO THE STATEMENT OF ACTIVITIES
The accompanying notes are an integral part of this financial statement.
36
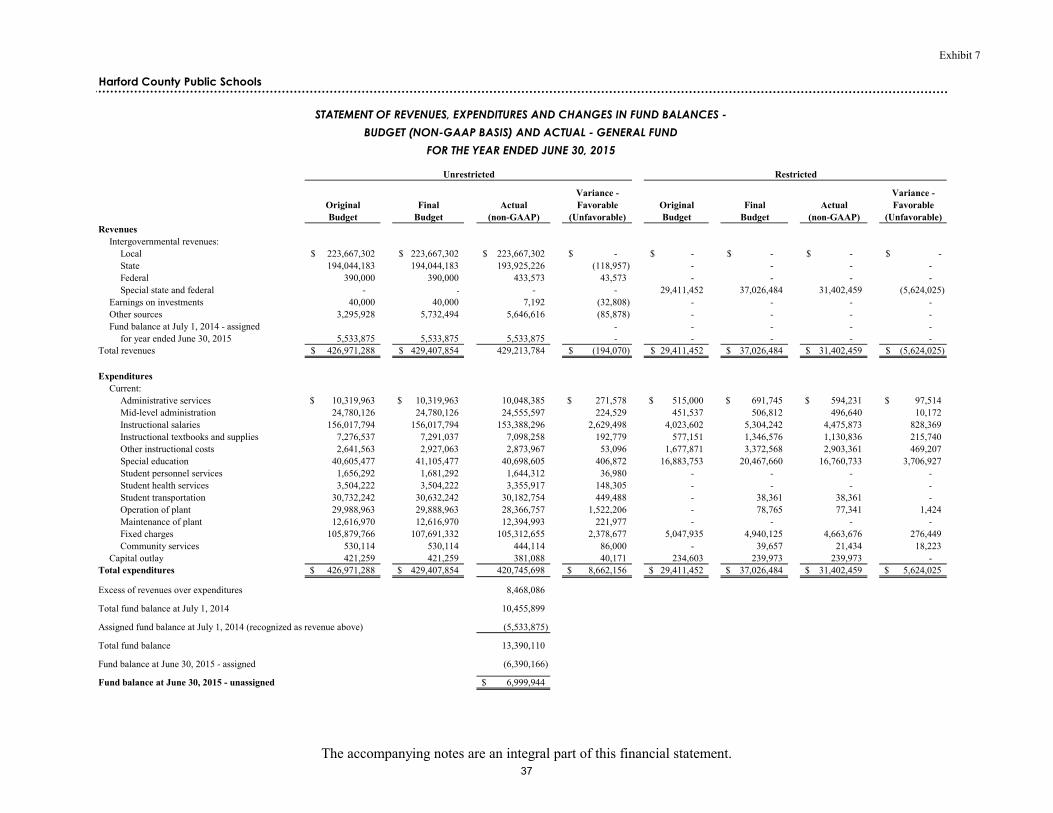
Exhibit 7
Harford County Public Schools
Unrestricted Restricted
Variance - Variance -Original Final Actual Favorable Original Final Actual FavorableBudget Budget (non-GAAP) (Unfavorable) Budget Budget (non-GAAP) (Unfavorable)
RevenuesIntergovernmental revenues:
Local 223,667,302$ 223,667,302$ 223,667,302$ -$ -$ -$ -$ -$ State 194,044,183 194,044,183 193,925,226 (118,957) - - - - Federal 390,000 390,000 433,573 43,573 - - - - Special state and federal - - - - 29,411,452 37,026,484 31,402,459 (5,624,025)
Earnings on investments 40,000 40,000 7,192 (32,808) - - - - Other sources 3,295,928 5,732,494 5,646,616 (85,878) - - - - Fund balance at July 1, 2014 - assigned - - - - -
for year ended June 30, 2015 5,533,875 5,533,875 5,533,875 - - - - - Total revenues 426,971,288$ 429,407,854$ 429,213,784 (194,070)$ 29,411,452$ 37,026,484$ 31,402,459$ (5,624,025)$
ExpendituresCurrent:
Administrative services 10,319,963$ 10,319,963$ 10,048,385 271,578$ 515,000$ 691,745$ 594,231$ 97,514$ Mid-level administration 24,780,126 24,780,126 24,555,597 224,529 451,537 506,812 496,640 10,172 Instructional salaries 156,017,794 156,017,794 153,388,296 2,629,498 4,023,602 5,304,242 4,475,873 828,369 Instructional textbooks and supplies 7,276,537 7,291,037 7,098,258 192,779 577,151 1,346,576 1,130,836 215,740 Other instructional costs 2,641,563 2,927,063 2,873,967 53,096 1,677,871 3,372,568 2,903,361 469,207 Special education 40,605,477 41,105,477 40,698,605 406,872 16,883,753 20,467,660 16,760,733 3,706,927 Student personnel services 1,656,292 1,681,292 1,644,312 36,980 - - - - Student health services 3,504,222 3,504,222 3,355,917 148,305 - - - - Student transportation 30,732,242 30,632,242 30,182,754 449,488 - 38,361 38,361 - Operation of plant 29,988,963 29,888,963 28,366,757 1,522,206 - 78,765 77,341 1,424 Maintenance of plant 12,616,970 12,616,970 12,394,993 221,977 - - - - Fixed charges 105,879,766 107,691,332 105,312,655 2,378,677 5,047,935 4,940,125 4,663,676 276,449 Community services 530,114 530,114 444,114 86,000 - 39,657 21,434 18,223
Capital outlay 421,259 421,259 381,088 40,171 234,603 239,973 239,973 - Total expenditures 426,971,288$ 429,407,854$ 420,745,698 8,662,156$ 29,411,452$ 37,026,484$ 31,402,459$ 5,624,025$
Excess of revenues over expenditures 8,468,086
Total fund balance at July 1, 2014 10,455,899
Assigned fund balance at July 1, 2014 (recognized as revenue above) (5,533,875)
Total fund balance 13,390,110
Fund balance at June 30, 2015 - assigned (6,390,166)
Fund balance at June 30, 2015 - unassigned 6,999,944$
STATEMENT OF REVENUES, EXPENDITURES AND CHANGES IN FUND BALANCES -
BUDGET (NON-GAAP BASIS) AND ACTUAL - GENERAL FUND
FOR THE YEAR ENDED JUNE 30, 2015
The accompanying notes are an integral part of this financial statement.37
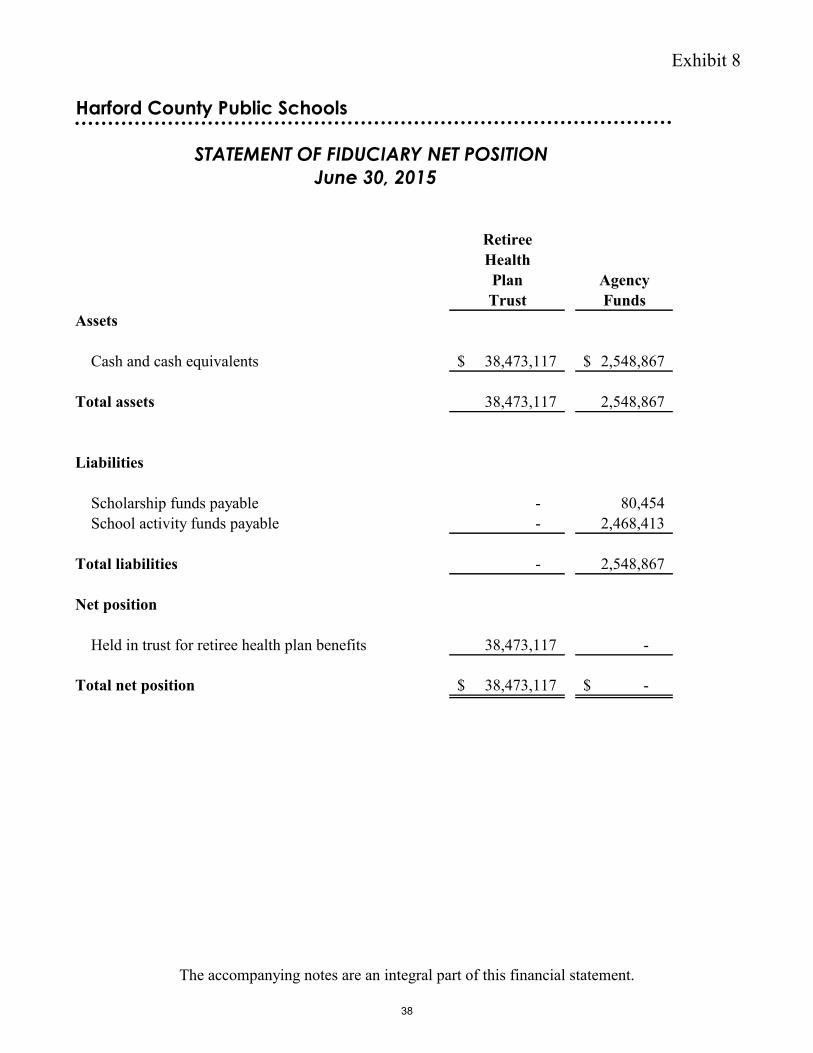
Exhibit 8
RetireeHealthPlan AgencyTrust Funds
Cash and cash equivalents 38,473,117$ 2,548,867$
Total assets 38,473,117 2,548,867
Scholarship funds payable - 80,454 School activity funds payable - 2,468,413
Total liabilities - 2,548,867
Net position
Held in trust for retiree health plan benefits 38,473,117 -
Total net position 38,473,117$ -$
Liabilities
Harford County Public Schools
Assets
STATEMENT OF FIDUCIARY NET POSITION
June 30, 2015
The accompanying notes are an integral part of this financial statement.
38
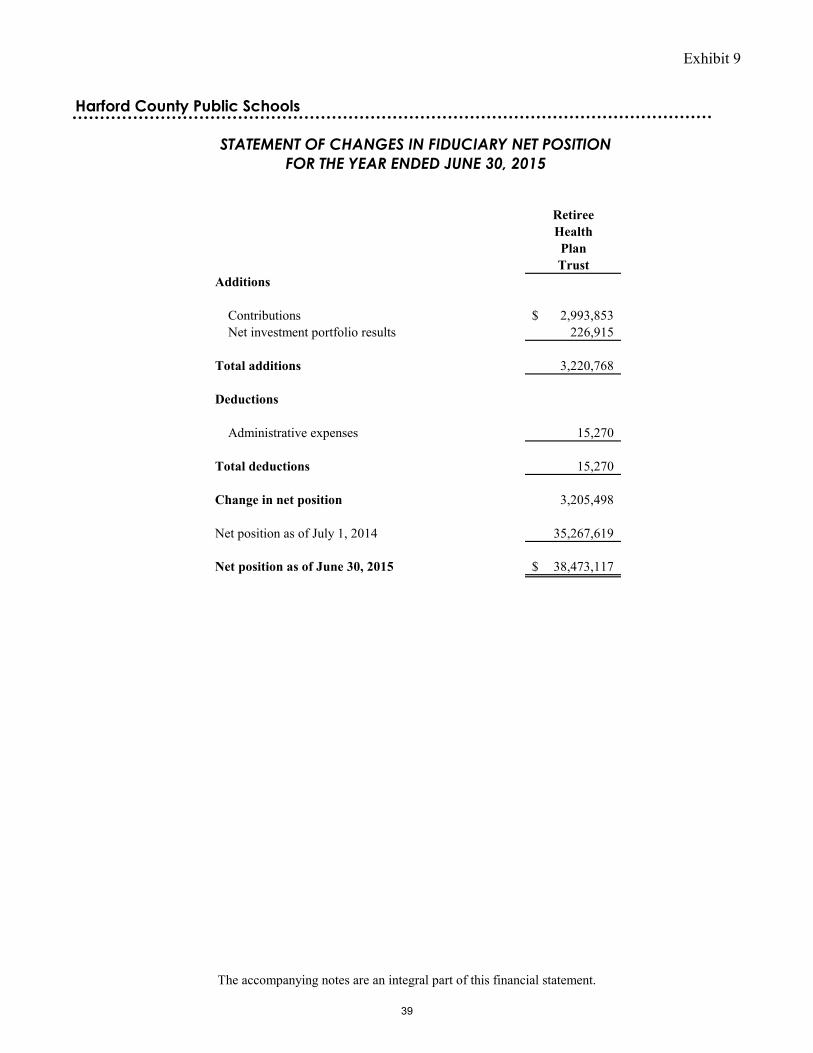
Exhibit 9
RetireeHealthPlanTrust
Contributions 2,993,853$ Net investment portfolio results 226,915
Total additions 3,220,768
Administrative expenses 15,270
Total deductions 15,270
Change in net position 3,205,498
Net position as of July 1, 2014 35,267,619
Net position as of June 30, 2015 38,473,117$
STATEMENT OF CHANGES IN FIDUCIARY NET POSITION
FOR THE YEAR ENDED JUNE 30, 2015
Deductions
Additions
Harford County Public Schools
The accompanying notes are an integral part of this financial statement.
39
HARFORD COUNTY PUBLIC SCHOOLS
NOTES TO FINANCIAL STATEMENTS
June 30, 2015
NOTE 1 – SUMMARY OF SIGNIFICANT ACCOUNTING POLICIES Reporting Entity The Board of Education of Harford County (the Board) is a body politic and corporate established by the Public School Laws of Maryland. For financial reporting purposes, the Board (alternatively referred to herein as Harford County Public Schools) is a component unit of Harford County, Maryland (the County) by virtue of the County’s responsibility for levying taxes and incurring debt for the benefit of the Board, as well as its budgetary control over the Board. Accordingly, the financial statements of the Board are included in the financial statements of the County. The Board itself has no component units. The accounting policies of Harford County Public Schools conform to accounting principles generally accepted in the United States of America. Accordingly, the Board applies all applicable Governmental Accounting Standards Board (GASB) pronouncements. The following is a summary of significant accounting policies employed by the Board. Government-Wide and Fund Financial Statements The Statement of Net Position and the Statement of Activities report information on all of the non-fiduciary activities of Harford County Public Schools as a whole. The activities of the General Fund (Current Expense Fund), Special Revenue Fund (Food Service Fund) and Capital Projects Fund (School Construction Fund) have been presented as governmental activities in the government-wide financial statements. The Statement of Activities demonstrates the degree to which the direct expenses of a given function are offset by program revenues. Direct expenses are those that are specifically associated with a service, program or department and are therefore clearly identifiable to a particular function. Program revenues include charges paid by the recipient of the goods or services offered by the program and grants and contributions that are restricted to meeting the operational requirements of a particular program. Local appropriations, state and federal aid and other items which are not classified as program revenues are presented as general revenues of the Board. The Board has no internal service funds and interfund services provided and used are negligible and are not eliminated in the process of consolidation. Separate financial statements are provided for governmental funds and fiduciary funds, even though the latter are excluded from the government-wide financial statements. All individual governmental funds are considered to be major funds and are reported as separate columns in the governmental fund financial statements. The Board has no proprietary funds.
40
HARFORD COUNTY PUBLIC SCHOOLS
NOTES TO FINANCIAL STATEMENTS
June 30, 2015
NOTE 1 – SUMMARY OF SIGNIFICANT ACCOUNTING POLICIES (continued) Measurement Focus, Basis of Accounting and Financial Statement Presentation The government-wide financial statements are reported using the economic resources measurement focus and the accrual basis of accounting. Revenues are recorded when earned and expenses are recorded when a liability is incurred, regardless of the timing of related cash flows. Local appropriations and state and federal aid are recognized as revenues in the year for which they were approved by the provider. Grants and similar items are recognized as revenues as soon as all eligibility requirements imposed by the provider have been met. Governmental fund financial statements are reported using the current financial resources measurement focus and the modified accrual basis of accounting. Revenues are recognized as soon as they are both measurable and available. Revenues are considered to be available when they are collectible within the current period or soon enough thereafter to pay liabilities of the current period. For this purpose, the Board considers revenues to be available if they are collected within sixty days of the end of the current fiscal period. Expenditures generally are recorded when a liability is incurred, as under accrual accounting. However, expenditures related to certain compensated absences are recognized when the obligations are expected to be liquidated with expendable available resources. Local appropriations and state and federal aid associated with the current fiscal period are considered to be susceptible to accrual and so have been recognized as revenues of the current fiscal period. Entitlements and shared revenues are recorded at the time of receipt or earlier if the susceptible to accrual criteria have been met. Expenditure driven grants are recognized as revenues when the qualifying expenditures have been incurred and all other grant requirements have been met. Interfund balances account for expenditures paid in the general fund for other funds through a common system. Reimbursements are made periodically as revenues are received. Agency funds are custodial in nature and do not measure results of operations or have a measurement focus. Agency funds do, however, use the accrual basis of accounting. The Retiree Health Plan Trust Fund financial statements are reported using the economic resources measurement focus and the accrual basis of accounting.
41
HARFORD COUNTY PUBLIC SCHOOLS
NOTES TO FINANCIAL STATEMENTS
June 30, 2015
NOTE 1 – SUMMARY OF SIGNIFICANT ACCOUNTING POLICIES (continued) Measurement Focus, Basis of Accounting and Financial Statement Presentation (continued) The Board reports the following funds in the fund financial statements: Governmental Funds Current Expense Fund (General Fund) - The general fund is the general operating fund of the Board. It is used to account for all financial resources except those required to be accounted for in another fund. Special state and federal programs are included in the restricted portion of this fund. Food Service Fund (Special Revenue Fund) – The food service fund is used to account for the operations of the cafeterias and production facilities which provide for the preparation and sale of meals primarily to students. As a special revenue fund, the proceeds of specific revenue sources (other than major capital projects) are legally restricted to expenditures for specified purposes. A substantial portion of its revenues are derived from other governments and it is not intended to be self-sustaining from food sales. The Board exercises the appropriate budgetary and accounting control through use of an annual budget prepared by the Department of Food and Nutrition and the Budget Office, which is reviewed and monitored by management during the fiscal year. There is no legal requirement for an approved budget. School Construction Fund (Capital Projects Fund) – The school construction fund is used to account for financial resources to be used for the acquisition or construction of major capital facilities. Fiduciary Funds Scholarship and School Funds (Agency Funds) - Agency funds are used to account for assets held by the Board in a trustee capacity. Scholarship funds account for monies that have been donated for scholarships but have not yet been awarded. The school funds account for student activities such as student organizations, yearbooks and field trips. School funds are the direct responsibility of the principals of the respective schools. Retiree Health Plan Trust Fund – This fund was established to prefund other postemployment benefits (OPEB) that the Board provides to retirees of the Board and their dependents.
42
HARFORD COUNTY PUBLIC SCHOOLS
NOTES TO FINANCIAL STATEMENTS
June 30, 2015
NOTE 1 – SUMMARY OF SIGNIFICANT ACCOUNTING POLICIES (continued) Assets, Liabilities and Net Position or Equity Due From Other Units of Government and Other Receivables Due from other units of government consists primarily of amounts due for local and state appropriations under the operating budget and capital projects, and expenditures in excess of amounts received under grant agreements. Other receivables include amounts due from other local education agencies for out of county tuition and the deposit with the Harford County Consortium for stabilization of health insurance costs. Accounts receivable are not collateralized, but are primarily with other governmental units and related agencies. These entities rarely default on their obligations and management of the Board considers all amounts collectible as of June 30, 2015. Therefore, no valuation allowance is provided against the amounts due. Inventory Inventory is valued at the lower of cost (first-in, first-out) or market. Inventory in the general fund consists of supplies maintained in the distribution center. Inventory in the food service fund consists of expendable food and supplies held for consumption. The cost is recorded as an asset at the time individual inventory items are purchased. As inventory is consumed, the cost is charged to expenditures. Capital Assets Capital assets, which include property, plant, equipment and infrastructure assets, are reported as governmental activities in the government-wide financial statements. Capital assets are defined by the Board as assets with an initial, individual cost of more than $5,000 and a useful life of at least two years. Capital assets are recorded at historical cost, or estimated historical cost if actual historical cost is not available. Donated capital assets are valued at their estimated fair value on the date donated. The costs of normal maintenance and repairs that do not add to the value of the asset or materially extend asset lives are not capitalized. Major outlays for capital assets and improvements are capitalized as projects are constructed. Property, plant and equipment are depreciated using the straight-line method over estimated useful lives of 20-50 years for buildings, improvements and infrastructure, and 5-20 years for furniture and equipment. Assets which have been acquired with funds received through federal grants must be used in accordance with the terms of the grant. Federal regulations require, in some cases, that the Board must reimburse the federal government for any assets which the Board retains for its own use after the termination of the grant unless otherwise provided by the grantor.
43

HARFORD COUNTY PUBLIC SCHOOLS
NOTES TO FINANCIAL STATEMENTS
June 30, 2015
NOTE 1 – SUMMARY OF SIGNIFICANT ACCOUNTING POLICIES (continued) Assets, Liabilities and Net Position or Equity (continued) Compensated Absences As of June 30, 2015, annual and sick leave earned, applicable to governmental fund types, but not taken by Board employees, was $27,663,827. This amount is based on vested accumulated leave as of June 30, 2015, for employees eligible to receive annual leave benefits at retirement. Sick leave is accrued for employees with at least ten years of service and calculated at 25% of their annual daily rate up to a maximum ranging from 200 to 300 days. An accrual in the amount of $1,551,699 was made in the General Fund for the year ended June 30, 2015. This amount was an estimate of the accumulated annual and sick leave which is due and payable as of June 30, 2015 as it will be paid to retirees during the first month of the fiscal year ending June 30, 2016. The remaining liability for accumulated annual and sick leave earned in the amount of $26,112,128 is reported as a noncurrent liability in the government-wide financial statements. Pensions Certain employees of the Board are members of the Maryland State Retirement and Pension System. Employees are members of either the Teachers Pension System of the State of Maryland (TPS) or the Employees Retirement System of the State of Maryland (ERS). TPS and ERS are part of the Maryland State Retirement and Pension System that is considered a single, multiple- employer cost-sharing plan. For purposes of measuring the net pension liability, deferred outflows of resources and deferred inflows of resources related to pensions, and pension expense, information about the fiduciary net position of TPS and ERS and additions to/deductions from TPS and ERS’ fiduciary net position have been determined on the same basis as they are reported by TPS and ERS. For this purpose, benefit payments (including refunds of employee contributions) are recognized when due and payable in accordance with the benefit terms. Investments are reported at fair value.
44
HARFORD COUNTY PUBLIC SCHOOLS
NOTES TO FINANCIAL STATEMENTS
June 30, 2015
NOTE 1 – SUMMARY OF SIGNIFICANT ACCOUNTING POLICIES (continued) Assets, Liabilities and Net Position or Equity (continued) Deferred Outflows/Inflows of Resources In addition to assets, the Statement of Net Position will sometimes report a separate section for deferred outflows of resources. This separate financial statement element, deferred outflows of resources, represents a consumption of net position that applies to a future period(s) and so will not be recognized as an outflow of resources (expense/expenditure) until then. In addition to liabilities, the Statement of Net Position will sometimes report a separate section for deferred inflows of resources. This separate financial statement element, deferred inflows of resources, represents an acquisition of net position that applies to a future period(s) and so will not be recognized as an inflow of resources (revenue) until that time. Encumbrances Encumbrance accounting, under which purchase orders, contracts and other commitments for the expenditure of monies are recorded in order to reserve that portion of the applicable appropriation, is employed as an extension of formal budgetary integration in the General Fund, Special Revenue Fund, and Capital Projects Fund. Encumbrances outstanding at year-end are reported as assignments of fund balances since they do not constitute expenditures or liabilities. Net Position and Fund Balance The difference between fund assets and deferred outflows and liabilities and deferred inflows is “Net Position” on the government-wide and fiduciary fund statements and “Fund Balance” on governmental fund statements. Net Position is classified as “Net investment in capital assets,” legally “Restricted” for a specific purpose, or “Unrestricted” and available for appropriation for general purposes. In the governmental fund financial statements, non-spendable and restricted fund balance represent amounts that are legally restricted by outside parties for use for a specific purpose or are otherwise not available for appropriation. Committed fund balance represents amounts that are reserved for a particular purpose by the Board and would require action by the Board to release the fund balance from its commitment. Assigned fund balance represents tentative management plans that are subject to change. Use of Estimates in Preparing Financial Statements The preparation of financial statements in conformity with GAAP requires management to make estimates and assumptions that affect the reported amounts of assets and liabilities and disclosures of contingent assets and liabilities at the date of the financial statements and the reported amounts of revenues and expenditures during the reporting period. Actual results could differ from those estimates.
45
HARFORD COUNTY PUBLIC SCHOOLS
NOTES TO FINANCIAL STATEMENTS
June 30, 2015
NOTE 2 – BUDGETS AND BUDGETARY ACCOUNTING Budgetary compliance is measured using the budgetary basis of accounting, the purpose of which is to demonstrate compliance with the legal requirements of Harford County, the State of Maryland, and special federal and state programs. The budgetary basis differs from GAAP, which is used for the fund financial statements, in that encumbrances, which represent commitments to purchase goods and services, are treated as expenditures of the current period rather than as reservations of the fund balance. The other principal difference is that under the budgetary basis, designations of the prior year's fund balance are treated as revenue of the current period. The Statement of Revenues, Expenditures and Changes in Fund Balances - Budget (non-GAAP basis) and Actual-General Fund is presented using the budgetary basis of accounting. By state law, major categories of expenditures may not exceed budgeted amounts. The state-mandated categories of expenditures include Administration, Mid-level Administration, Instructional Salaries, Textbooks and Instructional Supplies, Other Instructional Costs, Special Education, Pupil Personnel Services, Student Health Services, Student Transportation, Operation of Plant, Maintenance of Plant, Fixed Charges, Community Services and Capital Outlay. The Board follows these procedures in establishing the budgetary data reflected in the financial statements: Operating Budget (General Fund)
1) In early June, budget questionnaires are distributed to principals and staff members. These questionnaires and supporting documents are due in the office of the Director of Budget at the beginning of October.
2) At the regular monthly meetings in October and November, the Board will establish its
priorities for the operating budget.
3) At the regular monthly meeting in December, the Superintendent of Schools will present the recommended operating budget to the Board and the general public.
4) In January, the Board will hold a special meeting for the purpose of providing for a public
hearing on the Superintendent’s recommended operating budget.
5) At the regular monthly meeting in January, the Board will adopt an operating budget and submit the adopted operating budget to the County Executive.
6) After approval or adjustment by the County Council, the final operating budget is approved
by the Board in June.
46
HARFORD COUNTY PUBLIC SCHOOLS
NOTES TO FINANCIAL STATEMENTS
June 30, 2015
NOTE 2 – BUDGETS AND BUDGETARY ACCOUNTING (continued)
Operating Budget (General Fund) (continued)
7) Budgets are normally adopted on a basis consistent with GAAP except for the inclusion of portions of the prior year’s fund balance as revenues, the inclusion of encumbrances as expenditures and the exclusion of retirement payments made on the Board’s behalf by the State of Maryland as revenues and expenditures. Budget comparisons presented are on a non-GAAP budgetary basis.
8) Transfers may be made within the major categories by the Board of Education without the
approval of the County Council as budgetary control is at the major category level. 9) Requests for transfers between major categories must be submitted to the County Council
for approval or denial. No action within thirty (30) days of submission constitutes approval.
The expenditures under special state and federal programs may exceed budgeted amounts. The grants included in this category are not part of budget categories subject to the spending limitations of the operating budget. Expenditures under these programs are limited to the amounts of the respective grants. Food Service Fund Budget (Special Revenue Fund) The Food Service Fund Budget is not a legally adopted budget and, therefore, a budget to actual presentation is not included in the basic financial statements. The comparison of the Food Services Fund Budget to actual revenues and expenditures is presented as a supplementary schedule to these financial statements. Revenue from Federal sources in the Food Service Fund includes $948,268 of donated commodities from the United States Department of Agriculture. Capital Budget - School Construction Fund (Capital Projects Fund) Annual budgetary comparisons to actual expenditures are not presented in the financial statements for the Capital Projects Fund. School construction is budgeted on a project basis with funds primarily provided by Harford County and the State of Maryland. State funds are approved by the State’s interagency committee. Reconciliation of Budgetary Data The Statement of Revenues, Expenditures and Changes in Fund Balances - Budget (Non-GAAP Basis) and Actual - General Fund is prepared on a legally prescribed budgetary basis of accounting which differs from GAAP. The purpose of the budgetary basis of accounting is to demonstrate compliance with the legal requirements of Harford County, the State of Maryland and special federal and state programs.
47
HARFORD COUNTY PUBLIC SCHOOLS
NOTES TO FINANCIAL STATEMENTS
June 30, 2015
NOTE 2 – BUDGETS AND BUDGETARY ACCOUNTING (continued)
The differences between the two methods are set forth below:
Revenues (non-GAAP budgetary basis - unrestricted and restricted) 460,616,243$ Fund balance at June 30, 2014 assigned to current year expenditures (5,533,875) Revenues adjusted by restricted encumbrances of expenditure driven grants (382,378) Pension contributions made directly by the State of Maryland 29,257,412 Interest earned on rate stabilization deposit 6,078 Changes in value of rate stabilization fund 1,601,567
Revenues (GAAP basis) 485,565,047$
Expenditures (non-GAAP budgetary basis - unrestricted and restricted) 452,148,157$ Net effect of encumbrances 245,094 Pension contributions made directly by the State of Maryland 29,257,412 Contribution for OPEB 1,528,539
Expenditures (GAAP basis) 483,179,202$
The unassigned fund balances in the current expense fund (general fund) are reconciled as follows:
Unassigned Fund Balance (non-GAAP budgetary basis) 6,999,944$ Cumulative effect of: Revenues adjusted by encumbrances of expenditure driven grants (592,134)
Unassigned fund balance (GAAP basis) 6,407,810$
The assigned fund balances in the current expense fund (general fund) are reconciled as follows:
Assigned Fund Balance (non-GAAP budgetary basis) 6,390,166$ Encumbrances 2,900,141 Rate stabilization fund balance 8,079,611
Assigned Fund Balance (GAAP basis) 17,369,918$
48
HARFORD COUNTY PUBLIC SCHOOLS
NOTES TO FINANCIAL STATEMENTS
June 30, 2015
NOTE 3 – CASH AND INVESTMENTS
Cash on Hand
At year end, cash on hand for petty cash and change funds was $740. Deposits As of June 30, 2015, the carrying amount of the Board’s deposits was $8,917,142 and the bank balance was $11,657,605. The Board’s deposits were not exposed to custodial credit risk as of June 30, 2015, as the deposits are covered by FDIC insurance or collateral held by the financial institution in the Board’s name.
Investments
Statutes authorize the Board to invest in obligations of the United States Government, federal government agency obligations, secured time deposits in Maryland banks, bankers’ acceptances, the Maryland Local Government Investment Pool (MLGIP), money market mutual funds, commercial paper and repurchase agreements secured by direct government or agency obligations. The Board is a participant in the Maryland Local Government Investment Pool, which is under the administration of the State Treasurer. The MLGIP was established in 1982 under Article 95 Section 22G of the Annotated Code of Maryland and is rated AAAm by Standard and Poors, their highest rating for money market funds. Unit value is computed using the amortized cost method. In addition, the net asset value of the pool, marked-to-market, is calculated and maintained on a weekly basis to ensure a $1.00 per unit constant value. The investment objectives of the Pool are: to preserve the capital value of the dollars invested; to provide a competitive rate of return; and to provide a readily available source of daily liquidity.
As of June 30, 2015, the Board’s investment balances were as follows:
Fair ValueMaryland Local Government Investment Pool 15,166,877$
49
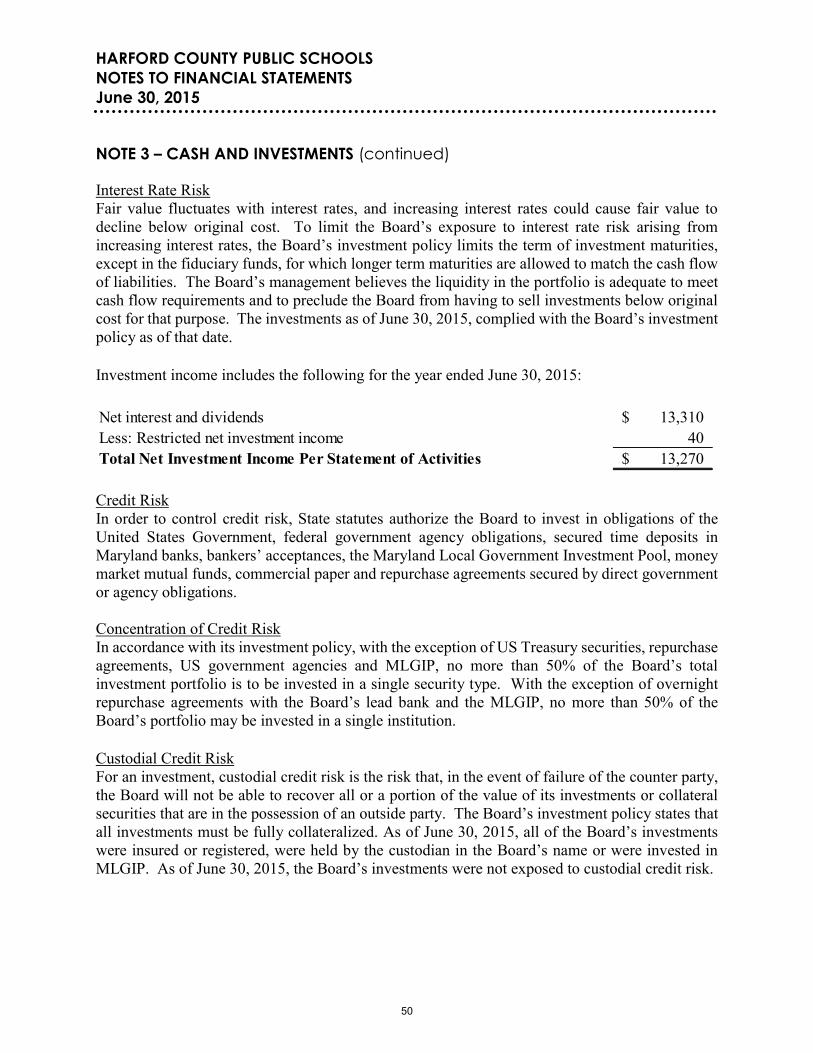
HARFORD COUNTY PUBLIC SCHOOLS
NOTES TO FINANCIAL STATEMENTS
June 30, 2015
NOTE 3 – CASH AND INVESTMENTS (continued) Interest Rate Risk Fair value fluctuates with interest rates, and increasing interest rates could cause fair value to decline below original cost. To limit the Board’s exposure to interest rate risk arising from increasing interest rates, the Board’s investment policy limits the term of investment maturities, except in the fiduciary funds, for which longer term maturities are allowed to match the cash flow of liabilities. The Board’s management believes the liquidity in the portfolio is adequate to meet cash flow requirements and to preclude the Board from having to sell investments below original cost for that purpose. The investments as of June 30, 2015, complied with the Board’s investment policy as of that date. Investment income includes the following for the year ended June 30, 2015:
Credit Risk In order to control credit risk, State statutes authorize the Board to invest in obligations of the United States Government, federal government agency obligations, secured time deposits in Maryland banks, bankers’ acceptances, the Maryland Local Government Investment Pool, money market mutual funds, commercial paper and repurchase agreements secured by direct government or agency obligations. Concentration of Credit Risk In accordance with its investment policy, with the exception of US Treasury securities, repurchase agreements, US government agencies and MLGIP, no more than 50% of the Board’s total investment portfolio is to be invested in a single security type. With the exception of overnight repurchase agreements with the Board’s lead bank and the MLGIP, no more than 50% of the Board’s portfolio may be invested in a single institution. Custodial Credit Risk For an investment, custodial credit risk is the risk that, in the event of failure of the counter party, the Board will not be able to recover all or a portion of the value of its investments or collateral securities that are in the possession of an outside party. The Board’s investment policy states that all investments must be fully collateralized. As of June 30, 2015, all of the Board’s investments were insured or registered, were held by the custodian in the Board’s name or were invested in MLGIP. As of June 30, 2015, the Board’s investments were not exposed to custodial credit risk.
Net interest and dividends 13,310$ Less: Restricted net investment income 40 Total Net Investment Income Per Statement of Activities 13,270$
50
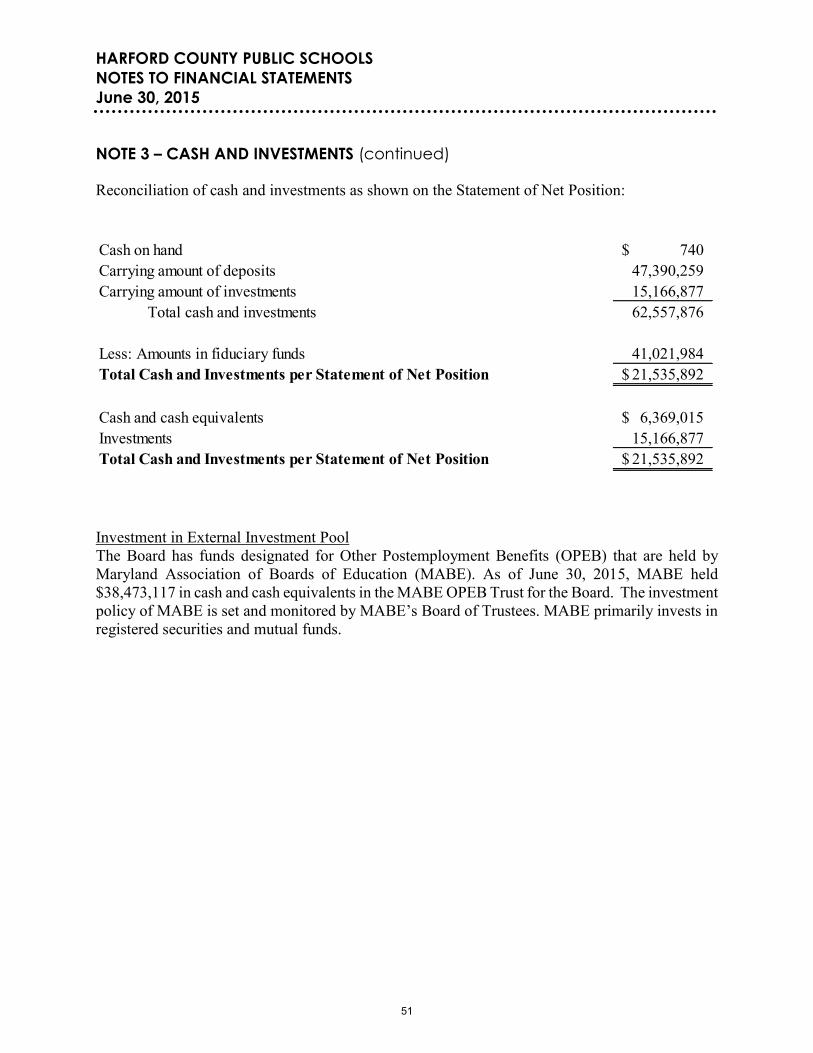
HARFORD COUNTY PUBLIC SCHOOLS
NOTES TO FINANCIAL STATEMENTS
June 30, 2015
NOTE 3 – CASH AND INVESTMENTS (continued) Reconciliation of cash and investments as shown on the Statement of Net Position:
Investment in External Investment Pool The Board has funds designated for Other Postemployment Benefits (OPEB) that are held by Maryland Association of Boards of Education (MABE). As of June 30, 2015, MABE held $38,473,117 in cash and cash equivalents in the MABE OPEB Trust for the Board. The investment policy of MABE is set and monitored by MABE’s Board of Trustees. MABE primarily invests in registered securities and mutual funds.
Cash on hand 740$ Carrying amount of deposits 47,390,259 Carrying amount of investments 15,166,877
Total cash and investments 62,557,876
Less: Amounts in fiduciary funds 41,021,984 Total Cash and Investments per Statement of Net Position 21,535,892$
Cash and cash equivalents 6,369,015$ Investments 15,166,877 Total Cash and Investments per Statement of Net Position 21,535,892$
51
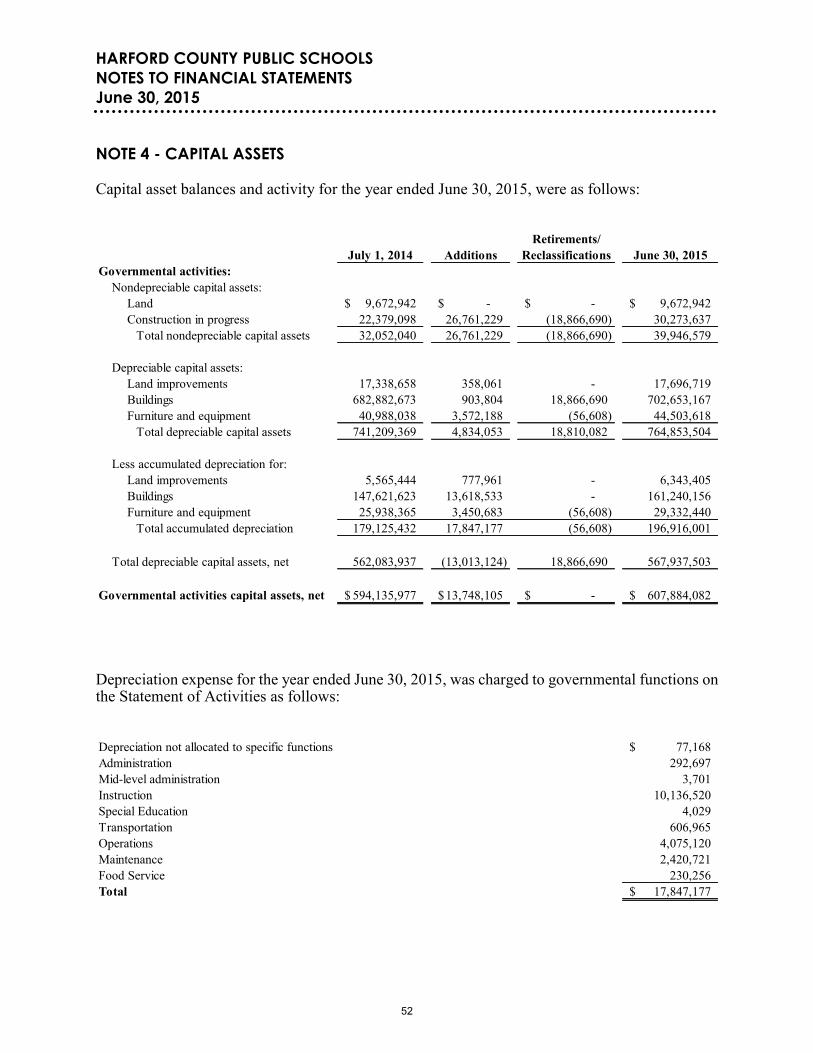
HARFORD COUNTY PUBLIC SCHOOLS
NOTES TO FINANCIAL STATEMENTS
June 30, 2015
NOTE 4 - CAPITAL ASSETS Capital asset balances and activity for the year ended June 30, 2015, were as follows:
Depreciation expense for the year ended June 30, 2015, was charged to governmental functions on the Statement of Activities as follows:
Retirements/July 1, 2014 Additions Reclassifications June 30, 2015
Governmental activities:Nondepreciable capital assets:
Land 9,672,942$ -$ -$ 9,672,942$ Construction in progress 22,379,098 26,761,229 (18,866,690) 30,273,637
Total nondepreciable capital assets 32,052,040 26,761,229 (18,866,690) 39,946,579
Depreciable capital assets:Land improvements 17,338,658 358,061 - 17,696,719 Buildings 682,882,673 903,804 18,866,690 702,653,167 Furniture and equipment 40,988,038 3,572,188 (56,608) 44,503,618
Total depreciable capital assets 741,209,369 4,834,053 18,810,082 764,853,504
Less accumulated depreciation for:Land improvements 5,565,444 777,961 - 6,343,405 Buildings 147,621,623 13,618,533 - 161,240,156 Furniture and equipment 25,938,365 3,450,683 (56,608) 29,332,440
Total accumulated depreciation 179,125,432 17,847,177 (56,608) 196,916,001
Total depreciable capital assets, net 562,083,937 (13,013,124) 18,866,690 567,937,503
Governmental activities capital assets, net 594,135,977$ 13,748,105$ -$ 607,884,082$
Depreciation not allocated to specific functions 77,168$ Administration 292,697 Mid-level administration 3,701 Instruction 10,136,520 Special Education 4,029 Transportation 606,965 Operations 4,075,120 Maintenance 2,420,721 Food Service 230,256 Total 17,847,177$
52
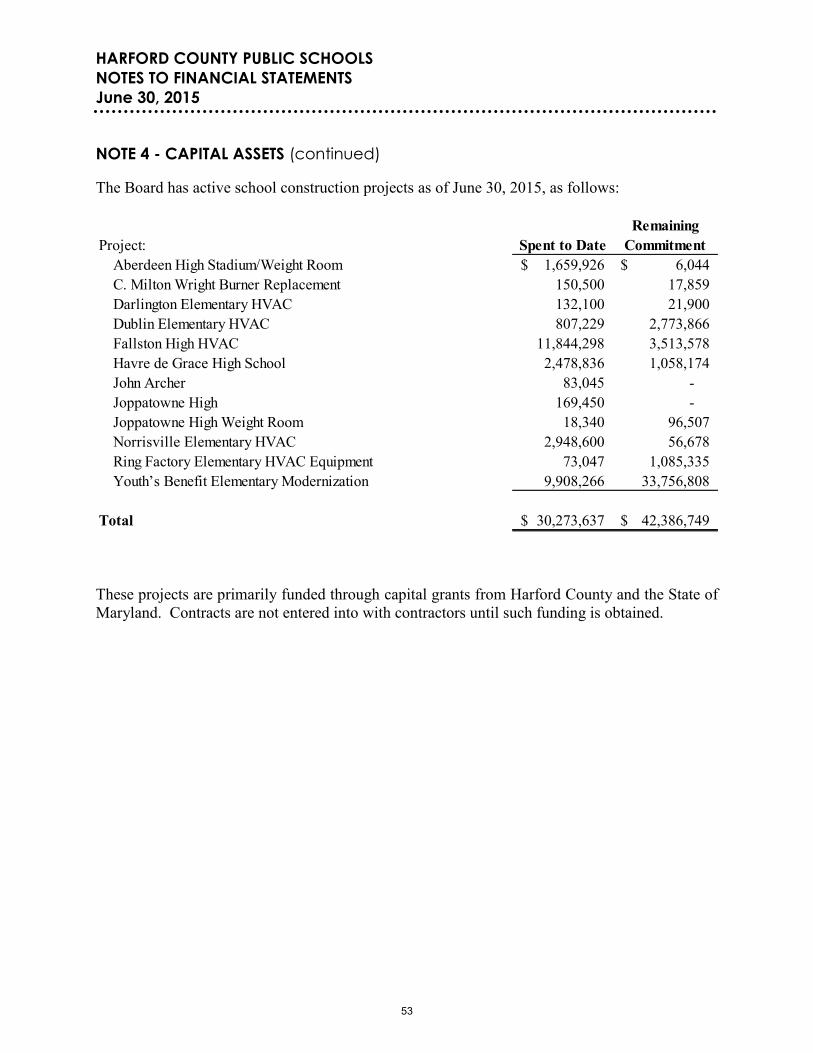
HARFORD COUNTY PUBLIC SCHOOLS
NOTES TO FINANCIAL STATEMENTS
June 30, 2015
NOTE 4 - CAPITAL ASSETS (continued) The Board has active school construction projects as of June 30, 2015, as follows:
These projects are primarily funded through capital grants from Harford County and the State of Maryland. Contracts are not entered into with contractors until such funding is obtained.
RemainingProject: Spent to Date Commitment
Aberdeen High Stadium/Weight Room 1,659,926$ 6,044$ C. Milton Wright Burner Replacement 150,500 17,859 Darlington Elementary HVAC 132,100 21,900 Dublin Elementary HVAC 807,229 2,773,866 Fallston High HVAC 11,844,298 3,513,578 Havre de Grace High School 2,478,836 1,058,174 John Archer 83,045 - Joppatowne High 169,450 - Joppatowne High Weight Room 18,340 96,507 Norrisville Elementary HVAC 2,948,600 56,678 Ring Factory Elementary HVAC Equipment 73,047 1,085,335 Youth’s Benefit Elementary Modernization 9,908,266 33,756,808
Total 30,273,637$ 42,386,749$
53
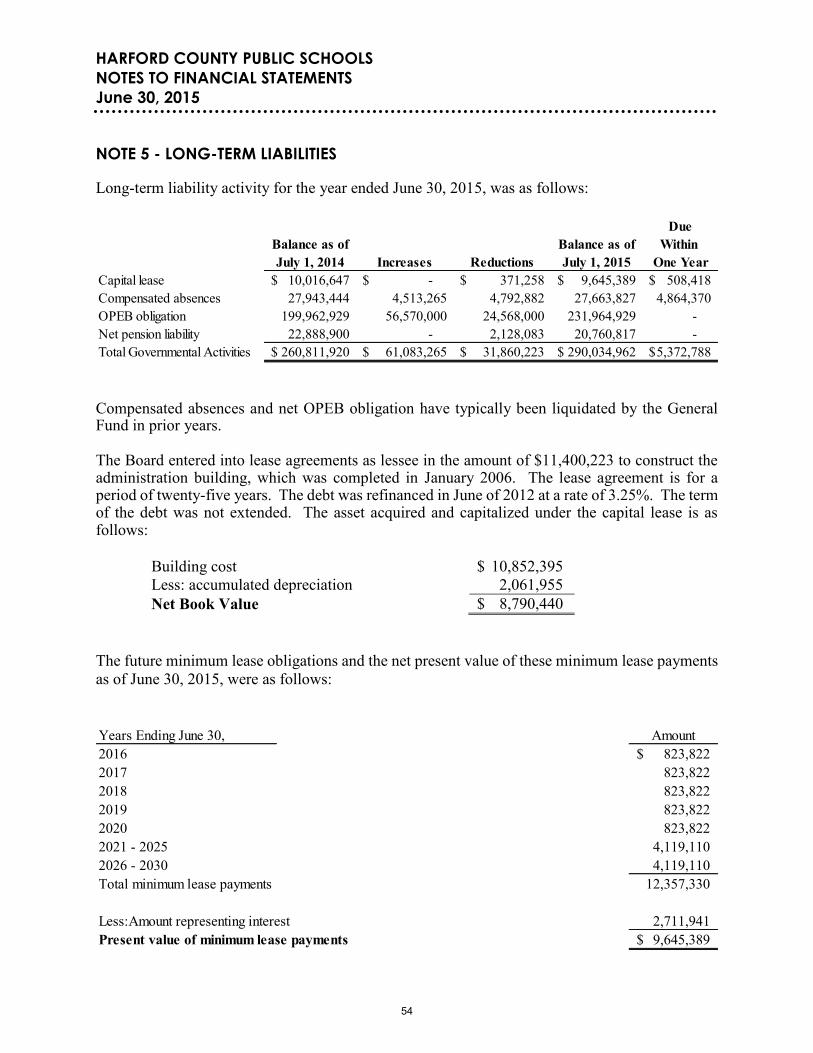
HARFORD COUNTY PUBLIC SCHOOLS
NOTES TO FINANCIAL STATEMENTS
June 30, 2015
NOTE 5 - LONG-TERM LIABILITIES Long-term liability activity for the year ended June 30, 2015, was as follows:
Compensated absences and net OPEB obligation have typically been liquidated by the General Fund in prior years. The Board entered into lease agreements as lessee in the amount of $11,400,223 to construct the administration building, which was completed in January 2006. The lease agreement is for a period of twenty-five years. The debt was refinanced in June of 2012 at a rate of 3.25%. The term of the debt was not extended. The asset acquired and capitalized under the capital lease is as follows:
Building cost $ 10,852,395 Less: accumulated depreciation 2,061,955 Net Book Value $ 8,790,440
The future minimum lease obligations and the net present value of these minimum lease payments as of June 30, 2015, were as follows:
DueBalance as of Balance as of Within July 1, 2014 Increases Reductions July 1, 2015 One Year
Capital lease 10,016,647$ -$ 371,258$ 9,645,389$ 508,418$ Compensated absences 27,943,444 4,513,265 4,792,882 27,663,827 4,864,370 OPEB obligation 199,962,929 56,570,000 24,568,000 231,964,929 - Net pension liability 22,888,900 - 2,128,083 20,760,817 - Total Governmental Activities 260,811,920$ 61,083,265$ 31,860,223$ 290,034,962$ 5,372,788$
Years Ending June 30, Amount2016 823,822$ 2017 823,822 2018 823,822 2019 823,822 2020 823,822 2021 - 2025 4,119,110 2026 - 2030 4,119,110 Total minimum lease payments 12,357,330
Less:Amount representing interest 2,711,941 Present value of minimum lease payments 9,645,389$
54
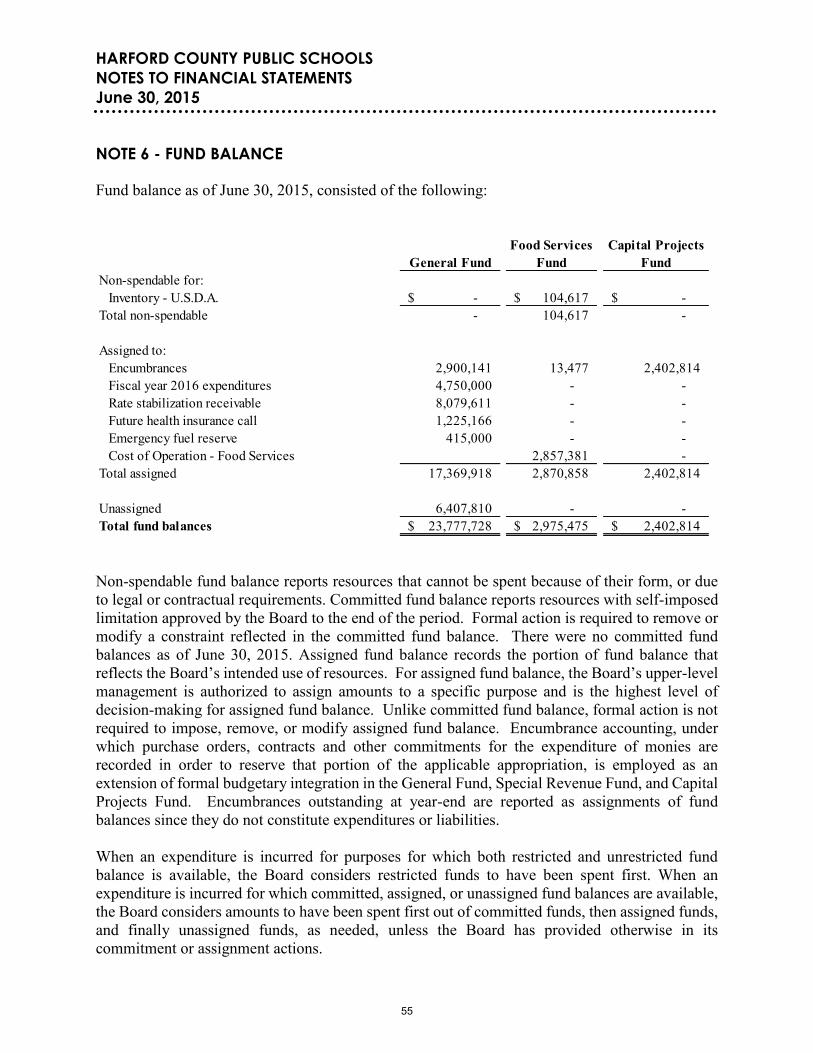
HARFORD COUNTY PUBLIC SCHOOLS
NOTES TO FINANCIAL STATEMENTS
June 30, 2015
NOTE 6 - FUND BALANCE Fund balance as of June 30, 2015, consisted of the following:
Non-spendable fund balance reports resources that cannot be spent because of their form, or due to legal or contractual requirements. Committed fund balance reports resources with self-imposed limitation approved by the Board to the end of the period. Formal action is required to remove or modify a constraint reflected in the committed fund balance. There were no committed fund balances as of June 30, 2015. Assigned fund balance records the portion of fund balance that reflects the Board’s intended use of resources. For assigned fund balance, the Board’s upper-level management is authorized to assign amounts to a specific purpose and is the highest level of decision-making for assigned fund balance. Unlike committed fund balance, formal action is not required to impose, remove, or modify assigned fund balance. Encumbrance accounting, under which purchase orders, contracts and other commitments for the expenditure of monies are recorded in order to reserve that portion of the applicable appropriation, is employed as an extension of formal budgetary integration in the General Fund, Special Revenue Fund, and Capital Projects Fund. Encumbrances outstanding at year-end are reported as assignments of fund balances since they do not constitute expenditures or liabilities. When an expenditure is incurred for purposes for which both restricted and unrestricted fund balance is available, the Board considers restricted funds to have been spent first. When an expenditure is incurred for which committed, assigned, or unassigned fund balances are available, the Board considers amounts to have been spent first out of committed funds, then assigned funds, and finally unassigned funds, as needed, unless the Board has provided otherwise in its commitment or assignment actions.
Food Services Capital ProjectsGeneral Fund Fund Fund
Non-spendable for: Inventory - U.S.D.A. -$ 104,617$ -$ Total non-spendable - 104,617 -
Assigned to: Encumbrances 2,900,141 13,477 2,402,814 Fiscal year 2016 expenditures 4,750,000 - - Rate stabilization receivable 8,079,611 - - Future health insurance call 1,225,166 - - Emergency fuel reserve 415,000 - - Cost of Operation - Food Services 2,857,381 - Total assigned 17,369,918 2,870,858 2,402,814
Unassigned 6,407,810 - - Total fund balances 23,777,728$ 2,975,475$ 2,402,814$
55
HARFORD COUNTY PUBLIC SCHOOLS
NOTES TO FINANCIAL STATEMENTS
June 30, 2015
NOTE 7 - PENSION PLANS General Information about the Pension Plan Plan Description Teachers employed by the Board are provided with pensions through the Teachers’ Pension System of the State of Maryland (TPS)—a cost-sharing multiple-employer defined benefit pension plan administered by the Maryland State Retirement and Pension System (MSRPS).Certain employees of the Board are provided with pensions through the Employees Retirement System of the State of Maryland (ERS)—a cost-sharing multiple-employer defined benefit pension plan administered by the Maryland State Retirement and Pension System (MSRPS). The State Personnel and Pensions Article of the Annotated Code of Maryland (the Article) grants the authority to establish and amend the benefit terms of TPS and ERS to the MSRPS Board of Trustees. MSRPS issues a publicly available financial report that can be obtained at www.sra.state.md.us/Agency/Downloads/CAFR/. Benefits Provided A member of either the Teachers’ or Employees’ Retirement System is generally eligible for full retirement benefits upon the earlier of attaining age 60 or accumulating 30 years of creditable service regardless of age. The annual retirement allowance equals 1/55 (1.81%) of the member’s Average Final Compensation (AFC) multiplied by the number of years of accumulated creditable service. An individual who is a member of either the Teachers’ or Employees’ Pension System on or before June 30, 2011, is eligible for full retirement benefits upon the earlier of attaining age 62, with specified years of eligibility service, or accumulating 30 years of eligibility service regardless of age. An individual who becomes a member of either the Teachers’ or Employees’ Pension System on or after July 1, 2011, is eligible for full retirement benefits if the member’s combined age and eligibility service equals at least 90 years or if the member is at least age 65 and has accrued at least 10 years of eligibility service. For most individuals who retired from either the Teachers’ or Employees’ Pension System on or before June 30, 2006, the annual pension allowance equals 1.2% of the member’s AFC, multiplied by the number of years of creditable service accumulated prior to July 1, 1998, plus 1.4% of the member’s AFC, multiplied by the number of years of creditable service accumulated subsequent to June 30, 1998. With certain exceptions, for individuals who are members of the Teachers’ or Employees’ Pension System on or after July 1, 2006, the annual pension allowance equals 1.2% of the member’s AFC, multiplied by the number of years of creditable service accumulated prior to July 1, 1998, plus 1.8% of the member’s AFC, multiplied by the number of years of creditable service accumulated subsequent to June 30, 1998. Beginning July 1, 2011, any new member of the Teachers’ or Employees’ Pension System shall earn an annual pension allowance equal to 1.5% of the member’s AFC multiplied by the number of years of creditable service accumulated as a member of the Teachers’ or Employees’ Pension System.
56
HARFORD COUNTY PUBLIC SCHOOLS
NOTES TO FINANCIAL STATEMENTS
June 30, 2015
NOTE 7 - PENSION PLANS (continued) General Information about the Pension Plan (continued) Benefits Provided (continued) Exceptions to these benefit formulas apply to members of the Employees’ Pension System, who are employed by a participating governmental unit that does not provide the 1998 or 2006 enhanced pension benefits or the 2011 reformed pension benefits. The pension allowance for these members equals 0.8% of the member’s AFC up to the social security integration level (SSIL), plus 1.5% of the member’s AFC in excess of the SSIL, multiplied by the number of years of accumulated creditable service. For the purpose of computing pension allowances, the SSIL is the average of the social security wage bases for the past 35 calendar years ending with the year the retiree separated from service. Early Service Retirement A member of either the Teachers’ or Employees’ Retirement System may retire with reduced benefits after completing 25 years of eligibility service. Benefits are reduced by 0.5% per month for each month remaining until the retiree either attains age 60 or would have accumulated 30 years of creditable service, whichever is less. The maximum reduction for a Teachers’ or Employees’ Retirement System member is 30%. An individual who is a member of either the Teachers’ or Employees’ Pension System on or before June 30, 2011, may retire with reduced benefits upon attaining age 55 with at least 15 years of eligibility service. Benefits are reduced by 0.5% per month for each month remaining until the retiree attains age 62. The maximum reduction for these members of the Teachers’ or Employees’ Pension System is 42%. An individual who becomes a member of either the Teachers’ or Employees’ Pension System on or after July 1, 2011, may retire with reduced benefits upon attaining age 60 with at least 15 years of eligibility service. Benefits are reduced by 0.5% per month for each month remaining until the retiree attains age 65. The maximum reduction for these members of the Teachers’ or Employees’ Pension System is 30%. Disability and Death Benefits Generally, a member covered under retirement plan provisions who is permanently disabled after 5 years of service receives a service allowance based on a minimum percentage (usually 25%) of the member’s AFC. A member covered under pension plan provisions who is permanently disabled after accumulating 5 years of eligibility service receives a service allowance computed as if service had continued with no change in salary until the retiree attained age 62. Death benefits are equal to a member’s annual salary as of the date of death plus all member contributions and interest. Cost of Living Adjustment The benefit attributable to service on or after July 1, 2011 now will be subject to different cost-of-living adjustments (COLA) that is based on the increase in the Consumer Price Index (CPI) and capped at 2.5% or 1.0% based on whether the market value investment return for the preceding calendar year was higher or lower than the investment return assumption used in the valuation.
57
HARFORD COUNTY PUBLIC SCHOOLS
NOTES TO FINANCIAL STATEMENTS
June 30, 2015
NOTE 7 - PENSION PLANS (continued) General Information about the Pension Plan (continued) Contributions (ERS) The Article sets contribution requirements of the active employees and the participating governmental units are established and may be amended by the MSRPS Board. Employees are required to contribute 7% of their annual pay. The Board’s contractually required contribution rate for ERS for the year ended June 30, 2015, was approximately $2.7 million, actuarially determined as an amount that, when combined with employee contributions, is expected to finance the costs of benefits earned by employees during the year, with an additional amount to finance any unfunded accrued liability. Contributions to ERS from the Board was approximately $2.7 million for the year ended June 30, 2015. Contributions (TPS) The Article sets contribution requirements of the active employees and the participating governmental units are established and may be amended by the MSRPS Board. Employees are required to contribute 7% of their annual pay. The State of Maryland is responsible for the net pension liability of TPS. The Board’s required contribution is for the normal cost and does not include any contribution for past service cost. As such, the State of Maryland is responsible for 100% of the net pension liability related to TPS and qualifies for as a special funding situation. The State of Maryland’s contribution on behalf of the Board for the year ended June 30, 2015 was approximately $29.3 million. The Board’s contractually required contribution rate for TPS for the year ended June 30, 2015, was approximately $9.0 million, actuarially determined as an amount that, when combined with the State of Maryland and employee contributions, is expected to finance the costs of benefits earned by employees during the year, with an additional amount to finance any unfunded accrued liability (State only). Contributions to ERS from the Board was approximately $9.0 million for the year ended June 30, 2015.
58
HARFORD COUNTY PUBLIC SCHOOLS
NOTES TO FINANCIAL STATEMENTS
June 30, 2015
NOTE 7 - PENSION PLANS (continued) Pension Liabilities, Pension Expense, and Deferred Outflows of Resources and Deferred Inflows of Resources Related to Pensions As of June 30, 2015, the Board reported a liability of approximately $20.8 million for its proportionate share of the ERS net pension liability. The ERS net pension liability was measured as of June 30, 2014, and the total pension liability used to calculate the net pension liability was determined by an actuarial valuation as of that date. The Board’s proportion of the ERS net pension liability was based on a projection of the Board’s long-term share of contributions to the pension plan relative to the projected contributions of all participating government units, actuarially determined. As of June 30, 2015, the Board’s proportion for ERS was 0.12 percent, which was substantially the same from its proportion measured as of June 30, 2014. For the year ended June 30, 2015, the Board recognized pension expense for ERS of approximately $2.6 million. As of June 30, 2015, the Board reported deferred outflows of resources and deferred inflows of resources related to ERS from the following sources:
$2,679,603 reported as deferred outflows of resources related to ERS resulting from Board contributions subsequent to the measurement date will be recognized as a reduction of the ERS net pension liability in the year ended June 30, 2016. Other amounts reported as deferred outflows of resources and deferred inflows of resources related to ERS will be recognized in pension expense as follows: Changes in assumptions: Fiscal years 2016-2019, $75,080 per year; Difference between projected and actual earnings on pension plan investments: Fiscal years 2016-2019, $568,101 per year. As of June 30, 2015, the State of Maryland’s proportionate share of the TPS net pension liability associated with Board is approximately $275,650,000. The TPS net pension liability was measured as of June 30, 2014, and the total pension liability used to calculate the net pension liability was determined by an actuarial valuation as of that date. State of Maryland’s proportionate share of the TPS net pension liability associated with Board was based on a projection of the State’s long-term share of contributions to the pension plan relative to the projected contributions of all participating government units, actuarially determined.
Deferred Outflows Deferred Inflowsof Resources of Resources
Changes of assumptions 300,321$ -$ Net difference between projected and actualearnings on pension plan investments - 2,272,407 Total 300,321$ 2,272,407$
59
HARFORD COUNTY PUBLIC SCHOOLS
NOTES TO FINANCIAL STATEMENTS
June 30, 2015
NOTE 7 - PENSION PLANS (continued) Pension Liabilities, Pension Expense, and Deferred Outflows of Resources and Deferred Inflows of Resources Related to Pensions (continued) Information Included in the MSRPS Financial Statements Actuarial assumptions, long-term expected rate of return on pension plan investments, discount rate, and pension plan fiduciary net position are available at www.sra.state.md.us/Agency/Downloads/CAFR/. Sensitivity of the Board’s Proportionate Share of the Net Pension Liability to Changes in the Discount Rate. The Board’s proportionate share of the ERS net pension liability calculated using the discount rate of 7.65 percent is $20,760,817. Additionally, the Board’s proportionate share of the ERS net pension liability if it were calculated using a discount rate that is 1-percentage-point lower (6.65 percent) is $29,918,952 or 1-percentage-point higher (8.65 percent) is $13,089,724. NOTE 8 - POSTEMPLOYMENT BENEFITS OTHER THAN PENSION BENEFITS The Board provides medical, dental and life insurance benefits to eligible employees upon retirement. The employer’s contributions are financed on a pay-as-you-go basis, and the future payment of these benefits is contingent upon the annual approval of the operating budget. Details of the postemployment benefits provided are as follows: Medical Benefits - Retirees are eligible for continued membership in one of the school system’s group medical plans provided that they have at least 10 years of service with the Board and are under 65 years of age. The Board pays either 85% or 90% of these medical insurance premiums, based on the plan chosen by the retiree. The Board pays 90% of the insurance premiums for Medicare supplemental insurance for retirees age 65 and older. The medical benefits paid by the Board for the year ended June 30, 2015 was $21,281,009. As of June 30, 2015, 2,306 of approximately 2,506 eligible retirees were receiving benefits. Dental Benefits - The Board pays 90% of dental insurance premiums for retirees with at least 10 years service. The dental benefits paid by the Board for the year ended June 30, 2015 was $1,067,883. As of June 30, 2015, 2,347 of approximately 2,506 eligible retirees were receiving benefits. Life Insurance Benefits - The Board pays 90% of the life insurance premiums for retirees with at least 10 years of service. The amount of insurance coverage is reduced to $20,000 upon retirement and $10,000 five years after retirement. The life insurance benefits paid by the Board for the year ended June 30, 2015 was $57,889. As of June 30, 2015, 2,186 of approximately 2,506 eligible retirees were receiving benefits.
60
HARFORD COUNTY PUBLIC SCHOOLS
NOTES TO FINANCIAL STATEMENTS
June 30, 2015
NOTE 8 - POSTEMPLOYMENT BENEFITS OTHER THAN PENSION BENEFITS (continued) The Board participates in the Maryland Association of Boards of Education (MABE) pooled OPEB investment trust. It is a member owned trust that provides the Board and the other nine member boards a structure to pool assets to reduce investment costs and share administrative expenses. Annual OPEB Cost and Net OPEB Obligation The Board's annual other postemployment benefit (OPEB) cost (expense) is calculated based on the annual required contribution of the employer (ARC), an amount actuarially determined in accordance with the parameters of GASB Statement 45. The ARC represents a level of funding that, if paid on an ongoing basis, is projected to cover normal cost each year and amortize any unfunded actuarial liabilities (or funding excess) over a period not to exceed thirty years. The following table shows the components of the Board's annual OPEB cost for the year ended June 30, 2015, the amount actually contributed to the plan, and changes in the Board's net OPEB obligation:
The Board's annual OPEB cost, the percentage of annual OPEB cost contributed to the plan, and the net OPEB obligation for the last three years was as follows:
Annual required contribution 57,802,000$ Interest on net OPEB Obligation 8,998,000 Amortization of net OPEB obligation (10,230,000) Annual OPEB cost (expense) 56,570,000 Contributions made 24,568,000 Increase in net OPEB obligation 32,002,000 Net OPEB obligation - beginning of year 199,962,929 Net OPEB obligation - end of year 231,964,929$
Fiscal Year Annual Percentage of Annual Net OPEBEnded OPEB Cost OPEB Cost Contributed Obligation
6/30/2015 56,570,000$ 43.40% 231,964,929$ 6/30/2014 59,125,000 37.12% 199,962,929 6/30/2013 55,980,000 36.81% 162,782,929
61
HARFORD COUNTY PUBLIC SCHOOLS
NOTES TO FINANCIAL STATEMENTS
June 30, 2015
NOTE 8 - POSTEMPLOYMENT BENEFITS OTHER THAN PENSION BENEFITS (continued) Funded Status and Funding Progress As of July 1, 2014, the plan was 4.75% funded. The actuarial accrued liability for benefits was $673,727,000, and the actuarial value of assets was $31,986,622, resulting in an unfunded actuarial accrued liability (UAAL) of $641,740,378. The covered payroll (annual payroll of active employees covered by the plan) was $262,513,165, and the ratio of the UAAL to the covered payroll was 244.46%. Actuarial valuations of an ongoing plan involve estimates of the value of reported amounts and assumptions about the probability of occurrence of events far into the future. Examples include assumptions about future employment, mortality, and the healthcare cost trend. Amounts determined regarding the funded status of the plan and the annual required contributions of the employer are subject to continual revision as actual results are compared with past expectations and new estimates are made about the future. The schedule of funding progress, presented as required supplementary information following the notes to the financial statements, presents multi-year trend information about whether the actuarial value of plan assets is increasing or decreasing over time relative to the actuarial accrued liabilities for benefits. Actuarial Methods and Assumptions Projections of benefits for financial reporting purposes are based on the substantive plan (the plan as understood by the employer and the plan members) and include the types of benefits provided at the time of each valuation and the historical pattern of sharing of benefit costs between the employer and plan members to that point. The actuarial methods and assumptions used include techniques that are designed to reduce the effects of short-term volatility in actuarial accrued liabilities and the actuarial value of assets, consistent with the long-term perspective of the calculations. Significant valuation methods and assumptions are as follows:
Valuation Date July 1, 2014 Actuarial Cost Method Projected Unit Credit method Amortization Method Closed, level percent of payroll over 24 years (as of 7/1/14) Asset Valuation Method Market value of Assets Actuarial Assumptions: Discount Rate 4.50% Investment Rate of Return 7.00% per year compounded annually Payroll Growth Rate 3.00% Inflation Rate 2.80% Healthcare Cost Trend Rates: Medical and prescription 8.00% initial year of valuation (not applicable to Life) 4.30% final year of valuation (not applicable to Life) Dental 5.00%
The actuarial value of assets was determined using market value of assets. The trust is assumed to earn 7% interest and contributions are assumed to be made in the middle of the year.
62
HARFORD COUNTY PUBLIC SCHOOLS
NOTES TO FINANCIAL STATEMENTS
June 30, 2015
NOTE 8 - POSTEMPLOYMENT BENEFITS OTHER THAN PENSION BENEFITS (continued) Actuarial Methods and Assumptions (continued) The unfunded liability was amortized over a closed period of 24 years using level percentage of pay for the fiscal year ended June 30, 2015.
Schedule of Funding Progress
Valuations prior to June 30, 2008, were not valued in accordance with GASB Statement No. 43.
NOTE 9 - RISK MANAGEMENT The Board is exposed to various risks of loss related to torts; theft of, damage to, and destruction of assets; errors and omissions; injuries to employees; and natural disasters for which the Board participates in the Maryland Association of Boards of Education (MABE) Group Insurance Pool and the Worker’s Compensation Self Insurance Fund. These public entity risk pools are self-insurance funds for the various member Maryland Boards of Education to minimize the cost of insurance and related administrative expenses. Coverage is provided up to specified limits and the Board pays an annual premium for the coverage provided. In addition to general liability insurance, the Group Insurance Pool also provides coverage for property liability and automobile liability. Coverage above these limits is provided by third party insurance carriers. Settled claims have not exceeded commercial insurance coverage in any of the past three fiscal years.
UAAL as a %Value of Accrued Unfunded Funded Covered of CoveredAssets Liability (AAL) AAL (UAAL) Ratio Payroll Payroll
June 30, 2008 12,136,368$ 361,962,000$ 349,825,632$ 3.35% 274,153,946$ 127.60%July 1, 2008 12,136,368 589,795,000 577,658,632 2.06% 278,038,509 207.76%July 1, 2009 10,233,348 626,155,000 615,921,652 1.63% 278,636,614 221.05%July 1, 2010 10,962,506 534,277,000 523,314,494 2.05% 278,479,993 187.92%July 1, 2011 15,255,626 462,698,000 447,442,374 3.30% 276,823,307 161.63%July 1, 2012 23,541,000 660,933,000 637,392,000 3.56% 273,638,115 232.93%July 1, 2013 28,024,880 696,905,000 668,880,120 4.02% 265,952,457 251.50%July 1, 2014 31,986,622 673,727,000 641,740,378 4.75% 262,514,165 244.46%
63
HARFORD COUNTY PUBLIC SCHOOLS
NOTES TO FINANCIAL STATEMENTS
June 30, 2015
NOTE 10 - CONTINGENCIES AND COMMITMENTS The Board has been named as defendant in several lawsuits in the normal course of business, the outcomes of which are uncertain. It is anticipated by the Board that an adverse decision on any or all of these suits would not have a material adverse effect on these financial statements. The Board leases certain equipment and properties for storage and other uses under long-term operating leases. Expenditures under operating leases amounted to approximately $1,296,832 for the year ended June 30, 2015.
NOTE 11- IMPLEMENTATION OF NEW ACCOUNTING PRINCIPLES The Board adopted Governmental Accounting Standard Board (GASB) Statement No. 68, entitled Accounting and Financial Reporting for Pensions, an amendment of GASB Statement No. 27, Statement No. 69, entitled Government Combinations and Disposals of Government Operations, and Statement No. 71, entitled Pension Transition for Contributions Made Subsequent to the Measurement Date—an amendment of GASB Statement No. 68. Net position of governmental activities has been restated by a negative $20,162,753, due to the implementation of GASB Statements No. 68 and 71 in recording the beginning net pension liability and the beginning deferred outflow of resources for contributions subsequent to the measurement date for all the defined benefit pension plans. As of the year ended June 30, 2015, GASB issued Statement No. 72, entitled Fair Value Measurement and Application; Statement No. 73, entitled Accounting and Financial Reporting for Pensions and Related Assets That are Not within the Scope of GASB Statement 68, and Amendments to certain Provisions of GASB Statements 67 and 68; GASB Statement No. 74 entitled, Financial Reporting For Postemployment Benefit Plans Other Than Pension Plans; GASB Statement No. 75 entitled, Accounting and Financial Reporting for Postemployment Benefits Other Than Pensions; GASB Statement No. 76 entitled, The Hierarchy of Generally Accepted Accounting Principles for State and Local Governments. These statements may have a material effect on the County’s financial statements once implemented. The County will be analyzing the effects of these pronouncements and plans to adopt them a applicable by their effective date.
64

Required Supplemental Information
Elisha Burkes, Grade 10, Aberdeen High School
Teacher: Richard Morris
65
HARFORD COUNTY PUBLIC SCHOOLS
REQUIRED SUPPLEMENTARY INFORMATION
FOR OTHER POSTEMPLOYMENT BENEFIT PLAN
June 30, 2015
Schedule of Funding Progress
UAAL as a %Value of Accrued Unfunded Funded Covered of CoveredAssets Liability (AAL) AAL (UAAL) Ratio Payroll Payroll
June 30, 2008 12,136,368$ 361,962,000$ 349,825,632$ 3.35% 274,153,946$ 127.60%July 1, 2008 12,136,368 589,795,000 577,658,632 2.06% 278,038,509 207.76%July 1, 2009 10,233,348 626,155,000 615,921,652 1.63% 278,636,614 221.05%July 1, 2010 10,962,506 534,277,000 523,314,494 2.05% 278,479,993 187.92%July 1, 2011 15,255,626 462,698,000 447,442,374 3.30% 276,823,307 161.63%July 1, 2012 23,541,000 660,933,000 637,392,000 3.56% 273,638,115 232.93%July 1, 2013 28,024,880 696,905,000 668,880,120 4.02% 265,952,457 251.50%July 1, 2014 31,986,622 673,727,000 641,740,378 4.75% 262,514,165 244.46%
66
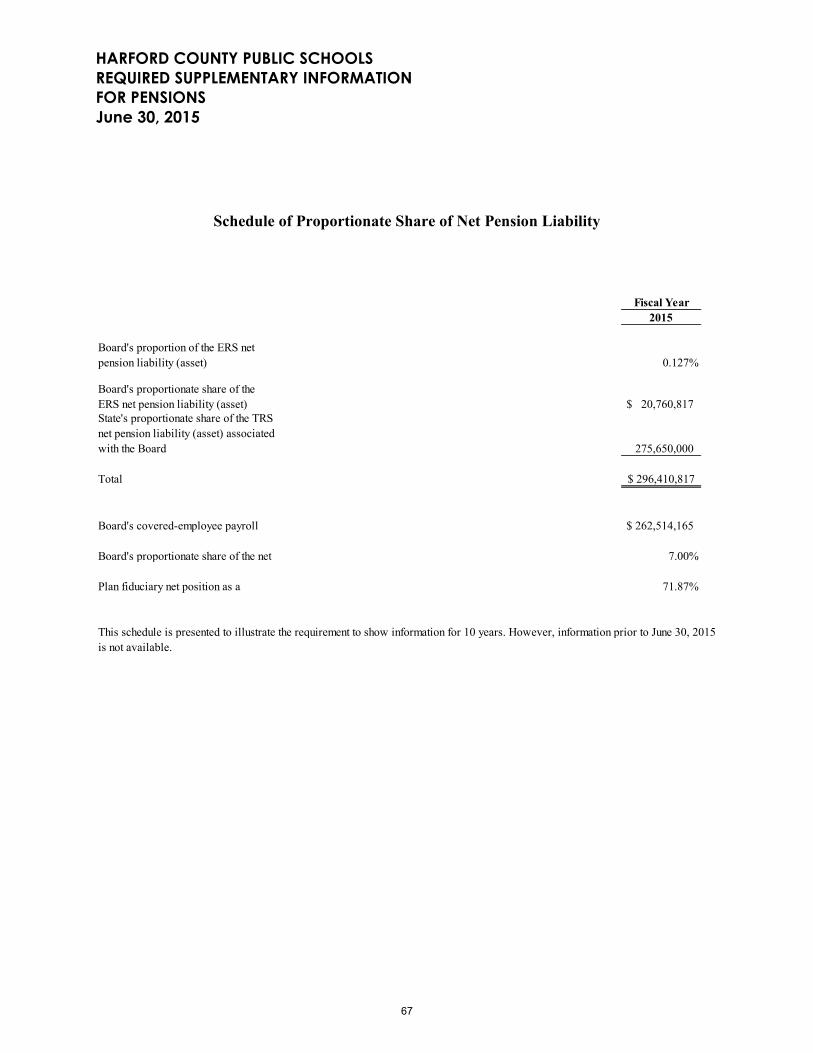
HARFORD COUNTY PUBLIC SCHOOLS
REQUIRED SUPPLEMENTARY INFORMATION
FOR PENSIONS
June 30, 2015
Schedule of Proportionate Share of Net Pension Liability
Fiscal Year2015
0.127%
$ 20,760,817
275,650,000
296,410,817$
$ 262,514,165
7.00%
71.87%
This schedule is presented to illustrate the requirement to show information for 10 years. However, information prior to June 30, 2015is not available.
Plan fiduciary net position as a
Board's proportion of the ERS net pension liability (asset)
Board's proportionate share of the ERS net pension liability (asset)State's proportionate share of the TRS net pension liability (asset) associated with the Board
Total
Board's covered-employee payroll
Board's proportionate share of the net
67
HARFORD COUNTY PUBLIC SCHOOLS
REQUIRED SUPPLEMENTARY INFORMATION
FOR PENSIONS
June 30, 2015
Schedule of Contributions
Fiscal Year2015
Contractually required contribution (ERS)
2,726,147$
Contributions in relation to the contractually required contribution (2,726,147)
Contribution deficiency (excess) -$
Board's covered-employee payroll 262,514,165$
Contributions as a percentage of covered-employee payroll 1.04%
This schedule is presented to illustrate the requirement to show information for 10 years. However, information prior to June 30, 2015is not available.
Jace Williams, Grade 2, Red Pump Elementary School
Teacher: Sharon Boyle
68

Other Supplemental Information
Sasha Taylor, Grade K, Riverside Elementary School
Teacher: Alice Flaherty
69
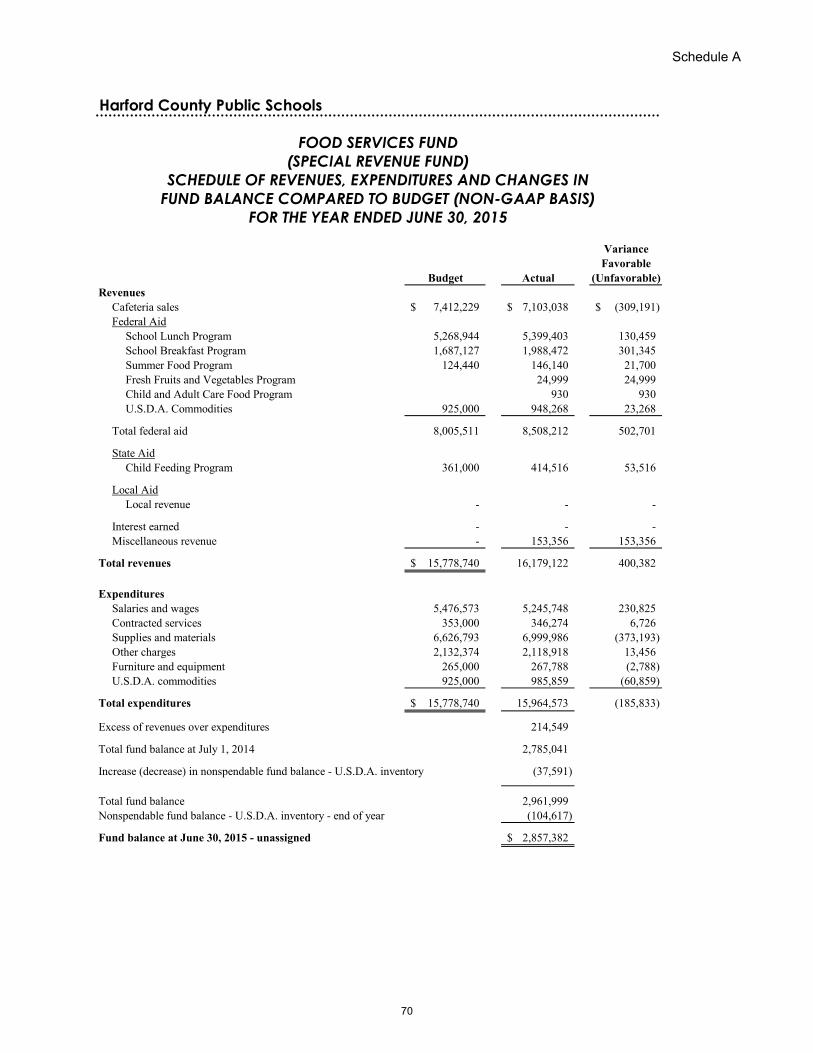
Schedule A
Harford County Public Schools
VarianceFavorable
Budget Actual (Unfavorable)Revenues
Cafeteria sales 7,412,229$ 7,103,038$ (309,191)$ Federal Aid
School Lunch Program 5,268,944 5,399,403 130,459 School Breakfast Program 1,687,127 1,988,472 301,345 Summer Food Program 124,440 146,140 21,700 Fresh Fruits and Vegetables Program 24,999 24,999 Child and Adult Care Food Program 930 930 U.S.D.A. Commodities 925,000 948,268 23,268
Total federal aid 8,005,511 8,508,212 502,701
State AidChild Feeding Program 361,000 414,516 53,516
Local AidLocal revenue - - -
Interest earned - - - Miscellaneous revenue - 153,356 153,356
Total revenues 15,778,740$ 16,179,122 400,382
ExpendituresSalaries and wages 5,476,573 5,245,748 230,825 Contracted services 353,000 346,274 6,726 Supplies and materials 6,626,793 6,999,986 (373,193) Other charges 2,132,374 2,118,918 13,456 Furniture and equipment 265,000 267,788 (2,788) U.S.D.A. commodities 925,000 985,859 (60,859)
Total expenditures 15,778,740$ 15,964,573 (185,833)
Excess of revenues over expenditures 214,549
Total fund balance at July 1, 2014 2,785,041
Increase (decrease) in nonspendable fund balance - U.S.D.A. inventory (37,591)
Total fund balance 2,961,999 Nonspendable fund balance - U.S.D.A. inventory - end of year (104,617)
Fund balance at June 30, 2015 - unassigned 2,857,382$
FOOD SERVICES FUND
(SPECIAL REVENUE FUND)
SCHEDULE OF REVENUES, EXPENDITURES AND CHANGES IN
FUND BALANCE COMPARED TO BUDGET (NON-GAAP BASIS)
FOR THE YEAR ENDED JUNE 30, 2015
70
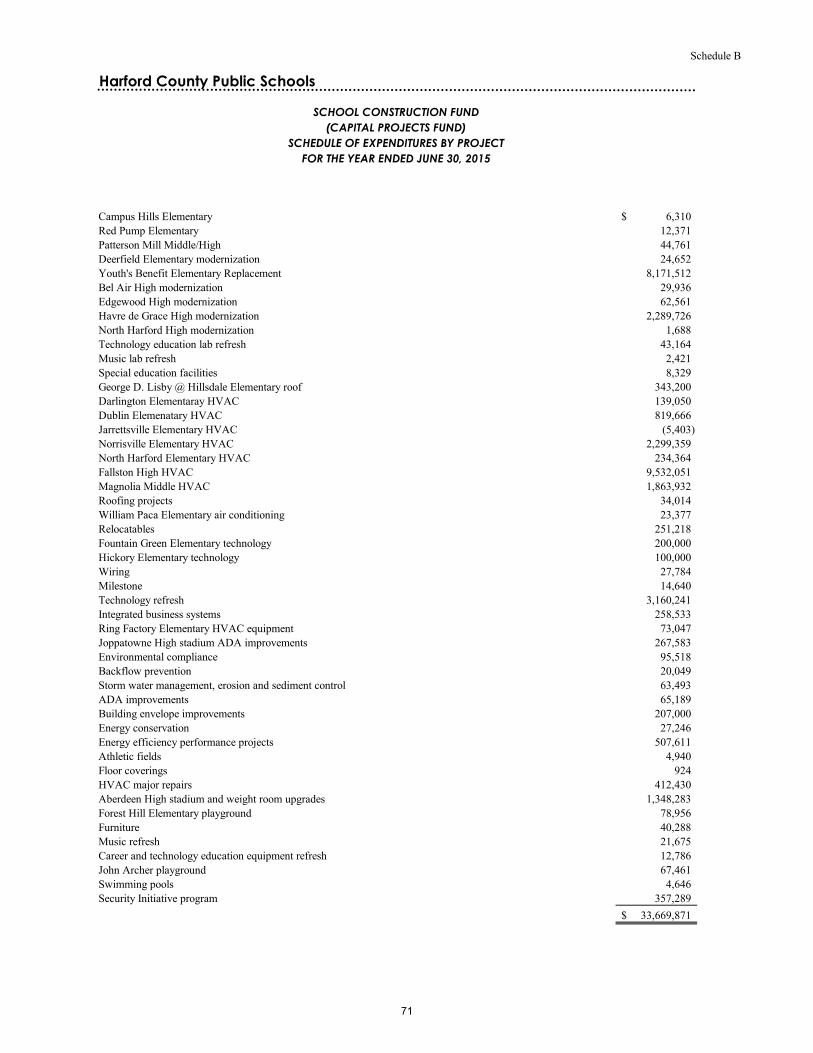
Schedule B
Harford County Public Schools
Campus Hills Elementary 6,310$ Red Pump Elementary 12,371 Patterson Mill Middle/High 44,761 Deerfield Elementary modernization 24,652 Youth's Benefit Elementary Replacement 8,171,512 Bel Air High modernization 29,936 Edgewood High modernization 62,561 Havre de Grace High modernization 2,289,726 North Harford High modernization 1,688 Technology education lab refresh 43,164 Music lab refresh 2,421 Special education facilities 8,329 George D. Lisby @ Hillsdale Elementary roof 343,200 Darlington Elementaray HVAC 139,050 Dublin Elemenatary HVAC 819,666 Jarrettsville Elementary HVAC (5,403) Norrisville Elementary HVAC 2,299,359 North Harford Elementary HVAC 234,364 Fallston High HVAC 9,532,051 Magnolia Middle HVAC 1,863,932 Roofing projects 34,014 William Paca Elementary air conditioning 23,377 Relocatables 251,218 Fountain Green Elementary technology 200,000 Hickory Elementary technology 100,000 Wiring 27,784 Milestone 14,640 Technology refresh 3,160,241 Integrated business systems 258,533 Ring Factory Elementary HVAC equipment 73,047 Joppatowne High stadium ADA improvements 267,583 Environmental compliance 95,518 Backflow prevention 20,049 Storm water management, erosion and sediment control 63,493 ADA improvements 65,189 Building envelope improvements 207,000 Energy conservation 27,246 Energy efficiency performance projects 507,611 Athletic fields 4,940 Floor coverings 924 HVAC major repairs 412,430 Aberdeen High stadium and weight room upgrades 1,348,283 Forest Hill Elementary playground 78,956 Furniture 40,288 Music refresh 21,675 Career and technology education equipment refresh 12,786 John Archer playground 67,461 Swimming pools 4,646 Security Initiative program 357,289
33,669,871$
SCHOOL CONSTRUCTION FUND
(CAPITAL PROJECTS FUND)
SCHEDULE OF EXPENDITURES BY PROJECT
FOR THE YEAR ENDED JUNE 30, 2015
71
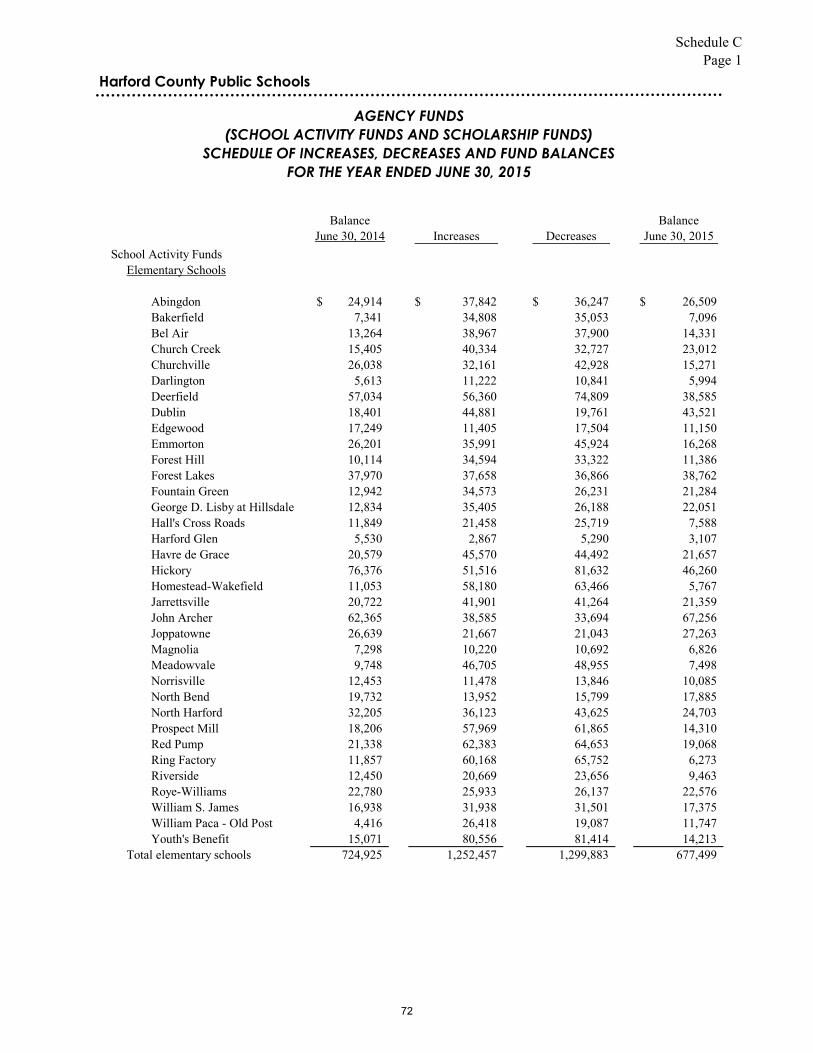
Schedule CPage 1
Balance BalanceJune 30, 2014 Increases Decreases June 30, 2015
School Activity FundsElementary Schools
Abingdon 24,914$ 37,842$ 36,247$ 26,509$ Bakerfield 7,341 34,808 35,053 7,096 Bel Air 13,264 38,967 37,900 14,331 Church Creek 15,405 40,334 32,727 23,012 Churchville 26,038 32,161 42,928 15,271 Darlington 5,613 11,222 10,841 5,994 Deerfield 57,034 56,360 74,809 38,585 Dublin 18,401 44,881 19,761 43,521 Edgewood 17,249 11,405 17,504 11,150 Emmorton 26,201 35,991 45,924 16,268 Forest Hill 10,114 34,594 33,322 11,386 Forest Lakes 37,970 37,658 36,866 38,762 Fountain Green 12,942 34,573 26,231 21,284 George D. Lisby at Hillsdale 12,834 35,405 26,188 22,051 Hall's Cross Roads 11,849 21,458 25,719 7,588 Harford Glen 5,530 2,867 5,290 3,107 Havre de Grace 20,579 45,570 44,492 21,657 Hickory 76,376 51,516 81,632 46,260 Homestead-Wakefield 11,053 58,180 63,466 5,767 Jarrettsville 20,722 41,901 41,264 21,359 John Archer 62,365 38,585 33,694 67,256 Joppatowne 26,639 21,667 21,043 27,263 Magnolia 7,298 10,220 10,692 6,826 Meadowvale 9,748 46,705 48,955 7,498 Norrisville 12,453 11,478 13,846 10,085 North Bend 19,732 13,952 15,799 17,885 North Harford 32,205 36,123 43,625 24,703 Prospect Mill 18,206 57,969 61,865 14,310 Red Pump 21,338 62,383 64,653 19,068 Ring Factory 11,857 60,168 65,752 6,273 Riverside 12,450 20,669 23,656 9,463 Roye-Williams 22,780 25,933 26,137 22,576 William S. James 16,938 31,938 31,501 17,375 William Paca - Old Post 4,416 26,418 19,087 11,747 Youth's Benefit 15,071 80,556 81,414 14,213
Total elementary schools 724,925 1,252,457 1,299,883 677,499
FOR THE YEAR ENDED JUNE 30, 2015
Harford County Public Schools
AGENCY FUNDS
SCHEDULE OF INCREASES, DECREASES AND FUND BALANCES
(SCHOOL ACTIVITY FUNDS AND SCHOLARSHIP FUNDS)
72
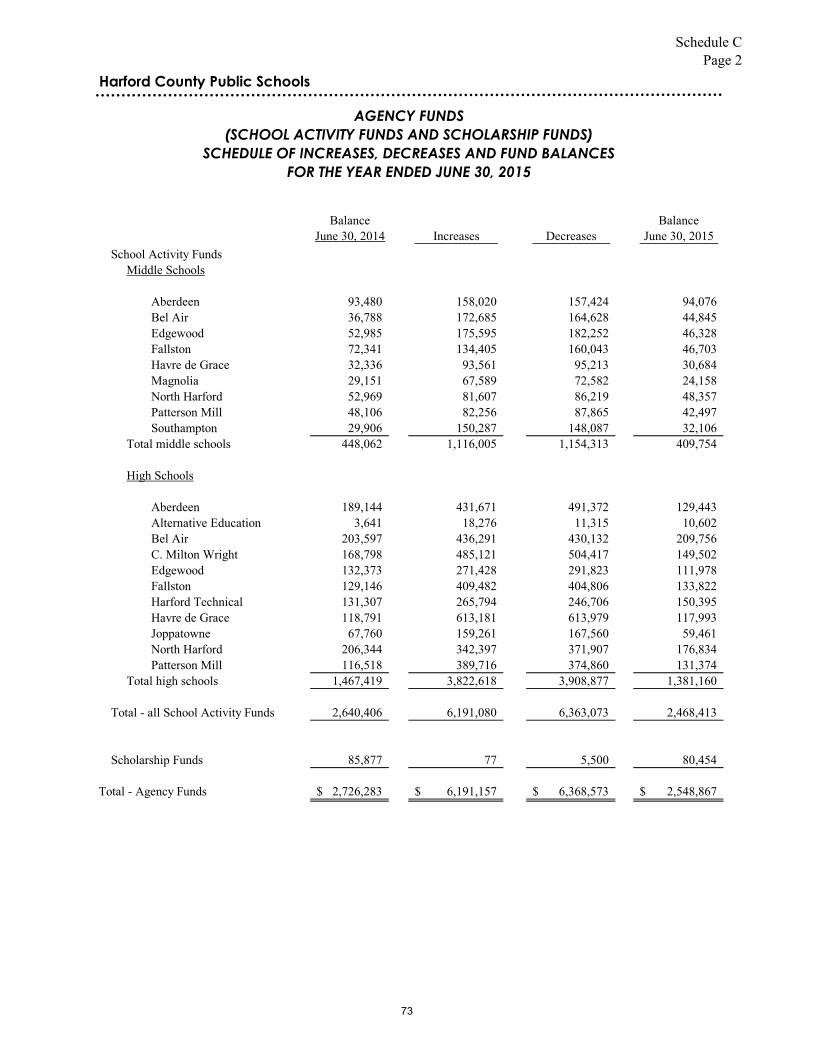
Schedule CPage 2
Balance BalanceJune 30, 2014 Increases Decreases June 30, 2015
School Activity Funds
FOR THE YEAR ENDED JUNE 30, 2015
Harford County Public Schools
AGENCY FUNDS
SCHEDULE OF INCREASES, DECREASES AND FUND BALANCES
(SCHOOL ACTIVITY FUNDS AND SCHOLARSHIP FUNDS)
Middle Schools
Aberdeen 93,480 158,020 157,424 94,076 Bel Air 36,788 172,685 164,628 44,845 Edgewood 52,985 175,595 182,252 46,328 Fallston 72,341 134,405 160,043 46,703 Havre de Grace 32,336 93,561 95,213 30,684 Magnolia 29,151 67,589 72,582 24,158 North Harford 52,969 81,607 86,219 48,357 Patterson Mill 48,106 82,256 87,865 42,497 Southampton 29,906 150,287 148,087 32,106
Total middle schools 448,062 1,116,005 1,154,313 409,754
High Schools
Aberdeen 189,144 431,671 491,372 129,443 Alternative Education 3,641 18,276 11,315 10,602 Bel Air 203,597 436,291 430,132 209,756 C. Milton Wright 168,798 485,121 504,417 149,502 Edgewood 132,373 271,428 291,823 111,978 Fallston 129,146 409,482 404,806 133,822 Harford Technical 131,307 265,794 246,706 150,395 Havre de Grace 118,791 613,181 613,979 117,993 Joppatowne 67,760 159,261 167,560 59,461 North Harford 206,344 342,397 371,907 176,834 Patterson Mill 116,518 389,716 374,860 131,374
Total high schools 1,467,419 3,822,618 3,908,877 1,381,160
Total - all School Activity Funds 2,640,406 6,191,080 6,363,073 2,468,413
Scholarship Funds 85,877 77 5,500 80,454
Total - Agency Funds 2,726,283$ 6,191,157$ 6,368,573$ 2,548,867$
73
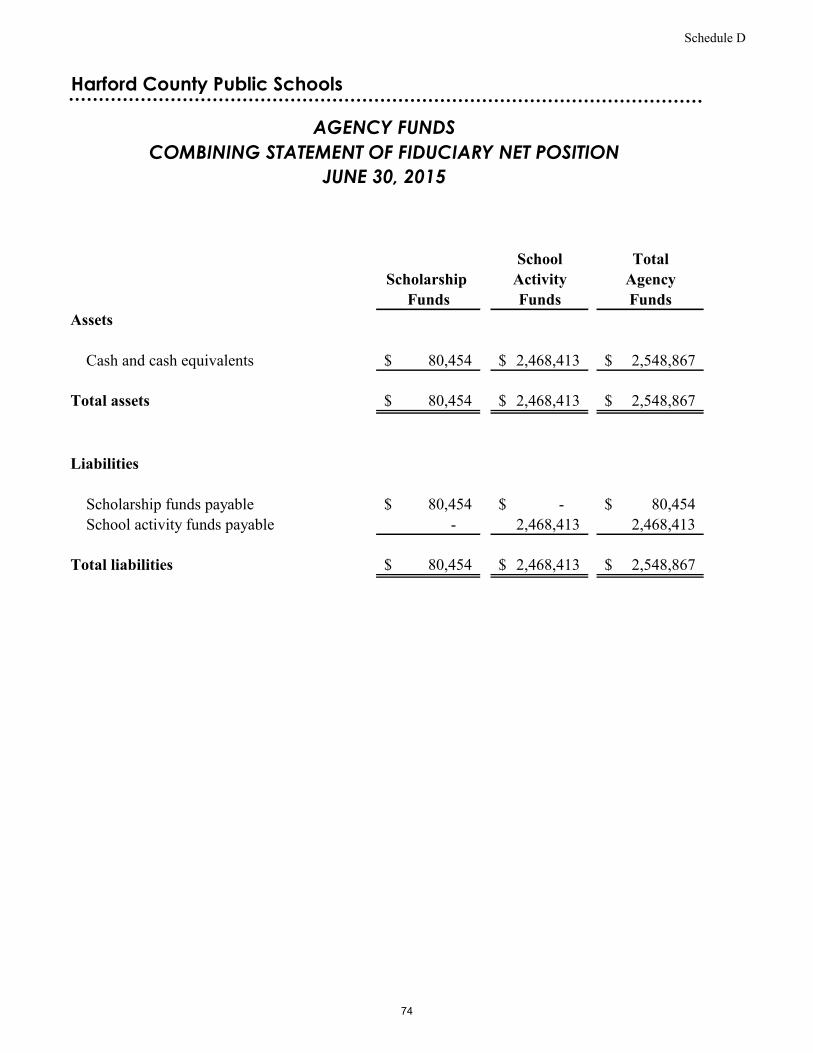
Schedule D
Harford County Public Schools
School TotalScholarship Activity Agency
Funds Funds Funds
Cash and cash equivalents 80,454$ 2,468,413$ 2,548,867$
Total assets 80,454$ 2,468,413$ 2,548,867$
Scholarship funds payable 80,454$ -$ 80,454$ School activity funds payable - 2,468,413 2,468,413
Total liabilities 80,454$ 2,468,413$ 2,548,867$
AGENCY FUNDS
Assets
Liabilities
JUNE 30, 2015
COMBINING STATEMENT OF FIDUCIARY NET POSITION
74
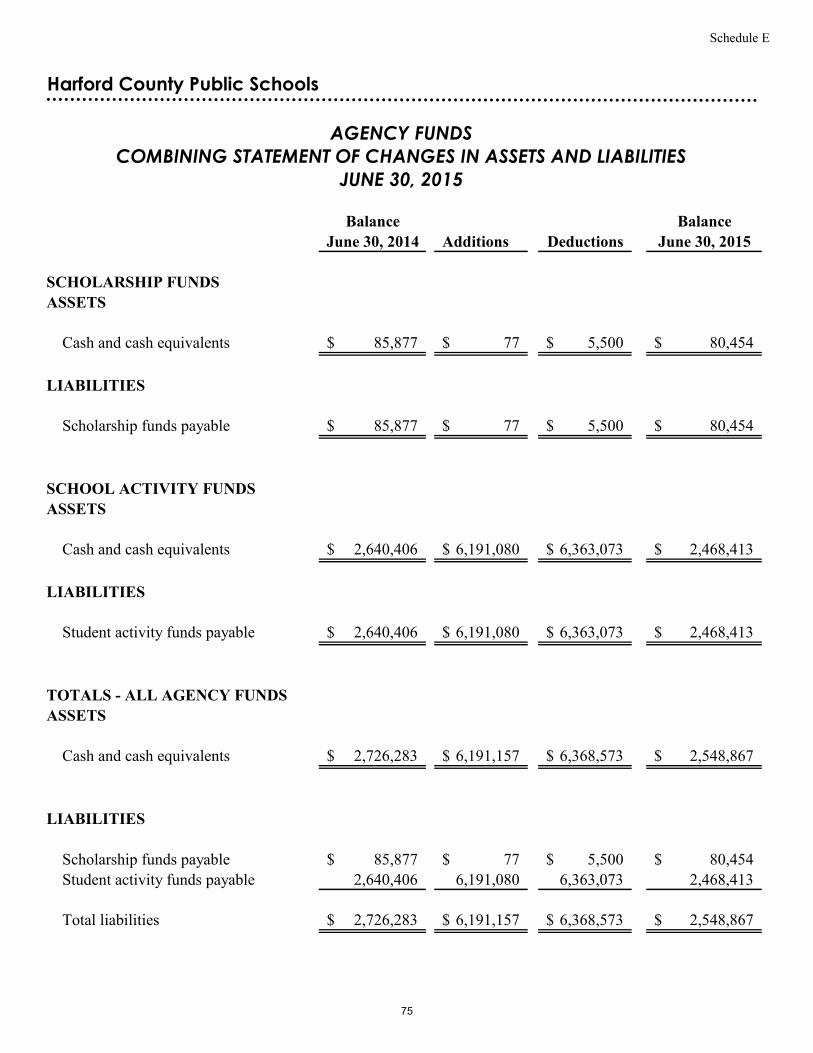
Schedule E
Harford County Public Schools
Balance BalanceJune 30, 2014 Additions Deductions June 30, 2015
SCHOLARSHIP FUNDS ASSETS
Cash and cash equivalents 85,877$ 77$ 5,500$ 80,454$
LIABILITIES
Scholarship funds payable 85,877$ 77$ 5,500$ 80,454$
SCHOOL ACTIVITY FUNDSASSETS
Cash and cash equivalents 2,640,406$ 6,191,080$ 6,363,073$ 2,468,413$
LIABILITIES
Student activity funds payable 2,640,406$ 6,191,080$ 6,363,073$ 2,468,413$
TOTALS - ALL AGENCY FUNDSASSETS
Cash and cash equivalents 2,726,283$ 6,191,157$ 6,368,573$ 2,548,867$
LIABILITIES
Scholarship funds payable 85,877$ 77$ 5,500$ 80,454$ Student activity funds payable 2,640,406 6,191,080 6,363,073 2,468,413
Total liabilities 2,726,283$ 6,191,157$ 6,368,573$ 2,548,867$
JUNE 30, 2015
AGENCY FUNDS
COMBINING STATEMENT OF CHANGES IN ASSETS AND LIABILITIES
75

Shelby Gahler, Grade 11, Bel Air High School
Teacher: Laura Crocker
Ambriel Deere, Grade 12, Harford Technical High School
Teacher: Judy Demond
76
Statistical Section This part of HCPS’ comprehensive annual financial report presents detailed information as a context for understanding what the information in the financial statements, note disclosures, and required supplementary information says about the Board’s overall financial health. Contents Page Financial Trends 78 - 81 These schedules contain trend information to help the reader understand
how the Board’s financial performance and well-being have changed over time.
Demographic and Economic Information 82 - 83 These schedules offer demographic and economic indicators to help the
reader understand the environment within which the Board’s financial activities take place.
Operating Information 84 - 93
These schedules contain service and infrastructure data to help the reader understand how the information in the Board’s financial report relates to the services it provides and activities it performs.
Sources: Unless otherwise noted, the information in these schedules is derived from the comprehensive annual financial reports for the relevant year after June 30, 2006 and from the Independent Auditors’ Report, Financial Statements and Supplemental Information for the relevant year prior to that.
77
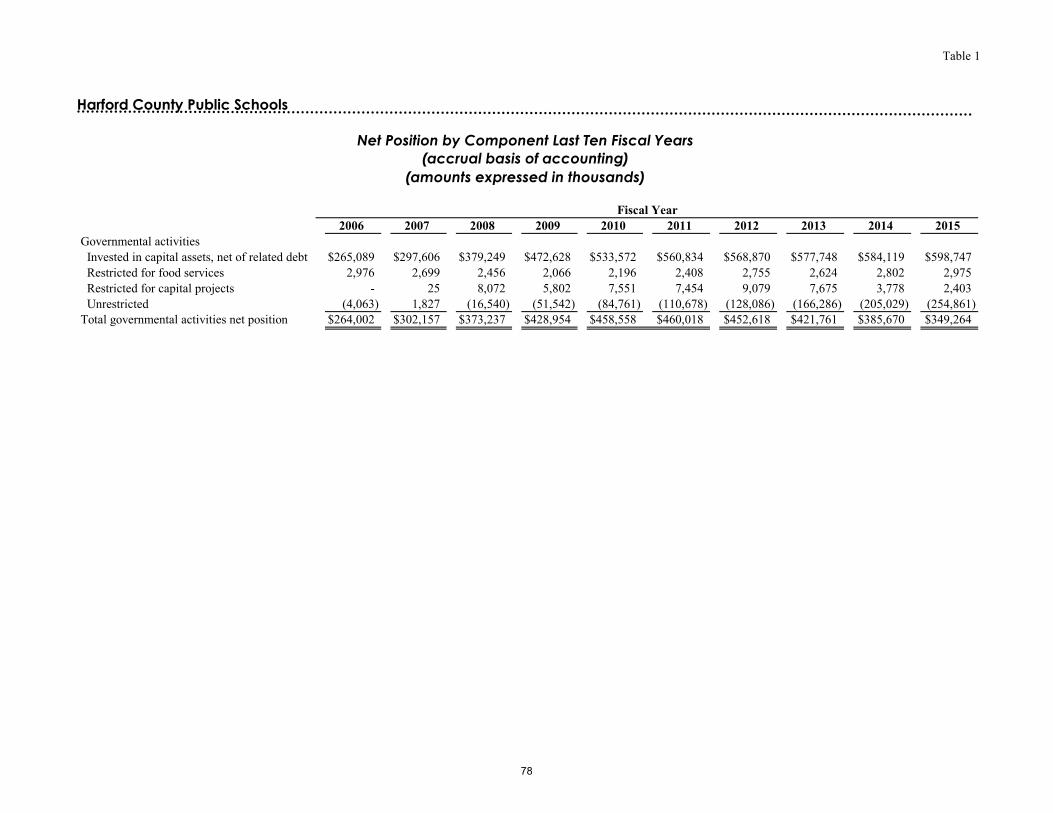
Table 1
2006 2007 2008 2009 2010 2011 2012 2013 2014 2015Governmental activities Invested in capital assets, net of related debt $265,089 $297,606 $379,249 $472,628 $533,572 $560,834 $568,870 $577,748 $584,119 $598,747 Restricted for food services 2,976 2,699 2,456 2,066 2,196 2,408 2,755 2,624 2,802 2,975 Restricted for capital projects - 25 8,072 5,802 7,551 7,454 9,079 7,675 3,778 2,403 Unrestricted (4,063) 1,827 (16,540) (51,542) (84,761) (110,678) (128,086) (166,286) (205,029) (254,861) Total governmental activities net position $264,002 $302,157 $373,237 $428,954 $458,558 $460,018 $452,618 $421,761 $385,670 $349,264
Harford County Public Schools
Net Position by Component Last Ten Fiscal Years
(accrual basis of accounting)
(amounts expressed in thousands)
Fiscal Year
78
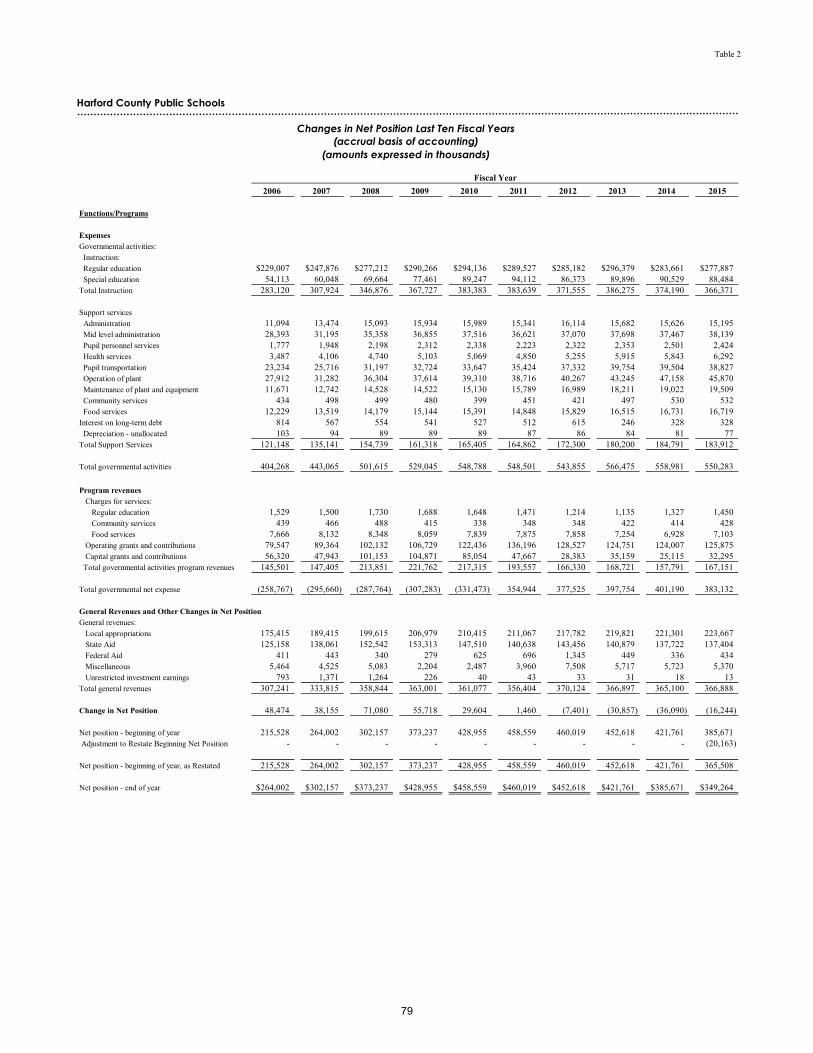
Table 2
2006 2007 2008 2009 2010 2011 2012 2013 2014 2015
Functions/Programs
ExpensesGovernmental activities: Instruction: Regular education $229,007 $247,876 $277,212 $290,266 $294,136 $289,527 $285,182 $296,379 $283,661 $277,887 Special education 54,113 60,048 69,664 77,461 89,247 94,112 86,373 89,896 90,529 88,484 Total Instruction 283,120 307,924 346,876 367,727 383,383 383,639 371,555 386,275 374,190 366,371
Support services Administration 11,094 13,474 15,093 15,934 15,989 15,341 16,114 15,682 15,626 15,195 Mid level administration 28,393 31,195 35,358 36,855 37,516 36,621 37,070 37,698 37,467 38,139 Pupil personnel services 1,777 1,948 2,198 2,312 2,338 2,223 2,322 2,353 2,501 2,424 Health services 3,487 4,106 4,740 5,103 5,069 4,850 5,255 5,915 5,843 6,292 Pupil transportation 23,234 25,716 31,197 32,724 33,647 35,424 37,332 39,754 39,504 38,827 Operation of plant 27,912 31,282 36,304 37,614 39,310 38,716 40,267 43,245 47,158 45,870 Maintenance of plant and equipment 11,671 12,742 14,528 14,522 15,130 15,789 16,989 18,211 19,022 19,509 Community services 434 498 499 480 399 451 421 497 530 532 Food services 12,229 13,519 14,179 15,144 15,391 14,848 15,829 16,515 16,731 16,719 Interest on long-term debt 814 567 554 541 527 512 615 246 328 328 Depreciation - unallocated 103 94 89 89 89 87 86 84 81 77 Total Support Services 121,148 135,141 154,739 161,318 165,405 164,862 172,300 180,200 184,791 183,912
Total governmental activities 404,268 443,065 501,615 529,045 548,788 548,501 543,855 566,475 558,981 550,283
Program revenues Charges for services: Regular education 1,529 1,500 1,730 1,688 1,648 1,471 1,214 1,135 1,327 1,450 Community services 439 466 488 415 338 348 348 422 414 428 Food services 7,666 8,132 8,348 8,059 7,839 7,875 7,858 7,254 6,928 7,103 Operating grants and contributions 79,547 89,364 102,132 106,729 122,436 136,196 128,527 124,751 124,007 125,875 Capital grants and contributions 56,320 47,943 101,153 104,871 85,054 47,667 28,383 35,159 25,115 32,295 Total governmental activities program revenues 145,501 147,405 213,851 221,762 217,315 193,557 166,330 168,721 157,791 167,151
Total governmental net expense (258,767) (295,660) (287,764) (307,283) (331,473) 354,944 377,525 397,754 401,190 383,132
General Revenues and Other Changes in Net PositionGeneral revenues: Local appropriations 175,415 189,415 199,615 206,979 210,415 211,067 217,782 219,821 221,301 223,667 State Aid 125,158 138,061 152,542 153,313 147,510 140,638 143,456 140,879 137,722 137,404 Federal Aid 411 443 340 279 625 696 1,345 449 336 434 Miscellaneous 5,464 4,525 5,083 2,204 2,487 3,960 7,508 5,717 5,723 5,370 Unrestricted investment earnings 793 1,371 1,264 226 40 43 33 31 18 13 Total general revenues 307,241 333,815 358,844 363,001 361,077 356,404 370,124 366,897 365,100 366,888
Change in Net Position 48,474 38,155 71,080 55,718 29,604 1,460 (7,401) (30,857) (36,090) (16,244)
Net position - beginning of year 215,528 264,002 302,157 373,237 428,955 458,559 460,019 452,618 421,761 385,671 Adjustment to Restate Beginning Net Position - - - - - - - - - (20,163)
Net position - beginning of year, as Restated 215,528 264,002 302,157 373,237 428,955 458,559 460,019 452,618 421,761 365,508
Net position - end of year $264,002 $302,157 $373,237 $428,955 $458,559 $460,019 $452,618 $421,761 $385,671 $349,264
Harford County Public Schools
Changes in Net Position Last Ten Fiscal Years
(accrual basis of accounting)
(amounts expressed in thousands)
Fiscal Year
79
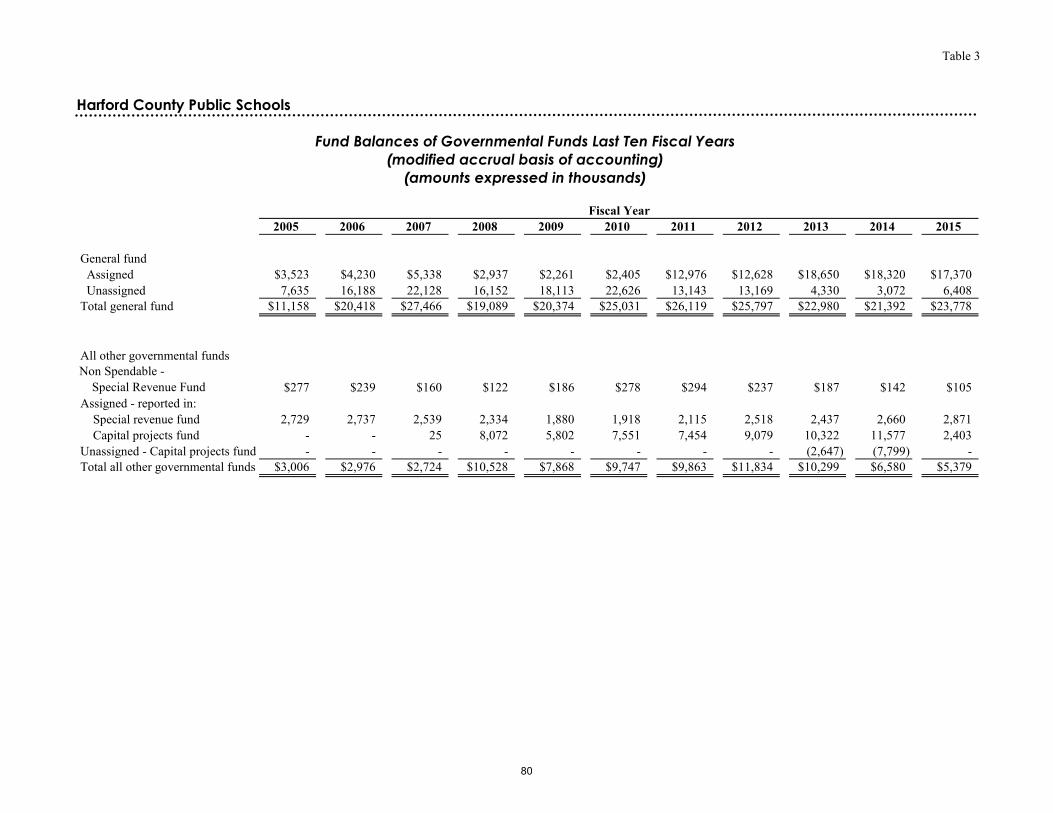
Table 3
2005 2006 2007 2008 2009 2010 2011 2012 2013 2014 2015
General fund Assigned $3,523 $4,230 $5,338 $2,937 $2,261 $2,405 $12,976 $12,628 $18,650 $18,320 $17,370 Unassigned 7,635 16,188 22,128 16,152 18,113 22,626 13,143 13,169 4,330 3,072 6,408 Total general fund $11,158 $20,418 $27,466 $19,089 $20,374 $25,031 $26,119 $25,797 $22,980 $21,392 $23,778
All other governmental funds Non Spendable - Special Revenue Fund $277 $239 $160 $122 $186 $278 $294 $237 $187 $142 $105Assigned - reported in: Special revenue fund 2,729 2,737 2,539 2,334 1,880 1,918 2,115 2,518 2,437 2,660 2,871 Capital projects fund - - 25 8,072 5,802 7,551 7,454 9,079 10,322 11,577 2,403 Unassigned - Capital projects fund - - - - - - - - (2,647) (7,799) - Total all other governmental funds $3,006 $2,976 $2,724 $10,528 $7,868 $9,747 $9,863 $11,834 $10,299 $6,580 $5,379
Harford County Public Schools
Fund Balances of Governmental Funds Last Ten Fiscal Years
(modified accrual basis of accounting)
(amounts expressed in thousands)
Fiscal Year
80
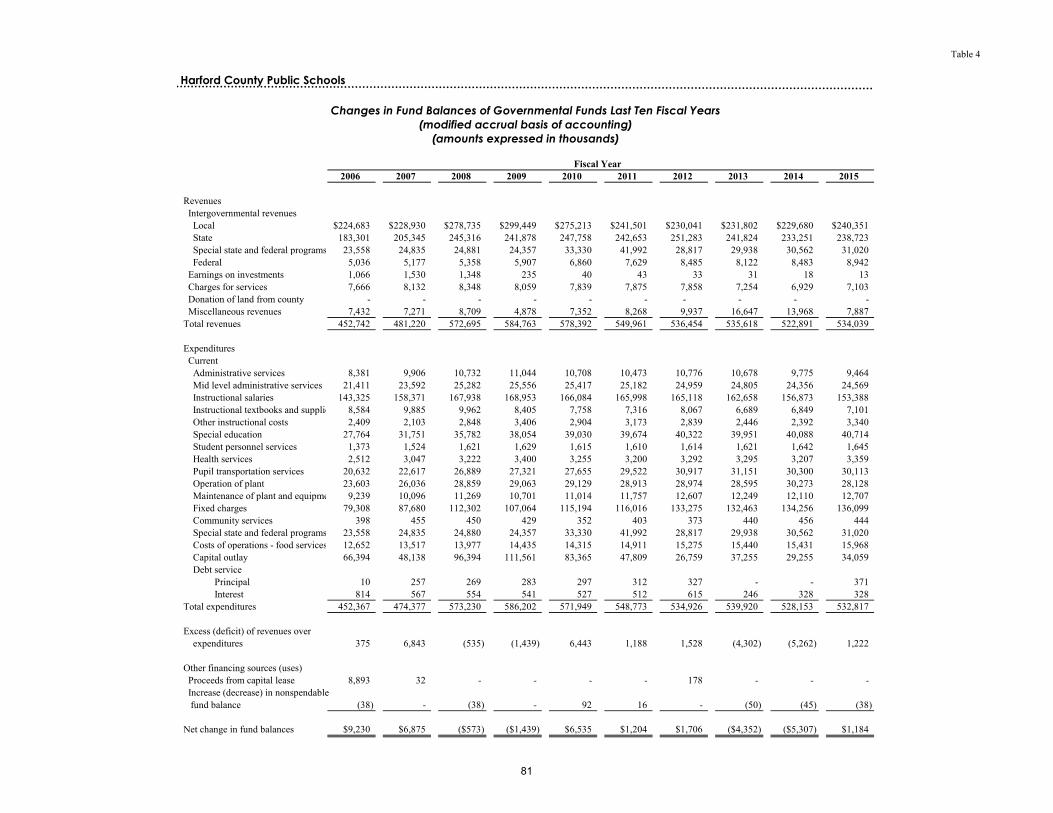
Table 4
2006 2007 2008 2009 2010 2011 2012 2013 2014 2015
Revenues Intergovernmental revenues Local $224,683 $228,930 $278,735 $299,449 $275,213 $241,501 $230,041 $231,802 $229,680 $240,351 State 183,301 205,345 245,316 241,878 247,758 242,653 251,283 241,824 233,251 238,723 Special state and federal programs 23,558 24,835 24,881 24,357 33,330 41,992 28,817 29,938 30,562 31,020 Federal 5,036 5,177 5,358 5,907 6,860 7,629 8,485 8,122 8,483 8,942 Earnings on investments 1,066 1,530 1,348 235 40 43 33 31 18 13 Charges for services 7,666 8,132 8,348 8,059 7,839 7,875 7,858 7,254 6,929 7,103 Donation of land from county - - - - - - - - - - Miscellaneous revenues 7,432 7,271 8,709 4,878 7,352 8,268 9,937 16,647 13,968 7,887 Total revenues 452,742 481,220 572,695 584,763 578,392 549,961 536,454 535,618 522,891 534,039
Expenditures Current Administrative services 8,381 9,906 10,732 11,044 10,708 10,473 10,776 10,678 9,775 9,464 Mid level administrative services 21,411 23,592 25,282 25,556 25,417 25,182 24,959 24,805 24,356 24,569 Instructional salaries 143,325 158,371 167,938 168,953 166,084 165,998 165,118 162,658 156,873 153,388 Instructional textbooks and supplies 8,584 9,885 9,962 8,405 7,758 7,316 8,067 6,689 6,849 7,101 Other instructional costs 2,409 2,103 2,848 3,406 2,904 3,173 2,839 2,446 2,392 3,340 Special education 27,764 31,751 35,782 38,054 39,030 39,674 40,322 39,951 40,088 40,714 Student personnel services 1,373 1,524 1,621 1,629 1,615 1,610 1,614 1,621 1,642 1,645 Health services 2,512 3,047 3,222 3,400 3,255 3,200 3,292 3,295 3,207 3,359 Pupil transportation services 20,632 22,617 26,889 27,321 27,655 29,522 30,917 31,151 30,300 30,113 Operation of plant 23,603 26,036 28,859 29,063 29,129 28,913 28,974 28,595 30,273 28,128 Maintenance of plant and equipment 9,239 10,096 11,269 10,701 11,014 11,757 12,607 12,249 12,110 12,707 Fixed charges 79,308 87,680 112,302 107,064 115,194 116,016 133,275 132,463 134,256 136,099 Community services 398 455 450 429 352 403 373 440 456 444 Special state and federal programs 23,558 24,835 24,880 24,357 33,330 41,992 28,817 29,938 30,562 31,020 Costs of operations - food services 12,652 13,517 13,977 14,435 14,315 14,911 15,275 15,440 15,431 15,968 Capital outlay 66,394 48,138 96,394 111,561 83,365 47,809 26,759 37,255 29,255 34,059 Debt service
Principal 10 257 269 283 297 312 327 - - 371 Interest 814 567 554 541 527 512 615 246 328 328
Total expenditures 452,367 474,377 573,230 586,202 571,949 548,773 534,926 539,920 528,153 532,817
Excess (deficit) of revenues over expenditures 375 6,843 (535) (1,439) 6,443 1,188 1,528 (4,302) (5,262) 1,222
Other financing sources (uses) Proceeds from capital lease 8,893 32 - - - - 178 - - - Increase (decrease) in nonspendable fund balance (38) - (38) - 92 16 - (50) (45) (38)
Net change in fund balances $9,230 $6,875 ($573) ($1,439) $6,535 $1,204 $1,706 ($4,352) ($5,307) $1,184
Harford County Public Schools
Changes in Fund Balances of Governmental Funds Last Ten Fiscal Years
(modified accrual basis of accounting)
(amounts expressed in thousands)
Fiscal Year
81
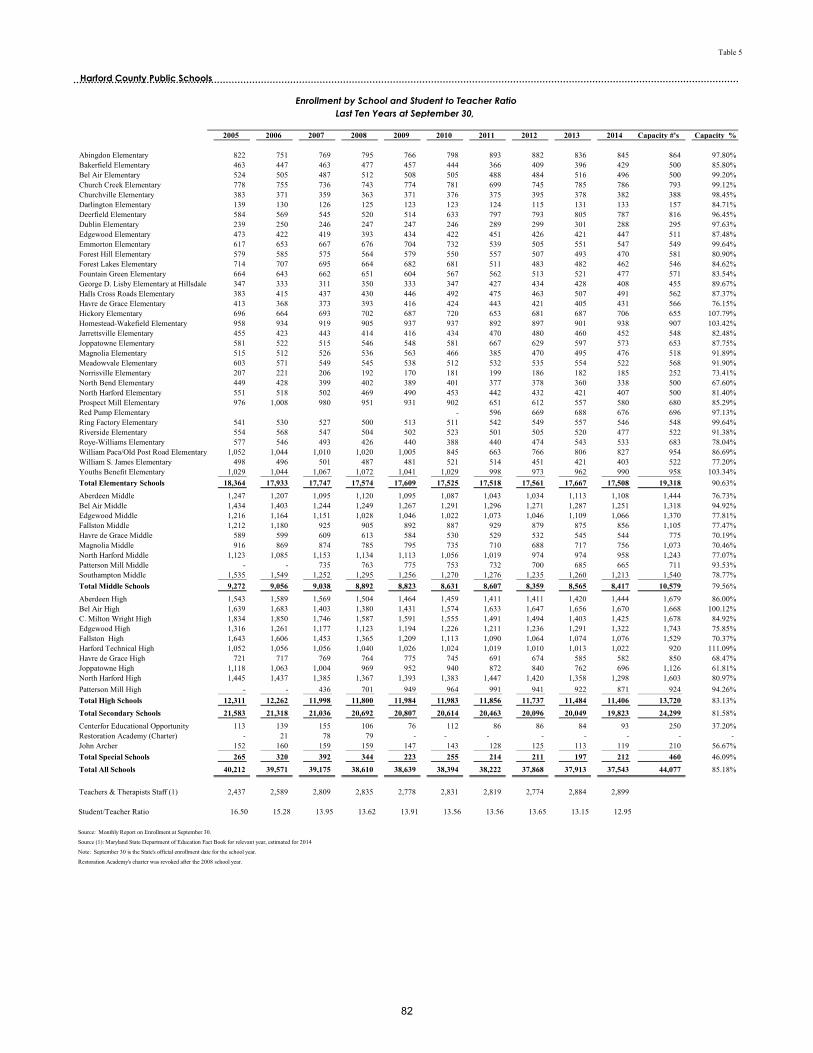
Table 5
2005 2006 2007 2008 2009 2010 2011 2012 2013 2014 Capacity #'s Capacity %
Abingdon Elementary 822 751 769 795 766 798 893 882 836 845 864 97.80%Bakerfield Elementary 463 447 463 477 457 444 366 409 396 429 500 85.80%Bel Air Elementary 524 505 487 512 508 505 488 484 516 496 500 99.20%Church Creek Elementary 778 755 736 743 774 781 699 745 785 786 793 99.12%Churchville Elementary 383 371 359 363 371 376 375 395 378 382 388 98.45%Darlington Elementary 139 130 126 125 123 123 124 115 131 133 157 84.71%Deerfield Elementary 584 569 545 520 514 633 797 793 805 787 816 96.45%Dublin Elementary 239 250 246 247 247 246 289 299 301 288 295 97.63%Edgewood Elementary 473 422 419 393 434 422 451 426 421 447 511 87.48%Emmorton Elementary 617 653 667 676 704 732 539 505 551 547 549 99.64%Forest Hill Elementary 579 585 575 564 579 550 557 507 493 470 581 80.90%Forest Lakes Elementary 714 707 695 664 682 681 511 483 482 462 546 84.62%Fountain Green Elementary 664 643 662 651 604 567 562 513 521 477 571 83.54%George D. Lisby Elementary at Hillsdale 347 333 311 350 333 347 427 434 428 408 455 89.67%Halls Cross Roads Elementary 383 415 437 430 446 492 475 463 507 491 562 87.37%Havre de Grace Elementary 413 368 373 393 416 424 443 421 405 431 566 76.15%Hickory Elementary 696 664 693 702 687 720 653 681 687 706 655 107.79%Homestead-Wakefield Elementary 958 934 919 905 937 937 892 897 901 938 907 103.42%Jarrettsville Elementary 455 423 443 414 416 434 470 480 460 452 548 82.48%Joppatowne Elementary 581 522 515 546 548 581 667 629 597 573 653 87.75%Magnolia Elementary 515 512 526 536 563 466 385 470 495 476 518 91.89%Meadowvale Elementary 603 571 549 545 538 512 532 535 554 522 568 91.90%Norrisville Elementary 207 221 206 192 170 181 199 186 182 185 252 73.41%North Bend Elementary 449 428 399 402 389 401 377 378 360 338 500 67.60%North Harford Elementary 551 518 502 469 490 453 442 432 421 407 500 81.40%Prospect Mill Elementary 976 1,008 980 951 931 902 651 612 557 580 680 85.29%Red Pump Elementary - 596 669 688 676 696 97.13%Ring Factory Elementary 541 530 527 500 513 511 542 549 557 546 548 99.64%Riverside Elementary 554 568 547 504 502 523 501 505 520 477 522 91.38%Roye-Williams Elementary 577 546 493 426 440 388 440 474 543 533 683 78.04%William Paca/Old Post Road Elementary 1,052 1,044 1,010 1,020 1,005 845 663 766 806 827 954 86.69%William S. James Elementary 498 496 501 487 481 521 514 451 421 403 522 77.20%Youths Benefit Elementary 1,029 1,044 1,067 1,072 1,041 1,029 998 973 962 990 958 103.34%Total Elementary Schools 18,364 17,933 17,747 17,574 17,609 17,525 17,518 17,561 17,667 17,508 19,318 90.63%Aberdeen Middle 1,247 1,207 1,095 1,120 1,095 1,087 1,043 1,034 1,113 1,108 1,444 76.73%Bel Air Middle 1,434 1,403 1,244 1,249 1,267 1,291 1,296 1,271 1,287 1,251 1,318 94.92%Edgewood Middle 1,216 1,164 1,151 1,028 1,046 1,022 1,073 1,046 1,109 1,066 1,370 77.81%Fallston Middle 1,212 1,180 925 905 892 887 929 879 875 856 1,105 77.47%Havre de Grace Middle 589 599 609 613 584 530 529 532 545 544 775 70.19%Magnolia Middle 916 869 874 785 795 735 710 688 717 756 1,073 70.46%North Harford Middle 1,123 1,085 1,153 1,134 1,113 1,056 1,019 974 974 958 1,243 77.07%Patterson Mill Middle - - 735 763 775 753 732 700 685 665 711 93.53%Southampton Middle 1,535 1,549 1,252 1,295 1,256 1,270 1,276 1,235 1,260 1,213 1,540 78.77%Total Middle Schools 9,272 9,056 9,038 8,892 8,823 8,631 8,607 8,359 8,565 8,417 10,579 79.56%Aberdeen High 1,543 1,589 1,569 1,504 1,464 1,459 1,411 1,411 1,420 1,444 1,679 86.00%Bel Air High 1,639 1,683 1,403 1,380 1,431 1,574 1,633 1,647 1,656 1,670 1,668 100.12%C. Milton Wright High 1,834 1,850 1,746 1,587 1,591 1,555 1,491 1,494 1,403 1,425 1,678 84.92%Edgewood High 1,316 1,261 1,177 1,123 1,194 1,226 1,211 1,236 1,291 1,322 1,743 75.85%Fallston High 1,643 1,606 1,453 1,365 1,209 1,113 1,090 1,064 1,074 1,076 1,529 70.37%Harford Technical High 1,052 1,056 1,056 1,040 1,026 1,024 1,019 1,010 1,013 1,022 920 111.09%Havre de Grace High 721 717 769 764 775 745 691 674 585 582 850 68.47%Joppatowne High 1,118 1,063 1,004 969 952 940 872 840 762 696 1,126 61.81%North Harford High 1,445 1,437 1,385 1,367 1,393 1,383 1,447 1,420 1,358 1,298 1,603 80.97%Patterson Mill High - - 436 701 949 964 991 941 922 871 924 94.26%Total High Schools 12,311 12,262 11,998 11,800 11,984 11,983 11,856 11,737 11,484 11,406 13,720 83.13%Total Secondary Schools 21,583 21,318 21,036 20,692 20,807 20,614 20,463 20,096 20,049 19,823 24,299 81.58%Centerfor Educational Opportunity 113 139 155 106 76 112 86 86 84 93 250 37.20%Restoration Academy (Charter) - 21 78 79 - - - - - - - - John Archer 152 160 159 159 147 143 128 125 113 119 210 56.67%Total Special Schools 265 320 392 344 223 255 214 211 197 212 460 46.09%Total All Schools 40,212 39,571 39,175 38,610 38,639 38,394 38,222 37,868 37,913 37,543 44,077 85.18%
Teachers & Therapists Staff (1) 2,437 2,589 2,809 2,835 2,778 2,831 2,819 2,774 2,884 2,899
Student/Teacher Ratio 16.50 15.28 13.95 13.62 13.91 13.56 13.56 13.65 13.15 12.95
Source: Monthly Report on Enrollment at September 30.
Source (1): Maryland State Department of Education Fact Book for relevant year, estimated for 2014
Note: September 30 is the State's official enrollment date for the school year.
Restoration Academy's charter was revoked after the 2008 school year.
Harford County Public Schools
Enrollment by School and Student to Teacher Ratio
Last Ten Years at September 30,
82
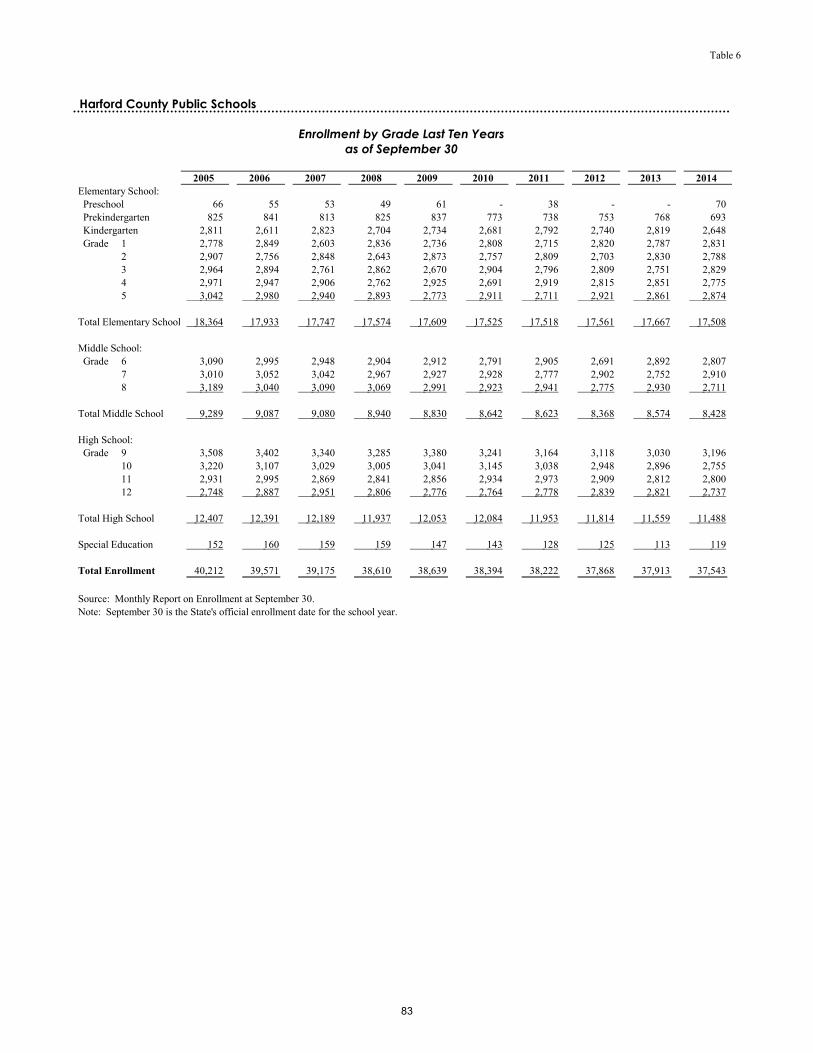
Table 6
2005 2006 2007 2008 2009 2010 2011 2012 2013 2014Elementary School: Preschool 66 55 53 49 61 - 38 - - 70 Prekindergarten 825 841 813 825 837 773 738 753 768 693 Kindergarten 2,811 2,611 2,823 2,704 2,734 2,681 2,792 2,740 2,819 2,648 Grade 1 2,778 2,849 2,603 2,836 2,736 2,808 2,715 2,820 2,787 2,831
2 2,907 2,756 2,848 2,643 2,873 2,757 2,809 2,703 2,830 2,788 3 2,964 2,894 2,761 2,862 2,670 2,904 2,796 2,809 2,751 2,829 4 2,971 2,947 2,906 2,762 2,925 2,691 2,919 2,815 2,851 2,775 5 3,042 2,980 2,940 2,893 2,773 2,911 2,711 2,921 2,861 2,874
Total Elementary School 18,364 17,933 17,747 17,574 17,609 17,525 17,518 17,561 17,667 17,508
Middle School: Grade 6 3,090 2,995 2,948 2,904 2,912 2,791 2,905 2,691 2,892 2,807
7 3,010 3,052 3,042 2,967 2,927 2,928 2,777 2,902 2,752 2,910 8 3,189 3,040 3,090 3,069 2,991 2,923 2,941 2,775 2,930 2,711
Total Middle School 9,289 9,087 9,080 8,940 8,830 8,642 8,623 8,368 8,574 8,428
High School: Grade 9 3,508 3,402 3,340 3,285 3,380 3,241 3,164 3,118 3,030 3,196
10 3,220 3,107 3,029 3,005 3,041 3,145 3,038 2,948 2,896 2,755 11 2,931 2,995 2,869 2,841 2,856 2,934 2,973 2,909 2,812 2,800 12 2,748 2,887 2,951 2,806 2,776 2,764 2,778 2,839 2,821 2,737
Total High School 12,407 12,391 12,189 11,937 12,053 12,084 11,953 11,814 11,559 11,488
Special Education 152 160 159 159 147 143 128 125 113 119
Total Enrollment 40,212 39,571 39,175 38,610 38,639 38,394 38,222 37,868 37,913 37,543
Source: Monthly Report on Enrollment at September 30.Note: September 30 is the State's official enrollment date for the school year.
Harford County Public Schools
Enrollment by Grade Last Ten Years
as of September 30
83
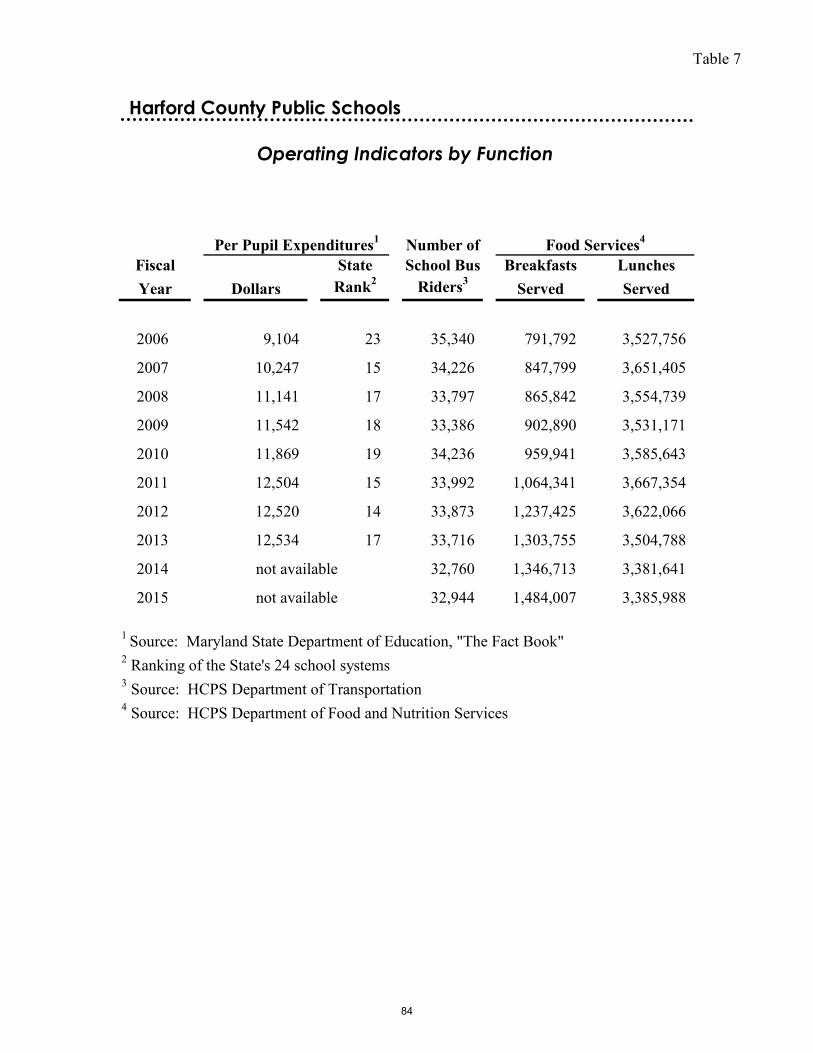
Table 7
Number ofFiscal State School Bus Breakfasts LunchesYear Dollars Rank2 Riders3 Served Served
2006 9,104 23 35,340 791,792 3,527,756
2007 10,247 15 34,226 847,799 3,651,405
2008 11,141 17 33,797 865,842 3,554,739
2009 11,542 18 33,386 902,890 3,531,171
2010 11,869 19 34,236 959,941 3,585,643
2011 12,504 15 33,992 1,064,341 3,667,354
2012 12,520 14 33,873 1,237,425 3,622,066
2013 12,534 17 33,716 1,303,755 3,504,788
2014 32,760 1,346,713 3,381,641
2015 32,944 1,484,007 3,385,988
1 Source: Maryland State Department of Education, "The Fact Book"2 Ranking of the State's 24 school systems3 Source: HCPS Department of Transportation4 Source: HCPS Department of Food and Nutrition Services
not available
not available
Harford County Public Schools
Operating Indicators by Function
Food Services4Per Pupil Expenditures1
84
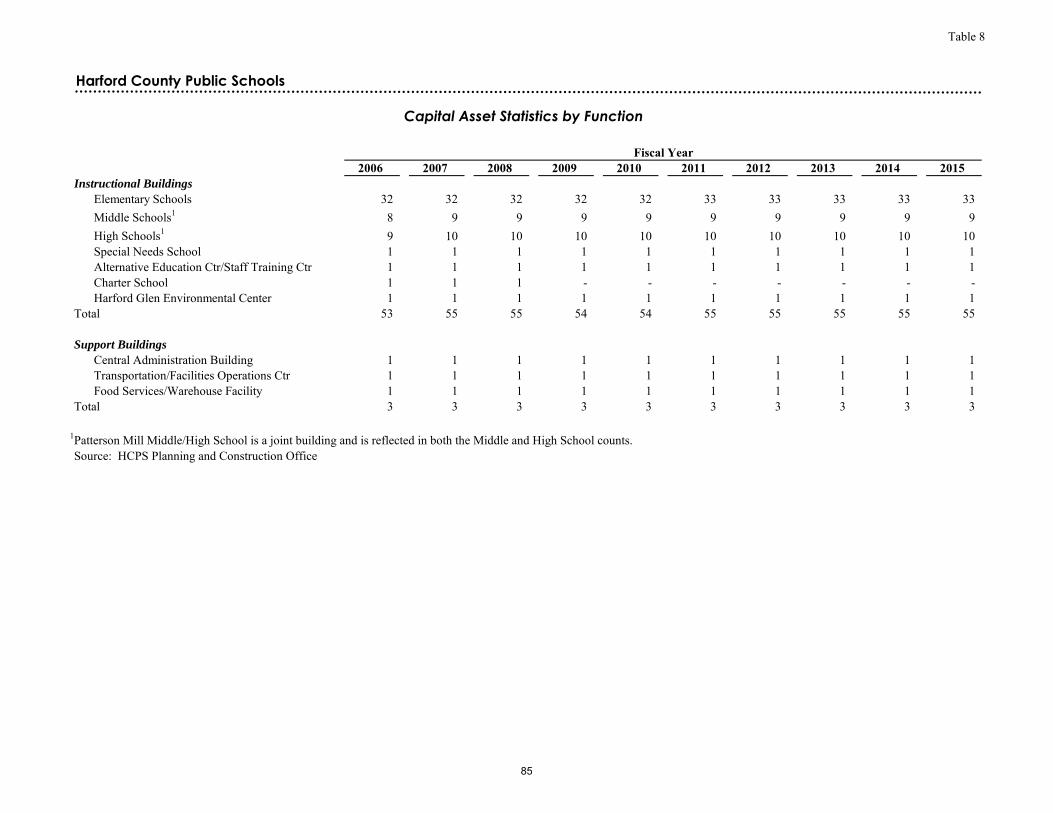
Table 8
2006 2007 2008 2009 2010 2011 2012 2013 2014 2015Instructional Buildings
Elementary Schools 32 32 32 32 32 33 33 33 33 33 Middle Schools1 8 9 9 9 9 9 9 9 9 9 High Schools1 9 10 10 10 10 10 10 10 10 10 Special Needs School 1 1 1 1 1 1 1 1 1 1 Alternative Education Ctr/Staff Training Ctr 1 1 1 1 1 1 1 1 1 1 Charter School 1 1 1 - - - - - - - Harford Glen Environmental Center 1 1 1 1 1 1 1 1 1 1
Total 53 55 55 54 54 55 55 55 55 55
Support Buildings
Central Administration Building 1 1 1 1 1 1 1 1 1 1 Transportation/Facilities Operations Ctr 1 1 1 1 1 1 1 1 1 1 Food Services/Warehouse Facility 1 1 1 1 1 1 1 1 1 1
Total 3 3 3 3 3 3 3 3 3 3
1Patterson Mill Middle/High School is a joint building and is reflected in both the Middle and High School counts.Source: HCPS Planning and Construction Office
Harford County Public Schools
Capital Asset Statistics by Function
Fiscal Year
85
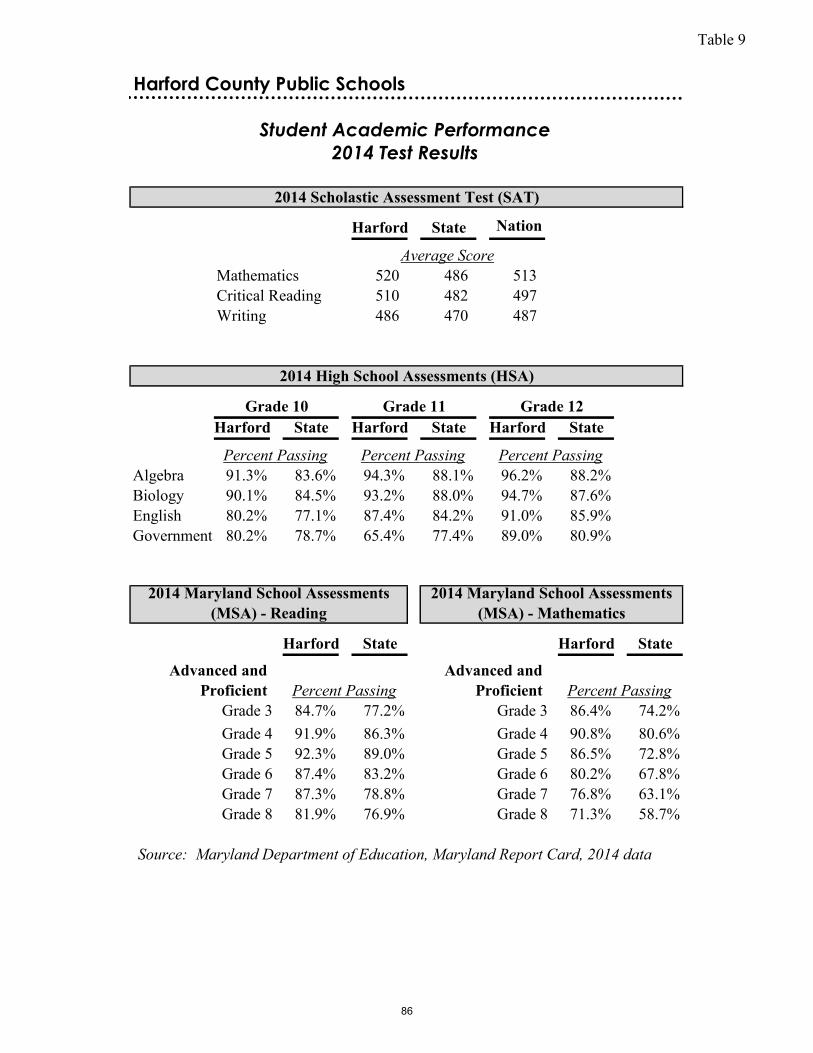
Table 9
Harford State Nation
Mathematics 520 486 513 Critical Reading 510 482 497 Writing 486 470 487
Harford State Harford State Harford State
Percent PassingAlgebra 91.3% 83.6% 94.3% 88.1% 96.2% 88.2%Biology 90.1% 84.5% 93.2% 88.0% 94.7% 87.6%English 80.2% 77.1% 87.4% 84.2% 91.0% 85.9%Government 80.2% 78.7% 65.4% 77.4% 89.0% 80.9%
Harford State Harford State
Percent PassingGrade 3 84.7% 77.2% Grade 3 86.4% 74.2%Grade 4 91.9% 86.3% Grade 4 90.8% 80.6%Grade 5 92.3% 89.0% Grade 5 86.5% 72.8%Grade 6 87.4% 83.2% Grade 6 80.2% 67.8%Grade 7 87.3% 78.8% Grade 7 76.8% 63.1%Grade 8 81.9% 76.9% Grade 8 71.3% 58.7%
Source: Maryland Department of Education, Maryland Report Card, 2014 data
Advanced and Proficient Percent Passing
Advanced and Proficient
Grade 10 Grade 11 Grade 12
Percent Passing Percent Passing
2014 Maryland School Assessments(MSA) - Reading
2014 Maryland School Assessments (MSA) - Mathematics
2014 High School Assessments (HSA)
Harford County Public Schools
Student Academic Performance
2014 Test Results
2014 Scholastic Assessment Test (SAT)
Average Score
86
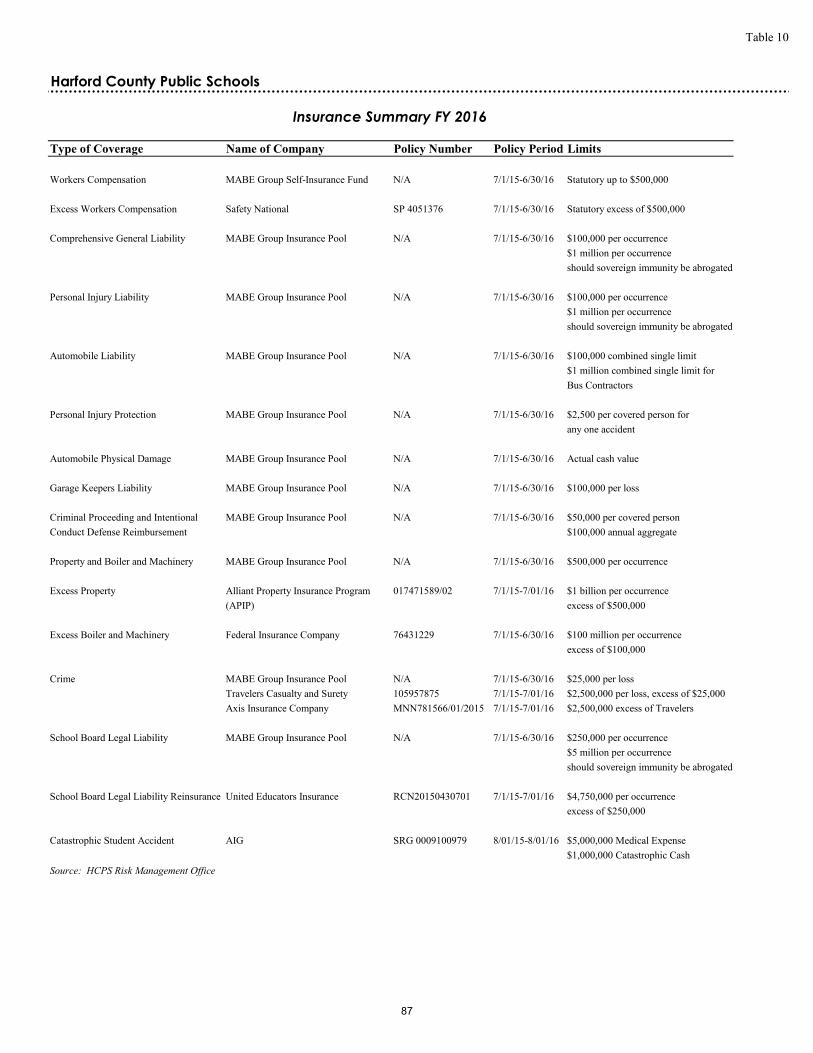
Table 10
Type of Coverage Name of Company Policy Number Policy Period Limits
Workers Compensation MABE Group Self-Insurance Fund N/A 7/1/15-6/30/16 Statutory up to $500,000
Excess Workers Compensation Safety National SP 4051376 7/1/15-6/30/16 Statutory excess of $500,000
Comprehensive General Liability MABE Group Insurance Pool N/A 7/1/15-6/30/16 $100,000 per occurrence$1 million per occurrenceshould sovereign immunity be abrogated
Personal Injury Liability MABE Group Insurance Pool N/A 7/1/15-6/30/16 $100,000 per occurrence$1 million per occurrenceshould sovereign immunity be abrogated
Automobile Liability MABE Group Insurance Pool N/A 7/1/15-6/30/16 $100,000 combined single limit$1 million combined single limit for Bus Contractors
Personal Injury Protection MABE Group Insurance Pool N/A 7/1/15-6/30/16 $2,500 per covered person forany one accident
Automobile Physical Damage MABE Group Insurance Pool N/A 7/1/15-6/30/16 Actual cash value
Garage Keepers Liability MABE Group Insurance Pool N/A 7/1/15-6/30/16 $100,000 per loss
Criminal Proceeding and Intentional MABE Group Insurance Pool N/A 7/1/15-6/30/16 $50,000 per covered personConduct Defense Reimbursement $100,000 annual aggregate
Property and Boiler and Machinery MABE Group Insurance Pool N/A 7/1/15-6/30/16 $500,000 per occurrence
Excess Property Alliant Property Insurance Program 017471589/02 7/1/15-7/01/16 $1 billion per occurrence(APIP) excess of $500,000
Excess Boiler and Machinery Federal Insurance Company 76431229 7/1/15-6/30/16 $100 million per occurrenceexcess of $100,000
Crime MABE Group Insurance Pool N/A 7/1/15-6/30/16 $25,000 per lossTravelers Casualty and Surety 105957875 7/1/15-7/01/16 $2,500,000 per loss, excess of $25,000Axis Insurance Company MNN781566/01/2015 7/1/15-7/01/16 $2,500,000 excess of Travelers
School Board Legal Liability MABE Group Insurance Pool N/A 7/1/15-6/30/16 $250,000 per occurrence$5 million per occurrenceshould sovereign immunity be abrogated
School Board Legal Liability Reinsurance United Educators Insurance RCN20150430701 7/1/15-7/01/16 $4,750,000 per occurrenceexcess of $250,000
Catastrophic Student Accident AIG SRG 0009100979 8/01/15-8/01/16 $5,000,000 Medical Expense$1,000,000 Catastrophic Cash
Source: HCPS Risk Management Office
Harford County Public Schools
Insurance Summary FY 2016
87
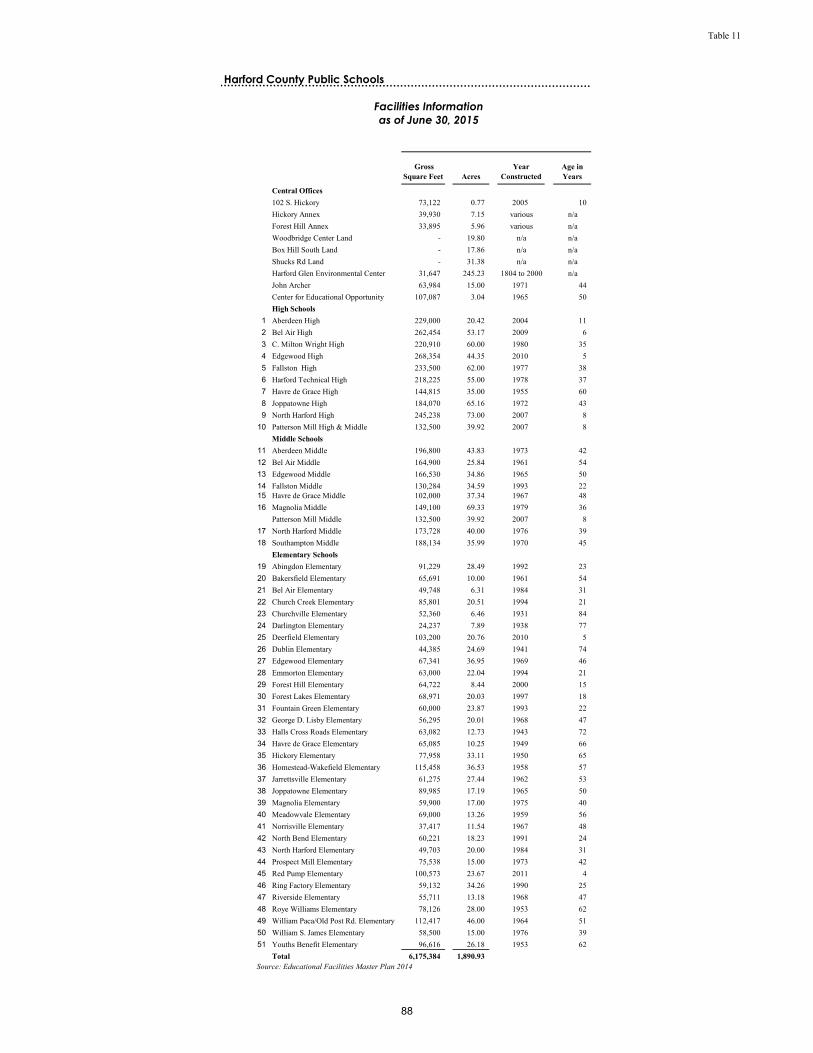
Table 11
Gross Square Feet Acres
Year Constructed
Age in Years
Central Offices102 S. Hickory 73,122 0.77 2005 10 Hickory Annex 39,930 7.15 various n/aForest Hill Annex 33,895 5.96 various n/aWoodbridge Center Land - 19.80 n/a n/aBox Hill South Land - 17.86 n/a n/aShucks Rd Land - 31.38 n/a n/aHarford Glen Environmental Center 31,647 245.23 1804 to 2000 n/aJohn Archer 63,984 15.00 1971 44 Center for Educational Opportunity 107,087 3.04 1965 50 High Schools
1 Aberdeen High 229,000 20.42 2004 11 2 Bel Air High 262,454 53.17 2009 6 3 C. Milton Wright High 220,910 60.00 1980 35 4 Edgewood High 268,354 44.35 2010 5 5 Fallston High 233,500 62.00 1977 38 6 Harford Technical High 218,225 55.00 1978 37 7 Havre de Grace High 144,815 35.00 1955 60 8 Joppatowne High 184,070 65.16 1972 43 9 North Harford High 245,238 73.00 2007 8
10 Patterson Mill High & Middle 132,500 39.92 2007 8 Middle Schools
11 Aberdeen Middle 196,800 43.83 1973 42 12 Bel Air Middle 164,900 25.84 1961 54 13 Edgewood Middle 166,530 34.86 1965 50 14 Fallston Middle 130,284 34.59 1993 22 15 Havre de Grace Middle 102,000 37.34 1967 48 16 Magnolia Middle 149,100 69.33 1979 36
Patterson Mill Middle 132,500 39.92 2007 8 17 North Harford Middle 173,728 40.00 1976 39 18 Southampton Middle 188,134 35.99 1970 45
Elementary Schools19 Abingdon Elementary 91,229 28.49 1992 23 20 Bakersfield Elementary 65,691 10.00 1961 54 21 Bel Air Elementary 49,748 6.31 1984 31 22 Church Creek Elementary 85,801 20.51 1994 21 23 Churchville Elementary 52,360 6.46 1931 84 24 Darlington Elementary 24,237 7.89 1938 77 25 Deerfield Elementary 103,200 20.76 2010 5 26 Dublin Elementary 44,385 24.69 1941 74 27 Edgewood Elementary 67,341 36.95 1969 46 28 Emmorton Elementary 63,000 22.04 1994 21 29 Forest Hill Elementary 64,722 8.44 2000 15 30 Forest Lakes Elementary 68,971 20.03 1997 18 31 Fountain Green Elementary 60,000 23.87 1993 22 32 George D. Lisby Elementary 56,295 20.01 1968 47 33 Halls Cross Roads Elementary 63,082 12.73 1943 72 34 Havre de Grace Elementary 65,085 10.25 1949 66 35 Hickory Elementary 77,958 33.11 1950 65 36 Homestead-Wakefield Elementary 115,458 36.53 1958 57 37 Jarrettsville Elementary 61,275 27.44 1962 53 38 Joppatowne Elementary 89,985 17.19 1965 50 39 Magnolia Elementary 59,900 17.00 1975 40 40 Meadowvale Elementary 69,000 13.26 1959 56 41 Norrisville Elementary 37,417 11.54 1967 48 42 North Bend Elementary 60,221 18.23 1991 24 43 North Harford Elementary 49,703 20.00 1984 31 44 Prospect Mill Elementary 75,538 15.00 1973 42 45 Red Pump Elementary 100,573 23.67 2011 4 46 Ring Factory Elementary 59,132 34.26 1990 25 47 Riverside Elementary 55,711 13.18 1968 47 48 Roye Williams Elementary 78,126 28.00 1953 62 49 William Paca/Old Post Rd. Elementary 112,417 46.00 1964 51 50 William S. James Elementary 58,500 15.00 1976 39 51 Youths Benefit Elementary 96,616 26.18 1953 62
Total 6,175,384 1,890.93Source: Educational Facilities Master Plan 2014
Facilities Information
as of June 30, 2015
Harford County Public Schools
88
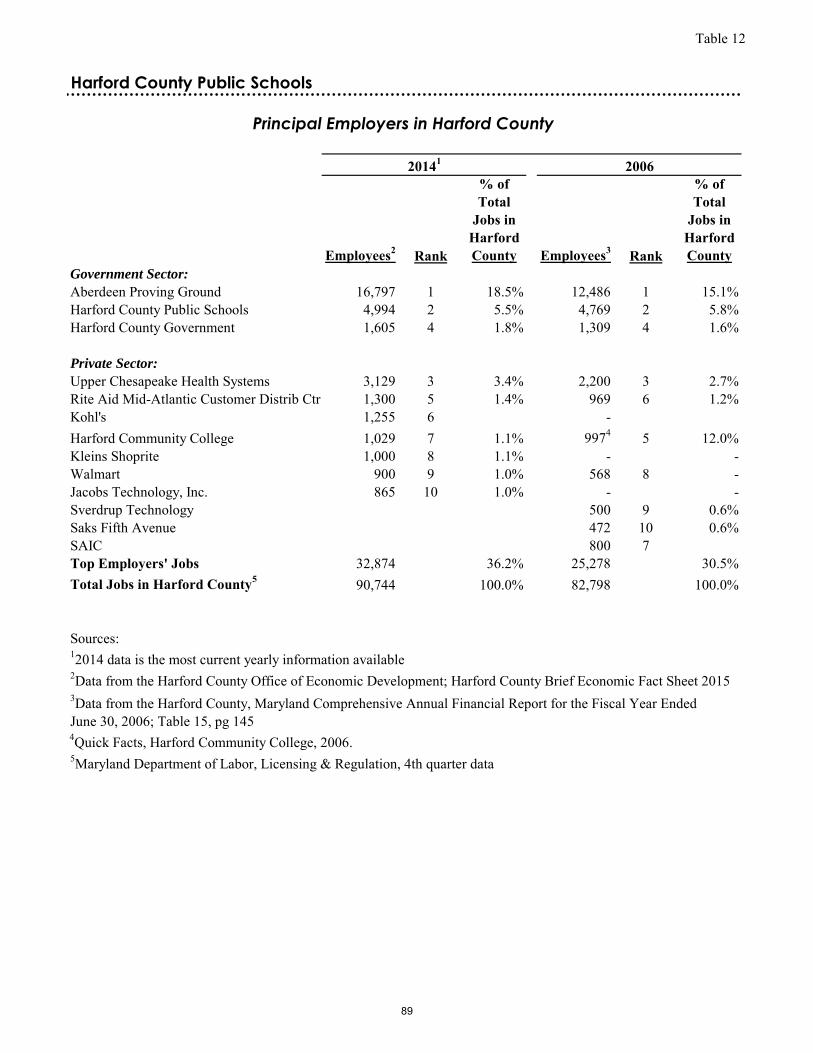
Table 12
Employees2 Rank
% of Total
Jobs in Harford County Employees3 Rank
% of Total
Jobs in Harford County
Government Sector:
Aberdeen Proving Ground 16,797 1 18.5% 12,486 1 15.1%Harford County Public Schools 4,994 2 5.5% 4,769 2 5.8%Harford County Government 1,605 4 1.8% 1,309 4 1.6%
Private Sector:
Upper Chesapeake Health Systems 3,129 3 3.4% 2,200 3 2.7%Rite Aid Mid-Atlantic Customer Distrib Ctr 1,300 5 1.4% 969 6 1.2%Kohl's 1,255 6 -Harford Community College 1,029 7 1.1% 9974 5 12.0%Kleins Shoprite 1,000 8 1.1% - -Walmart 900 9 1.0% 568 8 -Jacobs Technology, Inc. 865 10 1.0% - -Sverdrup Technology 500 9 0.6%Saks Fifth Avenue 472 10 0.6%SAIC 800 7Top Employers' Jobs 32,874 36.2% 25,278 30.5%Total Jobs in Harford County5 90,744 100.0% 82,798 100.0%
Sources: 12014 data is the most current yearly information available2Data from the Harford County Office of Economic Development; Harford County Brief Economic Fact Sheet 2015
4Quick Facts, Harford Community College, 2006.5Maryland Department of Labor, Licensing & Regulation, 4th quarter data
Harford County Public Schools
Principal Employers in Harford County
20141 2006
3Data from the Harford County, Maryland Comprehensive Annual Financial Report for the Fiscal Year Ended June 30, 2006; Table 15, pg 145
89
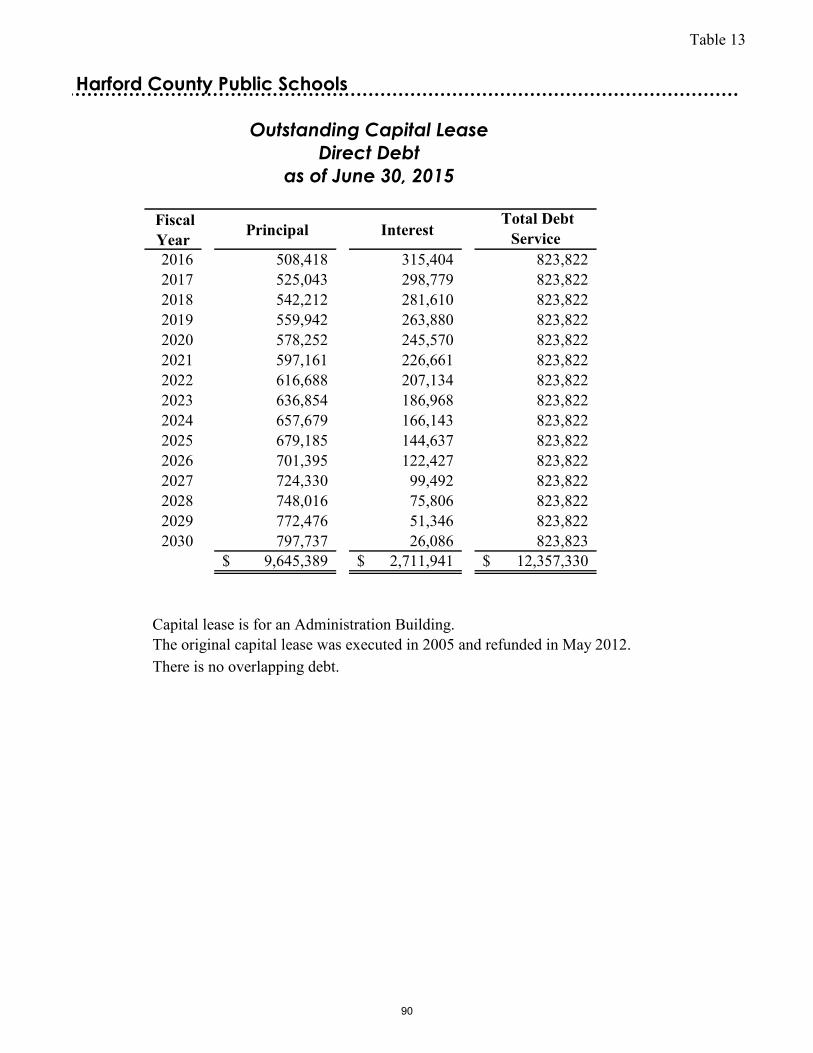
Table 13
Fiscal Year Principal Interest
Total Debt Service
2016 508,418 315,404 823,822 2017 525,043 298,779 823,822 2018 542,212 281,610 823,822 2019 559,942 263,880 823,822 2020 578,252 245,570 823,822 2021 597,161 226,661 823,822 2022 616,688 207,134 823,822 2023 636,854 186,968 823,822 2024 657,679 166,143 823,822 2025 679,185 144,637 823,822 2026 701,395 122,427 823,822 2027 724,330 99,492 823,822 2028 748,016 75,806 823,822 2029 772,476 51,346 823,822 2030 797,737 26,086 823,823
9,645,389$ 2,711,941$ 12,357,330$
Capital lease is for an Administration Building. The original capital lease was executed in 2005 and refunded in May 2012.There is no overlapping debt.
Outstanding Capital Lease
as of June 30, 2015
Direct Debt
Harford County Public Schools
90
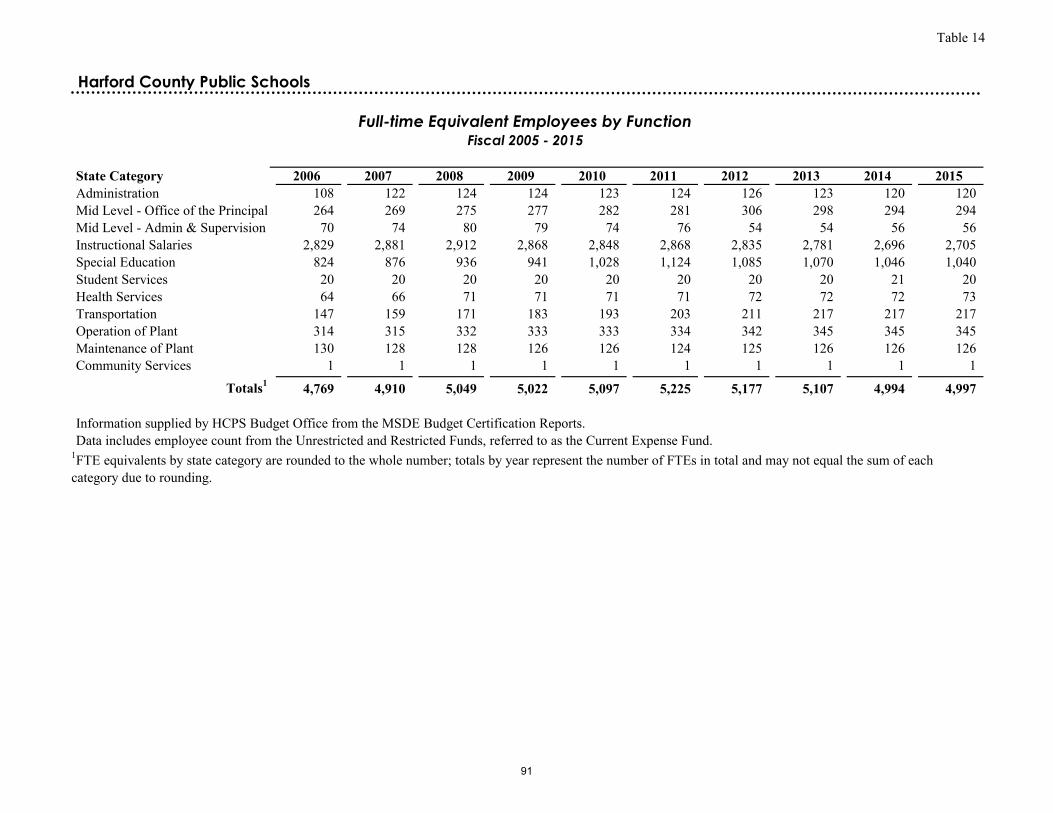
Table 14
Harford County Public Schools
State Category 2006 2007 2008 2009 2010 2011 2012 2013 2014 2015Administration 108 122 124 124 123 124 126 123 120 120 Mid Level - Office of the Principal 264 269 275 277 282 281 306 298 294 294 Mid Level - Admin & Supervision 70 74 80 79 74 76 54 54 56 56 Instructional Salaries 2,829 2,881 2,912 2,868 2,848 2,868 2,835 2,781 2,696 2,705 Special Education 824 876 936 941 1,028 1,124 1,085 1,070 1,046 1,040 Student Services 20 20 20 20 20 20 20 20 21 20 Health Services 64 66 71 71 71 71 72 72 72 73 Transportation 147 159 171 183 193 203 211 217 217 217 Operation of Plant 314 315 332 333 333 334 342 345 345 345 Maintenance of Plant 130 128 128 126 126 124 125 126 126 126 Community Services 1 1 1 1 1 1 1 1 1 1
Totals1 4,769 4,910 5,049 5,022 5,097 5,225 5,177 5,107 4,994 4,997
Information supplied by HCPS Budget Office from the MSDE Budget Certification Reports.Data includes employee count from the Unrestricted and Restricted Funds, referred to as the Current Expense Fund.
Full-time Equivalent Employees by FunctionFiscal 2005 - 2015
1FTE equivalents by state category are rounded to the whole number; totals by year represent the number of FTEs in total and may not equal the sum of each category due to rounding.
91
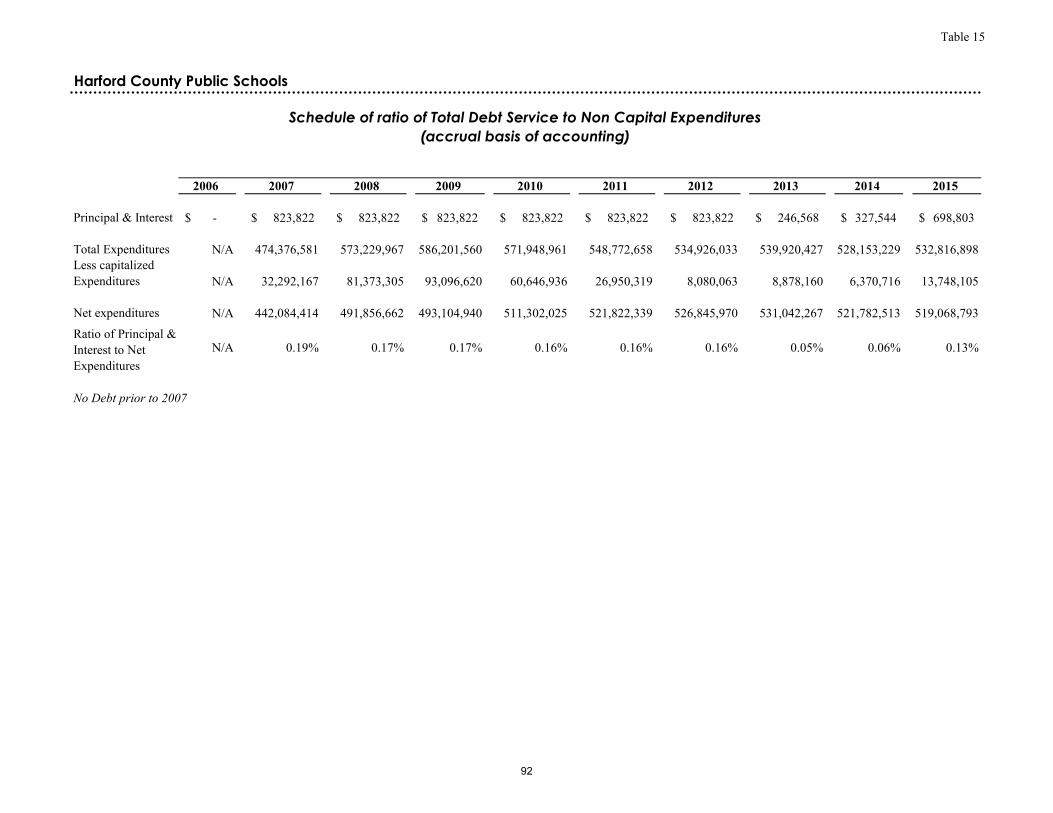
Table 15
2006 2007 2008 2009 2010 2011 2012 2013 2014 2015
Principal & Interest -$ 823,822$ 823,822$ 823,822$ 823,822$ 823,822$ 823,822$ 246,568$ 327,544$ 698,803$
Total Expenditures N/A 474,376,581 573,229,967 586,201,560 571,948,961 548,772,658 534,926,033 539,920,427 528,153,229 532,816,898Less capitalized Expenditures N/A 32,292,167 81,373,305 93,096,620 60,646,936 26,950,319 8,080,063 8,878,160 6,370,716 13,748,105
Net expenditures N/A 442,084,414 491,856,662 493,104,940 511,302,025 521,822,339 526,845,970 531,042,267 521,782,513 519,068,793
Ratio of Principal & Interest to Net Expenditures
N/A 0.19% 0.17% 0.17% 0.16% 0.16% 0.16% 0.05% 0.06% 0.13%
Harford County Public Schools
Schedule of ratio of Total Debt Service to Non Capital Expenditures
(accrual basis of accounting)
No Debt prior to 2007
92
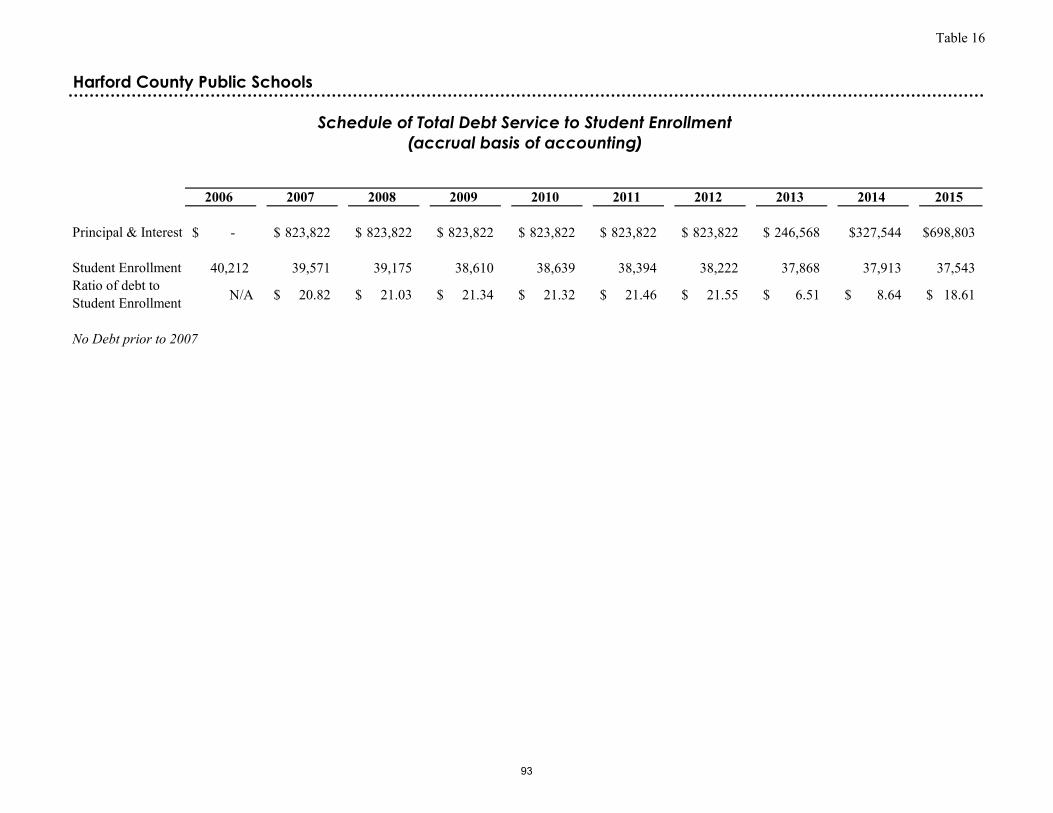
Table 16
2006 2007 2008 2009 2010 2011 2012 2013 2014 2015
Principal & Interest -$ 823,822$ 823,822$ 823,822$ 823,822$ 823,822$ 823,822$ 246,568$ $327,544 $698,803
Student Enrollment 40,212 39,571 39,175 38,610 38,639 38,394 38,222 37,868 37,913 37,543 Ratio of debt to Student Enrollment N/A 20.82$ 21.03$ 21.34$ 21.32$ 21.46$ 21.55$ 6.51$ 8.64$ 18.61$
No Debt prior to 2007
Harford County Public Schools
Schedule of Total Debt Service to Student Enrollment
(accrual basis of accounting)
93

Compliance Section
Lance Einfeld, Grade 10, Aberdeen High School
Teacher: Richard Morris
94
200 International Circle • Suite 5500 • Hunt Valley • Maryland 21030 • P 410.584.0060 • F 410.584.0061
Independent Public Accountants’ Report on Internal Control Over Financial Reporting and on Compliance and Other Matters Based on an Audit of Financial Statements Performed in
Accordance with Government Auditing Standards Members of the Board of Education of Harford County Bel Air, Maryland We have audited, in accordance with auditing standards generally accepted in the United States of America and the standards applicable to financial audits contained in Government Auditing Standards issued by the Comptroller General of the United States, the financial statements of the governmental activities, each major fund, and the aggregate remaining fund information of Harford County Public Schools (HCPS) as of and for the year ended June 30, 2015, and the related notes to the financial statements, which collectively comprise HCPS’ basic financial statements, and have issued our report thereon dated September 17, 2015. Internal Control over Financial Reporting In planning and performing our audit of the financial statements, we considered HCPS’ internal control over financial reporting (internal control) to determine the audit procedures that are appropriate in the circumstances for the purpose of expressing our opinions on the financial statements, but not for the purpose of expressing an opinion on the effectiveness of HCPS’ internal control. Accordingly, we do not express an opinion on the effectiveness of HCPS’ internal control. A deficiency in internal control exists when the design or operation of a control does not allow management or employees in the normal course of performing their assigned functions, to prevent, or detect and correct misstatements on a timely basis. A material weakness is a deficiency, or a combination of deficiencies, in internal control, such that there is a reasonable possibility that a material misstatement of the entity’s financial statements will not be prevented, or detected and corrected on a timely basis. A significant deficiency is a deficiency, or a combination of deficiencies, in internal control that is less severe than a material weakness, yet important enough to merit attention by those charged with governance. Our consideration of internal control over financial reporting was for the limited purpose described in the first paragraph of this section and was not designed to identify all deficiencies in internal control over financial reporting that might be material weaknesses or significant deficiencies. Given these limitations, during our audit we did not identify any deficiencies in internal control over financial reporting that we consider to be material weaknesses. However, material weaknesses may exist that have not been identified.
95
2
Compliance and Other Matters As part of obtaining reasonable assurance about whether HCPS’ financial statements are free from material misstatement, we performed tests of its compliance with certain provisions of laws, regulations, contracts, and grant agreements, noncompliance with which could have a direct and material effect on the determination of financial statement amounts. However, providing an opinion on compliance with those provisions was not an objective of our audit and, accordingly, we do not express such an opinion. The results of our tests disclosed no instances of noncompliance or other matters that are required to be reported under Government Auditing Standards. Purpose of this Report The purpose of this report is solely to describe the scope of our testing of internal control and compliance and the results of that testing, and not to provide an opinion on the effectiveness of the entity’s internal control or on compliance. This report is an integral part of an audit performed in accordance with Government Auditing Standards in considering the entity’s internal control and compliance. Accordingly, this communication is not suitable for any other purpose. Hunt Valley, Maryland September 17, 2015
96

Daryese Fleming, Grade 4, Joppatowne Elementary School
Teacher: Sharon Pardew
Mary Kraczek, Grade 9, Bel Air High School
Teacher: Jennifer Moss
97

FROM TOP, LEFT TO RIGHT: Laura Potter, mathematics teacher at C. Milton Wright High School and HCPS Teacher of the Year, poses with Principal Mike Thatcher and her new car, a donated one-year lease courtesy of Jones Junction; Fountain Green Elementary School was honored for being selected as a Maryland Blue Ribbon School; Tracy Goetzinger, first grade teacher at William S. James Elementary School, was selected to recieve a $1,000 Edna May Merson Scholarship from the Council of Educational Administrative and Supervisory Organizations of Maryland (CEASOM); HCPS honored employees who have served the county, and its students, for 10, 20, 30 and 40 years (40-year employees pictured); North Harford High School Principal Ed Herbold retired this year, after 30 years of service to HCPS; Doris Schaule, of Patterson Mill High School, was selected as the 2015 HCPS Nurse of the Year.
HCPS Faculty and Staff Noteworthy Accomplishments