Embed Size (px)
Citation preview

Omnicom
A N N U A L R E P O R T
2020

Omnicom
A N N U A L R E P O R T
2020
UNITED STATESSECURITIES AND EXCHANGE COMMISSION
Washington, D.C. 20549__________________________________
FORM 10-KA ANNUAL REPORT PURSUANT TO SECTION 13 OR 15(d) OF THE SECURITIES EXCHANGE ACT OF 1934
FOR THE FISCAL YEAR ENDED DECEMBER 31, 2020__________________________________
Commission File Number: 1-10551__________________________________
OMNICOM GROUP INC.(Exact name of registrant as specified in its charter)
New York 13-1514814(State or other jurisdiction of
incorporation or organization)(I.R.S. Employer Identification No.)
280 Park Avenue, New York, NY 10017(Address of principal executive offices) (Zip Code)
Registrant’s telephone number, including area code: (212) 415-3600__________________________________
Securities Registered Pursuant to Section 12(b) of the Act:
Title of each class Trading Symbols Name of each exchange on which registeredCommon Stock, $0.15 Par Value OMC New York Stock Exchange0.800% Senior Notes due 2027 OMC/27 New York Stock Exchange1.400% Senior Notes due 2031 OMC/31 New York Stock Exchange
Securities Registered Pursuant to Section 12(g) of the Act: None__________________________________
Indicate by check mark if the registrant is a well-known seasoned issuer, as defined in Rule 405 of the Securities Act.
Yes A No MIndicate by check mark if the registrant is not required to file reports pursuant to Section 13 or Section 15(d) of the Act.
Yes M No AIndicate by check mark whether the registrant (1) has filed all reports required to be filed by Section 13 or 15(d) of the Securities
Exchange Act of 1934 during the preceding 12 months (or for such shorter period that the registrant was required to file such reports)and (2) has been subject to such filing requirements for the past 90 days.
Yes A No MIndicate by check mark whether the registrant has submitted electronically every Interactive Data File required to be submitted
pursuant to Rule 405 of Regulation S-T during the preceding 12 months (or for such shorter period that the registrant was required tosubmit such files).
Yes A No MIndicate by check mark whether the registrant is a large accelerated filer, an accelerated filer, a non-accelerated filer, a smaller
reporting company or an emerging growth company. See the definitions of “large accelerated filer,” “accelerated filer,” “smaller reportingcompany” and “emerging growth company” in Rule 12b-2 of the Exchange Act.
Large accelerated filer A Accelerated filer M Non-accelerated filer M
Smaller reporting company M Emerging growth company M
If an emerging growth company, indicate by check mark if the registrant has elected not to use the extended transition period forcomplying with any new or revised financial accounting standards provided pursuant to Section 13(a) of the Exchange Act. M
Indicate by check mark whether the registrant has filed a report on and attestation to its management’s assessment of theeffectiveness of its internal control over financial reporting under Section 404(b) of the Sarbanes-Oxley Act (15 U.S.C. 7262(b)) by theregistered public accounting firm that prepared or issued its audit report. H
Indicate by check mark whether the registrant is a shell company (as defined in Rule 12b-2 of the Exchange Act).
Yes M No A__________________________________
The aggregate market value of the voting and non-voting common stock held by non-affiliates as of June 30, 2020 was$11,583,494,559. As of February 11, 2021, there were 215,014,390 shares of Omnicom Group Inc. Common Stock outstanding.
Portions of the Omnicom Group Inc. Definitive Proxy Statement for the Annual Meeting of Shareholders scheduled to be held onMay 4, 2021 are incorporated by reference into Part III of this report to the extent described herein.
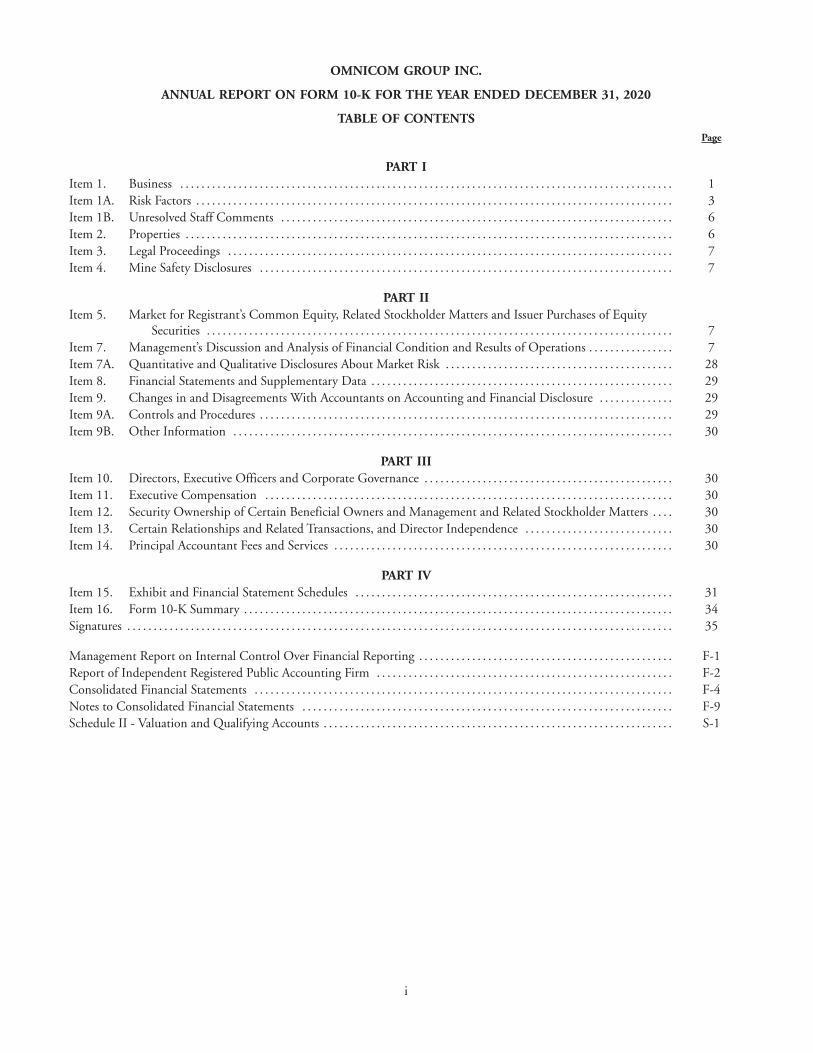
OMNICOM GROUP INC.
ANNUAL REPORT ON FORM 10-K FOR THE YEAR ENDED DECEMBER 31, 2020
TABLE OF CONTENTSPage
PART IItem 1. Business . . . . . . . . . . . . . . . . . . . . . . . . . . . . . . . . . . . . . . . . . . . . . . . . . . . . . . . . . . . . . . . . . . . . . . . . . . . . . . . . . . . . . . . . . . . . . 1Item 1A. Risk Factors . . . . . . . . . . . . . . . . . . . . . . . . . . . . . . . . . . . . . . . . . . . . . . . . . . . . . . . . . . . . . . . . . . . . . . . . . . . . . . . . . . . . . . . . . . 3Item 1B. Unresolved Staff Comments . . . . . . . . . . . . . . . . . . . . . . . . . . . . . . . . . . . . . . . . . . . . . . . . . . . . . . . . . . . . . . . . . . . . . . . . . . 6Item 2. Properties . . . . . . . . . . . . . . . . . . . . . . . . . . . . . . . . . . . . . . . . . . . . . . . . . . . . . . . . . . . . . . . . . . . . . . . . . . . . . . . . . . . . . . . . . . . . 6Item 3. Legal Proceedings . . . . . . . . . . . . . . . . . . . . . . . . . . . . . . . . . . . . . . . . . . . . . . . . . . . . . . . . . . . . . . . . . . . . . . . . . . . . . . . . . . . . 7Item 4. Mine Safety Disclosures . . . . . . . . . . . . . . . . . . . . . . . . . . . . . . . . . . . . . . . . . . . . . . . . . . . . . . . . . . . . . . . . . . . . . . . . . . . . . . 7
PART IIItem 5. Market for Registrant’s Common Equity, Related Stockholder Matters and Issuer Purchases of Equity
Securities . . . . . . . . . . . . . . . . . . . . . . . . . . . . . . . . . . . . . . . . . . . . . . . . . . . . . . . . . . . . . . . . . . . . . . . . . . . . . . . . . . . . . . . . 7Item 7. Management’s Discussion and Analysis of Financial Condition and Results of Operations . . . . . . . . . . . . . . . . 7Item 7A. Quantitative and Qualitative Disclosures About Market Risk . . . . . . . . . . . . . . . . . . . . . . . . . . . . . . . . . . . . . . . . . . . 28Item 8. Financial Statements and Supplementary Data . . . . . . . . . . . . . . . . . . . . . . . . . . . . . . . . . . . . . . . . . . . . . . . . . . . . . . . . . 29Item 9. Changes in and Disagreements With Accountants on Accounting and Financial Disclosure . . . . . . . . . . . . . . 29Item 9A. Controls and Procedures . . . . . . . . . . . . . . . . . . . . . . . . . . . . . . . . . . . . . . . . . . . . . . . . . . . . . . . . . . . . . . . . . . . . . . . . . . . . . . 29Item 9B. Other Information . . . . . . . . . . . . . . . . . . . . . . . . . . . . . . . . . . . . . . . . . . . . . . . . . . . . . . . . . . . . . . . . . . . . . . . . . . . . . . . . . . . 30
PART IIIItem 10. Directors, Executive Officers and Corporate Governance . . . . . . . . . . . . . . . . . . . . . . . . . . . . . . . . . . . . . . . . . . . . . . . 30Item 11. Executive Compensation . . . . . . . . . . . . . . . . . . . . . . . . . . . . . . . . . . . . . . . . . . . . . . . . . . . . . . . . . . . . . . . . . . . . . . . . . . . . . 30Item 12. Security Ownership of Certain Beneficial Owners and Management and Related Stockholder Matters . . . . 30Item 13. Certain Relationships and Related Transactions, and Director Independence . . . . . . . . . . . . . . . . . . . . . . . . . . . . 30Item 14. Principal Accountant Fees and Services . . . . . . . . . . . . . . . . . . . . . . . . . . . . . . . . . . . . . . . . . . . . . . . . . . . . . . . . . . . . . . . . 30
PART IVItem 15. Exhibit and Financial Statement Schedules . . . . . . . . . . . . . . . . . . . . . . . . . . . . . . . . . . . . . . . . . . . . . . . . . . . . . . . . . . . . 31Item 16. Form 10-K Summary . . . . . . . . . . . . . . . . . . . . . . . . . . . . . . . . . . . . . . . . . . . . . . . . . . . . . . . . . . . . . . . . . . . . . . . . . . . . . . . . . 34Signatures . . . . . . . . . . . . . . . . . . . . . . . . . . . . . . . . . . . . . . . . . . . . . . . . . . . . . . . . . . . . . . . . . . . . . . . . . . . . . . . . . . . . . . . . . . . . . . . . . . . . . . . 35
Management Report on Internal Control Over Financial Reporting . . . . . . . . . . . . . . . . . . . . . . . . . . . . . . . . . . . . . . . . . . . . . . . . F-1Report of Independent Registered Public Accounting Firm . . . . . . . . . . . . . . . . . . . . . . . . . . . . . . . . . . . . . . . . . . . . . . . . . . . . . . . . F-2Consolidated Financial Statements . . . . . . . . . . . . . . . . . . . . . . . . . . . . . . . . . . . . . . . . . . . . . . . . . . . . . . . . . . . . . . . . . . . . . . . . . . . . . . . F-4Notes to Consolidated Financial Statements . . . . . . . . . . . . . . . . . . . . . . . . . . . . . . . . . . . . . . . . . . . . . . . . . . . . . . . . . . . . . . . . . . . . . . F-9Schedule II - Valuation and Qualifying Accounts . . . . . . . . . . . . . . . . . . . . . . . . . . . . . . . . . . . . . . . . . . . . . . . . . . . . . . . . . . . . . . . . . . S-1
i
FORWARD-LOOKING STATEMENTS
Certain statements in this Annual Report on Form 10-K constitute forward-looking statements, including statements withinthe meaning of the Private Securities Litigation Reform Act of 1995. In addition, from time to time, the Company or itsrepresentatives have made, or may make, forward-looking statements, orally or in writing. These statements may discuss goals,intentions and expectations as to future plans, trends, events, results of operations or financial condition, or otherwise, based oncurrent beliefs of the Company’s management as well as assumptions made by, and information currently available to, theCompany’s management. Forward-looking statements may be accompanied by words such as “aim,” “anticipate,” “believe,” “plan,”“could,” “should,” “would,” “estimate,” “expect,” “forecast,” “future,” “guidance,” “intend,” “may,” “will,” “possible,” “potential,”“predict,” “project” or similar words, phrases or expressions. These forward-looking statements are subject to various risks anduncertainties, many of which are outside the Company’s control. Therefore, you should not place undue reliance on suchstatements. Factors that could cause actual results to differ materially from those in the forward-looking statements include: theimpact of the COVID-19 pandemic, international, national or local economic conditions that could adversely affect the Companyor its clients; losses on media purchases and production costs incurred on behalf of clients; reductions in client spending, aslowdown in client payments and a deterioration in the credit markets; the ability to attract new clients and retain existing clients inthe manner anticipated; changes in client advertising, marketing and corporate communications requirements; failure to managepotential conflicts of interest between or among clients; unanticipated changes relating to competitive factors in the advertising,marketing and corporate communications industries; the ability to hire and retain key personnel; currency exchange ratefluctuations; reliance on information technology systems; changes in legislation or governmental regulations affecting the Companyor its clients; risks associated with assumptions the Company makes in connection with its critical accounting estimates and legalproceedings; and the Company’s international operations, which are subject to the risks of currency repatriation restrictions, socialor political conditions and regulatory environment. The foregoing list of factors is not exhaustive. You should carefully consider theforegoing factors and the other risks and uncertainties that may affect the Company’s business, including those described in Item1A, “Risk Factors” and Item 7, “Management’s Discussion and Analysis of Financial Condition and Results of Operations” in thisreport. Except as required under applicable law, the Company does not assume any obligation to update theseforward-looking statements.
ii
PART I
Introduction
This report is our 2020 annual report to shareholders and our 2020 Annual Report on Form 10-K, or 2020 10-K.
Omnicom Group Inc., a New York corporation formed in 1986, through its branded networks and agencies providesadvertising, marketing and corporate communications services to over 5,000 clients in more than 70 countries. The terms“Omnicom,” “the Company,” “we,” “our” and “us” each refer to Omnicom Group Inc. and its subsidiaries unless the contextindicates otherwise.
Item 1. Business
Our Business
Omnicom is a strategic holding company providing advertising, marketing and corporate communications services to clientsthrough our branded networks and agencies around the world. We operate in a highly competitive industry and compete againstother global, national and regional advertising and marketing services companies, as well as technology, social media andprofessional services companies. The proliferation of media channels, including the rapid development and integration ofinteractive technologies and media, has fragmented consumer audiences targeted by our clients. These developments make it morecomplex for marketers to reach their target audiences in a cost-effective way, causing them to turn to global service providers such asOmnicom for a customized mix of advertising and marketing services designed to optimize their total marketing expenditure. Asdiscussed below, in 2020 the COVID-19 pandemic negatively impacted our business.
On a global, pan-regional and local basis, our networks and agencies provide a comprehensive range of services in thefollowing fundamental disciplines: advertising, customer relationship management, or CRM, which includes CRM ConsumerExperience and CRM Execution & Support, public relations and healthcare. Advertising includes creative services, as well asstrategic media planning and buying and data analytics services. CRM Consumer Experience includes Omnicom’s PrecisionMarketing Group and digital/direct agencies, as well as our branding, shopper marketing and experiential marketing agencies.CRM Execution & Support includes field marketing, sales support, merchandising and point of sale, as well as other specializedmarketing and custom communications services. Public relations services include corporate communications, crisis management,public affairs and media and media relations services. Healthcare includes advertising and media services to global healthcareclients. Our business model was built and continues to evolve around our clients. Our fundamental business principle is that ourclients’ specific marketing requirements are the central focus of how we structure our service offerings and allocate our resources.This client-centric business model requires that multiple agencies within Omnicom collaborate in formal and informal virtualclient networks utilizing our key client matrix organization structure. This collaboration allows us to cut across our internalorganizational structures to execute our clients’ marketing requirements in a consistent and comprehensive manner. We use ourclient-centric approach to grow our business by expanding our service offerings to existing clients, moving into new markets andobtaining new clients. In addition to collaborating through our client service models, our agencies and networks collaborate acrossinternally developed technology platforms. Annalect, our proprietary data and analytics platform, serves as the strategic resource forall of our agencies and networks to share when developing client service strategies across our virtual networks. Omni, ourpeople-based precision marketing and insights platform, identifies and defines personalized consumer experiences at scale acrosscreative, media and CRM, as well as other disciplines.
Driven by our clients’ continuous demand for more effective and efficient marketing activities, we strive to provide anextensive range of advertising, marketing and corporate communications services through various client-centric networks that areorganized to meet specific client objectives. Our service offerings include:
advertising investor relationsbranding marketing researchcontent marketing media planning and buyingcorporate social responsibility consulting merchandising and point of salecrisis communications mobile marketingcustom publishing multi-cultural marketingdata analytics non-profit marketingdatabase management organizational communicationsdigital/direct marketing package designdigital transformation product placemententertainment marketing promotional marketingexperiential marketing public affairsfield marketing public relationsfinancial/corporate business-to-business advertising retail marketing
1
graphic arts/digital imaging sales supporthealthcare marketing and communications search engine marketinginstore design shopper marketinginteractive marketing social media marketing
sports and event marketing
Certain business trends had positively impacted our business and industry. These trends include clients increasingly expanding thefocus of their brand strategies from national markets to pan-regional and global markets and integrating traditional and non-traditionalmarketing channels, as well as utilizing new communications technologies and emerging digital platforms. As clients increase theirdemands for marketing effectiveness and efficiency, they continue to consolidate their business within one or a small number of serviceproviders in the pursuit of a single engagement covering all consumer touch points. We have structured our business around these trends.We believe that our key client matrix organization structure approach to collaboration and integration of our services and solutionsprovides a competitive advantage to our business in the past and we expect this to continue over the medium and long term. Our keyclient matrix organization structure facilitates superior client management and allows for greater integration of the services required by theworld’s largest brands. Our overarching strategy is to continue to use our virtual client networks to grow our business relationships withour largest clients by serving them across our networks, disciplines and geographies.
In 2020, the COVID-19 pandemic negatively impacted our business and results of operations. Efforts to mitigate the impactof the pandemic, including government actions to restrict travel, limit public gatherings, shelter-in-place orders and mandatoryclosures of businesses, resulted in many of our clients reducing or suspending their spending for our advertising, marketing andcorporate communication services. As a result, for the year ended December 31, 2020, revenue decreased 11.9%, compared to2019, primarily due to the impact of the COVID-19 pandemic. We anticipate that the negative impact from the pandemic on ourrevenue will continue through the first quarter of 2021 as compared to the prior year period. However, we expect organic revenuegrowth for the first half of 2021. The impact of the COVID-19 pandemic on our revenue has been, and may continue to be,material, depending on several factors, including the potential for prolonged or additional governmental actions to mitigate theeffects of the pandemic. It is possible that the COVID-19 pandemic will accelerate certain trends that began pre-pandemic,particularly those relating to online commerce, brand building and how we deploy our personnel. We expect that some of thesetrends will benefit our agencies and provide revenue growth opportunities, as well as increasing flexibility with respect to our use ofphysical locations and our cost structure, but some trends may negatively affect us including potential disruption by newparticipants and technologies (see Item 7, “Management’s Discussion and Analysis of Financial Condition and Results ofOperations,” or MD&A, of this report).
We continually evaluate our portfolio of businesses to identify areas for investment and acquisition opportunities, as well as toidentify non-strategic or underperforming businesses for disposition. For information about our acquisitions and dispositions, seeMD&A - Acquisitions and Goodwill and Notes 5 and 13, respectively, to the consolidated financial statements. None of ouracquisitions or dispositions, individually or in the aggregate, was material to our results of operations or financial position in thethree years ended December 31, 2020.
The various components of our business, including revenue by discipline and geographic area, and material factors thataffected us in 2020 are discussed in the MD&A.
Our Clients
Our clients operate in virtually every sector of the global economy. In many cases, multiple agencies or networks servedifferent brands, product groups or both within the same client. For example, in 2020 our largest client represented 3.4% ofrevenue and was served by more than 110 of our agencies. Our 100 largest clients, many of which represent the largest globalmarketers, represented approximately 54% of revenue and were each served, on average, by more than 50 of our agencies.
Government Regulations
We are subject to various local, state and federal laws and regulations in the countries in which we conduct business.Compliance with these laws and regulations in the normal course of business did not have a material effect on our business, resultsof operations or financial position. Additional information regarding the impact of government regulations on our business isincluded in Item 1A. Risk Factors under the heading Regulatory Risks.
Human Capital Resources
Our employees are our most important assets. We believe a critical component to our success depends on the ability to attract,develop and retain key personnel. The skill sets of our workforce across our agencies and within each discipline are similar.Common to all is the ability to understand a client’s brand or product and its selling proposition and to develop a unique message
2
to communicate the value of the brand or product to the client’s target audience, whether through traditional channels or emergingdigital platforms. Recognizing the importance of this core competency, we support and develop our employees through trainingand development programs that build and strengthen employees’ leadership and professional skills.
Human capital management strategies are developed collectively by senior management, including the management teams ofthe Company’s networks and practice areas, and are overseen by the Company’s Board of Directors. We are committed to effortsthat ensure that the workplace is equitable, ethical, fosters an inclusive work environment across our global workforce and respectshuman rights. Our human capital management priorities include, among other things, providing competitive wages and benefits,succession planning, promoting diversity and inclusion and adopting codes of conduct and business ethics to be implementedthroughout the Company.
At December 31, 2020, we employed approximately 64,100 people worldwide. The United States, our largest employee base,employed about 20,800 people. None of our regular employees in the United States is represented by a labor union. Theapproximate number of employees in our principal geographic regions were 27,100 in the Americas, 25,800 in Europe, MiddleEast and Africa, or EMEA, and 11,200 in Asia Pacific. Certain employees in a few countries outside of the United States, primarilyin Europe, are represented by work councils. See the MD&A for a discussion of the effect of salary and related costs on our resultsof operations.
Information About Our Executive Officers
At February 11, 2021, our executive officers were:
Name Position Age
John D. Wren . . . . . . . . . . . . . . . . . . . . . . . . . . . . . . . . . . . . . . . . . . . . . . . . . Chairman of the Board and Chief Executive Officer 68
Philip J. Angelastro . . . . . . . . . . . . . . . . . . . . . . . . . . . . . . . . . . . . . . . . . . . . Executive Vice President and Chief Financial Officer 56
Michael J. O’Brien . . . . . . . . . . . . . . . . . . . . . . . . . . . . . . . . . . . . . . . . . . . . . Executive Vice President, General Counsel and Secretary 59
Andrew L. Castellaneta . . . . . . . . . . . . . . . . . . . . . . . . . . . . . . . . . . . . . . . . Senior Vice President, Chief Accounting Officer 62
Peter L. Swiecicki . . . . . . . . . . . . . . . . . . . . . . . . . . . . . . . . . . . . . . . . . . . . . . Senior Vice President, Finance and Controller 62
Rochelle M. Tarlowe . . . . . . . . . . . . . . . . . . . . . . . . . . . . . . . . . . . . . . . . . . . Senior Vice President and Treasurer 50
Jonathan B. Nelson . . . . . . . . . . . . . . . . . . . . . . . . . . . . . . . . . . . . . . . . . . . . CEO, Omnicom Digital 53
Each executive officer has held their present position for at least five years, except Mr. Wren was named Chairman of theBoard and Chief Executive Officer in May 2018 and previously served as President and Chief Executive Officer from 1997 to May2018; and Ms. Tarlowe was named Senior Vice President and Treasurer in May 2019 and previously served as Senior Vice Presidentand Treasurer of Avis Budget Group from 2007 until April 2019. Additional information about our directors and executive officerswill appear in our definitive proxy statement, which is expected to be filed with the United States Securities and ExchangeCommission, or SEC, by March 25, 2021.
Available Information
We file annual, quarterly and current reports and any amendments to those reports, proxy statements and other informationwith the SEC. Documents we file with the SEC are available free of charge on our website at http://investor.omnicomgroup.com,as soon as reasonably practicable after such material is filed with the SEC. The information included on or available through ourwebsite is not part of this or any other report we file with the SEC. Any document that we file with the SEC is available on theSEC’s website at www.sec.gov.
Item 1A. Risk Factors
Economic Risks
The COVID-19 pandemic has adversely impacted our business, results of operations and financial position and couldadversely impact our business, results of operations and financial position in the future.
In 2020, the COVID-19 pandemic negatively impacted our business, results of operations and financial position. Most of ourclients’ businesses were negatively affected by the COVID-19 pandemic. As long as the COVID-19 pandemic remains a threat,global economic conditions will continue to be volatile and such uncertainty cuts across all clients, industries and geographies.Demand for our services can be expected to continue to be adversely affected as marketers reduce expenditures in the short termdue to the uncertain impact of the pandemic on the global economy. The extent of the impact of the COVID-19 pandemic on ourbusiness will depend on numerous factors that we are not able to accurately predict, including the duration and scope of thepandemic, government actions to mitigate the effects of the pandemic, and the intermediate and long-term impact of the pandemicon marketers’ spending plans.
3
Adverse economic conditions, a reduction in client spending, a deterioration in the credit markets or a delay in clientpayments could have a material effect on our business, results of operations and financial position.
Economic conditions have a direct impact on our business, results of operations and financial position. Adverse global orregional economic conditions, including those caused by the COVID-19 pandemic, pose a risk that clients may reduce, postponeor cancel spending on advertising, marketing and corporate communications projects. Such actions would reduce the demand forour services and could result in a reduction in our revenue, which would adversely affect our business, results of operations andfinancial position. A contraction in the availability of credit may make it more difficult for us to meet our working capitalrequirements. In addition, a disruption in the credit markets could adversely affect our clients and could cause them to delaypayment for our services or take other actions that would negatively affect our working capital. In such circumstances, we may needto obtain additional financing to fund our day-to-day working capital requirements, which may not be available on favorable terms,or at all. Even if we take action to respond to adverse economic conditions, reductions in revenue and disruptions in the creditmarkets by aligning our cost structure and more efficiently managing our working capital, such actions may not be effective.
In an economic downturn, the risk of a material loss related to media purchases and production costs incurred on behalf of ourclients could significantly increase, and methods for managing or mitigating such risk may be less available or unavailable.
In the normal course of business, our agencies enter into contractual commitments with media providers and production companieson behalf of our clients at levels that can substantially exceed the revenue from our services. These commitments are included in accountspayable when the services are delivered by the media providers or production companies. If permitted by local law and the clientagreement, many of our agencies purchase media and production services for our clients as an agent for a disclosed principal. In addition,while operating practices vary by country, media type and media vendor, in the United States and certain foreign markets, many of ouragencies’ contracts with media and production providers specify that our agencies are not liable to the media and production providersunder the theory of sequential liability until and to the extent we have been paid by our client for the media or production services.
Where purchases of media and production services are made by our agencies as a principal or are not subject to the theory ofsequential liability, the risk of a material loss as a result of payment default by our clients could increase significantly and such a loss couldhave a material adverse effect on our business, results of operations and financial position.
In addition, our methods of managing the risk of payment default, including obtaining credit insurance, requiring payment inadvance, mitigating the potential loss in the marketplace or negotiating with media providers, may be less available or unavailable during asevere economic downturn.
Business and Operational Risks
Clients periodically review and change their advertising, marketing and corporate communications requirements andrelationships. If we are unable to remain competitive or retain key clients, our business, results of operations and financialposition may be adversely affected.
We operate in a highly competitive industry. Key competitive considerations for retaining existing clients and winning new clientsinclude our ability to develop solutions that meet client needs in a rapidly changing environment, the quality and effectiveness of ourservices and our ability to serve clients efficiently, particularly large multinational clients, on a broad geographic basis. While many of ourclient relationships are long-standing, from time to time clients put their advertising, marketing and corporate communications businessup for competitive review. We have won and lost accounts as a result of these reviews. To the extent that we are not able to remaincompetitive or retain key clients, our revenue may be adversely affected, which could have a material adverse effect on our business, resultsof operations and financial position.
Acquiring new clients and retaining existing clients depends on our ability to avoid and manage conflicts of interestarising from other client relationships, retaining key personnel and maintaining a highly skilled workforce.
Our ability to acquire new clients and retain existing clients may, in some cases, be limited by clients’ perceptions of, or policiesconcerning, conflicts of interest arising from other client relationships. If we are unable to maintain multiple agencies to manage multipleclient relationships and avoid potential conflicts of interests, our business, results of operations and financial position may beadversely affected.
As a service business, our ability to attract and retain key personnel is an important aspect of our competitiveness. If we areunable to attract and retain key personnel, our ability to provide our services in the manner clients have come to expect may beadversely affected, which could harm our reputation and result in a loss of clients, which could have a material adverse effect on ourbusiness, results of operations and financial position.
4
The loss of several of our largest clients could have a material adverse effect on our business, results of operations andfinancial position.
In 2020, our 100 largest clients represented approximately 54% of our revenue. Clients generally are able to reduce or cancelcurrent or future spending on advertising, marketing and corporate communications projects at any time on short notice for anyreason. A significant reduction in spending on our services by our largest clients, or the loss of several of our largest clients, if notreplaced by new clients or an increase in business from existing clients, would adversely affect our revenue and could have a materialadverse effect on our business, results of operations and financial position.
We rely extensively on information technology systems, and cybersecurity incidents could adversely affect us.
We rely on information technology systems and infrastructure to process, store and transmit data, summarize results, manageour business and maintain client advertising and marketing information. Increased cybersecurity threats and attacks, which areconstantly evolving, pose a risk to our systems and networks. For example, in February 2021, we experienced a cybersecurityincident that resulted in the disruption of certain of our information technology systems at one of our networks. Based on theinformation currently known and our investigation to date, we do not believe the incident will have a material impact on ourbusiness, operations or financial results. However, cybersecurity threats and attacks in the future could be material. Securitybreaches, improper use of our systems and unauthorized access to our data and information by employees and others may pose arisk that sensitive data may be exposed to unauthorized persons or to the public. We also have access to sensitive or personal data orinformation that is subject to privacy laws and regulations. Our systems and processes to protect against, detect, prevent, respond toand mitigate cybersecurity incidents and our organizational training for employees to develop an understanding of cybersecurityrisks and threats may be unable to prevent material security breaches, theft, modification or loss of data, employee malfeasance andadditional known and unknown threats. Such events could adversely affect our business and reputation. We also use third-partyservice providers, including cloud providers, to store, transmit and process data. These third-party service providers could also besubject to cybersecurity incidents that could adversely affect us.
In addition, in 2020 and continuing into 2021, the overwhelming majority of our workforce temporarily transitioned toworking from home during the COVID-19 pandemic. The increase in the number of our employees working from home mayincrease certain business and procedural control risks, including increased risk of cybersecurity incidents and exposure of sensitivebusiness and client advertising and marketing information as well as personal data or information.
Risks Related to International Operations
Currency exchange rate fluctuations have impacted, and in the future could impact our business, results of operations andfinancial position.
In 2020, our international operations represented approximately 45% of our revenue. We operate in all major internationalmarkets including the Euro Zone, the United Kingdom, or the U.K., Australia, Brazil, Canada, China and Japan. Our agenciestransact business in more than 50 different currencies. Substantially all of our foreign operations transact business in their localcurrency, and accordingly their financial statements are translated into U.S. Dollars. As a result, both adverse and beneficialfluctuations in foreign exchange rates impact our business, results of operations and financial position. In addition, fundstransferred to the United States can be adversely or beneficially impacted by changes in foreign currency exchange rates.
As a global business we face certain risks of doing business internationally, and we are exposed to risks from operating inhigh-growth markets and developing countries, which could have a material adverse effect on our business, results ofoperations and financial position.
The operational and financial performance of our international businesses are affected by global and regional economicconditions, competition for new business and staff, currency exchange rate fluctuations, political conditions, differing regulatoryenvironments and other risks associated with extensive international operations. In addition, we conduct business in numeroushigh-growth markets and developing countries that tend to have longer billing collection cycles, currency repatriation restrictionsand commercial laws that can be undeveloped, vague, inconsistently enforced, retroactively applied or frequently changed. The risksassociated with our international operations could have a material adverse effect on our business, results of operations and financialposition. Additionally, our operations are subject to the United States Foreign Corrupt Practices Act and other anti-corruption andanti-bribery laws and regulations. These laws and regulations are complex and stringent, and any violation could have an adverseeffect on our business and reputation. For financial information by geographic region, see Note 8 to the consolidatedfinancial statements.
We have substantial operations in the U.K. and the Euro Zone. On December 31, 2020, the U.K. completed its separationfrom the European Union, or E.U., (commonly referred to as “Brexit”) and entered into an agreement, or Brexit Agreement, withthe E.U. that defines the terms of their relationship, covering, among other things, trade and tariffs, services and travel. Theuncertainties related to the impact of the Brexit Agreement have cross-border operational, financial and tax implications, amongothers, and any economic volatility that may arise in the U.K., the E.U. or elsewhere may adversely affect our business.
5
Risks Related to Acquisitions
We may be unsuccessful in evaluating material risks involved in completed and future acquisitions.
We regularly evaluate potential acquisitions of businesses that are complementary to our businesses and client needs. As partof the process, we conduct business, legal and financial due diligence to identify and evaluate material risks involved in anyparticular transaction. Despite our efforts, we may be unsuccessful in ascertaining or evaluating all such risks. As a result, theintended advantages of any given acquisition may not be realized. If we fail to identify certain material risks from one or moreacquisitions, our business, results of operations and financial position could be adversely affected.
Our goodwill is an intangible asset that may become impaired, which could have a material adverse effect on ourbusiness, results of operations and financial position.
In accordance with generally accepted accounting principles in the United States, or U.S. GAAP or GAAP, we have recorded asignificant amount of goodwill related to our acquisitions; a substantial portion of which represents the intangible specializedknow-how of the acquired workforce. As discussed in Note 2 to the consolidated financial statements, we review the carrying valueof goodwill for impairment annually at June 30 and whenever events or circumstances indicate the carrying value may not berecoverable. The estimates and assumptions about future results of operations and cash flows made in connection with theimpairment testing could differ from future actual results of operations and cash flows. While we have concluded, for each yearpresented in the financial statements included in this report, that our goodwill is not impaired, future events could cause us toconclude that the intangible asset values associated with a given operation may become impaired. Any resulting non-cashimpairment charge could have a material adverse effect on our business, results of operations and financial position.
Regulatory Risks
Government regulation and consumer advocates may limit the scope and content of our services, which could affect ourability to meet our clients’ needs, which could have a material adverse effect on our business, results of operations andfinancial position.
Government agencies and consumer groups directly or indirectly affect or attempt to affect the scope, content and manner ofpresentation of advertising, marketing and corporate communications services, through regulation or other governmental action,which could affect our ability to meet our clients’ needs. Such regulation may seek, among other things, to limit the taxdeductibility of advertising expenditures by certain industries or for certain products and services. In addition, there has been atendency on the part of businesses to resort to the judicial system to challenge advertising practices and claims, which could causeour clients affected by such actions to reduce their spending on our services. Any regulatory or judicial action that affects our abilityto meet our clients’ needs or reduces client spending on our services could have a material adverse effect on our business, results ofoperations and financial position.
Further, laws and regulations related to user privacy, use of personal information and Internet tracking technologies have beenproposed or enacted in the United States and a number of international markets. These laws and regulations could affect theacceptance of new communications technologies and the use of current communications technologies as advertising media. Theseactions could affect our business and reduce demand for certain of our services, which could have a material adverse effect on ourbusiness, results of operations and financial position.
We could be affected by future laws or regulations enacted in response to climate change concerns and other actions.
Our businesses could be indirectly affected by increased prices for goods or services provided to us by companies that aredirectly affected by laws and regulations aimed at mitigating the impact of climate change. Specifically, these companies may seek topass their increased costs through to their customers. Further, if our clients are impacted by such laws or requirements, eitherdirectly or indirectly, their spending for advertising and marketing services may decline, which could adversely impact our business,results of operations and financial position. Additionally, to comply with potential future changes in environmental laws andregulations, we may need to incur additional costs; therefore, at this time, we cannot estimate what impact such regulations mayhave on our business, results of operations and financial position.
Item 1B. Unresolved Staff Comments
None.
Item 2. Properties
We conduct business and maintain offices throughout the world. The facility requirements of our businesses are similar acrossgeographic regions and disciplines. Substantially all our office space is leased under operating leases with varying expiration dates.Lease obligations of our foreign operations are generally denominated in their local currency. We believe that our facilities areadequate for our current operations and are well maintained. Our principal corporate offices are located at 280 Park Avenue,
6
New York, New York; 1055 Washington Boulevard, Stamford, Connecticut and 525 Okeechobee Boulevard, West Palm Beach,Florida. We also maintain executive offices in London, England; Shanghai, China and Singapore.
Notes 2 and 16 to the consolidated financial statements provide a description of our lease expense, which comprises asignificant component of our occupancy and other costs, and our lease commitments.
Item 3. Legal Proceedings
In the ordinary course of business, we are involved in various legal proceedings. We do not expect that these proceedings willhave a material adverse effect on our results of operations or financial position.
Item 4. Mine Safety Disclosures
Not Applicable.
PART II
Item 5. Market for Registrant’s Common Equity, Related Stockholder Matters and Issuer Purchases of Equity Securities
Our common stock is listed and traded on the New York Stock Exchange under the symbol OMC. As of February 11, 2021,there were 1,930 registered holders of our common stock.
Common stock repurchases during the three months ended December 31, 2020 were:
PeriodTotal Number ofShares Purchased
Average PricePaid Per Share
Total Number ofShares Purchased
as Part of PubliclyAnnounced Plans
or Programs
Maximum Number ofShares that May YetBe Purchased Under
the Plans or Programs
October 1 - October 31, 2020 . . . . . . . . . . . . . . . . . . . . . . . . . 51,487 $50.22 — —November 1 - November 30, 2020 . . . . . . . . . . . . . . . . . . . . . — — — —December 1 - December 31, 2020 . . . . . . . . . . . . . . . . . . . . . . 5,316 64.34 — —
56,803 $51.54 — —
During the three months ended December 31, 2020, we withheld 56,803 shares from employees to satisfy estimated statutoryincome tax obligations related to the vesting of restricted stock awards. We did not purchase any shares of our common stock in theopen market. The value of the common stock withheld was based on the closing price of our common stock on the applicablevesting or exercise date. There were no unregistered sales of equity securities during the three months ended December 31, 2020.
For information on securities authorized for issuance under our equity compensation plans, see Item 12, “Security Ownershipof Certain Beneficial Owners and Management and Related Stockholder Matters,” which relevant information will be included inour definitive proxy statement, which is expected to be filed with the SEC by March 25, 2021.
Item 7. Management’s Discussion and Analysis of Financial Condition and Results of Operations
EXECUTIVE SUMMARY
Impact of the COVID-19 Pandemic on our Business
In 2020, the COVID-19 pandemic negatively impacted our business and results of operations. Efforts to mitigate the impact of thepandemic, including government actions to restrict travel, limit public gatherings, shelter-in-place orders and mandatory closures ofbusinesses, resulted in many of our clients reducing or suspending their spending for our advertising, marketing and corporatecommunication services. As a result, for the year ended December 31, 2020, revenue decreased $1,782.6 million, or 11.9%, compared to2019, primarily due to the impact of the COVID-19 pandemic. We anticipate that the negative impact from the pandemic on ourrevenue will continue through the first quarter of 2021 as compared to the prior year period. However, we expect organic revenue growthfor the first half of 2021. The impact of the COVID-19 pandemic on our revenue has been, and may continue to be, material, dependingon several factors, including the potential for prolonged or additional governmental actions to mitigate the effects of the pandemic. It ispossible that the COVID-19 pandemic will accelerate certain trends that began pre-pandemic, particularly those relating to onlinecommerce, brand building and how we deploy our personnel. We expect that some of these trends will benefit our agencies and providerevenue growth opportunities, as well as increasing flexibility with respect to our use of physical locations and our cost structure, but sometrends may negatively affect us including potential disruption by new participants and technologies.
In response to the impact of the COVID-19 pandemic, in the second quarter of 2020, we took actions to align our cost structureand reduce our workforce and facility requirements and continued the review of businesses for disposal and assets for impairment. As aresult, we recorded a pre-tax charge of $277.9 million, which is comprised of incremental severance of $150.0 million, real estate
7
operating lease right-of-use, or ROU, asset and other asset impairment charges of $55.8 million, other exit costs of $47.0 million anddispositions and other charges of $25.1 million (see Note 1 to the consolidated financial statements). These actions reduced headcount byover 6,000 and reduced the related facility requirements, which should result in significant reductions in future operating expenses.
In addition, during 2020, we reduced salary and service costs by $162.6 million related to reimbursements and tax credits undergovernment programs in several countries, including the Coronavirus Aid, Relief, and Economic Security Act, or the CARES Act, in theUnited States, the Kurzarbeit program in Germany, and other government reimbursement programs in the U.K., France, Canada andother jurisdictions (see Note 1 to the consolidated financial statements). Further, in the fourth quarter of 2020, we recorded assetimpairment charges of $55.8 million associated with underperforming assets, which is included in salary and service costs.
The COVID-19 pandemic negatively impacted most of our clients’ businesses. As a result, clients have cut costs, includingpostponing or reducing marketing communication expenditures. While certain industries such as healthcare and pharmaceuticals,technology and telecommunications, financial services and consumer products have been less affected, as long as the COVID-19pandemic remains a threat, global economic conditions continue to be volatile and such uncertainty cuts across all clients, industries andgeographies. Overall, while we have a diversified portfolio of service offerings, clients and geographies, demand for our services can beexpected to continue to be adversely affected as marketers reduce expenditures in the short term due to the uncertain impact of thepandemic on the global economy. We expect global economic performance and our performance to vary by geography until the impact ofthe COVID-19 pandemic on the global economy moderates.
Although we have experienced a decrease in our cash flow from operating activities, we took numerous proactive steps to strengthenour liquidity and financial position that are intended to mitigate the potential impact of the COVID-19 pandemic on our liquidity. InFebruary 2020, we issued $600 million 2.45% Senior Notes due April 30, 2030, or the 2.45% Notes. In March 2020, the net proceedsfrom the issuance of the 2.45% Notes were used to redeem the remaining $600 million principal amount of our 4.45% Senior Notes dueAugust 15, 2020, or the 2020 Notes. As a result, we have no notes maturing until May 2022. In April 2020, we issued $600 million of4.20% Senior Notes due June 1, 2030, or the 4.20% Notes, and we entered into a new $400 million 364 day revolving credit facility, orthe 364 Day Credit Facility. The 364 Day Credit Facility is in addition to our existing $2.5 billion multi-currency revolving credit facility,or Credit Facility, which we extended to mature in February 2025. In addition, in March 2020, we suspended our share repurchase activity.
Results of Operations for the Year Ended December 31, 2020
We are a strategic holding company providing advertising, marketing and corporate communications services to clientsthrough our branded networks and agencies around the world. On a global, pan-regional and local basis, our networks and agenciesprovide a comprehensive range of services in the following fundamental disciplines: advertising, CRM, which includes CRMConsumer Experience and CRM Execution & Support, public relations and healthcare. Our business model was built andcontinues to evolve around our clients. While our networks and agencies operate under different names and frame their ideas indifferent disciplines, we organize our services around our clients. Our fundamental business principle is that our clients’ specificmarketing requirements are the central focus of how we structure our service offerings and allocate our resources. This client-centricbusiness model requires that multiple agencies within Omnicom collaborate in formal and informal virtual client networks utilizingour key client matrix organization structure. This collaboration allows us to cut across our internal organizational structures toexecute our clients’ marketing requirements in a consistent and comprehensive manner. We use our client-centric approach to growour business by expanding our service offerings to existing clients, moving into new markets and obtaining new clients. In addition,we pursue selective acquisitions of complementary companies with strong entrepreneurial management teams that typicallycurrently serve or could serve our existing clients.
As a leading global advertising, marketing and corporate communications company, we operate in all major markets and havea large and diverse client base. In 2020, our largest client represented 3.4% of revenue and our 100 largest clients, which representmany of the world’s major marketers, represented approximately 54% of revenue. Our clients operate in virtually every sector of theglobal economy with no one industry representing more than 16% of our revenue in 2020. Although our revenue is generallybalanced between the United States and international markets and we have a large and diverse client base, we are not immune togeneral economic downturns.
Global economic conditions have a direct impact on our business and financial performance. Adverse global or regionaleconomic conditions, such as those currently arising from the COVID-19 pandemic, pose a risk that our clients may reduce,postpone or cancel spending on advertising, marketing and corporate communications services, which would reduce the demandfor our services. Revenue is typically lower in the first and third quarters and higher in the second and fourth quarters, reflectingclient spending patterns during the year and additional project work that usually occurs in the fourth quarter. As a result of theimpact related to the COVID-19 pandemic, we experienced a significant decline in our year-over-year organic revenue growth inthe second, third and fourth quarters of 2020, which will likely continue at least through the first half of 2021. We anticipate thatthe negative impact from the pandemic on our revenue will continue through the first quarter of 2021 as compared to the prioryear period. However, we expect organic revenue growth for the first half of 2021.
8
In 2020, revenue decreased $1,782.6 million, or 11.9%, compared to 2019. Changes in foreign exchange rates reducedrevenue $60.9 million, or 0.4%, acquisition revenue, net of disposition revenue, reduced revenue $56.7 million, or 0.4%, reflectingthe disposition of certain non-strategic businesses, and organic growth reduced revenue $1,665.0 million, or 11.1%.
Certain global events targeted by major marketers for advertising expenditures, such as the FIFA World Cup and theOlympics, and certain national events, such as the U.S. election process, may affect our revenue period-over-period in certainbusinesses. Typically, these events do not have a significant impact on our revenue in any period.
Beginning in March 2020 and continuing through the fourth quarter of 2020, our business experienced the effects fromreductions in client spending due to the impact related to the COVID-19 pandemic. The spending reductions impacted all ourbusinesses and markets. The most significantly impacted businesses were our advertising discipline, CRM Consumer Experiencediscipline, especially in our event marketing businesses, and CRM Execution & Support discipline, primarily in our field marketingand merchandising businesses. In North America, we experienced a decline in organic revenue attributable to the COVID-19pandemic in all our disciplines, except healthcare. In Europe and the Middle East and Africa, almost all businesses and regionsexperienced a decline in organic revenue resulting from the COVID-19 pandemic, which was marginally offset by an increaseprimarily from the strengthening of the British Pound and Euro against the U.S. Dollar. In addition, the economic and politicalconditions in the U.K. and the E.U. resulting from the implementation of the Brexit Agreement remain uncertain and couldnegatively impact our businesses in the U.K. and the E.U. In Latin America, the impact of the COVID-19 pandemic compoundedby the continuing unstable economic and political conditions in Brazil resulted in negative organic growth in Brazil andthroughout the region. In addition, the weakening of foreign currency exchange rates against the U.S. Dollar in all countriesfurther contributed to the reduction in revenue in the region. In Asia-Pacific, almost all our businesses in the region experiencednegative organic growth as a result of the COVID-19 pandemic, and the weakening of most currencies against the U.S. Dollar hada marginal negative impact on revenue. The economic and fiscal issues, including the impact related to the COVID-19 pandemic,facing the countries we operate in can be expected to continue to cause economic uncertainty and volatility; however, the impacton our business varies by country. We monitor economic conditions closely, as well as client revenue levels and other factors. Inresponse to reductions in our revenue that are expected to continue at least through the first half of 2021, beginning in the secondquarter of 2020, we took actions to align our cost structure with changes in client demand and manage our working capital.However, there can be no assurance whether, or to what extent, our efforts to mitigate any impact of the current and future adverseeconomic conditions, reductions in client revenue, changes in client creditworthiness and other developments will be effective orthat additional actions will not be necessary.
Prior to the COVID-19 pandemic, certain business trends generally had a positive impact on our business and industry. Thesetrends include clients increasingly expanding the focus of their brand strategies from national markets to pan-regional and globalmarkets and integrating traditional and non-traditional marketing channels, as well as utilizing new communications technologiesand emerging digital platforms. As clients increase their demands for marketing effectiveness and efficiency, they have made it apractice to consolidate their business within one service provider in the pursuit of a single engagement covering all consumer touchpoints. We have structured our business around these trends. While the current economic environment caused many clients toreduce spending for our services, certain trends such as increased spending on digital marketing platforms, and our key clientmatrix organization structure approach to collaboration and integration of our services and solutions provide a competitiveadvantage to our business. We expect this advantage to continue over the medium and long term.
Driven by our clients’ continuous demand for more effective and efficient marketing activities, we strive to provide anextensive range of advertising, marketing and corporate communications services through various client-centric networks that areorganized to meet specific client objectives. These services include, among others, advertising, brand consulting, content marketing,corporate social responsibility consulting, crisis communications, custom publishing, data analytics, database management, digital/direct marketing, digital transformation, entertainment marketing, experiential marketing, field marketing, financial/corporatebusiness-to-business advertising, graphic arts/digital imaging, healthcare marketing and communications, in-store design,interactive marketing, investor relations, marketing research, media planning and buying, merchandising and point of sale, mobilemarketing, multi-cultural marketing, non-profit marketing, organizational communications, package design, product placement,promotional marketing, public affairs, public relations, retail marketing, sales support, search engine marketing, shopper marketing,social media marketing and sports and event marketing.
We continually evaluate our portfolio of businesses to identify areas for investment and acquisition opportunities, as well as toidentify non-strategic or underperforming businesses for disposition. In the first and second quarters of 2019, we disposed ofcertain businesses, primarily in our CRM Execution & Support discipline.
9
Given our size and breadth, we manage our business by monitoring several financial indicators. The key indicators that wefocus on are revenue and operating expenses. We analyze revenue growth by reviewing the components and mix of the growth,including growth by principal regional market and marketing discipline, the impact from foreign currency exchange rate changes,growth from acquisitions, net of dispositions, and growth from our largest clients. Operating expenses are comprised of cost ofservices, selling, general and administrative expenses, or SG&A, and depreciation and amortization.
In 2020, our revenue decreased 11.9% compared to 2019. Changes in foreign exchange rates reduced revenue 0.4%,acquisition revenue, net of disposition revenue, reduced revenue 0.4%, and organic growth decreased revenue 11.1% as all ourmarkets were negatively impacted by the COVID-19 pandemic. The change in revenue across our principal regional markets were:North America decreased 10.6%, Europe decreased 12.2%, Asia-Pacific decreased 8.8% and Latin America decreased 31.7%. Thechange in revenue in 2020, compared to 2019, in our fundamental disciplines was: Advertising decreased 13.1%, CRM ConsumerExperience decreased 15.6%, CRM Execution & Support decreased 16.7%, Public Relations decreased 5.6% and Healthcareincreased 3.4%.
We measure cost of services in two distinct categories: salary and service costs and occupancy and other costs. As a servicebusiness, salary and service costs make up the significant portion of our operating expenses and substantially all these costs comprisethe essential components directly linked to the delivery of our services. Salary and service costs include employee compensation andbenefits, freelance labor and third-party service costs, which include third-party supplier costs and client-related travel costs.Occupancy and other costs consist of the indirect costs related to the delivery of our services, including office rent and otheroccupancy costs, equipment rent, technology costs, general office expenses and other expenses.
SG&A expenses, which decreased year-over-year, primarily consist of third-party marketing costs, professional fees andcompensation and benefits and occupancy and other costs of our corporate and executive offices, which includes group-widefinance and accounting, treasury, legal and governance, human resource oversight and similar costs.
In 2020, salary and service costs, which tend to fluctuate with changes in revenue, decreased $1,399.4 million, or 12.8%,compared to 2019. Salary and related service costs in 2020 decreased $644.3 million, or 9.3%, year-over-year, primarily as a resultof the severance and furlough actions we took in the second quarter of 2020. Also, during 2020, we reduced salary and service costsby $162.6 million related to reimbursements and tax credits under government programs in several countries (see Note 1 to theconsolidated financial statements). Third-party service costs, which include expenses incurred with third-party vendors primarilywhen we act as a principal when performing services for our clients, decreased $755.1 million, or 18.5%, year-over-year reflectingthe decrease in revenue and the impact of actions we took to align our cost structure. Occupancy and other costs, which are lessdirectly linked to changes in revenue than salary and service costs, decreased $83.3 million, or 6.8%, in 2020 as compared to 2019.Operating profit decreased $523.5 million to $1,598.8 million. Operating margin decreased to 12.1% from 14.2%, and EBITAmargin decreased to 12.8% from 14.8% year-over-year. In 2020, operating profit, operating margin and EBITA margin included anet decrease aggregating $171.1 million related to the COVID-19 repositioning costs recorded in the second quarter and assetimpairment charges recorded in the fourth quarter, partially offset by an increase related to reimbursements and tax credits undergovernment programs in several countries (see Note 1 to the consolidated financial statements).
In 2020, net interest expense increased $5.5 million year-over-year to $189.5 million. Interest expense on debt decreased$27.6 million to $199.6 million, primarily reflecting a reduction in interest expense from our refinancing activity at lower interestrates in the second half of 2019 and the first quarter of 2020, partially offset by a loss of $7.7 million on the early redemption ofthe remaining $600 million principal amount of the 2020 Notes in the first quarter of 2020 and the interest expense from theissuance of the 4.20% Notes in April 2020 (see Note 7 to the consolidated financial statements). Interest income in 2020 decreased$28.0 million year-over-year to $32.3 million primarily due to lower rates.
Our effective tax rate for 2020 increased year-over-year to 27.1% from 26.0%. The non-deductibility in certain jurisdictionsof a portion of the COVID-19 repositioning costs recorded in the second quarter of 2020 had the effect of increasing our effectivetax rate for 2020. This increase was substantially offset by a lower effective tax rate on our foreign earnings resulting from a changein legislation. In 2019, income tax expense was reduced by $10.8 million primarily from the net favorable settlements of uncertaintax positions in certain jurisdictions. After considering these items, our effective rate for 2020 would have approximated the ratefor 2019.
Net income - Omnicom Group Inc. in 2020 decreased $393.7 million to $945.4 million from $1,339.1 million in 2019. Theyear-over-year decrease is due to the factors described above. Diluted net income per share - Omnicom Group Inc. decreased to$4.37 in 2020, compared to $6.06 in 2019, due to the factors described above, as well as the impact of the reduction in ourweighted average common shares outstanding resulting from repurchases of our common stock through March 2020, net of sharesissued for restricted stock awards, stock option exercises and the employee stock purchase plan during the year. As discussed above
10
and in Note 1 to the consolidated financial statements, our results of operations for 2020 included COVID-19 repositioning costsand asset impairment charges, which were partially offset by an increase attributable to reimbursements and tax credits undergovernment programs in several countries. The after-tax impact of these items on net income - Omnicom Group Inc. was$146.8 million.
CRITICAL ACCOUNTING POLICIES
The following summary of our critical accounting policies provides a better understanding of our financial statements and therelated discussion in this MD&A. We believe that the following policies may involve a higher degree of judgment and complexityin their application than most of our accounting policies and represent the critical accounting policies used in the preparation ofour financial statements. Readers are encouraged to consider this summary together with our financial statements and the relatednotes, including Note 2, for a more complete understanding of the critical accounting policies discussed below.
Estimates
We prepare our financial statements in conformity with U.S. GAAP and are required to make estimates and assumptions thataffect the amounts reported in the consolidated financial statements and accompanying notes. We use a fair value approach intesting goodwill for impairment and when evaluating our equity method investments to determine if an other-than-temporaryimpairment has occurred. Actual results could differ from those estimates and assumptions.
Acquisitions and Goodwill
The evaluation of potential acquisitions is based on various factors, including specialized know-how, reputation, geographiccoverage, competitive position and service offerings of the target businesses, as well as our experience and judgment.
Our acquisition strategy is focused on acquiring the expertise of an assembled workforce in order to continue to build uponthe core capabilities of our various strategic business platforms and agency brands through the expansion of their geographic reachor their service capabilities to better serve our clients. Additional key factors we consider include the competitive position andspecialized know-how of the acquisition targets. Accordingly, as is typical in most service businesses, a substantial portion of theassets we acquire are intangible assets primarily consisting of the know-how of the personnel, which is treated as part of goodwilland is not required to be valued separately under U.S. GAAP. For each acquisition, we undertake a detailed review to identify otherintangible assets that are required to be valued separately. A significant portion of the identifiable intangible assets acquired isderived from customer relationships, including the related customer contracts, as well as trade names. In valuing these identifiedintangible assets, we typically use an income approach and consider comparable market participant measurements.
We evaluate goodwill for impairment at least annually at the end of the second quarter of each fiscal year and whenever eventsor circumstances indicate the carrying value may not be recoverable. Under FASB ASC Topic 350, Intangibles - Goodwill and Other,we have the option of either assessing qualitative factors to determine whether it is more-likely-than-not that the carrying value ofour reporting units exceeds their respective fair value or proceeding directly to the goodwill impairment test. We performed theannual impairment test and compared the fair value of each of our reporting units to its respective carrying value, includinggoodwill. We identified our regional reporting units as components of our operating segments, which are our five global agencynetworks. The regional reporting units of each agency network are responsible for the agencies in their region. They report to thesegment managers and facilitate the administrative and logistical requirements of our key client matrix organization structure fordelivering services to clients in their regions. We have concluded that for each of our operating segments, their regional reportingunits have similar economic characteristics and should be aggregated for purposes of testing goodwill for impairment at theoperating segment level. Our conclusion was based on a detailed analysis of the aggregation criteria set forth in FASB ASC Topic280, Segment Reporting, and in FASB ASC Topic 350. Consistent with our fundamental business strategy, the agencies within ourregional reporting units serve similar clients in similar industries, and in many cases the same clients. In addition, the agencieswithin our regional reporting units have similar economic characteristics. The main economic components of each agency areemployee compensation and related costs and direct service costs and occupancy and other costs, which include rent and occupancycosts, technology costs that are generally limited to personal computers, servers and off-the-shelf software and other overheadexpenses. Finally, the expected benefits of our acquisitions are typically shared by multiple agencies in various regions as they worktogether to integrate the acquired agency into our virtual client network strategy.
Goodwill Impairment Review - Estimates and Assumptions
We use the following valuation methodologies to determine the fair value of our reporting units: (1) the income approach,which utilizes discounted expected future cash flows, (2) comparative market participant multiples for EBITDA (earnings beforeinterest, taxes, depreciation and amortization) and (3) when available, consideration of recent and similar acquisition transactions.
11
In applying the income approach, we use estimates to derive the discounted expected cash flows (“DCF”) for each reportingunit that serves as the basis of our valuation. These estimates and assumptions include revenue growth and operating margin,EBITDA, tax rates, capital expenditures, weighted average cost of capital and related discount rates and expected long-term cashflow growth rates. All of these estimates and assumptions are affected by conditions specific to our businesses, economic conditionsrelated to the industry we operate in, as well as conditions in the global economy. The assumptions that have the most significanteffect on our valuations derived using a DCF methodology are: (1) the expected long-term growth rate of our reporting units’ cashflows and (2) the weighted average cost of capital (“WACC”) for each reporting unit.
At June 30, 2020 we adjusted our assumptions to reflect the economic conditions in light of the impact on our businessrelated to the COVID-19 pandemic, including downward adjustment to our revenue and earnings assumptions, reducing ourlong-term growth rate and increasing the weighted average cost of capital, or WACC, for each reporting unit and limiting ourestimate of our equity value to reflect the decline in our share price that occurred during the first half of 2020. In addition, theassumptions reflected the expected cost reductions from our severance and real estate facility repositioning actions (see Notes 1 and11 to the consolidated financial statements).
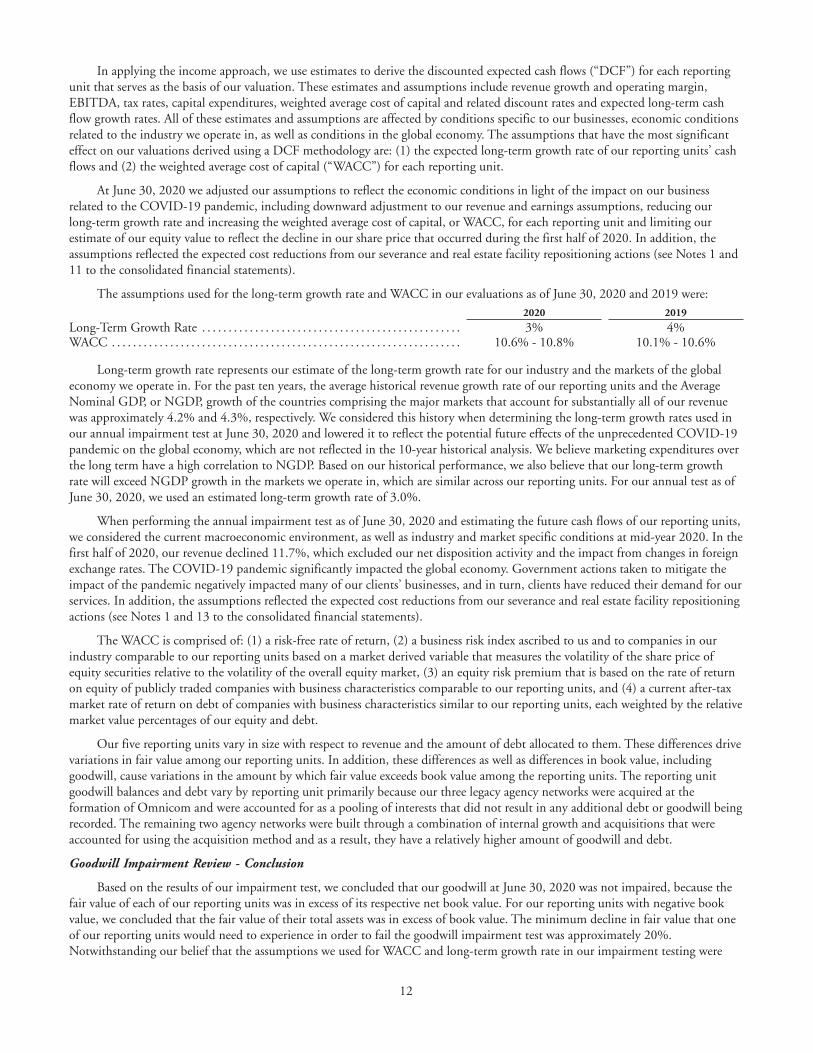
The assumptions used for the long-term growth rate and WACC in our evaluations as of June 30, 2020 and 2019 were:2020 2019
Long-Term Growth Rate . . . . . . . . . . . . . . . . . . . . . . . . . . . . . . . . . . . . . . . . . . . . . . . . . 3% 4%WACC . . . . . . . . . . . . . . . . . . . . . . . . . . . . . . . . . . . . . . . . . . . . . . . . . . . . . . . . . . . . . . . . . . 10.6% - 10.8% 10.1% - 10.6%
Long-term growth rate represents our estimate of the long-term growth rate for our industry and the markets of the globaleconomy we operate in. For the past ten years, the average historical revenue growth rate of our reporting units and the AverageNominal GDP, or NGDP, growth of the countries comprising the major markets that account for substantially all of our revenuewas approximately 4.2% and 4.3%, respectively. We considered this history when determining the long-term growth rates used inour annual impairment test at June 30, 2020 and lowered it to reflect the potential future effects of the unprecedented COVID-19pandemic on the global economy, which are not reflected in the 10-year historical analysis. We believe marketing expenditures overthe long term have a high correlation to NGDP. Based on our historical performance, we also believe that our long-term growthrate will exceed NGDP growth in the markets we operate in, which are similar across our reporting units. For our annual test as ofJune 30, 2020, we used an estimated long-term growth rate of 3.0%.
When performing the annual impairment test as of June 30, 2020 and estimating the future cash flows of our reporting units,we considered the current macroeconomic environment, as well as industry and market specific conditions at mid-year 2020. In thefirst half of 2020, our revenue declined 11.7%, which excluded our net disposition activity and the impact from changes in foreignexchange rates. The COVID-19 pandemic significantly impacted the global economy. Government actions taken to mitigate theimpact of the pandemic negatively impacted many of our clients’ businesses, and in turn, clients have reduced their demand for ourservices. In addition, the assumptions reflected the expected cost reductions from our severance and real estate facility repositioningactions (see Notes 1 and 13 to the consolidated financial statements).
The WACC is comprised of: (1) a risk-free rate of return, (2) a business risk index ascribed to us and to companies in ourindustry comparable to our reporting units based on a market derived variable that measures the volatility of the share price ofequity securities relative to the volatility of the overall equity market, (3) an equity risk premium that is based on the rate of returnon equity of publicly traded companies with business characteristics comparable to our reporting units, and (4) a current after-taxmarket rate of return on debt of companies with business characteristics similar to our reporting units, each weighted by the relativemarket value percentages of our equity and debt.
Our five reporting units vary in size with respect to revenue and the amount of debt allocated to them. These differences drivevariations in fair value among our reporting units. In addition, these differences as well as differences in book value, includinggoodwill, cause variations in the amount by which fair value exceeds book value among the reporting units. The reporting unitgoodwill balances and debt vary by reporting unit primarily because our three legacy agency networks were acquired at theformation of Omnicom and were accounted for as a pooling of interests that did not result in any additional debt or goodwill beingrecorded. The remaining two agency networks were built through a combination of internal growth and acquisitions that wereaccounted for using the acquisition method and as a result, they have a relatively higher amount of goodwill and debt.
Goodwill Impairment Review - Conclusion
Based on the results of our impairment test, we concluded that our goodwill at June 30, 2020 was not impaired, because thefair value of each of our reporting units was in excess of its respective net book value. For our reporting units with negative bookvalue, we concluded that the fair value of their total assets was in excess of book value. The minimum decline in fair value that oneof our reporting units would need to experience in order to fail the goodwill impairment test was approximately 20%.Notwithstanding our belief that the assumptions we used for WACC and long-term growth rate in our impairment testing were
12
reasonable, we performed a sensitivity analysis for each of our reporting units. The results of this sensitivity analysis on ourimpairment test as of June 30, 2020 revealed that if the WACC increased by 1% and/or the long-term growth rate decreased by1%, the fair value of each of our reporting units would continue to be in excess of its respective net book value and would pass theimpairment test.
We will continue to perform our impairment test each year at June 30th unless events or circumstances trigger the need for aninterim impairment test. There were no events through December 31, 2020 that would change our impairment assessment. Theestimates used in our goodwill impairment test do not constitute forecasts or projections of future results of operations, but ratherare estimates and assumptions based on historical results and assessments of macroeconomic factors affecting our reporting units asof the valuation date. We believe that our estimates and assumptions are reasonable, but they are subject to change from period toperiod. Actual results of operations and other factors will likely differ from the estimates used in our discounted cash flowvaluation, and it is possible that differences could be significant. A change in the estimates we use could result in a decline in theestimated fair value of one or more of our reporting units from the amounts derived as of our latest valuation and could cause us tofail our goodwill impairment test if the estimated fair value for the reporting unit is less than the carrying value of the net assets ofthe reporting unit, including its goodwill. A large decline in estimated fair value of a reporting unit could result in a non-cashimpairment charge and may have an adverse effect on our results of operations and financial condition. Additional informationabout acquisitions and goodwill appears in Notes 2, 5 and 6 to the consolidated financial statements.
Revenue Recognition
Revenue is recognized when a customer obtains control of promised goods or services (the performance obligation) in anamount that reflects the consideration we expect to receive in exchange for those goods or services (the transaction price). Wemeasure revenue by estimating the transaction price based on the consideration specified in the client arrangement. Revenue isrecognized as the performance obligations are satisfied. Our revenue is primarily derived from the planning and execution ofadvertising communications and marketing services in the following fundamental disciplines: advertising, which includes creativeadvertising services and strategic media planning and buying services, customer relationship management or CRM, which includesCRM Consumer Experience and CRM Execution & Support, public relations and healthcare advertising. Our client contracts areprimarily fees for service on a rate per hour or per project basis. Revenue is recorded net of sales, use and value added taxes.
Performance Obligations. In substantially all our disciplines, the performance obligation is to provide advisory andconsulting services at an agreed-upon level of effort to accomplish the specified engagement. Our client contracts are comprised ofdiverse arrangements involving fees based on any one or a combination of the following: an agreed fee or rate per hour for the levelof effort expended by our employees; commissions based on the client’s spending for media purchased from third parties;qualitative or quantitative incentive provisions specified in the contract; and reimbursement for third-party costs that we arerequired to include in revenue when we control the vendor services related to these costs and we act as principal. The transactionprice of a contract is allocated to each distinct performance obligation based on its relative stand-alone selling price and isrecognized as revenue when, or as, the customer receives the benefit of the performance obligation. Clients typically receive andconsume the benefit of our services as they are performed. Substantially all our client contracts provide that we are compensated forservices performed to date and allow for cancellation by either party on short notice, typically 90 days, without penalty.
Generally, our short-term contracts, which normally take 30 to 90 days to complete, are performed by a single agency andconsist of a single performance obligation. As a result, we do not consider the underlying services as separate or distinctperformance obligations because our services are highly interrelated, occur in close proximity, and the integration of the variouscomponents of a marketing message is essential to overall service. In certain of our long-term client contracts, which have a term ofup to one year, the performance obligation is a stand-ready obligation, because we provide a constant level of similar services overthe term of the contract. In other long-term contracts, when our services are not a stand-ready obligation, we consider our servicesdistinct performance obligations and allocate the transaction price to each separate performance obligation based on its stand-aloneselling price, including contracts for strategic media planning and buying services, which are considered to be multiple performanceobligations, and we allocate the transaction price to each distinct service based on the staffing plan and the stand-alone selling price.In substantially all of our creative services contracts, we have distinct performance obligations for our services, including certaincreative services contracts where we act as an agent and arrange, at the client’s direction, for third parties to perform studioproduction efforts.
Revenue Recognition Methods. A substantial portion of our revenue is recognized over time, as the services are performed,because the client receives and consumes the benefit of our performance throughout the contract period, or we create an asset withno alternative use and are contractually entitled to payment for our performance to date in the event the client terminates thecontract for convenience. For these client contracts, other than when we have a stand-ready obligation to perform services, revenueis recognized over time using input measures that correspond to the level of staff effort expended to satisfy the performanceobligation on a rate per hour or equivalent basis. For client contracts when we have a stand-ready obligation to perform services onan ongoing basis over the life of the contract, typically for periods up to one year, where the scope of these arrangements is broad
13
and there are no significant gaps in performing the services, we recognize revenue using a time-based measure resulting in astraight-line revenue recognition. From time to time, there may be changes in the client service requirements during the term of acontract and the changes could be significant. These changes are typically negotiated as new contracts covering the additionalrequirements and the associated costs, as well as additional fees for the incremental work to be performed.
To a lesser extent, for certain other contracts where our performance obligations are satisfied in phases, we recognize revenueover time using certain output measures based on the measurement of the value transferred to the customer, including milestonesachieved. Where the transaction price or a portion of the transaction price is derived from commissions based on a percentage ofpurchased media from third parties, the performance obligation is not satisfied until the media is run and we have an enforceablecontract providing a right to payment. Accordingly, revenue for commissions is recognized at a point in time, typically when themedia is run, including when it is not subject to cancellation by the client or media vendor.
Principal vs. Agent. In substantially all our businesses, we incur third-party costs on behalf of clients, including direct costsand incidental, or out-of-pocket costs. Third-party direct costs incurred in connection with the creation and delivery of advertisingor marketing communication services include, among others: purchased media, studio production services, specialized talent,including artists and other freelance labor, event marketing supplies, materials and services, promotional items, market research andthird-party data and other related expenditures. Out-of-pocket costs include, among others: transportation, hotel, meals andtelecommunication charges incurred by us in the course of providing our services. Billings related to out-of-pocket costs areincluded in revenue since we control the goods or services prior to delivery to the client.
However, the inclusion of billings related to third-party direct costs in revenue depends on whether we act as a principal or asan agent in the client arrangement. In most of our businesses, including advertising, which also includes studio production effortsand media planning and buying services, public relations, healthcare advertising and most of our CRM Consumer Experiencebusinesses, we act as an agent and arrange, at the client’s direction, for third parties to perform certain services. In these cases, we donot control the goods or services prior to the transfer to the client. As a result, revenue is recorded net of these costs, equal to theamount retained for our fee or commission.
In certain businesses we may act as principal when contracting for third-party services on behalf of our clients. In our eventsbusiness and most of our CRM Execution & Support businesses, including field marketing and certain specialty marketingbusinesses, we act as principal because we control the specified goods or services before they are transferred to the client and we areresponsible for providing the specified goods or services, or we are responsible for directing and integrating third-party vendors tofulfill our performance obligation at the agreed upon contractual price. In such arrangements, we also take pricing risk under theterms of the client contract. In certain specialty media buying businesses, we act as principal when we control the buying processfor the purchase of the media and contract directly with the media vendor. In these arrangements, we assume the pricing risk underthe terms of the client contract. When we act as principal, we include billable amounts related to third-party costs in thetransaction price and record revenue over time at the gross amount billed, including out-of-pocket costs, consistent with themanner that we recognize revenue for the underlying services contract. However, in media buying contracts where we act asprincipal, we recognize revenue at a point in time, typically when the media is run, including when it is not subject to cancellationby the client or media vendor.
Variable Consideration. Some of our client arrangements include variable consideration provisions, which includeperformance incentives, tiered commission structures and vendor rebates in certain markets outside of the United States. Variableconsideration is estimated and included in total consideration at contract inception based on either the expected value method orthe most likely outcome method. These estimates are based on historical award experience, anticipated performance and otherfactors known at the time. Performance incentives are typically recognized in revenue over time. Variable consideration for ourmedia businesses in certain international markets includes rebate revenue and is recognized when it is probable that the media willbe run, including when it is not subject to cancellation by the client. In addition, when we receive rebates or credits from vendorsfor transactions entered into on behalf of clients, they are remitted to the clients in accordance with contractual requirements orretained by us based on the terms of the client contract or local law. Amounts passed on to clients are recorded as a liability andamounts retained by us are recorded as revenue when earned, typically when the media is run.
NEW ACCOUNTING STANDARDS
See Note 22 to the consolidated financial statements for information on the adoption of new accounting standards andaccounting standards not yet adopted.
14
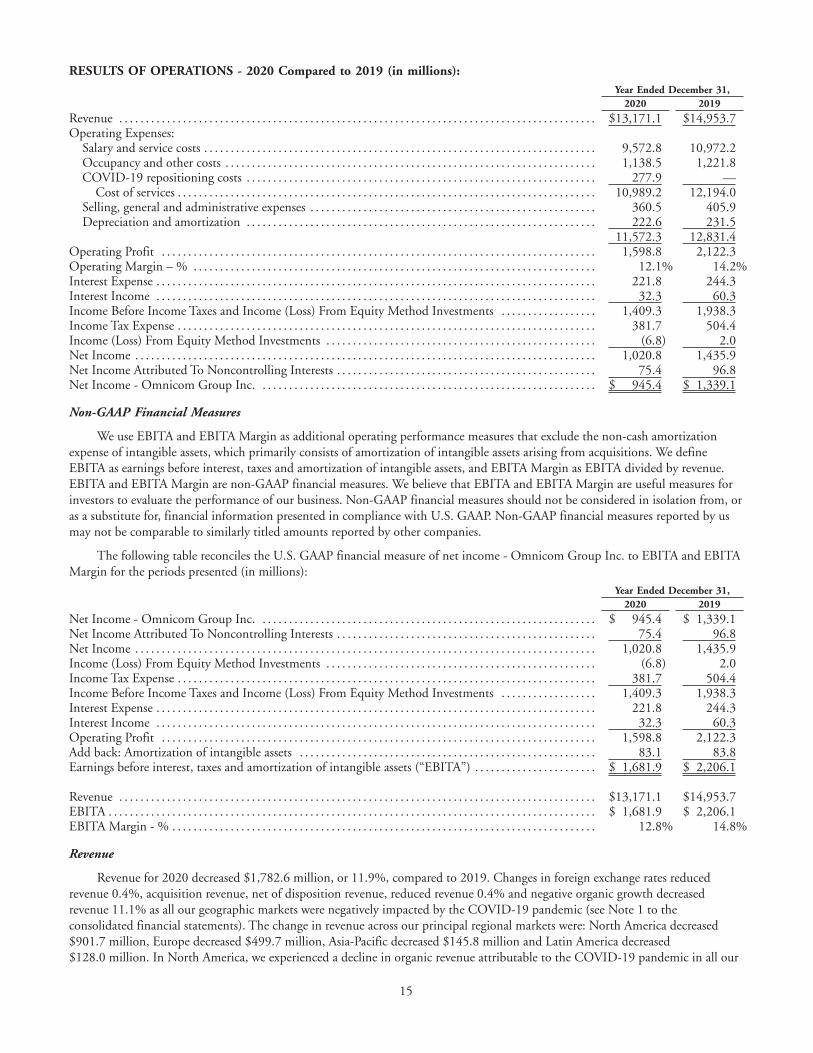
RESULTS OF OPERATIONS - 2020 Compared to 2019 (in millions):Year Ended December 31,
2020 2019
Revenue . . . . . . . . . . . . . . . . . . . . . . . . . . . . . . . . . . . . . . . . . . . . . . . . . . . . . . . . . . . . . . . . . . . . . . . . . . . . . . . . . . . . . . . . . . $13,171.1 $14,953.7Operating Expenses:
Salary and service costs . . . . . . . . . . . . . . . . . . . . . . . . . . . . . . . . . . . . . . . . . . . . . . . . . . . . . . . . . . . . . . . . . . . . . . . . . . 9,572.8 10,972.2Occupancy and other costs . . . . . . . . . . . . . . . . . . . . . . . . . . . . . . . . . . . . . . . . . . . . . . . . . . . . . . . . . . . . . . . . . . . . . . 1,138.5 1,221.8COVID-19 repositioning costs . . . . . . . . . . . . . . . . . . . . . . . . . . . . . . . . . . . . . . . . . . . . . . . . . . . . . . . . . . . . . . . . . . 277.9 —
Cost of services . . . . . . . . . . . . . . . . . . . . . . . . . . . . . . . . . . . . . . . . . . . . . . . . . . . . . . . . . . . . . . . . . . . . . . . . . . . . . . . 10,989.2 12,194.0Selling, general and administrative expenses . . . . . . . . . . . . . . . . . . . . . . . . . . . . . . . . . . . . . . . . . . . . . . . . . . . . . . 360.5 405.9Depreciation and amortization . . . . . . . . . . . . . . . . . . . . . . . . . . . . . . . . . . . . . . . . . . . . . . . . . . . . . . . . . . . . . . . . . . 222.6 231.5
11,572.3 12,831.4Operating Profit . . . . . . . . . . . . . . . . . . . . . . . . . . . . . . . . . . . . . . . . . . . . . . . . . . . . . . . . . . . . . . . . . . . . . . . . . . . . . . . . . . 1,598.8 2,122.3Operating Margin – % . . . . . . . . . . . . . . . . . . . . . . . . . . . . . . . . . . . . . . . . . . . . . . . . . . . . . . . . . . . . . . . . . . . . . . . . . . . . 12.1% 14.2%Interest Expense . . . . . . . . . . . . . . . . . . . . . . . . . . . . . . . . . . . . . . . . . . . . . . . . . . . . . . . . . . . . . . . . . . . . . . . . . . . . . . . . . . . 221.8 244.3Interest Income . . . . . . . . . . . . . . . . . . . . . . . . . . . . . . . . . . . . . . . . . . . . . . . . . . . . . . . . . . . . . . . . . . . . . . . . . . . . . . . . . . . 32.3 60.3Income Before Income Taxes and Income (Loss) From Equity Method Investments . . . . . . . . . . . . . . . . . . 1,409.3 1,938.3Income Tax Expense . . . . . . . . . . . . . . . . . . . . . . . . . . . . . . . . . . . . . . . . . . . . . . . . . . . . . . . . . . . . . . . . . . . . . . . . . . . . . . . 381.7 504.4Income (Loss) From Equity Method Investments . . . . . . . . . . . . . . . . . . . . . . . . . . . . . . . . . . . . . . . . . . . . . . . . . . . (6.8) 2.0Net Income . . . . . . . . . . . . . . . . . . . . . . . . . . . . . . . . . . . . . . . . . . . . . . . . . . . . . . . . . . . . . . . . . . . . . . . . . . . . . . . . . . . . . . . 1,020.8 1,435.9Net Income Attributed To Noncontrolling Interests . . . . . . . . . . . . . . . . . . . . . . . . . . . . . . . . . . . . . . . . . . . . . . . . . 75.4 96.8Net Income - Omnicom Group Inc. . . . . . . . . . . . . . . . . . . . . . . . . . . . . . . . . . . . . . . . . . . . . . . . . . . . . . . . . . . . . . . . $ 945.4 $ 1,339.1
Non-GAAP Financial Measures
We use EBITA and EBITA Margin as additional operating performance measures that exclude the non-cash amortizationexpense of intangible assets, which primarily consists of amortization of intangible assets arising from acquisitions. We defineEBITA as earnings before interest, taxes and amortization of intangible assets, and EBITA Margin as EBITA divided by revenue.EBITA and EBITA Margin are non-GAAP financial measures. We believe that EBITA and EBITA Margin are useful measures forinvestors to evaluate the performance of our business. Non-GAAP financial measures should not be considered in isolation from, oras a substitute for, financial information presented in compliance with U.S. GAAP. Non-GAAP financial measures reported by usmay not be comparable to similarly titled amounts reported by other companies.
The following table reconciles the U.S. GAAP financial measure of net income - Omnicom Group Inc. to EBITA and EBITAMargin for the periods presented (in millions):
Year Ended December 31,2020 2019
Net Income - Omnicom Group Inc. . . . . . . . . . . . . . . . . . . . . . . . . . . . . . . . . . . . . . . . . . . . . . . . . . . . . . . . . . . . . . . . $ 945.4 $ 1,339.1Net Income Attributed To Noncontrolling Interests . . . . . . . . . . . . . . . . . . . . . . . . . . . . . . . . . . . . . . . . . . . . . . . . . 75.4 96.8Net Income . . . . . . . . . . . . . . . . . . . . . . . . . . . . . . . . . . . . . . . . . . . . . . . . . . . . . . . . . . . . . . . . . . . . . . . . . . . . . . . . . . . . . . . 1,020.8 1,435.9Income (Loss) From Equity Method Investments . . . . . . . . . . . . . . . . . . . . . . . . . . . . . . . . . . . . . . . . . . . . . . . . . . . (6.8) 2.0Income Tax Expense . . . . . . . . . . . . . . . . . . . . . . . . . . . . . . . . . . . . . . . . . . . . . . . . . . . . . . . . . . . . . . . . . . . . . . . . . . . . . . . 381.7 504.4Income Before Income Taxes and Income (Loss) From Equity Method Investments . . . . . . . . . . . . . . . . . . 1,409.3 1,938.3Interest Expense . . . . . . . . . . . . . . . . . . . . . . . . . . . . . . . . . . . . . . . . . . . . . . . . . . . . . . . . . . . . . . . . . . . . . . . . . . . . . . . . . . . 221.8 244.3Interest Income . . . . . . . . . . . . . . . . . . . . . . . . . . . . . . . . . . . . . . . . . . . . . . . . . . . . . . . . . . . . . . . . . . . . . . . . . . . . . . . . . . . 32.3 60.3Operating Profit . . . . . . . . . . . . . . . . . . . . . . . . . . . . . . . . . . . . . . . . . . . . . . . . . . . . . . . . . . . . . . . . . . . . . . . . . . . . . . . . . . 1,598.8 2,122.3Add back: Amortization of intangible assets . . . . . . . . . . . . . . . . . . . . . . . . . . . . . . . . . . . . . . . . . . . . . . . . . . . . . . . . 83.1 83.8Earnings before interest, taxes and amortization of intangible assets (“EBITA”) . . . . . . . . . . . . . . . . . . . . . . . $ 1,681.9 $ 2,206.1 Revenue . . . . . . . . . . . . . . . . . . . . . . . . . . . . . . . . . . . . . . . . . . . . . . . . . . . . . . . . . . . . . . . . . . . . . . . . . . . . . . . . . . . . . . . . . . $13,171.1 $14,953.7EBITA . . . . . . . . . . . . . . . . . . . . . . . . . . . . . . . . . . . . . . . . . . . . . . . . . . . . . . . . . . . . . . . . . . . . . . . . . . . . . . . . . . . . . . . . . . . . $ 1,681.9 $ 2,206.1EBITA Margin - % . . . . . . . . . . . . . . . . . . . . . . . . . . . . . . . . . . . . . . . . . . . . . . . . . . . . . . . . . . . . . . . . . . . . . . . . . . . . . . . . 12.8% 14.8%
Revenue
Revenue for 2020 decreased $1,782.6 million, or 11.9%, compared to 2019. Changes in foreign exchange rates reducedrevenue 0.4%, acquisition revenue, net of disposition revenue, reduced revenue 0.4% and negative organic growth decreasedrevenue 11.1% as all our geographic markets were negatively impacted by the COVID-19 pandemic (see Note 1 to theconsolidated financial statements). The change in revenue across our principal regional markets were: North America decreased$901.7 million, Europe decreased $499.7 million, Asia-Pacific decreased $145.8 million and Latin America decreased$128.0 million. In North America, we experienced a decline in organic revenue attributable to the COVID-19 pandemic in all our
15
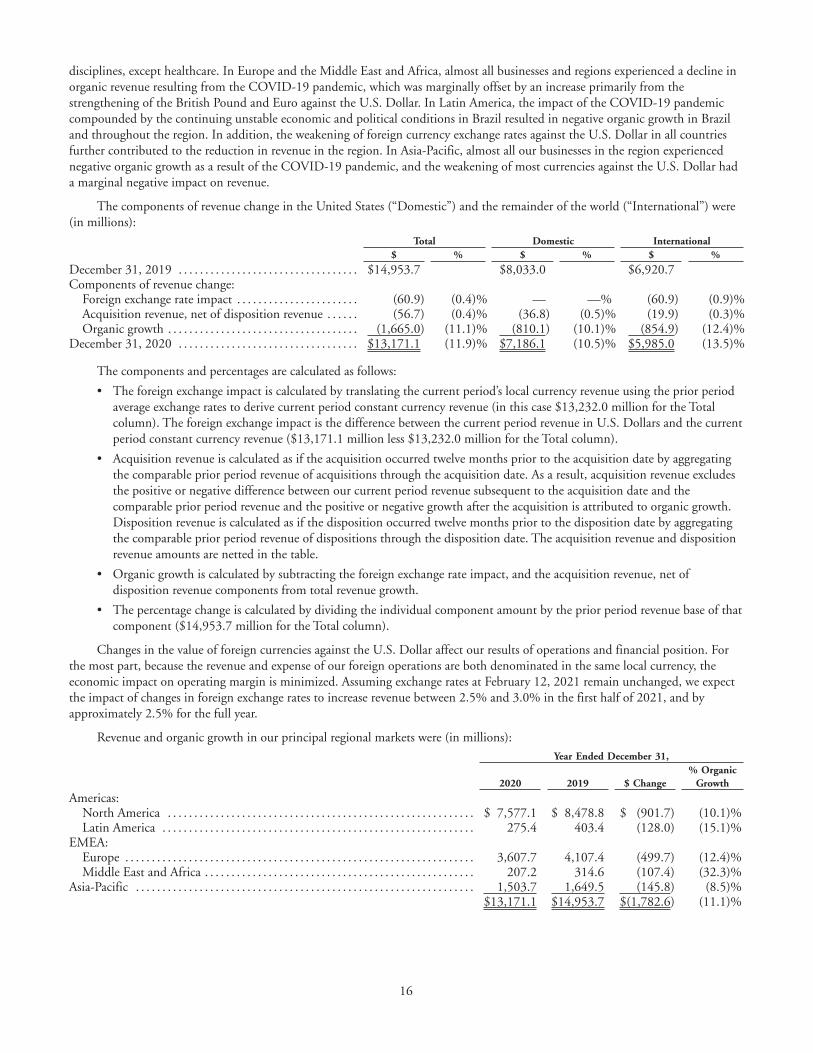
disciplines, except healthcare. In Europe and the Middle East and Africa, almost all businesses and regions experienced a decline inorganic revenue resulting from the COVID-19 pandemic, which was marginally offset by an increase primarily from thestrengthening of the British Pound and Euro against the U.S. Dollar. In Latin America, the impact of the COVID-19 pandemiccompounded by the continuing unstable economic and political conditions in Brazil resulted in negative organic growth in Braziland throughout the region. In addition, the weakening of foreign currency exchange rates against the U.S. Dollar in all countriesfurther contributed to the reduction in revenue in the region. In Asia-Pacific, almost all our businesses in the region experiencednegative organic growth as a result of the COVID-19 pandemic, and the weakening of most currencies against the U.S. Dollar hada marginal negative impact on revenue.
The components of revenue change in the United States (“Domestic”) and the remainder of the world (“International”) were(in millions):
Total Domestic International$ % $ % $ %
December 31, 2019 . . . . . . . . . . . . . . . . . . . . . . . . . . . . . . . . . . $14,953.7 $8,033.0 $6,920.7Components of revenue change:
Foreign exchange rate impact . . . . . . . . . . . . . . . . . . . . . . . (60.9) (0.4)% — —% (60.9) (0.9)%Acquisition revenue, net of disposition revenue . . . . . . (56.7) (0.4)% (36.8) (0.5)% (19.9) (0.3)%Organic growth . . . . . . . . . . . . . . . . . . . . . . . . . . . . . . . . . . . . (1,665.0) (11.1)% (810.1) (10.1)% (854.9) (12.4)%
December 31, 2020 . . . . . . . . . . . . . . . . . . . . . . . . . . . . . . . . . . $13,171.1 (11.9)% $7,186.1 (10.5)% $5,985.0 (13.5)%
The components and percentages are calculated as follows:
• The foreign exchange impact is calculated by translating the current period’s local currency revenue using the prior periodaverage exchange rates to derive current period constant currency revenue (in this case $13,232.0 million for the Totalcolumn). The foreign exchange impact is the difference between the current period revenue in U.S. Dollars and the currentperiod constant currency revenue ($13,171.1 million less $13,232.0 million for the Total column).
• Acquisition revenue is calculated as if the acquisition occurred twelve months prior to the acquisition date by aggregatingthe comparable prior period revenue of acquisitions through the acquisition date. As a result, acquisition revenue excludesthe positive or negative difference between our current period revenue subsequent to the acquisition date and thecomparable prior period revenue and the positive or negative growth after the acquisition is attributed to organic growth.Disposition revenue is calculated as if the disposition occurred twelve months prior to the disposition date by aggregatingthe comparable prior period revenue of dispositions through the disposition date. The acquisition revenue and dispositionrevenue amounts are netted in the table.
• Organic growth is calculated by subtracting the foreign exchange rate impact, and the acquisition revenue, net ofdisposition revenue components from total revenue growth.
• The percentage change is calculated by dividing the individual component amount by the prior period revenue base of thatcomponent ($14,953.7 million for the Total column).
Changes in the value of foreign currencies against the U.S. Dollar affect our results of operations and financial position. Forthe most part, because the revenue and expense of our foreign operations are both denominated in the same local currency, theeconomic impact on operating margin is minimized. Assuming exchange rates at February 12, 2021 remain unchanged, we expectthe impact of changes in foreign exchange rates to increase revenue between 2.5% and 3.0% in the first half of 2021, and byapproximately 2.5% for the full year.
Revenue and organic growth in our principal regional markets were (in millions):Year Ended December 31,
2020 2019 $ Change% Organic
Growth
Americas:North America . . . . . . . . . . . . . . . . . . . . . . . . . . . . . . . . . . . . . . . . . . . . . . . . . . . . . . . . . . $ 7,577.1 $ 8,478.8 $ (901.7) (10.1)%Latin America . . . . . . . . . . . . . . . . . . . . . . . . . . . . . . . . . . . . . . . . . . . . . . . . . . . . . . . . . . . 275.4 403.4 (128.0) (15.1)%
EMEA:Europe . . . . . . . . . . . . . . . . . . . . . . . . . . . . . . . . . . . . . . . . . . . . . . . . . . . . . . . . . . . . . . . . . . 3,607.7 4,107.4 (499.7) (12.4)%Middle East and Africa . . . . . . . . . . . . . . . . . . . . . . . . . . . . . . . . . . . . . . . . . . . . . . . . . . . 207.2 314.6 (107.4) (32.3)%
Asia-Pacific . . . . . . . . . . . . . . . . . . . . . . . . . . . . . . . . . . . . . . . . . . . . . . . . . . . . . . . . . . . . . . . . 1,503.7 1,649.5 (145.8) (8.5)%$13,171.1 $14,953.7 $(1,782.6) (11.1)%
16
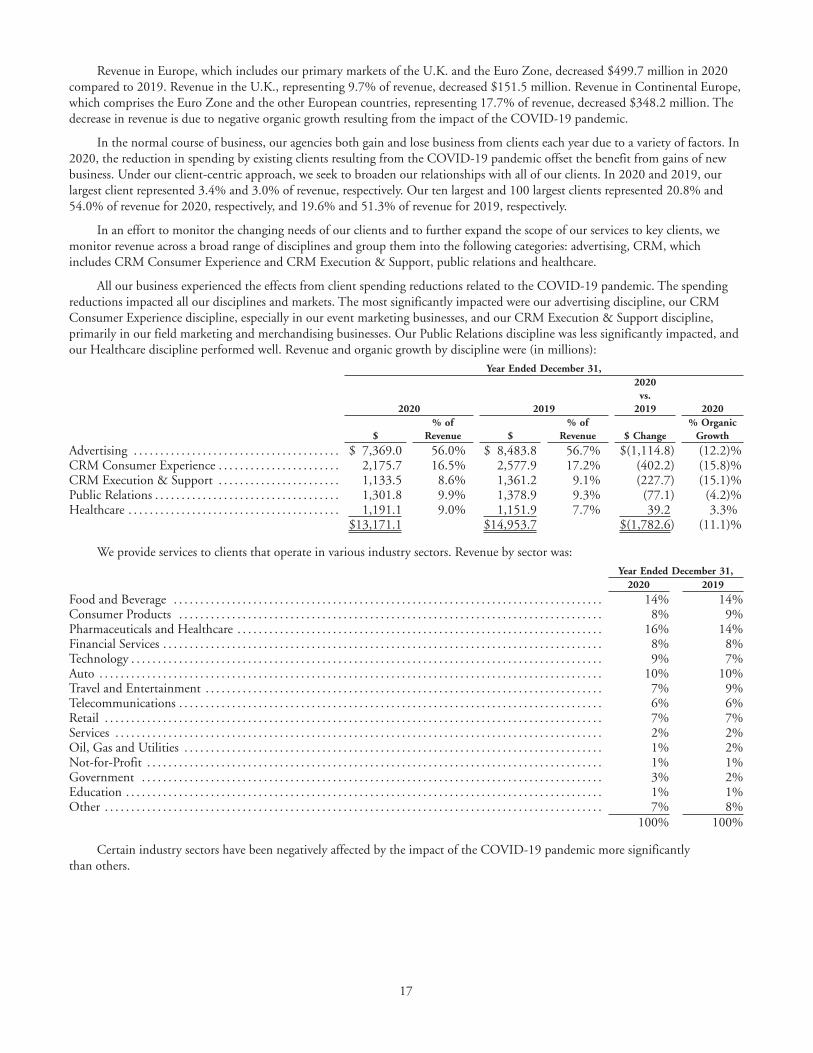
Revenue in Europe, which includes our primary markets of the U.K. and the Euro Zone, decreased $499.7 million in 2020compared to 2019. Revenue in the U.K., representing 9.7% of revenue, decreased $151.5 million. Revenue in Continental Europe,which comprises the Euro Zone and the other European countries, representing 17.7% of revenue, decreased $348.2 million. Thedecrease in revenue is due to negative organic growth resulting from the impact of the COVID-19 pandemic.
In the normal course of business, our agencies both gain and lose business from clients each year due to a variety of factors. In2020, the reduction in spending by existing clients resulting from the COVID-19 pandemic offset the benefit from gains of newbusiness. Under our client-centric approach, we seek to broaden our relationships with all of our clients. In 2020 and 2019, ourlargest client represented 3.4% and 3.0% of revenue, respectively. Our ten largest and 100 largest clients represented 20.8% and54.0% of revenue for 2020, respectively, and 19.6% and 51.3% of revenue for 2019, respectively.
In an effort to monitor the changing needs of our clients and to further expand the scope of our services to key clients, wemonitor revenue across a broad range of disciplines and group them into the following categories: advertising, CRM, whichincludes CRM Consumer Experience and CRM Execution & Support, public relations and healthcare.
All our business experienced the effects from client spending reductions related to the COVID-19 pandemic. The spendingreductions impacted all our disciplines and markets. The most significantly impacted were our advertising discipline, our CRMConsumer Experience discipline, especially in our event marketing businesses, and our CRM Execution & Support discipline,primarily in our field marketing and merchandising businesses. Our Public Relations discipline was less significantly impacted, andour Healthcare discipline performed well. Revenue and organic growth by discipline were (in millions):
Year Ended December 31,
2020 2019
2020vs.
2019 2020
$% of
Revenue $% of
Revenue $ Change% Organic
Growth
Advertising . . . . . . . . . . . . . . . . . . . . . . . . . . . . . . . . . . . . . . . $ 7,369.0 56.0% $ 8,483.8 56.7% $(1,114.8) (12.2)%CRM Consumer Experience . . . . . . . . . . . . . . . . . . . . . . . 2,175.7 16.5% 2,577.9 17.2% (402.2) (15.8)%CRM Execution & Support . . . . . . . . . . . . . . . . . . . . . . . 1,133.5 8.6% 1,361.2 9.1% (227.7) (15.1)%Public Relations . . . . . . . . . . . . . . . . . . . . . . . . . . . . . . . . . . . 1,301.8 9.9% 1,378.9 9.3% (77.1) (4.2)%Healthcare . . . . . . . . . . . . . . . . . . . . . . . . . . . . . . . . . . . . . . . . 1,191.1 9.0% 1,151.9 7.7% 39.2 3.3%
$13,171.1 $14,953.7 $(1,782.6) (11.1)%
We provide services to clients that operate in various industry sectors. Revenue by sector was:Year Ended December 31,
2020 2019
Food and Beverage . . . . . . . . . . . . . . . . . . . . . . . . . . . . . . . . . . . . . . . . . . . . . . . . . . . . . . . . . . . . . . . . . . . . . . . . . . . . . . . . . 14% 14%Consumer Products . . . . . . . . . . . . . . . . . . . . . . . . . . . . . . . . . . . . . . . . . . . . . . . . . . . . . . . . . . . . . . . . . . . . . . . . . . . . . . . . 8% 9%Pharmaceuticals and Healthcare . . . . . . . . . . . . . . . . . . . . . . . . . . . . . . . . . . . . . . . . . . . . . . . . . . . . . . . . . . . . . . . . . . . . . 16% 14%Financial Services . . . . . . . . . . . . . . . . . . . . . . . . . . . . . . . . . . . . . . . . . . . . . . . . . . . . . . . . . . . . . . . . . . . . . . . . . . . . . . . . . . . 8% 8%Technology . . . . . . . . . . . . . . . . . . . . . . . . . . . . . . . . . . . . . . . . . . . . . . . . . . . . . . . . . . . . . . . . . . . . . . . . . . . . . . . . . . . . . . . . . 9% 7%Auto . . . . . . . . . . . . . . . . . . . . . . . . . . . . . . . . . . . . . . . . . . . . . . . . . . . . . . . . . . . . . . . . . . . . . . . . . . . . . . . . . . . . . . . . . . . . . . . 10% 10%Travel and Entertainment . . . . . . . . . . . . . . . . . . . . . . . . . . . . . . . . . . . . . . . . . . . . . . . . . . . . . . . . . . . . . . . . . . . . . . . . . . . 7% 9%Telecommunications . . . . . . . . . . . . . . . . . . . . . . . . . . . . . . . . . . . . . . . . . . . . . . . . . . . . . . . . . . . . . . . . . . . . . . . . . . . . . . . . 6% 6%Retail . . . . . . . . . . . . . . . . . . . . . . . . . . . . . . . . . . . . . . . . . . . . . . . . . . . . . . . . . . . . . . . . . . . . . . . . . . . . . . . . . . . . . . . . . . . . . . 7% 7%Services . . . . . . . . . . . . . . . . . . . . . . . . . . . . . . . . . . . . . . . . . . . . . . . . . . . . . . . . . . . . . . . . . . . . . . . . . . . . . . . . . . . . . . . . . . . . 2% 2%Oil, Gas and Utilities . . . . . . . . . . . . . . . . . . . . . . . . . . . . . . . . . . . . . . . . . . . . . . . . . . . . . . . . . . . . . . . . . . . . . . . . . . . . . . . 1% 2%Not-for-Profit . . . . . . . . . . . . . . . . . . . . . . . . . . . . . . . . . . . . . . . . . . . . . . . . . . . . . . . . . . . . . . . . . . . . . . . . . . . . . . . . . . . . . . 1% 1%Government . . . . . . . . . . . . . . . . . . . . . . . . . . . . . . . . . . . . . . . . . . . . . . . . . . . . . . . . . . . . . . . . . . . . . . . . . . . . . . . . . . . . . . . 3% 2%Education . . . . . . . . . . . . . . . . . . . . . . . . . . . . . . . . . . . . . . . . . . . . . . . . . . . . . . . . . . . . . . . . . . . . . . . . . . . . . . . . . . . . . . . . . . 1% 1%Other . . . . . . . . . . . . . . . . . . . . . . . . . . . . . . . . . . . . . . . . . . . . . . . . . . . . . . . . . . . . . . . . . . . . . . . . . . . . . . . . . . . . . . . . . . . . . . 7% 8%
100% 100%
Certain industry sectors have been negatively affected by the impact of the COVID-19 pandemic more significantlythan others.
17
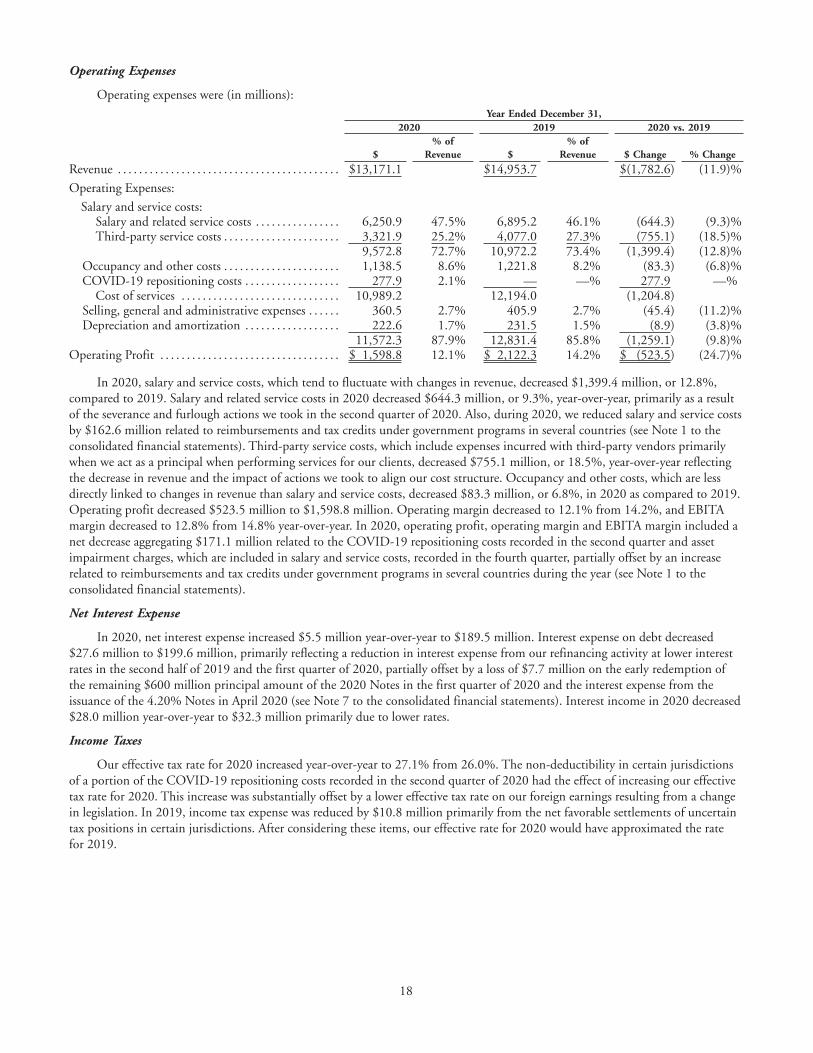
Operating Expenses
Operating expenses were (in millions):Year Ended December 31,
2020 2019 2020 vs. 2019
$% of
Revenue $% of
Revenue $ Change % Change
Revenue . . . . . . . . . . . . . . . . . . . . . . . . . . . . . . . . . . . . . . . . . . $13,171.1 $14,953.7 $(1,782.6) (11.9)%
Operating Expenses:
Salary and service costs:Salary and related service costs . . . . . . . . . . . . . . . . 6,250.9 47.5% 6,895.2 46.1% (644.3) (9.3)%Third-party service costs . . . . . . . . . . . . . . . . . . . . . . 3,321.9 25.2% 4,077.0 27.3% (755.1) (18.5)%
9,572.8 72.7% 10,972.2 73.4% (1,399.4) (12.8)%Occupancy and other costs . . . . . . . . . . . . . . . . . . . . . . 1,138.5 8.6% 1,221.8 8.2% (83.3) (6.8)%COVID-19 repositioning costs . . . . . . . . . . . . . . . . . . 277.9 2.1% — —% 277.9 —%
Cost of services . . . . . . . . . . . . . . . . . . . . . . . . . . . . . . 10,989.2 12,194.0 (1,204.8)Selling, general and administrative expenses . . . . . . 360.5 2.7% 405.9 2.7% (45.4) (11.2)%Depreciation and amortization . . . . . . . . . . . . . . . . . . 222.6 1.7% 231.5 1.5% (8.9) (3.8)%
11,572.3 87.9% 12,831.4 85.8% (1,259.1) (9.8)%Operating Profit . . . . . . . . . . . . . . . . . . . . . . . . . . . . . . . . . . $ 1,598.8 12.1% $ 2,122.3 14.2% $ (523.5) (24.7)%
In 2020, salary and service costs, which tend to fluctuate with changes in revenue, decreased $1,399.4 million, or 12.8%,compared to 2019. Salary and related service costs in 2020 decreased $644.3 million, or 9.3%, year-over-year, primarily as a resultof the severance and furlough actions we took in the second quarter of 2020. Also, during 2020, we reduced salary and service costsby $162.6 million related to reimbursements and tax credits under government programs in several countries (see Note 1 to theconsolidated financial statements). Third-party service costs, which include expenses incurred with third-party vendors primarilywhen we act as a principal when performing services for our clients, decreased $755.1 million, or 18.5%, year-over-year reflectingthe decrease in revenue and the impact of actions we took to align our cost structure. Occupancy and other costs, which are lessdirectly linked to changes in revenue than salary and service costs, decreased $83.3 million, or 6.8%, in 2020 as compared to 2019.Operating profit decreased $523.5 million to $1,598.8 million. Operating margin decreased to 12.1% from 14.2%, and EBITAmargin decreased to 12.8% from 14.8% year-over-year. In 2020, operating profit, operating margin and EBITA margin included anet decrease aggregating $171.1 million related to the COVID-19 repositioning costs recorded in the second quarter and assetimpairment charges, which are included in salary and service costs, recorded in the fourth quarter, partially offset by an increaserelated to reimbursements and tax credits under government programs in several countries during the year (see Note 1 to theconsolidated financial statements).
Net Interest Expense
In 2020, net interest expense increased $5.5 million year-over-year to $189.5 million. Interest expense on debt decreased$27.6 million to $199.6 million, primarily reflecting a reduction in interest expense from our refinancing activity at lower interestrates in the second half of 2019 and the first quarter of 2020, partially offset by a loss of $7.7 million on the early redemption ofthe remaining $600 million principal amount of the 2020 Notes in the first quarter of 2020 and the interest expense from theissuance of the 4.20% Notes in April 2020 (see Note 7 to the consolidated financial statements). Interest income in 2020 decreased$28.0 million year-over-year to $32.3 million primarily due to lower rates.
Income Taxes
Our effective tax rate for 2020 increased year-over-year to 27.1% from 26.0%. The non-deductibility in certain jurisdictionsof a portion of the COVID-19 repositioning costs recorded in the second quarter of 2020 had the effect of increasing our effectivetax rate for 2020. This increase was substantially offset by a lower effective tax rate on our foreign earnings resulting from a changein legislation. In 2019, income tax expense was reduced by $10.8 million primarily from the net favorable settlements of uncertaintax positions in certain jurisdictions. After considering these items, our effective rate for 2020 would have approximated the ratefor 2019.
18
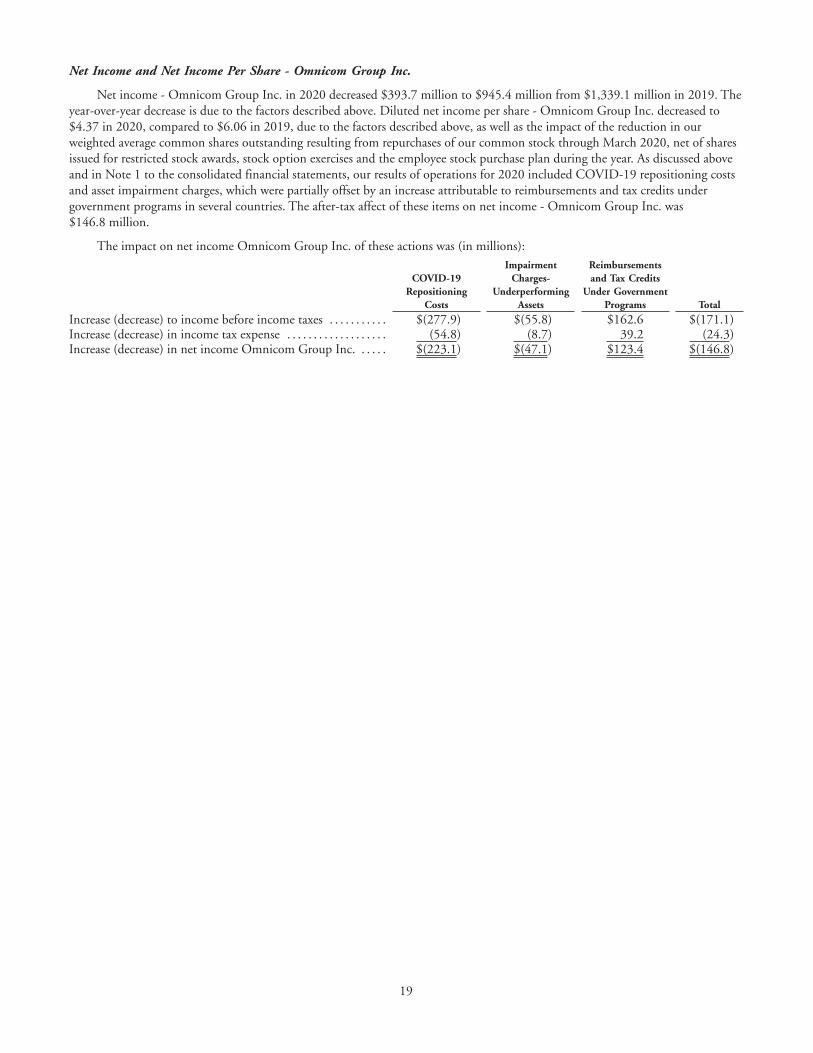
Net Income and Net Income Per Share - Omnicom Group Inc.
Net income - Omnicom Group Inc. in 2020 decreased $393.7 million to $945.4 million from $1,339.1 million in 2019. Theyear-over-year decrease is due to the factors described above. Diluted net income per share - Omnicom Group Inc. decreased to$4.37 in 2020, compared to $6.06 in 2019, due to the factors described above, as well as the impact of the reduction in ourweighted average common shares outstanding resulting from repurchases of our common stock through March 2020, net of sharesissued for restricted stock awards, stock option exercises and the employee stock purchase plan during the year. As discussed aboveand in Note 1 to the consolidated financial statements, our results of operations for 2020 included COVID-19 repositioning costsand asset impairment charges, which were partially offset by an increase attributable to reimbursements and tax credits undergovernment programs in several countries. The after-tax affect of these items on net income - Omnicom Group Inc. was$146.8 million.
The impact on net income Omnicom Group Inc. of these actions was (in millions):
COVID-19Repositioning
Costs
ImpairmentCharges-
UnderperformingAssets
Reimbursementsand Tax Credits
Under GovernmentPrograms Total
Increase (decrease) to income before income taxes . . . . . . . . . . . $(277.9) $(55.8) $162.6 $(171.1)Increase (decrease) in income tax expense . . . . . . . . . . . . . . . . . . . (54.8) (8.7) 39.2 (24.3)Increase (decrease) in net income Omnicom Group Inc. . . . . . $(223.1) $(47.1) $123.4 $(146.8)
19
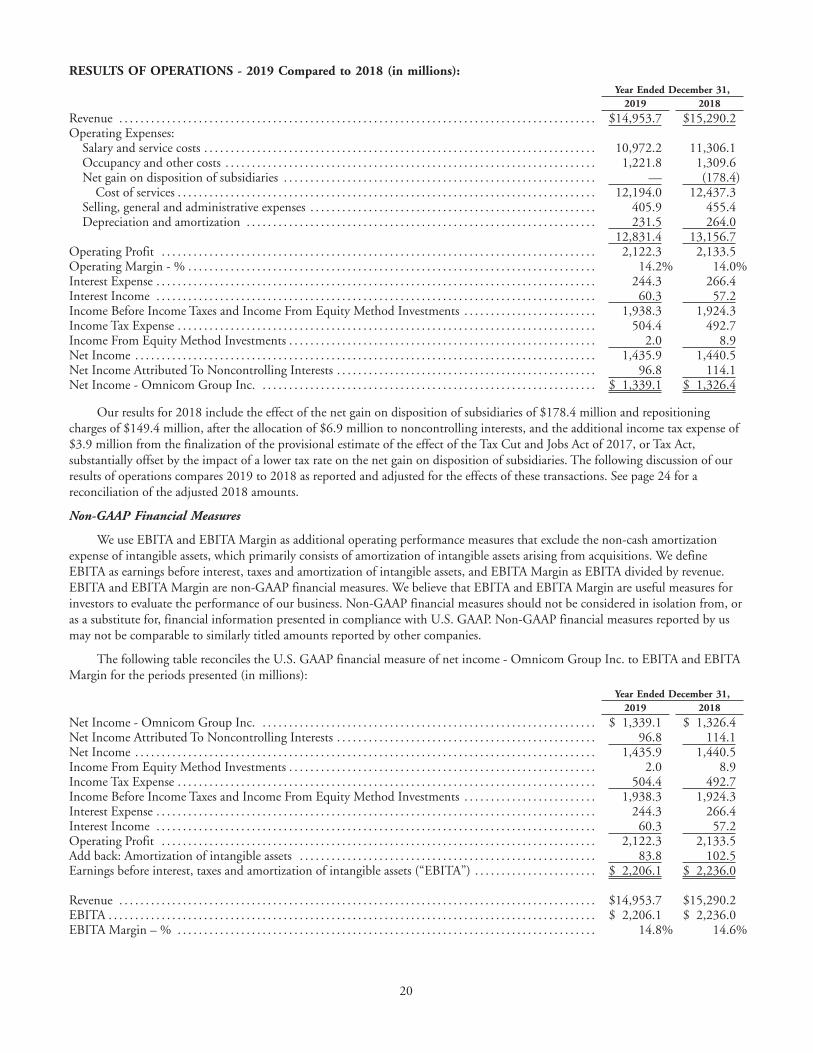
RESULTS OF OPERATIONS - 2019 Compared to 2018 (in millions):Year Ended December 31,
2019 2018
Revenue . . . . . . . . . . . . . . . . . . . . . . . . . . . . . . . . . . . . . . . . . . . . . . . . . . . . . . . . . . . . . . . . . . . . . . . . . . . . . . . . . . . . . . . . . . $14,953.7 $15,290.2Operating Expenses:
Salary and service costs . . . . . . . . . . . . . . . . . . . . . . . . . . . . . . . . . . . . . . . . . . . . . . . . . . . . . . . . . . . . . . . . . . . . . . . . . . 10,972.2 11,306.1Occupancy and other costs . . . . . . . . . . . . . . . . . . . . . . . . . . . . . . . . . . . . . . . . . . . . . . . . . . . . . . . . . . . . . . . . . . . . . . 1,221.8 1,309.6Net gain on disposition of subsidiaries . . . . . . . . . . . . . . . . . . . . . . . . . . . . . . . . . . . . . . . . . . . . . . . . . . . . . . . . . . . — (178.4)
Cost of services . . . . . . . . . . . . . . . . . . . . . . . . . . . . . . . . . . . . . . . . . . . . . . . . . . . . . . . . . . . . . . . . . . . . . . . . . . . . . . . 12,194.0 12,437.3Selling, general and administrative expenses . . . . . . . . . . . . . . . . . . . . . . . . . . . . . . . . . . . . . . . . . . . . . . . . . . . . . . 405.9 455.4Depreciation and amortization . . . . . . . . . . . . . . . . . . . . . . . . . . . . . . . . . . . . . . . . . . . . . . . . . . . . . . . . . . . . . . . . . . 231.5 264.0
12,831.4 13,156.7Operating Profit . . . . . . . . . . . . . . . . . . . . . . . . . . . . . . . . . . . . . . . . . . . . . . . . . . . . . . . . . . . . . . . . . . . . . . . . . . . . . . . . . . 2,122.3 2,133.5Operating Margin - % . . . . . . . . . . . . . . . . . . . . . . . . . . . . . . . . . . . . . . . . . . . . . . . . . . . . . . . . . . . . . . . . . . . . . . . . . . . . . 14.2% 14.0%Interest Expense . . . . . . . . . . . . . . . . . . . . . . . . . . . . . . . . . . . . . . . . . . . . . . . . . . . . . . . . . . . . . . . . . . . . . . . . . . . . . . . . . . . 244.3 266.4Interest Income . . . . . . . . . . . . . . . . . . . . . . . . . . . . . . . . . . . . . . . . . . . . . . . . . . . . . . . . . . . . . . . . . . . . . . . . . . . . . . . . . . . 60.3 57.2Income Before Income Taxes and Income From Equity Method Investments . . . . . . . . . . . . . . . . . . . . . . . . . 1,938.3 1,924.3Income Tax Expense . . . . . . . . . . . . . . . . . . . . . . . . . . . . . . . . . . . . . . . . . . . . . . . . . . . . . . . . . . . . . . . . . . . . . . . . . . . . . . . 504.4 492.7Income From Equity Method Investments . . . . . . . . . . . . . . . . . . . . . . . . . . . . . . . . . . . . . . . . . . . . . . . . . . . . . . . . . . 2.0 8.9Net Income . . . . . . . . . . . . . . . . . . . . . . . . . . . . . . . . . . . . . . . . . . . . . . . . . . . . . . . . . . . . . . . . . . . . . . . . . . . . . . . . . . . . . . . 1,435.9 1,440.5Net Income Attributed To Noncontrolling Interests . . . . . . . . . . . . . . . . . . . . . . . . . . . . . . . . . . . . . . . . . . . . . . . . . 96.8 114.1Net Income - Omnicom Group Inc. . . . . . . . . . . . . . . . . . . . . . . . . . . . . . . . . . . . . . . . . . . . . . . . . . . . . . . . . . . . . . . . $ 1,339.1 $ 1,326.4
Our results for 2018 include the effect of the net gain on disposition of subsidiaries of $178.4 million and repositioningcharges of $149.4 million, after the allocation of $6.9 million to noncontrolling interests, and the additional income tax expense of$3.9 million from the finalization of the provisional estimate of the effect of the Tax Cut and Jobs Act of 2017, or Tax Act,substantially offset by the impact of a lower tax rate on the net gain on disposition of subsidiaries. The following discussion of ourresults of operations compares 2019 to 2018 as reported and adjusted for the effects of these transactions. See page 24 for areconciliation of the adjusted 2018 amounts.
Non-GAAP Financial Measures
We use EBITA and EBITA Margin as additional operating performance measures that exclude the non-cash amortizationexpense of intangible assets, which primarily consists of amortization of intangible assets arising from acquisitions. We defineEBITA as earnings before interest, taxes and amortization of intangible assets, and EBITA Margin as EBITA divided by revenue.EBITA and EBITA Margin are non-GAAP financial measures. We believe that EBITA and EBITA Margin are useful measures forinvestors to evaluate the performance of our business. Non-GAAP financial measures should not be considered in isolation from, oras a substitute for, financial information presented in compliance with U.S. GAAP. Non-GAAP financial measures reported by usmay not be comparable to similarly titled amounts reported by other companies.
The following table reconciles the U.S. GAAP financial measure of net income - Omnicom Group Inc. to EBITA and EBITAMargin for the periods presented (in millions):
Year Ended December 31,2019 2018
Net Income - Omnicom Group Inc. . . . . . . . . . . . . . . . . . . . . . . . . . . . . . . . . . . . . . . . . . . . . . . . . . . . . . . . . . . . . . . . $ 1,339.1 $ 1,326.4Net Income Attributed To Noncontrolling Interests . . . . . . . . . . . . . . . . . . . . . . . . . . . . . . . . . . . . . . . . . . . . . . . . . 96.8 114.1Net Income . . . . . . . . . . . . . . . . . . . . . . . . . . . . . . . . . . . . . . . . . . . . . . . . . . . . . . . . . . . . . . . . . . . . . . . . . . . . . . . . . . . . . . . 1,435.9 1,440.5Income From Equity Method Investments . . . . . . . . . . . . . . . . . . . . . . . . . . . . . . . . . . . . . . . . . . . . . . . . . . . . . . . . . . 2.0 8.9Income Tax Expense . . . . . . . . . . . . . . . . . . . . . . . . . . . . . . . . . . . . . . . . . . . . . . . . . . . . . . . . . . . . . . . . . . . . . . . . . . . . . . . 504.4 492.7Income Before Income Taxes and Income From Equity Method Investments . . . . . . . . . . . . . . . . . . . . . . . . . 1,938.3 1,924.3Interest Expense . . . . . . . . . . . . . . . . . . . . . . . . . . . . . . . . . . . . . . . . . . . . . . . . . . . . . . . . . . . . . . . . . . . . . . . . . . . . . . . . . . . 244.3 266.4Interest Income . . . . . . . . . . . . . . . . . . . . . . . . . . . . . . . . . . . . . . . . . . . . . . . . . . . . . . . . . . . . . . . . . . . . . . . . . . . . . . . . . . . 60.3 57.2Operating Profit . . . . . . . . . . . . . . . . . . . . . . . . . . . . . . . . . . . . . . . . . . . . . . . . . . . . . . . . . . . . . . . . . . . . . . . . . . . . . . . . . . 2,122.3 2,133.5Add back: Amortization of intangible assets . . . . . . . . . . . . . . . . . . . . . . . . . . . . . . . . . . . . . . . . . . . . . . . . . . . . . . . . 83.8 102.5Earnings before interest, taxes and amortization of intangible assets (“EBITA”) . . . . . . . . . . . . . . . . . . . . . . . $ 2,206.1 $ 2,236.0 Revenue . . . . . . . . . . . . . . . . . . . . . . . . . . . . . . . . . . . . . . . . . . . . . . . . . . . . . . . . . . . . . . . . . . . . . . . . . . . . . . . . . . . . . . . . . . $14,953.7 $15,290.2EBITA . . . . . . . . . . . . . . . . . . . . . . . . . . . . . . . . . . . . . . . . . . . . . . . . . . . . . . . . . . . . . . . . . . . . . . . . . . . . . . . . . . . . . . . . . . . . $ 2,206.1 $ 2,236.0EBITA Margin – % . . . . . . . . . . . . . . . . . . . . . . . . . . . . . . . . . . . . . . . . . . . . . . . . . . . . . . . . . . . . . . . . . . . . . . . . . . . . . . . 14.8% 14.6%
20
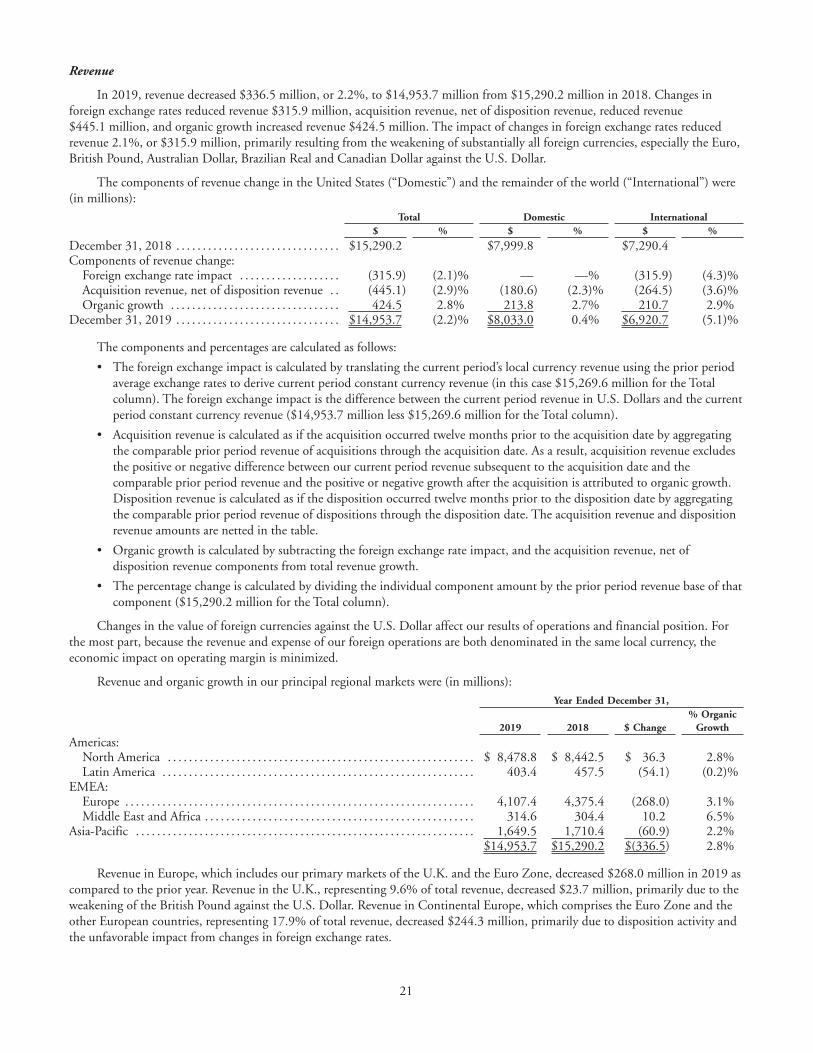
Revenue
In 2019, revenue decreased $336.5 million, or 2.2%, to $14,953.7 million from $15,290.2 million in 2018. Changes inforeign exchange rates reduced revenue $315.9 million, acquisition revenue, net of disposition revenue, reduced revenue$445.1 million, and organic growth increased revenue $424.5 million. The impact of changes in foreign exchange rates reducedrevenue 2.1%, or $315.9 million, primarily resulting from the weakening of substantially all foreign currencies, especially the Euro,British Pound, Australian Dollar, Brazilian Real and Canadian Dollar against the U.S. Dollar.
The components of revenue change in the United States (“Domestic”) and the remainder of the world (“International”) were(in millions):
Total Domestic International$ % $ % $ %
December 31, 2018 . . . . . . . . . . . . . . . . . . . . . . . . . . . . . . . $15,290.2 $7,999.8 $7,290.4Components of revenue change:
Foreign exchange rate impact . . . . . . . . . . . . . . . . . . . (315.9) (2.1)% — —% (315.9) (4.3)%Acquisition revenue, net of disposition revenue . . (445.1) (2.9)% (180.6) (2.3)% (264.5) (3.6)%Organic growth . . . . . . . . . . . . . . . . . . . . . . . . . . . . . . . . 424.5 2.8% 213.8 2.7% 210.7 2.9%
December 31, 2019 . . . . . . . . . . . . . . . . . . . . . . . . . . . . . . . $14,953.7 (2.2)% $8,033.0 0.4% $6,920.7 (5.1)%
The components and percentages are calculated as follows:
• The foreign exchange impact is calculated by translating the current period’s local currency revenue using the prior periodaverage exchange rates to derive current period constant currency revenue (in this case $15,269.6 million for the Totalcolumn). The foreign exchange impact is the difference between the current period revenue in U.S. Dollars and the currentperiod constant currency revenue ($14,953.7 million less $15,269.6 million for the Total column).
• Acquisition revenue is calculated as if the acquisition occurred twelve months prior to the acquisition date by aggregatingthe comparable prior period revenue of acquisitions through the acquisition date. As a result, acquisition revenue excludesthe positive or negative difference between our current period revenue subsequent to the acquisition date and thecomparable prior period revenue and the positive or negative growth after the acquisition is attributed to organic growth.Disposition revenue is calculated as if the disposition occurred twelve months prior to the disposition date by aggregatingthe comparable prior period revenue of dispositions through the disposition date. The acquisition revenue and dispositionrevenue amounts are netted in the table.
• Organic growth is calculated by subtracting the foreign exchange rate impact, and the acquisition revenue, net ofdisposition revenue components from total revenue growth.
• The percentage change is calculated by dividing the individual component amount by the prior period revenue base of thatcomponent ($15,290.2 million for the Total column).
Changes in the value of foreign currencies against the U.S. Dollar affect our results of operations and financial position. Forthe most part, because the revenue and expense of our foreign operations are both denominated in the same local currency, theeconomic impact on operating margin is minimized.
Revenue and organic growth in our principal regional markets were (in millions):Year Ended December 31,
2019 2018 $ Change% Organic
Growth
Americas:North America . . . . . . . . . . . . . . . . . . . . . . . . . . . . . . . . . . . . . . . . . . . . . . . . . . . . . . . . . . $ 8,478.8 $ 8,442.5 $ 36.3 2.8%Latin America . . . . . . . . . . . . . . . . . . . . . . . . . . . . . . . . . . . . . . . . . . . . . . . . . . . . . . . . . . . 403.4 457.5 (54.1) (0.2)%
EMEA:Europe . . . . . . . . . . . . . . . . . . . . . . . . . . . . . . . . . . . . . . . . . . . . . . . . . . . . . . . . . . . . . . . . . . 4,107.4 4,375.4 (268.0) 3.1%Middle East and Africa . . . . . . . . . . . . . . . . . . . . . . . . . . . . . . . . . . . . . . . . . . . . . . . . . . . 314.6 304.4 10.2 6.5%
Asia-Pacific . . . . . . . . . . . . . . . . . . . . . . . . . . . . . . . . . . . . . . . . . . . . . . . . . . . . . . . . . . . . . . . . 1,649.5 1,710.4 (60.9) 2.2%$14,953.7 $15,290.2 $(336.5) 2.8%
Revenue in Europe, which includes our primary markets of the U.K. and the Euro Zone, decreased $268.0 million in 2019 ascompared to the prior year. Revenue in the U.K., representing 9.6% of total revenue, decreased $23.7 million, primarily due to theweakening of the British Pound against the U.S. Dollar. Revenue in Continental Europe, which comprises the Euro Zone and theother European countries, representing 17.9% of total revenue, decreased $244.3 million, primarily due to disposition activity andthe unfavorable impact from changes in foreign exchange rates.
21
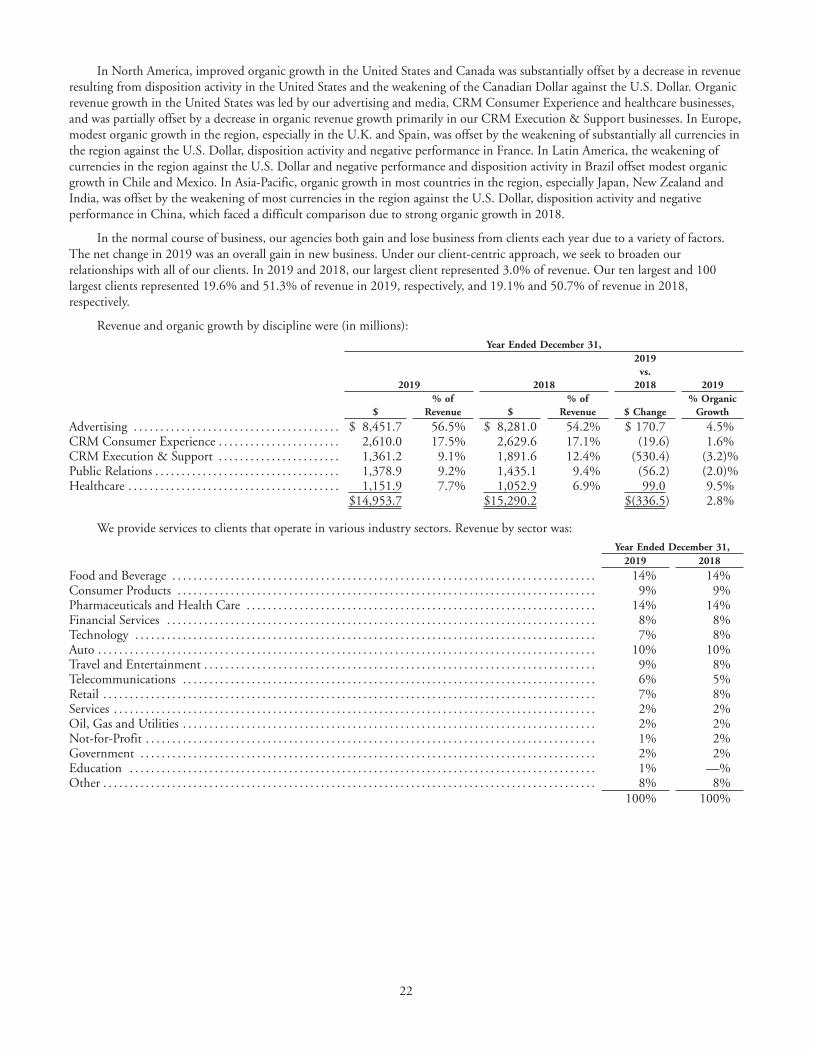
In North America, improved organic growth in the United States and Canada was substantially offset by a decrease in revenueresulting from disposition activity in the United States and the weakening of the Canadian Dollar against the U.S. Dollar. Organicrevenue growth in the United States was led by our advertising and media, CRM Consumer Experience and healthcare businesses,and was partially offset by a decrease in organic revenue growth primarily in our CRM Execution & Support businesses. In Europe,modest organic growth in the region, especially in the U.K. and Spain, was offset by the weakening of substantially all currencies inthe region against the U.S. Dollar, disposition activity and negative performance in France. In Latin America, the weakening ofcurrencies in the region against the U.S. Dollar and negative performance and disposition activity in Brazil offset modest organicgrowth in Chile and Mexico. In Asia-Pacific, organic growth in most countries in the region, especially Japan, New Zealand andIndia, was offset by the weakening of most currencies in the region against the U.S. Dollar, disposition activity and negativeperformance in China, which faced a difficult comparison due to strong organic growth in 2018.
In the normal course of business, our agencies both gain and lose business from clients each year due to a variety of factors.The net change in 2019 was an overall gain in new business. Under our client-centric approach, we seek to broaden ourrelationships with all of our clients. In 2019 and 2018, our largest client represented 3.0% of revenue. Our ten largest and 100largest clients represented 19.6% and 51.3% of revenue in 2019, respectively, and 19.1% and 50.7% of revenue in 2018,respectively.
Revenue and organic growth by discipline were (in millions):Year Ended December 31,
2019 2018
2019vs.
2018 2019
$% of
Revenue $% of
Revenue $ Change% Organic
Growth
Advertising . . . . . . . . . . . . . . . . . . . . . . . . . . . . . . . . . . . . . . . $ 8,451.7 56.5% $ 8,281.0 54.2% $ 170.7 4.5%CRM Consumer Experience . . . . . . . . . . . . . . . . . . . . . . . 2,610.0 17.5% 2,629.6 17.1% (19.6) 1.6%CRM Execution & Support . . . . . . . . . . . . . . . . . . . . . . . 1,361.2 9.1% 1,891.6 12.4% (530.4) (3.2)%Public Relations . . . . . . . . . . . . . . . . . . . . . . . . . . . . . . . . . . . 1,378.9 9.2% 1,435.1 9.4% (56.2) (2.0)%Healthcare . . . . . . . . . . . . . . . . . . . . . . . . . . . . . . . . . . . . . . . . 1,151.9 7.7% 1,052.9 6.9% 99.0 9.5%
$14,953.7 $15,290.2 $(336.5) 2.8%
We provide services to clients that operate in various industry sectors. Revenue by sector was:Year Ended December 31,
2019 2018
Food and Beverage . . . . . . . . . . . . . . . . . . . . . . . . . . . . . . . . . . . . . . . . . . . . . . . . . . . . . . . . . . . . . . . . . . . . . . . . . . . . . . . . 14% 14%Consumer Products . . . . . . . . . . . . . . . . . . . . . . . . . . . . . . . . . . . . . . . . . . . . . . . . . . . . . . . . . . . . . . . . . . . . . . . . . . . . . . . 9% 9%Pharmaceuticals and Health Care . . . . . . . . . . . . . . . . . . . . . . . . . . . . . . . . . . . . . . . . . . . . . . . . . . . . . . . . . . . . . . . . . . 14% 14%Financial Services . . . . . . . . . . . . . . . . . . . . . . . . . . . . . . . . . . . . . . . . . . . . . . . . . . . . . . . . . . . . . . . . . . . . . . . . . . . . . . . . . 8% 8%Technology . . . . . . . . . . . . . . . . . . . . . . . . . . . . . . . . . . . . . . . . . . . . . . . . . . . . . . . . . . . . . . . . . . . . . . . . . . . . . . . . . . . . . . . 7% 8%Auto . . . . . . . . . . . . . . . . . . . . . . . . . . . . . . . . . . . . . . . . . . . . . . . . . . . . . . . . . . . . . . . . . . . . . . . . . . . . . . . . . . . . . . . . . . . . . . 10% 10%Travel and Entertainment . . . . . . . . . . . . . . . . . . . . . . . . . . . . . . . . . . . . . . . . . . . . . . . . . . . . . . . . . . . . . . . . . . . . . . . . . . 9% 8%Telecommunications . . . . . . . . . . . . . . . . . . . . . . . . . . . . . . . . . . . . . . . . . . . . . . . . . . . . . . . . . . . . . . . . . . . . . . . . . . . . . . 6% 5%Retail . . . . . . . . . . . . . . . . . . . . . . . . . . . . . . . . . . . . . . . . . . . . . . . . . . . . . . . . . . . . . . . . . . . . . . . . . . . . . . . . . . . . . . . . . . . . . 7% 8%Services . . . . . . . . . . . . . . . . . . . . . . . . . . . . . . . . . . . . . . . . . . . . . . . . . . . . . . . . . . . . . . . . . . . . . . . . . . . . . . . . . . . . . . . . . . . 2% 2%Oil, Gas and Utilities . . . . . . . . . . . . . . . . . . . . . . . . . . . . . . . . . . . . . . . . . . . . . . . . . . . . . . . . . . . . . . . . . . . . . . . . . . . . . . 2% 2%Not-for-Profit . . . . . . . . . . . . . . . . . . . . . . . . . . . . . . . . . . . . . . . . . . . . . . . . . . . . . . . . . . . . . . . . . . . . . . . . . . . . . . . . . . . . . 1% 2%Government . . . . . . . . . . . . . . . . . . . . . . . . . . . . . . . . . . . . . . . . . . . . . . . . . . . . . . . . . . . . . . . . . . . . . . . . . . . . . . . . . . . . . . 2% 2%Education . . . . . . . . . . . . . . . . . . . . . . . . . . . . . . . . . . . . . . . . . . . . . . . . . . . . . . . . . . . . . . . . . . . . . . . . . . . . . . . . . . . . . . . . 1% —%Other . . . . . . . . . . . . . . . . . . . . . . . . . . . . . . . . . . . . . . . . . . . . . . . . . . . . . . . . . . . . . . . . . . . . . . . . . . . . . . . . . . . . . . . . . . . . . 8% 8%
100% 100%
22
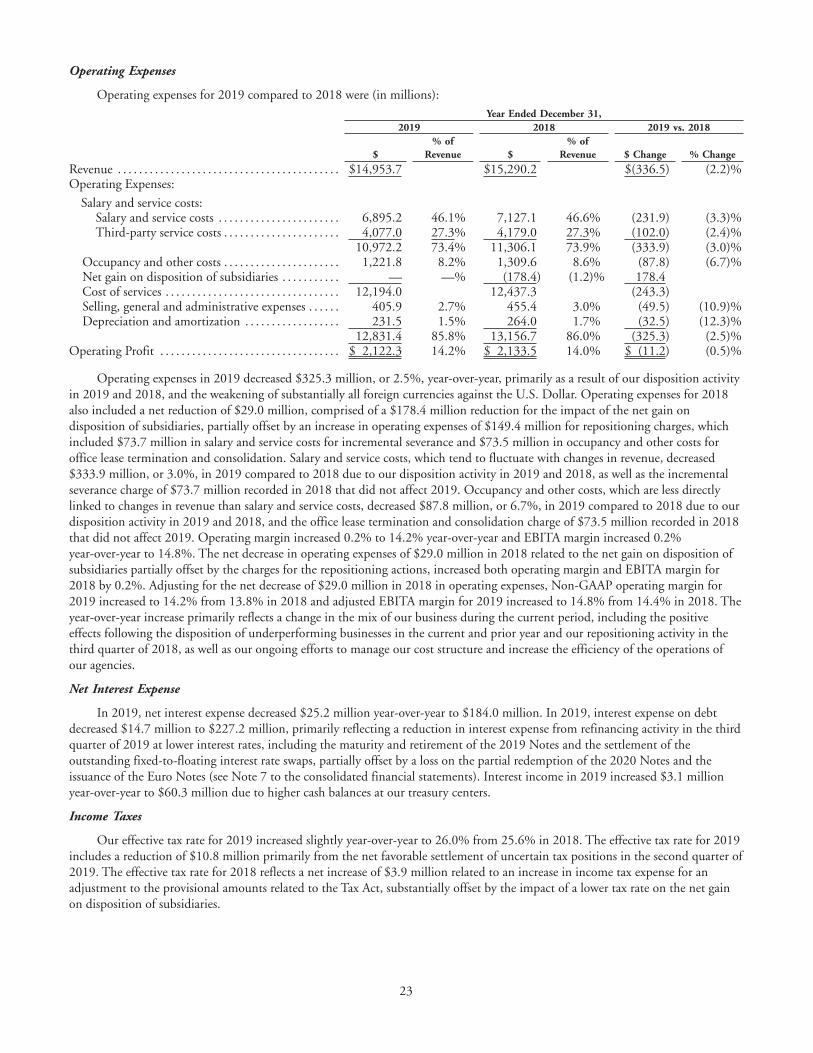
Operating Expenses
Operating expenses for 2019 compared to 2018 were (in millions):Year Ended December 31,
2019 2018 2019 vs. 2018
$% of
Revenue $% of
Revenue $ Change % Change
Revenue . . . . . . . . . . . . . . . . . . . . . . . . . . . . . . . . . . . . . . . . . . $14,953.7 $15,290.2 $(336.5) (2.2)%Operating Expenses:
Salary and service costs:Salary and service costs . . . . . . . . . . . . . . . . . . . . . . . 6,895.2 46.1% 7,127.1 46.6% (231.9) (3.3)%Third-party service costs . . . . . . . . . . . . . . . . . . . . . . 4,077.0 27.3% 4,179.0 27.3% (102.0) (2.4)%
10,972.2 73.4% 11,306.1 73.9% (333.9) (3.0)%Occupancy and other costs . . . . . . . . . . . . . . . . . . . . . . 1,221.8 8.2% 1,309.6 8.6% (87.8) (6.7)%Net gain on disposition of subsidiaries . . . . . . . . . . . — —% (178.4) (1.2)% 178.4Cost of services . . . . . . . . . . . . . . . . . . . . . . . . . . . . . . . . . 12,194.0 12,437.3 (243.3)Selling, general and administrative expenses . . . . . . 405.9 2.7% 455.4 3.0% (49.5) (10.9)%Depreciation and amortization . . . . . . . . . . . . . . . . . . 231.5 1.5% 264.0 1.7% (32.5) (12.3)%
12,831.4 85.8% 13,156.7 86.0% (325.3) (2.5)%Operating Profit . . . . . . . . . . . . . . . . . . . . . . . . . . . . . . . . . . $ 2,122.3 14.2% $ 2,133.5 14.0% $ (11.2) (0.5)%
Operating expenses in 2019 decreased $325.3 million, or 2.5%, year-over-year, primarily as a result of our disposition activityin 2019 and 2018, and the weakening of substantially all foreign currencies against the U.S. Dollar. Operating expenses for 2018also included a net reduction of $29.0 million, comprised of a $178.4 million reduction for the impact of the net gain ondisposition of subsidiaries, partially offset by an increase in operating expenses of $149.4 million for repositioning charges, whichincluded $73.7 million in salary and service costs for incremental severance and $73.5 million in occupancy and other costs foroffice lease termination and consolidation. Salary and service costs, which tend to fluctuate with changes in revenue, decreased$333.9 million, or 3.0%, in 2019 compared to 2018 due to our disposition activity in 2019 and 2018, as well as the incrementalseverance charge of $73.7 million recorded in 2018 that did not affect 2019. Occupancy and other costs, which are less directlylinked to changes in revenue than salary and service costs, decreased $87.8 million, or 6.7%, in 2019 compared to 2018 due to ourdisposition activity in 2019 and 2018, and the office lease termination and consolidation charge of $73.5 million recorded in 2018that did not affect 2019. Operating margin increased 0.2% to 14.2% year-over-year and EBITA margin increased 0.2%year-over-year to 14.8%. The net decrease in operating expenses of $29.0 million in 2018 related to the net gain on disposition ofsubsidiaries partially offset by the charges for the repositioning actions, increased both operating margin and EBITA margin for2018 by 0.2%. Adjusting for the net decrease of $29.0 million in 2018 in operating expenses, Non-GAAP operating margin for2019 increased to 14.2% from 13.8% in 2018 and adjusted EBITA margin for 2019 increased to 14.8% from 14.4% in 2018. Theyear-over-year increase primarily reflects a change in the mix of our business during the current period, including the positiveeffects following the disposition of underperforming businesses in the current and prior year and our repositioning activity in thethird quarter of 2018, as well as our ongoing efforts to manage our cost structure and increase the efficiency of the operations ofour agencies.
Net Interest Expense
In 2019, net interest expense decreased $25.2 million year-over-year to $184.0 million. In 2019, interest expense on debtdecreased $14.7 million to $227.2 million, primarily reflecting a reduction in interest expense from refinancing activity in the thirdquarter of 2019 at lower interest rates, including the maturity and retirement of the 2019 Notes and the settlement of theoutstanding fixed-to-floating interest rate swaps, partially offset by a loss on the partial redemption of the 2020 Notes and theissuance of the Euro Notes (see Note 7 to the consolidated financial statements). Interest income in 2019 increased $3.1 millionyear-over-year to $60.3 million due to higher cash balances at our treasury centers.
Income Taxes
Our effective tax rate for 2019 increased slightly year-over-year to 26.0% from 25.6% in 2018. The effective tax rate for 2019includes a reduction of $10.8 million primarily from the net favorable settlement of uncertain tax positions in the second quarter of2019. The effective tax rate for 2018 reflects a net increase of $3.9 million related to an increase in income tax expense for anadjustment to the provisional amounts related to the Tax Act, substantially offset by the impact of a lower tax rate on the net gainon disposition of subsidiaries.
23
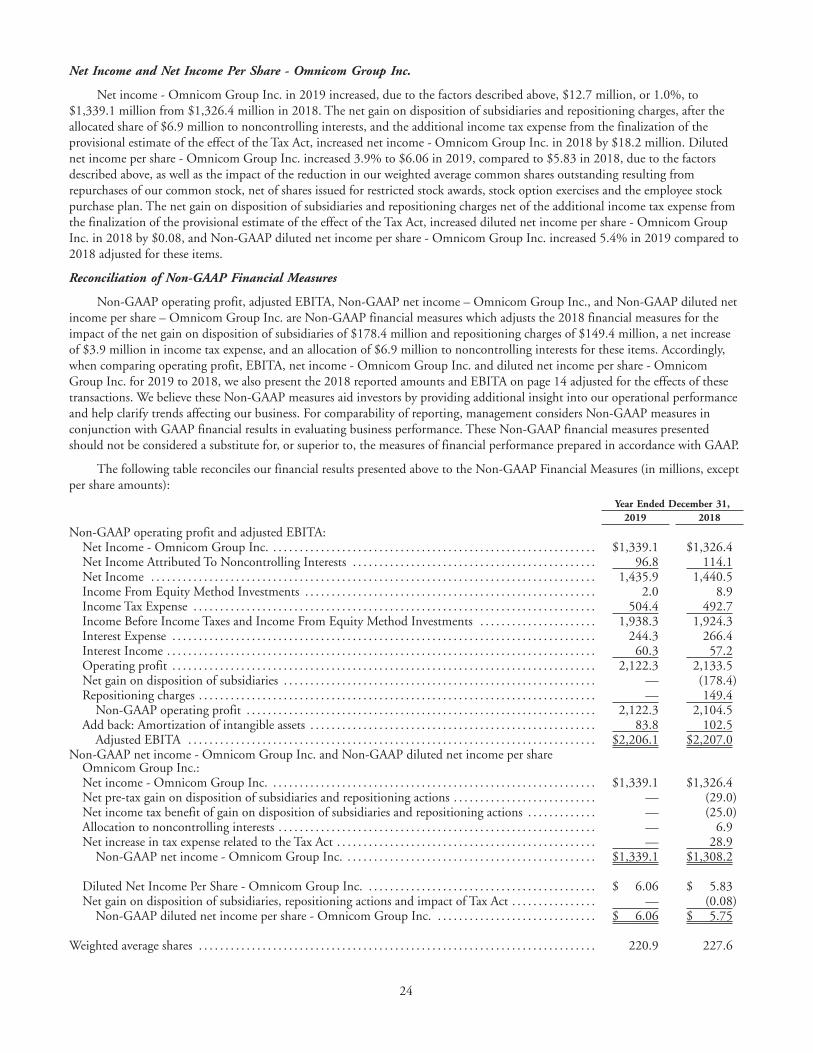
Net Income and Net Income Per Share - Omnicom Group Inc.
Net income - Omnicom Group Inc. in 2019 increased, due to the factors described above, $12.7 million, or 1.0%, to$1,339.1 million from $1,326.4 million in 2018. The net gain on disposition of subsidiaries and repositioning charges, after theallocated share of $6.9 million to noncontrolling interests, and the additional income tax expense from the finalization of theprovisional estimate of the effect of the Tax Act, increased net income - Omnicom Group Inc. in 2018 by $18.2 million. Dilutednet income per share - Omnicom Group Inc. increased 3.9% to $6.06 in 2019, compared to $5.83 in 2018, due to the factorsdescribed above, as well as the impact of the reduction in our weighted average common shares outstanding resulting fromrepurchases of our common stock, net of shares issued for restricted stock awards, stock option exercises and the employee stockpurchase plan. The net gain on disposition of subsidiaries and repositioning charges net of the additional income tax expense fromthe finalization of the provisional estimate of the effect of the Tax Act, increased diluted net income per share - Omnicom GroupInc. in 2018 by $0.08, and Non-GAAP diluted net income per share - Omnicom Group Inc. increased 5.4% in 2019 compared to2018 adjusted for these items.
Reconciliation of Non-GAAP Financial Measures
Non-GAAP operating profit, adjusted EBITA, Non-GAAP net income – Omnicom Group Inc., and Non-GAAP diluted netincome per share – Omnicom Group Inc. are Non-GAAP financial measures which adjusts the 2018 financial measures for theimpact of the net gain on disposition of subsidiaries of $178.4 million and repositioning charges of $149.4 million, a net increaseof $3.9 million in income tax expense, and an allocation of $6.9 million to noncontrolling interests for these items. Accordingly,when comparing operating profit, EBITA, net income - Omnicom Group Inc. and diluted net income per share - OmnicomGroup Inc. for 2019 to 2018, we also present the 2018 reported amounts and EBITA on page 14 adjusted for the effects of thesetransactions. We believe these Non-GAAP measures aid investors by providing additional insight into our operational performanceand help clarify trends affecting our business. For comparability of reporting, management considers Non-GAAP measures inconjunction with GAAP financial results in evaluating business performance. These Non-GAAP financial measures presentedshould not be considered a substitute for, or superior to, the measures of financial performance prepared in accordance with GAAP.
The following table reconciles our financial results presented above to the Non-GAAP Financial Measures (in millions, exceptper share amounts):
Year Ended December 31,2019 2018
Non-GAAP operating profit and adjusted EBITA:Net Income - Omnicom Group Inc. . . . . . . . . . . . . . . . . . . . . . . . . . . . . . . . . . . . . . . . . . . . . . . . . . . . . . . . . . . . . . $1,339.1 $1,326.4Net Income Attributed To Noncontrolling Interests . . . . . . . . . . . . . . . . . . . . . . . . . . . . . . . . . . . . . . . . . . . . . . 96.8 114.1Net Income . . . . . . . . . . . . . . . . . . . . . . . . . . . . . . . . . . . . . . . . . . . . . . . . . . . . . . . . . . . . . . . . . . . . . . . . . . . . . . . . . . . . 1,435.9 1,440.5Income From Equity Method Investments . . . . . . . . . . . . . . . . . . . . . . . . . . . . . . . . . . . . . . . . . . . . . . . . . . . . . . . 2.0 8.9Income Tax Expense . . . . . . . . . . . . . . . . . . . . . . . . . . . . . . . . . . . . . . . . . . . . . . . . . . . . . . . . . . . . . . . . . . . . . . . . . . . . 504.4 492.7Income Before Income Taxes and Income From Equity Method Investments . . . . . . . . . . . . . . . . . . . . . . 1,938.3 1,924.3Interest Expense . . . . . . . . . . . . . . . . . . . . . . . . . . . . . . . . . . . . . . . . . . . . . . . . . . . . . . . . . . . . . . . . . . . . . . . . . . . . . . . . 244.3 266.4Interest Income . . . . . . . . . . . . . . . . . . . . . . . . . . . . . . . . . . . . . . . . . . . . . . . . . . . . . . . . . . . . . . . . . . . . . . . . . . . . . . . . . 60.3 57.2Operating profit . . . . . . . . . . . . . . . . . . . . . . . . . . . . . . . . . . . . . . . . . . . . . . . . . . . . . . . . . . . . . . . . . . . . . . . . . . . . . . . . 2,122.3 2,133.5Net gain on disposition of subsidiaries . . . . . . . . . . . . . . . . . . . . . . . . . . . . . . . . . . . . . . . . . . . . . . . . . . . . . . . . . . . — (178.4)Repositioning charges . . . . . . . . . . . . . . . . . . . . . . . . . . . . . . . . . . . . . . . . . . . . . . . . . . . . . . . . . . . . . . . . . . . . . . . . . . . — 149.4
Non-GAAP operating profit . . . . . . . . . . . . . . . . . . . . . . . . . . . . . . . . . . . . . . . . . . . . . . . . . . . . . . . . . . . . . . . . . . 2,122.3 2,104.5Add back: Amortization of intangible assets . . . . . . . . . . . . . . . . . . . . . . . . . . . . . . . . . . . . . . . . . . . . . . . . . . . . . . 83.8 102.5
Adjusted EBITA . . . . . . . . . . . . . . . . . . . . . . . . . . . . . . . . . . . . . . . . . . . . . . . . . . . . . . . . . . . . . . . . . . . . . . . . . . . . . $2,206.1 $2,207.0Non-GAAP net income - Omnicom Group Inc. and Non-GAAP diluted net income per share
Omnicom Group Inc.:Net income - Omnicom Group Inc. . . . . . . . . . . . . . . . . . . . . . . . . . . . . . . . . . . . . . . . . . . . . . . . . . . . . . . . . . . . . . $1,339.1 $1,326.4Net pre-tax gain on disposition of subsidiaries and repositioning actions . . . . . . . . . . . . . . . . . . . . . . . . . . . — (29.0)Net income tax benefit of gain on disposition of subsidiaries and repositioning actions . . . . . . . . . . . . . — (25.0)Allocation to noncontrolling interests . . . . . . . . . . . . . . . . . . . . . . . . . . . . . . . . . . . . . . . . . . . . . . . . . . . . . . . . . . . . — 6.9Net increase in tax expense related to the Tax Act . . . . . . . . . . . . . . . . . . . . . . . . . . . . . . . . . . . . . . . . . . . . . . . . . — 28.9
Non-GAAP net income - Omnicom Group Inc. . . . . . . . . . . . . . . . . . . . . . . . . . . . . . . . . . . . . . . . . . . . . . . . $1,339.1 $1,308.2
Diluted Net Income Per Share - Omnicom Group Inc. . . . . . . . . . . . . . . . . . . . . . . . . . . . . . . . . . . . . . . . . . . . $ 6.06 $ 5.83Net gain on disposition of subsidiaries, repositioning actions and impact of Tax Act . . . . . . . . . . . . . . . . — (0.08)
Non-GAAP diluted net income per share - Omnicom Group Inc. . . . . . . . . . . . . . . . . . . . . . . . . . . . . . . $ 6.06 $ 5.75 Weighted average shares . . . . . . . . . . . . . . . . . . . . . . . . . . . . . . . . . . . . . . . . . . . . . . . . . . . . . . . . . . . . . . . . . . . . . . . . . . . 220.9 227.6
24
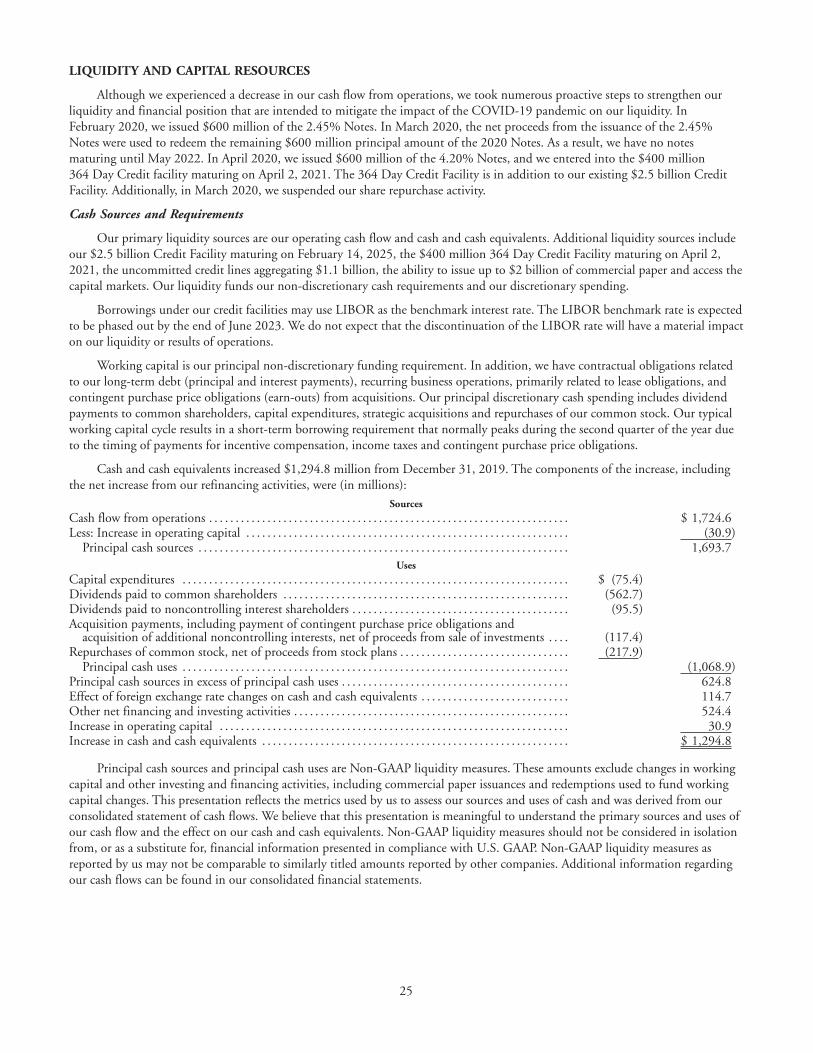
LIQUIDITY AND CAPITAL RESOURCES
Although we experienced a decrease in our cash flow from operations, we took numerous proactive steps to strengthen ourliquidity and financial position that are intended to mitigate the impact of the COVID-19 pandemic on our liquidity. InFebruary 2020, we issued $600 million of the 2.45% Notes. In March 2020, the net proceeds from the issuance of the 2.45%Notes were used to redeem the remaining $600 million principal amount of the 2020 Notes. As a result, we have no notesmaturing until May 2022. In April 2020, we issued $600 million of the 4.20% Notes, and we entered into the $400 million364 Day Credit facility maturing on April 2, 2021. The 364 Day Credit Facility is in addition to our existing $2.5 billion CreditFacility. Additionally, in March 2020, we suspended our share repurchase activity.
Cash Sources and Requirements
Our primary liquidity sources are our operating cash flow and cash and cash equivalents. Additional liquidity sources includeour $2.5 billion Credit Facility maturing on February 14, 2025, the $400 million 364 Day Credit Facility maturing on April 2,2021, the uncommitted credit lines aggregating $1.1 billion, the ability to issue up to $2 billion of commercial paper and access thecapital markets. Our liquidity funds our non-discretionary cash requirements and our discretionary spending.
Borrowings under our credit facilities may use LIBOR as the benchmark interest rate. The LIBOR benchmark rate is expectedto be phased out by the end of June 2023. We do not expect that the discontinuation of the LIBOR rate will have a material impacton our liquidity or results of operations.
Working capital is our principal non-discretionary funding requirement. In addition, we have contractual obligations relatedto our long-term debt (principal and interest payments), recurring business operations, primarily related to lease obligations, andcontingent purchase price obligations (earn-outs) from acquisitions. Our principal discretionary cash spending includes dividendpayments to common shareholders, capital expenditures, strategic acquisitions and repurchases of our common stock. Our typicalworking capital cycle results in a short-term borrowing requirement that normally peaks during the second quarter of the year dueto the timing of payments for incentive compensation, income taxes and contingent purchase price obligations.
Cash and cash equivalents increased $1,294.8 million from December 31, 2019. The components of the increase, includingthe net increase from our refinancing activities, were (in millions):
SourcesCash flow from operations . . . . . . . . . . . . . . . . . . . . . . . . . . . . . . . . . . . . . . . . . . . . . . . . . . . . . . . . . . . . . . . . . . . . $ 1,724.6Less: Increase in operating capital . . . . . . . . . . . . . . . . . . . . . . . . . . . . . . . . . . . . . . . . . . . . . . . . . . . . . . . . . . . . . (30.9)
Principal cash sources . . . . . . . . . . . . . . . . . . . . . . . . . . . . . . . . . . . . . . . . . . . . . . . . . . . . . . . . . . . . . . . . . . . . . . 1,693.7Uses
Capital expenditures . . . . . . . . . . . . . . . . . . . . . . . . . . . . . . . . . . . . . . . . . . . . . . . . . . . . . . . . . . . . . . . . . . . . . . . . . $ (75.4)Dividends paid to common shareholders . . . . . . . . . . . . . . . . . . . . . . . . . . . . . . . . . . . . . . . . . . . . . . . . . . . . . . (562.7)Dividends paid to noncontrolling interest shareholders . . . . . . . . . . . . . . . . . . . . . . . . . . . . . . . . . . . . . . . . . (95.5)Acquisition payments, including payment of contingent purchase price obligations and
acquisition of additional noncontrolling interests, net of proceeds from sale of investments . . . . (117.4)Repurchases of common stock, net of proceeds from stock plans . . . . . . . . . . . . . . . . . . . . . . . . . . . . . . . . (217.9)
Principal cash uses . . . . . . . . . . . . . . . . . . . . . . . . . . . . . . . . . . . . . . . . . . . . . . . . . . . . . . . . . . . . . . . . . . . . . . . . . (1,068.9)Principal cash sources in excess of principal cash uses . . . . . . . . . . . . . . . . . . . . . . . . . . . . . . . . . . . . . . . . . . . 624.8Effect of foreign exchange rate changes on cash and cash equivalents . . . . . . . . . . . . . . . . . . . . . . . . . . . . 114.7Other net financing and investing activities . . . . . . . . . . . . . . . . . . . . . . . . . . . . . . . . . . . . . . . . . . . . . . . . . . . . 524.4Increase in operating capital . . . . . . . . . . . . . . . . . . . . . . . . . . . . . . . . . . . . . . . . . . . . . . . . . . . . . . . . . . . . . . . . . . 30.9Increase in cash and cash equivalents . . . . . . . . . . . . . . . . . . . . . . . . . . . . . . . . . . . . . . . . . . . . . . . . . . . . . . . . . . $ 1,294.8
Principal cash sources and principal cash uses are Non-GAAP liquidity measures. These amounts exclude changes in workingcapital and other investing and financing activities, including commercial paper issuances and redemptions used to fund workingcapital changes. This presentation reflects the metrics used by us to assess our sources and uses of cash and was derived from ourconsolidated statement of cash flows. We believe that this presentation is meaningful to understand the primary sources and uses ofour cash flow and the effect on our cash and cash equivalents. Non-GAAP liquidity measures should not be considered in isolationfrom, or as a substitute for, financial information presented in compliance with U.S. GAAP. Non-GAAP liquidity measures asreported by us may not be comparable to similarly titled amounts reported by other companies. Additional information regardingour cash flows can be found in our consolidated financial statements.
25
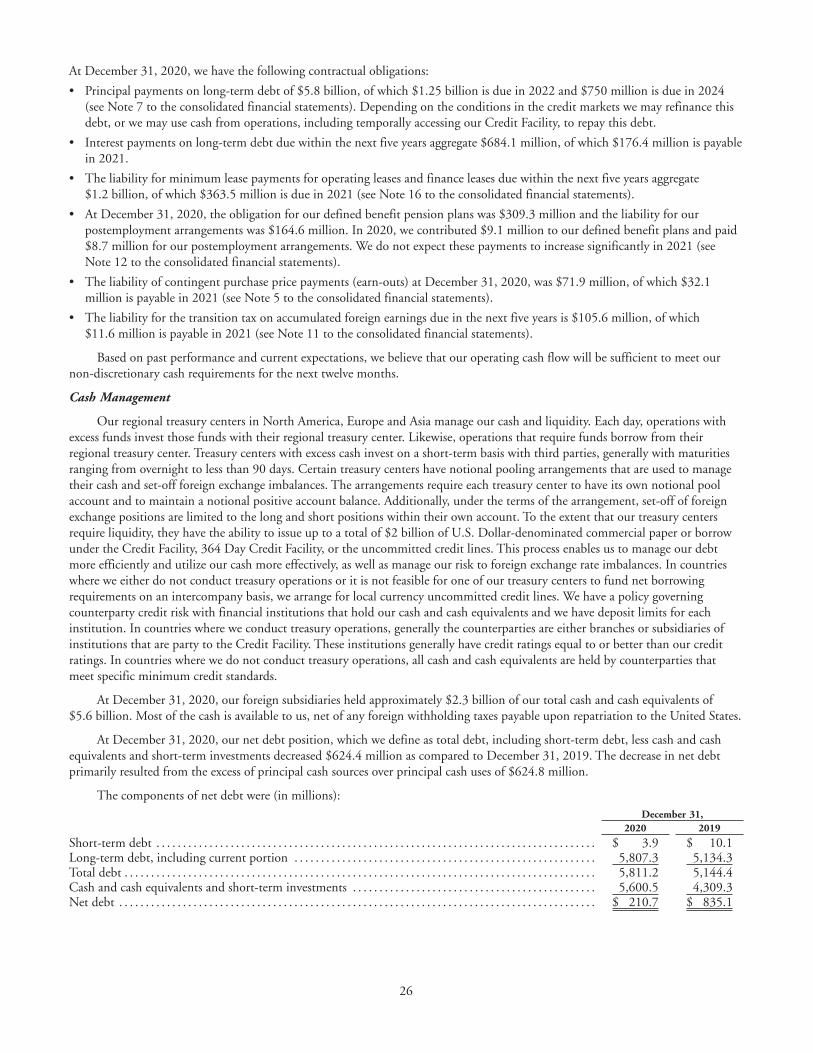
At December 31, 2020, we have the following contractual obligations:
• Principal payments on long-term debt of $5.8 billion, of which $1.25 billion is due in 2022 and $750 million is due in 2024(see Note 7 to the consolidated financial statements). Depending on the conditions in the credit markets we may refinance thisdebt, or we may use cash from operations, including temporally accessing our Credit Facility, to repay this debt.
• Interest payments on long-term debt due within the next five years aggregate $684.1 million, of which $176.4 million is payablein 2021.
• The liability for minimum lease payments for operating leases and finance leases due within the next five years aggregate$1.2 billion, of which $363.5 million is due in 2021 (see Note 16 to the consolidated financial statements).
• At December 31, 2020, the obligation for our defined benefit pension plans was $309.3 million and the liability for ourpostemployment arrangements was $164.6 million. In 2020, we contributed $9.1 million to our defined benefit plans and paid$8.7 million for our postemployment arrangements. We do not expect these payments to increase significantly in 2021 (seeNote 12 to the consolidated financial statements).
• The liability of contingent purchase price payments (earn-outs) at December 31, 2020, was $71.9 million, of which $32.1million is payable in 2021 (see Note 5 to the consolidated financial statements).
• The liability for the transition tax on accumulated foreign earnings due in the next five years is $105.6 million, of which$11.6 million is payable in 2021 (see Note 11 to the consolidated financial statements).
Based on past performance and current expectations, we believe that our operating cash flow will be sufficient to meet ournon-discretionary cash requirements for the next twelve months.
Cash Management
Our regional treasury centers in North America, Europe and Asia manage our cash and liquidity. Each day, operations withexcess funds invest those funds with their regional treasury center. Likewise, operations that require funds borrow from theirregional treasury center. Treasury centers with excess cash invest on a short-term basis with third parties, generally with maturitiesranging from overnight to less than 90 days. Certain treasury centers have notional pooling arrangements that are used to managetheir cash and set-off foreign exchange imbalances. The arrangements require each treasury center to have its own notional poolaccount and to maintain a notional positive account balance. Additionally, under the terms of the arrangement, set-off of foreignexchange positions are limited to the long and short positions within their own account. To the extent that our treasury centersrequire liquidity, they have the ability to issue up to a total of $2 billion of U.S. Dollar-denominated commercial paper or borrowunder the Credit Facility, 364 Day Credit Facility, or the uncommitted credit lines. This process enables us to manage our debtmore efficiently and utilize our cash more effectively, as well as manage our risk to foreign exchange rate imbalances. In countrieswhere we either do not conduct treasury operations or it is not feasible for one of our treasury centers to fund net borrowingrequirements on an intercompany basis, we arrange for local currency uncommitted credit lines. We have a policy governingcounterparty credit risk with financial institutions that hold our cash and cash equivalents and we have deposit limits for eachinstitution. In countries where we conduct treasury operations, generally the counterparties are either branches or subsidiaries ofinstitutions that are party to the Credit Facility. These institutions generally have credit ratings equal to or better than our creditratings. In countries where we do not conduct treasury operations, all cash and cash equivalents are held by counterparties thatmeet specific minimum credit standards.
At December 31, 2020, our foreign subsidiaries held approximately $2.3 billion of our total cash and cash equivalents of$5.6 billion. Most of the cash is available to us, net of any foreign withholding taxes payable upon repatriation to the United States.
At December 31, 2020, our net debt position, which we define as total debt, including short-term debt, less cash and cashequivalents and short-term investments decreased $624.4 million as compared to December 31, 2019. The decrease in net debtprimarily resulted from the excess of principal cash sources over principal cash uses of $624.8 million.
The components of net debt were (in millions):December 31,
2020 2019
Short-term debt . . . . . . . . . . . . . . . . . . . . . . . . . . . . . . . . . . . . . . . . . . . . . . . . . . . . . . . . . . . . . . . . . . . . . . . . . . . . . . . . . . . $ 3.9 $ 10.1Long-term debt, including current portion . . . . . . . . . . . . . . . . . . . . . . . . . . . . . . . . . . . . . . . . . . . . . . . . . . . . . . . . . 5,807.3 5,134.3Total debt . . . . . . . . . . . . . . . . . . . . . . . . . . . . . . . . . . . . . . . . . . . . . . . . . . . . . . . . . . . . . . . . . . . . . . . . . . . . . . . . . . . . . . . . . 5,811.2 5,144.4Cash and cash equivalents and short-term investments . . . . . . . . . . . . . . . . . . . . . . . . . . . . . . . . . . . . . . . . . . . . . . 5,600.5 4,309.3Net debt . . . . . . . . . . . . . . . . . . . . . . . . . . . . . . . . . . . . . . . . . . . . . . . . . . . . . . . . . . . . . . . . . . . . . . . . . . . . . . . . . . . . . . . . . . $ 210.7 $ 835.1
26
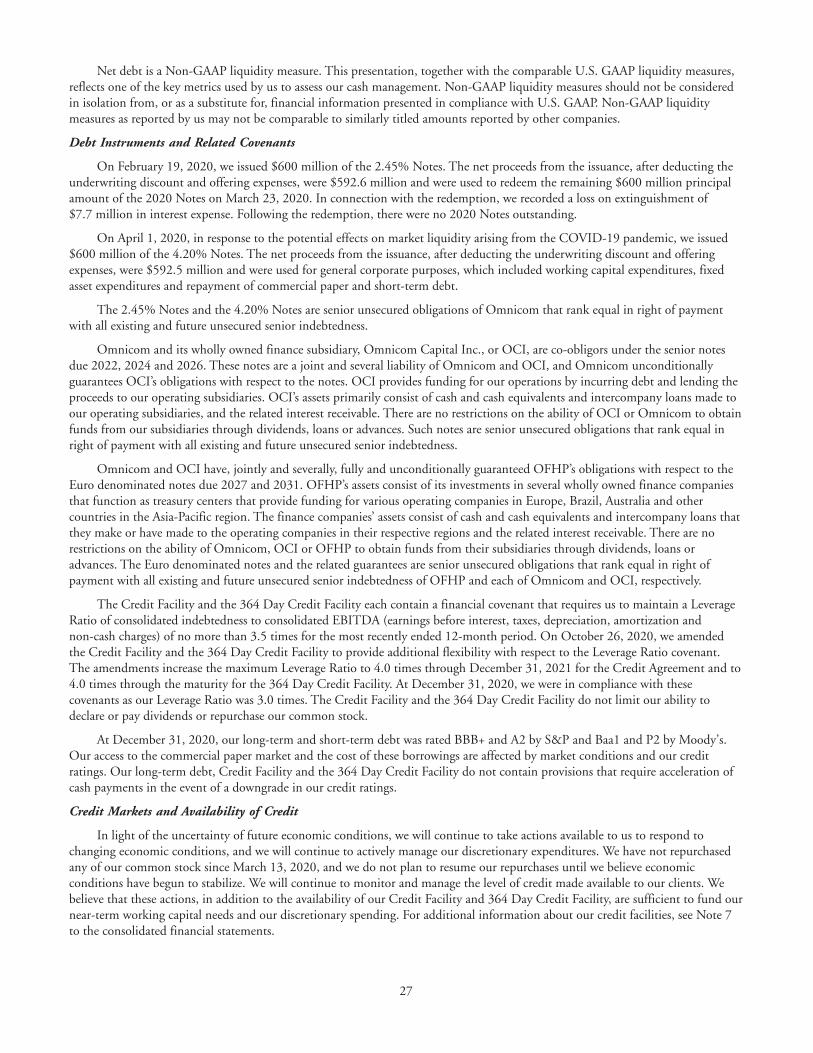
Net debt is a Non-GAAP liquidity measure. This presentation, together with the comparable U.S. GAAP liquidity measures,reflects one of the key metrics used by us to assess our cash management. Non-GAAP liquidity measures should not be consideredin isolation from, or as a substitute for, financial information presented in compliance with U.S. GAAP. Non-GAAP liquiditymeasures as reported by us may not be comparable to similarly titled amounts reported by other companies.
Debt Instruments and Related Covenants
On February 19, 2020, we issued $600 million of the 2.45% Notes. The net proceeds from the issuance, after deducting theunderwriting discount and offering expenses, were $592.6 million and were used to redeem the remaining $600 million principalamount of the 2020 Notes on March 23, 2020. In connection with the redemption, we recorded a loss on extinguishment of$7.7 million in interest expense. Following the redemption, there were no 2020 Notes outstanding.
On April 1, 2020, in response to the potential effects on market liquidity arising from the COVID-19 pandemic, we issued$600 million of the 4.20% Notes. The net proceeds from the issuance, after deducting the underwriting discount and offeringexpenses, were $592.5 million and were used for general corporate purposes, which included working capital expenditures, fixedasset expenditures and repayment of commercial paper and short-term debt.
The 2.45% Notes and the 4.20% Notes are senior unsecured obligations of Omnicom that rank equal in right of paymentwith all existing and future unsecured senior indebtedness.
Omnicom and its wholly owned finance subsidiary, Omnicom Capital Inc., or OCI, are co-obligors under the senior notesdue 2022, 2024 and 2026. These notes are a joint and several liability of Omnicom and OCI, and Omnicom unconditionallyguarantees OCI’s obligations with respect to the notes. OCI provides funding for our operations by incurring debt and lending theproceeds to our operating subsidiaries. OCI’s assets primarily consist of cash and cash equivalents and intercompany loans made toour operating subsidiaries, and the related interest receivable. There are no restrictions on the ability of OCI or Omnicom to obtainfunds from our subsidiaries through dividends, loans or advances. Such notes are senior unsecured obligations that rank equal inright of payment with all existing and future unsecured senior indebtedness.
Omnicom and OCI have, jointly and severally, fully and unconditionally guaranteed OFHP’s obligations with respect to theEuro denominated notes due 2027 and 2031. OFHP’s assets consist of its investments in several wholly owned finance companiesthat function as treasury centers that provide funding for various operating companies in Europe, Brazil, Australia and othercountries in the Asia-Pacific region. The finance companies’ assets consist of cash and cash equivalents and intercompany loans thatthey make or have made to the operating companies in their respective regions and the related interest receivable. There are norestrictions on the ability of Omnicom, OCI or OFHP to obtain funds from their subsidiaries through dividends, loans oradvances. The Euro denominated notes and the related guarantees are senior unsecured obligations that rank equal in right ofpayment with all existing and future unsecured senior indebtedness of OFHP and each of Omnicom and OCI, respectively.
The Credit Facility and the 364 Day Credit Facility each contain a financial covenant that requires us to maintain a LeverageRatio of consolidated indebtedness to consolidated EBITDA (earnings before interest, taxes, depreciation, amortization andnon-cash charges) of no more than 3.5 times for the most recently ended 12-month period. On October 26, 2020, we amendedthe Credit Facility and the 364 Day Credit Facility to provide additional flexibility with respect to the Leverage Ratio covenant.The amendments increase the maximum Leverage Ratio to 4.0 times through December 31, 2021 for the Credit Agreement and to4.0 times through the maturity for the 364 Day Credit Facility. At December 31, 2020, we were in compliance with thesecovenants as our Leverage Ratio was 3.0 times. The Credit Facility and the 364 Day Credit Facility do not limit our ability todeclare or pay dividends or repurchase our common stock.
At December 31, 2020, our long-term and short-term debt was rated BBB+ and A2 by S&P and Baa1 and P2 by Moody’s.Our access to the commercial paper market and the cost of these borrowings are affected by market conditions and our creditratings. Our long-term debt, Credit Facility and the 364 Day Credit Facility do not contain provisions that require acceleration ofcash payments in the event of a downgrade in our credit ratings.
Credit Markets and Availability of Credit
In light of the uncertainty of future economic conditions, we will continue to take actions available to us to respond tochanging economic conditions, and we will continue to actively manage our discretionary expenditures. We have not repurchasedany of our common stock since March 13, 2020, and we do not plan to resume our repurchases until we believe economicconditions have begun to stabilize. We will continue to monitor and manage the level of credit made available to our clients. Webelieve that these actions, in addition to the availability of our Credit Facility and 364 Day Credit Facility, are sufficient to fund ournear-term working capital needs and our discretionary spending. For additional information about our credit facilities, see Note 7to the consolidated financial statements.
27
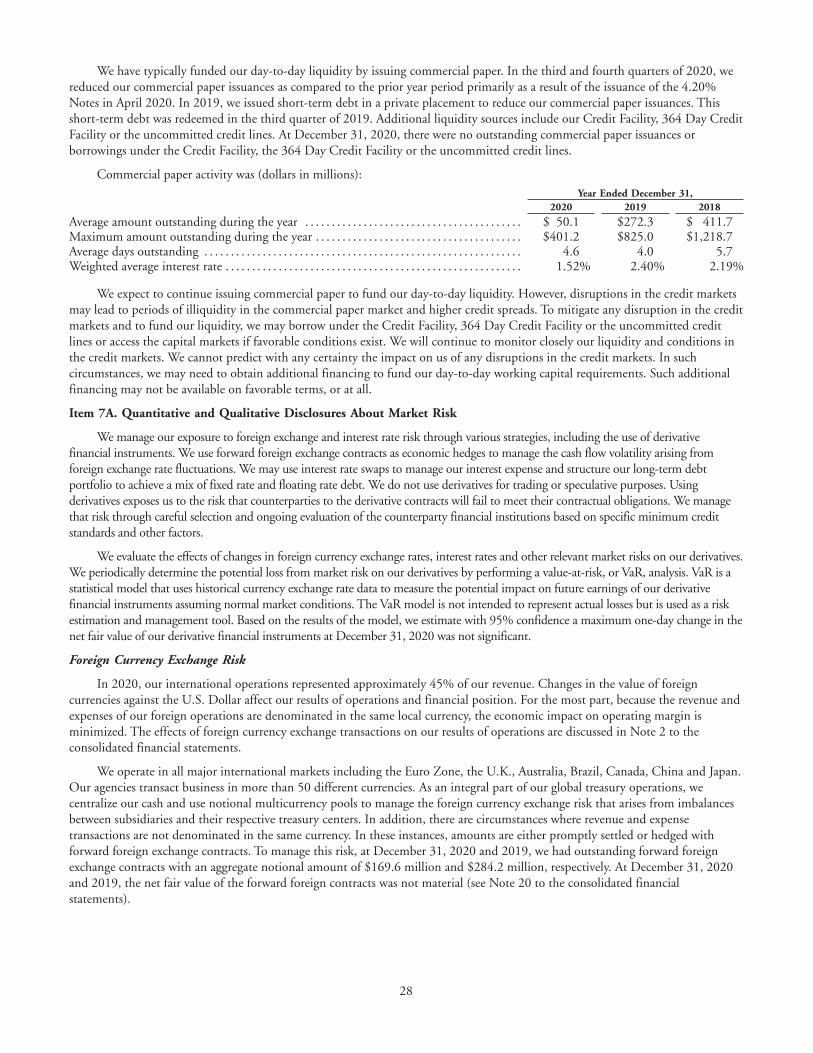
We have typically funded our day-to-day liquidity by issuing commercial paper. In the third and fourth quarters of 2020, wereduced our commercial paper issuances as compared to the prior year period primarily as a result of the issuance of the 4.20%Notes in April 2020. In 2019, we issued short-term debt in a private placement to reduce our commercial paper issuances. Thisshort-term debt was redeemed in the third quarter of 2019. Additional liquidity sources include our Credit Facility, 364 Day CreditFacility or the uncommitted credit lines. At December 31, 2020, there were no outstanding commercial paper issuances orborrowings under the Credit Facility, the 364 Day Credit Facility or the uncommitted credit lines.
Commercial paper activity was (dollars in millions):Year Ended December 31,
2020 2019 2018
Average amount outstanding during the year . . . . . . . . . . . . . . . . . . . . . . . . . . . . . . . . . . . . . . . . . $ 50.1 $272.3 $ 411.7Maximum amount outstanding during the year . . . . . . . . . . . . . . . . . . . . . . . . . . . . . . . . . . . . . . . $401.2 $825.0 $1,218.7Average days outstanding . . . . . . . . . . . . . . . . . . . . . . . . . . . . . . . . . . . . . . . . . . . . . . . . . . . . . . . . . . . . 4.6 4.0 5.7Weighted average interest rate . . . . . . . . . . . . . . . . . . . . . . . . . . . . . . . . . . . . . . . . . . . . . . . . . . . . . . . . 1.52% 2.40% 2.19%
We expect to continue issuing commercial paper to fund our day-to-day liquidity. However, disruptions in the credit marketsmay lead to periods of illiquidity in the commercial paper market and higher credit spreads. To mitigate any disruption in the creditmarkets and to fund our liquidity, we may borrow under the Credit Facility, 364 Day Credit Facility or the uncommitted creditlines or access the capital markets if favorable conditions exist. We will continue to monitor closely our liquidity and conditions inthe credit markets. We cannot predict with any certainty the impact on us of any disruptions in the credit markets. In suchcircumstances, we may need to obtain additional financing to fund our day-to-day working capital requirements. Such additionalfinancing may not be available on favorable terms, or at all.
Item 7A. Quantitative and Qualitative Disclosures About Market Risk
We manage our exposure to foreign exchange and interest rate risk through various strategies, including the use of derivativefinancial instruments. We use forward foreign exchange contracts as economic hedges to manage the cash flow volatility arising fromforeign exchange rate fluctuations. We may use interest rate swaps to manage our interest expense and structure our long-term debtportfolio to achieve a mix of fixed rate and floating rate debt. We do not use derivatives for trading or speculative purposes. Usingderivatives exposes us to the risk that counterparties to the derivative contracts will fail to meet their contractual obligations. We managethat risk through careful selection and ongoing evaluation of the counterparty financial institutions based on specific minimum creditstandards and other factors.
We evaluate the effects of changes in foreign currency exchange rates, interest rates and other relevant market risks on our derivatives.We periodically determine the potential loss from market risk on our derivatives by performing a value-at-risk, or VaR, analysis. VaR is astatistical model that uses historical currency exchange rate data to measure the potential impact on future earnings of our derivativefinancial instruments assuming normal market conditions. The VaR model is not intended to represent actual losses but is used as a riskestimation and management tool. Based on the results of the model, we estimate with 95% confidence a maximum one-day change in thenet fair value of our derivative financial instruments at December 31, 2020 was not significant.
Foreign Currency Exchange Risk
In 2020, our international operations represented approximately 45% of our revenue. Changes in the value of foreigncurrencies against the U.S. Dollar affect our results of operations and financial position. For the most part, because the revenue andexpenses of our foreign operations are denominated in the same local currency, the economic impact on operating margin isminimized. The effects of foreign currency exchange transactions on our results of operations are discussed in Note 2 to theconsolidated financial statements.
We operate in all major international markets including the Euro Zone, the U.K., Australia, Brazil, Canada, China and Japan.Our agencies transact business in more than 50 different currencies. As an integral part of our global treasury operations, wecentralize our cash and use notional multicurrency pools to manage the foreign currency exchange risk that arises from imbalancesbetween subsidiaries and their respective treasury centers. In addition, there are circumstances where revenue and expensetransactions are not denominated in the same currency. In these instances, amounts are either promptly settled or hedged withforward foreign exchange contracts. To manage this risk, at December 31, 2020 and 2019, we had outstanding forward foreignexchange contracts with an aggregate notional amount of $169.6 million and $284.2 million, respectively. At December 31, 2020and 2019, the net fair value of the forward foreign contracts was not material (see Note 20 to the consolidated financialstatements).
28
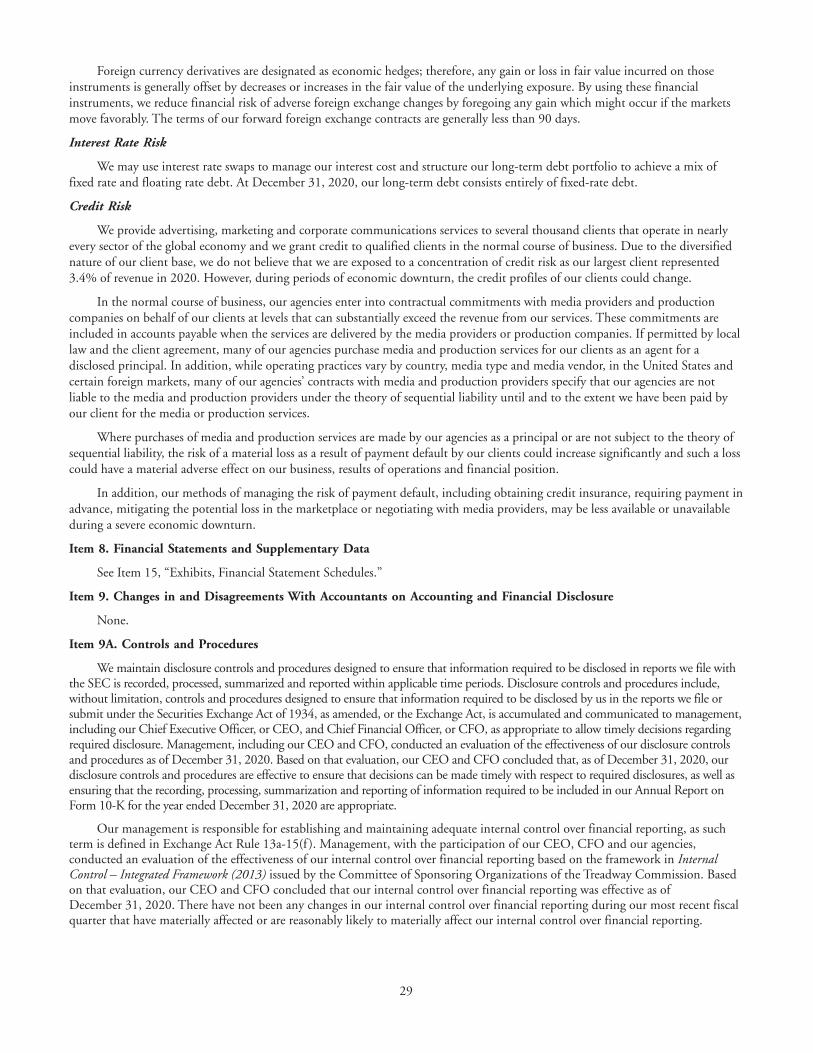
Foreign currency derivatives are designated as economic hedges; therefore, any gain or loss in fair value incurred on thoseinstruments is generally offset by decreases or increases in the fair value of the underlying exposure. By using these financialinstruments, we reduce financial risk of adverse foreign exchange changes by foregoing any gain which might occur if the marketsmove favorably. The terms of our forward foreign exchange contracts are generally less than 90 days.
Interest Rate Risk
We may use interest rate swaps to manage our interest cost and structure our long-term debt portfolio to achieve a mix offixed rate and floating rate debt. At December 31, 2020, our long-term debt consists entirely of fixed-rate debt.
Credit Risk
We provide advertising, marketing and corporate communications services to several thousand clients that operate in nearlyevery sector of the global economy and we grant credit to qualified clients in the normal course of business. Due to the diversifiednature of our client base, we do not believe that we are exposed to a concentration of credit risk as our largest client represented3.4% of revenue in 2020. However, during periods of economic downturn, the credit profiles of our clients could change.
In the normal course of business, our agencies enter into contractual commitments with media providers and productioncompanies on behalf of our clients at levels that can substantially exceed the revenue from our services. These commitments areincluded in accounts payable when the services are delivered by the media providers or production companies. If permitted by locallaw and the client agreement, many of our agencies purchase media and production services for our clients as an agent for adisclosed principal. In addition, while operating practices vary by country, media type and media vendor, in the United States andcertain foreign markets, many of our agencies’ contracts with media and production providers specify that our agencies are notliable to the media and production providers under the theory of sequential liability until and to the extent we have been paid byour client for the media or production services.
Where purchases of media and production services are made by our agencies as a principal or are not subject to the theory ofsequential liability, the risk of a material loss as a result of payment default by our clients could increase significantly and such a losscould have a material adverse effect on our business, results of operations and financial position.
In addition, our methods of managing the risk of payment default, including obtaining credit insurance, requiring payment inadvance, mitigating the potential loss in the marketplace or negotiating with media providers, may be less available or unavailableduring a severe economic downturn.
Item 8. Financial Statements and Supplementary Data
See Item 15, “Exhibits, Financial Statement Schedules.”
Item 9. Changes in and Disagreements With Accountants on Accounting and Financial Disclosure
None.
Item 9A. Controls and Procedures
We maintain disclosure controls and procedures designed to ensure that information required to be disclosed in reports we file withthe SEC is recorded, processed, summarized and reported within applicable time periods. Disclosure controls and procedures include,without limitation, controls and procedures designed to ensure that information required to be disclosed by us in the reports we file orsubmit under the Securities Exchange Act of 1934, as amended, or the Exchange Act, is accumulated and communicated to management,including our Chief Executive Officer, or CEO, and Chief Financial Officer, or CFO, as appropriate to allow timely decisions regardingrequired disclosure. Management, including our CEO and CFO, conducted an evaluation of the effectiveness of our disclosure controlsand procedures as of December 31, 2020. Based on that evaluation, our CEO and CFO concluded that, as of December 31, 2020, ourdisclosure controls and procedures are effective to ensure that decisions can be made timely with respect to required disclosures, as well asensuring that the recording, processing, summarization and reporting of information required to be included in our Annual Report onForm 10-K for the year ended December 31, 2020 are appropriate.
Our management is responsible for establishing and maintaining adequate internal control over financial reporting, as suchterm is defined in Exchange Act Rule 13a-15(f ). Management, with the participation of our CEO, CFO and our agencies,conducted an evaluation of the effectiveness of our internal control over financial reporting based on the framework in InternalControl – Integrated Framework (2013) issued by the Committee of Sponsoring Organizations of the Treadway Commission. Basedon that evaluation, our CEO and CFO concluded that our internal control over financial reporting was effective as ofDecember 31, 2020. There have not been any changes in our internal control over financial reporting during our most recent fiscalquarter that have materially affected or are reasonably likely to materially affect our internal control over financial reporting.
29
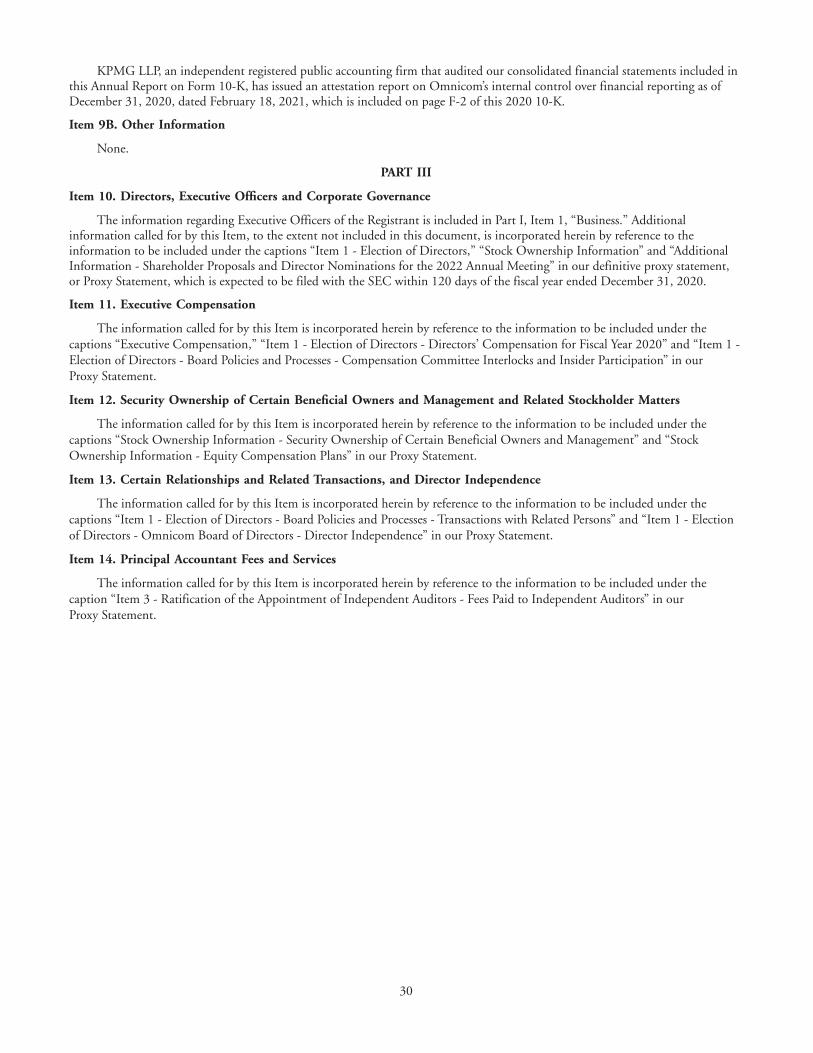
KPMG LLP, an independent registered public accounting firm that audited our consolidated financial statements included inthis Annual Report on Form 10-K, has issued an attestation report on Omnicom’s internal control over financial reporting as ofDecember 31, 2020, dated February 18, 2021, which is included on page F-2 of this 2020 10-K.
Item 9B. Other Information
None.
PART III
Item 10. Directors, Executive Officers and Corporate Governance
The information regarding Executive Officers of the Registrant is included in Part I, Item 1, “Business.” Additionalinformation called for by this Item, to the extent not included in this document, is incorporated herein by reference to theinformation to be included under the captions “Item 1 - Election of Directors,” “Stock Ownership Information” and “AdditionalInformation - Shareholder Proposals and Director Nominations for the 2022 Annual Meeting” in our definitive proxy statement,or Proxy Statement, which is expected to be filed with the SEC within 120 days of the fiscal year ended December 31, 2020.
Item 11. Executive Compensation
The information called for by this Item is incorporated herein by reference to the information to be included under thecaptions “Executive Compensation,” “Item 1 - Election of Directors - Directors’ Compensation for Fiscal Year 2020” and “Item 1 -Election of Directors - Board Policies and Processes - Compensation Committee Interlocks and Insider Participation” in ourProxy Statement.
Item 12. Security Ownership of Certain Beneficial Owners and Management and Related Stockholder Matters
The information called for by this Item is incorporated herein by reference to the information to be included under thecaptions “Stock Ownership Information - Security Ownership of Certain Beneficial Owners and Management” and “StockOwnership Information - Equity Compensation Plans” in our Proxy Statement.
Item 13. Certain Relationships and Related Transactions, and Director Independence
The information called for by this Item is incorporated herein by reference to the information to be included under thecaptions “Item 1 - Election of Directors - Board Policies and Processes - Transactions with Related Persons” and “Item 1 - Electionof Directors - Omnicom Board of Directors - Director Independence” in our Proxy Statement.
Item 14. Principal Accountant Fees and Services
The information called for by this Item is incorporated herein by reference to the information to be included under thecaption “Item 3 - Ratification of the Appointment of Independent Auditors - Fees Paid to Independent Auditors” in ourProxy Statement.
30
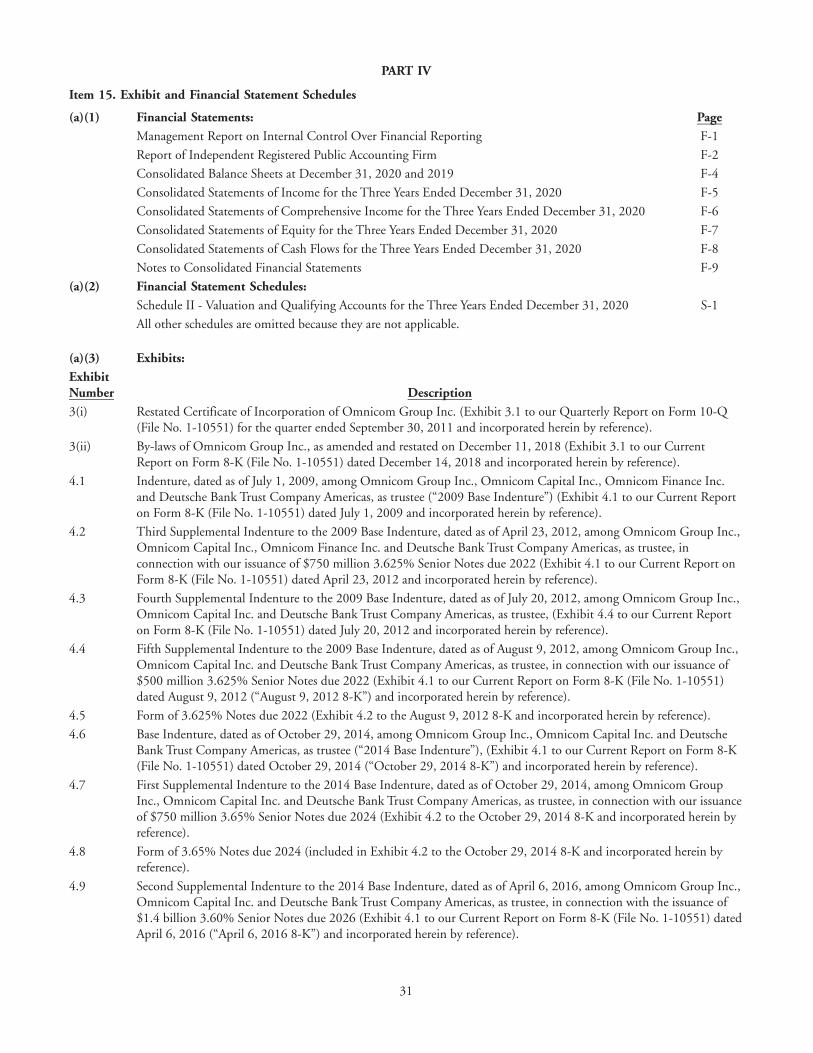
PART IV
Item 15. Exhibit and Financial Statement Schedules
(a)(1) Financial Statements: Page
Management Report on Internal Control Over Financial Reporting F-1
Report of Independent Registered Public Accounting Firm F-2
Consolidated Balance Sheets at December 31, 2020 and 2019 F-4
Consolidated Statements of Income for the Three Years Ended December 31, 2020 F-5
Consolidated Statements of Comprehensive Income for the Three Years Ended December 31, 2020 F-6
Consolidated Statements of Equity for the Three Years Ended December 31, 2020 F-7
Consolidated Statements of Cash Flows for the Three Years Ended December 31, 2020 F-8
Notes to Consolidated Financial Statements F-9
(a)(2) Financial Statement Schedules:
Schedule II - Valuation and Qualifying Accounts for the Three Years Ended December 31, 2020 S-1
All other schedules are omitted because they are not applicable.
(a)(3) Exhibits:
ExhibitNumber Description
3(i) Restated Certificate of Incorporation of Omnicom Group Inc. (Exhibit 3.1 to our Quarterly Report on Form 10-Q(File No. 1-10551) for the quarter ended September 30, 2011 and incorporated herein by reference).
3(ii) By-laws of Omnicom Group Inc., as amended and restated on December 11, 2018 (Exhibit 3.1 to our CurrentReport on Form 8-K (File No. 1-10551) dated December 14, 2018 and incorporated herein by reference).
4.1 Indenture, dated as of July 1, 2009, among Omnicom Group Inc., Omnicom Capital Inc., Omnicom Finance Inc.and Deutsche Bank Trust Company Americas, as trustee (“2009 Base Indenture”) (Exhibit 4.1 to our Current Reporton Form 8-K (File No. 1-10551) dated July 1, 2009 and incorporated herein by reference).
4.2 Third Supplemental Indenture to the 2009 Base Indenture, dated as of April 23, 2012, among Omnicom Group Inc.,Omnicom Capital Inc., Omnicom Finance Inc. and Deutsche Bank Trust Company Americas, as trustee, inconnection with our issuance of $750 million 3.625% Senior Notes due 2022 (Exhibit 4.1 to our Current Report onForm 8-K (File No. 1-10551) dated April 23, 2012 and incorporated herein by reference).
4.3 Fourth Supplemental Indenture to the 2009 Base Indenture, dated as of July 20, 2012, among Omnicom Group Inc.,Omnicom Capital Inc. and Deutsche Bank Trust Company Americas, as trustee, (Exhibit 4.4 to our Current Reporton Form 8-K (File No. 1-10551) dated July 20, 2012 and incorporated herein by reference).
4.4 Fifth Supplemental Indenture to the 2009 Base Indenture, dated as of August 9, 2012, among Omnicom Group Inc.,Omnicom Capital Inc. and Deutsche Bank Trust Company Americas, as trustee, in connection with our issuance of$500 million 3.625% Senior Notes due 2022 (Exhibit 4.1 to our Current Report on Form 8-K (File No. 1-10551)dated August 9, 2012 (“August 9, 2012 8-K”) and incorporated herein by reference).
4.5 Form of 3.625% Notes due 2022 (Exhibit 4.2 to the August 9, 2012 8-K and incorporated herein by reference).
4.6 Base Indenture, dated as of October 29, 2014, among Omnicom Group Inc., Omnicom Capital Inc. and DeutscheBank Trust Company Americas, as trustee (“2014 Base Indenture”), (Exhibit 4.1 to our Current Report on Form 8-K(File No. 1-10551) dated October 29, 2014 (“October 29, 2014 8-K”) and incorporated herein by reference).
4.7 First Supplemental Indenture to the 2014 Base Indenture, dated as of October 29, 2014, among Omnicom GroupInc., Omnicom Capital Inc. and Deutsche Bank Trust Company Americas, as trustee, in connection with our issuanceof $750 million 3.65% Senior Notes due 2024 (Exhibit 4.2 to the October 29, 2014 8-K and incorporated herein byreference).
4.8 Form of 3.65% Notes due 2024 (included in Exhibit 4.2 to the October 29, 2014 8-K and incorporated herein byreference).
4.9 Second Supplemental Indenture to the 2014 Base Indenture, dated as of April 6, 2016, among Omnicom Group Inc.,Omnicom Capital Inc. and Deutsche Bank Trust Company Americas, as trustee, in connection with the issuance of$1.4 billion 3.60% Senior Notes due 2026 (Exhibit 4.1 to our Current Report on Form 8-K (File No. 1-10551) datedApril 6, 2016 (“April 6, 2016 8-K”) and incorporated herein by reference).
31
4.10 Form of 3.60% Notes due 2026 (included in Exhibit 4.1 to the April 6, 2016 8-K and incorporated herein byreference).
4.11 Base Indenture, dated as of July 8, 2019, among Omnicom Finance Holdings plc, as issuer, Omnicom Group Inc. andOmnicom Capital Inc., as guarantors, and Deutsche Bank Trust Company Americas, as trustee (“2019 BaseIndenture”), (Exhibit 4.1 to our Current Report on Form 8-K (File No. 1-10551) dated July 8, 2019 (“July 8, 20198-K”) and incorporated herein by reference).
4.12 First Supplemental Indenture to the 2019 Base Indenture, dated as of July 8, 2019, among Omnicom FinanceHoldings plc, as issuer, Omnicom Group Inc. and Omnicom Capital Inc., as guarantors, and Deutsche Bank TrustCompany Americas, as trustee, in connection with the issuance of €500 million aggregate principal amount of SeniorNotes due 2027 and €500 million aggregate principal amount of Senior Notes due 2031 (Exhibit 4.2 to the July 8,2019 8-K and incorporated herein by reference).
4.13 Form of 0.80% Notes due 2027 (included in Exhibit 4.2 to the July 8, 2019 8-K and incorporated herein byreference).
4.14 Form of 1.40% Notes due 2031 (included in Exhibit 4.2 to the July 8, 2019 8-K and incorporated herein byreference).
4.15 Base Indenture, dated as of February 21, 2020, among Omnicom Group Inc., as issuer, and Deutsche Bank TrustCompany Americas, as trustee (Exhibit 4.1 to our Current Report on Form 8-K (File No. 1-10551) filed on February21, 2020 (″February 21, 2020 8-K″) and incorporated herein by reference).
4.16 First Supplemental Indenture, dated as of February 21, 2020, among Omnicom Group Inc., as issuer, and DeutscheBank Trust Company Americas, as trustee (Exhibit 4.2 to the February 21, 2020 8-K and incorporated herein byreference).
4.17 Form of 2.450% Notes due 2030 (Included in Exhibit 4.2 to the February 21, 2020 8-K and incorporated herein byreference).
4.18 Second Supplemental Indenture, dated as of April 1, 2020, among Omnicom Group Inc., as issuer, and DeutscheBank Trust Company Americas, as trustee (Exhibit 4.1 to our Current Report on Form 8-K (File No. 1-10551) filedon April 1, 2020 (“April 1, 2020 8-K”) and incorporated herein by reference).
4.19 Form of 4.200% Notes due 2030 (Included in Exhibit 4.1 to the April 1, 2020 8-K and incorporated herein byreference).
4.20 Description of Securities (Exhibit 4.17 to our Annual Report on Form 10-K (File No. 1-10551) for the year endedDecember 31, 2019 and incorporated herein by reference).
10.1 Second Amended and Restated Five Year Credit Agreement, dated as of February 14, 2020, by and among OmnicomCapital Inc., a Connecticut corporation, Omnicom Finance Limited, a private limited company organized under thelaws of England and Wales, Omnicom Group Inc., a New York corporation, any other subsidiary of Omnicom GroupInc. designated for borrowing privileges, the banks, financial institutions and other institutional lenders and initialissuing banks listed on the signature pages thereof, Citibank, N.A., JPMorgan Chase Bank, N.A., and Wells FargoSecurities, LLC, as lead arrangers and book managers, JPMorgan Chase Bank, N.A. and Wells Fargo Bank, NationalAssociation, as syndication agents, Bank of America, N.A., BNP Paribas, Barclays Bank PLC, Deutsche BankSecurities Inc. and HSBC Bank USA, National Association, as documentation agents, and Citibank, N.A., asadministrative agent for the lenders (Exhibit 10.1 to our Current Report on Form 8-K (File No. 1-10551) filed onFebruary 19, 2020 and incorporated herein by reference).
10.2 364-Day Credit Agreement, dated as of April 3, 2020, by and among Omnicom Capital Inc., Omnicom Group Inc.,the banks, financial institutions and other institutional lenders and initial issuing banks listed on the signature pagesthereof, Citibank, N.A., BofA Securities, Inc., Mizuho Bank, Ltd. and U.S. Bank National Association, as joint leadarrangers and joint book managers, Bank of America, N.A., Mizuho Bank, Ltd. and U.S. Bank National Association,as syndication agents, and Citibank, N.A., as administrative agent for the lenders (Exhibit 10.1 to our Current Reporton Form 8-K (File No. 1-10551) filed on April 6, 2020 and incorporated herein by reference).
32
10.3 Amendment No. 1 to the Credit Agreement, dated October 26, 2020, to the Second Amended and Restated Five YearCredit Agreement, dated as of February 14, 2020, by and among Omnicom Capital Inc., Omnicom Finance Limited,Omnicom Group Inc., any other subsidiary of Omnicom Group Inc. designated for borrowing privileges, the banks,financial institutions and other institutional lenders party thereto, Citibank, N.A., JPMorgan Chase Bank, N.A., andWells Fargo Securities, LLC, as lead arrangers and book managers, JPMorgan Chase Bank, N.A. and Wells FargoBank, National Association, as syndication agents, Bank of America, N.A., BNP Paribas, Barclays Bank PLC,Deutsche Bank Securities Inc. and HSBC Bank USA, National Association, as documentation agents, and Citibank,N.A., as administrative agent for the lenders (Exhibit 10.1 to our Quarterly Report on Form 10-Q (File No. 1-10551)for the quarter ended September 30, 2020 (″September 30, 2020 10-Q″) and incorporated herein by reference).
10.4 Amendment No. 1 to the Credit Agreement, dated October 26, 2020, to the 364-Day Credit Agreement, dated as ofApril 3, 2020, by and among Omnicom Capital Inc., Omnicom Group Inc., the banks, financial institutions andother institutional lenders party thereto, Citibank, N.A., BofA Securities, Inc., Mizuho Bank, Ltd. and U.S. BankNational Association, as joint lead arrangers and joint book managers, Bank of America, N.A., Mizuho Bank, Ltd. andU.S. Bank National Association, as syndication agents, and Citibank, N.A., as administrative agent for the lenders(Exhibit 10.2 to the September 30, 2020 10-Q and incorporated herein by reference).
10.5 Director Compensation and Director Compensation and Deferred Stock Program Stock Program (Exhibit 10.1 to ourQuarterly Report on Form 10-Q (File No. 1-10551) for the quarter ended March 31, 2020 (″March 31, 2020 10-Q″)and incorporated herein by reference).
10.6 Standard form of our Executive Salary Continuation Plan Agreement (Exhibit 10.5 to our Annual Report on Form10-K (File No. 1-10551) for the year ended December 31, 2012 and incorporated herein by reference).
10.7 Standard form of the Director Indemnification Agreement (Exhibit 10.25 to our Annual Report on Form 10-K (FileNo. 1-10551) for the year ended December 31, 1989 and incorporated herein by reference).
10.8 Senior Management Incentive Plan as amended and restated on December 4, 2008 (Exhibit 10.9 to our AnnualReport on Form 10-K (File No. 1-10551) for the year ended December 31, 2008 (“2008 10-K”) and incorporatedherein by reference).
10.9 Omnicom Group Inc. SERCR Plan (Exhibit 10.10 to our Annual Report on Form 10-K (File No. 1-10551) for theyear ended December 31, 2011 and incorporated herein by reference).
10.10 Form of Award Agreement under the Omnicom Group Inc. SERCR Plan (Exhibit 10.2 to our Current Report onForm 8-K (File No. 1-10551) dated December 13, 2006 and incorporated herein by reference).
10.11 Omnicom Group Inc. Amended and Restated 2007 Incentive Award Plan (Appendix A to our Proxy Statement (FileNo. 1-10551) filed on April 15, 2010 and incorporated herein by reference).
10.12 Form of Indemnification Agreement (Exhibit 10.1 to our Quarterly Report on Form 10-Q (File No. 1-10551) for thequarter ended June 30, 2007 and incorporated herein by reference).
10.13 Restricted Stock Unit Deferred Compensation Plan (Exhibit 10.16 to the 2008 10-K and incorporated herein byreference).
10.14 Restricted Stock Deferred Compensation Plan (Exhibit 10.17 to the 2008 10-K and incorporated herein byreference).
10.15 Amendment No. 1 to the Restricted Stock Deferred Compensation Plan (Exhibit 10.18 to the 2008 10-K andincorporated herein by reference).
10.16 Amendment No. 2 to the Restricted Stock Deferred Compensation Plan (Exhibit 10.19 to the 2008 10-K andincorporated herein by reference).
10.17 Form of Grant Notice and Option Agreement (Exhibit 10.20 to our Annual Report on Form 10-K (File No.1-10551) for the year ended December 31, 2010 (“2010 10-K”) and incorporated herein by reference).
10.18 Form of Grant Notice and Restricted Stock Agreement (Exhibit 10.21 to 2010 10-K and incorporated herein byreference).
10.19 Form of Grant Notice and Restricted Stock Unit Agreement (Exhibit 10.22 to 2010 10-K and incorporated herein byreference).
10.20 Form of Grant Notice and Performance Restricted Stock Unit Agreement (Exhibit 10.1 to our Quarterly Report onForm 10-Q (File No. 1-10551) for the quarter ended June 30, 2011 and incorporated herein by reference).
10.21 Omnicom Group Inc. 2013 Incentive Award Plan (Appendix A to our Proxy Statement (File No. 1-10551) filed onApril 11, 2013 and incorporated herein by reference).
33
10.22 Director Compensation and Deferred Stock Program (Exhibit 10.19 to our Annual Report on Form 10-K (File No.1-10551) for the year ended December 31, 2016 and incorporated herein by reference).
10.23 Separation Agreement, dated October 12, 2018, by and between Omnicom Capital Inc. and Dennis Hewitt (Exhibit10.1 to our Current Report on Form 8-K (File No. 1-10551) filed on October 18, 2018 and incorporated herein byreference).
10.24 Rochelle Tarlowe employment letter (Exhibit 10.3 to the March 31, 2020 10-Q and incorporated herein byreference).
21 Subsidiaries of the Registrant.
23 Consent of KPMG LLP.
31.1 Certification of Chairman and Chief Executive Officer required by Rule 13a-14(a) under the Securities Exchange Actof 1934, as amended.
31.2 Certification of Executive Vice President and Chief Financial Officer required by Rule 13a-14(a) under the SecuritiesExchange Act of 1934, as amended.
32 Certification of the Chairman and Chief Executive Officer and the Executive Vice President and Chief FinancialOfficer required by Rule 13a-14(b) under the Securities Exchange Act of 1934, as amended, and 18 U.S.C. Section1350.
101.INS Inline XBRL Instance Document (the instance document does not appear in the Interactive Data File because itsXBRL tags are embedded within the Inline XBRL document)
101.SCH Inline XBRL Taxonomy Extension Schema Document
101.CAL Inline XBRL Taxonomy Extension Calculation Linkbase Document
101.DEF Inline XBRL Taxonomy Extension Definition Linkbase Document
101.LAB Inline XBRL Taxonomy Extension Label Linkbase Document
101.PRE Inline XBRL Taxonomy Extension Presentation Linkbase Document
104 Cover Page Interactive Data File (formatted as inline XBRL and contained in Exhibit 101)
Item 16. Form 10-K Summary
None.
34
SIGNATURES
Pursuant to the requirements of Section 13 or 15(d) of the Securities Exchange Act of 1934, the registrant has dulycaused this report to be signed on its behalf by the undersigned, thereunto duly authorized.
OMNICOM GROUP INC.
February 18, 2021 BY: /S/ PHILIP J. ANGELASTRO
Philip J. AngelastroExecutive Vice President and Chief Financial Officer
Pursuant to the requirements of the Securities Exchange Act of 1934, this report has been signed below by thefollowing persons on behalf of the registrant and in the capacities and on the dates indicated.
Signature Title Date
/S/ JOHN D. WREN Chairman and Chief Executive Officer and Director(Principal Executive Officer)
February 18, 2021
John D. Wren
/S/ PHILIP J. ANGELASTRO Executive Vice President and Chief Financial Officer(Principal Financial Officer)
February 18, 2021
Philip J. Angelastro
/S/ ANDREW L. CASTELLANETA Senior Vice President, Chief Accounting Officer(Principal Accounting Officer)
February 18, 2021
Andrew L. Castellaneta
/S/ MARY C. CHOKSI Director February 18, 2021
Mary C. Choksi
/S/ LEONARD S. COLEMAN, JR. Director February 18, 2021
Leonard S. Coleman, Jr.
/S/ SUSAN S. DENISON Director February 18, 2021
Susan S. Denison
/S/ RONNIE S. HAWKINS Director February 18, 2021
Ronnie S. Hawkins
/S/ DEBORAH J. KISSIRE Director February 18, 2021
Deborah J. Kissire
/S/ GRACIA C. MARTORE Director February 18, 2021
Gracia C. Martore
/S/ LINDA JOHNSON RICE Director February 18, 2021
Linda Johnson Rice
/S/ VALERIE M. WILLIAMS Director February 18, 2021
Valerie M. Williams
35
MANAGEMENT REPORT ON INTERNAL CONTROL OVER FINANCIAL REPORTING
Management is responsible for the preparation of the consolidated financial statements and related information of OmnicomGroup Inc., or Omnicom. Management uses its best judgment to ensure that the consolidated financial statements present fairly, inall material respects, Omnicom’s consolidated financial position and results of operations in conformity with generally acceptedaccounting principles in the United States.
The financial statements have been audited by an independent registered public accounting firm in accordance with thestandards of the Public Company Accounting Oversight Board. Their report expresses the independent accountant’s judgment as tothe fairness of management’s reported financial position, results of operations and cash flows. This judgment is based on theprocedures described in the fifth and sixth paragraphs of their report.
Omnicom management is responsible for establishing and maintaining adequate internal control over financial reporting, assuch term is defined in Securities Exchange Act Rule 13a-15(f ). Management, with the participation of our Chief ExecutiveOfficer, or CEO, Chief Financial Officer, or CFO, and our agencies, conducted an evaluation of the effectiveness of our internalcontrol over financial reporting based on the framework in Internal Control - Integrated Framework (2013) issued by the Committeeof Sponsoring Organizations of the Treadway Commission. Based on that evaluation, our CEO and CFO concluded that ourinternal control over financial reporting was effective as of December 31, 2020. There have not been any changes in our internalcontrol over financial reporting during our fourth fiscal quarter that have materially affected or are reasonably likely to affect ourinternal control over financial reporting.
KPMG LLP, an independent registered public accounting firm that audited our consolidated financial statements included inthis Annual Report on Form 10-K, has issued an attestation report on Omnicom’s internal control over financial reporting as ofDecember 31, 2020, dated February 18, 2021.
The Board of Directors of Omnicom has an Audit Committee comprised of four independent directors. The AuditCommittee meets periodically with financial management, Internal Audit and the independent auditors to review accounting,control, audit and financial reporting matters.
F-1
REPORT OF INDEPENDENT REGISTERED PUBLIC ACCOUNTING FIRM
To the Shareholders and Board of DirectorsOmnicom Group Inc.:
Opinions on the Consolidated Financial Statements and Internal Control Over Financial Reporting
We have audited the accompanying consolidated balance sheets of Omnicom Group Inc. and subsidiaries (the Company) asof December 31, 2020 and 2019, the related consolidated statements of income, comprehensive income, equity, and cash flows foreach of the years in the three-year period ended December 31, 2020, and the related notes and financial statement schedule II(collectively, the consolidated financial statements). We also have audited the Company’s internal control over financial reporting asof December 31, 2020, based on criteria established in Internal Control - Integrated Framework (2013) issued by the Committee ofSponsoring Organizations of the Treadway Commission.
In our opinion, the consolidated financial statements referred to above present fairly, in all material respects, the financialposition of the Company as of December 31, 2020 and 2019, and the results of its operations and its cash flows for each of theyears in the three-year period ended December 31, 2020, in conformity with U.S. generally accepted accounting principles. Also inour opinion, the Company maintained, in all material respects, effective internal control over financial reporting as ofDecember 31, 2020, based on criteria established in Internal Control - Integrated Framework (2013) issued by the Committee ofSponsoring Organizations of the Treadway Commission.
Change in Accounting Principle
As discussed in Note 16 to the consolidated financial statements, the Company has changed its method of accounting forleases effective January 1, 2019 due to the adoption of Accounting Standards Codification Topic 842, Leases.
Basis for Opinions
The Company’s management is responsible for these consolidated financial statements, for maintaining effective internalcontrol over financial reporting, and for its assessment of the effectiveness of internal control over financial reporting, included inthe accompanying Management Report on Internal Control Over Financial Reporting. Our responsibility is to express an opinionon the Company’s consolidated financial statements and an opinion on the Company’s internal control over financial reportingbased on our audits. We are a public accounting firm registered with the Public Company Accounting Oversight Board (UnitedStates) (PCAOB) and are required to be independent with respect to the Company in accordance with the U.S. federal securitieslaws and the applicable rules and regulations of the Securities and Exchange Commission and the PCAOB.
We conducted our audits in accordance with the standards of the PCAOB. Those standards require that we plan and performthe audits to obtain reasonable assurance about whether the consolidated financial statements are free of material misstatement,whether due to error or fraud, and whether effective internal control over financial reporting was maintained in all materialrespects.
Our audits of the consolidated financial statements included performing procedures to assess the risks of materialmisstatement of the consolidated financial statements, whether due to error or fraud, and performing procedures that respond tothose risks. Such procedures included examining, on a test basis, evidence regarding the amounts and disclosures in theconsolidated financial statements. Our audits also included evaluating the accounting principles used and significant estimatesmade by management, as well as evaluating the overall presentation of the consolidated financial statements. Our audit of internalcontrol over financial reporting included obtaining an understanding of internal control over financial reporting, assessing the riskthat a material weakness exists, and testing and evaluating the design and operating effectiveness of internal control based on theassessed risk. Our audits also included performing such other procedures as we considered necessary in the circumstances. Webelieve that our audits provide a reasonable basis for our opinions.
Definition and Limitations of Internal Control Over Financial Reporting
A company’s internal control over financial reporting is a process designed to provide reasonable assurance regarding thereliability of financial reporting and the preparation of financial statements for external purposes in accordance with generallyaccepted accounting principles. A company’s internal control over financial reporting includes those policies and procedures that(1) pertain to the maintenance of records that, in reasonable detail, accurately and fairly reflect the transactions and dispositions ofthe assets of the company; (2) provide reasonable assurance that transactions are recorded as necessary to permit preparation offinancial statements in accordance with generally accepted accounting principles, and that receipts and expenditures of thecompany are being made only in accordance with authorizations of management and directors of the company; and (3) providereasonable assurance regarding prevention or timely detection of unauthorized acquisition, use, or disposition of the company’sassets that could have a material effect on the financial statements.
F-2
Because of its inherent limitations, internal control over financial reporting may not prevent or detect misstatements. Also,projections of any evaluation of effectiveness to future periods are subject to the risk that controls may become inadequate becauseof changes in conditions, or that the degree of compliance with the policies or procedures may deteriorate.
Critical Audit Matter
The critical audit matter communicated below is a matter arising from the current period audit of the consolidated financialstatements that was communicated or required to be communicated to the audit committee and that: (1) relates to accounts ordisclosures that are material to the consolidated financial statements and (2) involved our especially challenging, subjective, orcomplex judgments. The communication of a critical audit matter does not alter in any way our opinion on the consolidatedfinancial statements, taken as a whole, and we are not, by communicating the critical audit matter below, providing a separateopinion on the critical audit matter or on the accounts or disclosures to which it relates.
Evaluation of the sufficiency of audit evidence over revenue recognition
As discussed in Note 3 to the consolidated financial statements, the Company provides an extensive range of advertising,marketing and corporate communication services through its branded networks and agencies, which operate in all majormarkets throughout the Americas, EMEA and Asia Pacific regions. Consolidated revenues across all disciplines and globaleconomic markets was $13,171.1 million for the year-ended December 31, 2020.
We identified the evaluation of the sufficiency of audit evidence over revenue recognition as a critical audit matter. Revenue isrecognized from contracts with customers that are based on statements of work which are typically separately negotiated withthe client at a local agency level and local agencies execute tens of thousands of contracts per year. Evaluating the sufficiencyof audit evidence obtained required a high degree of auditor judgment because of the volume of contracts entered into acrossthe branded networks and agencies for which revenue was recorded. This included selecting the locations where testing wouldbe performed and the supervision and review of procedures performed at those locations.
The following are the primary procedures we performed to address this critical audit matter. We applied auditor judgment todetermine the scope of agencies at which we performed audit procedures and the nature and extent of the proceduresperformed at each location. At each agency where procedures over revenue were performed, we (1) evaluated the design andtested the operating effectiveness of certain internal controls over revenue recognition, including controls to check that localagencies recorded revenue in accordance with the Company’s accounting policies and billings were recorded and presented inaccordance with client agreements, (2) examined a selection of contracts and assessed that the Company’s accounting policieswere applied consistently and accurately, and (3) assessed the recording of revenue by selecting certain transactions andcomparing the amounts recognized for consistency with the underlying documentation including contracts with customers.We evaluated the sufficiency of audit evidence obtained by assessing the results of procedures performed over revenuerecognition.
/s/ KPMG LLP
We have served as the Company’s auditor since 2002.
New York, New YorkFebruary 18, 2021
F-3
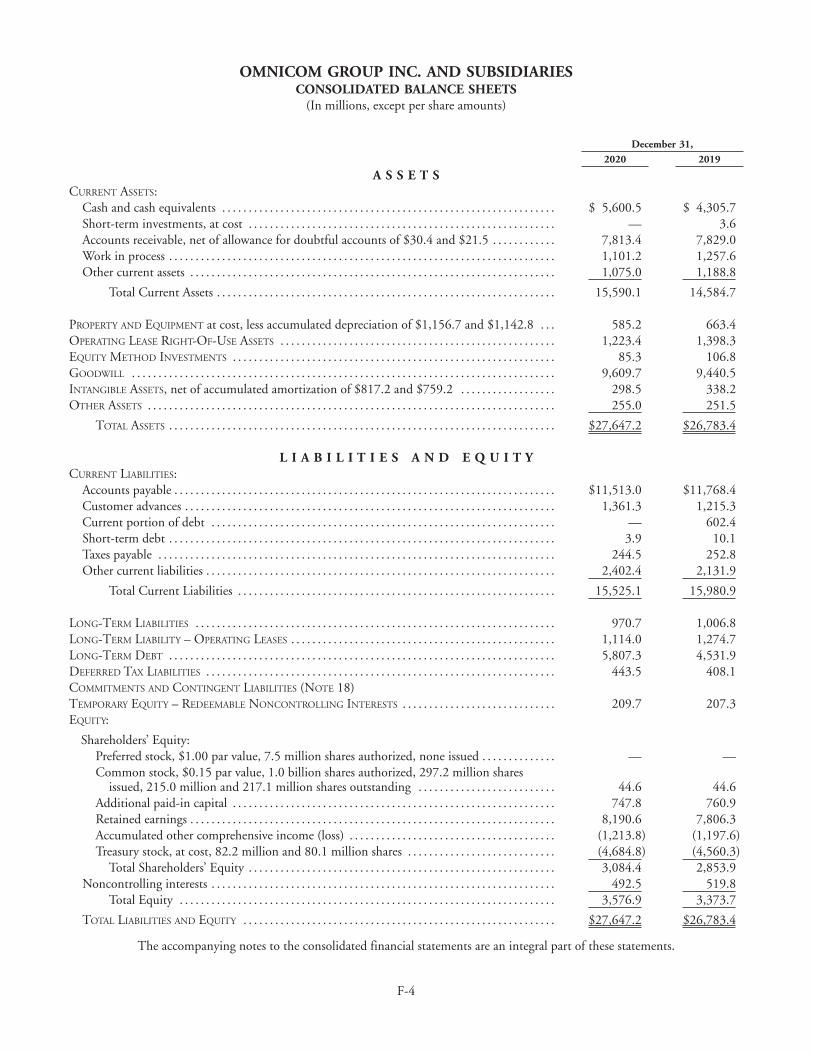
OMNICOM GROUP INC. AND SUBSIDIARIESCONSOLIDATED BALANCE SHEETS
(In millions, except per share amounts)
December 31,
2020 2019
A S S E T SCURRENT ASSETS:
Cash and cash equivalents . . . . . . . . . . . . . . . . . . . . . . . . . . . . . . . . . . . . . . . . . . . . . . . . . . . . . . . . . . . . . . . $ 5,600.5 $ 4,305.7Short-term investments, at cost . . . . . . . . . . . . . . . . . . . . . . . . . . . . . . . . . . . . . . . . . . . . . . . . . . . . . . . . . . — 3.6Accounts receivable, net of allowance for doubtful accounts of $30.4 and $21.5 . . . . . . . . . . . . 7,813.4 7,829.0Work in process . . . . . . . . . . . . . . . . . . . . . . . . . . . . . . . . . . . . . . . . . . . . . . . . . . . . . . . . . . . . . . . . . . . . . . . . . 1,101.2 1,257.6Other current assets . . . . . . . . . . . . . . . . . . . . . . . . . . . . . . . . . . . . . . . . . . . . . . . . . . . . . . . . . . . . . . . . . . . . . 1,075.0 1,188.8
Total Current Assets . . . . . . . . . . . . . . . . . . . . . . . . . . . . . . . . . . . . . . . . . . . . . . . . . . . . . . . . . . . . . . . . 15,590.1 14,584.7 PROPERTY AND EQUIPMENT at cost, less accumulated depreciation of $1,156.7 and $1,142.8 . . . 585.2 663.4OPERATING LEASE RIGHT-OF-USE ASSETS . . . . . . . . . . . . . . . . . . . . . . . . . . . . . . . . . . . . . . . . . . . . . . . . . . . . 1,223.4 1,398.3EQUITY METHOD INVESTMENTS . . . . . . . . . . . . . . . . . . . . . . . . . . . . . . . . . . . . . . . . . . . . . . . . . . . . . . . . . . . . . 85.3 106.8GOODWILL . . . . . . . . . . . . . . . . . . . . . . . . . . . . . . . . . . . . . . . . . . . . . . . . . . . . . . . . . . . . . . . . . . . . . . . . . . . . . . . . 9,609.7 9,440.5INTANGIBLE ASSETS, net of accumulated amortization of $817.2 and $759.2 . . . . . . . . . . . . . . . . . . 298.5 338.2OTHER ASSETS . . . . . . . . . . . . . . . . . . . . . . . . . . . . . . . . . . . . . . . . . . . . . . . . . . . . . . . . . . . . . . . . . . . . . . . . . . . . . 255.0 251.5
TOTAL ASSETS . . . . . . . . . . . . . . . . . . . . . . . . . . . . . . . . . . . . . . . . . . . . . . . . . . . . . . . . . . . . . . . . . . . . . . . . . $27,647.2 $26,783.4
L I A B I L I T I E S A N D E Q U I T YCURRENT LIABILITIES:
Accounts payable . . . . . . . . . . . . . . . . . . . . . . . . . . . . . . . . . . . . . . . . . . . . . . . . . . . . . . . . . . . . . . . . . . . . . . . . $11,513.0 $11,768.4Customer advances . . . . . . . . . . . . . . . . . . . . . . . . . . . . . . . . . . . . . . . . . . . . . . . . . . . . . . . . . . . . . . . . . . . . . . 1,361.3 1,215.3Current portion of debt . . . . . . . . . . . . . . . . . . . . . . . . . . . . . . . . . . . . . . . . . . . . . . . . . . . . . . . . . . . . . . . . . — 602.4Short-term debt . . . . . . . . . . . . . . . . . . . . . . . . . . . . . . . . . . . . . . . . . . . . . . . . . . . . . . . . . . . . . . . . . . . . . . . . . 3.9 10.1Taxes payable . . . . . . . . . . . . . . . . . . . . . . . . . . . . . . . . . . . . . . . . . . . . . . . . . . . . . . . . . . . . . . . . . . . . . . . . . . . 244.5 252.8Other current liabilities . . . . . . . . . . . . . . . . . . . . . . . . . . . . . . . . . . . . . . . . . . . . . . . . . . . . . . . . . . . . . . . . . . 2,402.4 2,131.9
Total Current Liabilities . . . . . . . . . . . . . . . . . . . . . . . . . . . . . . . . . . . . . . . . . . . . . . . . . . . . . . . . . . . . 15,525.1 15,980.9 LONG-TERM LIABILITIES . . . . . . . . . . . . . . . . . . . . . . . . . . . . . . . . . . . . . . . . . . . . . . . . . . . . . . . . . . . . . . . . . . . . 970.7 1,006.8LONG-TERM LIABILITY – OPERATING LEASES . . . . . . . . . . . . . . . . . . . . . . . . . . . . . . . . . . . . . . . . . . . . . . . . . . 1,114.0 1,274.7LONG-TERM DEBT . . . . . . . . . . . . . . . . . . . . . . . . . . . . . . . . . . . . . . . . . . . . . . . . . . . . . . . . . . . . . . . . . . . . . . . . . 5,807.3 4,531.9DEFERRED TAX LIABILITIES . . . . . . . . . . . . . . . . . . . . . . . . . . . . . . . . . . . . . . . . . . . . . . . . . . . . . . . . . . . . . . . . . . 443.5 408.1COMMITMENTS AND CONTINGENT LIABILITIES (NOTE 18)TEMPORARY EQUITY – REDEEMABLE NONCONTROLLING INTERESTS . . . . . . . . . . . . . . . . . . . . . . . . . . . . . 209.7 207.3EQUITY:
Shareholders’ Equity:Preferred stock, $1.00 par value, 7.5 million shares authorized, none issued . . . . . . . . . . . . . . — —Common stock, $0.15 par value, 1.0 billion shares authorized, 297.2 million shares
issued, 215.0 million and 217.1 million shares outstanding . . . . . . . . . . . . . . . . . . . . . . . . . . 44.6 44.6Additional paid-in capital . . . . . . . . . . . . . . . . . . . . . . . . . . . . . . . . . . . . . . . . . . . . . . . . . . . . . . . . . . . . . 747.8 760.9Retained earnings . . . . . . . . . . . . . . . . . . . . . . . . . . . . . . . . . . . . . . . . . . . . . . . . . . . . . . . . . . . . . . . . . . . . . 8,190.6 7,806.3Accumulated other comprehensive income (loss) . . . . . . . . . . . . . . . . . . . . . . . . . . . . . . . . . . . . . . . (1,213.8) (1,197.6)Treasury stock, at cost, 82.2 million and 80.1 million shares . . . . . . . . . . . . . . . . . . . . . . . . . . . . (4,684.8) (4,560.3)
Total Shareholders’ Equity . . . . . . . . . . . . . . . . . . . . . . . . . . . . . . . . . . . . . . . . . . . . . . . . . . . . . . . . . . 3,084.4 2,853.9Noncontrolling interests . . . . . . . . . . . . . . . . . . . . . . . . . . . . . . . . . . . . . . . . . . . . . . . . . . . . . . . . . . . . . . . . . 492.5 519.8
Total Equity . . . . . . . . . . . . . . . . . . . . . . . . . . . . . . . . . . . . . . . . . . . . . . . . . . . . . . . . . . . . . . . . . . . . . . . 3,576.9 3,373.7
TOTAL LIABILITIES AND EQUITY . . . . . . . . . . . . . . . . . . . . . . . . . . . . . . . . . . . . . . . . . . . . . . . . . . . . . . . . . . . $27,647.2 $26,783.4
The accompanying notes to the consolidated financial statements are an integral part of these statements.
F-4
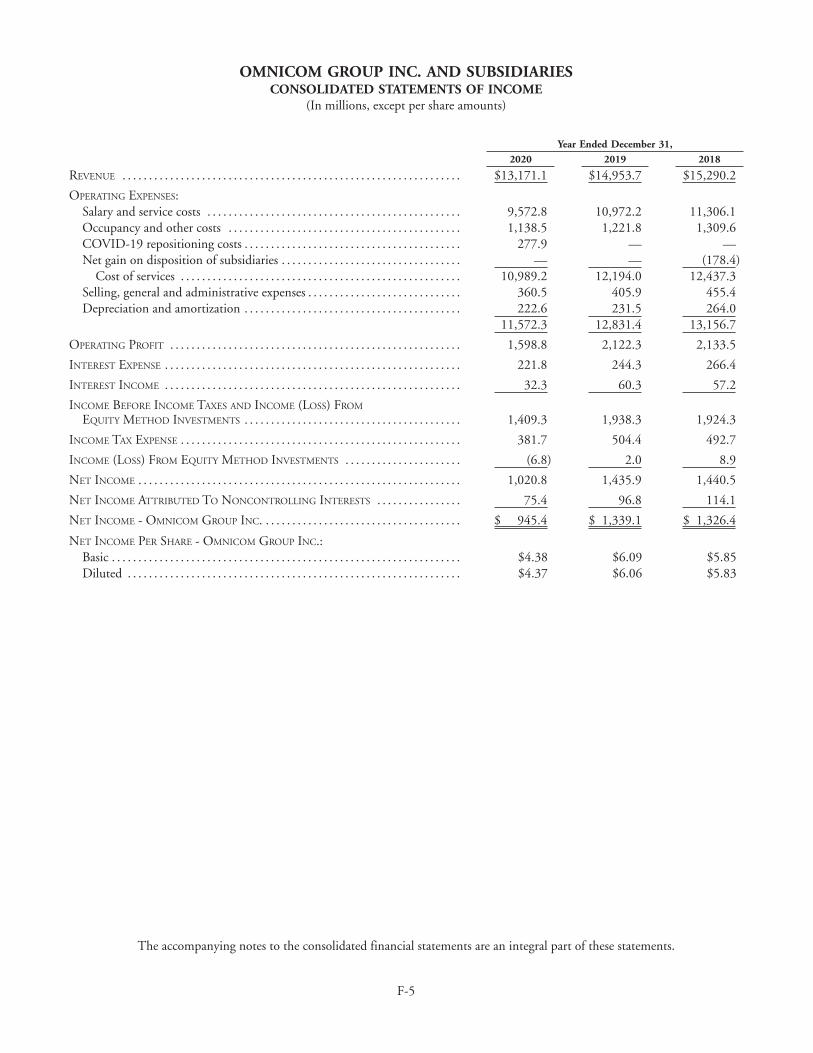
OMNICOM GROUP INC. AND SUBSIDIARIESCONSOLIDATED STATEMENTS OF INCOME
(In millions, except per share amounts)
Year Ended December 31,
2020 2019 2018
REVENUE . . . . . . . . . . . . . . . . . . . . . . . . . . . . . . . . . . . . . . . . . . . . . . . . . . . . . . . . . . . . . . . . $13,171.1 $14,953.7 $15,290.2
OPERATING EXPENSES:Salary and service costs . . . . . . . . . . . . . . . . . . . . . . . . . . . . . . . . . . . . . . . . . . . . . . . . 9,572.8 10,972.2 11,306.1Occupancy and other costs . . . . . . . . . . . . . . . . . . . . . . . . . . . . . . . . . . . . . . . . . . . . 1,138.5 1,221.8 1,309.6COVID-19 repositioning costs . . . . . . . . . . . . . . . . . . . . . . . . . . . . . . . . . . . . . . . . . 277.9 — —Net gain on disposition of subsidiaries . . . . . . . . . . . . . . . . . . . . . . . . . . . . . . . . . . — — (178.4)
Cost of services . . . . . . . . . . . . . . . . . . . . . . . . . . . . . . . . . . . . . . . . . . . . . . . . . . . . . 10,989.2 12,194.0 12,437.3Selling, general and administrative expenses . . . . . . . . . . . . . . . . . . . . . . . . . . . . . 360.5 405.9 455.4Depreciation and amortization . . . . . . . . . . . . . . . . . . . . . . . . . . . . . . . . . . . . . . . . . 222.6 231.5 264.0
11,572.3 12,831.4 13,156.7
OPERATING PROFIT . . . . . . . . . . . . . . . . . . . . . . . . . . . . . . . . . . . . . . . . . . . . . . . . . . . . . . . 1,598.8 2,122.3 2,133.5
INTEREST EXPENSE . . . . . . . . . . . . . . . . . . . . . . . . . . . . . . . . . . . . . . . . . . . . . . . . . . . . . . . . 221.8 244.3 266.4
INTEREST INCOME . . . . . . . . . . . . . . . . . . . . . . . . . . . . . . . . . . . . . . . . . . . . . . . . . . . . . . . . 32.3 60.3 57.2
INCOME BEFORE INCOME TAXES AND INCOME (LOSS) FROM
EQUITY METHOD INVESTMENTS . . . . . . . . . . . . . . . . . . . . . . . . . . . . . . . . . . . . . . . . . 1,409.3 1,938.3 1,924.3
INCOME TAX EXPENSE . . . . . . . . . . . . . . . . . . . . . . . . . . . . . . . . . . . . . . . . . . . . . . . . . . . . . 381.7 504.4 492.7
INCOME (LOSS) FROM EQUITY METHOD INVESTMENTS . . . . . . . . . . . . . . . . . . . . . . (6.8) 2.0 8.9
NET INCOME . . . . . . . . . . . . . . . . . . . . . . . . . . . . . . . . . . . . . . . . . . . . . . . . . . . . . . . . . . . . . 1,020.8 1,435.9 1,440.5
NET INCOME ATTRIBUTED TO NONCONTROLLING INTERESTS . . . . . . . . . . . . . . . . 75.4 96.8 114.1
NET INCOME - OMNICOM GROUP INC. . . . . . . . . . . . . . . . . . . . . . . . . . . . . . . . . . . . . . $ 945.4 $ 1,339.1 $ 1,326.4
NET INCOME PER SHARE - OMNICOM GROUP INC.:Basic . . . . . . . . . . . . . . . . . . . . . . . . . . . . . . . . . . . . . . . . . . . . . . . . . . . . . . . . . . . . . . . . . . $4.38 $6.09 $5.85Diluted . . . . . . . . . . . . . . . . . . . . . . . . . . . . . . . . . . . . . . . . . . . . . . . . . . . . . . . . . . . . . . . $4.37 $6.06 $5.83
The accompanying notes to the consolidated financial statements are an integral part of these statements.
F-5
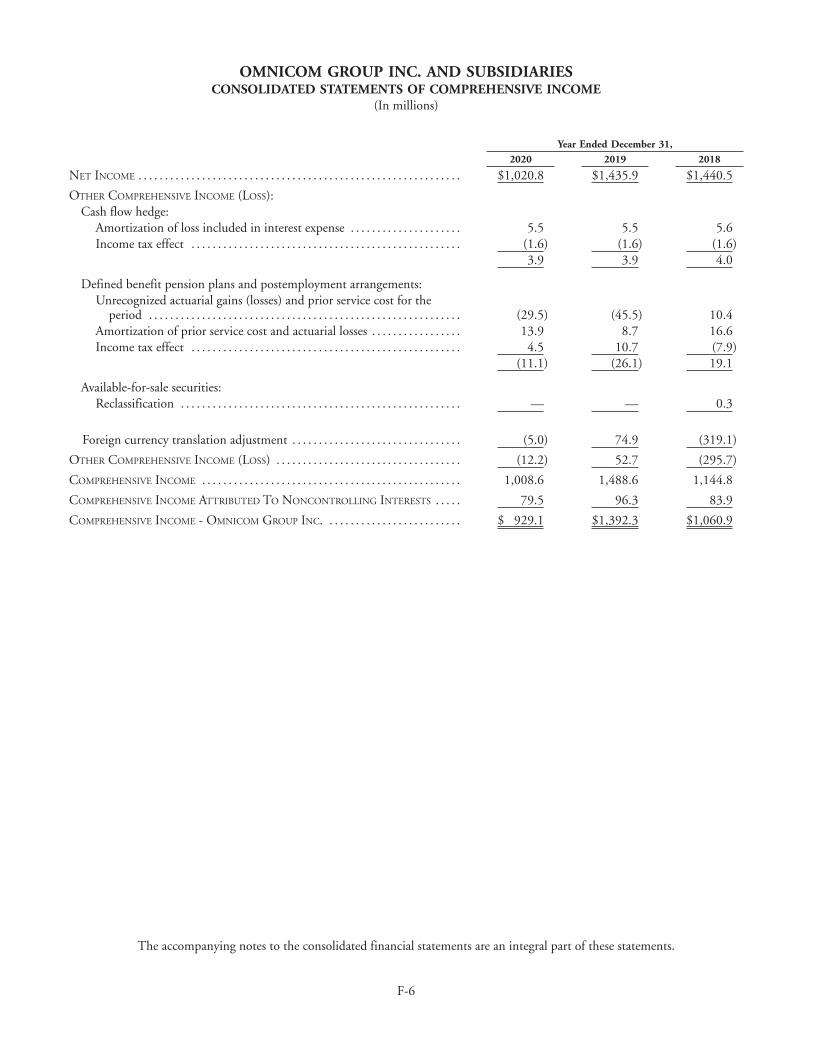
OMNICOM GROUP INC. AND SUBSIDIARIESCONSOLIDATED STATEMENTS OF COMPREHENSIVE INCOME
(In millions)
Year Ended December 31,
2020 2019 2018
NET INCOME . . . . . . . . . . . . . . . . . . . . . . . . . . . . . . . . . . . . . . . . . . . . . . . . . . . . . . . . . . . . . $1,020.8 $1,435.9 $1,440.5
OTHER COMPREHENSIVE INCOME (LOSS):Cash flow hedge:
Amortization of loss included in interest expense . . . . . . . . . . . . . . . . . . . . . 5.5 5.5 5.6Income tax effect . . . . . . . . . . . . . . . . . . . . . . . . . . . . . . . . . . . . . . . . . . . . . . . . . . . (1.6) (1.6) (1.6)
3.9 3.9 4.0
Defined benefit pension plans and postemployment arrangements: Unrecognized actuarial gains (losses) and prior service cost for the
period . . . . . . . . . . . . . . . . . . . . . . . . . . . . . . . . . . . . . . . . . . . . . . . . . . . . . . . . . . . (29.5) (45.5) 10.4Amortization of prior service cost and actuarial losses . . . . . . . . . . . . . . . . . 13.9 8.7 16.6Income tax effect . . . . . . . . . . . . . . . . . . . . . . . . . . . . . . . . . . . . . . . . . . . . . . . . . . . 4.5 10.7 (7.9)
(11.1) (26.1) 19.1
Available-for-sale securities: Reclassification . . . . . . . . . . . . . . . . . . . . . . . . . . . . . . . . . . . . . . . . . . . . . . . . . . . . . — — 0.3
Foreign currency translation adjustment . . . . . . . . . . . . . . . . . . . . . . . . . . . . . . . . (5.0) 74.9 (319.1)
OTHER COMPREHENSIVE INCOME (LOSS) . . . . . . . . . . . . . . . . . . . . . . . . . . . . . . . . . . . (12.2) 52.7 (295.7)
COMPREHENSIVE INCOME . . . . . . . . . . . . . . . . . . . . . . . . . . . . . . . . . . . . . . . . . . . . . . . . . 1,008.6 1,488.6 1,144.8
COMPREHENSIVE INCOME ATTRIBUTED TO NONCONTROLLING INTERESTS . . . . . 79.5 96.3 83.9
COMPREHENSIVE INCOME - OMNICOM GROUP INC. . . . . . . . . . . . . . . . . . . . . . . . . . $ 929.1 $1,392.3 $1,060.9
The accompanying notes to the consolidated financial statements are an integral part of these statements.
F-6
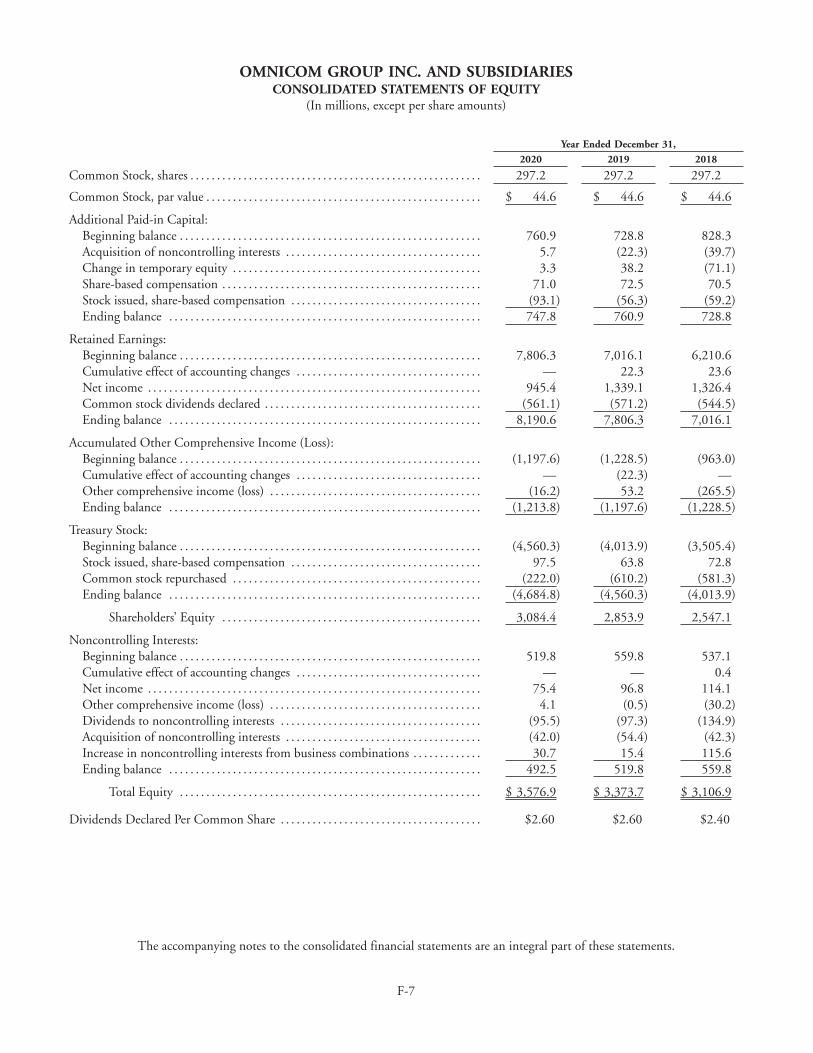
OMNICOM GROUP INC. AND SUBSIDIARIESCONSOLIDATED STATEMENTS OF EQUITY
(In millions, except per share amounts)
Year Ended December 31,
2020 2019 2018
Common Stock, shares . . . . . . . . . . . . . . . . . . . . . . . . . . . . . . . . . . . . . . . . . . . . . . . . . . . . . . . 297.2 297.2 297.2
Common Stock, par value . . . . . . . . . . . . . . . . . . . . . . . . . . . . . . . . . . . . . . . . . . . . . . . . . . . . $ 44.6 $ 44.6 $ 44.6
Additional Paid-in Capital: Beginning balance . . . . . . . . . . . . . . . . . . . . . . . . . . . . . . . . . . . . . . . . . . . . . . . . . . . . . . . . . 760.9 728.8 828.3Acquisition of noncontrolling interests . . . . . . . . . . . . . . . . . . . . . . . . . . . . . . . . . . . . . 5.7 (22.3) (39.7)Change in temporary equity . . . . . . . . . . . . . . . . . . . . . . . . . . . . . . . . . . . . . . . . . . . . . . . 3.3 38.2 (71.1)Share-based compensation . . . . . . . . . . . . . . . . . . . . . . . . . . . . . . . . . . . . . . . . . . . . . . . . . 71.0 72.5 70.5Stock issued, share-based compensation . . . . . . . . . . . . . . . . . . . . . . . . . . . . . . . . . . . . (93.1) (56.3) (59.2)Ending balance . . . . . . . . . . . . . . . . . . . . . . . . . . . . . . . . . . . . . . . . . . . . . . . . . . . . . . . . . . . 747.8 760.9 728.8
Retained Earnings: Beginning balance . . . . . . . . . . . . . . . . . . . . . . . . . . . . . . . . . . . . . . . . . . . . . . . . . . . . . . . . . 7,806.3 7,016.1 6,210.6Cumulative effect of accounting changes . . . . . . . . . . . . . . . . . . . . . . . . . . . . . . . . . . . — 22.3 23.6Net income . . . . . . . . . . . . . . . . . . . . . . . . . . . . . . . . . . . . . . . . . . . . . . . . . . . . . . . . . . . . . . . 945.4 1,339.1 1,326.4Common stock dividends declared . . . . . . . . . . . . . . . . . . . . . . . . . . . . . . . . . . . . . . . . . (561.1) (571.2) (544.5)Ending balance . . . . . . . . . . . . . . . . . . . . . . . . . . . . . . . . . . . . . . . . . . . . . . . . . . . . . . . . . . . 8,190.6 7,806.3 7,016.1
Accumulated Other Comprehensive Income (Loss): Beginning balance . . . . . . . . . . . . . . . . . . . . . . . . . . . . . . . . . . . . . . . . . . . . . . . . . . . . . . . . . (1,197.6) (1,228.5) (963.0)Cumulative effect of accounting changes . . . . . . . . . . . . . . . . . . . . . . . . . . . . . . . . . . . — (22.3) —Other comprehensive income (loss) . . . . . . . . . . . . . . . . . . . . . . . . . . . . . . . . . . . . . . . . (16.2) 53.2 (265.5)Ending balance . . . . . . . . . . . . . . . . . . . . . . . . . . . . . . . . . . . . . . . . . . . . . . . . . . . . . . . . . . . (1,213.8) (1,197.6) (1,228.5)
Treasury Stock: Beginning balance . . . . . . . . . . . . . . . . . . . . . . . . . . . . . . . . . . . . . . . . . . . . . . . . . . . . . . . . . (4,560.3) (4,013.9) (3,505.4)Stock issued, share-based compensation . . . . . . . . . . . . . . . . . . . . . . . . . . . . . . . . . . . . 97.5 63.8 72.8Common stock repurchased . . . . . . . . . . . . . . . . . . . . . . . . . . . . . . . . . . . . . . . . . . . . . . . (222.0) (610.2) (581.3)Ending balance . . . . . . . . . . . . . . . . . . . . . . . . . . . . . . . . . . . . . . . . . . . . . . . . . . . . . . . . . . . (4,684.8) (4,560.3) (4,013.9)
Shareholders’ Equity . . . . . . . . . . . . . . . . . . . . . . . . . . . . . . . . . . . . . . . . . . . . . . . . . 3,084.4 2,853.9 2,547.1
Noncontrolling Interests: Beginning balance . . . . . . . . . . . . . . . . . . . . . . . . . . . . . . . . . . . . . . . . . . . . . . . . . . . . . . . . . 519.8 559.8 537.1Cumulative effect of accounting changes . . . . . . . . . . . . . . . . . . . . . . . . . . . . . . . . . . . — — 0.4Net income . . . . . . . . . . . . . . . . . . . . . . . . . . . . . . . . . . . . . . . . . . . . . . . . . . . . . . . . . . . . . . . 75.4 96.8 114.1Other comprehensive income (loss) . . . . . . . . . . . . . . . . . . . . . . . . . . . . . . . . . . . . . . . . 4.1 (0.5) (30.2)Dividends to noncontrolling interests . . . . . . . . . . . . . . . . . . . . . . . . . . . . . . . . . . . . . . (95.5) (97.3) (134.9)Acquisition of noncontrolling interests . . . . . . . . . . . . . . . . . . . . . . . . . . . . . . . . . . . . . (42.0) (54.4) (42.3)Increase in noncontrolling interests from business combinations . . . . . . . . . . . . . 30.7 15.4 115.6Ending balance . . . . . . . . . . . . . . . . . . . . . . . . . . . . . . . . . . . . . . . . . . . . . . . . . . . . . . . . . . . 492.5 519.8 559.8
Total Equity . . . . . . . . . . . . . . . . . . . . . . . . . . . . . . . . . . . . . . . . . . . . . . . . . . . . . . . . . $ 3,576.9 $ 3,373.7 $ 3,106.9
Dividends Declared Per Common Share . . . . . . . . . . . . . . . . . . . . . . . . . . . . . . . . . . . . . . $2.60 $2.60 $2.40
The accompanying notes to the consolidated financial statements are an integral part of these statements.
F-7
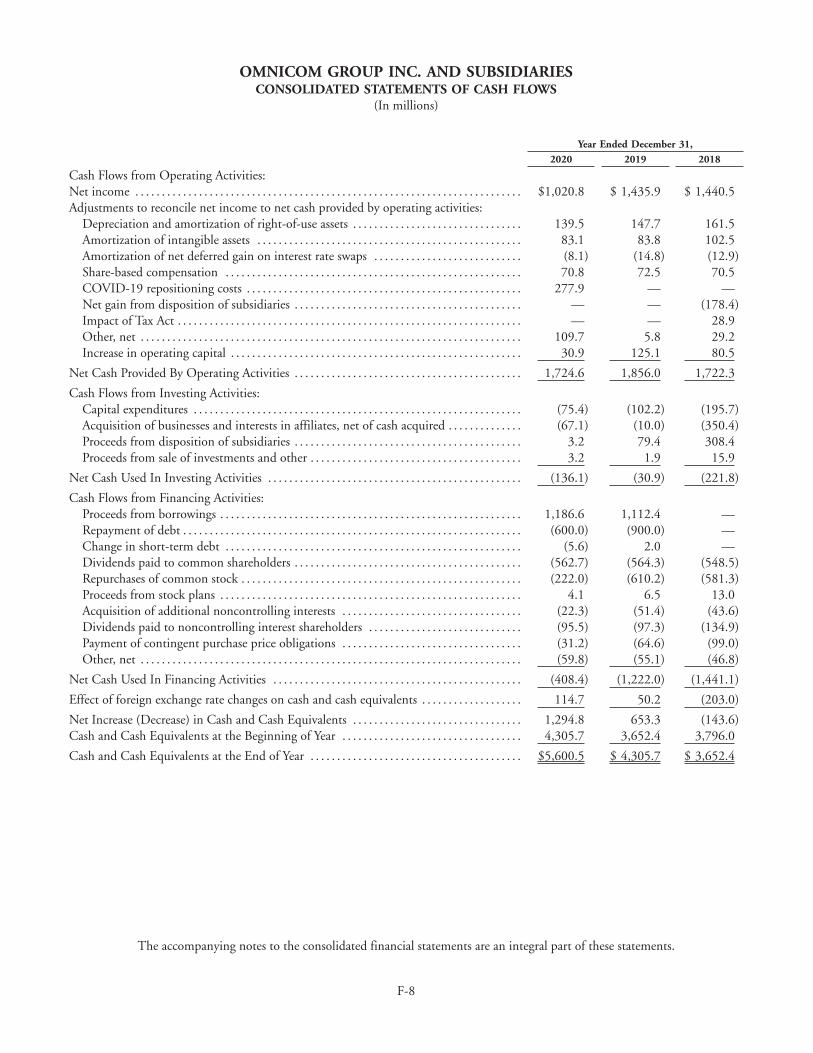
OMNICOM GROUP INC. AND SUBSIDIARIESCONSOLIDATED STATEMENTS OF CASH FLOWS
(In millions)
Year Ended December 31,
2020 2019 2018
Cash Flows from Operating Activities:Net income . . . . . . . . . . . . . . . . . . . . . . . . . . . . . . . . . . . . . . . . . . . . . . . . . . . . . . . . . . . . . . . . . . . . . . . . . $1,020.8 $ 1,435.9 $ 1,440.5Adjustments to reconcile net income to net cash provided by operating activities:
Depreciation and amortization of right-of-use assets . . . . . . . . . . . . . . . . . . . . . . . . . . . . . . . . 139.5 147.7 161.5Amortization of intangible assets . . . . . . . . . . . . . . . . . . . . . . . . . . . . . . . . . . . . . . . . . . . . . . . . . . 83.1 83.8 102.5Amortization of net deferred gain on interest rate swaps . . . . . . . . . . . . . . . . . . . . . . . . . . . . (8.1) (14.8) (12.9)Share-based compensation . . . . . . . . . . . . . . . . . . . . . . . . . . . . . . . . . . . . . . . . . . . . . . . . . . . . . . . . 70.8 72.5 70.5COVID-19 repositioning costs . . . . . . . . . . . . . . . . . . . . . . . . . . . . . . . . . . . . . . . . . . . . . . . . . . . . 277.9 — —Net gain from disposition of subsidiaries . . . . . . . . . . . . . . . . . . . . . . . . . . . . . . . . . . . . . . . . . . . — — (178.4)Impact of Tax Act . . . . . . . . . . . . . . . . . . . . . . . . . . . . . . . . . . . . . . . . . . . . . . . . . . . . . . . . . . . . . . . . . — — 28.9Other, net . . . . . . . . . . . . . . . . . . . . . . . . . . . . . . . . . . . . . . . . . . . . . . . . . . . . . . . . . . . . . . . . . . . . . . . . 109.7 5.8 29.2Increase in operating capital . . . . . . . . . . . . . . . . . . . . . . . . . . . . . . . . . . . . . . . . . . . . . . . . . . . . . . . 30.9 125.1 80.5
Net Cash Provided By Operating Activities . . . . . . . . . . . . . . . . . . . . . . . . . . . . . . . . . . . . . . . . . . . 1,724.6 1,856.0 1,722.3
Cash Flows from Investing Activities:Capital expenditures . . . . . . . . . . . . . . . . . . . . . . . . . . . . . . . . . . . . . . . . . . . . . . . . . . . . . . . . . . . . . . (75.4) (102.2) (195.7)Acquisition of businesses and interests in affiliates, net of cash acquired . . . . . . . . . . . . . . (67.1) (10.0) (350.4)Proceeds from disposition of subsidiaries . . . . . . . . . . . . . . . . . . . . . . . . . . . . . . . . . . . . . . . . . . . 3.2 79.4 308.4Proceeds from sale of investments and other . . . . . . . . . . . . . . . . . . . . . . . . . . . . . . . . . . . . . . . . 3.2 1.9 15.9
Net Cash Used In Investing Activities . . . . . . . . . . . . . . . . . . . . . . . . . . . . . . . . . . . . . . . . . . . . . . . . (136.1) (30.9) (221.8)
Cash Flows from Financing Activities:Proceeds from borrowings . . . . . . . . . . . . . . . . . . . . . . . . . . . . . . . . . . . . . . . . . . . . . . . . . . . . . . . . . 1,186.6 1,112.4 —Repayment of debt . . . . . . . . . . . . . . . . . . . . . . . . . . . . . . . . . . . . . . . . . . . . . . . . . . . . . . . . . . . . . . . . (600.0) (900.0) —Change in short-term debt . . . . . . . . . . . . . . . . . . . . . . . . . . . . . . . . . . . . . . . . . . . . . . . . . . . . . . . . (5.6) 2.0 —Dividends paid to common shareholders . . . . . . . . . . . . . . . . . . . . . . . . . . . . . . . . . . . . . . . . . . . (562.7) (564.3) (548.5)Repurchases of common stock . . . . . . . . . . . . . . . . . . . . . . . . . . . . . . . . . . . . . . . . . . . . . . . . . . . . . (222.0) (610.2) (581.3)Proceeds from stock plans . . . . . . . . . . . . . . . . . . . . . . . . . . . . . . . . . . . . . . . . . . . . . . . . . . . . . . . . . 4.1 6.5 13.0Acquisition of additional noncontrolling interests . . . . . . . . . . . . . . . . . . . . . . . . . . . . . . . . . . (22.3) (51.4) (43.6)Dividends paid to noncontrolling interest shareholders . . . . . . . . . . . . . . . . . . . . . . . . . . . . . (95.5) (97.3) (134.9)Payment of contingent purchase price obligations . . . . . . . . . . . . . . . . . . . . . . . . . . . . . . . . . . (31.2) (64.6) (99.0)Other, net . . . . . . . . . . . . . . . . . . . . . . . . . . . . . . . . . . . . . . . . . . . . . . . . . . . . . . . . . . . . . . . . . . . . . . . . (59.8) (55.1) (46.8)
Net Cash Used In Financing Activities . . . . . . . . . . . . . . . . . . . . . . . . . . . . . . . . . . . . . . . . . . . . . . . (408.4) (1,222.0) (1,441.1)
Effect of foreign exchange rate changes on cash and cash equivalents . . . . . . . . . . . . . . . . . . . 114.7 50.2 (203.0)
Net Increase (Decrease) in Cash and Cash Equivalents . . . . . . . . . . . . . . . . . . . . . . . . . . . . . . . . 1,294.8 653.3 (143.6)Cash and Cash Equivalents at the Beginning of Year . . . . . . . . . . . . . . . . . . . . . . . . . . . . . . . . . . 4,305.7 3,652.4 3,796.0
Cash and Cash Equivalents at the End of Year . . . . . . . . . . . . . . . . . . . . . . . . . . . . . . . . . . . . . . . . $5,600.5 $ 4,305.7 $ 3,652.4
The accompanying notes to the consolidated financial statements are an integral part of these statements.
F-8
OMNICOM GROUP INC. AND SUBSIDIARIESNOTES TO CONSOLIDATED FINANCIAL STATEMENTS
1. Presentation of Financial Statements
The terms “Omnicom,” “the Company,” “we,” “our” and “us” each refer to Omnicom Group Inc. and its subsidiaries, unless thecontext indicates otherwise. The accompanying consolidated financial statements were prepared in accordance with generally acceptedaccounting principles in the United States, or U.S. GAAP or GAAP. All intercompany balances and transactions have been eliminated.
We prepare our financial statements in conformity with U.S. GAAP and are required to make estimates and assumptions that affectthe amounts reported in the consolidated financial statements and accompanying notes. Actual results could differ from those estimatesand assumptions.
Risks and Uncertainties
Impact of the COVID-19 Pandemic on our Business
In 2020, the COVID-19 pandemic negatively impacted our business and results of operations. Efforts to mitigate the impactof the pandemic, including government actions to restrict travel, limit public gatherings, shelter-in-place orders and mandatoryclosures of businesses, resulted in many of our clients reducing or suspending their spending for our advertising, marketing andcorporate communication services. As a result, for the year ended December 31, 2020, revenue decreased $1,782.6 million, or11.9%, compared to 2019, primarily due to the impact of the COVID-19 pandemic. The impact of the COVID-19 pandemic onour revenue has been, and may continue to be, material, depending on several factors, including the potential for prolonged oradditional governmental actions to mitigate the effects of the pandemic in the near-term, and the intermediate and long-termimpact on marketers’ spending plans.
In response to the impact of the COVID-19 pandemic, in the second quarter of 2020, we took actions to align our coststructure and reduce our workforce and facility requirements and continued the review of businesses for disposal and assets forimpairment. As a result, we recorded a pre-tax charge of $277.9 million, which is comprised of incremental severance of$150.0 million, real estate operating lease right-of-use, or ROU, asset and other asset impairment charges of $55.8 million, otherexit costs of $47.0 million and dispositions and other charges of $25.1 million.
In addition, during 2020 we reduced salary and service costs by $162.6 million related to reimbursements and tax creditsunder government programs in several countries, including the Coronavirus Aid, Relief, and Economic Security Act, or the CARESAct, in the United States, the Kurzarbeit program in Germany, and other government reimbursement programs in the U.K.,France, Canada and other jurisdictions.
The COVID-19 pandemic negatively impacted most of our clients’ businesses. As a result, clients have cut costs, includingpostponing or reducing marketing communication expenditures. While certain industries such as healthcare and pharmaceuticals,technology and telecommunications, financial services and consumer products have been less affected, as long as the COVID-19pandemic remains a threat, global economic conditions continue to be volatile and such uncertainty cuts across all clients,industries and geographies. Overall, while we have a diversified portfolio of service offerings, clients and geographies, demand forour services can be expected to continue to be adversely affected as marketers reduce expenditures in the short term due to theuncertain impact of the pandemic on the global economy. We expect global economic performance and our performance to vary bygeography until the impact of the COVID-19 pandemic on the global economy moderates.
Although we have experienced a decrease in our cash flow from operating activities, we took numerous proactive steps tostrengthen our liquidity and financial position that are intended to mitigate the potential impact of the COVID-19 pandemic onour liquidity. In February 2020, we issued $600 million 2.45% Senior Notes due April 30, 2030, or the 2.45% Notes. InMarch 2020, the net proceeds from the issuance of the 2.45% Notes were used to redeem the remaining $600 million principalamount of our 4.45% Senior Notes due August 15, 2020, or the 2020 Notes. As a result, we have no notes maturing until May2022. In April 2020, we issued $600 million of 4.20% Senior Notes due June 1, 2030, or the 4.20% Notes, and we entered into anew $400 million 364 day revolving credit facility, or the 364 Day Credit Facility. The 364 Day Credit Facility is in addition to ourexisting $2.5 billion multi-currency revolving credit facility, or Credit Facility, which we extended to mature in February 2025. Inaddition, in March 2020, we suspended our share repurchase activity.
The impact on the global economy and resulting decline in the price of our common stock was determined to be a triggerevent in the first quarter of 2020 that required us to perform a review of our long-lived assets for impairment, primarily related togoodwill, amortizable intangible assets and equity method investments. We updated our review in June 2020, and the result of thereview of intangible assets and goodwill is discussed in Note 5. In the second quarter of 2020, we disposed of one of our equitymethod investments and recognized a non-cash after-tax charge of $3.9 million. In the fourth quarter of 2020 we recorded assetimpairment charges of $55.8 million associated with underperforming assets, which is included in salary and service costs.
F-9
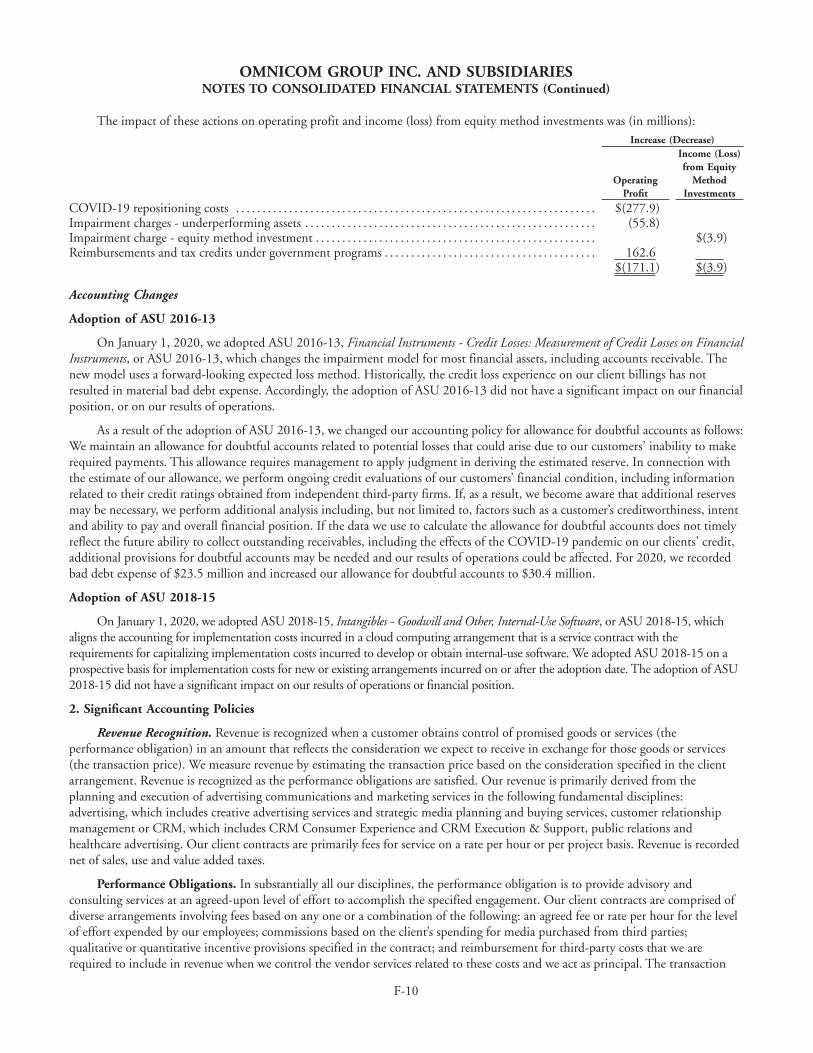
OMNICOM GROUP INC. AND SUBSIDIARIESNOTES TO CONSOLIDATED FINANCIAL STATEMENTS (Continued)
The impact of these actions on operating profit and income (loss) from equity method investments was (in millions):Increase (Decrease)
OperatingProfit
Income (Loss)from Equity
MethodInvestments
COVID-19 repositioning costs . . . . . . . . . . . . . . . . . . . . . . . . . . . . . . . . . . . . . . . . . . . . . . . . . . . . . . . . . . . . . . . . . . . . $(277.9)Impairment charges - underperforming assets . . . . . . . . . . . . . . . . . . . . . . . . . . . . . . . . . . . . . . . . . . . . . . . . . . . . . . . (55.8)Impairment charge - equity method investment . . . . . . . . . . . . . . . . . . . . . . . . . . . . . . . . . . . . . . . . . . . . . . . . . . . . . $(3.9)Reimbursements and tax credits under government programs . . . . . . . . . . . . . . . . . . . . . . . . . . . . . . . . . . . . . . . . 162.6
$(171.1) $(3.9)
Accounting Changes
Adoption of ASU 2016-13
On January 1, 2020, we adopted ASU 2016-13, Financial Instruments - Credit Losses: Measurement of Credit Losses on FinancialInstruments, or ASU 2016-13, which changes the impairment model for most financial assets, including accounts receivable. Thenew model uses a forward-looking expected loss method. Historically, the credit loss experience on our client billings has notresulted in material bad debt expense. Accordingly, the adoption of ASU 2016-13 did not have a significant impact on our financialposition, or on our results of operations.
As a result of the adoption of ASU 2016-13, we changed our accounting policy for allowance for doubtful accounts as follows:We maintain an allowance for doubtful accounts related to potential losses that could arise due to our customers’ inability to makerequired payments. This allowance requires management to apply judgment in deriving the estimated reserve. In connection withthe estimate of our allowance, we perform ongoing credit evaluations of our customers’ financial condition, including informationrelated to their credit ratings obtained from independent third-party firms. If, as a result, we become aware that additional reservesmay be necessary, we perform additional analysis including, but not limited to, factors such as a customer’s creditworthiness, intentand ability to pay and overall financial position. If the data we use to calculate the allowance for doubtful accounts does not timelyreflect the future ability to collect outstanding receivables, including the effects of the COVID-19 pandemic on our clients’ credit,additional provisions for doubtful accounts may be needed and our results of operations could be affected. For 2020, we recordedbad debt expense of $23.5 million and increased our allowance for doubtful accounts to $30.4 million.
Adoption of ASU 2018-15
On January 1, 2020, we adopted ASU 2018-15, Intangibles - Goodwill and Other, Internal-Use Software, or ASU 2018-15, whichaligns the accounting for implementation costs incurred in a cloud computing arrangement that is a service contract with therequirements for capitalizing implementation costs incurred to develop or obtain internal-use software. We adopted ASU 2018-15 on aprospective basis for implementation costs for new or existing arrangements incurred on or after the adoption date. The adoption of ASU2018-15 did not have a significant impact on our results of operations or financial position.
2. Significant Accounting Policies
Revenue Recognition. Revenue is recognized when a customer obtains control of promised goods or services (theperformance obligation) in an amount that reflects the consideration we expect to receive in exchange for those goods or services(the transaction price). We measure revenue by estimating the transaction price based on the consideration specified in the clientarrangement. Revenue is recognized as the performance obligations are satisfied. Our revenue is primarily derived from theplanning and execution of advertising communications and marketing services in the following fundamental disciplines:advertising, which includes creative advertising services and strategic media planning and buying services, customer relationshipmanagement or CRM, which includes CRM Consumer Experience and CRM Execution & Support, public relations andhealthcare advertising. Our client contracts are primarily fees for service on a rate per hour or per project basis. Revenue is recordednet of sales, use and value added taxes.
Performance Obligations. In substantially all our disciplines, the performance obligation is to provide advisory andconsulting services at an agreed-upon level of effort to accomplish the specified engagement. Our client contracts are comprised ofdiverse arrangements involving fees based on any one or a combination of the following: an agreed fee or rate per hour for the levelof effort expended by our employees; commissions based on the client’s spending for media purchased from third parties;qualitative or quantitative incentive provisions specified in the contract; and reimbursement for third-party costs that we arerequired to include in revenue when we control the vendor services related to these costs and we act as principal. The transaction
F-10
OMNICOM GROUP INC. AND SUBSIDIARIESNOTES TO CONSOLIDATED FINANCIAL STATEMENTS (Continued)
price of a contract is allocated to each distinct performance obligation based on its relative stand-alone selling price and isrecognized as revenue when, or as, the customer receives the benefit of the performance obligation. Clients typically receive andconsume the benefit of our services as they are performed. Substantially all our client contracts provide that we are compensated forservices performed to date and allow for cancellation by either party on short notice, typically 90 days, without penalty.
Generally, our short-term contracts, which normally take 30 to 90 days to complete, are performed by a single agency andconsist of a single performance obligation. As a result, we do not consider the underlying services as separate or distinctperformance obligations because our services are highly interrelated, occur in close proximity, and the integration of the variouscomponents of a marketing message is essential to overall service. In certain of our long-term client contracts, which have a term ofup to one year, the performance obligation is a stand-ready obligation, because we provide a constant level of similar services overthe term of the contract. In other long-term contracts, when our services are not a stand-ready obligation, we consider our servicesdistinct performance obligations and allocate the transaction price to each separate performance obligation based on its stand-aloneselling price, including contracts for strategic media planning and buying services, which are considered to be multiple performanceobligations, and we allocate the transaction price to each distinct service based on the staffing plan and the stand-alone selling price.In substantially all of our creative services contracts, we have distinct performance obligations for our services, including certaincreative services contracts where we act as an agent and arrange, at the client’s direction, for third parties to perform studioproduction efforts.
Revenue Recognition Methods. A substantial portion of our revenue is recognized over time, as the services are performed,because the client receives and consumes the benefit of our performance throughout the contract period, or we create an asset withno alternative use and are contractually entitled to payment for our performance to date in the event the client terminates thecontract for convenience. For these client contracts, other than when we have a stand-ready obligation to perform services, revenueis recognized over time using input measures that correspond to the level of staff effort expended to satisfy the performanceobligation on a rate per hour or equivalent basis. For client contracts when we have a stand-ready obligation to perform services onan ongoing basis over the life of the contract, typically for periods up to one year, where the scope of these arrangements is broadand there are no significant gaps in performing the services, we recognize revenue using a time-based measure resulting in astraight-line revenue recognition. From time to time, there may be changes in the client service requirements during the term of acontract and the changes could be significant. These changes are typically negotiated as new contracts covering the additionalrequirements and the associated costs, as well as additional fees for the incremental work to be performed.
To a lesser extent, for certain other contracts where our performance obligations are satisfied in phases, we recognize revenueover time using certain output measures based on the measurement of the value transferred to the customer, including milestonesachieved. Where the transaction price or a portion of the transaction price is derived from commissions based on a percentage ofpurchased media from third parties, the performance obligation is not satisfied until the media is run and we have an enforceablecontract providing a right to payment. Accordingly, revenue for commissions is recognized at a point in time, typically when themedia is run, including when it is not subject to cancellation by the client or media vendor.
Principal vs. Agent. In substantially all our businesses, we incur third-party costs on behalf of clients, including direct costsand incidental, or out-of-pocket costs. Third-party direct costs incurred in connection with the creation and delivery of advertisingor marketing communication services include, among others: purchased media, studio production services, specialized talent,including artists and other freelance labor, event marketing supplies, materials and services, promotional items, market research andthird-party data and other related expenditures. Out-of-pocket costs include, among others: transportation, hotel, meals andtelecommunication charges incurred by us in the course of providing our services. Billings related to out-of-pocket costs areincluded in revenue since we control the goods or services prior to delivery to the client.
However, the inclusion of billings related to third-party direct costs in revenue depends on whether we act as a principal or asan agent in the client arrangement. In most of our businesses, including advertising, which also includes studio production effortsand media planning and buying services, public relations, healthcare advertising and most of our CRM Consumer Experiencebusinesses, we act as an agent and arrange, at the client’s direction, for third parties to perform certain services. In these cases, we donot control the goods or services prior to the transfer to the client. As a result, revenue is recorded net of these costs, equal to theamount retained for our fee or commission.
In certain businesses we may act as principal when contracting for third-party services on behalf of our clients. In our eventsbusiness and most of our CRM Execution & Support businesses, including field marketing and certain specialty marketingbusinesses, we act as principal because we control the specified goods or services before they are transferred to the client and we areresponsible for providing the specified goods or services, or we are responsible for directing and integrating third-party vendors to
F-11
OMNICOM GROUP INC. AND SUBSIDIARIESNOTES TO CONSOLIDATED FINANCIAL STATEMENTS (Continued)
fulfill our performance obligation at the agreed upon contractual price. In such arrangements, we also take pricing risk under theterms of the client contract. In certain specialty media buying businesses, we act as principal when we control the buying processfor the purchase of the media and contract directly with the media vendor. In these arrangements, we assume the pricing risk underthe terms of the client contract. When we act as principal, we include billable amounts related to third-party costs in thetransaction price and record revenue over time at the gross amount billed, including out-of-pocket costs, consistent with themanner that we recognize revenue for the underlying services contract. However, in media buying contracts where we act asprincipal, we recognize revenue at a point in time, typically when the media is run, including when it is not subject to cancellationby the client or media vendor.
Variable Consideration. Some of our client arrangements include variable consideration provisions, which includeperformance incentives, tiered commission structures and vendor rebates in certain markets outside of the United States. Variableconsideration is estimated and included in total consideration at contract inception based on either the expected value method orthe most likely outcome method. These estimates are based on historical award experience, anticipated performance and otherfactors known at the time. Performance incentives are typically recognized in revenue over time. Variable consideration for ourmedia businesses in certain international markets includes rebate revenue and is recognized when it is probable that the media willbe run, including when it is not subject to cancellation by the client. In addition, when we receive rebates or credits from vendorsfor transactions entered into on behalf of clients, they are remitted to the clients in accordance with contractual requirements orretained by us based on the terms of the client contract or local law. Amounts passed on to clients are recorded as a liability andamounts retained by us are recorded as revenue when earned, typically when the media is run.
Operating Expenses. Operating expenses include cost of services, selling, general and administrative expenses, or SG&A, anddepreciation and amortization. We measure cost of services in two distinct categories: salary and service costs and occupancy andother costs. As a service business, salary and service costs make up the vast majority of our operating expenses and substantially allthese costs comprise the essential components directly linked to the delivery of our services. Salary and service costs includeemployee compensation and benefits, freelance labor and direct service costs, which include third-party supplier costs andclient-related travel costs. Occupancy and other costs consist of the indirect costs related to the delivery of our services, includingoffice rent and other occupancy costs, equipment rent, technology costs, general office expenses and other expenses. SG&Aexpenses primarily consist of third-party marketing costs, professional fees and compensation and benefits and occupancy and othercosts of our corporate and executive offices, which includes group-wide finance and accounting, treasury, legal and governance,human resource oversight and similar costs.
Cash and Cash Equivalents. Cash and cash equivalents include cash in banks and highly liquid interest-bearing timedeposits with original maturities of three months or less. Due to the short-term nature of these investments, carrying valueapproximates fair value. We have a policy governing counterparty credit risk for financial institutions that hold our cash and cashequivalents and we have deposit limits for each institution.
Short-Term Investments. Short-term investments include interest-bearing time deposits with maturities of less than twelvemonths. Short-term investments are carried at cost, which approximates fair value.
Work in Process. Work in process represents accrued costs incurred on behalf of customers, including media and productioncosts, and fees and other third-party costs that have not yet been billed. Media and production costs are billed during theproduction process in accordance with the terms of the client contract. Substantially all unbilled fees and costs will be billed withinthe next 30 days.
Property and Equipment. Property and equipment are carried at cost and are depreciated over the estimated useful lives ofthe assets using the straight-line method. The estimated useful lives range from seven to ten years for furniture and three to fiveyears for equipment. Leasehold improvements are amortized on a straight-line basis over the shorter of the lease term or theestimated useful life of the asset. Assets under finance leases are amortized on a straight-line basis over the lease term.
Equity Method Investments. Investments in companies where we exercise significant influence over the operating andfinancial policies of the investee and own less than 50% of the equity are accounted for using the equity method. Ourproportionate share of the net income or loss of equity method investments is included in results of operations and any dividendsreceived reduce the carrying value of the investment. The excess of the cost of our investment over our proportionate share of thefair value of the net assets of the investee at the acquisition date is recognized as goodwill and included in the carrying amount ofthe investment. Goodwill in the equity method investments is not amortized. Gains and losses from changes in our ownershipinterests are recorded in results of operations until control is achieved. In circumstances where a change in our ownership interestresults in obtaining control, the existing carrying value of the investment is remeasured to the acquisition date fair value and any
F-12
OMNICOM GROUP INC. AND SUBSIDIARIESNOTES TO CONSOLIDATED FINANCIAL STATEMENTS (Continued)
gain or loss is recognized in results of operations. We periodically review the carrying value of the equity method investments todetermine if there has been an other-than-temporary decline in carrying value. A variety of factors are considered when determiningif a decline in carrying value is other-than-temporary, including the financial condition and business prospects of the investee, aswell as our investment intent.
Marketable Equity Securities. Marketable equity securities are measured at fair value and changes in fair value are recognizedin results of operations.
Non-Marketable Equity Securities. Non-marketable equity securities do not have a readily determinable fair value and aremeasured at cost, less any impairment, and are adjusted for observable changes in fair value from transactions for identical orsimilar securities of the same issuer.
Goodwill and Intangible Assets. Goodwill represents the excess of the acquisition cost over the fair value of the net assetsacquired. Goodwill is not amortized but is periodically reviewed for impairment. Intangible assets comprise customer relationships,including the related customer contracts and trade names, and purchased and internally developed software and are amortized overtheir estimated useful lives ranging from five to twelve years. We consider a number of factors in determining the useful lives andamortization method, including the pattern in which the economic benefits are consumed, as well as trade name recognition andcustomer attrition. There is no estimated residual value for the intangible assets.
We review the carrying value of goodwill for impairment annually at June 30 and whenever events or circumstances indicatethe carrying value may not be recoverable. The impairment evaluation compares the fair value of each reporting unit, which weidentified as our five agency networks, to its carrying value, including goodwill. If the fair value of the reporting unit is equal to orgreater than its carrying value, goodwill is not impaired. Goodwill is impaired when the carrying value of the reporting unit exceedsits fair value. Goodwill is written down to its fair value through a non-cash expense recorded in results of operations in the periodthe impairment is identified.
We identified our regional reporting units as components of our operating segments, which are our five agency networks. Theregional reporting units and practice areas of each agency network monitor the performance and are responsible for the agencies intheir region. The regional reporting units report to the segment managers and facilitate the administrative and logisticalrequirements of our client-centric strategy for delivering services to clients in their regions. We have concluded that, for each of ouroperating segments, their regional reporting units had similar economic characteristics and should be aggregated for purposes oftesting goodwill for impairment at the operating segment level. Our conclusion was based on a detailed analysis of the aggregationcriteria set forth in FASB ASC Topic 280, Segment Reporting, and the guidance set forth in FASB ASC Topic 350, Intangibles -Goodwill and Other. Consistent with our fundamental business strategy, the agencies within our regional reporting units servesimilar clients in similar industries, and in many cases the same clients. The main economic components of each agency areemployee compensation and related costs and direct service costs and occupancy and other costs, which include rent and occupancycosts, technology costs that are generally limited to personal computers, servers and off-the-shelf software and other overhead costs.Finally, the expected benefits of our acquisitions are typically shared by multiple agencies in various regions as they work together tointegrate the acquired agency into our client service strategy. We use the following valuation methodologies to determine the fairvalue of our reporting units: (1) the income approach, which utilizes discounted expected future cash flows, (2) comparative marketparticipant multiples of EBITDA (earnings before interest, taxes, depreciation and amortization) and (3) when available,consideration of recent and similar acquisition transactions.
Based on the results of the annual impairment test, we concluded that at June 30, 2020 and 2019 goodwill was not impairedbecause either the fair value of each reporting unit was substantially in excess of its respective net book value, or for reporting unitswith a negative book value, fair value of assets exceeds total assets. Subsequent to the annual impairment test of goodwill at June 30,2020, there have been no events or circumstances that triggered the need for an interim impairment test.
Debt Issuance Costs. Debt issuance costs are capitalized and amortized in interest expense over the life of the related debtand are presented as a reduction to the carrying amount of debt.
Temporary Equity - Redeemable Noncontrolling Interests. Owners of noncontrolling equity interests in some of oursubsidiaries have the right in certain circumstances to require us to purchase all or a portion of their equity interests at fair value asdefined in the applicable agreements. The intent of the parties is to approximate fair value at the time of redemption by using amultiple of earnings that is consistent with generally accepted valuation practices used by market participants in our industry. Thesecontingent redemption rights are embedded in the equity security at issuance, are not free-standing instruments, do not represent ade facto financing and are not under our control.
F-13
OMNICOM GROUP INC. AND SUBSIDIARIESNOTES TO CONSOLIDATED FINANCIAL STATEMENTS (Continued)
Treasury Stock. Repurchases of our common stock are accounted for at cost and are recorded as treasury stock. Reissuedtreasury stock, primarily in connection with share-based compensation plans, is accounted for at average cost. Gains or losses onreissued treasury stock arising from the difference between the average cost and the fair value of the award are recorded inadditional paid-in capital and do not affect results of operations.
Business Combinations. Business combinations are accounted for using the acquisition method and accordingly, the assetsacquired, including identified intangible assets, liabilities assumed and any noncontrolling interest in the acquired business arerecorded at acquisition date fair value. In circumstances where control is obtained and less than 100% of a business is acquired,goodwill is recorded as if 100% were acquired. Acquisition-related costs, including advisory, legal, accounting, valuation and othercosts are expensed as incurred. Certain acquisitions include an initial payment at closing and provide for future additionalcontingent purchase price payments (earn-outs), which are recorded as a liability at the acquisition date fair value using thediscount rate in effect on the acquisition date. Subsequent changes in the fair value of the liability are recorded in results ofoperations. Amounts earned under the contingent purchase price arrangements may be subject to a maximum and payment is notcontingent upon future employment. The results of operations of acquired businesses are included in results of operations from theacquisition date.
Noncontrolling Interests. Noncontrolling interests represent equity interests in certain subsidiaries held by third parties.Noncontrolling interests are presented as a component of equity and the proportionate share of net income attributed to thenoncontrolling interests is recorded in results of operations. Changes in noncontrolling interests that do not result in a loss ofcontrol are accounted for in equity. Gains and losses resulting from a loss of control are recorded in results of operations.
Foreign Currency Translation and Transactions. Substantially all of our foreign subsidiaries use their local currency as theirfunctional currency. Assets and liabilities are translated into U.S. Dollars at the exchange rate on the balance sheet date and revenueand expenses are translated at the average exchange rate for the period. Translation adjustments are recorded in accumulated othercomprehensive income. Net foreign currency transaction gains and losses are recorded in results of operations. In 2020 and 2019,we recorded losses of $4.8 million and $11.2 million, respectively, and in 2018, we recorded gains of $2.1 million.
Share-Based Compensation. Share-based compensation for restricted stock and stock option awards is measured at the grantdate fair value. The fair value of restricted stock awards is determined and fixed using the closing price of our common stock on thegrant date and is recorded in additional paid-in capital. The fair value of stock option awards is determined using the Black-Scholesoption valuation model. For awards with a service only vesting condition, compensation expense is recognized on a straight-linebasis over the requisite service period. For awards with a performance vesting condition, compensation expense is recognized on agraded-vesting basis. Typically, all share-based awards are settled with treasury stock. See Note 10 for additional informationregarding our specific award plans.
Salary Continuation Agreements. Arrangements with certain present and former employees provide for continuingpayments for periods up to ten years after cessation of full-time employment in consideration for agreement by the employees notto compete with us and to render consulting services during the postemployment period. Such payments, which are subject tocertain limitations, including our operating performance during the postemployment period, represent the fair value of the servicesrendered and are expensed in such periods.
Severance. The liability for one-time termination benefits, such as severance pay or benefit payouts, is measured andrecognized at fair value in the period the liability is incurred. Subsequent changes to the liability are recognized in results ofoperations in the period of change.
Defined Benefit Pension Plans and Postemployment Arrangements. The funded status of our defined benefit plans isrecorded as an asset or liability. Funded status is the difference between the fair value of plan assets and the benefit obligation atDecember 31, the measurement date, determined on a plan-by-plan basis. The benefit obligation for the defined benefit plans isthe projected benefit obligation (“PBO”), which represents the actuarial present value of benefits expected to be paid uponretirement based on estimated future compensation levels. The fair value of plan assets represents the current market value.Overfunded plans where the fair value of plan assets exceeds the benefit obligation are aggregated and recorded as a prepaid pensionasset equal to the excess. Underfunded plans where the benefit obligation exceeds the fair value of plan assets are aggregated andrecorded as a liability equal to the excess. The benefit obligation liability for our postemployment arrangements is the PBO andthese arrangements are not funded. The current portion of the benefit obligation for the defined benefit plans and postemploymentarrangements, which represents the actuarial present value of benefits payable in the next twelve months that exceed the fair valueof plan assets, is recorded in other current liabilities and the long-term portion is recorded in long-term liabilities.
F-14
OMNICOM GROUP INC. AND SUBSIDIARIESNOTES TO CONSOLIDATED FINANCIAL STATEMENTS (Continued)
Deferred Compensation. Some of our subsidiaries have deferred compensation arrangements with certain executives thatprovide for payments over varying terms upon retirement, cessation of employment or death. The cost of these arrangements isaccrued during the employee’s service period.
Income Taxes. We use the asset and liability method of accounting for income taxes. Under this method, income tax expenseis recognized for the amount of taxes payable for the current period and the deferred taxes recognized during the period. Deferredincome taxes reflect the temporary difference between assets and liabilities that are recognized for financial reporting purposes andincome tax purposes and are recorded as noncurrent. Deferred income taxes are measured using the enacted tax rates that areassumed to be in effect when the differences reverse. Valuation allowances are recorded where it is more likely than not that all or aportion of a deferred tax asset will not be realized. In assessing the need for a valuation allowance, we evaluate factors such as priorearnings history, expected future earnings, carry-back and carry-forward periods and tax strategies that could potentially enhancethe likelihood of the realization of a deferred tax asset.
Interest and penalties related to tax positions taken in our tax returns are recorded in income tax expense. We record aliability for uncertain tax positions that reflects the treatment of certain tax positions taken in our tax returns, or planned to betaken in future tax returns, which have not been reflected in income tax expense. Until these positions are sustained by the taxingauthorities or the statute of limitations concerning such issues lapses, we do not generally recognize the tax benefits resulting fromsuch positions.
Net Income Per Share. Basic net income per share is based on the weighted average number of common shares outstandingduring the period. Diluted net income per share is based on the weighted average number of common shares outstanding, plus thedilutive effect of common share equivalents, which include outstanding stock options and restricted stock awards.
Leases. At the inception of a contract we assess whether the contract is, or contains, a lease. A lease is classified as a financelease if any one of the following criteria are met: the lease transfers ownership of the asset by the end of the lease term, the leasecontains an option to purchase the asset that is reasonably certain to be exercised, the lease term is for a major part of the remaininguseful life of the asset or the present value of the lease payments equals or exceeds substantially all of the fair value of the asset. Alease is classified as an operating lease if it does not meet any one of the criteria. Substantially all our operating leases are leases foroffice space, and substantially all our finance leases are leases for office furniture and technology equipment.
For all leases a ROU asset and lease liability are recognized at the lease commencement date. The lease liability represents thepresent value of the lease payments under the lease. The ROU asset is initially measured at cost, which includes the initial leaseliability, plus any initial direct costs incurred, consisting mainly of brokerage commissions, less any lease incentives received. AllROU assets are reviewed for impairment. The lease liability is initially measured as the present value of the lease payments,discounted using the interest rate implicit in the lease or, if that rate cannot be readily determined, our secured incrementalborrowing rate for the same term as the underlying lease. For real estate and certain equipment operating leases, we use our securedincremental borrowing rate. For finance leases, we use the rate implicit in the lease or our secured incremental borrowing rate if theimplicit lease rate cannot be determined.
Lease payments included in the measurement of the lease liability comprise: the fixed noncancelable lease payments, paymentsfor optional renewal periods where it is reasonably certain the renewal period will be exercised, and payments for early terminationoptions unless it is reasonably certain the lease will not be terminated early. Lease components, including fixed payments for realestate taxes and insurance for office space leases, are included in the measurement of the initial lease liability.
Office space leases may contain variable lease payments, which include payments based on an index or rate. Variable leasepayments based on an index or rate are initially measured using the index or rate in effect at lease commencement. Additionalpayments based on the change in an index or rate, or payments based on a change in our portion of the operating expenses,including real estate taxes and insurance, are recorded as a period expense when incurred. Lease modifications result inremeasurement of the lease liability.
Operating lease expense is recognized on a straight-line basis over the lease term. Lease expense may include variable leasepayments incurred in the period that were not included in the initial lease liability. Finance lease expense consists of theamortization of the ROU asset on a straight-line basis over the lease term and interest expense determined on an amortized costbasis. Finance lease payments are allocated between a reduction of the lease liability and interest expense.
F-15
OMNICOM GROUP INC. AND SUBSIDIARIESNOTES TO CONSOLIDATED FINANCIAL STATEMENTS (Continued)
Concentration of Credit Risk. We provide advertising, marketing and corporate communications services to severalthousand clients that operate in nearly every industry sector of the global economy and we grant credit to qualified clients in thenormal course of business. Due to the diversified nature of our client base, we do not believe that we are exposed to a concentrationof credit risk as our largest client accounted for 3.4% of revenue in 2020.
Derivative Financial Instruments. All derivative instruments, including certain derivative instruments embedded in othercontracts, are recorded at fair value. Derivatives qualify for hedge accounting if: the hedging instrument is designated as a hedge,the hedged exposure is specifically identifiable and exposes us to risk, and a change in fair value of the derivative financialinstrument and an opposite change in the fair value of the hedged exposure have a high degree of correlation. The method ofassessing hedge effectiveness and measuring hedge ineffectiveness is formally documented. Hedge effectiveness is assessed, andhedge ineffectiveness is measured at least quarterly throughout the designated hedge period. If the derivative is a hedge, dependingon the nature of the hedge, changes in the fair value of the derivative will either be offset against the change in fair value of thehedged asset, liability or firm commitment through results of operations or recognized in other comprehensive income until thehedged item is recognized in results of operations. We do not use derivatives for trading or speculative purposes. Using derivativesexposes us to the risk that counterparties to the derivative contracts will fail to meet their contractual obligations. We manage thatrisk through careful selection and ongoing evaluation of the counterparty financial institutions based on specific minimum creditstandards and other factors.
Fair Value. We apply the fair value measurement guidance in FASB ASC Topic 820, Fair Value Measurements and Disclosures,for our financial assets and liabilities that are required to be measured at fair value and for our nonfinancial assets and liabilities thatare not required to be measured at fair value on a recurring basis, which includes goodwill and other identifiable intangible assets.The measurement of fair value requires the use of techniques based on observable and unobservable inputs. Observable inputsreflect market data obtained from independent sources, while unobservable inputs reflect our market assumptions. The inputscreate the following fair value hierarchy:
• Level 1 - Unadjusted quoted prices in active markets for identical assets or liabilities.
• Level 2 - Unadjusted quoted prices in active markets for similar assets or liabilities; unadjusted quoted prices for identicalassets or liabilities in markets that are not active; and model-derived valuations with observable inputs.
• Level 3 - Unobservable inputs for the asset or liability.
We use unadjusted quoted market prices to determine the fair value of our financial assets and liabilities and classify suchitems in Level 1. We use unadjusted quoted market prices for similar assets and liabilities in active markets and model-derivedvaluations and classify such items in Level 2.
In determining the fair value of financial assets and liabilities, we consider certain market valuation adjustments that marketparticipants would consider in determining fair value, including: counterparty credit risk adjustments applied to financial assets andliabilities, taking into account the actual credit risk of the counterparty when valuing assets measured at fair value and credit riskadjustments applied to reflect our credit risk when valuing liabilities measured at fair value.
Reclassifications. Certain reclassifications have been made to the prior year financial information to conform to the currentyear presentation.
3. Revenue
Nature of our services
We provide an extensive range of advertising, marketing and corporate communications services through various client-centricnetworks that are organized to meet specific client objectives. Our branded networks and agencies operate in all major markets andprovide services in the following fundamental disciplines: advertising, customer relationship management, or CRM, which includesCRM Consumer Experience and CRM Execution & Support, public relations and healthcare. Advertising includes creativeservices, as well as strategic media planning and buying and data analytics services. CRM Consumer Experience includesOmnicom’s Precision Marketing Group and digital/direct agencies, as well as our brand consulting, shopper marketing andexperiential marketing agencies. CRM Execution & Support includes field marketing, sales support, merchandising and point ofsale, as well as other specialized marketing and custom communications services. Public relations services include corporatecommunications, crisis management, public affairs and media and media relations services. Healthcare includes advertising andmedia services to global healthcare clients. At the core of all our services is the ability to create or develop a client’s marketing orcorporate communications message into content that can be delivered to a target audience across differentcommunications mediums.
F-16
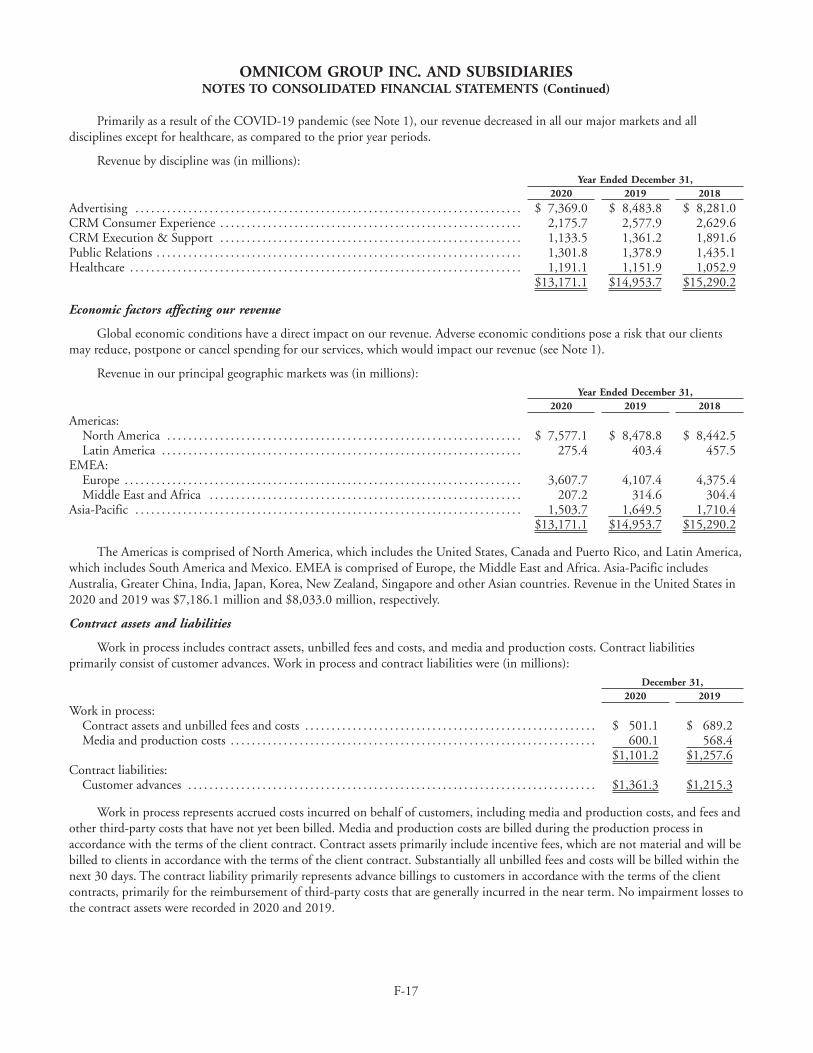
OMNICOM GROUP INC. AND SUBSIDIARIESNOTES TO CONSOLIDATED FINANCIAL STATEMENTS (Continued)
Primarily as a result of the COVID-19 pandemic (see Note 1), our revenue decreased in all our major markets and alldisciplines except for healthcare, as compared to the prior year periods.
Revenue by discipline was (in millions):Year Ended December 31,
2020 2019 2018
Advertising . . . . . . . . . . . . . . . . . . . . . . . . . . . . . . . . . . . . . . . . . . . . . . . . . . . . . . . . . . . . . . . . . . . . . . . . . $ 7,369.0 $ 8,483.8 $ 8,281.0CRM Consumer Experience . . . . . . . . . . . . . . . . . . . . . . . . . . . . . . . . . . . . . . . . . . . . . . . . . . . . . . . . . 2,175.7 2,577.9 2,629.6CRM Execution & Support . . . . . . . . . . . . . . . . . . . . . . . . . . . . . . . . . . . . . . . . . . . . . . . . . . . . . . . . . 1,133.5 1,361.2 1,891.6Public Relations . . . . . . . . . . . . . . . . . . . . . . . . . . . . . . . . . . . . . . . . . . . . . . . . . . . . . . . . . . . . . . . . . . . . . 1,301.8 1,378.9 1,435.1Healthcare . . . . . . . . . . . . . . . . . . . . . . . . . . . . . . . . . . . . . . . . . . . . . . . . . . . . . . . . . . . . . . . . . . . . . . . . . . 1,191.1 1,151.9 1,052.9
$13,171.1 $14,953.7 $15,290.2
Economic factors affecting our revenue
Global economic conditions have a direct impact on our revenue. Adverse economic conditions pose a risk that our clientsmay reduce, postpone or cancel spending for our services, which would impact our revenue (see Note 1).
Revenue in our principal geographic markets was (in millions):Year Ended December 31,
2020 2019 2018
Americas:North America . . . . . . . . . . . . . . . . . . . . . . . . . . . . . . . . . . . . . . . . . . . . . . . . . . . . . . . . . . . . . . . . . . . $ 7,577.1 $ 8,478.8 $ 8,442.5Latin America . . . . . . . . . . . . . . . . . . . . . . . . . . . . . . . . . . . . . . . . . . . . . . . . . . . . . . . . . . . . . . . . . . . . 275.4 403.4 457.5
EMEA:Europe . . . . . . . . . . . . . . . . . . . . . . . . . . . . . . . . . . . . . . . . . . . . . . . . . . . . . . . . . . . . . . . . . . . . . . . . . . . 3,607.7 4,107.4 4,375.4Middle East and Africa . . . . . . . . . . . . . . . . . . . . . . . . . . . . . . . . . . . . . . . . . . . . . . . . . . . . . . . . . . . 207.2 314.6 304.4
Asia-Pacific . . . . . . . . . . . . . . . . . . . . . . . . . . . . . . . . . . . . . . . . . . . . . . . . . . . . . . . . . . . . . . . . . . . . . . . . . 1,503.7 1,649.5 1,710.4$13,171.1 $14,953.7 $15,290.2
The Americas is comprised of North America, which includes the United States, Canada and Puerto Rico, and Latin America,which includes South America and Mexico. EMEA is comprised of Europe, the Middle East and Africa. Asia-Pacific includesAustralia, Greater China, India, Japan, Korea, New Zealand, Singapore and other Asian countries. Revenue in the United States in2020 and 2019 was $7,186.1 million and $8,033.0 million, respectively.
Contract assets and liabilities
Work in process includes contract assets, unbilled fees and costs, and media and production costs. Contract liabilitiesprimarily consist of customer advances. Work in process and contract liabilities were (in millions):
December 31,2020 2019
Work in process:Contract assets and unbilled fees and costs . . . . . . . . . . . . . . . . . . . . . . . . . . . . . . . . . . . . . . . . . . . . . . . . . . . . . . . $ 501.1 $ 689.2Media and production costs . . . . . . . . . . . . . . . . . . . . . . . . . . . . . . . . . . . . . . . . . . . . . . . . . . . . . . . . . . . . . . . . . . . . . 600.1 568.4
$1,101.2 $1,257.6Contract liabilities:
Customer advances . . . . . . . . . . . . . . . . . . . . . . . . . . . . . . . . . . . . . . . . . . . . . . . . . . . . . . . . . . . . . . . . . . . . . . . . . . . . . $1,361.3 $1,215.3
Work in process represents accrued costs incurred on behalf of customers, including media and production costs, and fees andother third-party costs that have not yet been billed. Media and production costs are billed during the production process inaccordance with the terms of the client contract. Contract assets primarily include incentive fees, which are not material and will bebilled to clients in accordance with the terms of the client contract. Substantially all unbilled fees and costs will be billed within thenext 30 days. The contract liability primarily represents advance billings to customers in accordance with the terms of the clientcontracts, primarily for the reimbursement of third-party costs that are generally incurred in the near term. No impairment losses tothe contract assets were recorded in 2020 and 2019.
F-17
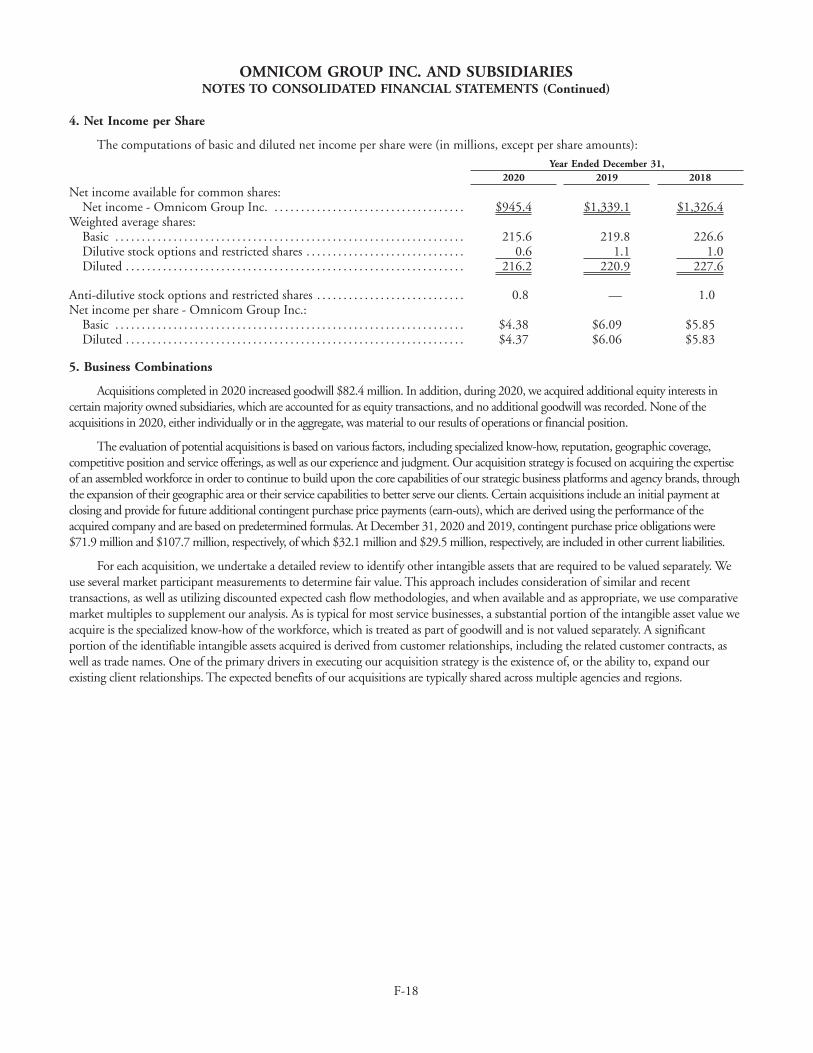
OMNICOM GROUP INC. AND SUBSIDIARIESNOTES TO CONSOLIDATED FINANCIAL STATEMENTS (Continued)
4. Net Income per Share
The computations of basic and diluted net income per share were (in millions, except per share amounts):Year Ended December 31,
2020 2019 2018
Net income available for common shares: Net income - Omnicom Group Inc. . . . . . . . . . . . . . . . . . . . . . . . . . . . . . . . . . . . . $945.4 $1,339.1 $1,326.4
Weighted average shares: Basic . . . . . . . . . . . . . . . . . . . . . . . . . . . . . . . . . . . . . . . . . . . . . . . . . . . . . . . . . . . . . . . . . . 215.6 219.8 226.6Dilutive stock options and restricted shares . . . . . . . . . . . . . . . . . . . . . . . . . . . . . . 0.6 1.1 1.0Diluted . . . . . . . . . . . . . . . . . . . . . . . . . . . . . . . . . . . . . . . . . . . . . . . . . . . . . . . . . . . . . . . . 216.2 220.9 227.6
Anti-dilutive stock options and restricted shares . . . . . . . . . . . . . . . . . . . . . . . . . . . . 0.8 — 1.0Net income per share - Omnicom Group Inc.:
Basic . . . . . . . . . . . . . . . . . . . . . . . . . . . . . . . . . . . . . . . . . . . . . . . . . . . . . . . . . . . . . . . . . . $4.38 $6.09 $5.85Diluted . . . . . . . . . . . . . . . . . . . . . . . . . . . . . . . . . . . . . . . . . . . . . . . . . . . . . . . . . . . . . . . . $4.37 $6.06 $5.83
5. Business Combinations
Acquisitions completed in 2020 increased goodwill $82.4 million. In addition, during 2020, we acquired additional equity interests incertain majority owned subsidiaries, which are accounted for as equity transactions, and no additional goodwill was recorded. None of theacquisitions in 2020, either individually or in the aggregate, was material to our results of operations or financial position.
The evaluation of potential acquisitions is based on various factors, including specialized know-how, reputation, geographic coverage,competitive position and service offerings, as well as our experience and judgment. Our acquisition strategy is focused on acquiring the expertiseof an assembled workforce in order to continue to build upon the core capabilities of our strategic business platforms and agency brands, throughthe expansion of their geographic area or their service capabilities to better serve our clients. Certain acquisitions include an initial payment atclosing and provide for future additional contingent purchase price payments (earn-outs), which are derived using the performance of theacquired company and are based on predetermined formulas. At December 31, 2020 and 2019, contingent purchase price obligations were$71.9 million and $107.7 million, respectively, of which $32.1 million and $29.5 million, respectively, are included in other current liabilities.
For each acquisition, we undertake a detailed review to identify other intangible assets that are required to be valued separately. Weuse several market participant measurements to determine fair value. This approach includes consideration of similar and recenttransactions, as well as utilizing discounted expected cash flow methodologies, and when available and as appropriate, we use comparativemarket multiples to supplement our analysis. As is typical for most service businesses, a substantial portion of the intangible asset value weacquire is the specialized know-how of the workforce, which is treated as part of goodwill and is not valued separately. A significantportion of the identifiable intangible assets acquired is derived from customer relationships, including the related customer contracts, aswell as trade names. One of the primary drivers in executing our acquisition strategy is the existence of, or the ability to, expand ourexisting client relationships. The expected benefits of our acquisitions are typically shared across multiple agencies and regions.
F-18
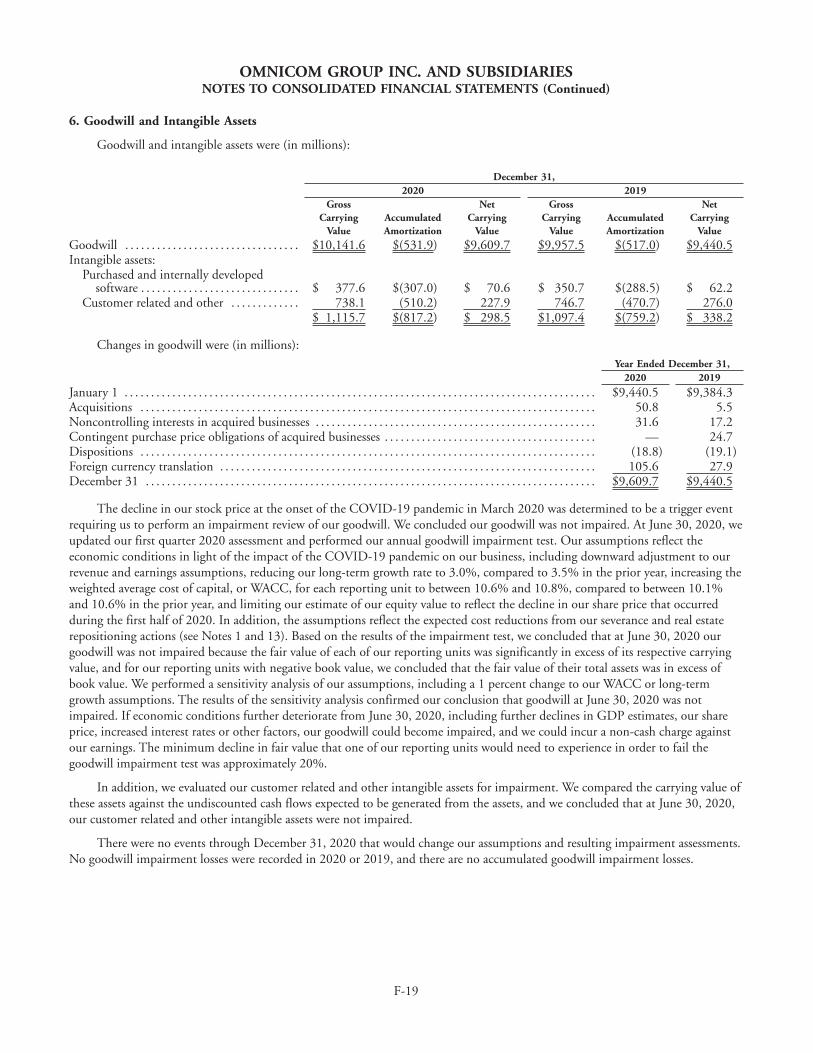
OMNICOM GROUP INC. AND SUBSIDIARIESNOTES TO CONSOLIDATED FINANCIAL STATEMENTS (Continued)
6. Goodwill and Intangible Assets
Goodwill and intangible assets were (in millions):
December 31,2020 2019
GrossCarrying
ValueAccumulatedAmortization
NetCarrying
Value
GrossCarrying
ValueAccumulatedAmortization
NetCarrying
ValueGoodwill . . . . . . . . . . . . . . . . . . . . . . . . . . . . . . . . . $10,141.6 $(531.9) $9,609.7 $9,957.5 $(517.0) $9,440.5Intangible assets:
Purchased and internally developedsoftware . . . . . . . . . . . . . . . . . . . . . . . . . . . . . . $ 377.6 $(307.0) $ 70.6 $ 350.7 $(288.5) $ 62.2
Customer related and other . . . . . . . . . . . . . 738.1 (510.2) 227.9 746.7 (470.7) 276.0$ 1,115.7 $(817.2) $ 298.5 $1,097.4 $(759.2) $ 338.2
Changes in goodwill were (in millions):Year Ended December 31,
2020 2019
January 1 . . . . . . . . . . . . . . . . . . . . . . . . . . . . . . . . . . . . . . . . . . . . . . . . . . . . . . . . . . . . . . . . . . . . . . . . . . . . . . . . . . . . . . . . . $9,440.5 $9,384.3Acquisitions . . . . . . . . . . . . . . . . . . . . . . . . . . . . . . . . . . . . . . . . . . . . . . . . . . . . . . . . . . . . . . . . . . . . . . . . . . . . . . . . . . . . . . 50.8 5.5Noncontrolling interests in acquired businesses . . . . . . . . . . . . . . . . . . . . . . . . . . . . . . . . . . . . . . . . . . . . . . . . . . . . . 31.6 17.2Contingent purchase price obligations of acquired businesses . . . . . . . . . . . . . . . . . . . . . . . . . . . . . . . . . . . . . . . . — 24.7Dispositions . . . . . . . . . . . . . . . . . . . . . . . . . . . . . . . . . . . . . . . . . . . . . . . . . . . . . . . . . . . . . . . . . . . . . . . . . . . . . . . . . . . . . . (18.8) (19.1)Foreign currency translation . . . . . . . . . . . . . . . . . . . . . . . . . . . . . . . . . . . . . . . . . . . . . . . . . . . . . . . . . . . . . . . . . . . . . . . 105.6 27.9December 31 . . . . . . . . . . . . . . . . . . . . . . . . . . . . . . . . . . . . . . . . . . . . . . . . . . . . . . . . . . . . . . . . . . . . . . . . . . . . . . . . . . . . . $9,609.7 $9,440.5
The decline in our stock price at the onset of the COVID-19 pandemic in March 2020 was determined to be a trigger eventrequiring us to perform an impairment review of our goodwill. We concluded our goodwill was not impaired. At June 30, 2020, weupdated our first quarter 2020 assessment and performed our annual goodwill impairment test. Our assumptions reflect theeconomic conditions in light of the impact of the COVID-19 pandemic on our business, including downward adjustment to ourrevenue and earnings assumptions, reducing our long-term growth rate to 3.0%, compared to 3.5% in the prior year, increasing theweighted average cost of capital, or WACC, for each reporting unit to between 10.6% and 10.8%, compared to between 10.1%and 10.6% in the prior year, and limiting our estimate of our equity value to reflect the decline in our share price that occurredduring the first half of 2020. In addition, the assumptions reflect the expected cost reductions from our severance and real estaterepositioning actions (see Notes 1 and 13). Based on the results of the impairment test, we concluded that at June 30, 2020 ourgoodwill was not impaired because the fair value of each of our reporting units was significantly in excess of its respective carryingvalue, and for our reporting units with negative book value, we concluded that the fair value of their total assets was in excess ofbook value. We performed a sensitivity analysis of our assumptions, including a 1 percent change to our WACC or long-termgrowth assumptions. The results of the sensitivity analysis confirmed our conclusion that goodwill at June 30, 2020 was notimpaired. If economic conditions further deteriorate from June 30, 2020, including further declines in GDP estimates, our shareprice, increased interest rates or other factors, our goodwill could become impaired, and we could incur a non-cash charge againstour earnings. The minimum decline in fair value that one of our reporting units would need to experience in order to fail thegoodwill impairment test was approximately 20%.
In addition, we evaluated our customer related and other intangible assets for impairment. We compared the carrying value ofthese assets against the undiscounted cash flows expected to be generated from the assets, and we concluded that at June 30, 2020,our customer related and other intangible assets were not impaired.
There were no events through December 31, 2020 that would change our assumptions and resulting impairment assessments.No goodwill impairment losses were recorded in 2020 or 2019, and there are no accumulated goodwill impairment losses.
F-19
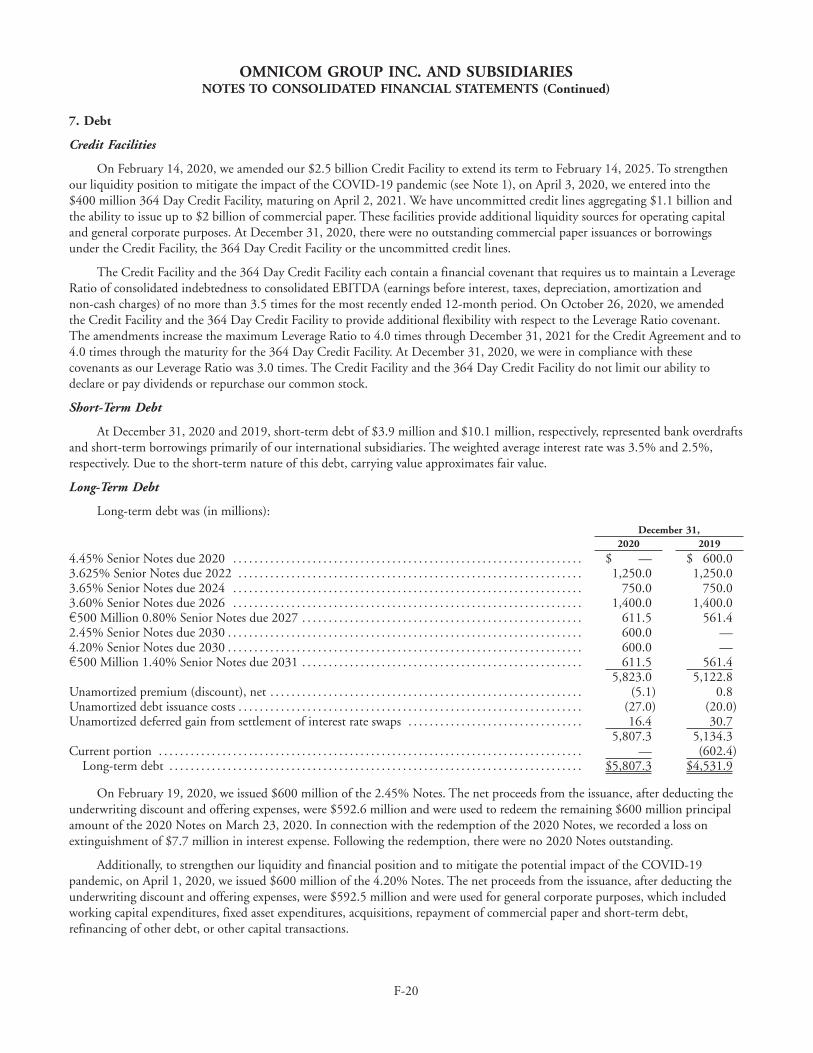
OMNICOM GROUP INC. AND SUBSIDIARIESNOTES TO CONSOLIDATED FINANCIAL STATEMENTS (Continued)
7. Debt
Credit Facilities
On February 14, 2020, we amended our $2.5 billion Credit Facility to extend its term to February 14, 2025. To strengthenour liquidity position to mitigate the impact of the COVID-19 pandemic (see Note 1), on April 3, 2020, we entered into the$400 million 364 Day Credit Facility, maturing on April 2, 2021. We have uncommitted credit lines aggregating $1.1 billion andthe ability to issue up to $2 billion of commercial paper. These facilities provide additional liquidity sources for operating capitaland general corporate purposes. At December 31, 2020, there were no outstanding commercial paper issuances or borrowingsunder the Credit Facility, the 364 Day Credit Facility or the uncommitted credit lines.
The Credit Facility and the 364 Day Credit Facility each contain a financial covenant that requires us to maintain a LeverageRatio of consolidated indebtedness to consolidated EBITDA (earnings before interest, taxes, depreciation, amortization andnon-cash charges) of no more than 3.5 times for the most recently ended 12-month period. On October 26, 2020, we amendedthe Credit Facility and the 364 Day Credit Facility to provide additional flexibility with respect to the Leverage Ratio covenant.The amendments increase the maximum Leverage Ratio to 4.0 times through December 31, 2021 for the Credit Agreement and to4.0 times through the maturity for the 364 Day Credit Facility. At December 31, 2020, we were in compliance with thesecovenants as our Leverage Ratio was 3.0 times. The Credit Facility and the 364 Day Credit Facility do not limit our ability todeclare or pay dividends or repurchase our common stock.
Short-Term Debt
At December 31, 2020 and 2019, short-term debt of $3.9 million and $10.1 million, respectively, represented bank overdraftsand short-term borrowings primarily of our international subsidiaries. The weighted average interest rate was 3.5% and 2.5%,respectively. Due to the short-term nature of this debt, carrying value approximates fair value.
Long-Term Debt
Long-term debt was (in millions):December 31,
2020 2019
4.45% Senior Notes due 2020 . . . . . . . . . . . . . . . . . . . . . . . . . . . . . . . . . . . . . . . . . . . . . . . . . . . . . . . . . . . . . . . . . . $ — $ 600.03.625% Senior Notes due 2022 . . . . . . . . . . . . . . . . . . . . . . . . . . . . . . . . . . . . . . . . . . . . . . . . . . . . . . . . . . . . . . . . . 1,250.0 1,250.03.65% Senior Notes due 2024 . . . . . . . . . . . . . . . . . . . . . . . . . . . . . . . . . . . . . . . . . . . . . . . . . . . . . . . . . . . . . . . . . . 750.0 750.03.60% Senior Notes due 2026 . . . . . . . . . . . . . . . . . . . . . . . . . . . . . . . . . . . . . . . . . . . . . . . . . . . . . . . . . . . . . . . . . . 1,400.0 1,400.0€500 Million 0.80% Senior Notes due 2027 . . . . . . . . . . . . . . . . . . . . . . . . . . . . . . . . . . . . . . . . . . . . . . . . . . . . . 611.5 561.42.45% Senior Notes due 2030 . . . . . . . . . . . . . . . . . . . . . . . . . . . . . . . . . . . . . . . . . . . . . . . . . . . . . . . . . . . . . . . . . . . 600.0 —4.20% Senior Notes due 2030 . . . . . . . . . . . . . . . . . . . . . . . . . . . . . . . . . . . . . . . . . . . . . . . . . . . . . . . . . . . . . . . . . . . 600.0 —€500 Million 1.40% Senior Notes due 2031 . . . . . . . . . . . . . . . . . . . . . . . . . . . . . . . . . . . . . . . . . . . . . . . . . . . . . 611.5 561.4
5,823.0 5,122.8Unamortized premium (discount), net . . . . . . . . . . . . . . . . . . . . . . . . . . . . . . . . . . . . . . . . . . . . . . . . . . . . . . . . . . . (5.1) 0.8Unamortized debt issuance costs . . . . . . . . . . . . . . . . . . . . . . . . . . . . . . . . . . . . . . . . . . . . . . . . . . . . . . . . . . . . . . . . . (27.0) (20.0)Unamortized deferred gain from settlement of interest rate swaps . . . . . . . . . . . . . . . . . . . . . . . . . . . . . . . . . 16.4 30.7
5,807.3 5,134.3Current portion . . . . . . . . . . . . . . . . . . . . . . . . . . . . . . . . . . . . . . . . . . . . . . . . . . . . . . . . . . . . . . . . . . . . . . . . . . . . . . . . — (602.4)
Long-term debt . . . . . . . . . . . . . . . . . . . . . . . . . . . . . . . . . . . . . . . . . . . . . . . . . . . . . . . . . . . . . . . . . . . . . . . . . . . . . . $5,807.3 $4,531.9
On February 19, 2020, we issued $600 million of the 2.45% Notes. The net proceeds from the issuance, after deducting theunderwriting discount and offering expenses, were $592.6 million and were used to redeem the remaining $600 million principalamount of the 2020 Notes on March 23, 2020. In connection with the redemption of the 2020 Notes, we recorded a loss onextinguishment of $7.7 million in interest expense. Following the redemption, there were no 2020 Notes outstanding.
Additionally, to strengthen our liquidity and financial position and to mitigate the potential impact of the COVID-19pandemic, on April 1, 2020, we issued $600 million of the 4.20% Notes. The net proceeds from the issuance, after deducting theunderwriting discount and offering expenses, were $592.5 million and were used for general corporate purposes, which includedworking capital expenditures, fixed asset expenditures, acquisitions, repayment of commercial paper and short-term debt,refinancing of other debt, or other capital transactions.
F-20
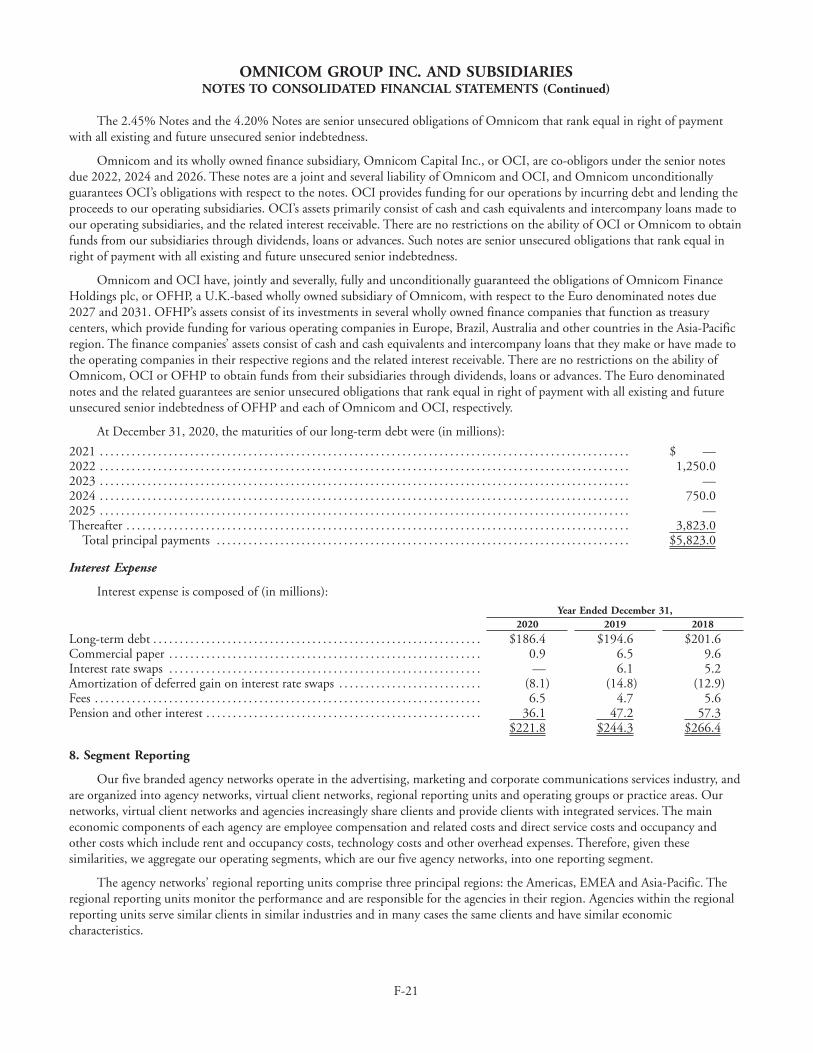
OMNICOM GROUP INC. AND SUBSIDIARIESNOTES TO CONSOLIDATED FINANCIAL STATEMENTS (Continued)
The 2.45% Notes and the 4.20% Notes are senior unsecured obligations of Omnicom that rank equal in right of paymentwith all existing and future unsecured senior indebtedness.
Omnicom and its wholly owned finance subsidiary, Omnicom Capital Inc., or OCI, are co-obligors under the senior notesdue 2022, 2024 and 2026. These notes are a joint and several liability of Omnicom and OCI, and Omnicom unconditionallyguarantees OCI’s obligations with respect to the notes. OCI provides funding for our operations by incurring debt and lending theproceeds to our operating subsidiaries. OCI’s assets primarily consist of cash and cash equivalents and intercompany loans made toour operating subsidiaries, and the related interest receivable. There are no restrictions on the ability of OCI or Omnicom to obtainfunds from our subsidiaries through dividends, loans or advances. Such notes are senior unsecured obligations that rank equal inright of payment with all existing and future unsecured senior indebtedness.
Omnicom and OCI have, jointly and severally, fully and unconditionally guaranteed the obligations of Omnicom FinanceHoldings plc, or OFHP, a U.K.-based wholly owned subsidiary of Omnicom, with respect to the Euro denominated notes due2027 and 2031. OFHP’s assets consist of its investments in several wholly owned finance companies that function as treasurycenters, which provide funding for various operating companies in Europe, Brazil, Australia and other countries in the Asia-Pacificregion. The finance companies’ assets consist of cash and cash equivalents and intercompany loans that they make or have made tothe operating companies in their respective regions and the related interest receivable. There are no restrictions on the ability ofOmnicom, OCI or OFHP to obtain funds from their subsidiaries through dividends, loans or advances. The Euro denominatednotes and the related guarantees are senior unsecured obligations that rank equal in right of payment with all existing and futureunsecured senior indebtedness of OFHP and each of Omnicom and OCI, respectively.
At December 31, 2020, the maturities of our long-term debt were (in millions):
2021 . . . . . . . . . . . . . . . . . . . . . . . . . . . . . . . . . . . . . . . . . . . . . . . . . . . . . . . . . . . . . . . . . . . . . . . . . . . . . . . . . . . . . . . . . . . . . . . . . . . . $ —2022 . . . . . . . . . . . . . . . . . . . . . . . . . . . . . . . . . . . . . . . . . . . . . . . . . . . . . . . . . . . . . . . . . . . . . . . . . . . . . . . . . . . . . . . . . . . . . . . . . . . . 1,250.02023 . . . . . . . . . . . . . . . . . . . . . . . . . . . . . . . . . . . . . . . . . . . . . . . . . . . . . . . . . . . . . . . . . . . . . . . . . . . . . . . . . . . . . . . . . . . . . . . . . . . . —2024 . . . . . . . . . . . . . . . . . . . . . . . . . . . . . . . . . . . . . . . . . . . . . . . . . . . . . . . . . . . . . . . . . . . . . . . . . . . . . . . . . . . . . . . . . . . . . . . . . . . . 750.02025 . . . . . . . . . . . . . . . . . . . . . . . . . . . . . . . . . . . . . . . . . . . . . . . . . . . . . . . . . . . . . . . . . . . . . . . . . . . . . . . . . . . . . . . . . . . . . . . . . . . . —Thereafter . . . . . . . . . . . . . . . . . . . . . . . . . . . . . . . . . . . . . . . . . . . . . . . . . . . . . . . . . . . . . . . . . . . . . . . . . . . . . . . . . . . . . . . . . . . . . . . 3,823.0
Total principal payments . . . . . . . . . . . . . . . . . . . . . . . . . . . . . . . . . . . . . . . . . . . . . . . . . . . . . . . . . . . . . . . . . . . . . . . . . . . . . . $5,823.0
Interest Expense
Interest expense is composed of (in millions):Year Ended December 31,
2020 2019 2018
Long-term debt . . . . . . . . . . . . . . . . . . . . . . . . . . . . . . . . . . . . . . . . . . . . . . . . . . . . . . . . . . . . . . $186.4 $194.6 $201.6Commercial paper . . . . . . . . . . . . . . . . . . . . . . . . . . . . . . . . . . . . . . . . . . . . . . . . . . . . . . . . . . . 0.9 6.5 9.6Interest rate swaps . . . . . . . . . . . . . . . . . . . . . . . . . . . . . . . . . . . . . . . . . . . . . . . . . . . . . . . . . . . — 6.1 5.2Amortization of deferred gain on interest rate swaps . . . . . . . . . . . . . . . . . . . . . . . . . . . (8.1) (14.8) (12.9)Fees . . . . . . . . . . . . . . . . . . . . . . . . . . . . . . . . . . . . . . . . . . . . . . . . . . . . . . . . . . . . . . . . . . . . . . . . . 6.5 4.7 5.6Pension and other interest . . . . . . . . . . . . . . . . . . . . . . . . . . . . . . . . . . . . . . . . . . . . . . . . . . . . 36.1 47.2 57.3
$221.8 $244.3 $266.4
8. Segment Reporting
Our five branded agency networks operate in the advertising, marketing and corporate communications services industry, andare organized into agency networks, virtual client networks, regional reporting units and operating groups or practice areas. Ournetworks, virtual client networks and agencies increasingly share clients and provide clients with integrated services. The maineconomic components of each agency are employee compensation and related costs and direct service costs and occupancy andother costs which include rent and occupancy costs, technology costs and other overhead expenses. Therefore, given thesesimilarities, we aggregate our operating segments, which are our five agency networks, into one reporting segment.
The agency networks’ regional reporting units comprise three principal regions: the Americas, EMEA and Asia-Pacific. Theregional reporting units monitor the performance and are responsible for the agencies in their region. Agencies within the regionalreporting units serve similar clients in similar industries and in many cases the same clients and have similar economiccharacteristics.
F-21
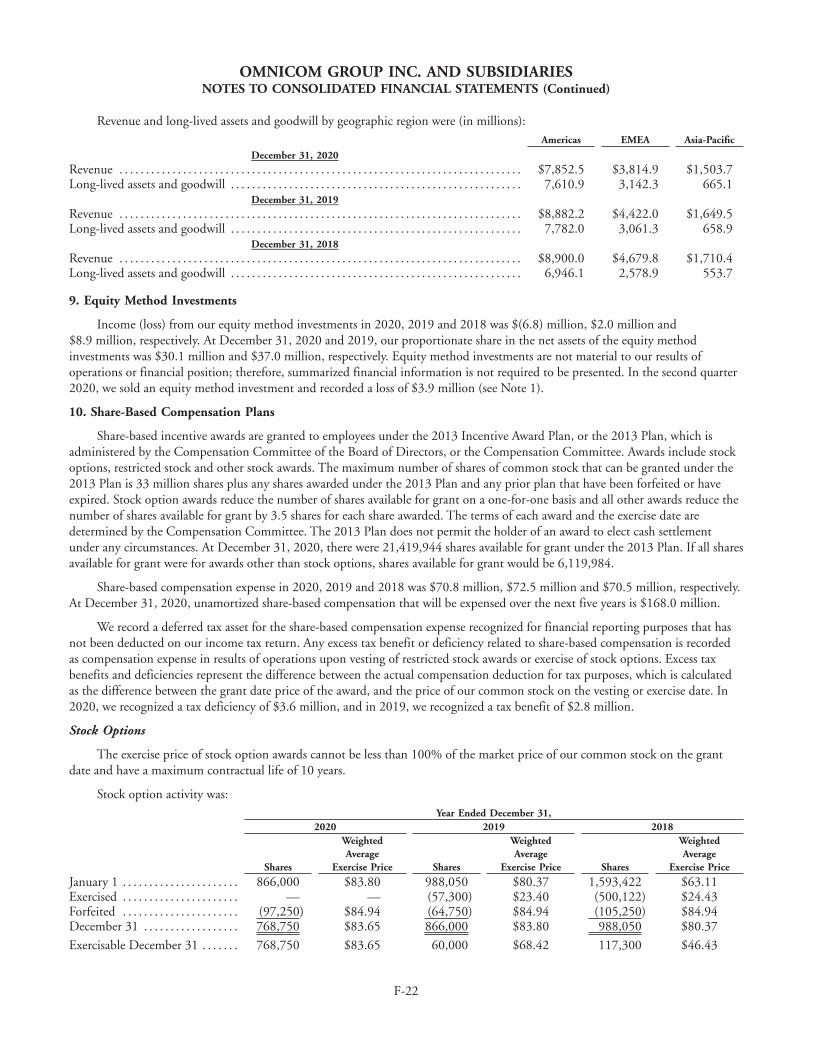
OMNICOM GROUP INC. AND SUBSIDIARIESNOTES TO CONSOLIDATED FINANCIAL STATEMENTS (Continued)
Revenue and long-lived assets and goodwill by geographic region were (in millions):Americas EMEA Asia-Pacific
December 31, 2020Revenue . . . . . . . . . . . . . . . . . . . . . . . . . . . . . . . . . . . . . . . . . . . . . . . . . . . . . . . . . . . . . . . . . . . . . . . . . . . . $7,852.5 $3,814.9 $1,503.7Long-lived assets and goodwill . . . . . . . . . . . . . . . . . . . . . . . . . . . . . . . . . . . . . . . . . . . . . . . . . . . . . . . 7,610.9 3,142.3 665.1
December 31, 2019Revenue . . . . . . . . . . . . . . . . . . . . . . . . . . . . . . . . . . . . . . . . . . . . . . . . . . . . . . . . . . . . . . . . . . . . . . . . . . . . $8,882.2 $4,422.0 $1,649.5Long-lived assets and goodwill . . . . . . . . . . . . . . . . . . . . . . . . . . . . . . . . . . . . . . . . . . . . . . . . . . . . . . . 7,782.0 3,061.3 658.9
December 31, 2018Revenue . . . . . . . . . . . . . . . . . . . . . . . . . . . . . . . . . . . . . . . . . . . . . . . . . . . . . . . . . . . . . . . . . . . . . . . . . . . . $8,900.0 $4,679.8 $1,710.4Long-lived assets and goodwill . . . . . . . . . . . . . . . . . . . . . . . . . . . . . . . . . . . . . . . . . . . . . . . . . . . . . . . 6,946.1 2,578.9 553.7
9. Equity Method Investments
Income (loss) from our equity method investments in 2020, 2019 and 2018 was $(6.8) million, $2.0 million and$8.9 million, respectively. At December 31, 2020 and 2019, our proportionate share in the net assets of the equity methodinvestments was $30.1 million and $37.0 million, respectively. Equity method investments are not material to our results ofoperations or financial position; therefore, summarized financial information is not required to be presented. In the second quarter2020, we sold an equity method investment and recorded a loss of $3.9 million (see Note 1).
10. Share-Based Compensation Plans
Share-based incentive awards are granted to employees under the 2013 Incentive Award Plan, or the 2013 Plan, which isadministered by the Compensation Committee of the Board of Directors, or the Compensation Committee. Awards include stockoptions, restricted stock and other stock awards. The maximum number of shares of common stock that can be granted under the2013 Plan is 33 million shares plus any shares awarded under the 2013 Plan and any prior plan that have been forfeited or haveexpired. Stock option awards reduce the number of shares available for grant on a one-for-one basis and all other awards reduce thenumber of shares available for grant by 3.5 shares for each share awarded. The terms of each award and the exercise date aredetermined by the Compensation Committee. The 2013 Plan does not permit the holder of an award to elect cash settlementunder any circumstances. At December 31, 2020, there were 21,419,944 shares available for grant under the 2013 Plan. If all sharesavailable for grant were for awards other than stock options, shares available for grant would be 6,119,984.
Share-based compensation expense in 2020, 2019 and 2018 was $70.8 million, $72.5 million and $70.5 million, respectively.At December 31, 2020, unamortized share-based compensation that will be expensed over the next five years is $168.0 million.
We record a deferred tax asset for the share-based compensation expense recognized for financial reporting purposes that hasnot been deducted on our income tax return. Any excess tax benefit or deficiency related to share-based compensation is recordedas compensation expense in results of operations upon vesting of restricted stock awards or exercise of stock options. Excess taxbenefits and deficiencies represent the difference between the actual compensation deduction for tax purposes, which is calculatedas the difference between the grant date price of the award, and the price of our common stock on the vesting or exercise date. In2020, we recognized a tax deficiency of $3.6 million, and in 2019, we recognized a tax benefit of $2.8 million.
Stock Options
The exercise price of stock option awards cannot be less than 100% of the market price of our common stock on the grantdate and have a maximum contractual life of 10 years.
Stock option activity was:Year Ended December 31,
2020 2019 2018
Shares
WeightedAverage
Exercise Price Shares
WeightedAverage
Exercise Price Shares
WeightedAverage
Exercise Price
January 1 . . . . . . . . . . . . . . . . . . . . . . 866,000 $83.80 988,050 $80.37 1,593,422 $63.11Exercised . . . . . . . . . . . . . . . . . . . . . . — — (57,300) $23.40 (500,122) $24.43Forfeited . . . . . . . . . . . . . . . . . . . . . . (97,250) $84.94 (64,750) $84.94 (105,250) $84.94December 31 . . . . . . . . . . . . . . . . . . 768,750 $83.65 866,000 $83.80 988,050 $80.37
Exercisable December 31 . . . . . . . 768,750 $83.65 60,000 $68.42 117,300 $46.43
F-22
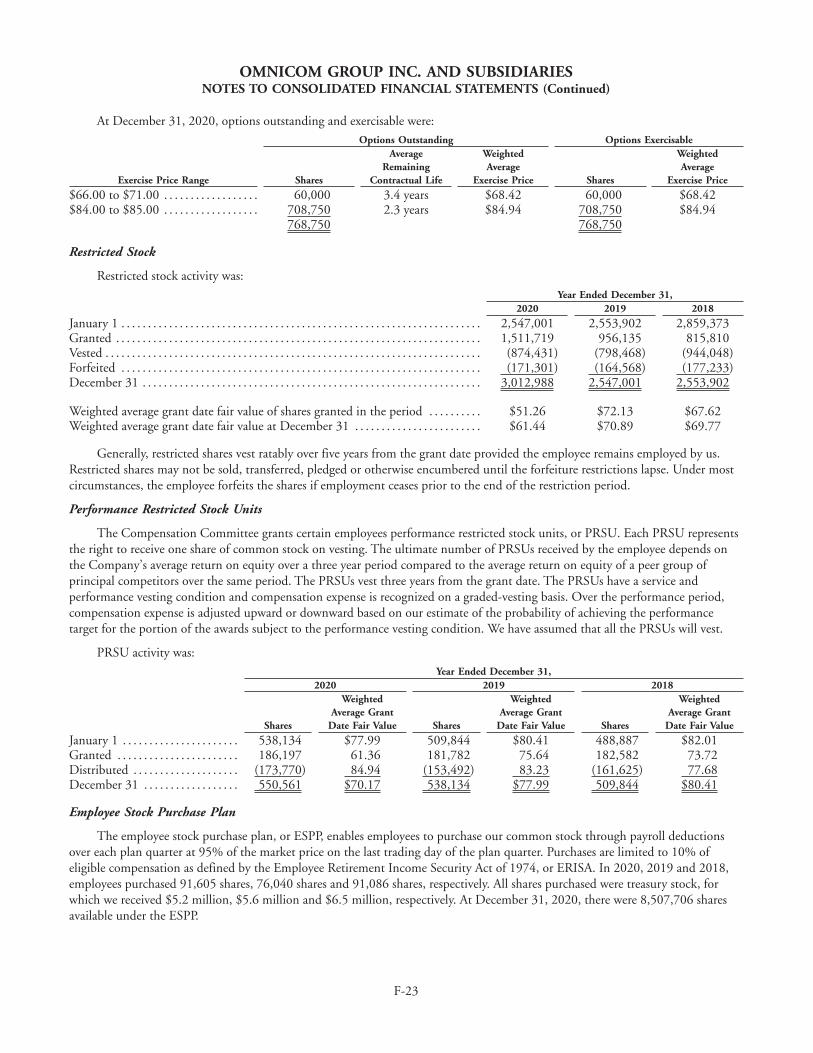
OMNICOM GROUP INC. AND SUBSIDIARIESNOTES TO CONSOLIDATED FINANCIAL STATEMENTS (Continued)
At December 31, 2020, options outstanding and exercisable were:Options Outstanding Options Exercisable
Exercise Price Range Shares
AverageRemaining
Contractual Life
WeightedAverage
Exercise Price Shares
WeightedAverage
Exercise Price
$66.00 to $71.00 . . . . . . . . . . . . . . . . . . 60,000 3.4 years $68.42 60,000 $68.42$84.00 to $85.00 . . . . . . . . . . . . . . . . . . 708,750 2.3 years $84.94 708,750 $84.94 768,750 768,750
Restricted Stock
Restricted stock activity was:Year Ended December 31,
2020 2019 2018
January 1 . . . . . . . . . . . . . . . . . . . . . . . . . . . . . . . . . . . . . . . . . . . . . . . . . . . . . . . . . . . . . . . . . . . . 2,547,001 2,553,902 2,859,373Granted . . . . . . . . . . . . . . . . . . . . . . . . . . . . . . . . . . . . . . . . . . . . . . . . . . . . . . . . . . . . . . . . . . . . . 1,511,719 956,135 815,810Vested . . . . . . . . . . . . . . . . . . . . . . . . . . . . . . . . . . . . . . . . . . . . . . . . . . . . . . . . . . . . . . . . . . . . . . . (874,431) (798,468) (944,048)Forfeited . . . . . . . . . . . . . . . . . . . . . . . . . . . . . . . . . . . . . . . . . . . . . . . . . . . . . . . . . . . . . . . . . . . . (171,301) (164,568) (177,233)December 31 . . . . . . . . . . . . . . . . . . . . . . . . . . . . . . . . . . . . . . . . . . . . . . . . . . . . . . . . . . . . . . . . 3,012,988 2,547,001 2,553,902
Weighted average grant date fair value of shares granted in the period . . . . . . . . . . $51.26 $72.13 $67.62Weighted average grant date fair value at December 31 . . . . . . . . . . . . . . . . . . . . . . . . $61.44 $70.89 $69.77
Generally, restricted shares vest ratably over five years from the grant date provided the employee remains employed by us.Restricted shares may not be sold, transferred, pledged or otherwise encumbered until the forfeiture restrictions lapse. Under mostcircumstances, the employee forfeits the shares if employment ceases prior to the end of the restriction period.
Performance Restricted Stock Units
The Compensation Committee grants certain employees performance restricted stock units, or PRSU. Each PRSU representsthe right to receive one share of common stock on vesting. The ultimate number of PRSUs received by the employee depends onthe Company’s average return on equity over a three year period compared to the average return on equity of a peer group ofprincipal competitors over the same period. The PRSUs vest three years from the grant date. The PRSUs have a service andperformance vesting condition and compensation expense is recognized on a graded-vesting basis. Over the performance period,compensation expense is adjusted upward or downward based on our estimate of the probability of achieving the performancetarget for the portion of the awards subject to the performance vesting condition. We have assumed that all the PRSUs will vest.
PRSU activity was:Year Ended December 31,
2020 2019 2018
Shares
WeightedAverage Grant
Date Fair Value Shares
WeightedAverage Grant
Date Fair Value Shares
WeightedAverage Grant
Date Fair Value
January 1 . . . . . . . . . . . . . . . . . . . . . . 538,134 $77.99 509,844 $80.41 488,887 $82.01Granted . . . . . . . . . . . . . . . . . . . . . . . 186,197 61.36 181,782 75.64 182,582 73.72Distributed . . . . . . . . . . . . . . . . . . . . (173,770) 84.94 (153,492) 83.23 (161,625) 77.68December 31 . . . . . . . . . . . . . . . . . . 550,561 $70.17 538,134 $77.99 509,844 $80.41
Employee Stock Purchase Plan
The employee stock purchase plan, or ESPP, enables employees to purchase our common stock through payroll deductionsover each plan quarter at 95% of the market price on the last trading day of the plan quarter. Purchases are limited to 10% ofeligible compensation as defined by the Employee Retirement Income Security Act of 1974, or ERISA. In 2020, 2019 and 2018,employees purchased 91,605 shares, 76,040 shares and 91,086 shares, respectively. All shares purchased were treasury stock, forwhich we received $5.2 million, $5.6 million and $6.5 million, respectively. At December 31, 2020, there were 8,507,706 sharesavailable under the ESPP.
F-23
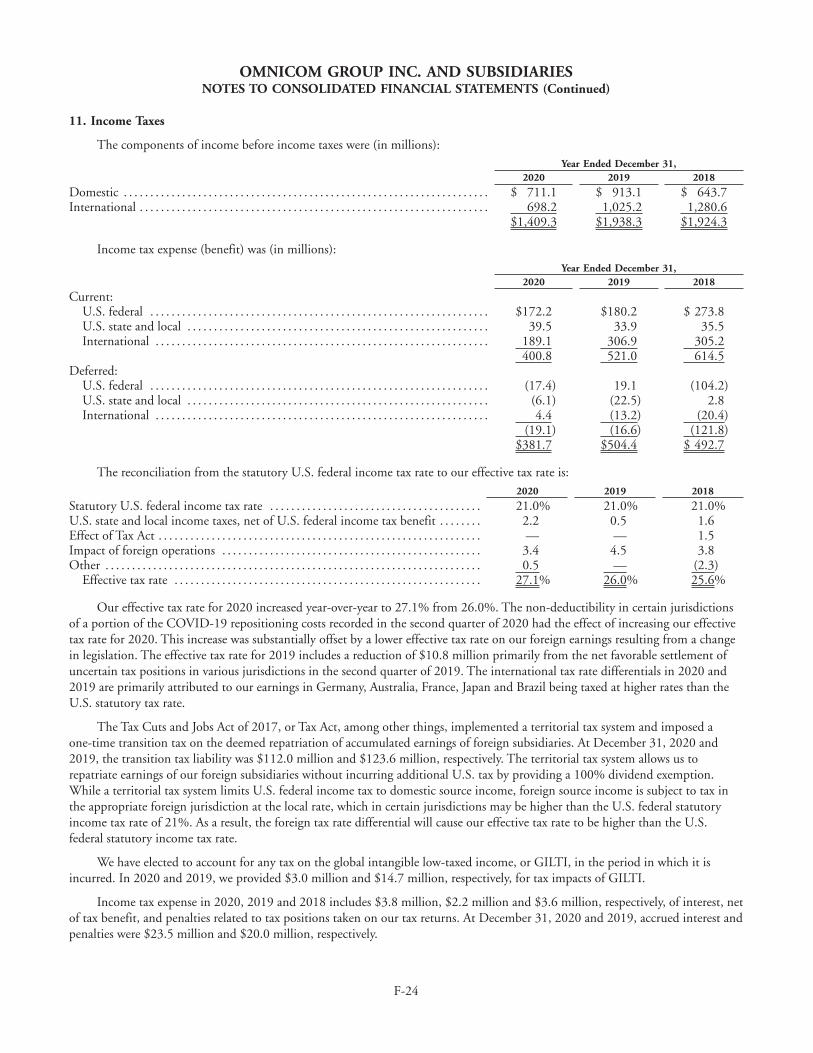
OMNICOM GROUP INC. AND SUBSIDIARIESNOTES TO CONSOLIDATED FINANCIAL STATEMENTS (Continued)
11. Income Taxes
The components of income before income taxes were (in millions):Year Ended December 31,
2020 2019 2018
Domestic . . . . . . . . . . . . . . . . . . . . . . . . . . . . . . . . . . . . . . . . . . . . . . . . . . . . . . . . . . . . . . . . . . . . . $ 711.1 $ 913.1 $ 643.7International . . . . . . . . . . . . . . . . . . . . . . . . . . . . . . . . . . . . . . . . . . . . . . . . . . . . . . . . . . . . . . . . . . 698.2 1,025.2 1,280.6
$1,409.3 $1,938.3 $1,924.3
Income tax expense (benefit) was (in millions):Year Ended December 31,
2020 2019 2018
Current: U.S. federal . . . . . . . . . . . . . . . . . . . . . . . . . . . . . . . . . . . . . . . . . . . . . . . . . . . . . . . . . . . . . . . . $172.2 $180.2 $ 273.8U.S. state and local . . . . . . . . . . . . . . . . . . . . . . . . . . . . . . . . . . . . . . . . . . . . . . . . . . . . . . . . . 39.5 33.9 35.5International . . . . . . . . . . . . . . . . . . . . . . . . . . . . . . . . . . . . . . . . . . . . . . . . . . . . . . . . . . . . . . . 189.1 306.9 305.2
400.8 521.0 614.5Deferred:
U.S. federal . . . . . . . . . . . . . . . . . . . . . . . . . . . . . . . . . . . . . . . . . . . . . . . . . . . . . . . . . . . . . . . . (17.4) 19.1 (104.2)U.S. state and local . . . . . . . . . . . . . . . . . . . . . . . . . . . . . . . . . . . . . . . . . . . . . . . . . . . . . . . . . (6.1) (22.5) 2.8International . . . . . . . . . . . . . . . . . . . . . . . . . . . . . . . . . . . . . . . . . . . . . . . . . . . . . . . . . . . . . . . 4.4 (13.2) (20.4)
(19.1) (16.6) (121.8) $381.7 $504.4 $ 492.7
The reconciliation from the statutory U.S. federal income tax rate to our effective tax rate is:2020 2019 2018
Statutory U.S. federal income tax rate . . . . . . . . . . . . . . . . . . . . . . . . . . . . . . . . . . . . . . . . 21.0% 21.0% 21.0%U.S. state and local income taxes, net of U.S. federal income tax benefit . . . . . . . . 2.2 0.5 1.6Effect of Tax Act . . . . . . . . . . . . . . . . . . . . . . . . . . . . . . . . . . . . . . . . . . . . . . . . . . . . . . . . . . . . . — — 1.5Impact of foreign operations . . . . . . . . . . . . . . . . . . . . . . . . . . . . . . . . . . . . . . . . . . . . . . . . . 3.4 4.5 3.8Other . . . . . . . . . . . . . . . . . . . . . . . . . . . . . . . . . . . . . . . . . . . . . . . . . . . . . . . . . . . . . . . . . . . . . . . 0.5 — (2.3)
Effective tax rate . . . . . . . . . . . . . . . . . . . . . . . . . . . . . . . . . . . . . . . . . . . . . . . . . . . . . . . . . . 27.1% 26.0% 25.6%
Our effective tax rate for 2020 increased year-over-year to 27.1% from 26.0%. The non-deductibility in certain jurisdictionsof a portion of the COVID-19 repositioning costs recorded in the second quarter of 2020 had the effect of increasing our effectivetax rate for 2020. This increase was substantially offset by a lower effective tax rate on our foreign earnings resulting from a changein legislation. The effective tax rate for 2019 includes a reduction of $10.8 million primarily from the net favorable settlement ofuncertain tax positions in various jurisdictions in the second quarter of 2019. The international tax rate differentials in 2020 and2019 are primarily attributed to our earnings in Germany, Australia, France, Japan and Brazil being taxed at higher rates than theU.S. statutory tax rate.
The Tax Cuts and Jobs Act of 2017, or Tax Act, among other things, implemented a territorial tax system and imposed aone-time transition tax on the deemed repatriation of accumulated earnings of foreign subsidiaries. At December 31, 2020 and2019, the transition tax liability was $112.0 million and $123.6 million, respectively. The territorial tax system allows us torepatriate earnings of our foreign subsidiaries without incurring additional U.S. tax by providing a 100% dividend exemption.While a territorial tax system limits U.S. federal income tax to domestic source income, foreign source income is subject to tax inthe appropriate foreign jurisdiction at the local rate, which in certain jurisdictions may be higher than the U.S. federal statutoryincome tax rate of 21%. As a result, the foreign tax rate differential will cause our effective tax rate to be higher than the U.S.federal statutory income tax rate.
We have elected to account for any tax on the global intangible low-taxed income, or GILTI, in the period in which it isincurred. In 2020 and 2019, we provided $3.0 million and $14.7 million, respectively, for tax impacts of GILTI.
Income tax expense in 2020, 2019 and 2018 includes $3.8 million, $2.2 million and $3.6 million, respectively, of interest, netof tax benefit, and penalties related to tax positions taken on our tax returns. At December 31, 2020 and 2019, accrued interest andpenalties were $23.5 million and $20.0 million, respectively.
F-24
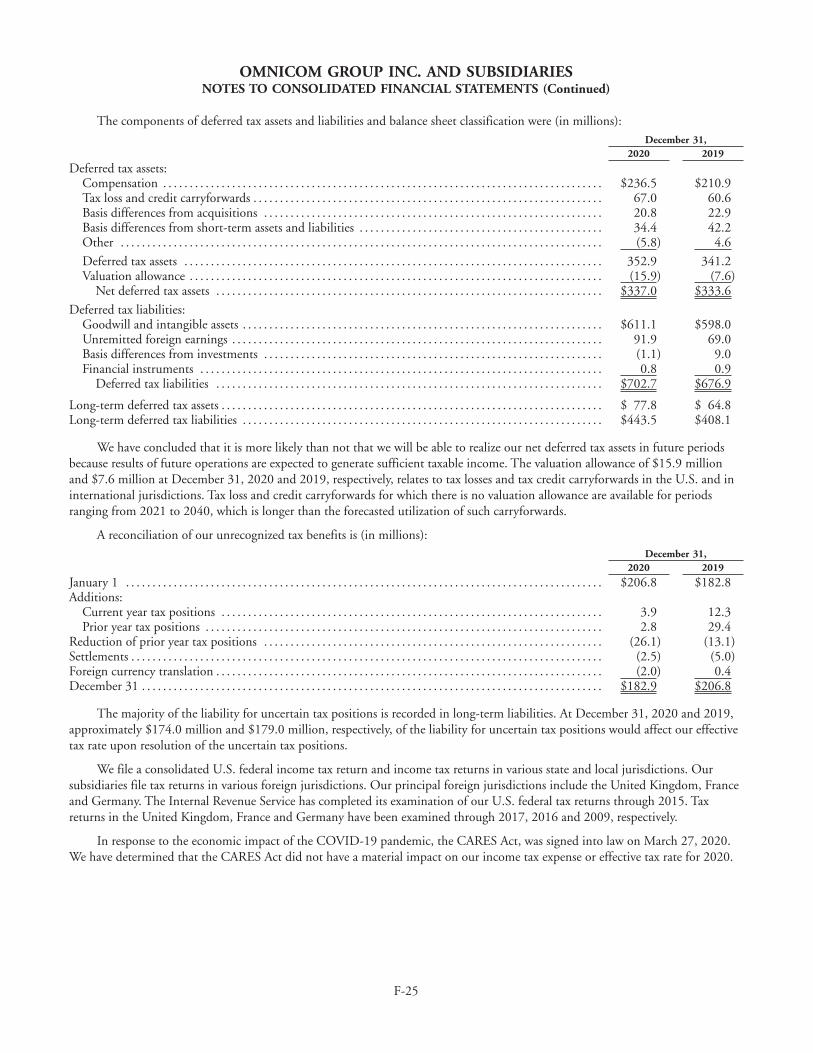
OMNICOM GROUP INC. AND SUBSIDIARIESNOTES TO CONSOLIDATED FINANCIAL STATEMENTS (Continued)
The components of deferred tax assets and liabilities and balance sheet classification were (in millions):December 31,
2020 2019
Deferred tax assets: Compensation . . . . . . . . . . . . . . . . . . . . . . . . . . . . . . . . . . . . . . . . . . . . . . . . . . . . . . . . . . . . . . . . . . . . . . . . . . . . . . . . . . . $236.5 $210.9Tax loss and credit carryforwards . . . . . . . . . . . . . . . . . . . . . . . . . . . . . . . . . . . . . . . . . . . . . . . . . . . . . . . . . . . . . . . . . . 67.0 60.6Basis differences from acquisitions . . . . . . . . . . . . . . . . . . . . . . . . . . . . . . . . . . . . . . . . . . . . . . . . . . . . . . . . . . . . . . . . 20.8 22.9Basis differences from short-term assets and liabilities . . . . . . . . . . . . . . . . . . . . . . . . . . . . . . . . . . . . . . . . . . . . . . 34.4 42.2Other . . . . . . . . . . . . . . . . . . . . . . . . . . . . . . . . . . . . . . . . . . . . . . . . . . . . . . . . . . . . . . . . . . . . . . . . . . . . . . . . . . . . . . . . . . . (5.8) 4.6
Deferred tax assets . . . . . . . . . . . . . . . . . . . . . . . . . . . . . . . . . . . . . . . . . . . . . . . . . . . . . . . . . . . . . . . . . . . . . . . . . . . . . . . 352.9 341.2Valuation allowance . . . . . . . . . . . . . . . . . . . . . . . . . . . . . . . . . . . . . . . . . . . . . . . . . . . . . . . . . . . . . . . . . . . . . . . . . . . . . . (15.9) (7.6)
Net deferred tax assets . . . . . . . . . . . . . . . . . . . . . . . . . . . . . . . . . . . . . . . . . . . . . . . . . . . . . . . . . . . . . . . . . . . . . . . . . $337.0 $333.6
Deferred tax liabilities: Goodwill and intangible assets . . . . . . . . . . . . . . . . . . . . . . . . . . . . . . . . . . . . . . . . . . . . . . . . . . . . . . . . . . . . . . . . . . . . $611.1 $598.0Unremitted foreign earnings . . . . . . . . . . . . . . . . . . . . . . . . . . . . . . . . . . . . . . . . . . . . . . . . . . . . . . . . . . . . . . . . . . . . . . 91.9 69.0Basis differences from investments . . . . . . . . . . . . . . . . . . . . . . . . . . . . . . . . . . . . . . . . . . . . . . . . . . . . . . . . . . . . . . . . (1.1) 9.0Financial instruments . . . . . . . . . . . . . . . . . . . . . . . . . . . . . . . . . . . . . . . . . . . . . . . . . . . . . . . . . . . . . . . . . . . . . . . . . . . . 0.8 0.9
Deferred tax liabilities . . . . . . . . . . . . . . . . . . . . . . . . . . . . . . . . . . . . . . . . . . . . . . . . . . . . . . . . . . . . . . . . . . . . . . . . . $702.7 $676.9
Long-term deferred tax assets . . . . . . . . . . . . . . . . . . . . . . . . . . . . . . . . . . . . . . . . . . . . . . . . . . . . . . . . . . . . . . . . . . . . . . . . $ 77.8 $ 64.8Long-term deferred tax liabilities . . . . . . . . . . . . . . . . . . . . . . . . . . . . . . . . . . . . . . . . . . . . . . . . . . . . . . . . . . . . . . . . . . . . $443.5 $408.1
We have concluded that it is more likely than not that we will be able to realize our net deferred tax assets in future periodsbecause results of future operations are expected to generate sufficient taxable income. The valuation allowance of $15.9 millionand $7.6 million at December 31, 2020 and 2019, respectively, relates to tax losses and tax credit carryforwards in the U.S. and ininternational jurisdictions. Tax loss and credit carryforwards for which there is no valuation allowance are available for periodsranging from 2021 to 2040, which is longer than the forecasted utilization of such carryforwards.
A reconciliation of our unrecognized tax benefits is (in millions):December 31,
2020 2019
January 1 . . . . . . . . . . . . . . . . . . . . . . . . . . . . . . . . . . . . . . . . . . . . . . . . . . . . . . . . . . . . . . . . . . . . . . . . . . . . . . . . . . . . . . . . . . $206.8 $182.8Additions:
Current year tax positions . . . . . . . . . . . . . . . . . . . . . . . . . . . . . . . . . . . . . . . . . . . . . . . . . . . . . . . . . . . . . . . . . . . . . . . . 3.9 12.3Prior year tax positions . . . . . . . . . . . . . . . . . . . . . . . . . . . . . . . . . . . . . . . . . . . . . . . . . . . . . . . . . . . . . . . . . . . . . . . . . . . 2.8 29.4
Reduction of prior year tax positions . . . . . . . . . . . . . . . . . . . . . . . . . . . . . . . . . . . . . . . . . . . . . . . . . . . . . . . . . . . . . . . . (26.1) (13.1)Settlements . . . . . . . . . . . . . . . . . . . . . . . . . . . . . . . . . . . . . . . . . . . . . . . . . . . . . . . . . . . . . . . . . . . . . . . . . . . . . . . . . . . . . . . . . (2.5) (5.0)Foreign currency translation . . . . . . . . . . . . . . . . . . . . . . . . . . . . . . . . . . . . . . . . . . . . . . . . . . . . . . . . . . . . . . . . . . . . . . . . . (2.0) 0.4December 31 . . . . . . . . . . . . . . . . . . . . . . . . . . . . . . . . . . . . . . . . . . . . . . . . . . . . . . . . . . . . . . . . . . . . . . . . . . . . . . . . . . . . . . . $182.9 $206.8
The majority of the liability for uncertain tax positions is recorded in long-term liabilities. At December 31, 2020 and 2019,approximately $174.0 million and $179.0 million, respectively, of the liability for uncertain tax positions would affect our effectivetax rate upon resolution of the uncertain tax positions.
We file a consolidated U.S. federal income tax return and income tax returns in various state and local jurisdictions. Oursubsidiaries file tax returns in various foreign jurisdictions. Our principal foreign jurisdictions include the United Kingdom, Franceand Germany. The Internal Revenue Service has completed its examination of our U.S. federal tax returns through 2015. Taxreturns in the United Kingdom, France and Germany have been examined through 2017, 2016 and 2009, respectively.
In response to the economic impact of the COVID-19 pandemic, the CARES Act, was signed into law on March 27, 2020.We have determined that the CARES Act did not have a material impact on our income tax expense or effective tax rate for 2020.
F-25
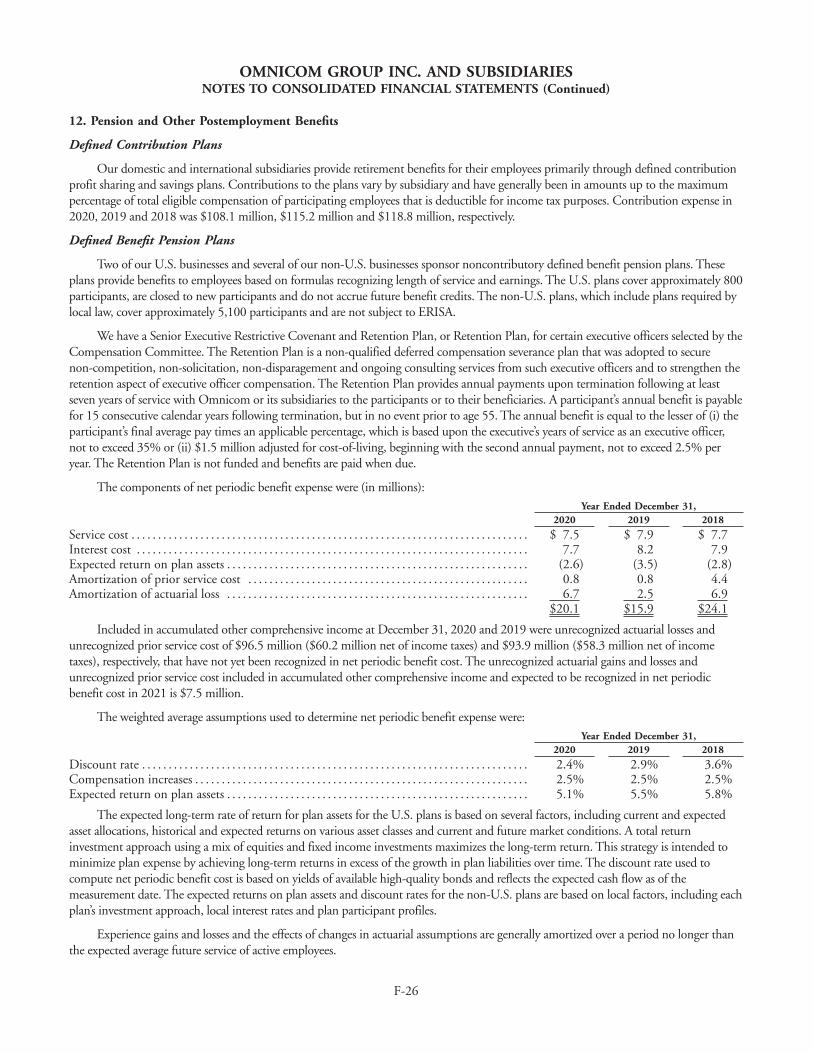
OMNICOM GROUP INC. AND SUBSIDIARIESNOTES TO CONSOLIDATED FINANCIAL STATEMENTS (Continued)
12. Pension and Other Postemployment Benefits
Defined Contribution Plans
Our domestic and international subsidiaries provide retirement benefits for their employees primarily through defined contributionprofit sharing and savings plans. Contributions to the plans vary by subsidiary and have generally been in amounts up to the maximumpercentage of total eligible compensation of participating employees that is deductible for income tax purposes. Contribution expense in2020, 2019 and 2018 was $108.1 million, $115.2 million and $118.8 million, respectively.
Defined Benefit Pension Plans
Two of our U.S. businesses and several of our non-U.S. businesses sponsor noncontributory defined benefit pension plans. Theseplans provide benefits to employees based on formulas recognizing length of service and earnings. The U.S. plans cover approximately 800participants, are closed to new participants and do not accrue future benefit credits. The non-U.S. plans, which include plans required bylocal law, cover approximately 5,100 participants and are not subject to ERISA.
We have a Senior Executive Restrictive Covenant and Retention Plan, or Retention Plan, for certain executive officers selected by theCompensation Committee. The Retention Plan is a non-qualified deferred compensation severance plan that was adopted to securenon-competition, non-solicitation, non-disparagement and ongoing consulting services from such executive officers and to strengthen theretention aspect of executive officer compensation. The Retention Plan provides annual payments upon termination following at leastseven years of service with Omnicom or its subsidiaries to the participants or to their beneficiaries. A participant’s annual benefit is payablefor 15 consecutive calendar years following termination, but in no event prior to age 55. The annual benefit is equal to the lesser of (i) theparticipant’s final average pay times an applicable percentage, which is based upon the executive’s years of service as an executive officer,not to exceed 35% or (ii) $1.5 million adjusted for cost-of-living, beginning with the second annual payment, not to exceed 2.5% peryear. The Retention Plan is not funded and benefits are paid when due.
The components of net periodic benefit expense were (in millions):Year Ended December 31,
2020 2019 2018
Service cost . . . . . . . . . . . . . . . . . . . . . . . . . . . . . . . . . . . . . . . . . . . . . . . . . . . . . . . . . . . . . . . . . . . . . . . . . . . $ 7.5 $ 7.9 $ 7.7Interest cost . . . . . . . . . . . . . . . . . . . . . . . . . . . . . . . . . . . . . . . . . . . . . . . . . . . . . . . . . . . . . . . . . . . . . . . . . . 7.7 8.2 7.9Expected return on plan assets . . . . . . . . . . . . . . . . . . . . . . . . . . . . . . . . . . . . . . . . . . . . . . . . . . . . . . . . . (2.6) (3.5) (2.8)Amortization of prior service cost . . . . . . . . . . . . . . . . . . . . . . . . . . . . . . . . . . . . . . . . . . . . . . . . . . . . . 0.8 0.8 4.4Amortization of actuarial loss . . . . . . . . . . . . . . . . . . . . . . . . . . . . . . . . . . . . . . . . . . . . . . . . . . . . . . . . . 6.7 2.5 6.9
$20.1 $15.9 $24.1
Included in accumulated other comprehensive income at December 31, 2020 and 2019 were unrecognized actuarial losses andunrecognized prior service cost of $96.5 million ($60.2 million net of income taxes) and $93.9 million ($58.3 million net of incometaxes), respectively, that have not yet been recognized in net periodic benefit cost. The unrecognized actuarial gains and losses andunrecognized prior service cost included in accumulated other comprehensive income and expected to be recognized in net periodicbenefit cost in 2021 is $7.5 million.
The weighted average assumptions used to determine net periodic benefit expense were:Year Ended December 31,
2020 2019 2018
Discount rate . . . . . . . . . . . . . . . . . . . . . . . . . . . . . . . . . . . . . . . . . . . . . . . . . . . . . . . . . . . . . . . . . . . . . . . . . 2.4% 2.9% 3.6%Compensation increases . . . . . . . . . . . . . . . . . . . . . . . . . . . . . . . . . . . . . . . . . . . . . . . . . . . . . . . . . . . . . . . 2.5% 2.5% 2.5%Expected return on plan assets . . . . . . . . . . . . . . . . . . . . . . . . . . . . . . . . . . . . . . . . . . . . . . . . . . . . . . . . . 5.1% 5.5% 5.8%
The expected long-term rate of return for plan assets for the U.S. plans is based on several factors, including current and expectedasset allocations, historical and expected returns on various asset classes and current and future market conditions. A total returninvestment approach using a mix of equities and fixed income investments maximizes the long-term return. This strategy is intended tominimize plan expense by achieving long-term returns in excess of the growth in plan liabilities over time. The discount rate used tocompute net periodic benefit cost is based on yields of available high-quality bonds and reflects the expected cash flow as of themeasurement date. The expected returns on plan assets and discount rates for the non-U.S. plans are based on local factors, including eachplan’s investment approach, local interest rates and plan participant profiles.
Experience gains and losses and the effects of changes in actuarial assumptions are generally amortized over a period no longer thanthe expected average future service of active employees.
F-26
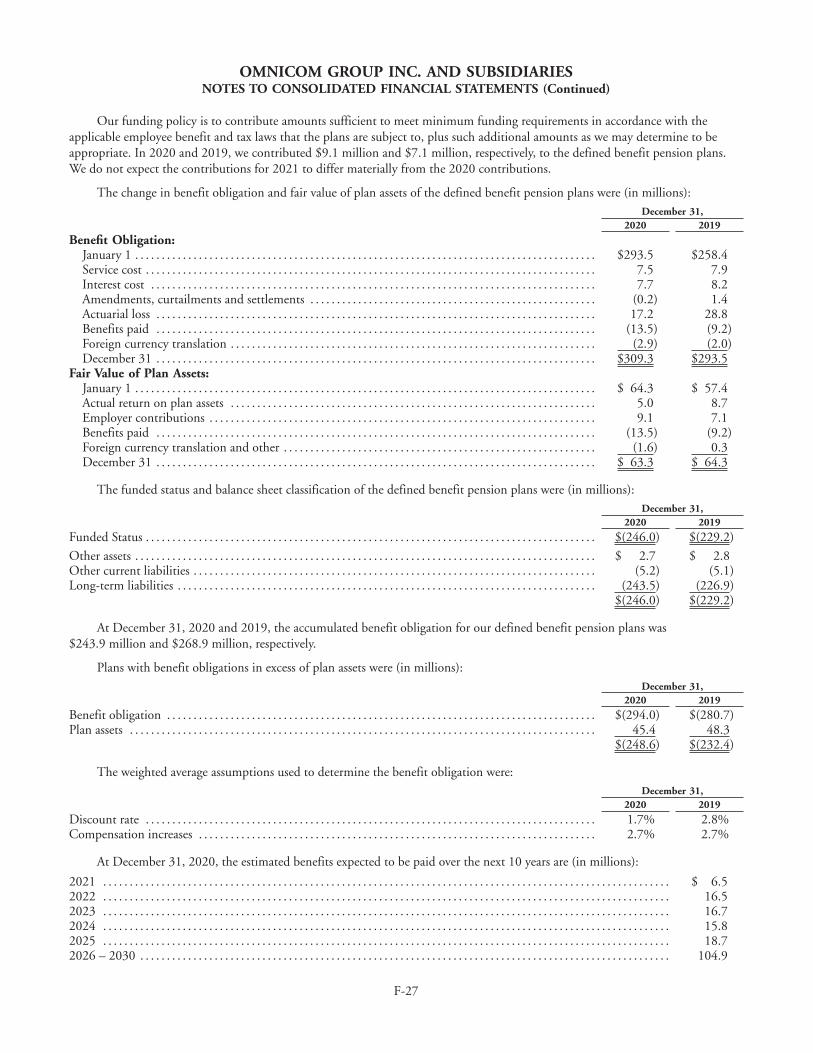
OMNICOM GROUP INC. AND SUBSIDIARIESNOTES TO CONSOLIDATED FINANCIAL STATEMENTS (Continued)
Our funding policy is to contribute amounts sufficient to meet minimum funding requirements in accordance with theapplicable employee benefit and tax laws that the plans are subject to, plus such additional amounts as we may determine to beappropriate. In 2020 and 2019, we contributed $9.1 million and $7.1 million, respectively, to the defined benefit pension plans.We do not expect the contributions for 2021 to differ materially from the 2020 contributions.
The change in benefit obligation and fair value of plan assets of the defined benefit pension plans were (in millions):December 31,
2020 2019
Benefit Obligation:January 1 . . . . . . . . . . . . . . . . . . . . . . . . . . . . . . . . . . . . . . . . . . . . . . . . . . . . . . . . . . . . . . . . . . . . . . . . . . . . . . . . . . . . . . . $293.5 $258.4Service cost . . . . . . . . . . . . . . . . . . . . . . . . . . . . . . . . . . . . . . . . . . . . . . . . . . . . . . . . . . . . . . . . . . . . . . . . . . . . . . . . . . . . . 7.5 7.9Interest cost . . . . . . . . . . . . . . . . . . . . . . . . . . . . . . . . . . . . . . . . . . . . . . . . . . . . . . . . . . . . . . . . . . . . . . . . . . . . . . . . . . . . 7.7 8.2Amendments, curtailments and settlements . . . . . . . . . . . . . . . . . . . . . . . . . . . . . . . . . . . . . . . . . . . . . . . . . . . . . . (0.2) 1.4Actuarial loss . . . . . . . . . . . . . . . . . . . . . . . . . . . . . . . . . . . . . . . . . . . . . . . . . . . . . . . . . . . . . . . . . . . . . . . . . . . . . . . . . . . 17.2 28.8Benefits paid . . . . . . . . . . . . . . . . . . . . . . . . . . . . . . . . . . . . . . . . . . . . . . . . . . . . . . . . . . . . . . . . . . . . . . . . . . . . . . . . . . . (13.5) (9.2)Foreign currency translation . . . . . . . . . . . . . . . . . . . . . . . . . . . . . . . . . . . . . . . . . . . . . . . . . . . . . . . . . . . . . . . . . . . . . (2.9) (2.0)December 31 . . . . . . . . . . . . . . . . . . . . . . . . . . . . . . . . . . . . . . . . . . . . . . . . . . . . . . . . . . . . . . . . . . . . . . . . . . . . . . . . . . . $309.3 $293.5
Fair Value of Plan Assets:January 1 . . . . . . . . . . . . . . . . . . . . . . . . . . . . . . . . . . . . . . . . . . . . . . . . . . . . . . . . . . . . . . . . . . . . . . . . . . . . . . . . . . . . . . . $ 64.3 $ 57.4Actual return on plan assets . . . . . . . . . . . . . . . . . . . . . . . . . . . . . . . . . . . . . . . . . . . . . . . . . . . . . . . . . . . . . . . . . . . . . 5.0 8.7Employer contributions . . . . . . . . . . . . . . . . . . . . . . . . . . . . . . . . . . . . . . . . . . . . . . . . . . . . . . . . . . . . . . . . . . . . . . . . . 9.1 7.1Benefits paid . . . . . . . . . . . . . . . . . . . . . . . . . . . . . . . . . . . . . . . . . . . . . . . . . . . . . . . . . . . . . . . . . . . . . . . . . . . . . . . . . . . (13.5) (9.2)Foreign currency translation and other . . . . . . . . . . . . . . . . . . . . . . . . . . . . . . . . . . . . . . . . . . . . . . . . . . . . . . . . . . . (1.6) 0.3December 31 . . . . . . . . . . . . . . . . . . . . . . . . . . . . . . . . . . . . . . . . . . . . . . . . . . . . . . . . . . . . . . . . . . . . . . . . . . . . . . . . . . . $ 63.3 $ 64.3
The funded status and balance sheet classification of the defined benefit pension plans were (in millions):December 31,
2020 2019
Funded Status . . . . . . . . . . . . . . . . . . . . . . . . . . . . . . . . . . . . . . . . . . . . . . . . . . . . . . . . . . . . . . . . . . . . . . . . . . . . . . . . . . . . . $(246.0) $(229.2)
Other assets . . . . . . . . . . . . . . . . . . . . . . . . . . . . . . . . . . . . . . . . . . . . . . . . . . . . . . . . . . . . . . . . . . . . . . . . . . . . . . . . . . . . . . . $ 2.7 $ 2.8Other current liabilities . . . . . . . . . . . . . . . . . . . . . . . . . . . . . . . . . . . . . . . . . . . . . . . . . . . . . . . . . . . . . . . . . . . . . . . . . . . . (5.2) (5.1)Long-term liabilities . . . . . . . . . . . . . . . . . . . . . . . . . . . . . . . . . . . . . . . . . . . . . . . . . . . . . . . . . . . . . . . . . . . . . . . . . . . . . . . (243.5) (226.9)
$(246.0) $(229.2)
At December 31, 2020 and 2019, the accumulated benefit obligation for our defined benefit pension plans was$243.9 million and $268.9 million, respectively.
Plans with benefit obligations in excess of plan assets were (in millions):December 31,
2020 2019
Benefit obligation . . . . . . . . . . . . . . . . . . . . . . . . . . . . . . . . . . . . . . . . . . . . . . . . . . . . . . . . . . . . . . . . . . . . . . . . . . . . . . . . . $(294.0) $(280.7)Plan assets . . . . . . . . . . . . . . . . . . . . . . . . . . . . . . . . . . . . . . . . . . . . . . . . . . . . . . . . . . . . . . . . . . . . . . . . . . . . . . . . . . . . . . . . 45.4 48.3
$(248.6) $(232.4)
The weighted average assumptions used to determine the benefit obligation were:December 31,
2020 2019
Discount rate . . . . . . . . . . . . . . . . . . . . . . . . . . . . . . . . . . . . . . . . . . . . . . . . . . . . . . . . . . . . . . . . . . . . . . . . . . . . . . . . . . . . . 1.7% 2.8%Compensation increases . . . . . . . . . . . . . . . . . . . . . . . . . . . . . . . . . . . . . . . . . . . . . . . . . . . . . . . . . . . . . . . . . . . . . . . . . . . 2.7% 2.7%
At December 31, 2020, the estimated benefits expected to be paid over the next 10 years are (in millions):
2021 . . . . . . . . . . . . . . . . . . . . . . . . . . . . . . . . . . . . . . . . . . . . . . . . . . . . . . . . . . . . . . . . . . . . . . . . . . . . . . . . . . . . . . . . . . . . . . . . . . . . . . . . . . . $ 6.52022 . . . . . . . . . . . . . . . . . . . . . . . . . . . . . . . . . . . . . . . . . . . . . . . . . . . . . . . . . . . . . . . . . . . . . . . . . . . . . . . . . . . . . . . . . . . . . . . . . . . . . . . . . . . 16.52023 . . . . . . . . . . . . . . . . . . . . . . . . . . . . . . . . . . . . . . . . . . . . . . . . . . . . . . . . . . . . . . . . . . . . . . . . . . . . . . . . . . . . . . . . . . . . . . . . . . . . . . . . . . . 16.72024 . . . . . . . . . . . . . . . . . . . . . . . . . . . . . . . . . . . . . . . . . . . . . . . . . . . . . . . . . . . . . . . . . . . . . . . . . . . . . . . . . . . . . . . . . . . . . . . . . . . . . . . . . . . 15.82025 . . . . . . . . . . . . . . . . . . . . . . . . . . . . . . . . . . . . . . . . . . . . . . . . . . . . . . . . . . . . . . . . . . . . . . . . . . . . . . . . . . . . . . . . . . . . . . . . . . . . . . . . . . . 18.72026 – 2030 . . . . . . . . . . . . . . . . . . . . . . . . . . . . . . . . . . . . . . . . . . . . . . . . . . . . . . . . . . . . . . . . . . . . . . . . . . . . . . . . . . . . . . . . . . . . . . . . . . . . 104.9
F-27
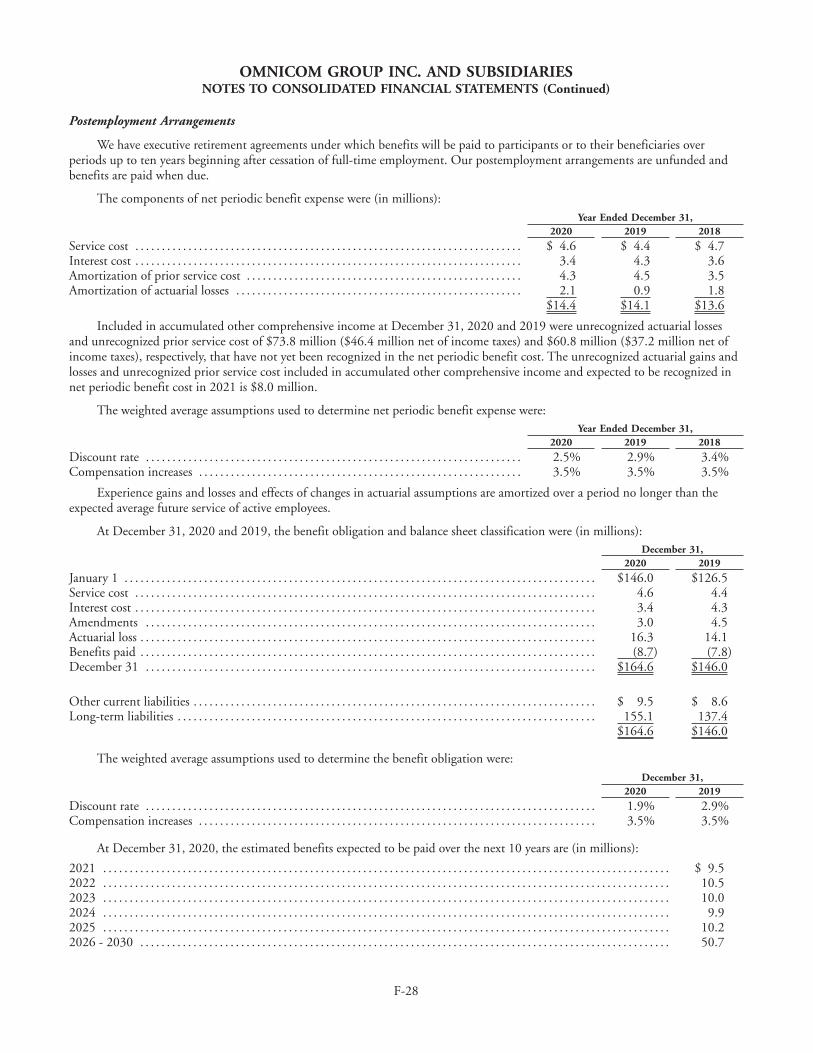
OMNICOM GROUP INC. AND SUBSIDIARIESNOTES TO CONSOLIDATED FINANCIAL STATEMENTS (Continued)
Postemployment Arrangements
We have executive retirement agreements under which benefits will be paid to participants or to their beneficiaries overperiods up to ten years beginning after cessation of full-time employment. Our postemployment arrangements are unfunded andbenefits are paid when due.
The components of net periodic benefit expense were (in millions):Year Ended December 31,
2020 2019 2018
Service cost . . . . . . . . . . . . . . . . . . . . . . . . . . . . . . . . . . . . . . . . . . . . . . . . . . . . . . . . . . . . . . . . . . . . . . . . . $ 4.6 $ 4.4 $ 4.7Interest cost . . . . . . . . . . . . . . . . . . . . . . . . . . . . . . . . . . . . . . . . . . . . . . . . . . . . . . . . . . . . . . . . . . . . . . . . . 3.4 4.3 3.6Amortization of prior service cost . . . . . . . . . . . . . . . . . . . . . . . . . . . . . . . . . . . . . . . . . . . . . . . . . . . . 4.3 4.5 3.5Amortization of actuarial losses . . . . . . . . . . . . . . . . . . . . . . . . . . . . . . . . . . . . . . . . . . . . . . . . . . . . . . 2.1 0.9 1.8
$14.4 $14.1 $13.6
Included in accumulated other comprehensive income at December 31, 2020 and 2019 were unrecognized actuarial lossesand unrecognized prior service cost of $73.8 million ($46.4 million net of income taxes) and $60.8 million ($37.2 million net ofincome taxes), respectively, that have not yet been recognized in the net periodic benefit cost. The unrecognized actuarial gains andlosses and unrecognized prior service cost included in accumulated other comprehensive income and expected to be recognized innet periodic benefit cost in 2021 is $8.0 million.
The weighted average assumptions used to determine net periodic benefit expense were:Year Ended December 31,
2020 2019 2018
Discount rate . . . . . . . . . . . . . . . . . . . . . . . . . . . . . . . . . . . . . . . . . . . . . . . . . . . . . . . . . . . . . . . . . . . . . . . 2.5% 2.9% 3.4%Compensation increases . . . . . . . . . . . . . . . . . . . . . . . . . . . . . . . . . . . . . . . . . . . . . . . . . . . . . . . . . . . . . 3.5% 3.5% 3.5%
Experience gains and losses and effects of changes in actuarial assumptions are amortized over a period no longer than theexpected average future service of active employees.
At December 31, 2020 and 2019, the benefit obligation and balance sheet classification were (in millions):December 31,
2020 2019
January 1 . . . . . . . . . . . . . . . . . . . . . . . . . . . . . . . . . . . . . . . . . . . . . . . . . . . . . . . . . . . . . . . . . . . . . . . . . . . . . . . . . . . . . . . . . $146.0 $126.5Service cost . . . . . . . . . . . . . . . . . . . . . . . . . . . . . . . . . . . . . . . . . . . . . . . . . . . . . . . . . . . . . . . . . . . . . . . . . . . . . . . . . . . . . . . 4.6 4.4Interest cost . . . . . . . . . . . . . . . . . . . . . . . . . . . . . . . . . . . . . . . . . . . . . . . . . . . . . . . . . . . . . . . . . . . . . . . . . . . . . . . . . . . . . . . 3.4 4.3Amendments . . . . . . . . . . . . . . . . . . . . . . . . . . . . . . . . . . . . . . . . . . . . . . . . . . . . . . . . . . . . . . . . . . . . . . . . . . . . . . . . . . . . . 3.0 4.5Actuarial loss . . . . . . . . . . . . . . . . . . . . . . . . . . . . . . . . . . . . . . . . . . . . . . . . . . . . . . . . . . . . . . . . . . . . . . . . . . . . . . . . . . . . . . 16.3 14.1Benefits paid . . . . . . . . . . . . . . . . . . . . . . . . . . . . . . . . . . . . . . . . . . . . . . . . . . . . . . . . . . . . . . . . . . . . . . . . . . . . . . . . . . . . . . (8.7) (7.8)December 31 . . . . . . . . . . . . . . . . . . . . . . . . . . . . . . . . . . . . . . . . . . . . . . . . . . . . . . . . . . . . . . . . . . . . . . . . . . . . . . . . . . . . . $164.6 $146.0
Other current liabilities . . . . . . . . . . . . . . . . . . . . . . . . . . . . . . . . . . . . . . . . . . . . . . . . . . . . . . . . . . . . . . . . . . . . . . . . . . . . $ 9.5 $ 8.6Long-term liabilities . . . . . . . . . . . . . . . . . . . . . . . . . . . . . . . . . . . . . . . . . . . . . . . . . . . . . . . . . . . . . . . . . . . . . . . . . . . . . . . 155.1 137.4
$164.6 $146.0
The weighted average assumptions used to determine the benefit obligation were:December 31,
2020 2019
Discount rate . . . . . . . . . . . . . . . . . . . . . . . . . . . . . . . . . . . . . . . . . . . . . . . . . . . . . . . . . . . . . . . . . . . . . . . . . . . . . . . . . . . . . 1.9% 2.9%Compensation increases . . . . . . . . . . . . . . . . . . . . . . . . . . . . . . . . . . . . . . . . . . . . . . . . . . . . . . . . . . . . . . . . . . . . . . . . . . . 3.5% 3.5%
At December 31, 2020, the estimated benefits expected to be paid over the next 10 years are (in millions):
2021 . . . . . . . . . . . . . . . . . . . . . . . . . . . . . . . . . . . . . . . . . . . . . . . . . . . . . . . . . . . . . . . . . . . . . . . . . . . . . . . . . . . . . . . . . . . . . . . . . . . . . . . . . . . $ 9.52022 . . . . . . . . . . . . . . . . . . . . . . . . . . . . . . . . . . . . . . . . . . . . . . . . . . . . . . . . . . . . . . . . . . . . . . . . . . . . . . . . . . . . . . . . . . . . . . . . . . . . . . . . . . . 10.52023 . . . . . . . . . . . . . . . . . . . . . . . . . . . . . . . . . . . . . . . . . . . . . . . . . . . . . . . . . . . . . . . . . . . . . . . . . . . . . . . . . . . . . . . . . . . . . . . . . . . . . . . . . . . 10.02024 . . . . . . . . . . . . . . . . . . . . . . . . . . . . . . . . . . . . . . . . . . . . . . . . . . . . . . . . . . . . . . . . . . . . . . . . . . . . . . . . . . . . . . . . . . . . . . . . . . . . . . . . . . . 9.92025 . . . . . . . . . . . . . . . . . . . . . . . . . . . . . . . . . . . . . . . . . . . . . . . . . . . . . . . . . . . . . . . . . . . . . . . . . . . . . . . . . . . . . . . . . . . . . . . . . . . . . . . . . . . 10.22026 - 2030 . . . . . . . . . . . . . . . . . . . . . . . . . . . . . . . . . . . . . . . . . . . . . . . . . . . . . . . . . . . . . . . . . . . . . . . . . . . . . . . . . . . . . . . . . . . . . . . . . . . . 50.7
F-28
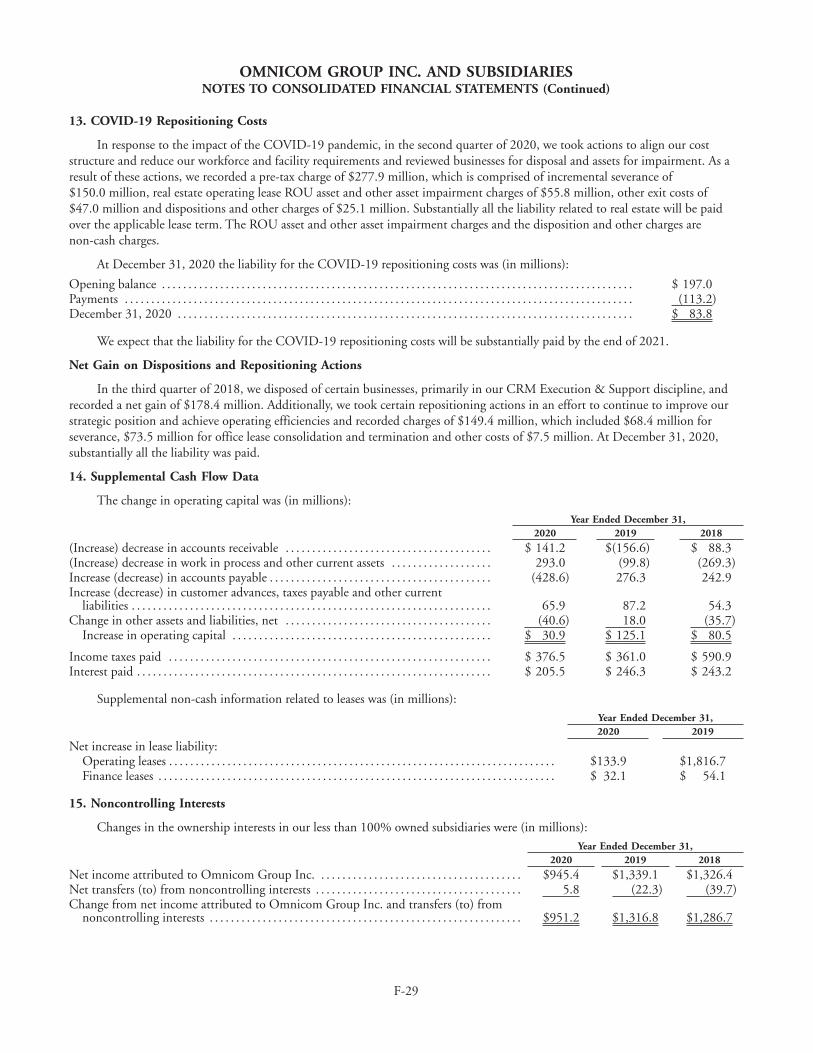
OMNICOM GROUP INC. AND SUBSIDIARIESNOTES TO CONSOLIDATED FINANCIAL STATEMENTS (Continued)
13. COVID-19 Repositioning Costs
In response to the impact of the COVID-19 pandemic, in the second quarter of 2020, we took actions to align our coststructure and reduce our workforce and facility requirements and reviewed businesses for disposal and assets for impairment. As aresult of these actions, we recorded a pre-tax charge of $277.9 million, which is comprised of incremental severance of$150.0 million, real estate operating lease ROU asset and other asset impairment charges of $55.8 million, other exit costs of$47.0 million and dispositions and other charges of $25.1 million. Substantially all the liability related to real estate will be paidover the applicable lease term. The ROU asset and other asset impairment charges and the disposition and other charges arenon-cash charges.
At December 31, 2020 the liability for the COVID-19 repositioning costs was (in millions):
Opening balance . . . . . . . . . . . . . . . . . . . . . . . . . . . . . . . . . . . . . . . . . . . . . . . . . . . . . . . . . . . . . . . . . . . . . . . . . . . . . . . . . . . . . . . . . $ 197.0Payments . . . . . . . . . . . . . . . . . . . . . . . . . . . . . . . . . . . . . . . . . . . . . . . . . . . . . . . . . . . . . . . . . . . . . . . . . . . . . . . . . . . . . . . . . . . . . . . . (113.2)December 31, 2020 . . . . . . . . . . . . . . . . . . . . . . . . . . . . . . . . . . . . . . . . . . . . . . . . . . . . . . . . . . . . . . . . . . . . . . . . . . . . . . . . . . . . . . $ 83.8
We expect that the liability for the COVID-19 repositioning costs will be substantially paid by the end of 2021.
Net Gain on Dispositions and Repositioning Actions
In the third quarter of 2018, we disposed of certain businesses, primarily in our CRM Execution & Support discipline, andrecorded a net gain of $178.4 million. Additionally, we took certain repositioning actions in an effort to continue to improve ourstrategic position and achieve operating efficiencies and recorded charges of $149.4 million, which included $68.4 million forseverance, $73.5 million for office lease consolidation and termination and other costs of $7.5 million. At December 31, 2020,substantially all the liability was paid.
14. Supplemental Cash Flow Data
The change in operating capital was (in millions):Year Ended December 31,
2020 2019 2018
(Increase) decrease in accounts receivable . . . . . . . . . . . . . . . . . . . . . . . . . . . . . . . . . . . . . . . $ 141.2 $(156.6) $ 88.3(Increase) decrease in work in process and other current assets . . . . . . . . . . . . . . . . . . . 293.0 (99.8) (269.3)Increase (decrease) in accounts payable . . . . . . . . . . . . . . . . . . . . . . . . . . . . . . . . . . . . . . . . . . (428.6) 276.3 242.9Increase (decrease) in customer advances, taxes payable and other current
liabilities . . . . . . . . . . . . . . . . . . . . . . . . . . . . . . . . . . . . . . . . . . . . . . . . . . . . . . . . . . . . . . . . . . . . 65.9 87.2 54.3Change in other assets and liabilities, net . . . . . . . . . . . . . . . . . . . . . . . . . . . . . . . . . . . . . . . (40.6) 18.0 (35.7)
Increase in operating capital . . . . . . . . . . . . . . . . . . . . . . . . . . . . . . . . . . . . . . . . . . . . . . . . . $ 30.9 $ 125.1 $ 80.5
Income taxes paid . . . . . . . . . . . . . . . . . . . . . . . . . . . . . . . . . . . . . . . . . . . . . . . . . . . . . . . . . . . . . $ 376.5 $ 361.0 $ 590.9Interest paid . . . . . . . . . . . . . . . . . . . . . . . . . . . . . . . . . . . . . . . . . . . . . . . . . . . . . . . . . . . . . . . . . . . $ 205.5 $ 246.3 $ 243.2
Supplemental non-cash information related to leases was (in millions):Year Ended December 31,2020 2019
Net increase in lease liability:Operating leases . . . . . . . . . . . . . . . . . . . . . . . . . . . . . . . . . . . . . . . . . . . . . . . . . . . . . . . . . . . . . . . . . . . . . . . . . $133.9 $1,816.7Finance leases . . . . . . . . . . . . . . . . . . . . . . . . . . . . . . . . . . . . . . . . . . . . . . . . . . . . . . . . . . . . . . . . . . . . . . . . . . . $ 32.1 $ 54.1
15. Noncontrolling Interests
Changes in the ownership interests in our less than 100% owned subsidiaries were (in millions):Year Ended December 31,
2020 2019 2018
Net income attributed to Omnicom Group Inc. . . . . . . . . . . . . . . . . . . . . . . . . . . . . . . . . . . . . . . $945.4 $1,339.1 $1,326.4Net transfers (to) from noncontrolling interests . . . . . . . . . . . . . . . . . . . . . . . . . . . . . . . . . . . . . . . 5.8 (22.3) (39.7)Change from net income attributed to Omnicom Group Inc. and transfers (to) from
noncontrolling interests . . . . . . . . . . . . . . . . . . . . . . . . . . . . . . . . . . . . . . . . . . . . . . . . . . . . . . . . . . . $951.2 $1,316.8 $1,286.7
F-29
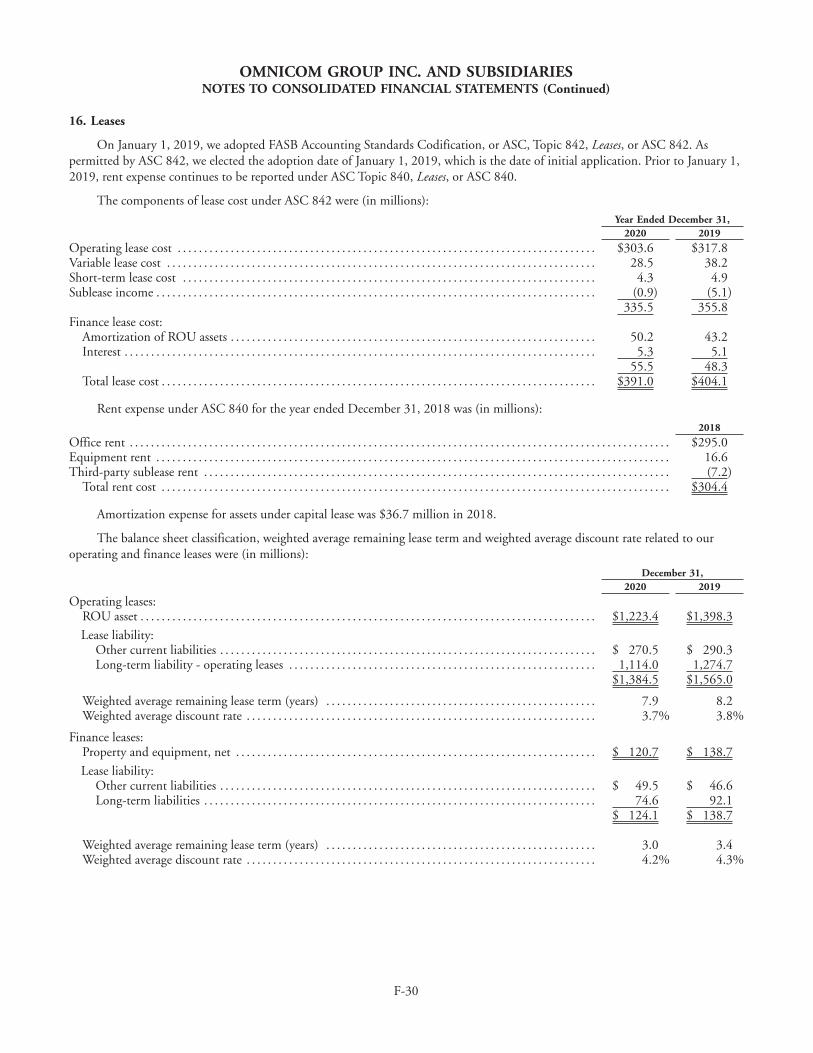
OMNICOM GROUP INC. AND SUBSIDIARIESNOTES TO CONSOLIDATED FINANCIAL STATEMENTS (Continued)
16. Leases
On January 1, 2019, we adopted FASB Accounting Standards Codification, or ASC, Topic 842, Leases, or ASC 842. Aspermitted by ASC 842, we elected the adoption date of January 1, 2019, which is the date of initial application. Prior to January 1,2019, rent expense continues to be reported under ASC Topic 840, Leases, or ASC 840.
The components of lease cost under ASC 842 were (in millions):Year Ended December 31,
2020 2019
Operating lease cost . . . . . . . . . . . . . . . . . . . . . . . . . . . . . . . . . . . . . . . . . . . . . . . . . . . . . . . . . . . . . . . . . . . . . . . . . . . . . . . $303.6 $317.8Variable lease cost . . . . . . . . . . . . . . . . . . . . . . . . . . . . . . . . . . . . . . . . . . . . . . . . . . . . . . . . . . . . . . . . . . . . . . . . . . . . . . . . . 28.5 38.2Short-term lease cost . . . . . . . . . . . . . . . . . . . . . . . . . . . . . . . . . . . . . . . . . . . . . . . . . . . . . . . . . . . . . . . . . . . . . . . . . . . . . . 4.3 4.9Sublease income . . . . . . . . . . . . . . . . . . . . . . . . . . . . . . . . . . . . . . . . . . . . . . . . . . . . . . . . . . . . . . . . . . . . . . . . . . . . . . . . . . . (0.9) (5.1)
335.5 355.8Finance lease cost:
Amortization of ROU assets . . . . . . . . . . . . . . . . . . . . . . . . . . . . . . . . . . . . . . . . . . . . . . . . . . . . . . . . . . . . . . . . . . . . . 50.2 43.2Interest . . . . . . . . . . . . . . . . . . . . . . . . . . . . . . . . . . . . . . . . . . . . . . . . . . . . . . . . . . . . . . . . . . . . . . . . . . . . . . . . . . . . . . . . . 5.3 5.1
55.5 48.3Total lease cost . . . . . . . . . . . . . . . . . . . . . . . . . . . . . . . . . . . . . . . . . . . . . . . . . . . . . . . . . . . . . . . . . . . . . . . . . . . . . . . . . . $391.0 $404.1
Rent expense under ASC 840 for the year ended December 31, 2018 was (in millions):2018
Office rent . . . . . . . . . . . . . . . . . . . . . . . . . . . . . . . . . . . . . . . . . . . . . . . . . . . . . . . . . . . . . . . . . . . . . . . . . . . . . . . . . . . . . . . . . . . . . . . . . . . . . . $295.0Equipment rent . . . . . . . . . . . . . . . . . . . . . . . . . . . . . . . . . . . . . . . . . . . . . . . . . . . . . . . . . . . . . . . . . . . . . . . . . . . . . . . . . . . . . . . . . . . . . . . . . 16.6Third-party sublease rent . . . . . . . . . . . . . . . . . . . . . . . . . . . . . . . . . . . . . . . . . . . . . . . . . . . . . . . . . . . . . . . . . . . . . . . . . . . . . . . . . . . . . . . . (7.2)
Total rent cost . . . . . . . . . . . . . . . . . . . . . . . . . . . . . . . . . . . . . . . . . . . . . . . . . . . . . . . . . . . . . . . . . . . . . . . . . . . . . . . . . . . . . . . . . . . . . . . . $304.4
Amortization expense for assets under capital lease was $36.7 million in 2018.
The balance sheet classification, weighted average remaining lease term and weighted average discount rate related to ouroperating and finance leases were (in millions):
December 31,2020 2019
Operating leases:ROU asset . . . . . . . . . . . . . . . . . . . . . . . . . . . . . . . . . . . . . . . . . . . . . . . . . . . . . . . . . . . . . . . . . . . . . . . . . . . . . . . . . . . . . . $1,223.4 $1,398.3
Lease liability:Other current liabilities . . . . . . . . . . . . . . . . . . . . . . . . . . . . . . . . . . . . . . . . . . . . . . . . . . . . . . . . . . . . . . . . . . . . . . . $ 270.5 $ 290.3Long-term liability - operating leases . . . . . . . . . . . . . . . . . . . . . . . . . . . . . . . . . . . . . . . . . . . . . . . . . . . . . . . . . . 1,114.0 1,274.7
$1,384.5 $1,565.0
Weighted average remaining lease term (years) . . . . . . . . . . . . . . . . . . . . . . . . . . . . . . . . . . . . . . . . . . . . . . . . . . . 7.9 8.2Weighted average discount rate . . . . . . . . . . . . . . . . . . . . . . . . . . . . . . . . . . . . . . . . . . . . . . . . . . . . . . . . . . . . . . . . . . 3.7% 3.8%
Finance leases:Property and equipment, net . . . . . . . . . . . . . . . . . . . . . . . . . . . . . . . . . . . . . . . . . . . . . . . . . . . . . . . . . . . . . . . . . . . . $ 120.7 $ 138.7
Lease liability:Other current liabilities . . . . . . . . . . . . . . . . . . . . . . . . . . . . . . . . . . . . . . . . . . . . . . . . . . . . . . . . . . . . . . . . . . . . . . . $ 49.5 $ 46.6Long-term liabilities . . . . . . . . . . . . . . . . . . . . . . . . . . . . . . . . . . . . . . . . . . . . . . . . . . . . . . . . . . . . . . . . . . . . . . . . . . 74.6 92.1
$ 124.1 $ 138.7
Weighted average remaining lease term (years) . . . . . . . . . . . . . . . . . . . . . . . . . . . . . . . . . . . . . . . . . . . . . . . . . . . 3.0 3.4Weighted average discount rate . . . . . . . . . . . . . . . . . . . . . . . . . . . . . . . . . . . . . . . . . . . . . . . . . . . . . . . . . . . . . . . . . . 4.2% 4.3%
F-30
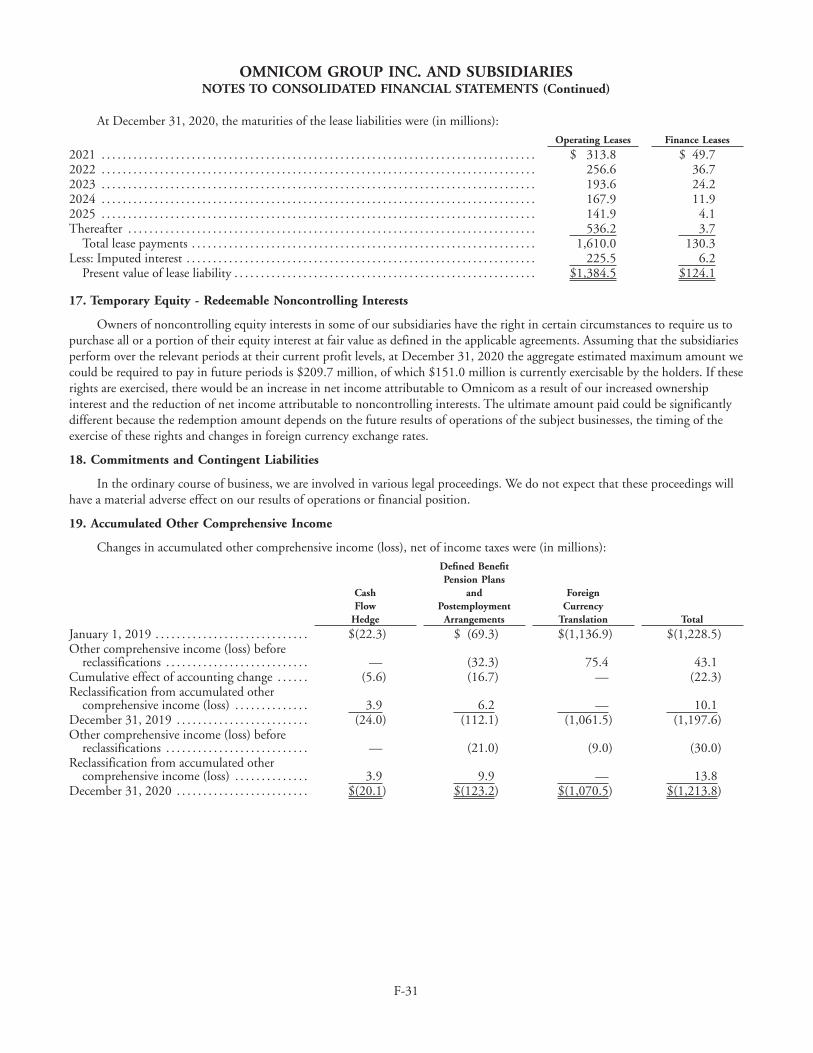
OMNICOM GROUP INC. AND SUBSIDIARIESNOTES TO CONSOLIDATED FINANCIAL STATEMENTS (Continued)
At December 31, 2020, the maturities of the lease liabilities were (in millions):Operating Leases Finance Leases
2021 . . . . . . . . . . . . . . . . . . . . . . . . . . . . . . . . . . . . . . . . . . . . . . . . . . . . . . . . . . . . . . . . . . . . . . . . . . . . . . . . . . $ 313.8 $ 49.72022 . . . . . . . . . . . . . . . . . . . . . . . . . . . . . . . . . . . . . . . . . . . . . . . . . . . . . . . . . . . . . . . . . . . . . . . . . . . . . . . . . . 256.6 36.72023 . . . . . . . . . . . . . . . . . . . . . . . . . . . . . . . . . . . . . . . . . . . . . . . . . . . . . . . . . . . . . . . . . . . . . . . . . . . . . . . . . . 193.6 24.22024 . . . . . . . . . . . . . . . . . . . . . . . . . . . . . . . . . . . . . . . . . . . . . . . . . . . . . . . . . . . . . . . . . . . . . . . . . . . . . . . . . . 167.9 11.92025 . . . . . . . . . . . . . . . . . . . . . . . . . . . . . . . . . . . . . . . . . . . . . . . . . . . . . . . . . . . . . . . . . . . . . . . . . . . . . . . . . . 141.9 4.1Thereafter . . . . . . . . . . . . . . . . . . . . . . . . . . . . . . . . . . . . . . . . . . . . . . . . . . . . . . . . . . . . . . . . . . . . . . . . . . . . . 536.2 3.7
Total lease payments . . . . . . . . . . . . . . . . . . . . . . . . . . . . . . . . . . . . . . . . . . . . . . . . . . . . . . . . . . . . . . . . . 1,610.0 130.3Less: Imputed interest . . . . . . . . . . . . . . . . . . . . . . . . . . . . . . . . . . . . . . . . . . . . . . . . . . . . . . . . . . . . . . . . . . 225.5 6.2
Present value of lease liability . . . . . . . . . . . . . . . . . . . . . . . . . . . . . . . . . . . . . . . . . . . . . . . . . . . . . . . . . $1,384.5 $124.1
17. Temporary Equity - Redeemable Noncontrolling Interests
Owners of noncontrolling equity interests in some of our subsidiaries have the right in certain circumstances to require us topurchase all or a portion of their equity interest at fair value as defined in the applicable agreements. Assuming that the subsidiariesperform over the relevant periods at their current profit levels, at December 31, 2020 the aggregate estimated maximum amount wecould be required to pay in future periods is $209.7 million, of which $151.0 million is currently exercisable by the holders. If theserights are exercised, there would be an increase in net income attributable to Omnicom as a result of our increased ownershipinterest and the reduction of net income attributable to noncontrolling interests. The ultimate amount paid could be significantlydifferent because the redemption amount depends on the future results of operations of the subject businesses, the timing of theexercise of these rights and changes in foreign currency exchange rates.
18. Commitments and Contingent Liabilities
In the ordinary course of business, we are involved in various legal proceedings. We do not expect that these proceedings willhave a material adverse effect on our results of operations or financial position.
19. Accumulated Other Comprehensive Income
Changes in accumulated other comprehensive income (loss), net of income taxes were (in millions):
CashFlow
Hedge
Defined BenefitPension Plans
andPostemployment
Arrangements
ForeignCurrency
Translation Total
January 1, 2019 . . . . . . . . . . . . . . . . . . . . . . . . . . . . . $(22.3) $ (69.3) $(1,136.9) $(1,228.5)Other comprehensive income (loss) before
reclassifications . . . . . . . . . . . . . . . . . . . . . . . . . . . — (32.3) 75.4 43.1Cumulative effect of accounting change . . . . . . (5.6) (16.7) — (22.3)Reclassification from accumulated other
comprehensive income (loss) . . . . . . . . . . . . . . 3.9 6.2 — 10.1December 31, 2019 . . . . . . . . . . . . . . . . . . . . . . . . . (24.0) (112.1) (1,061.5) (1,197.6)Other comprehensive income (loss) before
reclassifications . . . . . . . . . . . . . . . . . . . . . . . . . . . — (21.0) (9.0) (30.0)Reclassification from accumulated other
comprehensive income (loss) . . . . . . . . . . . . . . 3.9 9.9 — 13.8December 31, 2020 . . . . . . . . . . . . . . . . . . . . . . . . . $(20.1) $(123.2) $(1,070.5) $(1,213.8)
F-31
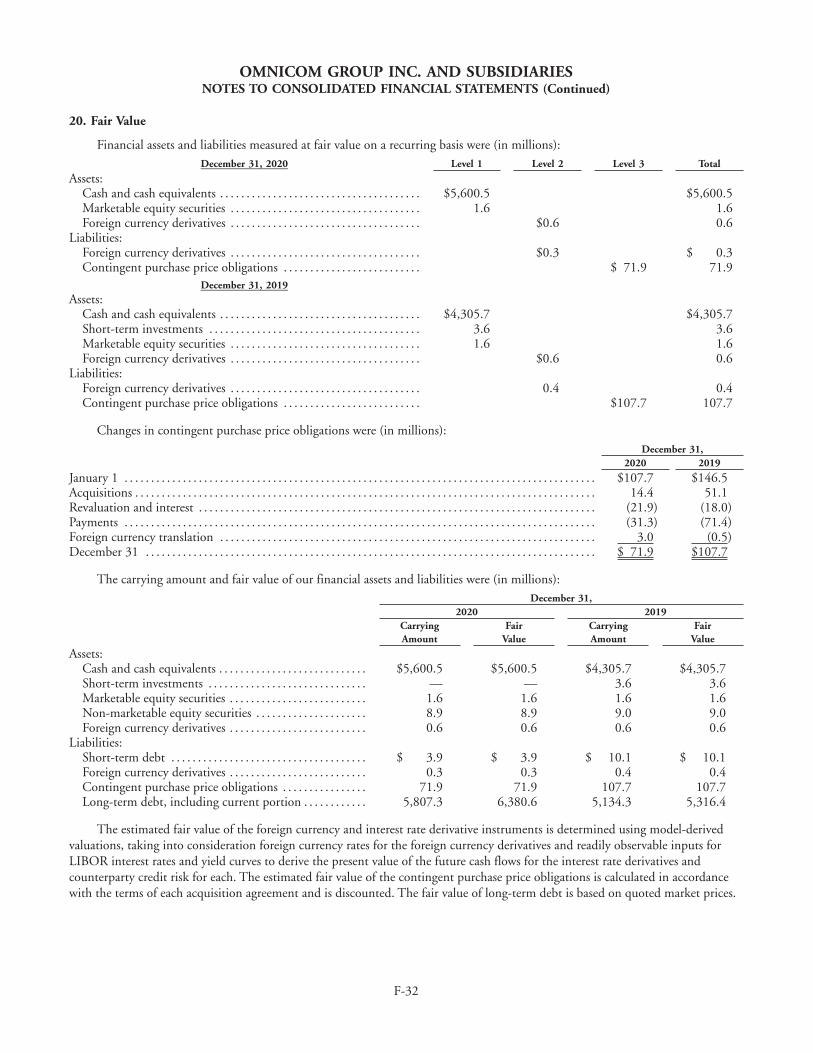
OMNICOM GROUP INC. AND SUBSIDIARIESNOTES TO CONSOLIDATED FINANCIAL STATEMENTS (Continued)
20. Fair Value
Financial assets and liabilities measured at fair value on a recurring basis were (in millions):December 31, 2020 Level 1 Level 2 Level 3 Total
Assets:Cash and cash equivalents . . . . . . . . . . . . . . . . . . . . . . . . . . . . . . . . . . . . . . $5,600.5 $5,600.5Marketable equity securities . . . . . . . . . . . . . . . . . . . . . . . . . . . . . . . . . . . . 1.6 1.6Foreign currency derivatives . . . . . . . . . . . . . . . . . . . . . . . . . . . . . . . . . . . . $0.6 0.6
Liabilities:Foreign currency derivatives . . . . . . . . . . . . . . . . . . . . . . . . . . . . . . . . . . . . $0.3 $ 0.3Contingent purchase price obligations . . . . . . . . . . . . . . . . . . . . . . . . . . $ 71.9 71.9
December 31, 2019Assets:
Cash and cash equivalents . . . . . . . . . . . . . . . . . . . . . . . . . . . . . . . . . . . . . . $4,305.7 $4,305.7Short-term investments . . . . . . . . . . . . . . . . . . . . . . . . . . . . . . . . . . . . . . . . 3.6 3.6Marketable equity securities . . . . . . . . . . . . . . . . . . . . . . . . . . . . . . . . . . . . 1.6 1.6Foreign currency derivatives . . . . . . . . . . . . . . . . . . . . . . . . . . . . . . . . . . . . $0.6 0.6
Liabilities:Foreign currency derivatives . . . . . . . . . . . . . . . . . . . . . . . . . . . . . . . . . . . . 0.4 0.4Contingent purchase price obligations . . . . . . . . . . . . . . . . . . . . . . . . . . $107.7 107.7
Changes in contingent purchase price obligations were (in millions):December 31,
2020 2019
January 1 . . . . . . . . . . . . . . . . . . . . . . . . . . . . . . . . . . . . . . . . . . . . . . . . . . . . . . . . . . . . . . . . . . . . . . . . . . . . . . . . . . . . . . . . . $107.7 $146.5Acquisitions . . . . . . . . . . . . . . . . . . . . . . . . . . . . . . . . . . . . . . . . . . . . . . . . . . . . . . . . . . . . . . . . . . . . . . . . . . . . . . . . . . . . . . . 14.4 51.1Revaluation and interest . . . . . . . . . . . . . . . . . . . . . . . . . . . . . . . . . . . . . . . . . . . . . . . . . . . . . . . . . . . . . . . . . . . . . . . . . . . (21.9) (18.0)Payments . . . . . . . . . . . . . . . . . . . . . . . . . . . . . . . . . . . . . . . . . . . . . . . . . . . . . . . . . . . . . . . . . . . . . . . . . . . . . . . . . . . . . . . . . (31.3) (71.4)Foreign currency translation . . . . . . . . . . . . . . . . . . . . . . . . . . . . . . . . . . . . . . . . . . . . . . . . . . . . . . . . . . . . . . . . . . . . . . . 3.0 (0.5)December 31 . . . . . . . . . . . . . . . . . . . . . . . . . . . . . . . . . . . . . . . . . . . . . . . . . . . . . . . . . . . . . . . . . . . . . . . . . . . . . . . . . . . . . $ 71.9 $107.7
The carrying amount and fair value of our financial assets and liabilities were (in millions):December 31,
2020 2019CarryingAmount
FairValue
CarryingAmount
FairValue
Assets:Cash and cash equivalents . . . . . . . . . . . . . . . . . . . . . . . . . . . . $5,600.5 $5,600.5 $4,305.7 $4,305.7Short-term investments . . . . . . . . . . . . . . . . . . . . . . . . . . . . . . — — 3.6 3.6Marketable equity securities . . . . . . . . . . . . . . . . . . . . . . . . . . 1.6 1.6 1.6 1.6Non-marketable equity securities . . . . . . . . . . . . . . . . . . . . . 8.9 8.9 9.0 9.0Foreign currency derivatives . . . . . . . . . . . . . . . . . . . . . . . . . . 0.6 0.6 0.6 0.6
Liabilities:Short-term debt . . . . . . . . . . . . . . . . . . . . . . . . . . . . . . . . . . . . . $ 3.9 $ 3.9 $ 10.1 $ 10.1Foreign currency derivatives . . . . . . . . . . . . . . . . . . . . . . . . . . 0.3 0.3 0.4 0.4Contingent purchase price obligations . . . . . . . . . . . . . . . . 71.9 71.9 107.7 107.7Long-term debt, including current portion . . . . . . . . . . . . 5,807.3 6,380.6 5,134.3 5,316.4
The estimated fair value of the foreign currency and interest rate derivative instruments is determined using model-derivedvaluations, taking into consideration foreign currency rates for the foreign currency derivatives and readily observable inputs forLIBOR interest rates and yield curves to derive the present value of the future cash flows for the interest rate derivatives andcounterparty credit risk for each. The estimated fair value of the contingent purchase price obligations is calculated in accordancewith the terms of each acquisition agreement and is discounted. The fair value of long-term debt is based on quoted market prices.
F-32

OMNICOM GROUP INC. AND SUBSIDIARIESNOTES TO CONSOLIDATED FINANCIAL STATEMENTS (Continued)
21. Derivative Instruments and Hedging Activities
We manage our exposure to foreign currency exchange rate risk and interest rate risk through various strategies, including theuse of derivative financial instruments. We use forward foreign exchange contracts as economic hedges to manage the cash flowvolatility arising from foreign currency exchange rate fluctuations. We may use interest rate swaps to manage our interest expenseand structure our long-term debt portfolio to achieve a mix of fixed rate and floating rate debt. We do not use derivatives fortrading or speculative purposes. Using derivatives exposes us to the risk that counterparties to the derivative contracts will fail tomeet their contractual obligations. We manage that risk through careful selection and ongoing evaluation of the counterpartyfinancial institutions based on specific minimum credit standards and other factors.
We evaluate the effects of changes in foreign currency exchange rates, interest rates and other relevant market risks on ourderivatives. We periodically determine the potential loss from market risk on our derivatives by performing a value-at-risk analysis,or VaR. VaR is a statistical model that uses historical currency exchange rate data to measure the potential impact on futureearnings of our derivative financial instruments assuming normal market conditions. The VaR model is not intended to representactual losses but is used as a risk estimation and management tool. Based on the results of the model, we estimate with 95%confidence a maximum one-day change in the net fair value of our derivative financial instruments at December 31, 2020 was notsignificant.
Foreign Currency Exchange Risk
As an integral part of our global treasury operations, we centralize our cash and use notional multicurrency pools to managethe foreign currency exchange risk that arises from imbalances between subsidiaries and their respective treasury centers. Inaddition, there are circumstances where revenue and expense transactions are not denominated in the same currency. In theseinstances, amounts are either promptly settled or hedged with forward foreign exchange contracts. To manage this risk, we hadoutstanding forward foreign exchange contracts with an aggregate notional amount of $169.6 million and $284.2 million atDecember 31, 2020 and 2019, respectively.
Foreign currency derivatives are designated as fair value hedges; therefore, any gain or loss in fair value incurred on thoseinstruments is recorded in results of operations and is generally offset by decreases or increases in the fair value of the underlyingexposure. By using these financial instruments, we reduce financial risk of adverse foreign exchange changes by foregoing any gainwhich might occur if the markets move favorably. The terms of our forward foreign exchange contracts are generally less than90 days.
22. New Accounting Standards
In December 2019, the FASB issued ASU 2019-12, Income Taxes (Topic 740) or ASU 2019-12, which, among other things,amends the rules for recognizing deferred taxes for investments, performing intra-period tax allocations and calculating incometaxes in interim periods and reduces complexity in certain areas, including the accounting for transactions that result in a step-up inthe tax basis of goodwill and allocating taxes to members of a consolidated group. ASU 2019-12 is effective January 1, 2021. We donot expect the adoption of ASU 2019-12 will have a material effect on our results of operations and financial position.
23. Subsequent Events
We have evaluated events subsequent to the balance sheet date and determined there have not been any events that haveoccurred that would require adjustment to or disclosure in the consolidated financial statements.
F-33
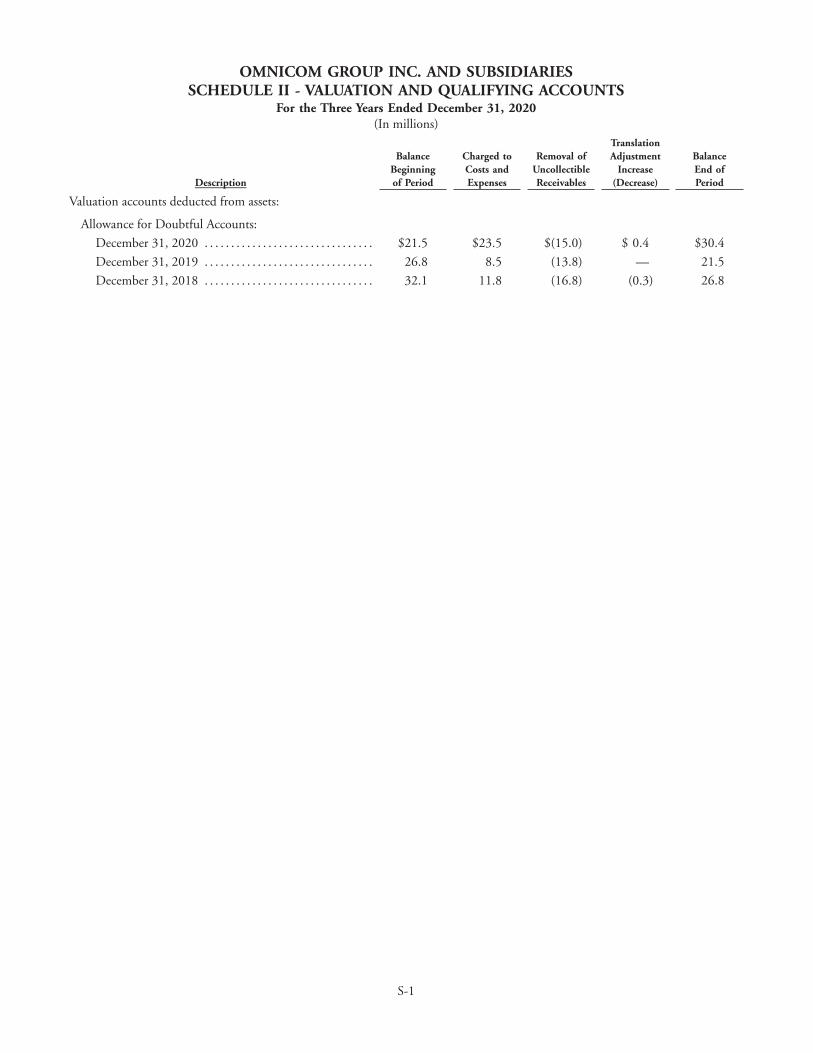
OMNICOM GROUP INC. AND SUBSIDIARIESSCHEDULE II - VALUATION AND QUALIFYING ACCOUNTS
For the Three Years Ended December 31, 2020(In millions)
Description
BalanceBeginningof Period
Charged toCosts andExpenses
Removal ofUncollectibleReceivables
TranslationAdjustment
Increase(Decrease)
BalanceEnd ofPeriod
Valuation accounts deducted from assets:
Allowance for Doubtful Accounts:
December 31, 2020 . . . . . . . . . . . . . . . . . . . . . . . . . . . . . . . . $21.5 $23.5 $(15.0) $ 0.4 $30.4
December 31, 2019 . . . . . . . . . . . . . . . . . . . . . . . . . . . . . . . . 26.8 8.5 (13.8) — 21.5
December 31, 2018 . . . . . . . . . . . . . . . . . . . . . . . . . . . . . . . . 32.1 11.8 (16.8) (0.3) 26.8
S-1
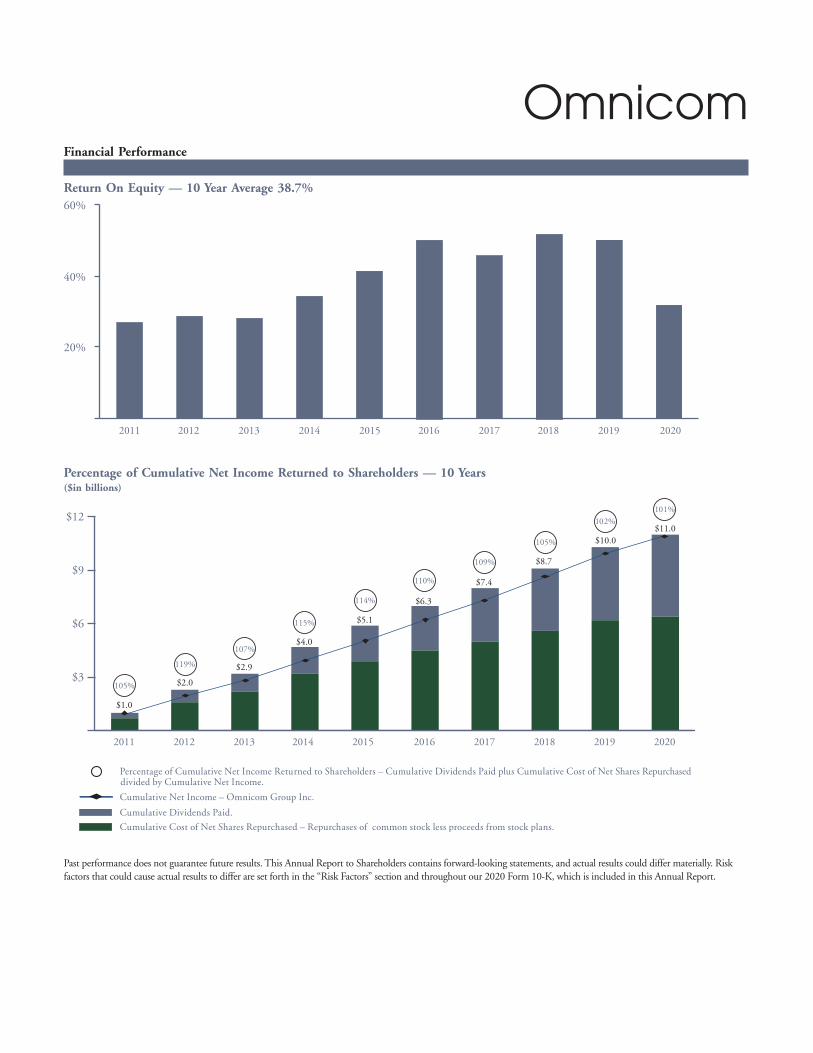
Financial Performance
Return On Equity — 10 Year Average 38.7%
20%
40%
60%
2020201920182017201620152014201320122011
Percentage of Cumulative Net Income Returned to Shareholders — 10 Years($in billions)
Cumulative Cost of Net Shares Repurchased – Repurchases of common stock less proceeds from stock plans.
Cumulative Dividends Paid.
Cumulative Net Income – Omnicom Group Inc.
Percentage of Cumulative Net Income Returned to Shareholders – Cumulative Dividends Paid plus Cumulative Cost of Net Shares Repurchased divided by Cumulative Net Income.
$3
$6
$9
$12
2020201920182017201620152014201320122011
$1.0
105% $2.0
119%
$4.0
115% $5.1
114% $6.3
110% $7.4
109% $8.7
105% $10.0
102%$11.0
101%
$2.9
107%
Past performance does not guarantee future results. This Annual Report to Shareholders contains forward-looking statements, and actual results could differ materially. Riskfactors that could cause actual results to differ are set forth in the “Risk Factors” section and throughout our 2020 Form 10-K, which is included in this Annual Report.
Omnicom
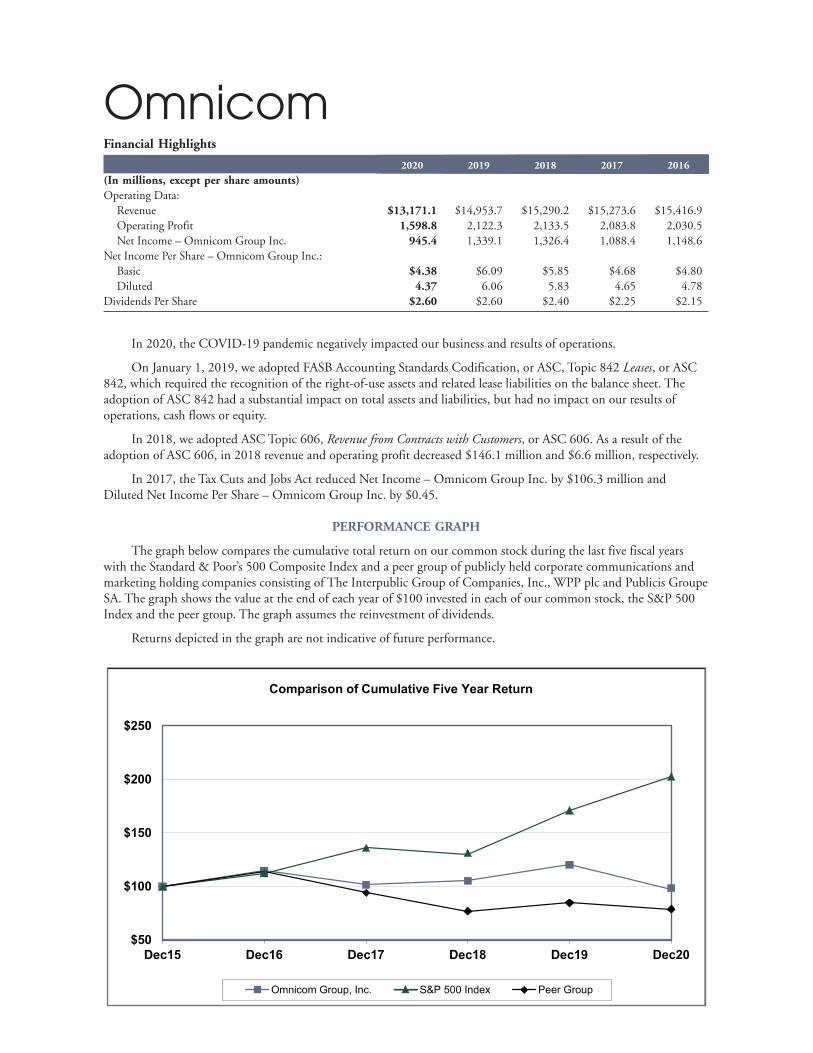
Financial Highlights
2020 2019 2018 2017 2016
(In millions, except per share amounts)Operating Data:
Revenue $13,171.1 $14,953.7 $15,290.2 $15,273.6 $15,416.9Operating Profit 1,598.8 2,122.3 2,133.5 2,083.8 2,030.5Net Income – Omnicom Group Inc. 945.4 1,339.1 1,326.4 1,088.4 1,148.6
Net Income Per Share – Omnicom Group Inc.:Basic $4.38 $6.09 $5.85 $4.68 $4.80Diluted 4.37 6.06 5.83 4.65 4.78
Dividends Per Share $2.60 $2.60 $2.40 $2.25 $2.15
In 2020, the COVID-19 pandemic negatively impacted our business and results of operations.
On January 1, 2019, we adopted FASB Accounting Standards Codification, or ASC, Topic 842 Leases, or ASC842, which required the recognition of the right-of-use assets and related lease liabilities on the balance sheet. Theadoption of ASC 842 had a substantial impact on total assets and liabilities, but had no impact on our results ofoperations, cash flows or equity.
In 2018, we adopted ASC Topic 606, Revenue from Contracts with Customers, or ASC 606. As a result of theadoption of ASC 606, in 2018 revenue and operating profit decreased $146.1 million and $6.6 million, respectively.
In 2017, the Tax Cuts and Jobs Act reduced Net Income – Omnicom Group Inc. by $106.3 million andDiluted Net Income Per Share – Omnicom Group Inc. by $0.45.
PERFORMANCE GRAPH
The graph below compares the cumulative total return on our common stock during the last five fiscal yearswith the Standard & Poor’s 500 Composite Index and a peer group of publicly held corporate communications andmarketing holding companies consisting of The Interpublic Group of Companies, Inc., WPP plc and Publicis GroupeSA. The graph shows the value at the end of each year of $100 invested in each of our common stock, the S&P 500Index and the peer group. The graph assumes the reinvestment of dividends.
Returns depicted in the graph are not indicative of future performance.
$50
$100
$150
$200
$250
Dec15 Dec16 Dec17 Dec18 Dec19 Dec20
Comparison of Cumulative Five Year Return
Omnicom Group, Inc. S&P 500 Index Peer Group
Omnicom
Board Of Directors
JOHN D. WRENChairman and Chief Executive Officer, Omnicom Group Inc.
LEONARD S. COLEMAN, JR.‡Former President, National League ofProfessional Baseball Clubs
MARY C. CHOKSIFormer Founding Partner and Senior Manager,Strategic Investment Group
SUSAN S. DENISONFormer Partner, Cook Associates
RONNIE S. HAWKINSManaging Director, Global Infrastructure Partners
DEBORAH J. KISSIREFormer Vice Chair and Regional Managing Partner, EY
GRACIA C. MARTOREFormer President and Chief Executive Officer, TEGNA Inc.
LINDA JOHNSON RICEChief Executive Officer, Johnson Publishing Company
VALERIE M. WILLIAMSFormer Southwest Assurance Managing Partner, EY ‡ Lead Independent Director
Officers
JOHN D. WRENChairman and Chief Executive Officer
PHILIP J. ANGELASTROExecutive Vice President and Chief Financial Officer
ASIT MEHRAExecutive Vice President
JONATHAN B. NELSONChief Executive Officer, Omnicom Digital
MICHAEL J. O’BRIENExecutive Vice President, General Counsel and Secretary
RITA E. RODRIGUEZExecutive Vice President
ADRIAN SAPOLLNIKExecutive Vice President, Strategy and Corporate Development
PETER K. SHERMANExecutive Vice President
ANDREW L. CASTELLANETASenior Vice President, Chief Accounting Officer
CRAIG CUYARSenior Vice President and Global Chief Information Officer
EMILY K. GRAHAMChief Equity and Impact Officer and Senior Vice President,Diversity and Inclusion Communications
ERIC HUTTNERSenior Vice President - Finance
STEPHEN MEDHURSTSenior Vice President of Treasury – Europe and Asia
MAEVE C. ROBINSONSenior Vice President - Finance
PETER L. SWIECICKISenior Vice President, Finance and Controller
ROCHELLE M. TARLOWESenior Vice President and Treasurer
JOHN C. WYNNESenior Vice President – Tax
Committees Of The Board
AUDITMary C. Choksi, ChairDeborah J. KissireGracia C. MartoreValerie M. Williams
COMPENSATIONSusan S. Denison, ChairMary C. ChoksiLeonard S. Coleman, Jr.Linda Johnson Rice
FINANCEGracia C. Martore, ChairRonnie S. HawkinsDeborah J. KissireValerie M. Williams
GOVERNANCELeonard S. Coleman, Jr., ChairSusan S. DenisonRonnie S. HawkinsLinda Johnson Rice
Omnicom
Corporate Information
PRINCIPAL EXECUTIVE OFFICES
OMNICOM GROUP INC.280 Park AvenueNew York, New York 10017Tel: (212) 415-3600
OMNICOM GROUP INC.1055 Washington BoulevardStamford, Connecticut 06901Tel: (203) 618-1500
OMNICOM GROUP INC.525 Okeechobee BoulevardSuite 870West Palm Beach, Florida 33411Tel: (561) 207-2200
OMNICOM EUROPE LIMITED
Bankside 390-100 Southwark StreetLondon, Se1 0SWUnited KingdomTel: +44(0) 20 7298 7007
OMNICOM ASIA PACIFIC – SINGAPORE
Creative Centre At PicoLobby B Level 820 Kallang AvenueSingapore 339411Tel: +65 6671 4417 www.omnicomgroup.com
ANNUAL MEETING
The Annual Meeting of Shareholders will beheld on Tuesday, May 4, 2021, at10 A.M. Eastern Daylight Time atOmnicom Group Inc.280 Park AvenueNew York, New York 10017
Shareholders may also attend online atwww.virtualshareholdermeeting.com/OMC2021
SEC CERTIFICATIONS
The certifications by the Chairman and Chief Executive Officerand the Executive Vice President and Chief Financial Officer ofOmnicom Group Inc., required under Sections 302 and 906 ofthe Sarbanes-Oxley Act of 2002, have been filed as exhibits tothe company’s 2020 Annual Report on Form 10-K.
NYSE CERTIFICATION
After the 2021 Annual Meeting of Shareholders, Omnicomintends to file with the New York Stock Exchange (NYSE) theCEO certification regarding Omnicom’s compliance with theNYSE’s corporate governance listing standards as required byNYSE rule 303A.12. Last year, the Chairman and ChiefExecutive Officer of Omnicom submitted this certification tothe NYSE on June 25, 2020
STOCK LISTING
Omnicom common stock is traded on the New York StockExchange. The ticker symbol is OMC.
TRANSFER AGENT & REGISTRAR
Equiniti Trust CompanyEQ Shareowner ServicesPO Box 64854, St. Paul, Minnesota 55164-0854www.shareowneronline.com
INVESTOR SERVICES PROGRAM
An Investor Services Program, which includes direct stockpurchase and dividend reinvestment features, is available toshareholders of record and other interested investors. For furtherinformation, please contact EQ Shareowner Services at800.468.9716 or go to www.shareowneronline.com.
STOCK TRANSFER MATTERS/CHANGE OF ADDRESS
To assist you in handling matters relating to stock transfer orchange of address, please write to or call our transfer agent:EQ Shareowner ServicesPO Box 64854, St. Paul, Minnesota 55164-0854 800.468.9716Or, by courier to:EQ Shareowner Services1110 Centre Pointe Curve, Suite 101Mendota Heights, Minnesota 55120-4100
INDEPENDENT AUDITORS
KPMG LLP345 Park AvenueNew York, New York 10154
Printed on Recycled Paper
Omnicom