Embed Size (px)
Citation preview
Secretariat of Commerce and Services
Ministry of Development, Industry and Foreign Trade of
Brazil
SISCOSERV – Statistics
Seminar on developments in trade in services statistics
and the way forward
Geneva, 19 September 2014
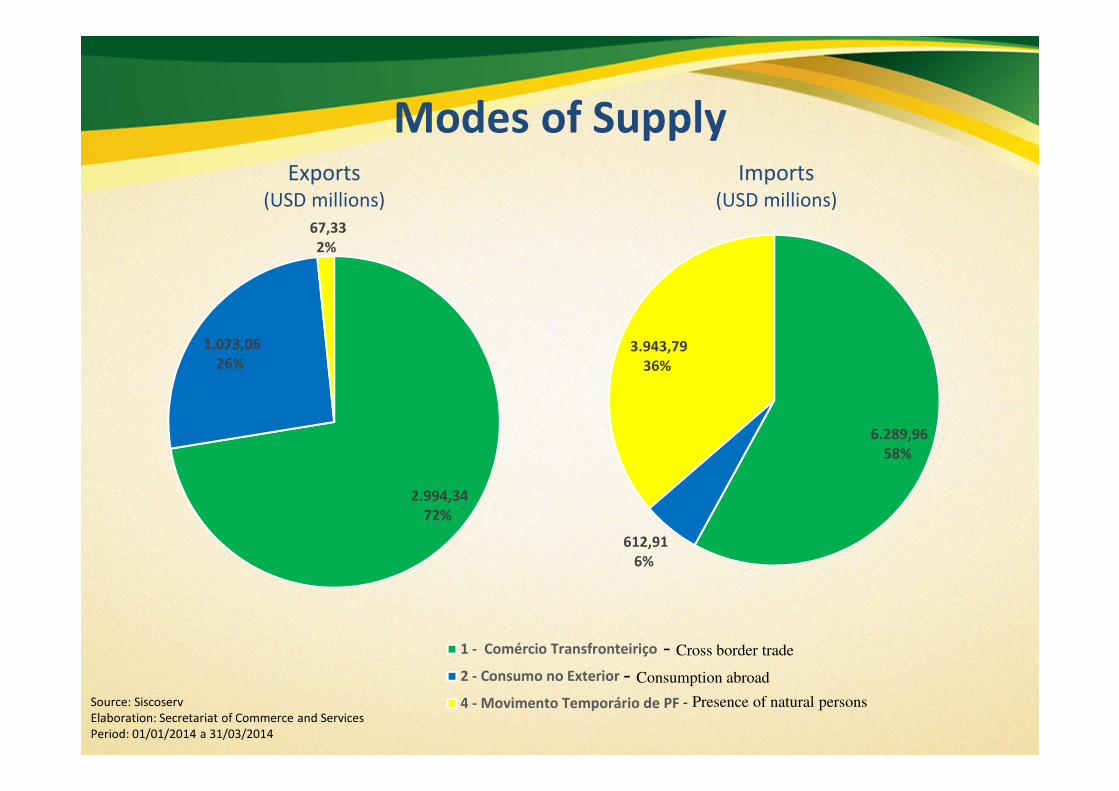
Modes of SupplyExports
(USD millions)
Imports(USD millions)
Source: Siscoserv
Elaboration: Secretariat of Commerce and Services
Period: 01/01/2014 a 31/03/2014
2.994,34
72%
1.073,06
26%
67,33
2%
1 - Comércio Transfronteiriço
2 - Consumo no Exterior
4 - Movimento Temporário de PF
6.289,96
58%
612,91
6%
3.943,79
36%
- Cross border trade
- Consumption abroad
- Presence of natural persons

NBS Code CPC Prov.Number
of sellers
Value
(USD
millions)
Share
11.1409 - Outros serviços
profissionais, técnicos e gerenciais8790 - Other business services
1397 482 11,66%
2
1.1401 - Serviços gerenciais, de
consultoria gerencial, de relações
públicas e de comunicação social
8650 - Management consulting
services792 409 9,90%
31.0502 - Serviços de transporte
aquaviário de cargas72 - Water transport services
520 399 9,66%
4
1.0905 - Serviços auxiliares aos
serviços financeiros, exceto os
relacionados a seguros e
previdência complementar
813 - Services auxiliary to financial
intermediation other than to
insurance and pension funding255 398 9,63%
51.0601 - Serviços de manuseio de
cargas741 - Cargo handling services
117 199 4,82%
61.0605 - Serviços de apoio para
transportes aquaviários
745 - Supporting services for water
transport 229 170 4,12%
SISCOSERV Statistics (1st quarter of 2014)
- Main services and intangibles exported by Brazil -
Source: Siscoserv / Elaboration: Secretariat of Commerce and Services
Period: 01/01/2014 a 31/03/2014

NBS Code CPC Prov.Number
of sellers
Value
(USD
millions)
Share
7
1.2001 - Serviços de manutenção e
reparação de produtos metálicos,
maquinário e equipamentos
886 - Repair services incidental to
metal products, machinery and
equipment 332 159 3,87%
8
1.1501 - Serviços de consultoria, de
segurança e de suporte em
tecnologia da informação (TI)
841 - Consultancy services related to
the installation of computer hardware
842 - Software implementation
services 284 151 3,67%
9
1.1201 - Serviços de pesquisa e
desenvolvimento em ciências
naturais, exatas e engenharia
851 - Research and experimental
development services on natural
sciences and engineering 108 142 3,44%
101.1805 - Outros serviços de apoio
(Other supporting services)
17100Partial correlation, 17200Partial,
18000Partial 75490 84910 87901 87903
87904 87906 87909Partial 88110Partial
96499Partial 377 134 3,26%
SISCOSERV Statistics (1st quarter of 2014)
- Main services and intangibles exported by Brazil -
Source: Siscoserv / Elaboration: Secretariat of Commerce and Services
Period: 01/01/2014 a 31/03/2014

NBS Code CPC Prov.Number of
Purchasers
Value
(USD
millions)
Share
1
1.1101 - Arrendamento mercantil
operacional ou locação de máquinas e
equipamentos, sem operador
831 - Leasing or rental services
concerning machinery and
equipment without operator 278 5.078 46,82%
21.0502 - Serviços de transporte
aquaviário de cargas72 - Water transport services
1878 1.247 11,50%
31.1103 - Licenciamento de direitos de
autor e direitos conexos8923 - Copyrights
1052 777 7,16%
41.0503 - Serviços de transportes
aéreo de cargas732 - Freight transportation by air
1234 275 2,54%
5
1.1110 - Contratos de transferência
de tecnologia (Technology transfer
agreement)
8929 – Other non financial
intangible assets (Partial correlation)195 247 2,28%
61.1804 - Serviços de planejamento de
viagens e de operador de turismo
74710Partial correlation 74720
91136Partial 96193Partial 96194Partial
9619Partial 96321 96331 96332
96413Partial 96491 96194Partial 123 245 2,26%
SISCOSERV Statistics (1st quarter of 2014)
- Main services and intangibles imported by Brazil -
Source: Siscoserv / Elaboration: Secretariat of Commerce and Services
Period: 01/01/2014 a 31/03/2014

NBS Code CPC Prov.Number of
Purchasers
Value
(USD
millions)
Share
7
1.1406 - Serviços de propaganda e
de alocação de espaço ou tempo
para propaganda
871 - Advertising services
384 217 2,01%
8
1.1105 - Licenciamento de direitos
sobre a propriedade industrial
(licencing of industrial property
rights)
8921 - Patents
8922 - Trademarks
8929 - Other non-financial intangible
assets (Partial – to include industrial
design) 231 216 2,00%
9
1.1409 - Outros serviços
profissionais, técnicos e gerenciais 879 - Other business services
1318 207 1,92%
10
1.1401 - Serviços gerenciais, de
consultoria gerencial, de relações
públicas e de comunicação social
865 - Management consulting
services753 206 1,91%
SISCOSERV Statistics (1st quarter of 2014)
- Main services and intangibles imported by Brazil -
Source: Siscoserv / Elaboration: Secretariat of Commerce and Services
Period: 01/01/2014 a 31/03/2014
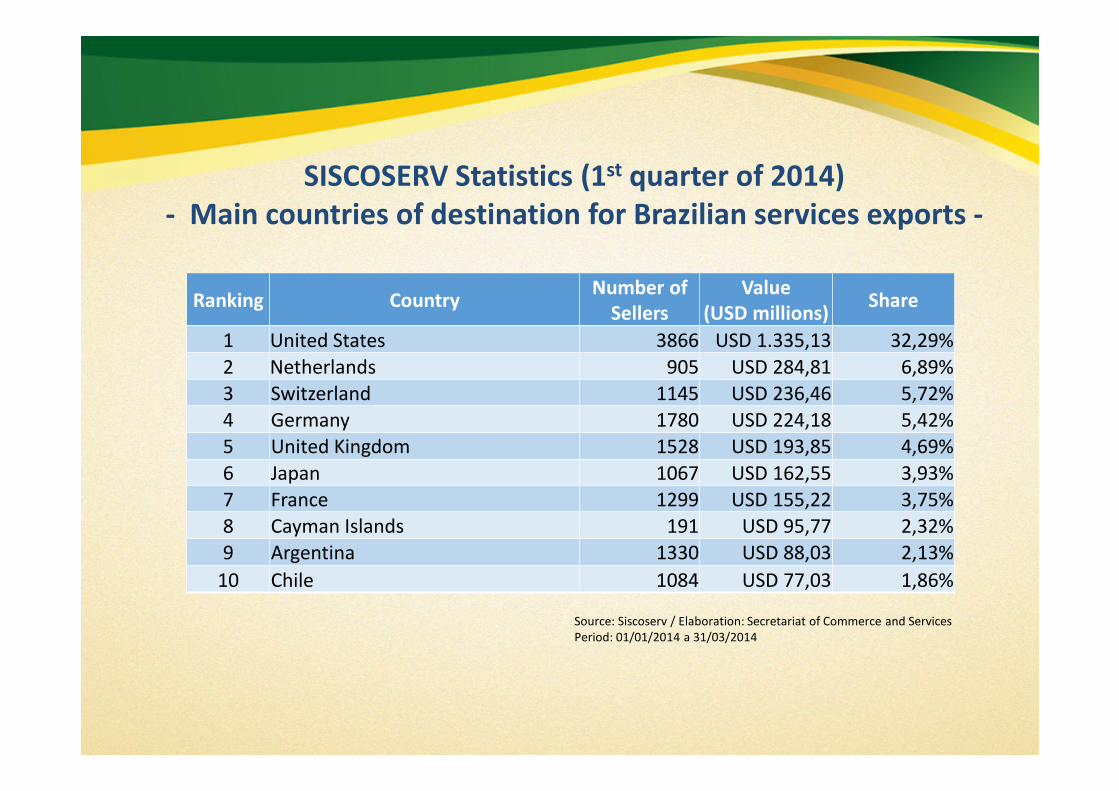
Ranking CountryNumber of
Sellers
Value
(USD millions)Share
1 United States 3866 USD 1.335,13 32,29%
2 Netherlands 905 USD 284,81 6,89%
3 Switzerland 1145 USD 236,46 5,72%
4 Germany 1780 USD 224,18 5,42%
5 United Kingdom 1528 USD 193,85 4,69%
6 Japan 1067 USD 162,55 3,93%
7 France 1299 USD 155,22 3,75%
8 Cayman Islands 191 USD 95,77 2,32%
9 Argentina 1330 USD 88,03 2,13%
10 Chile 1084 USD 77,03 1,86%
SISCOSERV Statistics (1st quarter of 2014)
- Main countries of destination for Brazilian services exports -
Source: Siscoserv / Elaboration: Secretariat of Commerce and Services
Period: 01/01/2014 a 31/03/2014

Country
Number of
Purchasers
Value
(USD millions) Share
1 United States 4827 USD 3.003,15 27,69%
2 Netherlands 735 USD 2.971,20 27,39%
3 United Kingdom 1596 USD 619,14 5,71%
4 Norway 180 USD 413,49 3,81%
5 France 1132 USD 406,38 3,75%
6 Switzerland 868 USD 392,79 3,62%
7 New Zeeland 76 USD 357,49 3,30%
8 Germany 1930 USD 353,66 3,26%
9 South Korea 383 USD 210,87 1,94%
10 Italy 1250 USD 191,69 1,77%
SISCOSERV Statistics (1st quarter of 2014)
- Main countries of origin of Brazilian services imports -
Source: Siscoserv / Elaboration: Secretariat of Commerce and Services
Period: 01/01/2014 a 31/03/2014

SISCOSERV Statistics (2013)
Main countries where the Brazilian Foreign Affiliates Trade in
Services are established
Ranking Country Revenue (USD) Share
1 Netherlands 10.549.061.449,60 39,76%
2 Venezuela 3.880.874.237,30 14,63%
3 Peru 1.835.276.887,39 6,92%
4 Angola 1.695.353.501,54 6,39%
5 United States 1.539.129.788,10 5,80%
6 Argentina 1.243.647.347,06 4,69%
7 Panama 1.074.625.793,02 4,05%
8 Cayman Islands 623.514.697,76 2,35%
9 Trinidad and Tobago 602.380.133,00 2,27%
10 Dominican Republic 402.508.630,33 1,52%
Source: Siscoserv / Elaboration: Secretariat of Commerce and Services
Period: 01/01/2014 a 31/03/2014

NBS Code CPC Prov. Revenue (USD) Share
1
1.1101 - Arrendamento mercantil
operacional ou locação de máquinas e
equipamentos, sem operador
831 - Leasing or rental services
concerning machinery and
equipment without operator 10.437.998.514,97 28,48%
2
1.0103 - Serviços de construção de
autoestradas (exceto autoestradas
elevadas), ruas, estradas, estradas férreas
e pistas de pouso e decolagem em
aeroportos
5131 - For highways (except
elevated highways), streets,
roads, railways and airfield
runways8.067.214.313,07 22,01%
3
1.0106 - Serviços de construção de
barragens, adutoras, sistemas de irrigação
e de outros sistemas de captação, adução,
contenção e armazenamento de água
51330 - For waterways, harbors,
dams and other water works
3.747.732.346,18 10,23%
41.0102 - Serviços de construção de
edificações não residenciais
Construction work of non
residential buildings
5123 5124 5125 5126 5127 5128
5129 1.545.689.860,14 4,22%
51.0101 - Serviços de construção de
edificações residenciais
Construction work of residential
buildings
5121 5122 1.518.386.617,71 4,14%
SISCOSERV Statistics (2013)
Main Services provided trough Brazilian Foreign Affiliates
Source: Siscoserv / Elaboration: Secretariat of Commerce and Services
Period: 01/01/2014 a 31/03/2014

NBS Code CPC Prov. Revenue (USD) Share
6
1.0901 - Serviços financeiros, exceto
bancos de investimento, serviços de
seguros e previdência complementar
Financial intermediation services,
except insurance and pension fund
services
8111partial 8112 8113 81199 1.282.321.943,90 3,50%
71.0105 - Serviços de construção de portos
e sua infraestrutura
51330 - For waterways, harbors,
dams and other water works
1.022.119.341,35 2,79%
8
1.0905 - Serviços auxiliares aos serviços
financeiros, exceto os relacionados a
seguros e previdência complementar
813 - Services auxiliary to financial
intermediation other than to
insurance and pension funding
961.920.778,63 2,62%
91.0127 - Serviços de tubulação para
fornecimento e escoamento de águas
5162 - Water plumbing and drain
laying work 921.489.346,00 2,51%
10
1.0107 - Serviços de construção de dutos e
linhas de comunicação de longo curso e de
linhas de transmissão de alta tensão
5134 - Construction work for long
distance pipelines, communication
and power lines (cables)
901.691.158,57 2,46%
SISCOSERV Statistics (2013)
Main Services provided trough Brazilian Foreign Affiliates
Source: Siscoserv / Elaboration: Secretariat of Commerce and Services
Period: 01/01/2014 a 31/03/2014
Thank you!
Secretariat of Commerce and Services
Ministry of Development, Industry and Foreign
Trade


![Core/Shell/Shell Nanomaterials of NaYF4: Yb, Er/Silica ...vibgyorpublishers.org/content/ijnn/ijnn-1-003.pdfand magnetic nanoparticles such as iron oxide [2,27] have been widely reported,](https://img.pdfslide.us/doc/110x75/5b1fbef37f8b9a112c8b5478/coreshellshell-nanomaterials-of-nayf4-yb-ersilica-magnetic-nanoparticles.jpg)

![The evolution of primate general and cultural intelligence · human cognition [2,27]. Primate genera differ in their performance in laboratory tests of cognition, with great apes](https://img.pdfslide.us/doc/110x75/5f3c774bd724df1213482bc8/the-evolution-of-primate-general-and-cultural-intelligence-human-cognition-227.jpg)