Embed Size (px)
Citation preview

Oluwakemi Izomo
Hans-Peter PlagOctober 20, 2014
Foresight: Cumulative Sea Level Equation
Vulnerability: The Example of Sea Level Rise
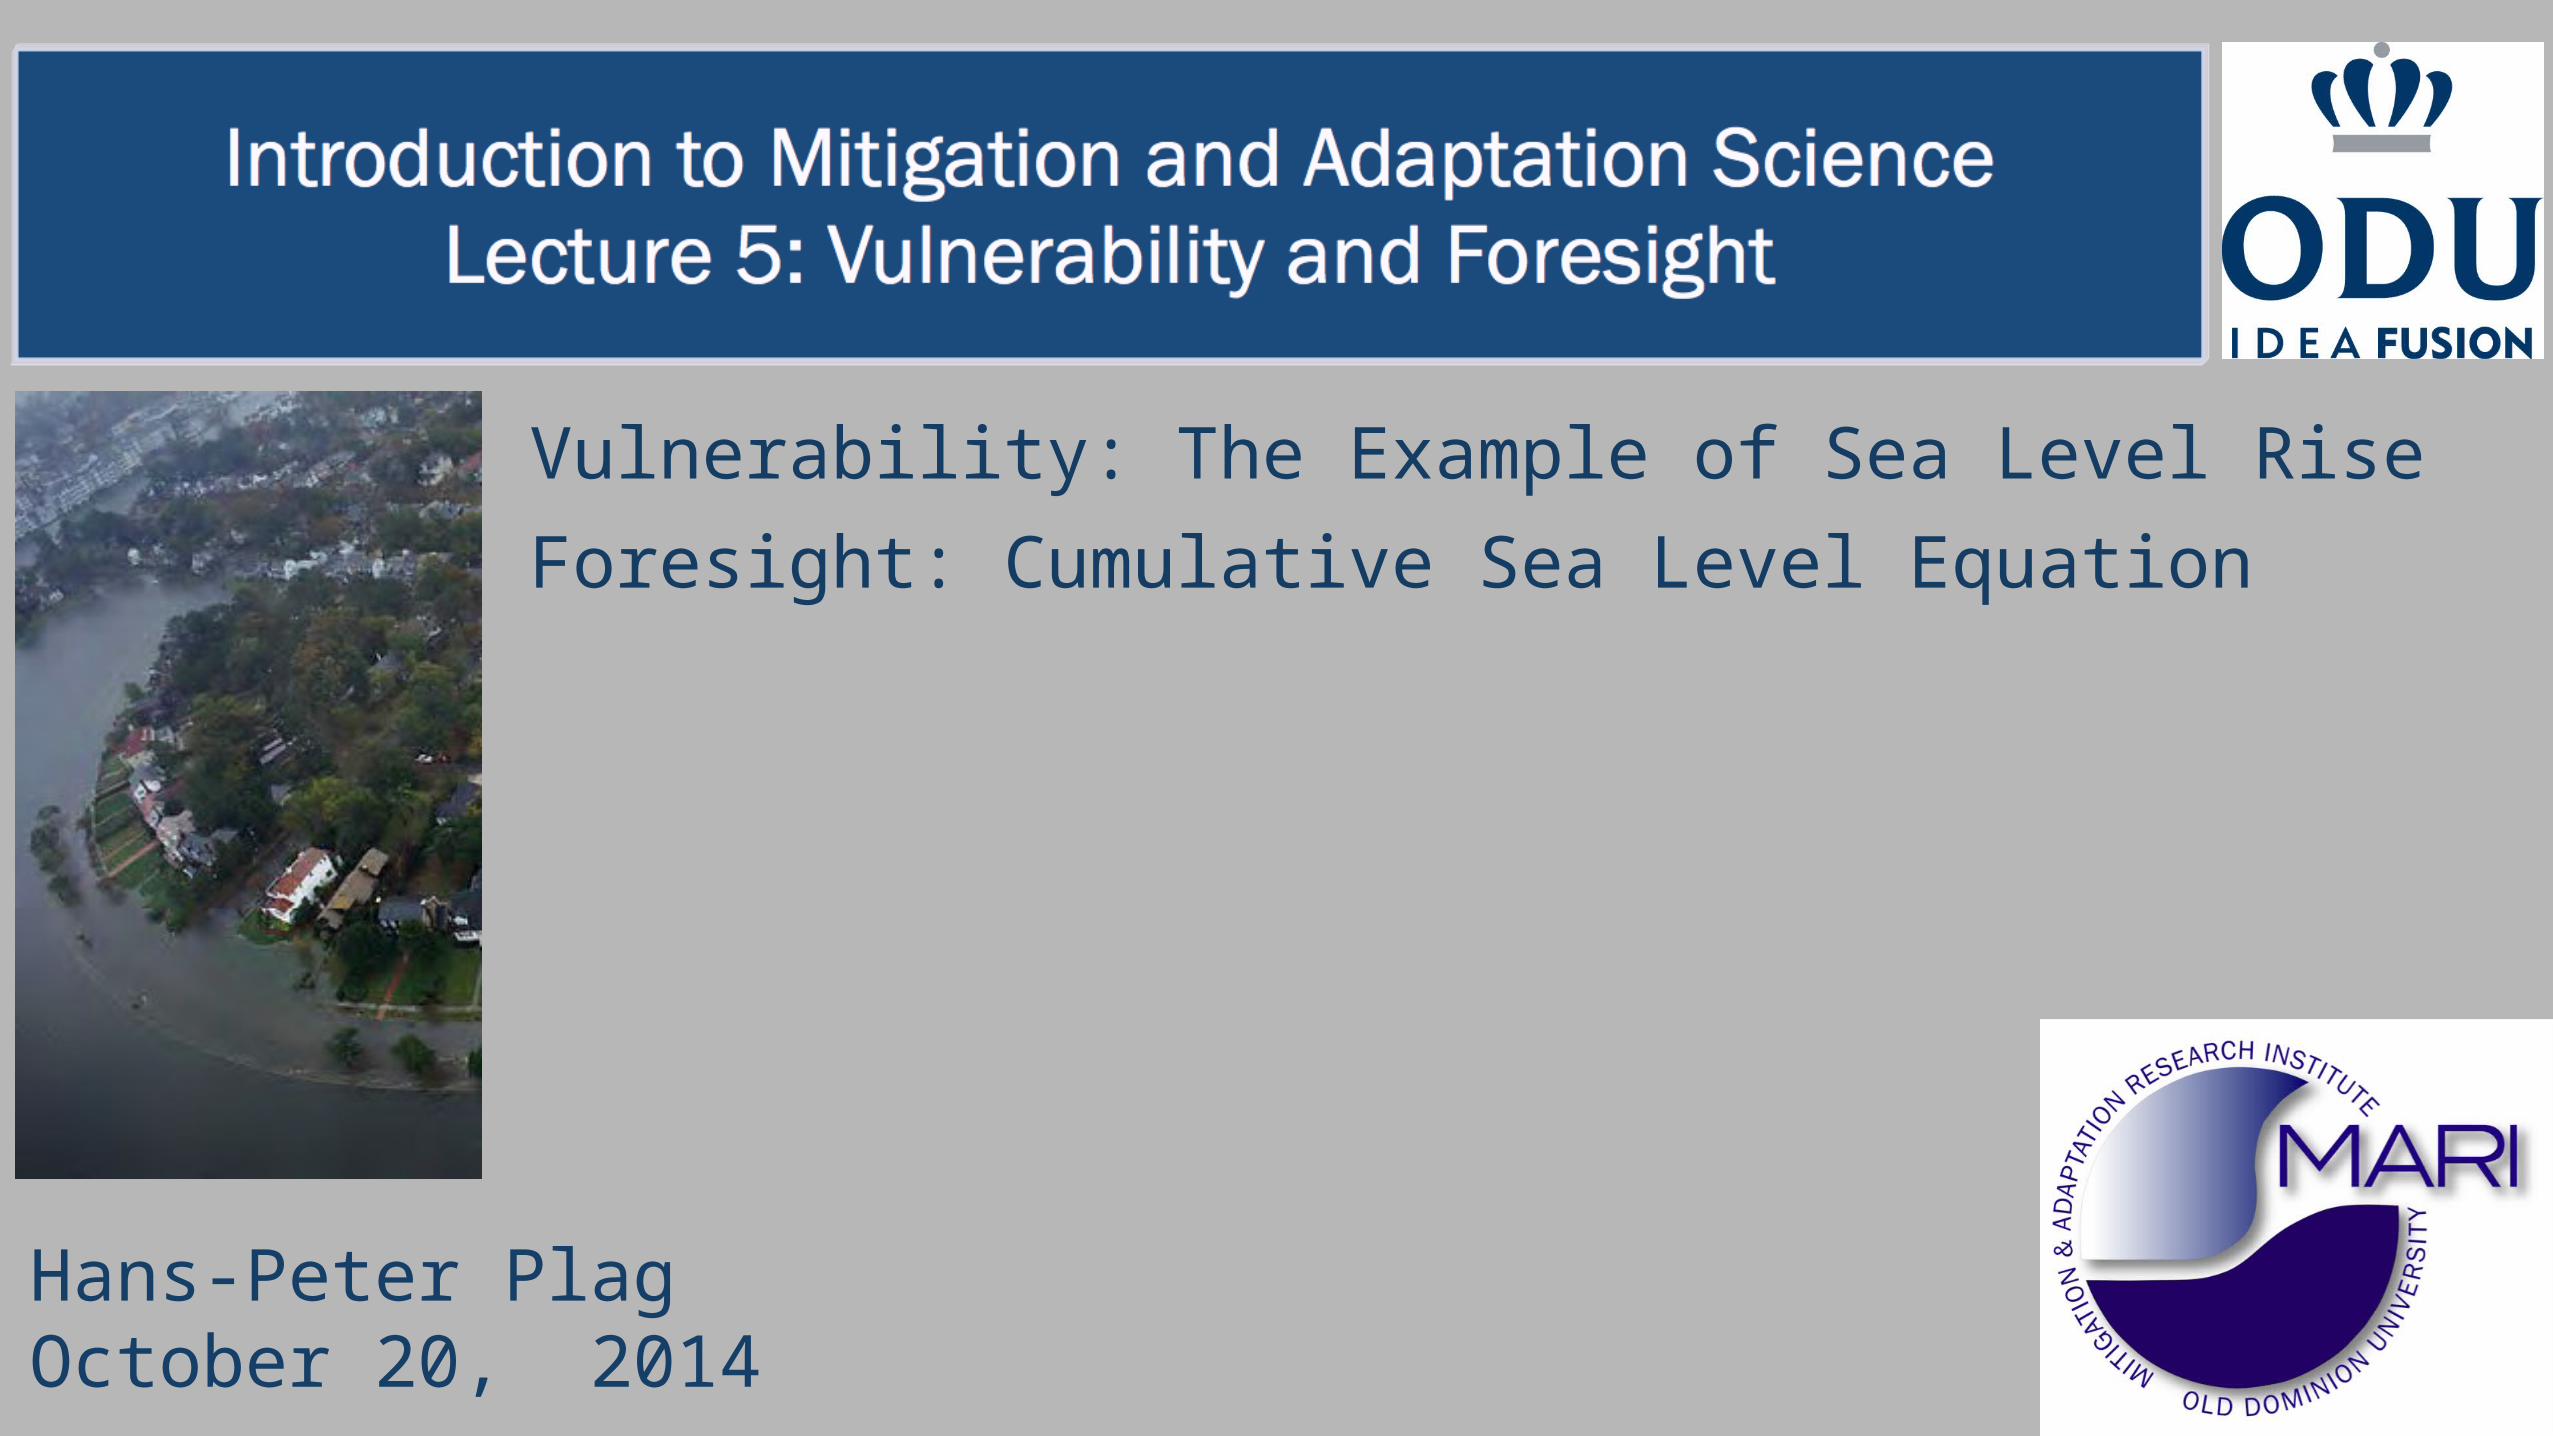
800 Years?
4.5 m
100 Years?How worried should we
be?
Accepted knowledge in 2000:Greenland: no significant contribution to sea level riseAntarctica: minor contributionMain contribution: steric changes
Knowledge in 2014:Greenland: is contributing, is accelerating, potentially a large contribution to sea level riseAntarctica: West Antarctic ice sheet (WAIS) will contribute 4.5 m
WAIS Contribution to Global Sea Level
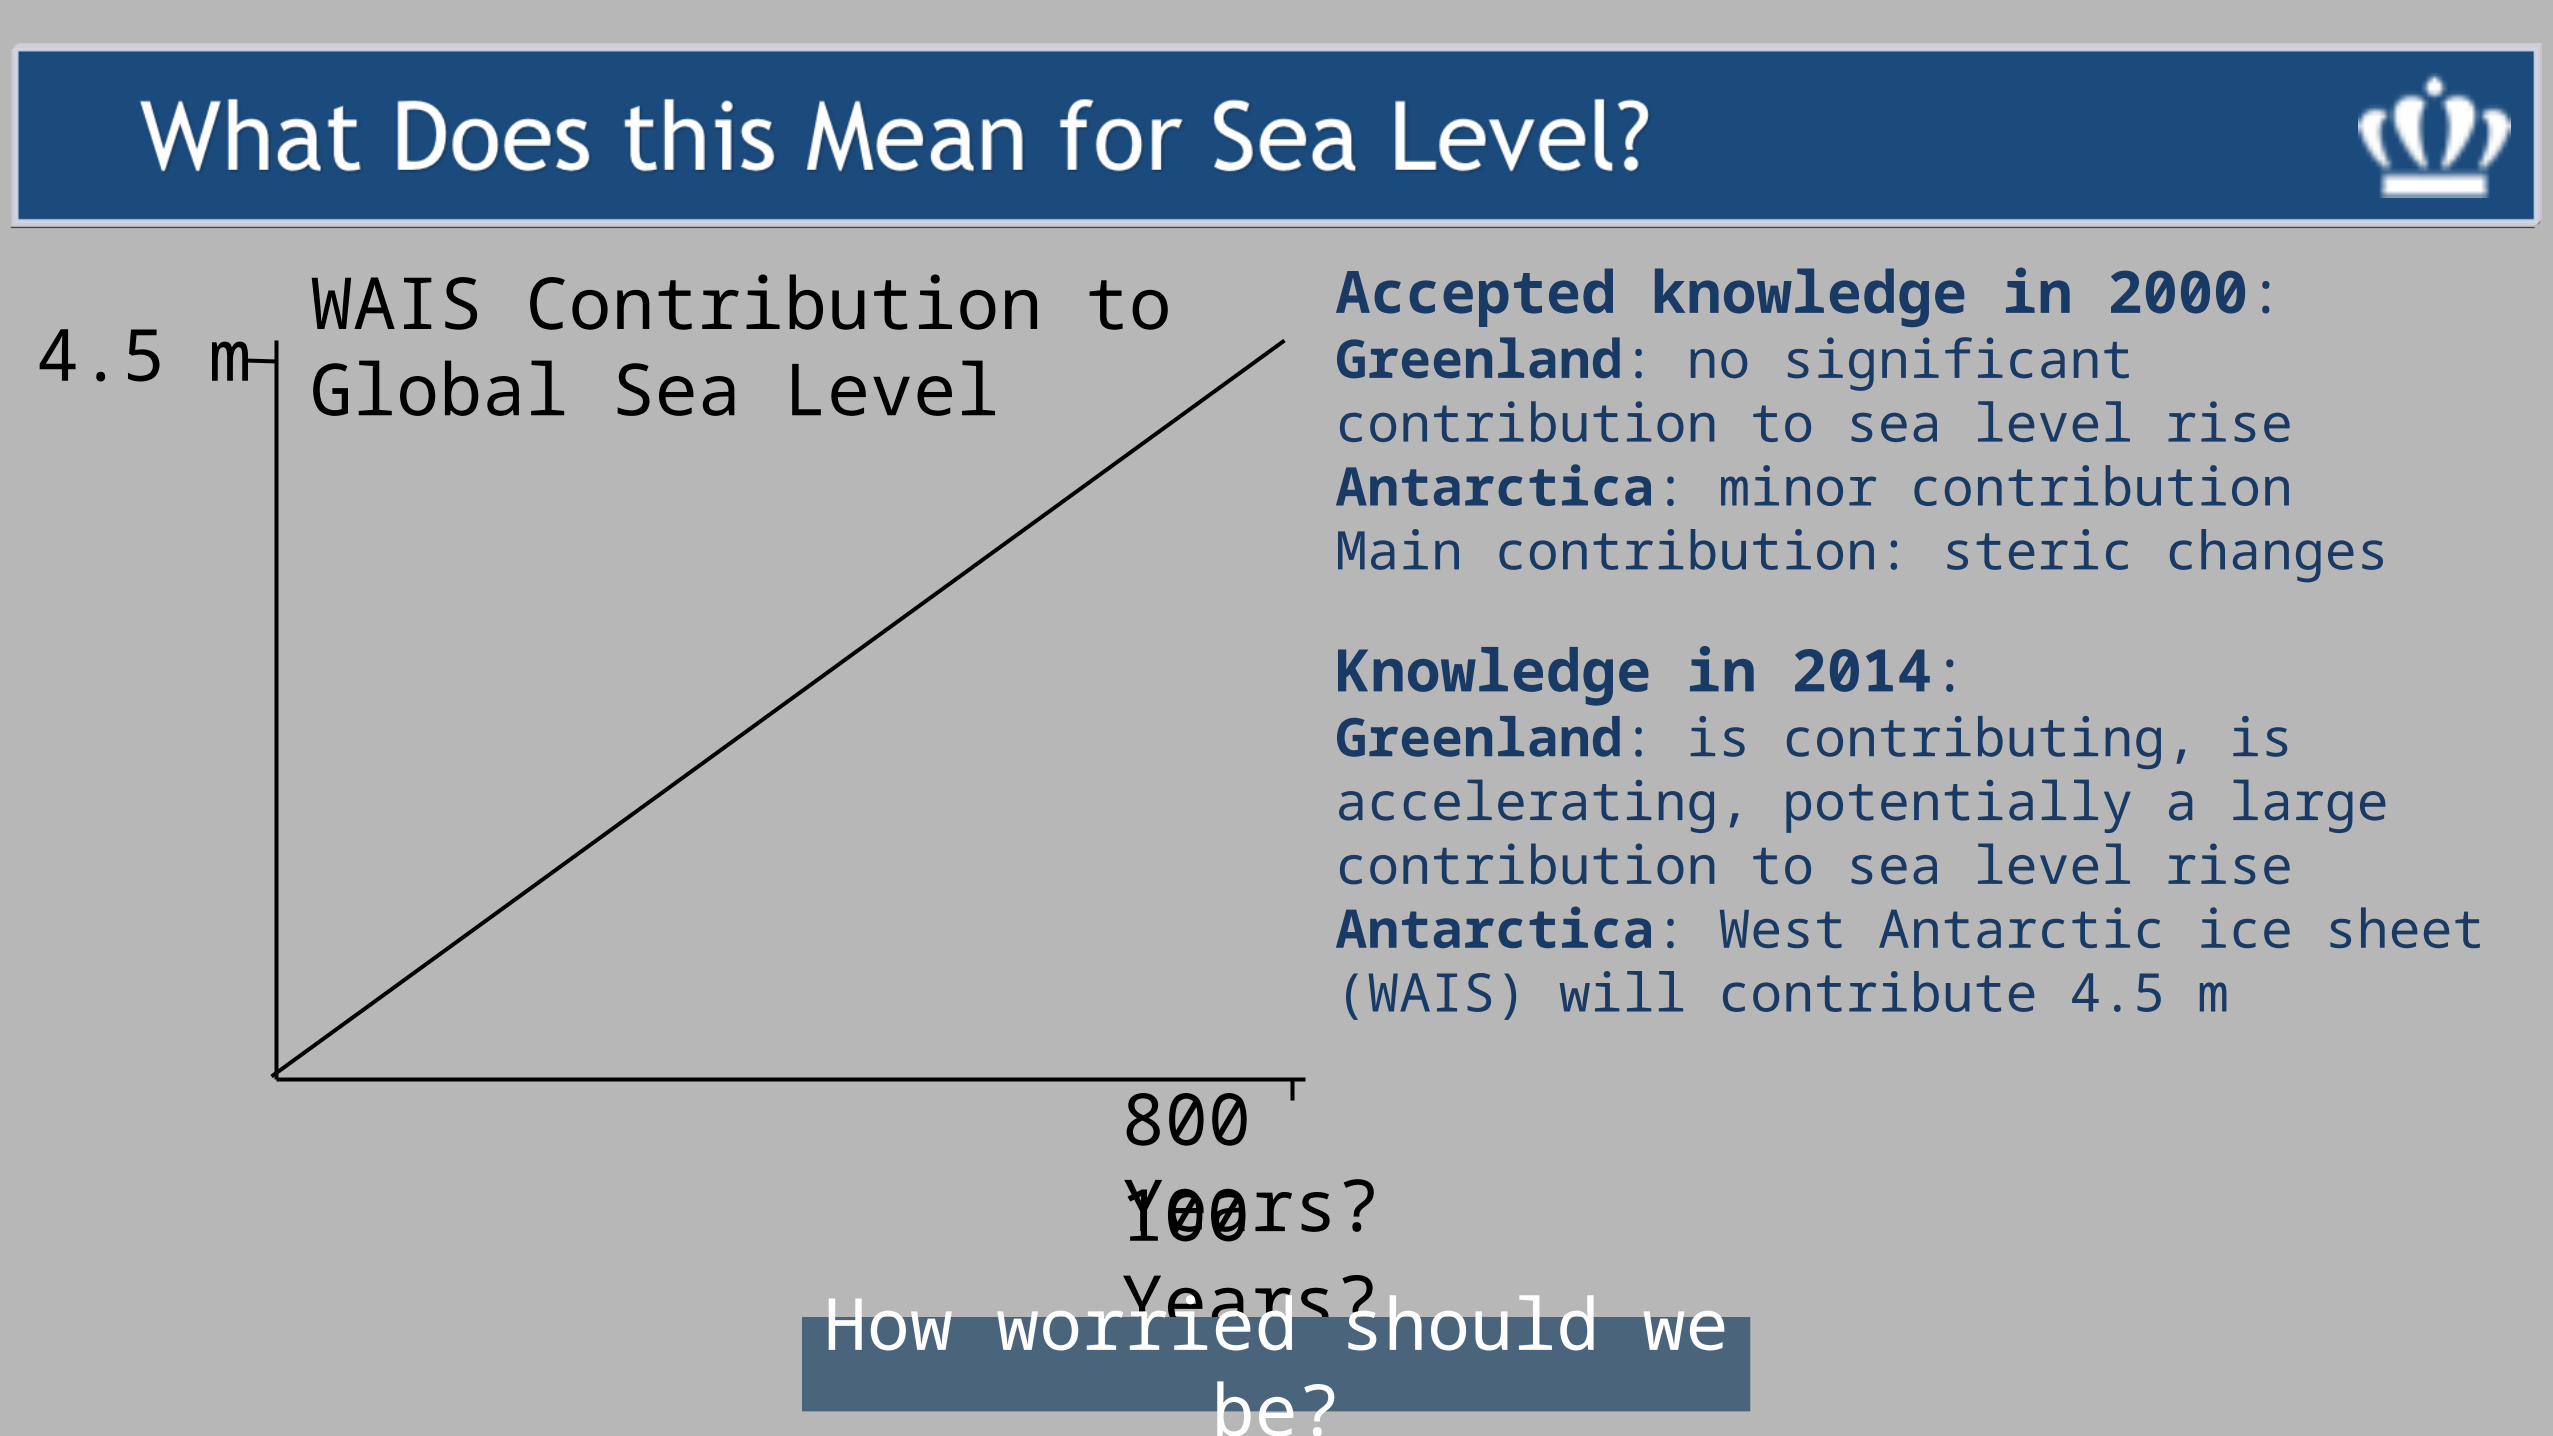
Modified from Church et al. (2010)
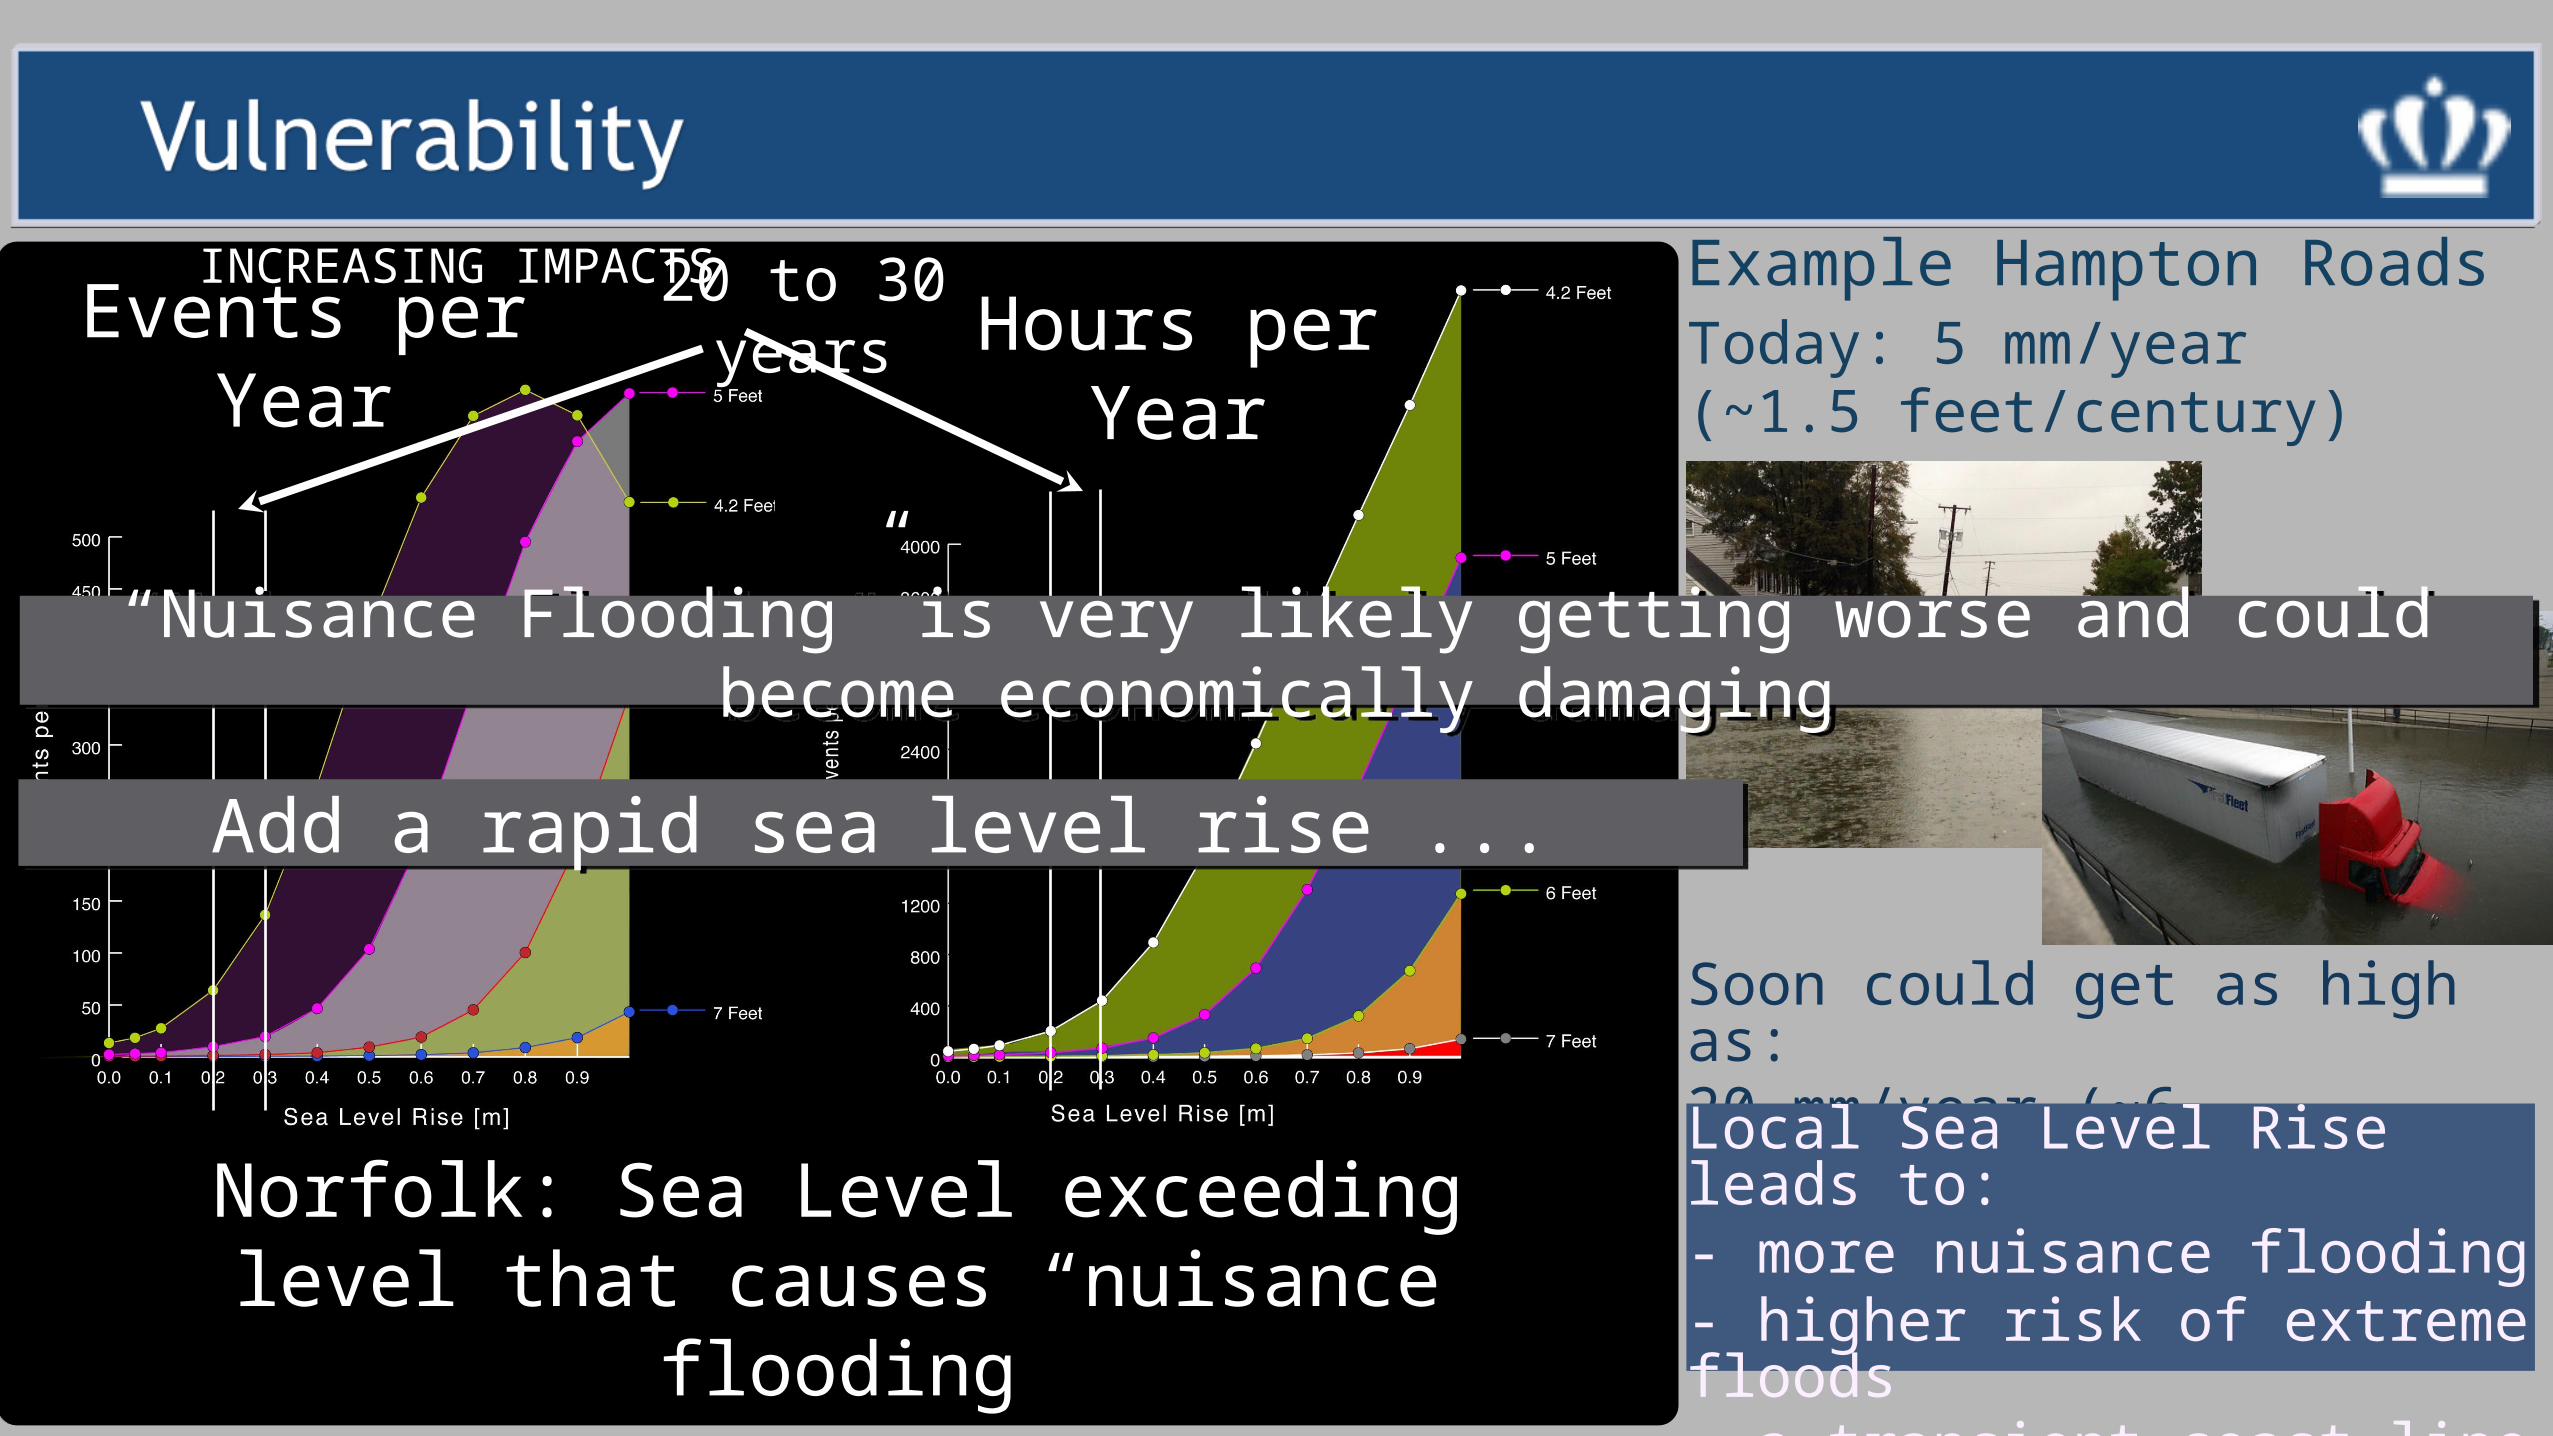
Example Hampton Roads
Soon could get as high as:20 mm/year (~6 feet/century)
Today: 5 mm/year(~1.5 feet/century)
Local Sea Level Rise leads to:- more nuisance flooding- higher risk of extreme floods- a transient coast line
Example Hampton Roads
Soon could get as high as:20 mm/year (~6 feet/century)
Today: 5 mm/year(~1.5 feet/century)
Local Sea Level Rise leads to:- more nuisance flooding- higher risk of extreme floods- a transient coast line
INCREASING IMPACTS 20 to 30 years
Norfolk: Sea Level exceeding level that causes “nuisance flooding
Events per Year
Hours per Year
“Nuisance Flooding” is very likely getting worse and could become economically damaging
“Nuisance Flooding” is very likely getting worse and could become economically damaging
Add a rapid sea level rise ...Add a rapid sea level rise ...


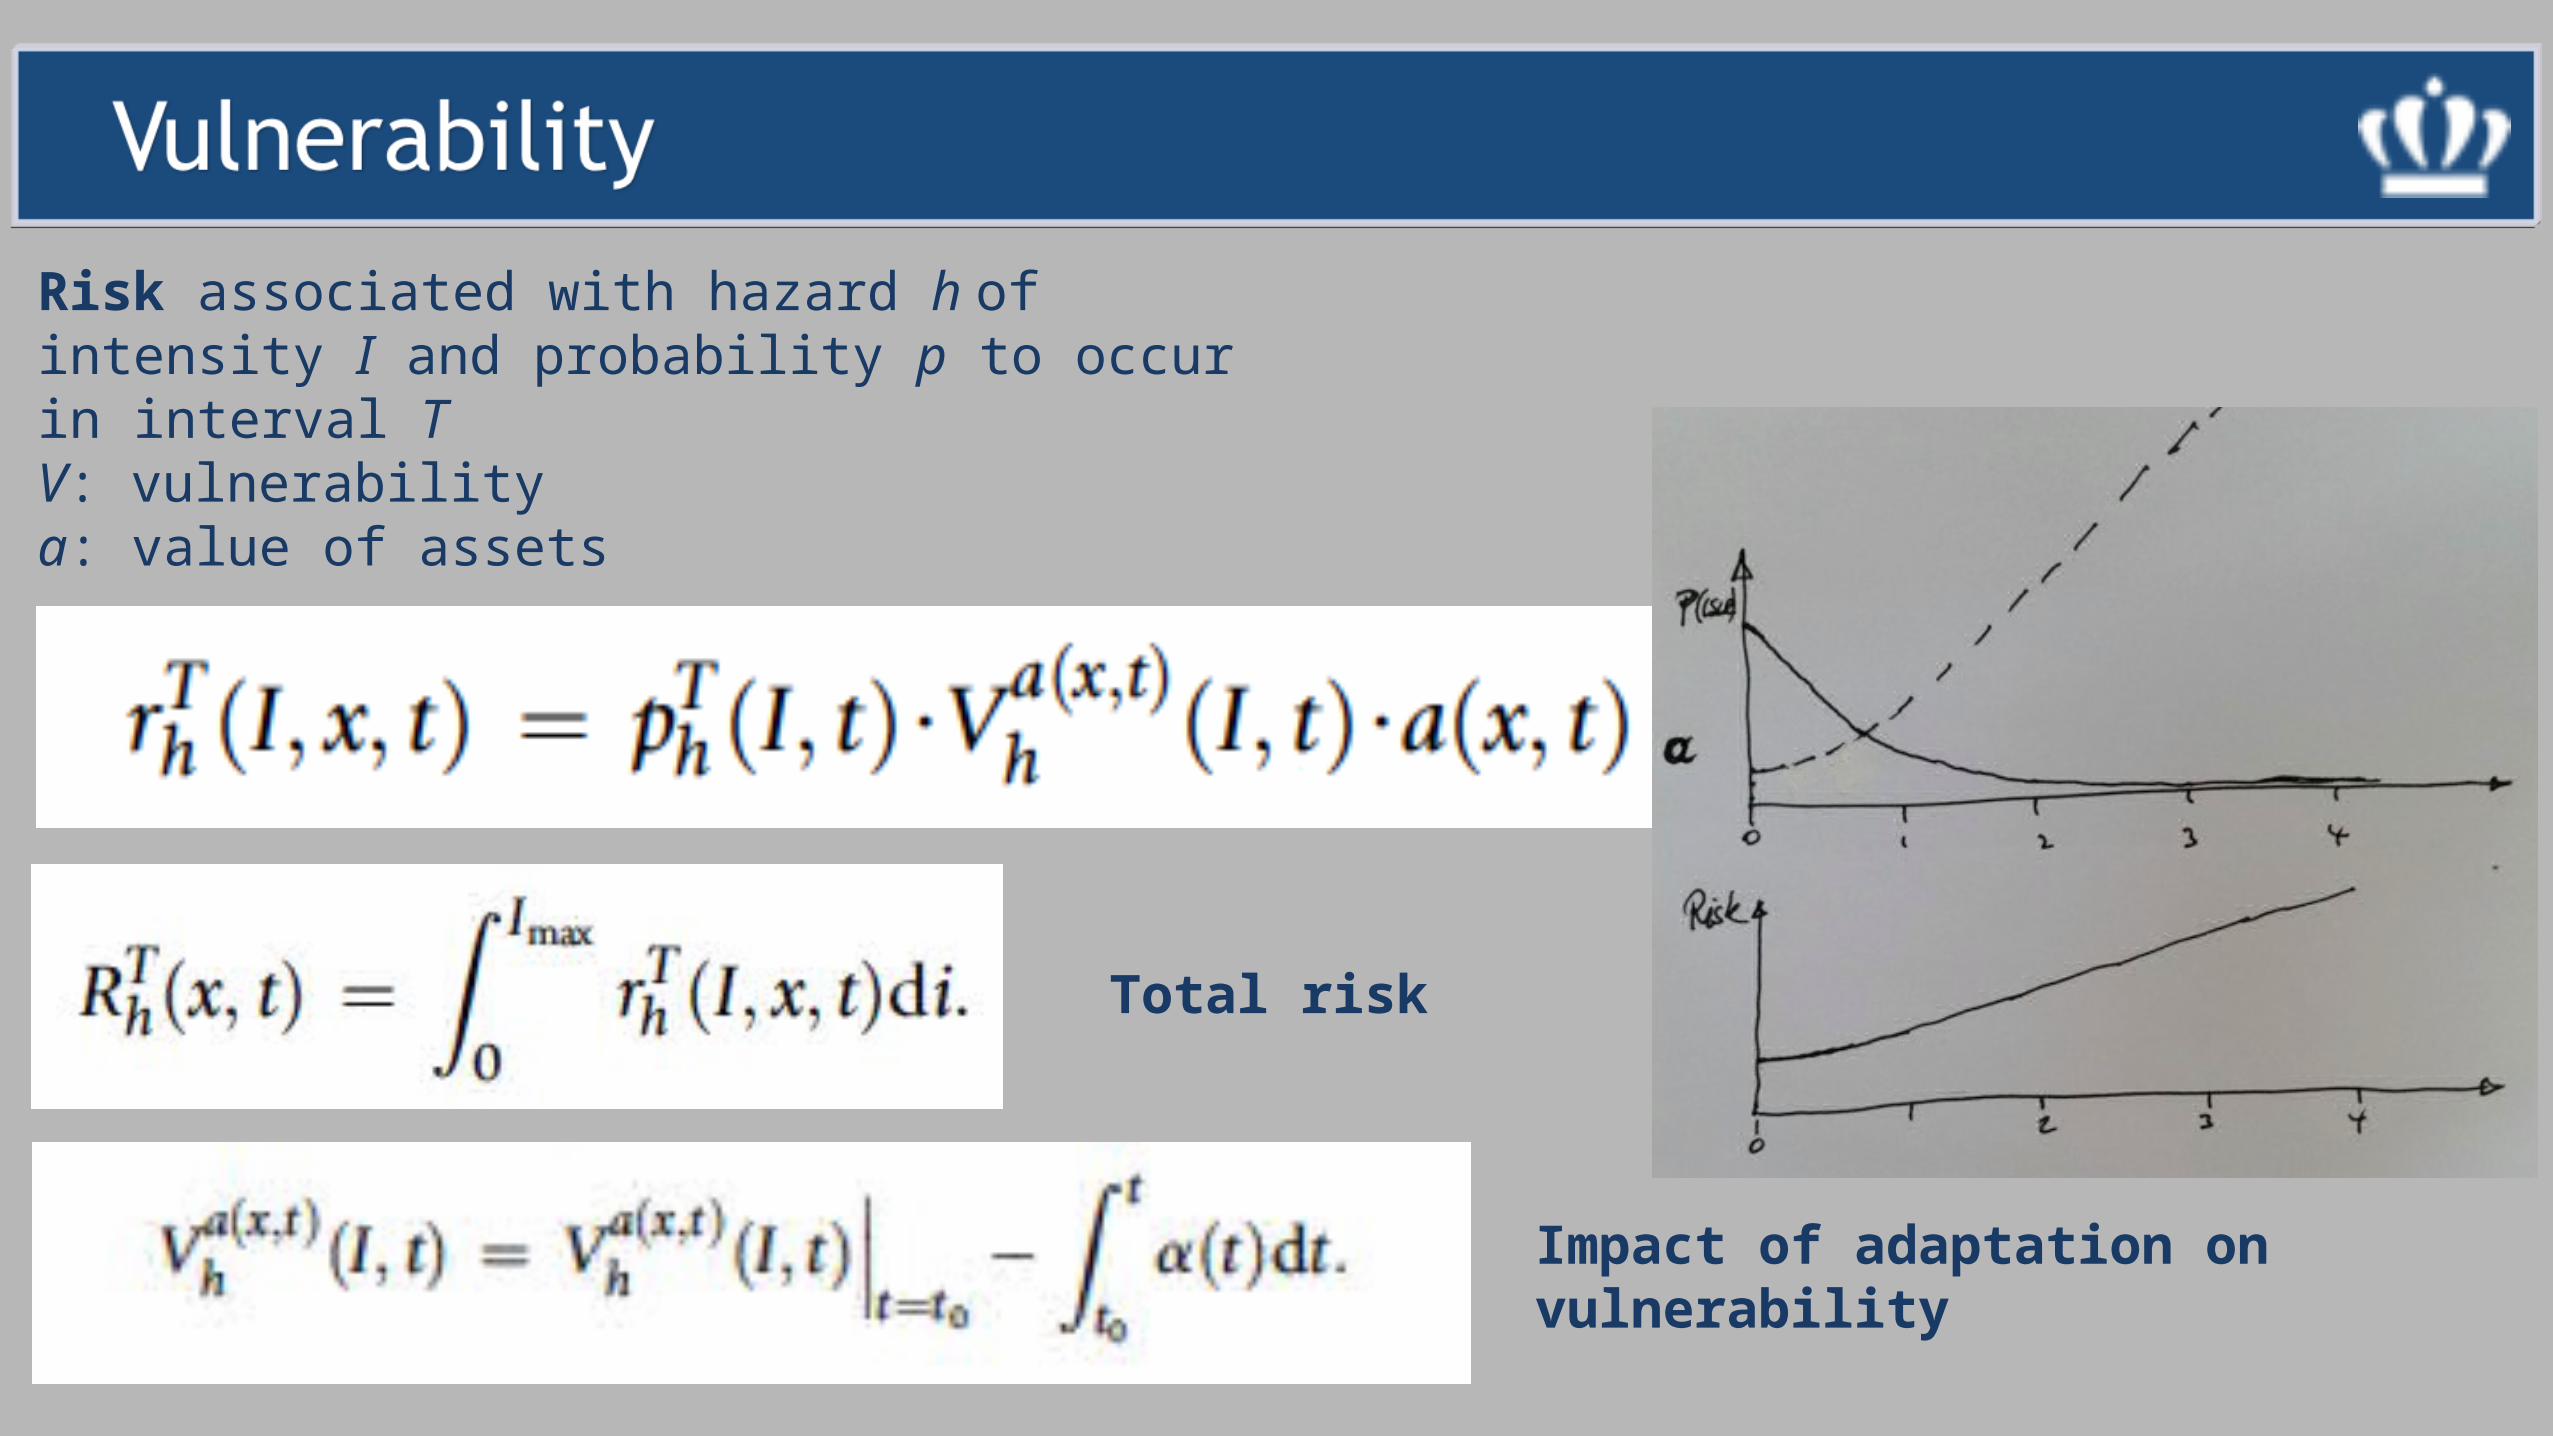
Risk associated with hazard h of intensity I and probability p to occur in interval TV: vulnerabilitya: value of assets
Total risk
Impact of adaptation on vulnerability
Risk associated with hazard h of intensity I and probability p to occur in interval TV: vulnerabilitya: value of assets
Total risk
Impact of adaptation on vulnerability
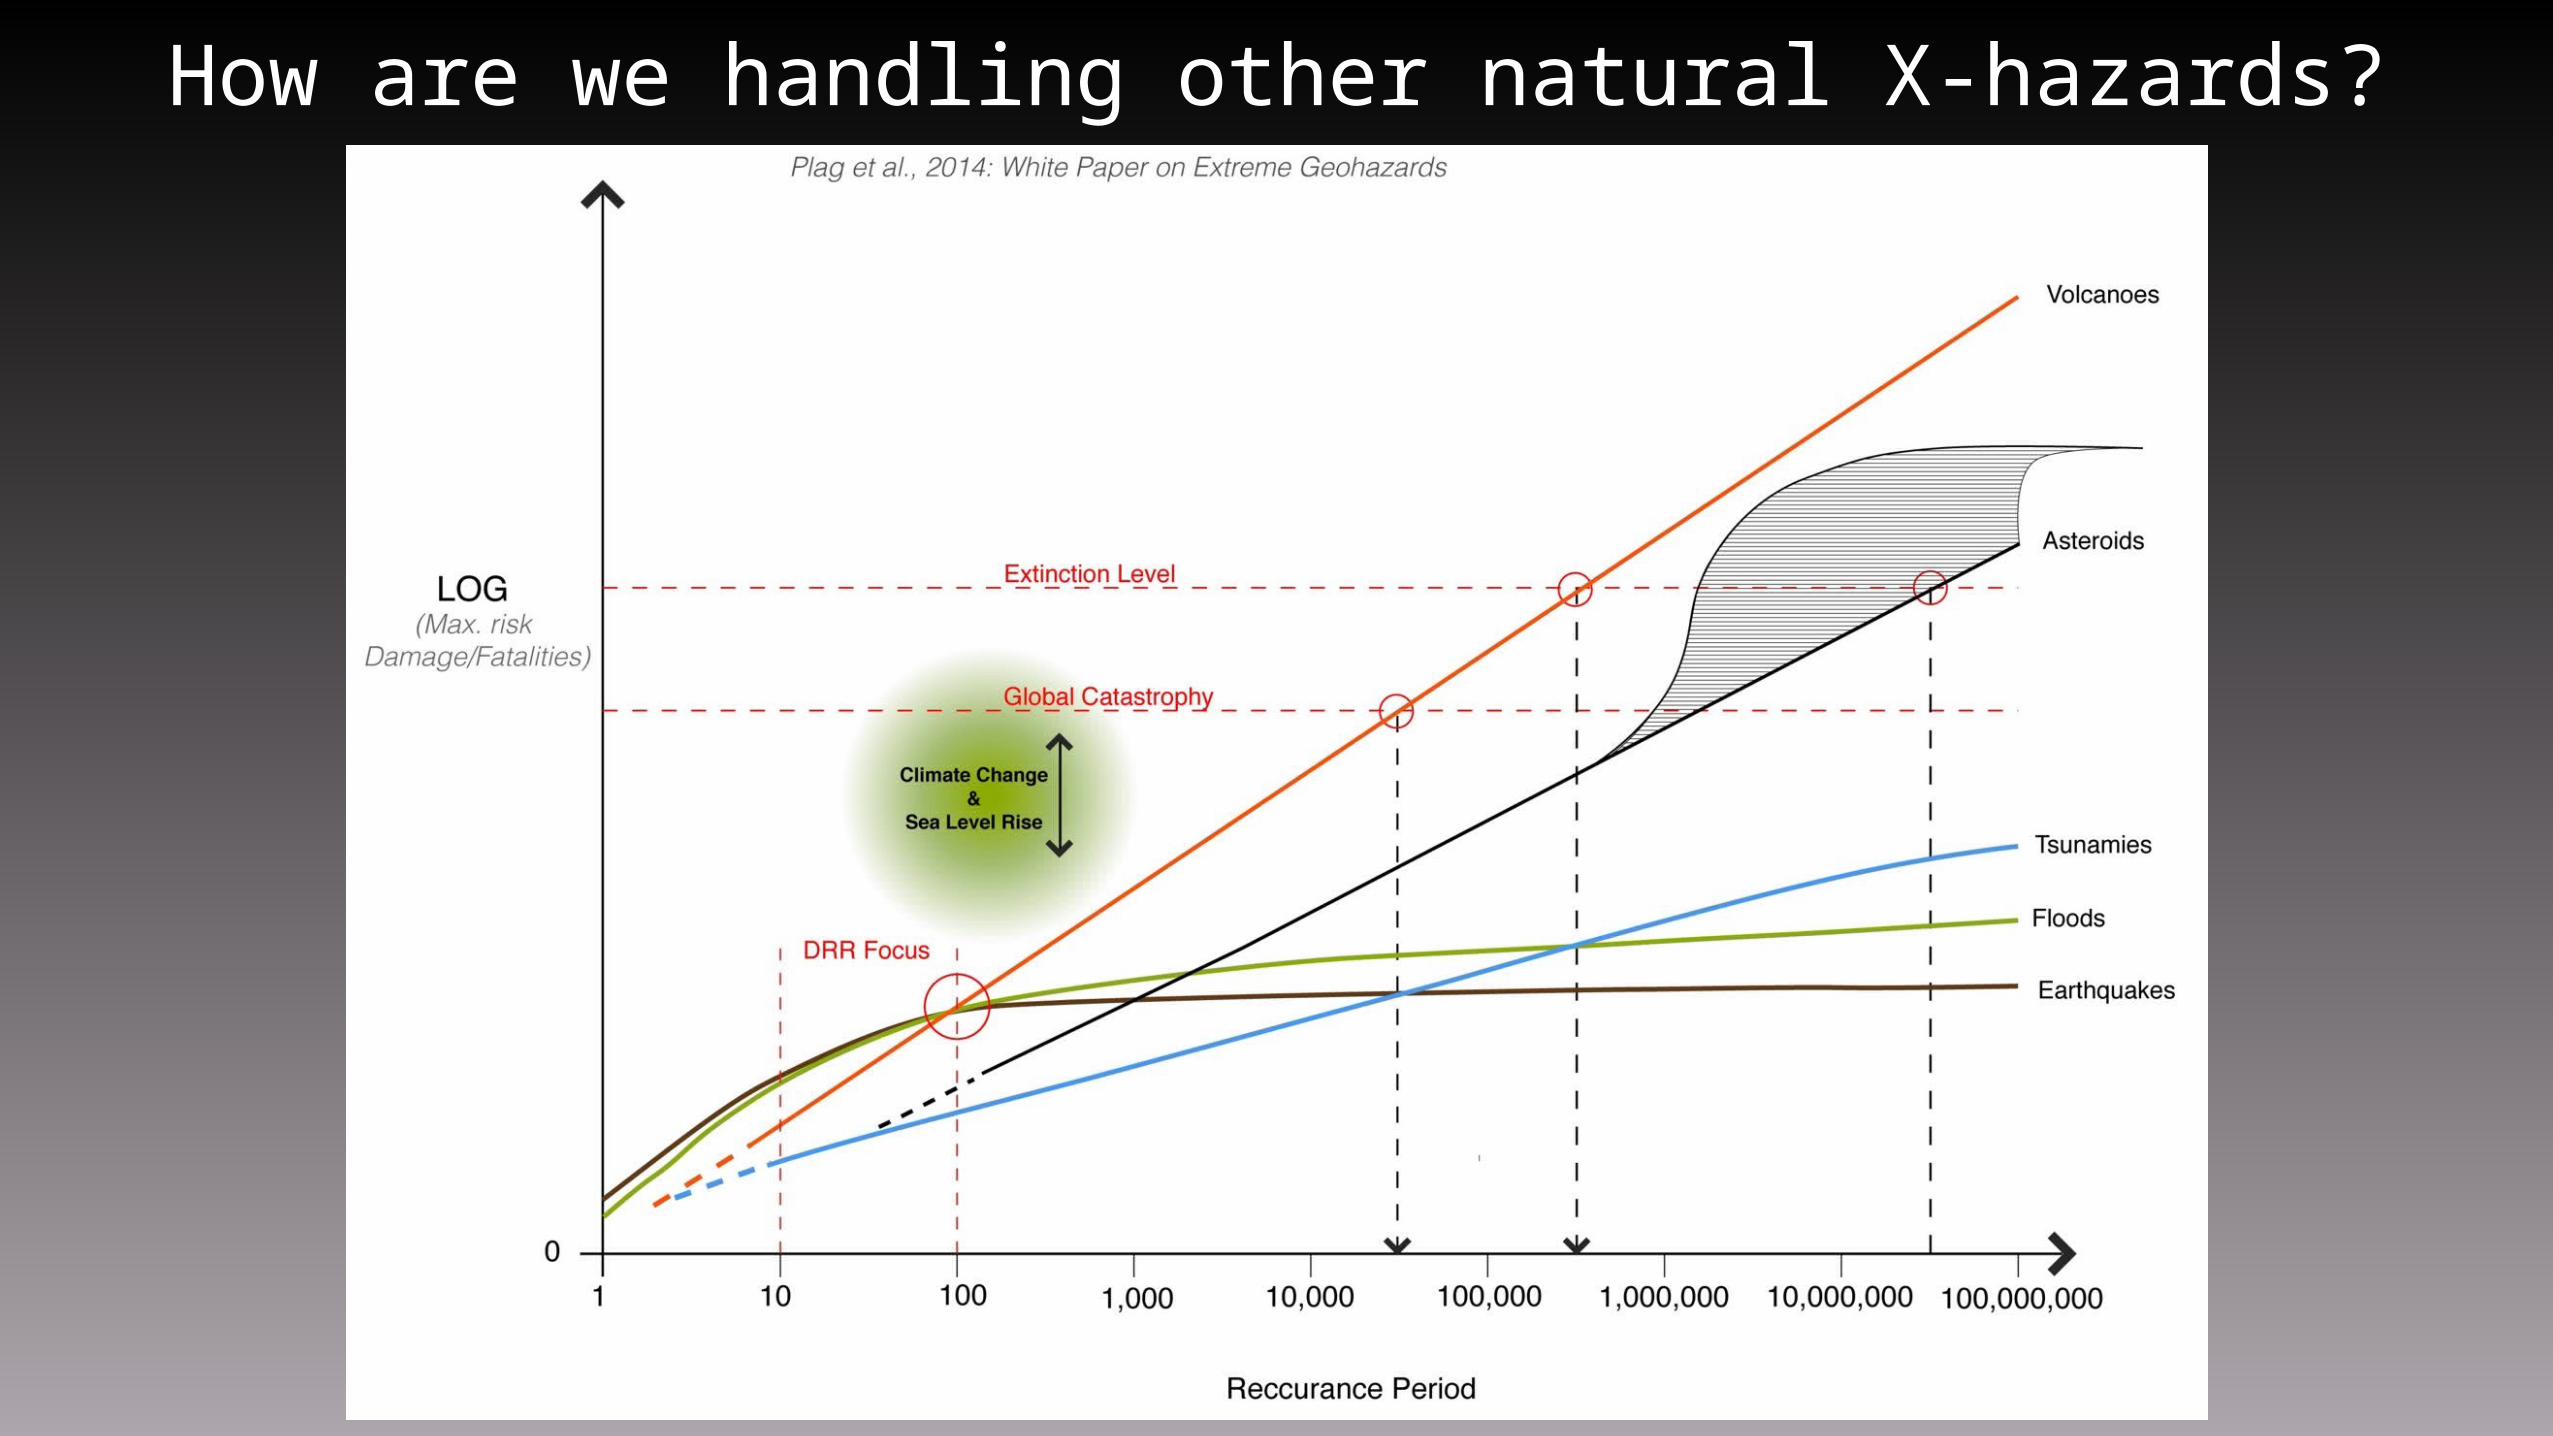
How are we handling other natural X-hazards?

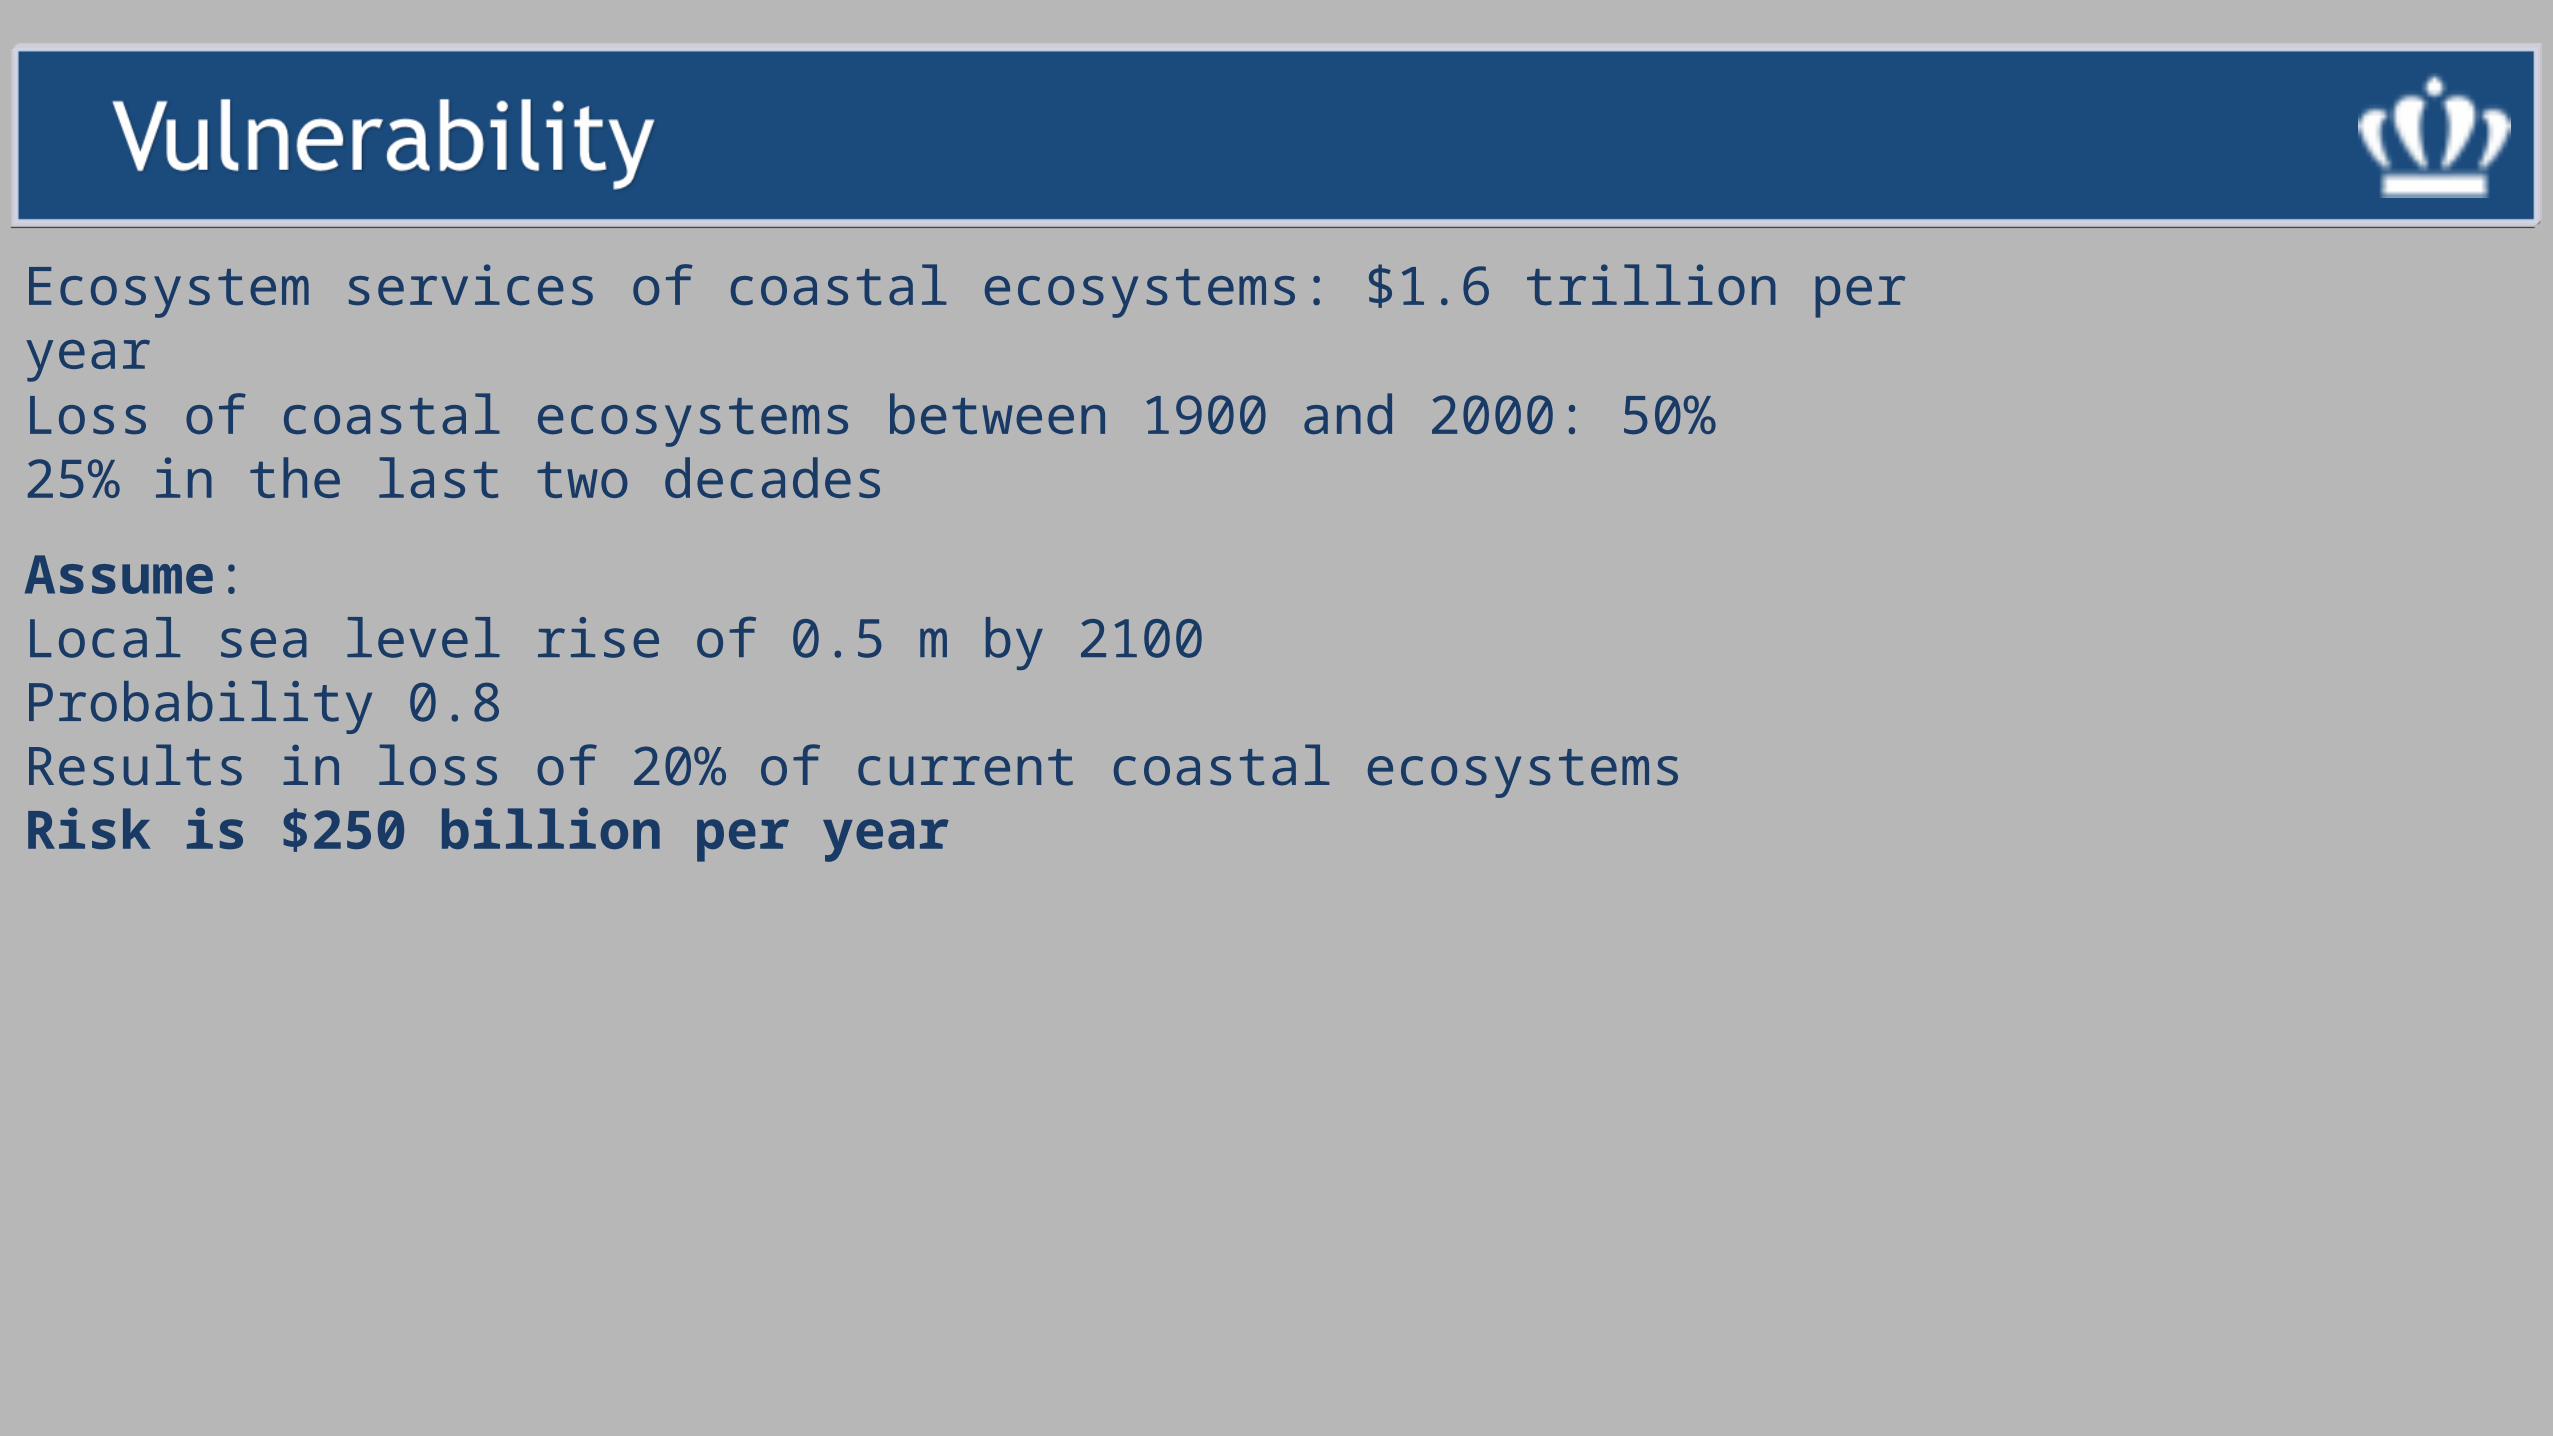
Ecosystem services of coastal ecosystems: $1.6 trillion per year
Assume:Local sea level rise of 0.5 m by 2100Probability 0.8Results in loss of 20% of current coastal ecosystemsRisk is $250 billion per year
Loss of coastal ecosystems between 1900 and 2000: 50%25% in the last two decades
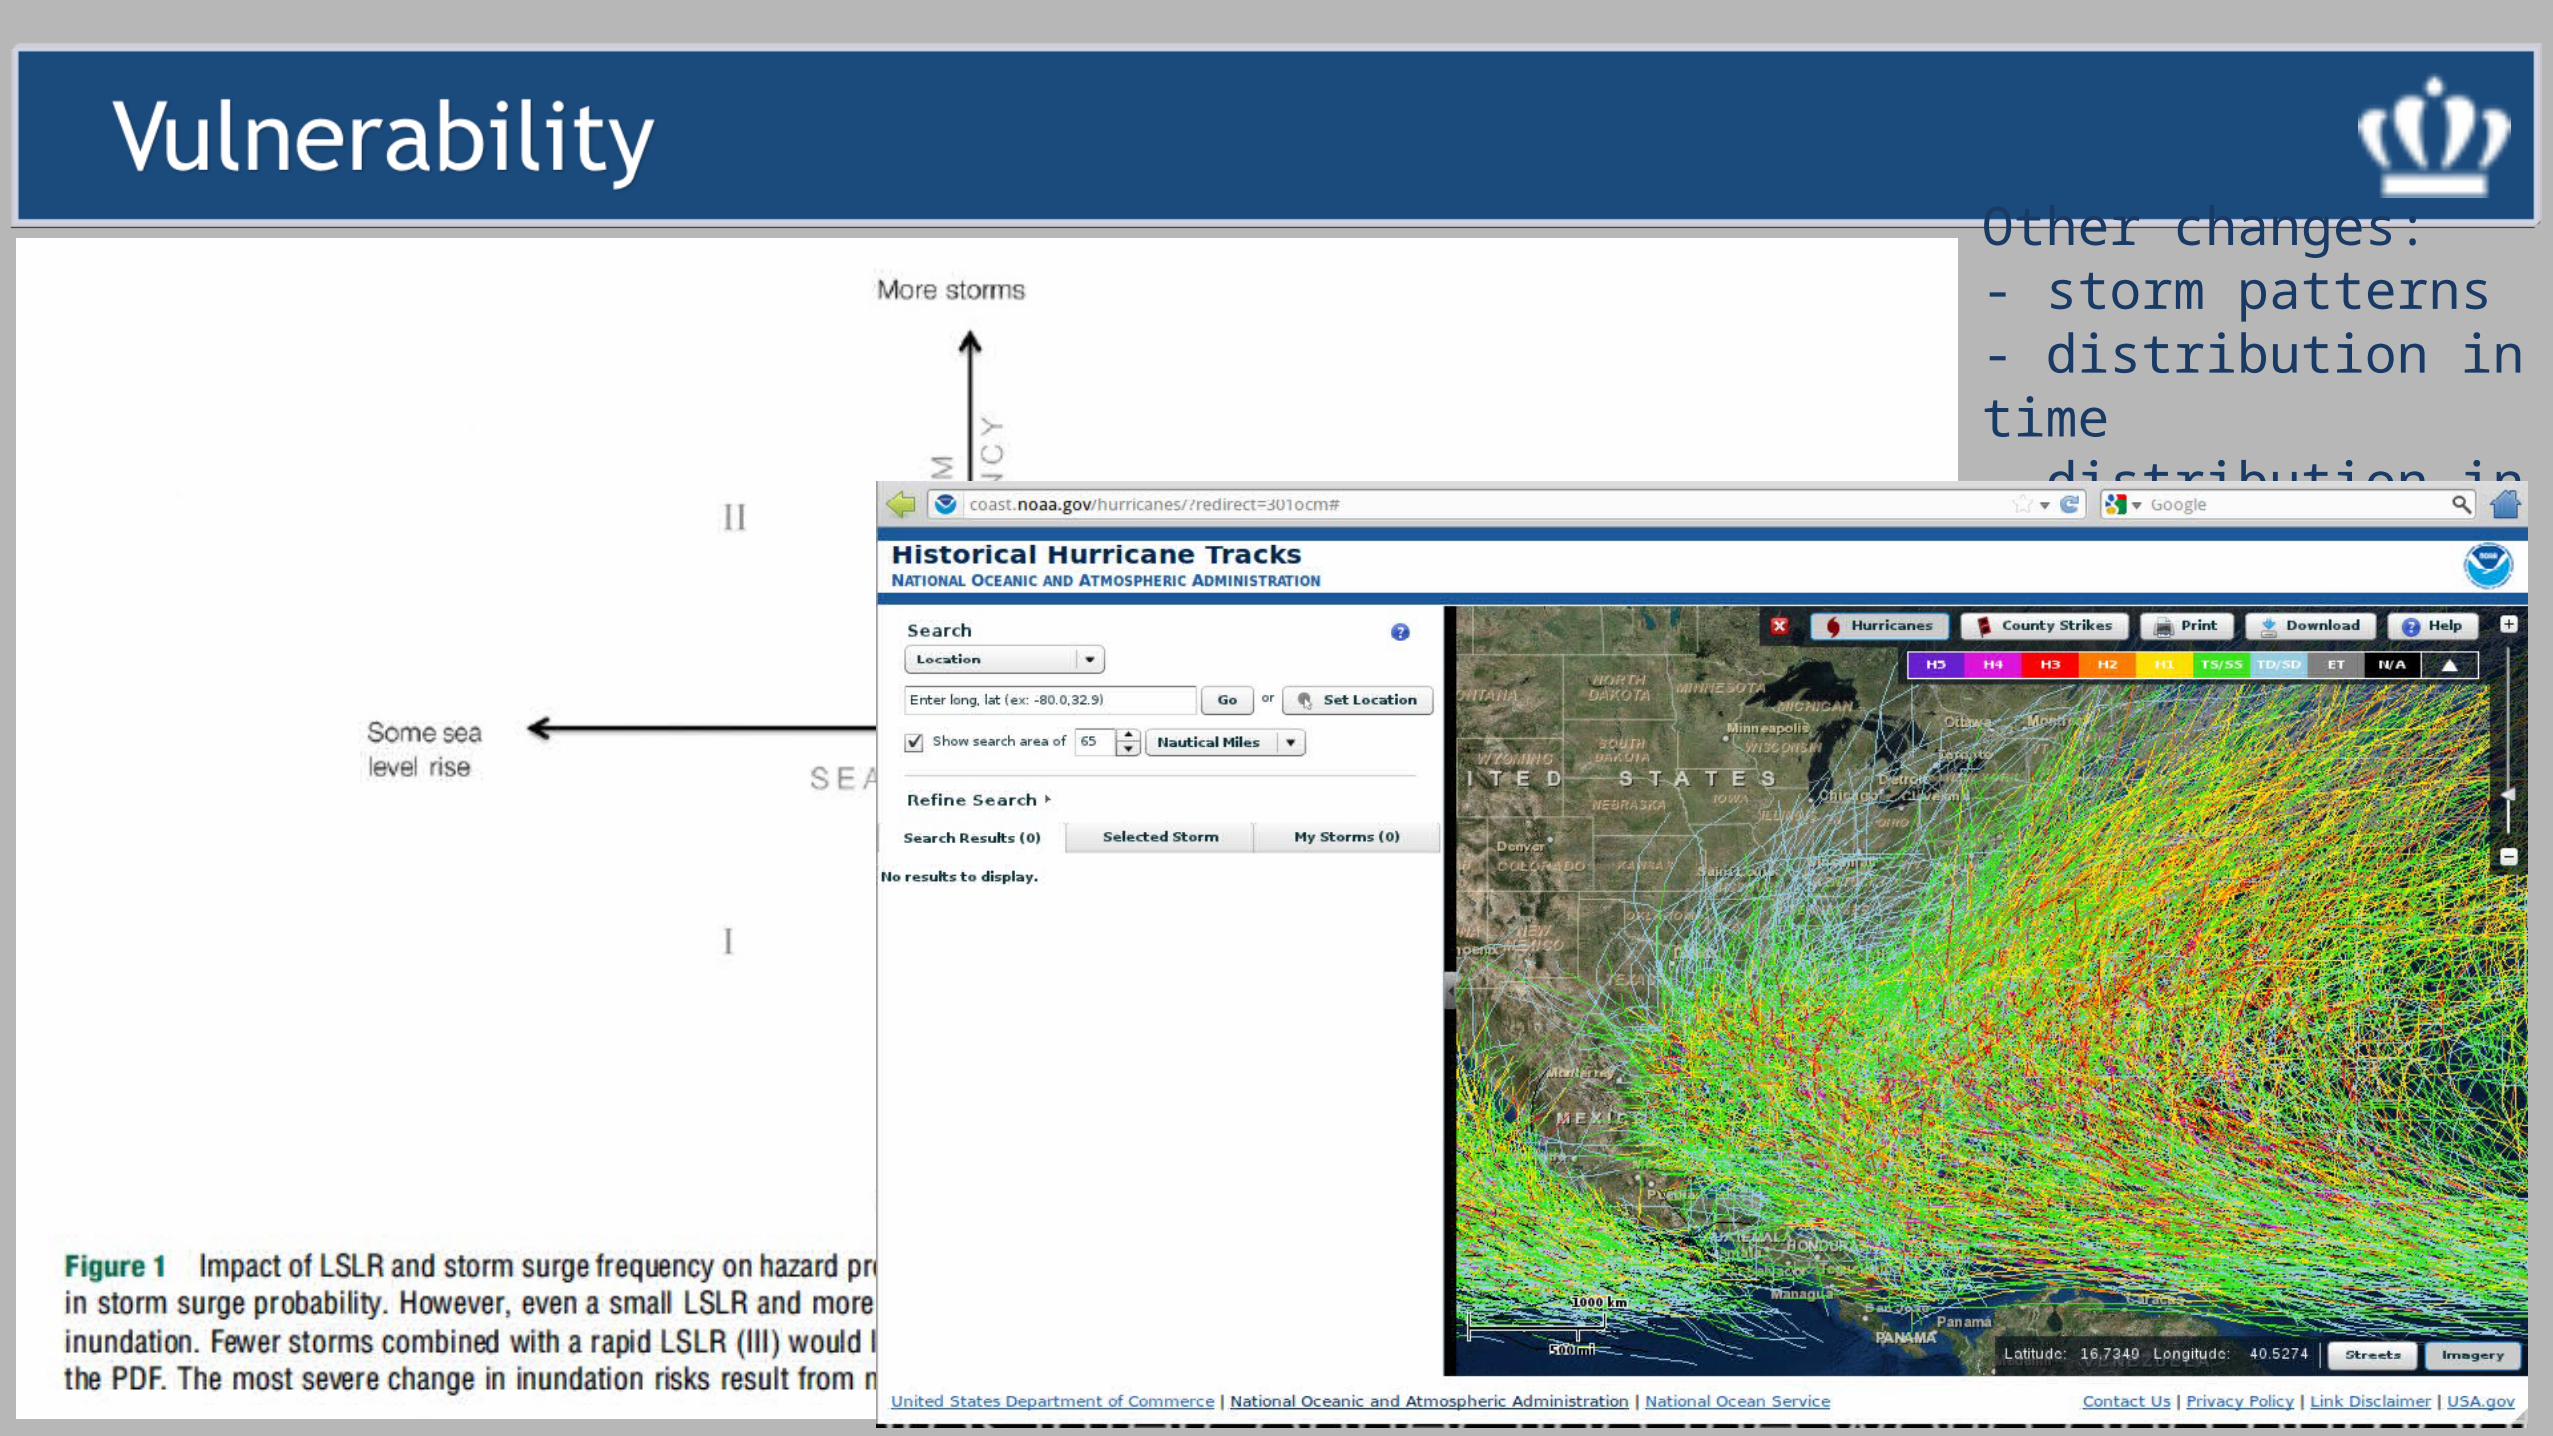
Other changes:- storm patterns- distribution in time- distribution in space

Planning for any limited range of plausible LSL trajectories inherently ignores part of the probability density function of future LSL.
How large is the risk associated with the part of the PDF not considered?MOST LIKELY VERY LARGE, BUT WE DON’T HAVE A SOLID ASSESSMENTHow likely is it that LSL might by far outside the limited range considered?WE CANNOT EXCLUDE THIS TO HAPPEN IN THE “POST-HOLOCENE”
How likely would that turn into a low-probability, high-impact event?MOST LIKELY, THIS WOULD BE A GLOBAL DISASTER AND COULD TURN INTO A X-EVENT