Embed Size (px)
DESCRIPTION
Techno-Economic Evaluation of Narrowband and Broadband Access Networks
Citation preview
7/18/2019 Olsen Duarte Et Ali IEEE JSAC 1996
http://slidepdf.com/reader/full/olsen-duarte-et-ali-ieee-jsac-1996 1/20
1
I84
IEEE
JOURNAL ON
SELECTED
AREAS
IN
COMMUNICATIONS,
VOL. 14, NO. 6, AUGUST 1996
Techno-Economic Evaluation
of
and Broadband Access Network
and Evolution Scenario Assess
Borgar T.
Olsen, Alc ibiade Zaganiar is , Kje l l Stordahl , L. Aa. Ims,
D.
M y h r e , T. (averli , M. Tahkokorpi ,
I. Well ing, M . Drie skens , J. Kraushaar , J . M o n o n e n ,
M.
Lahteeno ja , S . Marka tos ,
M.
De Bortol i ,
U. Fer re ro , M. Rave ra ,
S .
Balzarett i , F. Fleuren , N. Gieschen , M . De Ol ive i ra Du a r t e ,
and
E.
de
Cast ro
Abstract-The pa pe r presents the main results obtained within
the Research in Advanced Communications in Europe (RACE)
project: 2087 TITAN (Tool for Introduction Scenarios and
Techno-Economic Evaluation of The Access Netw ork) regardin g
minimum-risk introductory routes for new narrowband
and
broadband services in the residential and small business market.
The project developed a methodology and a tool for techno-
economic evaluation of advanced narrowband and broadband
telecommunications networks and services.
Results from four extensive access network studies are
presented. For the narrowband services, optical access and
radio in the local loop have been assessed and compared to
conventional copper layout in a greenfield environment. Access
network upgrad e strategies for emerging new broadband services
have been evaluated in three studies, with technological options
ranging from enhanced copper to hybrid-fiber-coax (HFC) and
broadband passive optical networks. An extensive study on
different broadband access network upgrade alternatives
f o r
public network operators (PNO’s) were carried out, taking
into account the diversity of conditions met today by Europ ean
countries. In anoth er stud y, the effect of com petition in the access
network was modeled assuming two main operators sharing
the market. Broadband upgrade alternatives were evaluated
for a new cable operator, competing with the dominant public
network operator. In addition, video-on-demand
(VoD)
and
Inter net access upgrades have been analyzed.
The paper demonstrates the viability
of
techno-economic
studies for the access network, including in-depth analysis
of
the
time-dependence of component cost, tariffs, service-penetrations
and market shares. This work intends to support establishing
guidelines for strategic decisions regarding the development of
the access network alternatives of different operators.
I. INTRODUCTION
SSESSMENT of residential access network scenarios
A s increasingly important for the telecommunications
Manuscript received July
18.
1995: revised October 9, 1995.
B. T. Olscn,
L.
Aa. Ims, and
D.
Myhre are with Telenor Research and
Development, Kjeller, Norway.
A.
Zaganiaris
is
with CNET-France Tclecom, Lannion, France.
K. Stordahl and T. Overli are with Telenor, Networks Division, Oslo,
Norway.
M . Tahkokorpi and
1.
Welling are with Nokia Research, Helsinki, Finland.
M. Drieskens and J. Kraushaar are with Ericsson Raynet, Brussels, Belgium.
J. Mononen and M. L at eenoj a are with Telecom, Finland Research Centre,
S.
Markatos is with the University
of
Athens, Athens, Greece.
M. De Bortoli, U. Fenzro, M. Ravera, and S. Balzaretti are with CSELT,
F.
Fleuren is with KPN Research, Leidscendam, The Netherlands.
N. Gieschen is with Telekom, Berlin, Germany.
M .
De
Oliveira Duarte and
E.
de Castro are with the University of Aveiro,
Publisher Item Identifier S 0733-8716(96)04893-7.
Helsinki, Finland.
Turin, Italy.
Aveiro, Portugal.
operators [11-[4]. Fast improving technology gives birth to
new alternatives, although the society’s ability to fully exploit
them lags by years. An increasing number of field trials
world-wide is paving the way toward integrated broadband
communications, which are at an early stage
of
development.
Most of the advanced components needed are being produced
in already significant quantities, yet they are in the beginning
of the learning process which will drive the costs further down
Widespread competition and technological breakthroughs
focus the attention of the operators on satisfying new cus-
tomer needs, as a strategy to keep and expand their mar-
ket share and, consequently, their revenue base
[7].
Since
average growth of plain old telephony services
(POTS)
is
almost saturated in Europe, the long-term growth and f i -
nancial strength of the public network operators (PNO’s)
imply the emergence of additional revenues such as the
Internet access service [8]. Furthermore, some operators be-
lieve that the investment in fiber in the loop (FITL) sys-
tems is not likely to be recouped by telephony services
alone
[9].
With increasing pressure to minimize costs and
to maximize revenues, a large variety
of
access network
architectures and upgrade scenarios must be rigorously ex-
amined in order to determine the most appropriate ones for
the different demographic area types and service demand
profiles.
Customer applications are not well-defined, despite recent
field trials and market surveys. Forecasting the penetration
of
still uncertain services is extremely difficult but necessary
to undertake. Market surveys and extrapolations from current
household spending patterns are commonly used sources for
forecasting [lo]-[12].
The value of new information services, which can be
carried by the existing or new networks, is likely to be
considerably enhanced by the provision
of
access
to
wideband
signals.’ Wideband access on twisted copper pairs enable rapid
access to multimedia information resources. Video dial tone
services, requiring a 2-Mb/s transport facility, would further
enable many new applications such as video-on-demand (VoD)
and video games, as well as narrowcasting services like
teleworking, teleshopping, and telelearning.
~51,
VI
’Wideband, capacity 5
Mb/s.
0733-8716/96 05.00 996 IEEE
Authorized licensed use limited to: UNIVERSIDADE DE AVEIRO. Downloaded on June 16, 2009 at 10:41 from IEEE Xplore. Restrictions apply.
7/18/2019 Olsen Duarte Et Ali IEEE JSAC 1996
http://slidepdf.com/reader/full/olsen-duarte-et-ali-ieee-jsac-1996 2/20
OLSEN
et ul : TECHNO-ECONOMIC
EVALUATION
OF
NARROWBAND AND BROADBAND
ACCESS NETWORK ALTERNATIVES
1185
=FPO=Flexibilily Point 0
-
.
-
-
-
LL2
LL1: Bus Sne
network]
L W
Star
Ciy
netwrk)
L L 9
Rhg
Interdty network
I
L3
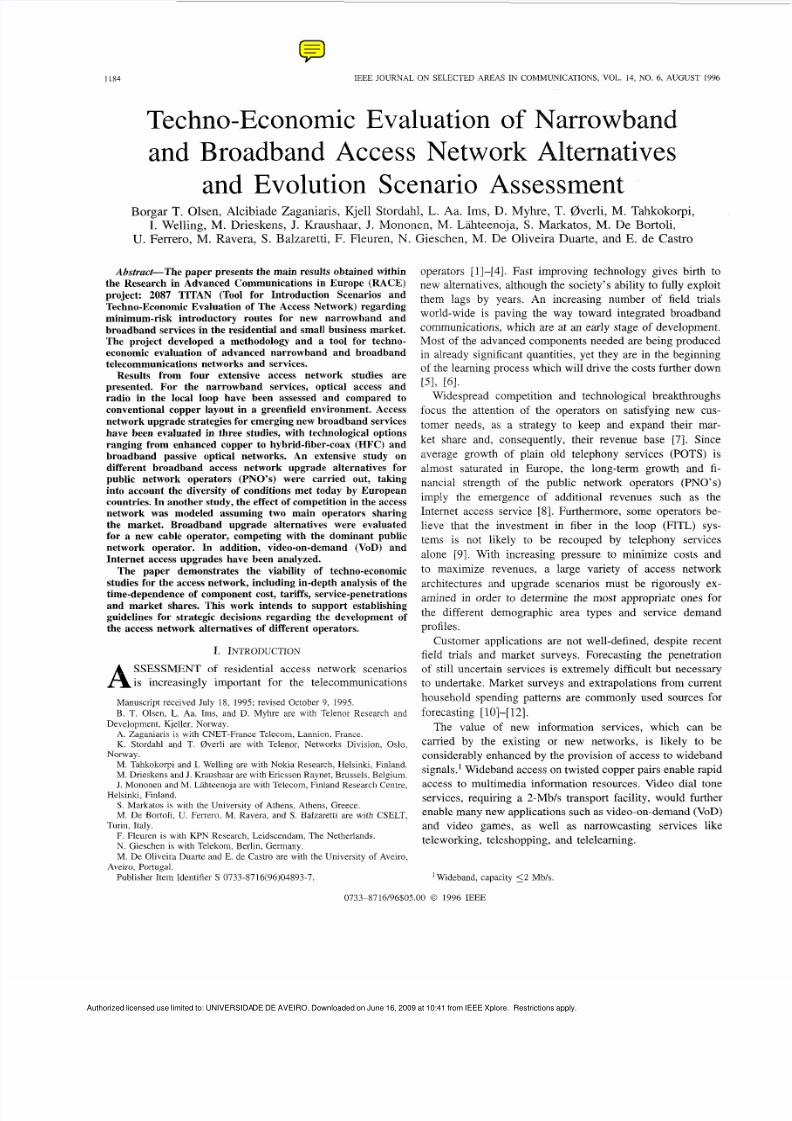
Fig.
1.
the
distributions.
The
double-star geometrical model
(a)
and
the square
model (b) for
This paper presents a methodology and results for the
assessment of access network evolution for the residential
and small business market. Its objective is the estimate of
the economic viability of different access network projects.
The evaluation is carried out in several stages: calculation of
the installed first cost, running costs, life-cycle costs, the cash
balance, and other economic figures of merit of the invest-
ment projects. This enables the comparison of various access
network architectures through a glob al system assessment and
contributes to the identification of minimum -risk introduction
strategies [13], [14]. The methodology and the tool dev eloped
within this project are being validated by comparison to
operating European networks and field trials.
11. THE TITAN METHOD OLOGY
The TITAN Tool is intended to assess any kind
of
access
network architecture (e.g., star, bus, ring, or combinations),
as well as, a variety of services with any estimated evolution
within the desired study period. The flexibility of the study pe-
riod length allows the user to derive scenarios which take into
account network and service evolution. Different architectures
which can prov ide a selected group of services can be chosen.
The param eters relevant to the engineering of the netw ork,
such as subscriber density are initially defined. These serve
as inputs to one or mo re geometrical models which calculates
the overall cable length of the various sections of the network.
The most commonly used geometrical models, the double
star and the square model, is shown in Fig. 1 [15], [16].
The models assume two or more flexibility points (FP’s)
between the service access point (SAP) and the subscriber
premises. The SAP,
as used in this study, refers to the
localization of the concentrator in the network, as used in
some European countries. Each SAP typically serves a few
thousand subscribers.
The n umber of flexibility points and the link levels between
the flexibility points in the mo del may be changed if required.
The system cost is calculated by establishing a list of the
volumes of the cost items needed in different flexibility
points and link levels. The network and service evolution
is taken into account by forming a new list for each year
of the study period. The cost items (network equipment,
cables, installation, and civil works) are derived from an
integrated cost database developed w ithin the TITAN project,
containing data gathered from many European sources. Cost
elements of different technological maturity and commercial
availability are included in the database. By adding operation,
maintenance, and administration (OAM) costs, the life-cycle
costs are obtained. The service penetrations, which can be
provided over different network architectures, is estimated
through the Delphi survey described in the next section [lo],
[
121. Finally, the overall financial budget is derived for the
various architectures by integrating demand and tariff data
with the life-cycle cost.
A The TITAN Modeling
of Component
Price Versus
Time
Theoretical considerations show that by combining a stan-
dard demand logistic curve for the growth over time of
the accumulated component volume with a learning curve
[17]-[19], every comp onent can be classified by fo ur pa-
rameters
[ 2 0 ] .
These are the component price today
P(O),
the learning curve coefficient K , the time it takes for the
accumulated volume curve to go from 10% to 90% of the
saturation value AT, and the value of the accumulated volume
today
n O ) ,
normalized to the saturation value. The last
parameter is the inverse of the assumed marked potential
normalized to the current cumulative volume. The
AT
and
n(0) re the only two parameters that need to be estimated by
forecast methods. The forecast function for the evolution of
the
relative accumulated volume
n ( t )
s given
by
n( t )
=
+exp In - ~.
{
[ n;o)
) 22]}-l
where the only inputs are
n(0)
and
AT.
Fig.
2
illustrates this
relation. Th e previous relation is now inserted into a learning
Authorized licensed use limited to: UNIVERSIDADE DE AVEIRO Downloaded on June 16 2009 at 10:41 from IEEE Xplore Restrictions apply
7/18/2019 Olsen Duarte Et Ali IEEE JSAC 1996
http://slidepdf.com/reader/full/olsen-duarte-et-ali-ieee-jsac-1996 3/20
I186
IEEE JOURNAL ON SELECTED AREAS IN COMMUNICATIONS, VOL. 14, NO. 6. AUGUST 1996
Normalised
price
1
oo
0 80
0,60
0,40
0,20
0
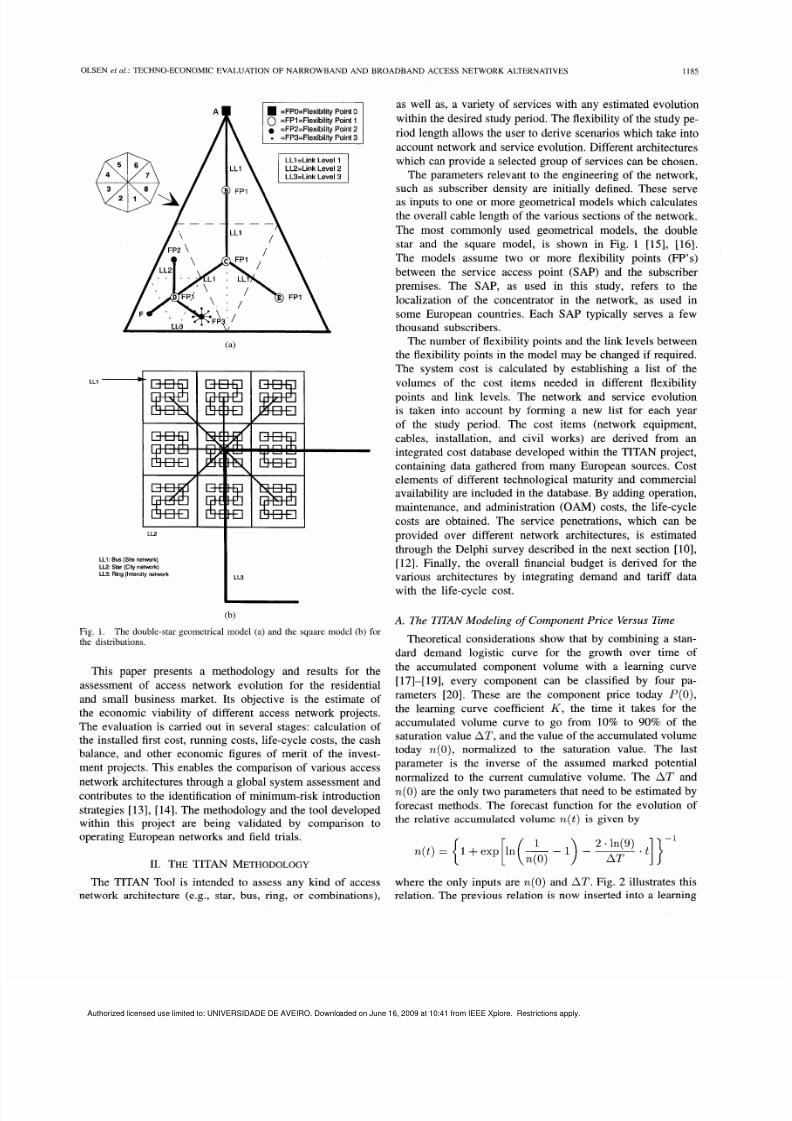
Fig
2
volume n, ( t )
The forecaat function for the evolution
of
the relative accumulated
curve
This yields the final expression of the price of the component
versus time
P ( t )= P(0)
which contains all four parameters involved in the component
price versus time evolution.
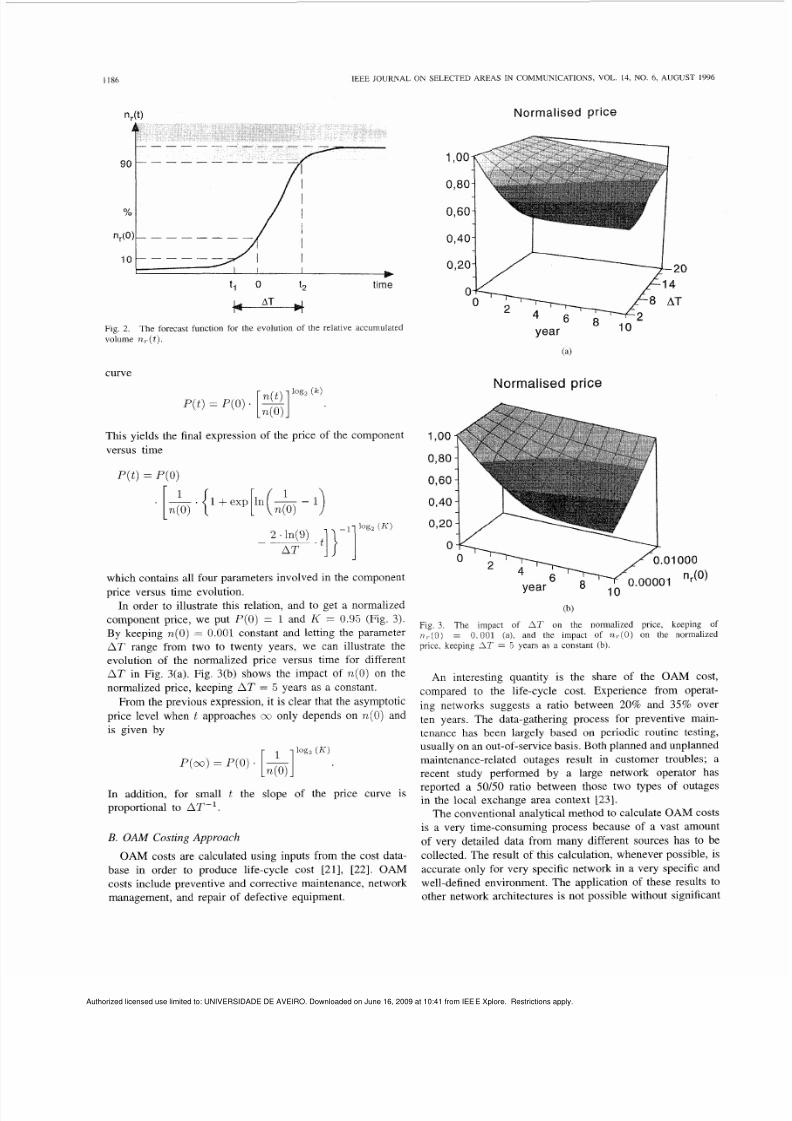
In order to illustrate this relation, and to get a normalized
component price, we put P(0) = and
K
= 0.95 (Fig. 3).
By keeping n(0)= 0.001 constant and letting the parameter
AT range from two to twenty years, we can illustrate the
evolution
of
the normalized price versus time for different
A T
in Fig. 3(a). Fig. 3(b) shows the impact of
n(0)
on the
normalized price, keeping A T
= 5
years
as
a constant.
From the previous expression, it is clear that the asymptotic
price level when t approaches only depends on
n(0)
and
is given by
In addition, for small t the slope of the price curve is
proportional to
AT-’.
B.
OAM Costing
Approach
OAM costs
are
calculated using inputs from the cost data-
base in order to produce life-cycle cost [21],
[22].
O A M
costs include preventive and corrective maintenance, network
management, and repair of defective equipment.
Normalised
price
(b)
Fig. 3. The impact of
AT
on the normalized price, keeping of
n, . (O)
= 0 . 0 0 1 (a),
and the impact
of n,.(O)
on the normalized
price. keeping
IT
= 5 years as a constant (b).
An interesting quantity is the share of the OAM cost,
compared to the life-cycle cost. Experience from operat-
ing networks suggests a ratio between
20
and 35% over
ten years. The data-gathering process for preventive main-
tenance has been largely based on periodic routine testing,
usually on an out-of- service basis. Both planned a nd unplanned
maintenance-related outage s result in customer troubles; a
recent study performed by a large network operator has
reported a 50150 ratio between those two types of outages
in the local exchange area context
[23].
The conv entional analytical method to calculate OAM costs
is a very time-consuming process because of a vast amount
of very detailed data from many different sources
has
to be
collected. The result of this calculation, whenever possible, is
accurate only for very specific network in a very specific and
well-defined environment. The application of these results to
other network architectures is not possible without significant
Authorized licensed use limited to: UNIVERSIDADE DE AVEIRO. Downloaded on June 16, 2009 at 10:41 from IEEE Xplore. Restrictions apply.
7/18/2019 Olsen Duarte Et Ali IEEE JSAC 1996
http://slidepdf.com/reader/full/olsen-duarte-et-ali-ieee-jsac-1996 4/20
OLSEN et
ul.:
TECHNO-ECONOMIC EVALUATION
OF
NARROWBAND AND BROADBAND ACCESS NETWORK ALTERNATIVES
1187
OA&M
Class
Civil
works
Coppercable
Electronics
Enclosures
Fibrecable
OptTransceiversAt T
OptTransceiversAtNT
PassOptComp
4.1
Phase
I:
Distribution
OA&M Cost
3 O
Yo
4,2Yo
7 O
o
5 O
4,l Yo
1
,o
Yo
2 l
4,2Yo
v
I INTRODUCTION SCENARIOS
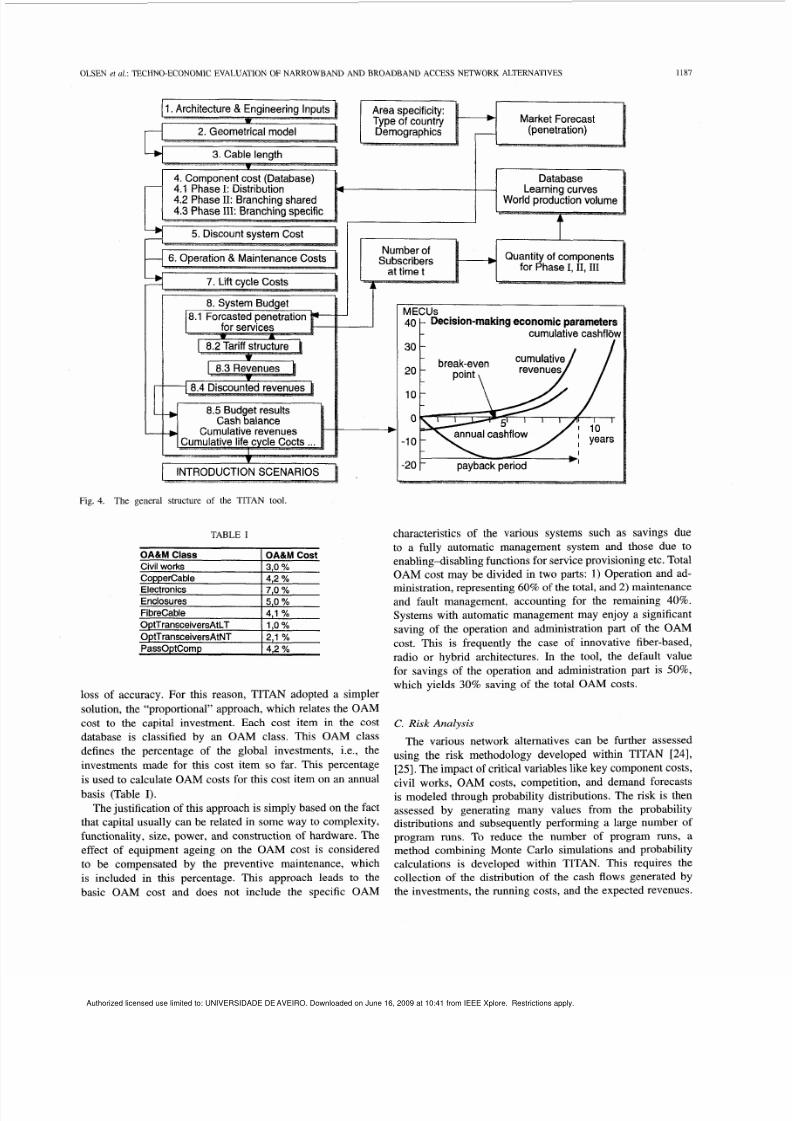
Fig. 4. The general structure
of
the TITAN tool.
loss of accuracy. For this reason, TITAN adopted a simpler
solution, the “propo rtional” approach, which relates the O AM
cost to the capital investment. Each cost item in the cost
database is classified by an OAM class. This OAM class
defines the percentage of the global investments, i.e., the
investments made for this cost item so far. This percentage
is used to calculate OAM costs for this cost item on an annual
basis (Table I).
The justification of this approach is simp ly based on th e fact
that capital usually can be related in som e way to complexity,
functionality, size, power, and construction of h ardware. Th e
effect of equipment ageing on the OAM cost is considered
to be compensated by the preventive maintenance, which
is included in this percentage. This approach leads to the
basic OAM cost and does not include the specific OAM
MECUs
Decision-makingeconom ic p arameters
40 r cumulative cashflbw
30
20
10
-10
-20
-b
-
payback period
characteristics of the various systems such as savings due
to a fully automatic management system and those due to
enabling-disabling functions for service provisioning etc. Total
OAM cost may be divided in two parts:
1 )
Operation and ad-
ministration, representing 60 of the total, and 2) maintenance
and fault management, accounting for the remaining
40 .
Systems with automatic management may enjoy a significant
saving of the operation and administration part of the
OAM
cost. This is frequently the case of innovative fiber-based,
radio or hybrid architectures. In the tool, the default value
for savings of the operation and administration part is
50 ,
which yields 30 saving of the total OAM costs.
C. isk Analysis
The various network alternatives can be further assessed
using the risk methodology developed within TITAN
[24],
[25] . he impact of critical variables like key com pone nt costs,
civil works, OAM costs, competition, and demand forecasts
is mo deled through probability distributions. The risk is then
assessed by generating many values from the probability
distributions and subsequently performing a large num ber of
program runs. To reduce the number of program runs, a
method combining Monte Carlo simulations and probability
calculations is developed within TITAN. This requires the
collection of the distribution of the cash flows generated by
the investments, the running costs, and the expected revenues.
Authorized licensed use limited to: UNIVERSIDADE DE AVEIRO. Downloaded on June 16, 2009 at 10:41 from IEEE Xplore. Restrictions apply.
7/18/2019 Olsen Duarte Et Ali IEEE JSAC 1996
http://slidepdf.com/reader/full/olsen-duarte-et-ali-ieee-jsac-1996 5/20
I188 IEEE JOURNAI
ON
SELECTED AREAS IN COMMUNICATIONS, VOL. 14, NO. 6, AUGUST 1996
For a given strategy, some probability measures on two
criteria commonly used in investment planning will give an
indication of whether it is worth investing or not: 1) The
present value of the cash
flows
(PVCF), or net present value
(NPV), and 2) the internal rate of return
I RR).
D.
The
Tool Description
Fig. 4 shows the general structure of the TITAN tool [20].
The tool is based on Excel@spreadsheet software. The central
part of the tool is the TITAN file, which contains macros
for the tool functionality. This is used in connection with
one database file and one or more main files. The tool has
two operating modes. The database mode is used for defining
cost components and services, and the main mode is used
for defining the architectures and service set and for actual
calculations and reporting.
The database contains several sections:
1) cost components, containing all component specific in-
2)
learning curve classes, which define a specific learning
3) volume classes, which define a specific market volume
4) OAM classes, which define a certain operations, admin-
5) write off period class which defines a component life-
6 uncertainty class, which defines the relative uncertainty
The main files are based on on e or more generalized access
network models. One such model is shown in Fig. 1. The m ain
sheet utilizes the geometrical model for calculation
of
cable
lengths and civil works. In this sheet, a “cost components”
section, also called “shopping list,” specifies all components
from the database used in this architecture. This section also
defines the point in time when each component is installed in
the network. The “shopping list” has been divided into sub-
sections according to the generic network model as described
above.
formation;
curve behavior;
evolution;
istration and maintenance behavior;
times for calculation
of
depreciation;
for the risk assessment.
111. FORECASTING
ERVICEEMAND
IN THE RESIDENTIAL
MARKET
The TITAN project has performed a comprehensive Delphi
survey in order to forecast the penetration of future services
and applications [lo] , [12]. The survey was performed in two
consecutive rounds among exp erts in ten European countries.
During the two rounds, the experts converged significantly
in their opinion about the servic e penetration forecasts. The
Delphi survey produced quantified information about the de-
velopment of new services and applications which requires
high capacity in the access network. The final results from
the survey give predictions of the future demand for wide and
broadband bearer serv ices 2 Demand h as been quantified in
terms of the number of subscribers to one or more services.
The growth of subscriber demand affects the amount
of
equipment required in the network and thus the discounted
’Broadband, cdpacity >2Mb/\
FCIRECAST A S
PERCENTAGE
3F THE R E S I D E N T I A L
MA R K E T
I SDN
W DEBAND
2 M B I
T S / S )
BROADBAND
8 M B I TS/ S>
//
I I I
1995 2000
2005
2010
F U R E C A S T Y E A R
Fig.
5.
of
the residential market.
Forecast for ISDN, wide- and broadband connections as a percentage
system cost. Demand is also input to the tool in terms of
the number of subscriptions for each service, which produce
revenue when multiplied by the given tariff.
The following applications were covered by the question-
naire: VoD, multimedia telegame, videophony, telecommunity
(telemedicine), telesh oppin g, advertising, an d marketing, in-
teractive TV, electronic newspapers, teleworking (simple and
advanced office), and remote edu cation (home and studio). The
number of questions was close to 400. The questions asked
for each application included qualitative information on the
type of users accompanied by detailed questions
on
the likely
demand (expressed in terms of penetration
of
the number of
households) for services delivering these applications at: 1)
A
range of different annual tariffs, 2) a number of different
future points in time (1995, 2000, 2005, and 2010), and 3)
for different levels of disposable income per household. In
addition to que stions on the applications, q uestions were asked
on three basic bearer services: 1 ) basic rate integrated services
digital network (ISDN) connections (up to
144 kb/s), 2)
wideband (up to 2048 kb/s), and 3) broadband (up to 8 Mb/s).
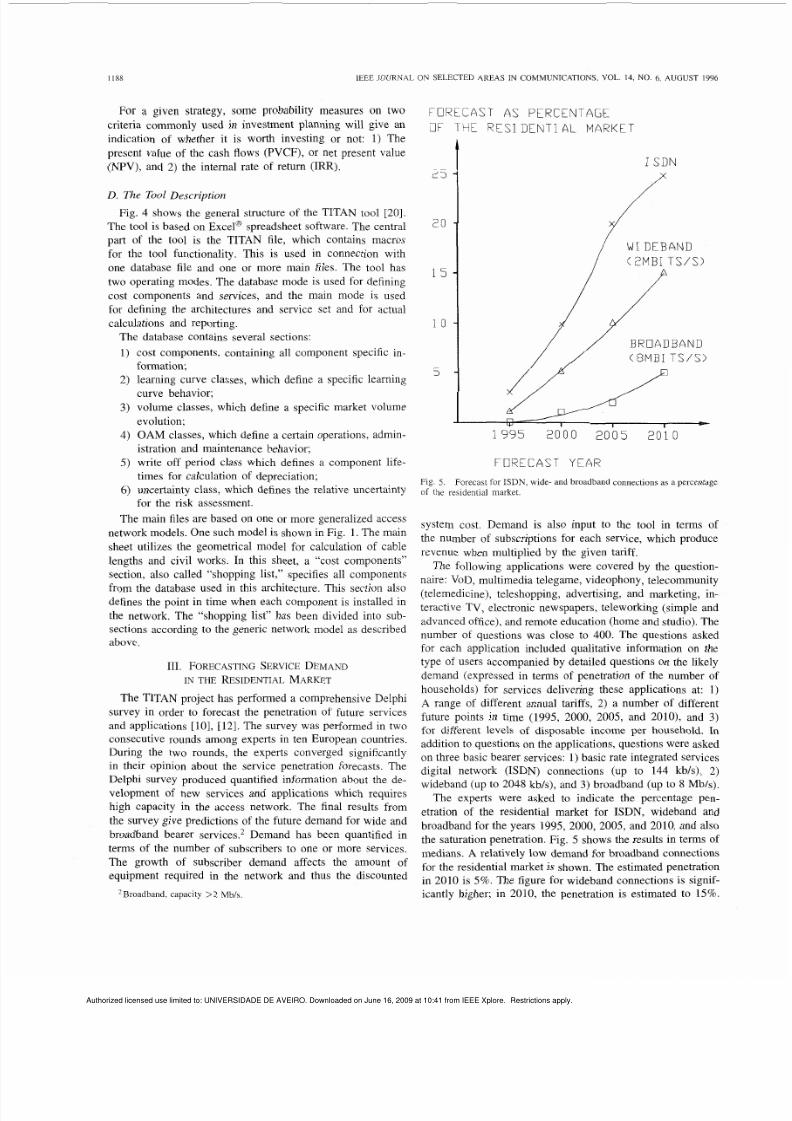
The experts were asked to indicate the percentage pen-
etration of the residential market for ISDN, wideband and
broadband for the years 1995, 2000, 2005, and 2010, and also
the saturation penetration. Fig. 5 shows the results in terms of
medians. A relatively low demand for broadband connections
for the residential m arket is sh own . The estimated penetration
in 2010 is 5%. The figure for w ideband connections is signif-
icantly higher; in 2010, the penetration is estimated to 15 .
Authorized licensed use limited to: UNIVERSIDADE DE AVEIRO. Downloaded on June 16, 2009 at 10:41 from IEEE Xplore. Restrictions apply.
7/18/2019 Olsen Duarte Et Ali IEEE JSAC 1996
http://slidepdf.com/reader/full/olsen-duarte-et-ali-ieee-jsac-1996 6/20
OLSEN ef
al.:
TECHNO-ECONOMIC EVALUATlON OF NARROWBAND AND BROADBAND ACCESS NETWORK ALTERNATIVES
25
1189
X
I
SDN
I
t
LL
1000 2000 3000 4000
ANNUAL S U B S C R I P T I
ON
T A R 1
F F
( E CU)
Fig.
6. Estimated demand curves for
ISDN,
wide- and broadband connections.
The demand for ISDN grows faster: Within a ten year period
from 1995-2005, the forecasts increases to
20 .
The opinion
of the experts regarding forecasts for wideband connections
vary. The standard deviation of the observations increases
from 1.8% (1 995) to
14.1%
(2010); the difference between the
75% fractile and the 25 fractile increases from 2% (1995)
to 10% (2010). In the TITAN project, the distribution of the
observations is used as an input to risk analysis performed in
the project to reflect the uncertainty of critical variables.
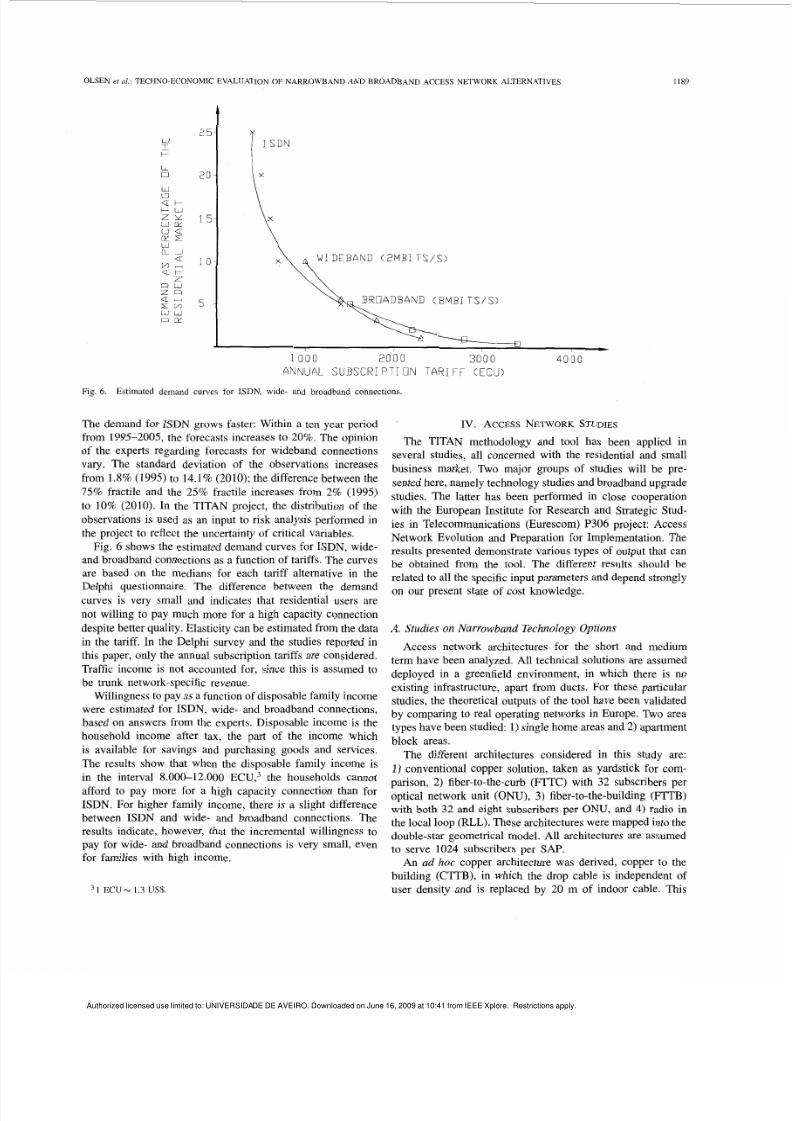
Fig. 6 shows the estimated demand curves for ISDN, wide-
and broadband co nnections as a fun ction of tariffs. The curves
are based on the medians for each tariff alternative in the
Delphi questionnaire. The difference between the demand
curves is very small and indicates that residential users are
not willing to pay much more for a high capacity connection
despite better quality, Elasticity can be estimated from the data
in the tariff. In the Delphi survey and the studies reported in
this paper, only the annual subscription tariffs are considered.
Traffic income is not accounted for, since this is assumed to
be trunk network-specific revenue.
Willingness to pay as a function of disposable family income
were estimated for ISDN, wide- and broadband connections,
based
on
answers from the experts. Disposable income is the
household income after tax, the part of the income which
is available for savings and purchasing goods and services.
The results show that when the disposable family income is
in the interval 8.000-12.000 ECU ,3 the households cannot
afford to pay more for a high capacity connection than for
ISDN. For higher family income, there is a slight difference
between ISDN and wide- and broadband connections. The
results indicate, however, that the incremental willingness to
pay for wide- and broadband connections is very small, even
for families with high income.
1 E C U N
1.3 US .
IV. ACCESSNETWORK TUDIES
The TITAN methodology and tool has been applied in
several studies, all concerned with the residential and small
business market. Two major groups of studies will be pre-
sented here, namely technology studies and broadband upgrade
studies. The latter has been performed in close cooperation
with the European Institute for Research and Strategic Stud-
ies in Telecommunications (Eurescom) P306 project: Access
Network Evolution and Preparation for Implementation. The
results presented demon strate various types of output that can
be obtained from the tool. The different results should be
related to all the specific input param eters and depend strongly
on our present state of cost knowledge.
A. Studies on Narrowband Technology Options
Access network architectures for the short and medium
term have been analyzed. All technical solutions are assumed
deployed in a greenfield environment, in which there is no
existing infrastructure, apart from ducts. For these particular
studies, the theoretical outputs
of
the tool have been validated
by comparing to real operating networks in Europe. Two area
types have been studied: 1) single home areas and 2) apartment
block areas.
The different architectures considered in this study are:
1) conventional copper solution, taken as yardstick for com-
parison, 2) fiber-to-the-curb (FTTC) with 32 subscribers per
optical network unit (ONU), 3) fiber-to-the-building (FTTB)
with both 32 and eight subscribers per ONU, and 4) radio in
the local loop (RL L). These arch itectures were mappe d into the
double-star geometrical model. All architectures are assumed
to serve 1024 subscribers per S AP.
An ad
hoc
copper architecture was derived, copper to the
building (CTTB), in which the drop cable is independent of
user density and is replaced by
20
m
of
indoor cable. This
Authorized licensed use limited to: UNIVERSIDADE DE AVEIRO. Downloaded on June 16, 2009 at 10:41 from IEEE Xplore. Restrictions apply.
7/18/2019 Olsen Duarte Et Ali IEEE JSAC 1996
http://slidepdf.com/reader/full/olsen-duarte-et-ali-ieee-jsac-1996 7/20
1190
IEEE JOURNAL ON SELECTED AREAS IN COMMUNICATION S, VOL. 14, NO. 6, AUGUST 1996
ECURlSER
IO00
9uo
800
I00
WO
500
400
3
2
100
n
C opper m C 3 2
RLL
U l F C
mthout
Civil Works
u 1 F C mlh Civil Works minimum
c a x
ECUAJSER
1000
900
8
700
601
501
4 0 0
300
2 0 0
100
0
FTTB32 FTTB8 CTTB32 ClTB8
(b)
Fig. 7.
The installed first
costs (IFC)
of the different systems for single
homes (a)
and apartment blocks (b),
a
subscriber density
of 3.000
subscrkrn'.
enabled a comparison of a copper network to FTTB archi-
tectures. In the conventional copper architecture, two twisted
pairs serve every h ome. Th irty percent
of
the installed pairs are
assumed to be unused. The copper cables are dispatched and
spliced at the flexibility points. The only electronics included
in this architecture are the POTS and the N-ISDN line cards.
The FTTC solution is based
on
a passive optical network
(PON) with 1:2 splitters at the exchange site and a 1:4 splitter
in a central flexibility point. The system has separate fibers for
upstream and downstream signals, adding up to a total of four
fibers to each ON U. The maximum capacity of the ON U used
in this architecture is 64 times 64 kb/s, whilst the maximum
capacity of the OLT is 64 times
2
Mb/s. The number of line
cards used depends on the penetration of services.
Also the
FTTB
alternative is a
PON
solution similar to
the one described above for FTTC. The main difference
is
that the copper cable from the ONU to the subscriber is
replaced by a constant length of 20 m indoor cable. Two
architecture versions are studied: 1) ONU's in buildings with
up to 32 subscribers and
2)
ONU's in buildings with up to
eight subscribers.
The radio in the local loop (RLL) architecture
is
a DECT-
based architecture on copper infrastructure. Base stations cov-
ering a maximum of
200
m in radius are placed in differ-
ent flexibility points depending on subscriber density. For
low density areas with less than 560 subscribers/km2, di-
rectional antennas are used to extend the range of the base
stations up to 800 m. The number of base stations is de-
termined by the range and traffic capacity
of
the base sta-
tions.
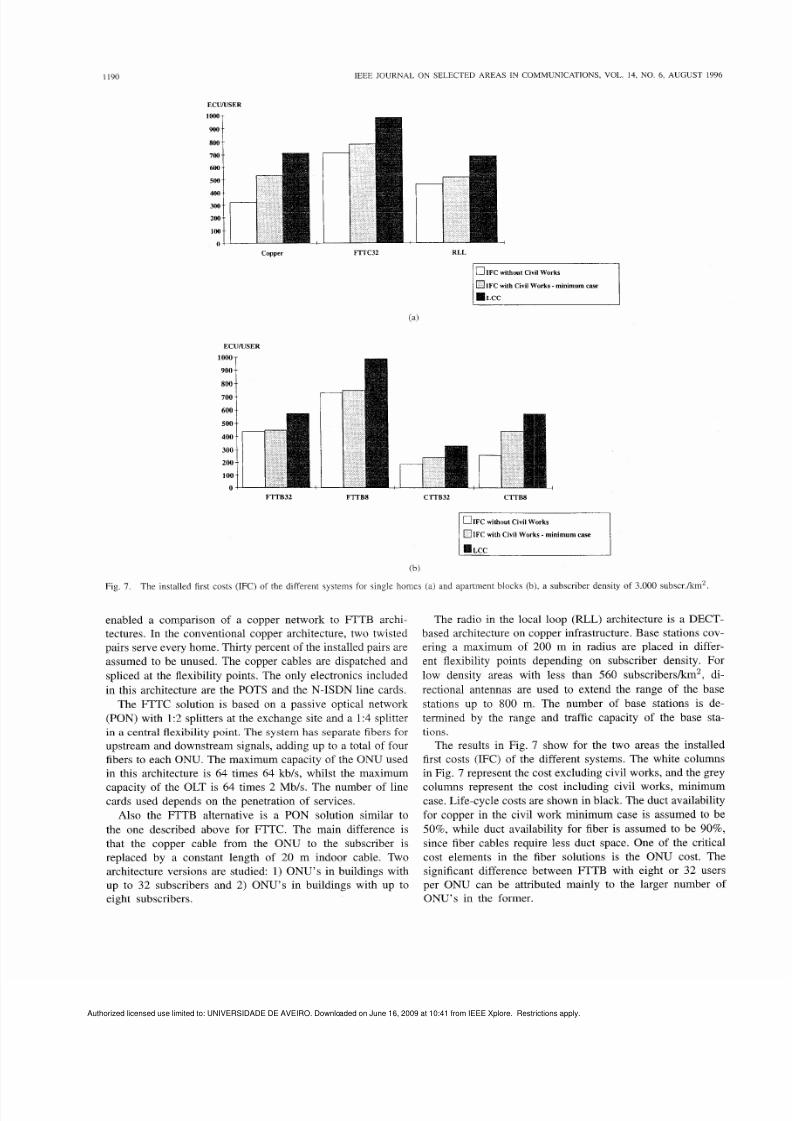
The results in Fig. 7 show for the two areas the installed
first costs (IFC) of the different systems. The white columns
in Fig. 7 represent the cost excluding civil works, and the grey
columns represent the cost including civil works, minimum
case. Life-cycle costs are shown in black. Th e du ct availability
for copper in the civil work
minimum
case is assumed to be
50 , while duct availability for fiber is assumed to be 90 ,
since fiber cables require less duct space. One of the critical
cost elements in the fiber solutions is the ONU cost. The
significant difference between FTTB with eight or 32 users
per ONU can be attributed mainly to the larger number of
ONU's in the former.
Authorized licensed use limited to: UNIVERSIDADE DE AVEIRO Downloaded on June 16 2009 at 10:41 from IEEE Xplore Restrictions apply
7/18/2019 Olsen Duarte Et Ali IEEE JSAC 1996
http://slidepdf.com/reader/full/olsen-duarte-et-ali-ieee-jsac-1996 8/20
OLSEN
et
al.: TECHNO-ECONOMIC EVALUATION OF NARROWBAND AND BROADBAND ACCESS NETWORK ALTERNATIVES
1191
4000 r
5 3500
e
3000
2500
c
E 2000
.-
U-
a,
v
rn
1500
3 1000
500
-
h
Access Alternatives
-
opper
-
- FTTC
- LL
- - - 4 - - - - *
. + -
II
0 I
30 100 300 1000 3000 10000 30000
Subscriber density (Subs/km2)
(4
Impact of Feed er Length
900
800
700
600
500
400
- - FTTC32
-
SS+Fibre
m
(I)
c
c 100
0
0
2500 5000 7500 1000
Feeder length
(rn)
(b)
Fig. 8.
The impact
of
subscriber density (a) the feeder length (b) on the IFC.
The results shown in Fig. 7 illustrate that relatively lower
OAM costs drive the cost of the fiber-based systems closer
to the copper solution. The fiber and radio-based networks
benefit from an automatic management, here yielding 30%
savings on the total OAM costs. The maintenance part of the
OAM cost is related to the environmental conditions at the
ONU location [23]. Therefore, significant cost savings may be
achieved when the
ONU
is inside a building.
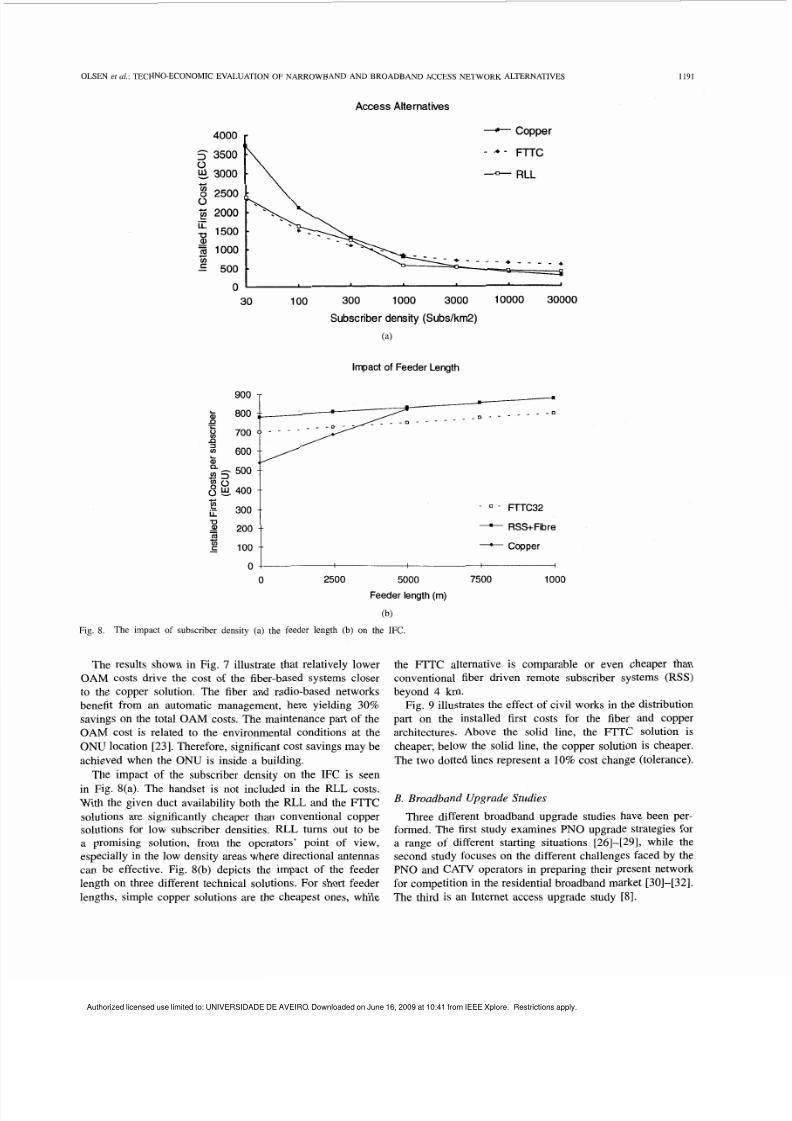
The impact of the subscriber density on the IFC is seen
in Fig. 8(a). The handset is not included in the RLL costs.
With the given duct availability both the RLL and the FTTC
solutions are significantly cheaper than conventional copper
solutions for low subscriber densities. RLL turns out to be
a promising solution, from the operators'
point of view,
especially in the low density areas w here directional antennas
can be effective. Fig. 8(b) depicts the impact of the feeder
length on three different technical solutions. For short feeder
lengths, simple copper solutions are the cheapest ones, w hile
the FTTC alternative is comparable or even cheaper than
conventional fiber driven remote subscriber systems (RSS)
beyond
4 km.
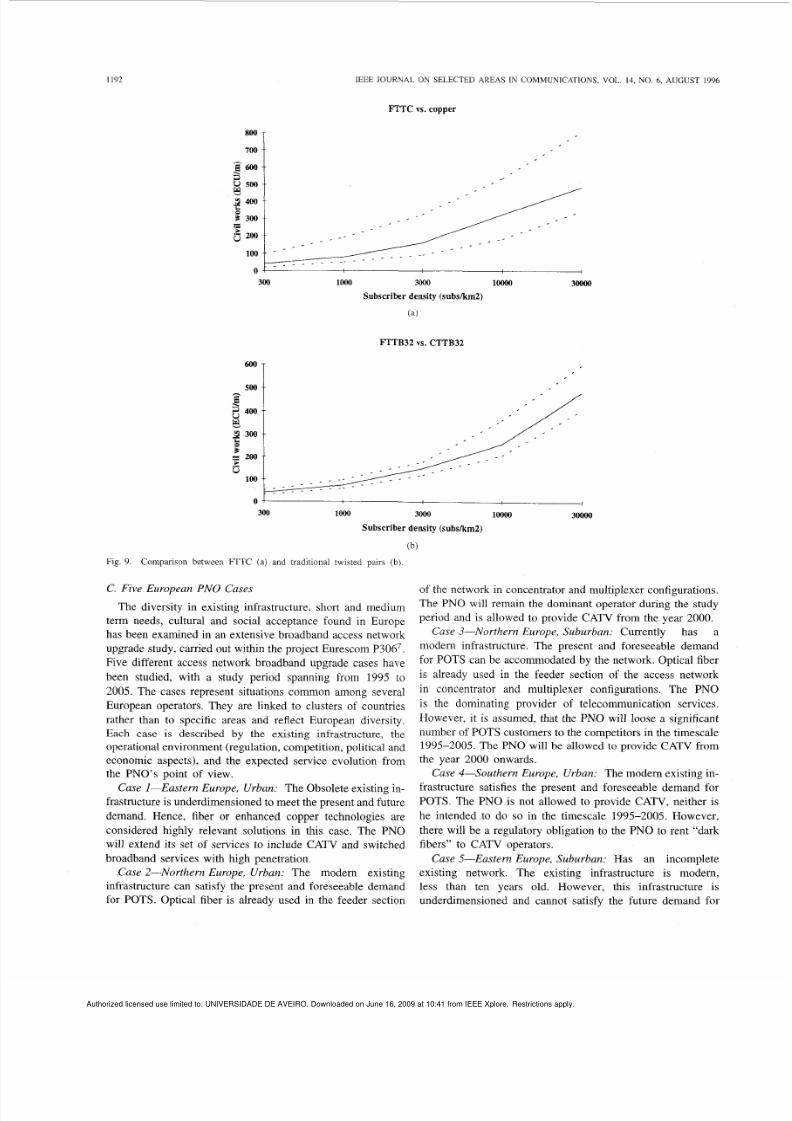
Fig. 9 illustrates the effect of civil works in the distribution
part on the installed first costs for the fiber and copper
architectures. Above the solid line, the FTTC solution is
cheaper; below the solid line, the copper solution is cheaper.
The two dotted lines represent a
10
cost change (tolerance).
B Broadband Upgrade Studies
Three different broadband upgrade studies have been per-
formed. The first study examines PN O upgrade strategies for
a range of different starting situation s [26]-[29], wh ile the
second study focuses on the different challenges faced by the
PNO and CATV operators in preparing their present network
for com petition in the residential broadband market [30]-[32].
The third is an Internet access upgrade study [SI.
Authorized licensed use limited to: UNIVERSIDADE DE AVEIRO. Downloaded on June 16, 2009 at 10:41 from IEEE Xplore. Restrictions apply.
7/18/2019 Olsen Duarte Et Ali IEEE JSAC 1996
http://slidepdf.com/reader/full/olsen-duarte-et-ali-ieee-jsac-1996 9/20
I192
IEEE JOURNAL ON SELECTED AREAS IN COM MUNICATIONS, VOL. 14, NO. 6, AUGUST
1996
FTTC
vs.
copper
700 i
Or
I
300 loo0
3Ooo
loo00
3
Subscriber
density
subskm2)
(a)
FTTB32
vs.
CTTB32
“
I
loo0
3000 loo00 3ooO
00
Subscriber
density
(subs )
(b)
Fig. 9.
Comparison between
FTTC
(a) and traditional twisted pairs (b)
C. Five European PN O Cases
The diversity in existing infrastructure, short and medium
term needs, cultural and social acceptance found in Europe
has been examined in an extensive broadband access network
upgrade study, carried out w ithin the project Eurescom P3 067.
Five different access network broadband upgrade cases have
been studied, with a study period spa nning from 1995 to
2005. The cases represent situations common among several
European operators. They are linked to clusters of countries
rather than to specific areas and reflect European diversity.
Each case
is
described by the existing infrastructure, the
operational environment (regulation, competition, political and
economic aspects), and the expected service evolution from
the PNO’s point of view.
Case 1-Eastern Europe, Urb an: The Obsolete existing in-
frastructure is underdimensioned to meet the present and future
demand. Hence, fiber or enhanced copper technologies are
considered highly relevant solutions in this case. The PNO
will extend its set of services to include CATV and switched
broadband services with high penetration.
Case 2-Northern Europe, Urba n: The modern existing
infrastructure can satisfy the present and foreseeable demand
for POTS. Optical fiber is already used in the feeder section
of the network in concentrator and multiplexer configurations.
The PN O w ill remain the dominant operator during the study
period and is allowed to provide CATV from the year 2000.
Case 3-Northern Europe, Suburban: Currently has a
modem infrastructure. The present and foreseeable demand
for POTS
can
be accommo dated by the network. Optical fiber
is already used in the feeder section of the access network
in concentrator and multiplexer configurations. The PNO
is the dominating provider of telecommunication services.
However, it is assumed, that the PNO will loose a significant
number of PO TS customers to the competitors in the timescale
1995-2005. The PN O will be allowed to provide CATV from
the year 2000 onwards.
Case 4-Southern Europe, Urba n: The mo dern existing in-
frastructure satisfies the present and foreseeable demand for
POTS. The PNO is not allowed to provide CATV, neither is
he intended to do so in the timescale 1995-2005. However,
there will be a regulatory obligation to the PNO to rent “dark
fibers” to CATV operators,
Case 5-Eastern Europe, Subu rban: Has an incomplete
existing network. The existing infrastructure is modern,
less than ten years old. However, this infrastructure is
underdimensioned and cannot satisfy the future demand for
Authorized licensed use limited to: UNIVERSIDADE DE AVEIRO. Downloaded on June 16, 2009 at 10:41 from IEEE Xplore. Restrictions apply.
7/18/2019 Olsen Duarte Et Ali IEEE JSAC 1996
http://slidepdf.com/reader/full/olsen-duarte-et-ali-ieee-jsac-1996 10/20
OLSEN
et ul.:
TECHNO-ECONOMIC EVALUATION
OF
NARROWBAND AND BROADBAND ACCESS NETWORK ALTERNATIVES
1193
70,000~~
60 000/0
50 000~~
40 000~0
l o ~ o o o / o . . . . . . . . .
go ooo/o
. . . . . . . . . . . . . . . . . . . .
80,~oo/o . . . . . . . . . . . . . . . . . . .
. . . . . . . . . . . . . . . . . . . . . . .
. . . . . . . . . . . . . . . . . . . . . . .
OTS
ISDN
CATV
2 Mb/s
asymmetric
- Mb/s symmetric
Fig. 10.
Penetration of services, Case 2.
CATVand
VOD
Headend
Local Exchanae
curb
=not
~ ~ i n ~ ~ ~ t ~ ~ ~
Fig. 11. Representative broadband
PON
architecture.
both POTS and N-ISDN. The PNO may provide CATV from
1995 onwards.
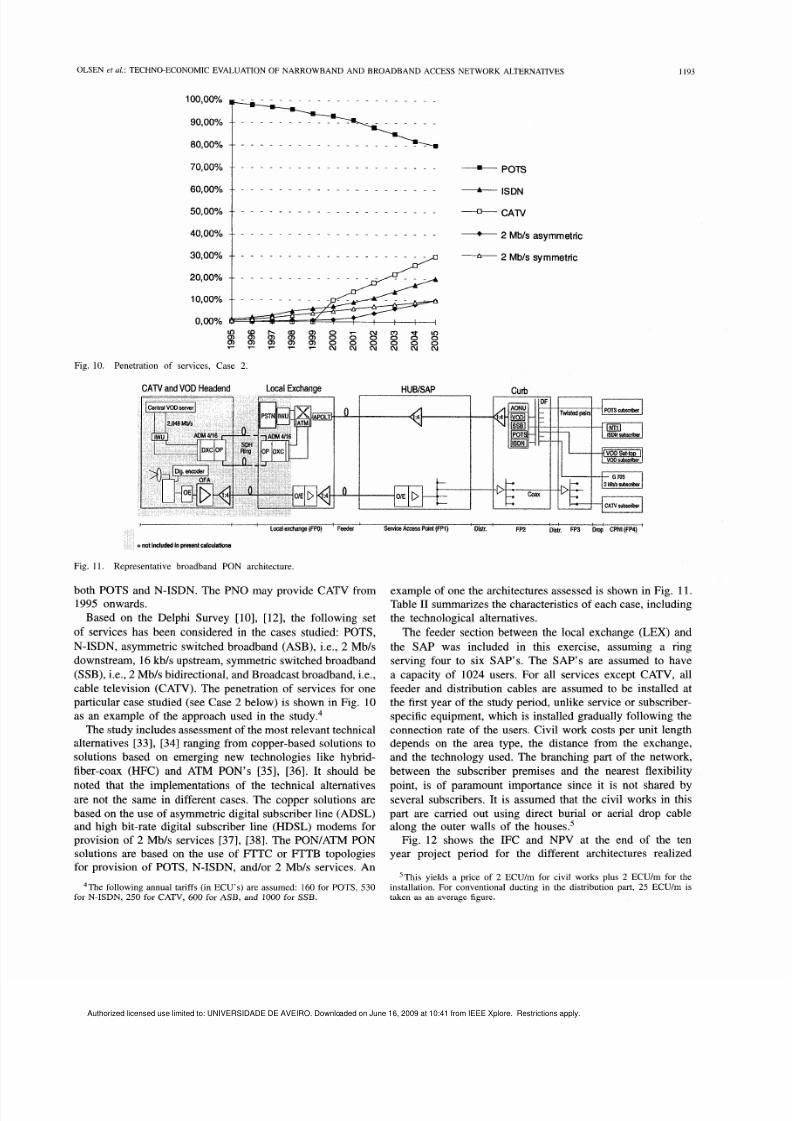
Based on the Delphi Survey [lo], [12], the following set
of
services has been considered in the cases studied: POTS,
N-ISDN , asymm etric switched broadband (ASB), i.e.,
2
Mb/s
downstream, 16 kb/s upstream, symmetric switched broadband
(SSB ), i.e.,
2
Mb/s b idirectional, and Bro adcast broadband, i.e.,
cable television (CATV). The p enetration of services for one
particular case studied (see Case 2 below) is show n in Fig. 10
as an example of the approach used in the study.4
The study includes assessment of the mo st relevant technical
alternatives [33], [34] ranging from copper-based solutions to
solutions based on emerging new technologies like hybrid-
fiber-coax
(HFC)
and ATM
PON’s
[35], [36]. It should be
noted that the implementations of the technical alternatives
are not the same in different cases. The copper solutions are
based on the use
of
asymm etric digital subscriber line (AD SL)
and high bit-rate digital subscriber line (HDSL) modems for
provision of 2 Mb/s services [37], [38]. The PON/ATM PON
solutions are based on the use of FTTC or FTTB topologies
for provision of POTS, N-ISDN, and/or 2 Mb/s services. An
4The following annual tanffs (in ECU’s) are assumed: 160 for POTS, 530
for N-ISDN, 250 for CATV, 600 for
ASB,
and 1000 for
SSB.
example of one the architectures assessed is sho wn in Fig. 1 1.
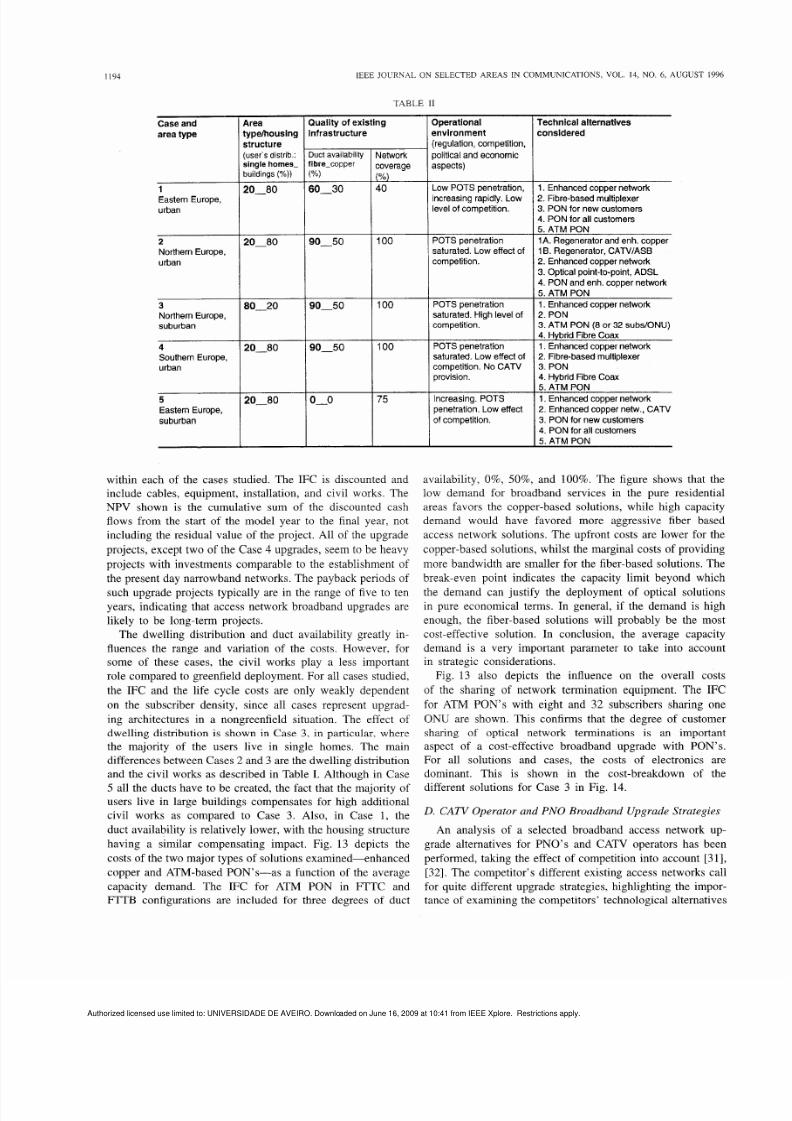
Table
I1
summ arizes the characteristics of each case, including
the technological alternatives.
The feeder section between the local exchange
(LEX)
and
the SAP was included in this exercise, assuming a ring
serving four to six SAP’s. The SAP’s are assumed to have
a capacity of 1024 users. For all services except CATV, all
feeder and distribution cables are assumed to be installed at
the first year of the study period, unlike service or subscriber-
specific equipment, which is installed gradually following the
connection rate of the users. Civil work costs per unit length
depends on the area type, the distance from the exchange,
and the technology used. The branching part of the network,
between the subscriber premises and the nearest flexibility
point, is of paramount importance since it is not shared by
several subscribers. It is assumed that the civil works in this
part are carried out using direct burial or aerial drop cable
along the outer walls
of
the houses.5
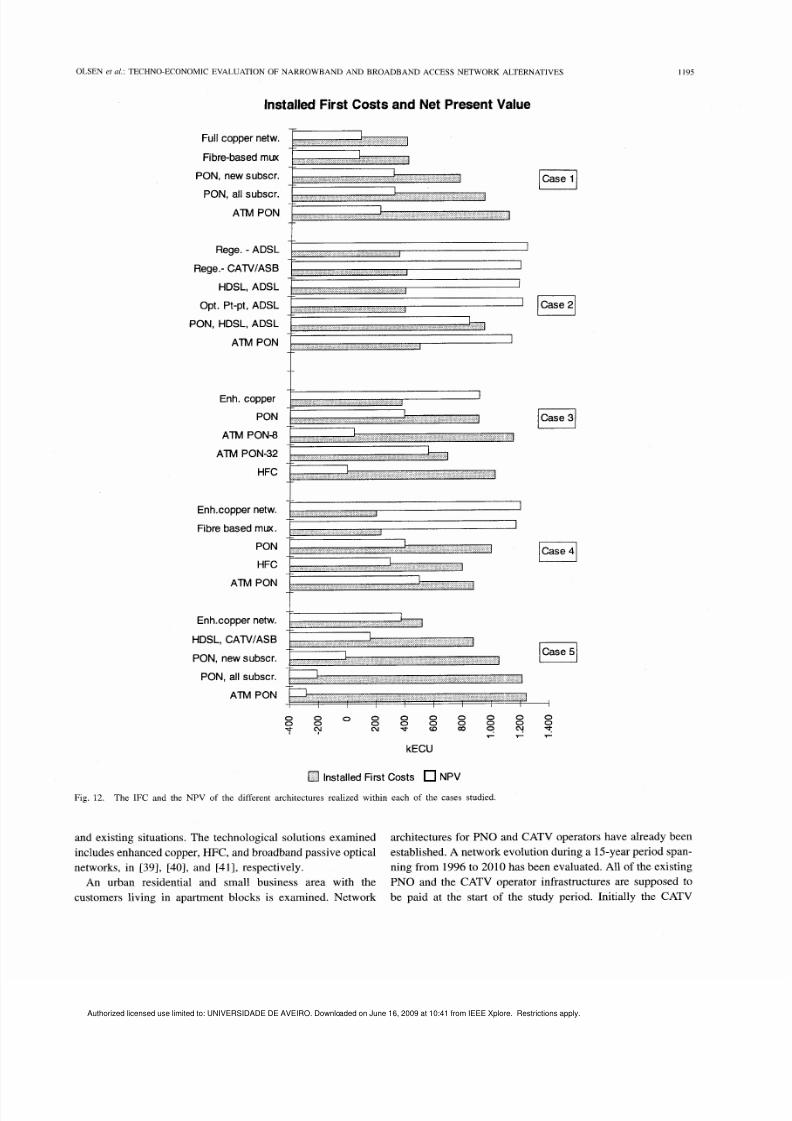
Fig.
12
shows the IFC and NPV at the end of the ten
year project period for the different architectures realized
5This
yields
a
price of 2 ECU/m for civil works plus 2 ECU/m for the
installation. For conventional ducting in
the
distribution part, 25 ECU/m
is
taken
as
an average figure.
Authorized licensed use limited to: UNIVERSIDADE DE AVEIRO Downloaded on June 16 2009 at 10:41 from IEEE Xplore Restrictions apply
7/18/2019 Olsen Duarte Et Ali IEEE JSAC 1996
http://slidepdf.com/reader/full/olsen-duarte-et-ali-ieee-jsac-1996 11/20
IEEE JOURWAL ON SELECTED AREAS IN COMMUNICATIONS,
VOL.
14, NO. 6, AUGUST 1996
75
Case and
area type
provision.
increasing. POTS
penetration.Low effect
of
competition.
1
Eastern Europe,
urban
2
Northern Europe,
urban
3
Northern Europe,
suburban
4
Southern Europe,
urban
5
Eastern Europe,
suburban
Area
typefhouslng
structure
(user‘s distrib.:
single homes-
buildings ( ))
20-80
20-80
80 20
20 80
20-80
TABLE
I1
Quaiitv
of
existing
I
Operational
infrastructure
Duct availability
f
bre-copper
Y o )
60-30
90 50
90-50
90-50
0-0
Network
coverage
environment
(regulation, competition,
political and economic
aspects)
40
Low POTS penetration,
increasing rapidly. Low
level
of
competition.
Technical alternatives
considered
1.
Enhanced copper network
2.
Fibre-based multiplexer
3.
PON for new customers
4. PON for all customers
5. ATM PON
IA . Regenerator and enh. copper
1B .
Regenerator, CATVIASB
2. Enhanced copper network
3. Optical point-to-point, ADSL
4. PON and enh. copper network
5.
ATM PON
1. Enhanced copper network
2.
PON
3.
ATM PON (8 or
32
subdONU)
4. Hybrid Fibre Coax
1. Enhanced copper network
2. Fibre-basedmultiplexer
3.
PON
4.
Hybrid Fibre Coax
5.
ATM PON
1. Enhanced copper network
2.
Enhanced copper netw., CATV
3. PON for new customers
4. PON for all customers
5. ATM PON
within each of the cases studied. The IFC is discounted and
include cables, equipment, installation, and civil works. The
NPV shown is the cumulative sum of the discounted cash
flows from the start
of
the model year to the final year, not
including the residual value
of
the project. All
of
the upgrade
projects, except two of the Case
4
upgrades, seem to be heavy
projects with investments comparable to the establishment of
the present day narrowband networks. The payback periods
of
such upgrade projects typically are in the range of five to ten
years, indicating that access network broadband upgrades are
likely to be long-term projects.
The dwelling distribution and duct availability greatly in-
fluences the range and variation of the costs. However, for
some of these cases, the civil works play a less important
role comp ared to greenfield deploy ment. For all cases studied,
the IFC and the life cycle costs are only weakly dependent
on the subscriber density, since all cases represent upgrad-
ing architectures in a nongreenfield situation. The effect
of
dwelling distribution is shown in Case 3, in particular, where
the majority of the users live in single homes. The main
differences between Cases
2
and 3 are the dwe lling distribution
and the civil works as described in Table I. Although in Case
5 all the ducts have to be created, the fact that the majority of
users live in large buildings compensates for high additional
civil works as compared to Case 3. Also, in Case 1, the
duct availability is relatively lower, with the housing structure
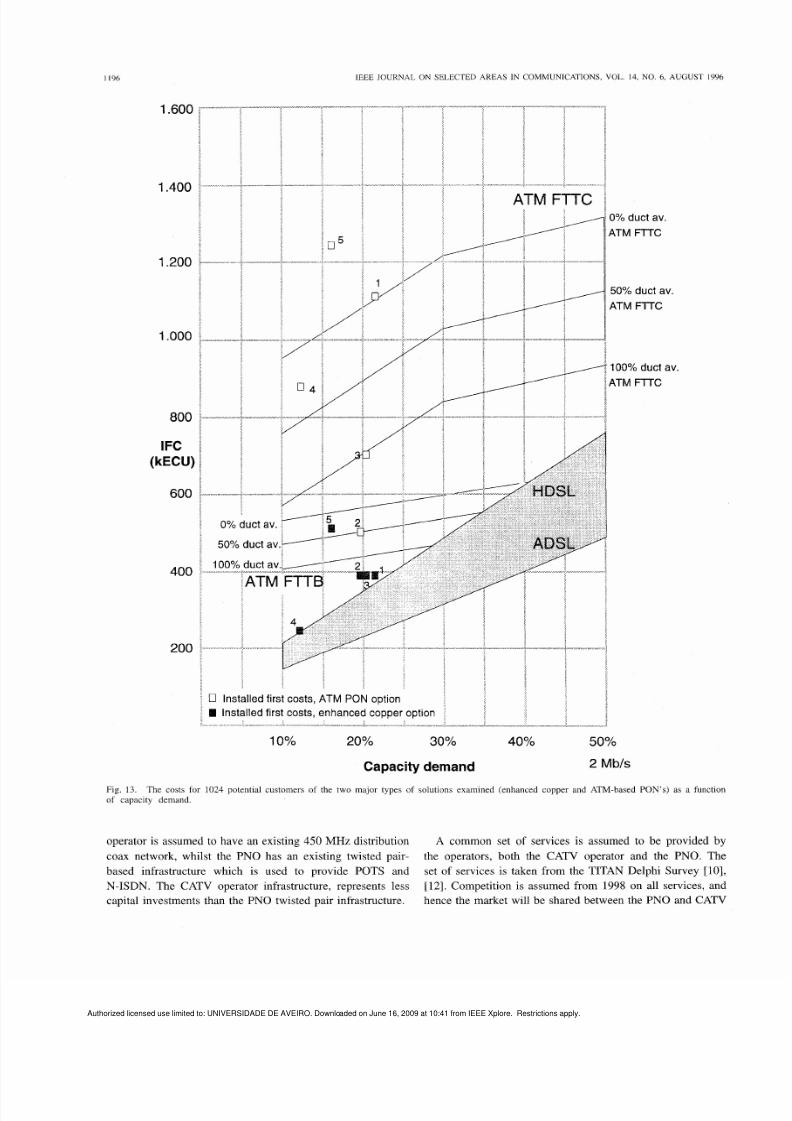
having a similar compensating impact. Fig.
13
depicts the
costs of the two major types of solutions examined+nhanced
copp er and ATM -based PON’s-as a func tion of the avera ge
capacity demand. The IFC for ATM PON in FTTC and
FTTB configurations are included for three degrees of duct
availability, 0 ,
50 ,
and 100 . The figure shows that the
low demand for broadband services in the pure residential
areas favors the copper-based solutions, while high capacity
demand would have favored more aggressive fiber based
access network solutions. The upfront costs are lower for the
copper-based solutions, whilst the marginal costs of providing
more bandw idth are smaller for the fiber-based solutions. Th e
break-even point indicates the capacity limit beyond which
the demand can justify the deployment
of
optical solutions
in pure economical terms. In general, if the demand is high
enough, the fiber-based solutions will probably be the most
cost-effective solution. In conclusion, the average capacity
demand is a very important parameter
to
take into account
in strategic considerations.
Fig. 13 also depicts the influence on the overall costs
of the sharing of network termination equipment. The IFC
for ATM PON’s with eight and
32
subscribers sharing one
ONU are shown. This confirms that the degree of customer
sharing of optical network terminations is an important
aspect of a cost-effective broadband upgrade with PON’s.
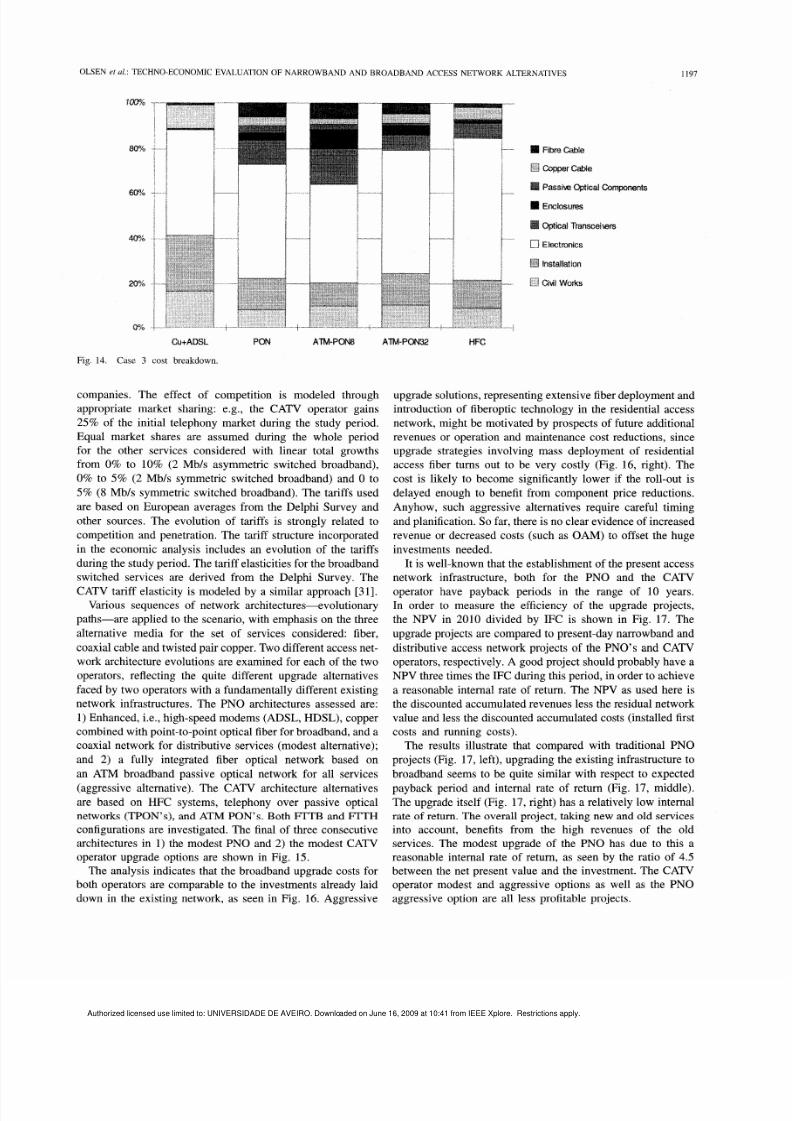
For all solutions and cases, the costs
of
electronics are
dominant. This is shown in the cost-breakdown of the
different solutions for Case
3
in Fig. 14.
D . CATV
Operator and PNO Broadband Upgrade Strategies
An analysis of a selected broadband access netw ork up-
grade alternatives for PNO’s and CATV operators has been
performed, taking the effect of comp etition into account [3 ],
[32]. The competitor’s different existing access networks call
for quite different upgrade strategies, highlighting the impor-
tance of exam ining the com petitors’ technological alternatives
Authorized licensed use limited to: UNIVERSIDADE DE AVEIRO Downloaded on June 16 2009 at 10:41 from IEEE Xplore Restrictions apply
7/18/2019 Olsen Duarte Et Ali IEEE JSAC 1996
http://slidepdf.com/reader/full/olsen-duarte-et-ali-ieee-jsac-1996 12/20
OLSEN et al.: TECHNO-ECONOMIC EVALUATION
OF
NARROW BAND AND BROADBA ND ACCESS NETWORK ALTERNATIVES
1195
Fig. 12.
Installed First Co sts and Net Pres ent Value
Full copper netw.
Fibre-based
rnux
PON, new subscr.
PON, all subscr.
ATM PON
Rege. - ADSL
Rege.- CAlV /AS B
HDSL, ADSL
Opt. P t-pt, ADSL
PON, HDSL, ADSL
ATM PON
Enh. copper
PON
ATM PONS
ATM PON-32
HFC
Enh.copper netw.
Fibre based
mux.
PON
HFC
ATM PON
Enh.copper netw.
HDSL, CAlV/ASB
PON, new subsc r.
PON, all subscr.
ATM PON
kECU
0 Installed First Costs NPV
The IFC and the NPV ot the different architectures realized within each of the cases studied
and existing situations. The technological solutions examined
includes enhanced copper, HFC, and broadband p assive optical
networks, in [39], [40], and [41], respectively.
An urban residential and small business area with the
customers living in apartment blocks is examined. Network
architectures for PNO and CATV operators have already been
established. A network evolution during a 15-year period span-
ning from 1996 to 2010 has been evaluated. All of the existing
PNO
and the CATV operator infrastructures are supposed to
be paid at the start of the study period. Initially the CATV
Authorized licensed use limited to: UNIVERSIDADE DE AVEIRO Downloaded on June 16 2009 at 10:41 from IEEE Xplore Restrictions apply
7/18/2019 Olsen Duarte Et Ali IEEE JSAC 1996
http://slidepdf.com/reader/full/olsen-duarte-et-ali-ieee-jsac-1996 13/20
IEEE
JOURNAL ON SELECTED AREAS IN COMMUN ICATIONS, VOL. 14, NO. 6, AUGUST 1996
I96
1.600
1.400
1.200
1 ooo
800
IFC
kECU)
600
400
200
--
--
0
duct av.
50
duct av
100
duct ac
ATM
nstalled
first
costs, ATM PON option
nstalled first costs, enhanced copper option
lxxi
~
~-
X I l l l l
10 20
30
Capacity demand
ATM
FTTC
0 duct av.
ATM FTTC
50 duct av.
ATM FTTC
100°/o
duct av.
ATM
FTTC
Fig.
13.
of capacity demand.
The costs for 1024 potential customers of the two major types of solutions examined (enhanced copper and ATM-based PON's) as a function
operator
is
assumed to have an existing
450
MHz distribution
coax network, whilst the PNO has an existing twisted pair-
based infrastructure which is used
to
provide POTS and
N-ISDN. The CATV operator infrastructure, represents less
capital investments than the PNO twisted pair infrastructure.
A common set of services is assumed to be provided by
the operators, both the CATV operator and the PNO. The
set of services is taken from the TITAN Delphi Survey
[lo],
[12].
Competition is assumed from
1998
on all services, and
hence the market will be shared between the PNO and CATV
Authorized licensed use limited to: UNIVERSIDADE DE AVEIRO Downloaded on June 16 2009 at 10:41 from IEEE Xplore Restrictions apply
7/18/2019 Olsen Duarte Et Ali IEEE JSAC 1996
http://slidepdf.com/reader/full/olsen-duarte-et-ali-ieee-jsac-1996 14/20
OLSEN
et
al.: TECHNO-ECONOMIC EVALUATION OF NARROWBAND AND BROADBAND ACCESS NETWORK ALTERNATIVES
1197
Fig. 14. Case 3 cost
breakdown.
companies. The effect of competition is modeled through
appropriate market sharing: e.g., the CATV operator gains
25
of the initial telephony market during the study period.
Equal market shares are assumed during the whole period
for the other services considered with linear total growths
from
0
to 10 (2 Mb/s asymmetric switched broadband),
0 to 5
(2
Mb/s symmetric switched broadband) and 0 to
5
(8 Mb/s symm etric switched broadband). The tariffs used
are based on European averages from the Delphi Survey and
other sources. The evolution of tariffs is strongly related to
competition and p enetration. The tariff structure incorporated
in the economic analysis includes an evolution of the tariffs
during the study period. The tariff elasticities for the broadb and
switched services are derived from the Delphi Survey. The
CATV tariff elasticity is mod eled by a similar approach [31].
Various sequences of network architectures-evolutionary
paths-are applied to the scenario, with emp hasis on the three
alternative media for the set of services considered: fiber,
coaxial cable and twisted pair copper. Two d ifferent access net-
work architecture evolutions are examined for each of the two
operators, reflecting the quite different upgrade alternatives
faced by two o perators with a fundam entally different existing
network infrastructures. The PNO architectures assessed are:
1) Enhanced, i.e., high-speed modems (A DSL,
HDSL),
copper
combined with point-to-point optical fiber for broadband, an d a
coaxial network for distributive services (modest alternative);
and 2) a fully integrated fiber optical network based on
an ATM broadband passive optical network for all services
(aggressive alternative). The CATV architecture alternatives
are based on HFC systems, telephony over passive optical
networks (TPON’s), and ATM PON’s. Both FTTB and FTTH
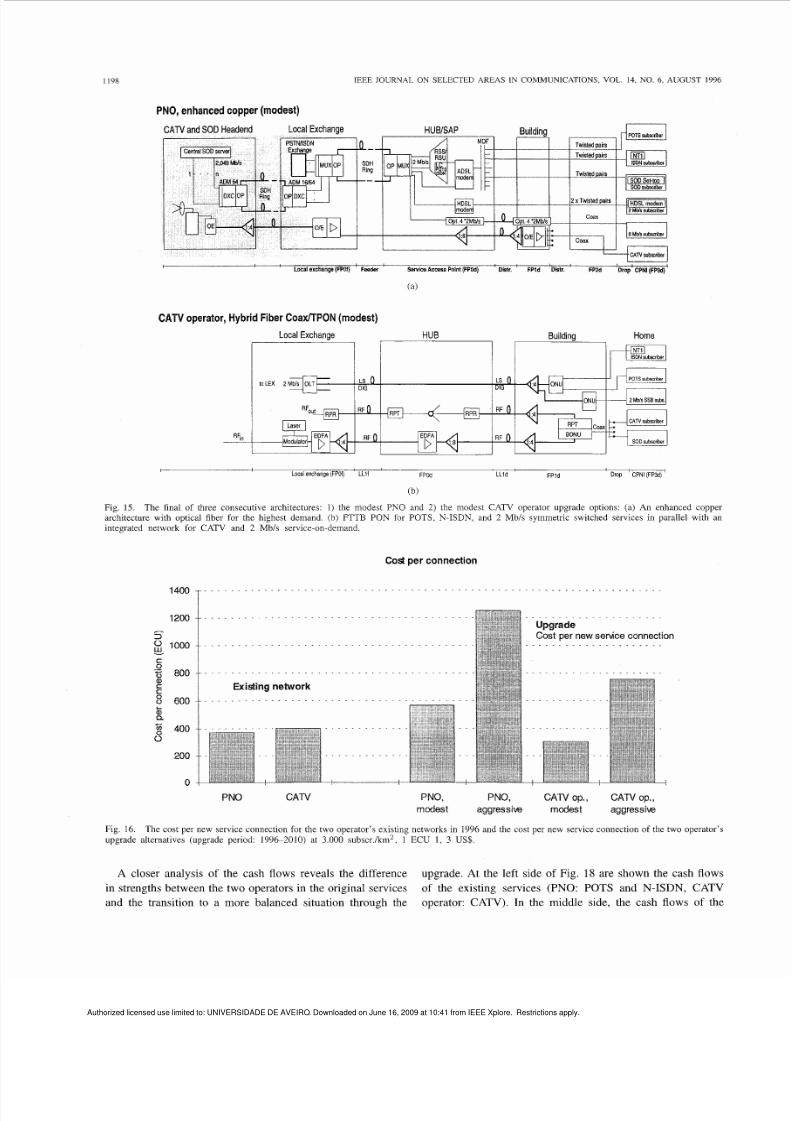
configurations are investigated. The final of three consecutive
architectures in 1) the mod est PNO and
2)
the modest CATV
operator upgrade options are shown in Fig.
15.
The analysis indicates that the broadban d upgrade costs for
both o perators are comparable to the investmen ts already laid
down in the existing network, as seen in Fig. 16. Aggressive
upgrade solutions, representing extensive fiber deployment and
introduction of fiberoptic technology in the residential access
network, might be motivated by prospects of future additional
revenues or operation and maintenance cost reductions, since
upgrade strategies involving mass deployment of residential
access fiber turns out to be very costly (Fig. 16, right). The
cost is likely to become significantly lower if the roll-out is
delayed enough to benefit from component price reductions.
Anyhow, such aggressive alternatives require careful timing
and planification. So far, there is no clear eviden ce of increased
revenue or decreased costs (such as OAM) to offset the huge
investments needed.
It is well-known that the establishment
of
the present access
network infrastructure, both for the PNO and the CATV
operator have payback periods in the range of 10 years.
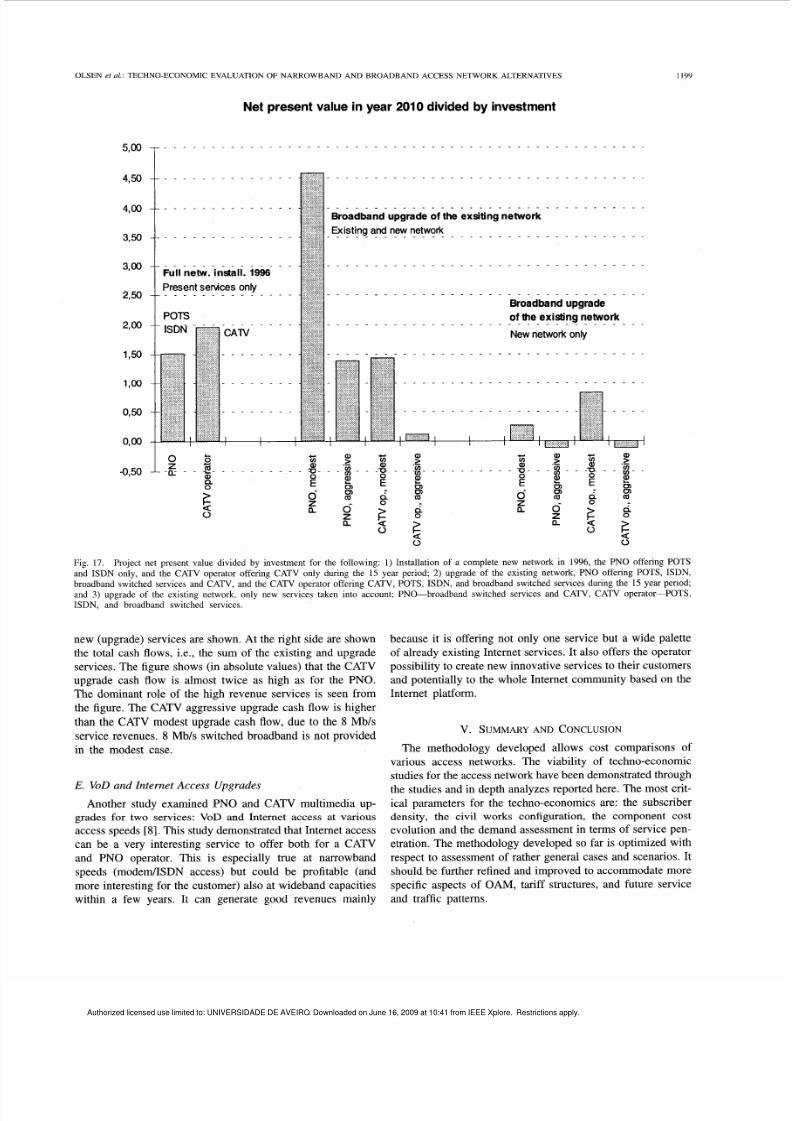
In order to measure the efficiency of the upgrade projects,
the NPV in 2010 divided by IFC is shown in Fig. 17. The
upgrade projects are compared to present-day narrowband and
distributive access netw ork projects of the PNO’s and CATV
operators, respectively. A good p roject should probably have a
NPV three times the IFC during this period, in order to achieve
a reasonable internal rate of return. The NPV as used here is
the discounted accum ulated revenues less the residual network
value and less the discounted accumulated costs (installed first
costs and running costs).
The results illustrate that compared with traditional PNO
projects (Fig. 17, left), upgrading the existing infrastructure to
broadband seems to be quite similar with respect to expected
payback period and internal rate
of
return (Fig. 17, middle).
The upg rade itself (Fig. 17, right) has a relatively low internal
rate of return. The overall project, taking new and old services
into account, benefits from the high revenues of the old
services. The modest upgrade of the PNO has due to this a
reasonable internal rate of return, as seen by the ratio
of 4.5
between the net present value an d the investment. The CATV
operator modest and aggressive options as well as the PNO
aggressive option are all less profitable projects.
Authorized licensed use limited to: UNIVERSIDADE DE AVEIRO Downloaded on June 16 2009 at 10:41 from IEEE Xplore Restrictions apply
7/18/2019 Olsen Duarte Et Ali IEEE JSAC 1996
http://slidepdf.com/reader/full/olsen-duarte-et-ali-ieee-jsac-1996 15/20
119X
IEEE JOURNAL
ON SELECTED
AREAS IN COMMUNICATIONS, VOL.
14
NO.
6,
AUGUST
1996
PNO, enhanced copper
(modest)
' Locelexcharqe(mD1) Fssder servicaAccssePolnt(Fwd)
DMr. '
FPld
Dlolr.
'
(a)
CATV
operato r, Hybr id Fiber CoaxfTPON (modes t)
I
Loca exchange(FPC ' LLl l FPW LLld FPld
Drop
CPNI (FPBd)'
(b)
Fig. 15. The final of three consecutive architectures: 1) the modest PNO and 2) the modest CATV operator upgrade options: (a) An enhanced copper
architecture with optical fiber for the highest demand. (b) F?TB PON for POTS. N-ISDN, and 2 Mb/s symmetric switched services in parallel with an
integrated network for CATV and 2 Mh/s service-on-demand.
Cost
per
connection
. . . . . . . . . . . . . . . . . . . . . . . . . . . .
I4Oo T
1200
c
2
1000
C
W
c
g a00
8 600
g 400
a
+-
200
j . . .
. . . . . . . . . . . . . . . . . . . . . . . . . . . .
Existing
network
. . . . . . . . . . . .
-
PNO
C A N
. .
. . . . . . . . . . . . . . . . . . .
Upgrade
Cost per new service connection
. . . . . . . . . . . . . . . . . . . .
PNO,
PNO
CATV
op. CATV op.,
modest aggressiw modest
aggressive
Fig. 16.
upgrade alternatives (upgrade period: 1996-2010) at 3.000 subscr,/km2, 1 ECU 1, 3 US .
The cost per new service connection for the two operator's existing networks in 1996 and the cost per new service connection
of
the two operator's
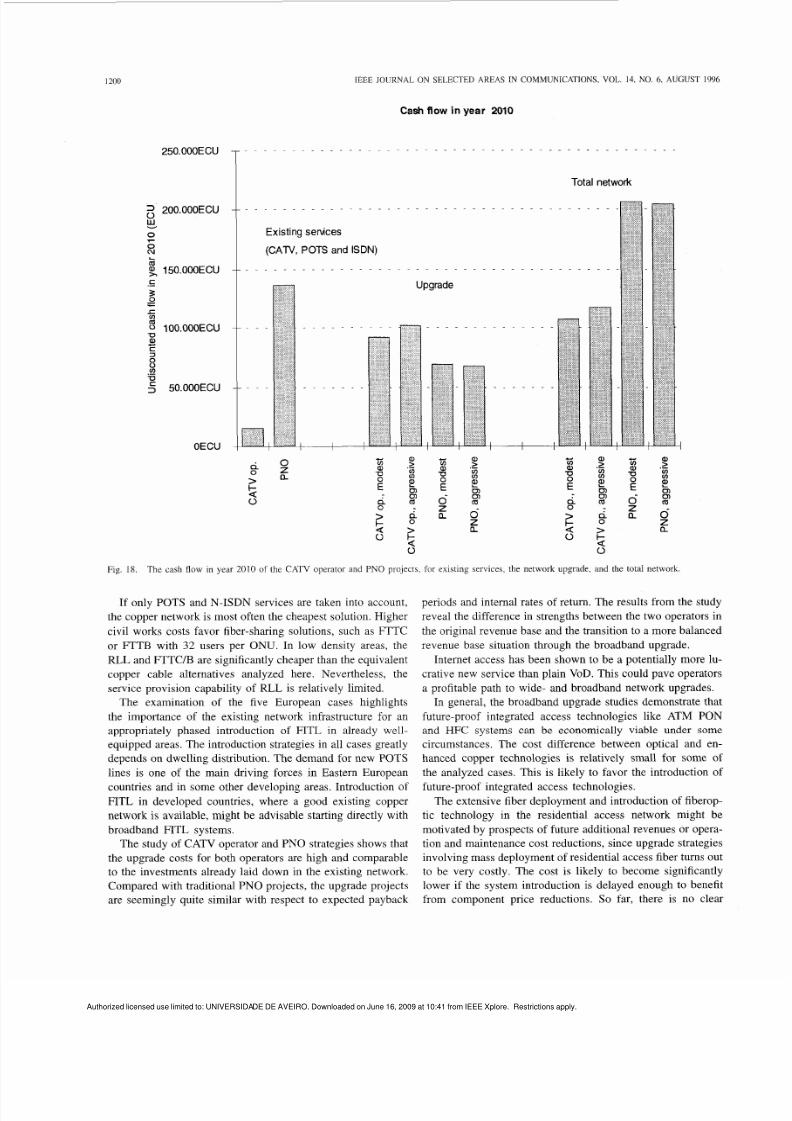
A closer analysis
of
the cash flows reveals the difference
in strengths between the two operators in the original services
and the transition to a more balanced situation through the
upgrade. At the left side
of
Fig.
18
are shown the cash flows
of
the existing services (PNO: POTS and N-ISDN, CATV
operator:
CATV).
In the middle side, the cash flows
of
the
Authorized licensed use limited to: UNIVERSIDADE DE AVEIRO Downloaded on June 16 2009 at 10:41 from IEEE Xplore Restrictions apply
7/18/2019 Olsen Duarte Et Ali IEEE JSAC 1996
http://slidepdf.com/reader/full/olsen-duarte-et-ali-ieee-jsac-1996 16/20
OLSEN ef
al.:
TECHNO-ECONOMIC EVALUATION OF NARROWBAND AND BROADBAND
ACCESS
NETWORK ALTERNATIVES
1199
Net present value in year
2010
divided
by
investment
. . . . . . . . . . . . . . . . . . . . . . . . . . . . . . . . .
. . . . . . . . . . . . . . . . . . . . . . . . . . . . . . . . . .
Broadband upgrade
of
the exsiting network
Exist ing and new network
. . . . . . . . . . . . . . . . . . . . . . . . . . . . . . . .
. . . . . . . . . . . . . . . . . . . . . . . . . . . . . . . . . .
. . . . . . . . . . . . . . . . . . . . . . . . . . . . . . . . . .
Broadband upgrade
of the existing network
New network only
. . . . . . . . . . . . . . . . . . . . . . . . . . . . . . . . . .
. . . . . . . . . . . . . . . . . . . . . . . . . .
. . . . . . . . . . . . . . . . . . . . . . . . . .
. . . . . . .
. . . . . . . . . . . . . . . . . .
. . . . . . .
L
2
. . . . . . . . .
4
a
z
a
z 4
d
z
a
Fig. 17. Project net present value divided by investment for the following:
1)
Installation of
a
complete new network in 1996, the PNO offering POTS
and ISDN only, and the CATV operator offering CATV only during the 15 year period; 2) upgrade of the existing network, PNO offering POTS, ISDN,
broadband switched services and CATV, and the CATV operator offering CATV, POTS, ISDN, and broadband switched services during the 15 year period;
and
3)
upgrade of the existing network, only new services taken into account: PNO-broadband switched services and CATV, CATV operator-POTS,
ISDN, and broadband switched services.
new (up grade) services are shown. At the right side are shown
the total cash flows, i.e., the sum of the existing and upgrade
services. The figure shows (in ab solute values) that the CATV
upgrade cash flow is almost twice as high as for the PNO.
The dominant role of the high revenue services is seen from
the figure. The CATV ag gressive upgrade cash flow is higher
than the CATV mo dest upgrade cash flow, due to the
8
Mb/s
service revenues.
8
Mb/s switched broadband is not provided
in the modest case.
E VoD
and
Internet Access
Upgrades
Another study examined PNO and CATV multimedia up-
grades for two services:
VoD
and Internet access at various
access speeds [8]. This study dem onstrated that Internet access
can be a very interesting service to offer both for a CATV
and PNO operator. This is especially true at narrowband
speeds (modem/lSDN access) but could be profitable (and
more interesting for the customer) also at wideban d capacities
within a few years. It can generate good revenues mainly
because it is offering not only one service but a wide palette
of already existing Internet services. It also offers the op erator
possibility to create new innovative services to their custom ers
and potentially to the who le Internet community based on the
Internet platform.
v . SUMMARY AND CONCLUSION
The methodology developed allows cost comparisons of
various access networks. The viability of techno-economic
studies for the access network have been dem onstrated through
the studies and in depth an alyzes reported here. The m ost crit-
ical parameters for the techno-economics are: the subscriber
density, the civil works configuration, the component cost
evolution and the dem and assessment in terms of service pen-
etration. The m ethodology developed
so
far is optimized with
respect to assessment of rather g eneral cases and scen arios. It
should be further refined and improved to accommo date more
specific aspects of O AM , tariff structures, and future service
and traffic patterns.
Authorized licensed use limited to: UNIVERSIDADE DE AVEIRO Downloaded on June 16 2009 at 10:41 from IEEE Xplore Restrictions apply
7/18/2019 Olsen Duarte Et Ali IEEE JSAC 1996
http://slidepdf.com/reader/full/olsen-duarte-et-ali-ieee-jsac-1996 17/20
I200
IEEE JOURNAL ON SELECTED AREAS IN COMMUNICATIONS, VOL. 14, NO. 6, AUGUST 1996
Cash
flow
in
year 2010
2 200.000ECU
N
m
X 150.000ECU
c
.-
-
.K
U
al
K
v
100.000ECU
8
5
5
50.000ECU
OECU
Existing
senices
(CATV, POTS and
ISDN)
Upgrade
.
g g
> a
t
Q
v
a
U
e
d
?
Q
0
a
v
.-
2
m
m
m
d
>
5
P
a
_ _
-
P
a
(3
Fig.
18.
The
cash flow in year
2010
of
the
CATV operator and
PNO
projects.
for
existlng services, the network upgrade, and the total network
If only POTS and N-ISDN services are taken into account,
the copper network is m ost often the cheapest solution. Higher
civil works costs favor fiber-sharing solutions, such as FTTC
or FTTB with
32
users per ONU. In low density areas, the
RLL and FTT C/B are significantly cheaper than the equivalent
copper cable alternatives analyzed here. Nevertheless, the
service provision capability of RLL is relatively limited.
The examination of the five European cases highlights
the importance of the existing network infrastructure for an
appro priately phased introduction of FITL in already well-
equipp ed areas. The introduction strategies in all cases greatly
depends on dwelling distribution. The demand for new POT S
lines is one of the main driving forces in Eastern European
countries and in some o ther developing areas. Introduction of
FITL in developed countries, where a good existing copper
network is available, might be advisable starting directly with
broadband FITL systems.
The study of CATV operator and PNO strategies shows that
the upgrade costs for both operators are high and comparable
to the investments already laid dow n in the existing network.
Compared with traditional PNO projects, the upgrade projects
are seemingly quite similar with respect to expected payback
periods and internal rates of return. T he results fro m the study
reveal the difference in strengths between the two operators in
the original revenue base an d the transition to a more balanc ed
revenue base situation through the broad band upgrade.
Internet access has been shown to be a potentially more lu-
crative new service than plain VoD. This could pave operators
a profitable path to wide- and broadband network upgrades.
In general, the broadband upgrade studies demonstrate that
future-proof integrated access technologies like ATM PON
and HFC systems can be economically viable under some
circumstances. The cost difference between optical and en-
hanced copper technologies
is
relatively small for some
of
the analyzed cases. This is likely to favor the introduction of
future-proof integrated access technologies.
The extensive fiber deployment and introduction of fiberop-
tic technology in the residential access network might be
motivated by prospects of future additional revenues or opera-
tion and maintenance cost reductions, since upgrade strategies
involving mass deployment of residential access fiber turns out
to be very costly. The cost is likely to become significantly
lower if the system introduction is delayed enough to benefit
from component price reductions.
So
far, there is no clear
Authorized licensed use limited to: UNIVERSIDADE DE AVEIRO. Downloaded on June 16, 2009 at 10:41 from IEEE Xplore. Restrictions apply.
7/18/2019 Olsen Duarte Et Ali IEEE JSAC 1996
http://slidepdf.com/reader/full/olsen-duarte-et-ali-ieee-jsac-1996 18/20
OLSEN et
ul.:
TECHNO-ECONOMIC EVALUATION OF NARROW BAND AND BR OADBA ND ACCESS NETWORK ALTERNATIVES
1201
evidence of increased revenue
or
decreased costs (such as
OAM) to offset the huge investments needed.
Rolling out fiber remains a key decision
of
great strategic
importance in access network upgrading, due to the expected
longer lifetime of o ptical cable infrastructure as com pared to
the system technologies.
ACKNOWLEDGMENT
TITAN is project
2087 of
the European RACE program.
This paper is also based on results achieved in the Eurescom
P306 project. The authors gratefully acknowledge the support
of the European Com mission and Eurescom 6 in carrying out
this work. Members of RA CE 20 87/TITAN : A. Zaganiaris,
D.
Joram (CNET-France Telecom-F),
B .
T. Olsen, K. Stordahl,
L.
A. Ims, T. gverli (Telenor Research-N),
S .
Markatos
(Univ. of Athens-GR), M . Tahkoko rpi, M. Kalervo, I. Welling
(Nokia-FIN),
J.
Mononen, M. Liihteenoja (Telecom Finland-
FIN), N. Kerteux (MET-F), M. De Bortoli, U. Ferrero, M.
[I41
D.
Gardan, A. Zaganiaris, A. Madani, R. Madigou, and
D.
Machon,
“Techno-economics of advanced optical subscriber networks,” in
Proc.
IEEE GLOBECOM’89,
Dallas, TX, Nov. 27-30, 1989.
[IS] A. Zaganiaris, D. Gardan, A. Roosma, M. Potts, R. Beeler, and A.
Socard, “Fiber to the home, A techno-economic evaluation within
Europe, by RACE program,” in Proc. ISSLS’91 Amsterdam, The
Netherlands, Apr. 22-26, 1991.
[16] T. P. Wright, “Factors affecting the cost of airplanes,”
J
Aeronautic
Science, vol. 3, no. 4, pp. 122-128, 1936.
[17] J. R. Crawford, “Learning curve, ship curve, ratios, related data,”
Lockheed Aircraft Corporation, 1944.
[
181 L. E. Yelle, “The learning curve: Historical review and comprehensive
survey,” Decision Science, vol. 10, no. 2, pp. 302-328, 1979.
[19] B. T. Olsen, A. Zaganiaris, N. Gieschen, M. Tahkokorpi, M. Drieskens,
and
S.
Markatos, “RACE 2087/TITAN: Tool for introduction scenarios
and techno-economic studies for the access network,” in
Proc. M C E
Open Workshop Broudhund Access, Nijmegen, The Netherlands, June
7-8,
1993.
[20] A. Zaganiaris, N. Gieschen, B. T. Olsen, K. Stordahl, M. Tahkokorpi,
M. Drieskens, and A. Ajibulu, “A methodology for achieving life-cycle
costs of optical access networks-from RACE 2087/TITAN,” in
Proc.
l l t h Annu Conf: EFOC’93,
the Hague, The Netherlands, June 30-July
2, 1993.
[21] A. Zaganiaris, M. Tahkokorpi, M . Drieskens,
J.
Van Hoecke, B. T.
Olsen,
S .
Markatos, and
M .
De Bortoli, “Life-cycle costs and economical
Ravera,
S .
Balzaretti, (CSELT-I), M. Drieskens,
J.
Kraushaar,
J.
van (Raynet-B), N. Gieschen (DBP-Telekom-D)
F.
Fleuren (KPN-NL), M. De Oliveira Duarte, E. de Castro,
budget of optical and hybrid access networks,” in Proc. 5th IEEE Con
OpticaUHybrid
Access
Networks ,
Montreal, Canada, Sept. 7-9, 1993.
[22] R. Diaz de la Iglesia, “Service-affecting optoelectronic failures in FITL
systems: Downtime, repair actions and maintenance expenses,”
IEEE J
M. J. Oliveira (Univ. Aveiro-P), and R. Diaz de la Iglesia
(Telefonica-SP).
Select. Areas Commun., vol. 12, no. 2, Feb. 1994.
[23] A. Zaganiaris, U. Ferrero, S. Balzaretti, M. Tahkokorpi, M. Kalervo,
B.
T.
Olsen, and K. Stordahl, “Methodology for risk assessment and
REFERENCES
111 P. Kaiser and T. Swanenburg, “Introduction to the 2nd RACE/Bellcore
workshop on optical networks,” in Proc.
2nd
RACE/Bellcore Workshop
Opt. Networks , Red Bank, NJ, Feb. 17-19, 1993.
[2] J Stern, “The evolution of broadband multimedia networks,” in
Proc.
6th Int. IEEE Workshop OAN’94, Kyoto, Japan, Oct. 16-19, 1994.
[3] H. L. Lemberg, “Evolution of optical fiber-based access networks in
the US., ” in
Proc.
6th
lnt.
IEEE Workshop OAN’94, Kyoto, Japan, Oct.
16-19, 1994.
[4] A. Cook and J. Stern, “Optical fiber access-Perspectives toward the
21st century,”
lEEE Commun Mug. ,
vol. 32, no. 2, pp. 78-86, Feb.
1994.
[SI D. P. Reed, Residential Fiber Optic Networks: An Engineering and
Economic Anulysis.
[6] P. LeBel and R. Oliver, “Residential broadband architectures strategies
and economics,” in Proc. 7th Int. IEEE Workshop OAN’95, Nuremberg,
Germany, Sept. 24-27, 1995.
[7] J.
Saijonmaa, M. Tahkokorpi, and 1. Welling, “Cost
of
investment
and revenue modeling and analysis of various networked multimedia
services in PTO and CATV operator environments,”
in
Proc. TELE-
COM ’95, Technol. Sum mit,
Geneva, Switzerland, Oct. 3-1 1, 1995, pp.
629-633.
[8] K. W. Lu, M. 1. Eiger, and
H.
L. Lemberg, “System and cost analysis
of broadband fiber loop architectures,” IEEE J Select. Areas Commun.,
vol.
8,
no.
6,
pp. 1058-1067, June 1990.
[9]
K.
Stordahl and
E.
Murphy, “Methods for forecasting long term demand
for wide and broadband services in the residential market,”
IEEE
Commun Mag., vol. 33 , no. 2, pp. 44449, Feb. 1995.
[IO] D. P. Luck, “Broadband to the home: Evolution scenarios for Australia,”
in Proc. 13th Annu Con EFOC&N’95, Brighton, UK, June 27-30,
199.5,
[ 1
11 K. Stordahl, B. T. Olsen, E. Murphy, A. Zaganiaris, E. Castro, and M.
Ravera, “Delphi survcy: Forecasting demand for wide- and broadband
services. From RACE 2087/TITAN,” in
Proc. 6th Inte.
IEEE
Workshop
OAN’94,
Kyoto, Japan, Oct. 16-19, 1994.
1121 D. P. Malley and 0
K.
Tonguz, “Fiber in the loop: Where and when is it
feasible,” IEEE J. Select. Areas Commun., vol. 10, no. 9, pp. 1523-1544,
Dec. 1992.
[I31 T. Miki, “Toward the service-rich era,” IEEE Commun. Mug., vol. 32,
no. 2, pp. 34-39, Feb. 1994.
Norwood, MA: Artech, 1992.
6This does not imply that it reflects a common technical po3ition of all the
Eurescom sharcholderdparties.
_.
techno-economic evaluation
of
optical access networks,” in Pmc. 20th
ECOC’94, Florence, Italy, Sept. 25-29, 1994.
[24] A. Zaganiaris, B. T. Olsen, K. Stordahl,
M.
De Bortoli, and M.
Tahkokorpi, “Life-cycle cost and risk assessment of the access network.
From RACE 2087/TITAN.” in Proc. 6th Int Workshoa OAN’94, Kyoto,
Japan, Oct. 16-19, 1994.
L. Ims, D. Myhre, B. T. Olsen, J . Mononen,
M.
Lathenooia, U. Ferrero,
A. Zaganiaris, K. Szomolanyi, and I. Orfanos, “Advanced multiservice
scenarios for EuroDe,” in Proc. 13thAnnu.
Conf:
EFOCdtN’95. Brighton.
UK, June 27-30,
~
1995.
L.
A. Ims,
B. T
Olsen. D. Mvhre. J. Mononen, M . Lihteenoia. U.
L
Ferrero, and A. Zaganiaris, “Multiservice access network upgrading
in Europe: A techno-economic analysis,” submitted to
IEEE
Commun.
W. Warzanskyj and U. Ferrero, “Access network evolution in Europe:
A view from EURESCOM,” in Proc. 20th
ECOC’94,
Florence, Italy,
Sept. 25-29, 1994.
U. Ferrero, M. de Bortoli, D. Myhre , L. A. Ims, B. T. Olsen, J. Mononen,
M. LXhteenoja, A. Zaganiaris, M. Pousa, K. Szomolinyi, and I. Orfanos,
“Access network upgrade strategies: Mapping the European diversity,”
in Proc. 7th
Int IEEE
Workshop OAN’95, Nuremberg, Germany, Sept.
24-28, 1995.
R. Olivier and P. LeBel, “Evolvability of the hybrid fiber-coax access
network architecture,” in
Proc.
6th Int. IEEE Workshop OAN’94, Kyoto,
Japan, Oct. 16-19, 1994.
B. T. Olsen, L. A. Ims, T. Overli, K. Stordahl, D. Myhre, M. Drieskens,
J. Kraushaar, M. Tahkokorpi, M. Ravera,
M.
De Bortoli, A. Zaganiaris,
S. Markatos, M. LBhteenoja, J. Mononen, and F. Fleuren, “PNO and
CATV operator broadband upgrade technology alternatives: A techno-
economic analysis,” in Proc. OFC’96, San Jose, CA, Feb. 25-Mar. 1,
1996.
B. T. Olsen, L. A. Ims, T. Overli, K. Stordahl, D. Myhre, M. Drieskens,
J. Kraushaar, and A. Zaganiaris, “Techno-economic analysis of PNO and
CATV operator strategies for broadband upgrade of
the
access network,”
in
Proc. Int. Teletrufic Seminar 19 95,
Bangkok, Thailand, Nov. 28-Dec.
1, 1995.
P. J. Dyke, “Evolution of optical fiber access penetration to provide
broadband services-A review of the available options,” in Proc 6th
Int. IEEE Workshop OAN’94, Kyoto, Japan, Oct. 16-19, 1994.
P.
J.
Dyke and D. B. Waters, “A review of the technical options for
evolving FITL to support small business and residential services,” J.
Lightwave Technol., vol. 12, no.
2,
pp. 376-381, Feb. 1994.
W. Verbiest, G . VanderPlas, and D. J. G. Mestdagh, “FITL and B-ISDN:
A marriage with a future,”
IEEE Commun.
Mug., vol. 30, no. 6, pp.
60-66, June 1993.
Y.
Mochida, “Technologies for local-access fibering,” IEEE
Commun.
Mag..
Authorized licensed use limited to: UNIVERSIDADE DE AVEIRO Downloaded on June 16 2009 at 10:41 from IEEE Xplore Restrictions apply
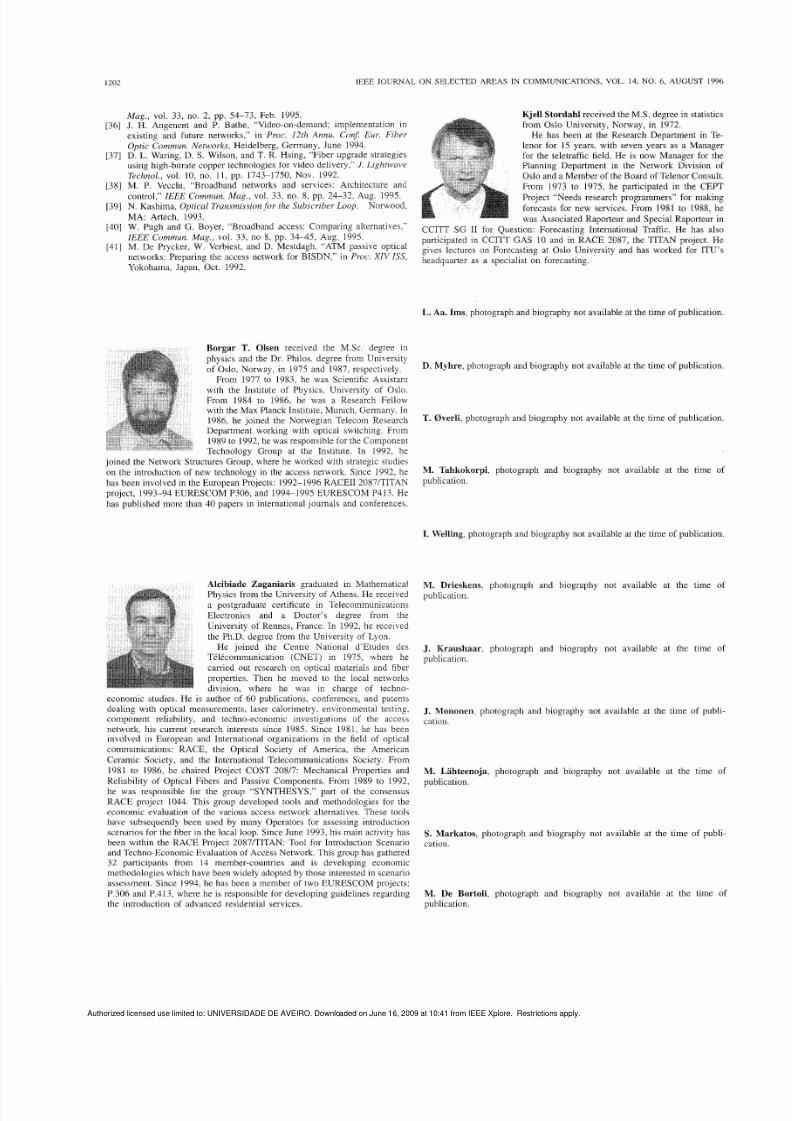
7/18/2019 Olsen Duarte Et Ali IEEE JSAC 1996
http://slidepdf.com/reader/full/olsen-duarte-et-ali-ieee-jsac-1996 19/20
I202
IEEE JOURNAL ON SELECTED AREAS IN COMMUNICATIONS, VOL.
14,
NO 6, AUGUST 1996
Mu g . , vol 33, no
2,
pp 54-73, Feb 1995
Kjell Stordahl
received the M S degree in statistics
existing and future networks,” in Proc
12th Annu Cons
Eur Fiber
He has been at the Research Department in Te-
Optic Commun Nelworks , Heidelberg, Germany, June 1994
lenor for 15 years, with seven years as a Manager
[37] D
L
Waring, D S Wilson, and T R Hsing, “Fiber upgrade strategies
for the teletraffic field He is now Mdnager for the
using high-bitrate copper technologies for video delivery,” J Lighhoaue
Planning Department in the Network Division of
Technol.,
vol 10, no 11, pp 1743-1750, Nov 1992 Oslo and a Member of the Board of Telenor Consult
[38] M P Vecchi, “Broadband networks and services Architecture and From 1973 to 1975, he participated in the CEPT
control,” IEEE Commun M u g , vol 33, no 8, pp. 24-32, Aug 1995
Project “Needs research programmers” for making
[39] N Kashima, Optical
Trunymiysion
or the
Subscriber
Loop Norwood
forecasts for new services From 1981 to 1988, he
MA Artech, 1993
was Associated Raporteur and Special Raporteur in
14”1
Pugh
and
Boyer, “Broadband Compxing CCITT SG
I1
for Question Forecasting International Traffic He has also
IE E E
Commun
M u g , vol 33, no 8, pp 34-45, Aug
1995 participated in CCITT GAS 10 and in RACE 2087, the TITAN project He
[411
De
Prycker, and Mestdagh “ATM passive gives lectures on Forecasting at Oslo University and has worked for ITU’s
networks Prepdring the access network for BISDN,” in Proc XIV ISS
headquarter as a speclallst
on
Yokohama, Japdn, Oct 1992
[36]
J
H Angenent and P Bathe, “Video-on-demand, implementation in from
Oslo
University, Norway, in 1972
L. Aa.
Ims. photograph and biography not available at the time of publication.
Borgar
T.
Olsen
received the M Sc degree in
physics and the Dr Philos degree from Unit ersit)
of Oslo, Norway,
in
1975 and 1987, respectively
From 1977 to 1983, he was Scientific Assistant
with the Institute
of
Physics, University of Oslo
From 1984 to 1986, he was a Research Fellow
with the Max Planck Institute, Munich, Germany In
1986, he joined the Norwegian Telecom Research
Department working with optical switching From
1989 to 1992, he was responsible for the Component
Technology Group at the Institute In 1992. he
joined the Network Structures Group, where he worked with strategic studies
on the introduction of new technology in the access network Since 1992. he
has been involvcd in the European Projects 1992-1996 RACEII 2087iTITAN
project, 1993-94 EURESCOM P306, and 1994-1995 EURESCOM P413 He
has published more than 40 papers in international Journals and conferences
. -
Alcibiade Zaganiaris
graduated in Mathematical
Physics from the University of Athens. He received
a postgraduate certificate in Telecommunications
Electronics and a Doctor’s degree from the
University of Rennes, France. In 1992, he received
the Ph.D. degree from the University of Lyon.
He joined the Centre National d’Etudes des
TClCcommunication (CNET) in 1975, where he
carricd out research on optical materials and fiber
properties. Then he moved to the local networks
division, where he was in charge
of
techno-
economic studies. He is author of 60 publications. conferences, and patents
dealing with optical measurements, laser calorimetry. environmental testing,
component reliability, and techno-economic investigations
of
the
access
network, his current research interests since 1985. Since 1981, he has been
involved
i n
European and International organizations in the field of optical
communications: RACE, the Optical Society of America, the American
Ceramic Society, and the International Telecommunications Society. From
1981 to 1986, he chaired Project COST 208/7: Mechanical Properties and
Reliability of Optical Fibers and Passive Components. From 1989 to 1992,
he was responsible for the group “SYNTHESYS,” part of the consensus
RACE project 1044. This group developed tools and methodologies for the
economic evaluation of the various access network alternatives. These tools
have subsequently been used by many Operators for assessing introduction
scenarios for the fiber in the local loop. Since June 1993, his main activity has
been within the RACE Project 2087/TITAN: Tool for Introduction Scenario
and Techno-Economic Evaluation
of
Access Network. This group has gathered
32 participants from 14 member-countries and is developing economic
methodologies which have been widely adopted by those interested in scenario
assessment. Since 1994, he has been a member of two EURESCOM projects:
P.306 and P.413, where he is responsible for developing guidelines regarding
the introduction of advanced residential services.
D. Myhre photograph and biography not available at the time of publication.
T. Overli
photograph and biography not available at the time of publication.
M. Tahkokorpi
photograph and biography not available at the time of
publication.
I. Welling
photograph and biography not available at the time of publication,
M . Drieskens
photograph and biography not available at the time of
publication.
J. Kraushaar
photograph and biography not available at the time of
publication.
J. Mononen.
photograph and biography not available at the time of publi-
cation.
M. Lahteenoja
photograph and biography not available at the time of
publication,
S.
Markatos
photograph and biography not available at the time of publi-
cation.
M. De Bortoli photograph and biography not available at the time of
publication,
Authorized licensed use limited to: UNIVERSIDADE DE AVEIRO Downloaded on June 16 2009 at 10:41 from IEEE Xplore Restrictions apply

7/18/2019 Olsen Duarte Et Ali IEEE JSAC 1996
http://slidepdf.com/reader/full/olsen-duarte-et-ali-ieee-jsac-1996 20/20
OLSEN et ul : TECHNO-ECONOMIC EVALUATION OF NARROW BAND AND BROADBAND ACCESS NETWORK ALTERNATIVES
1203
U. Ferrero photograph and biography not available at the time of publication.
N. Gieschen photograph and biography not available at the time of publi-
cation.
M.
Ravera photograph and biography not available at the time of publication.
M. De
Oliveira
Duarte photograph and biography not available at the time
of publication.
S. Balzaretti
photograph and biography
not
available at the time of publi-
cation.
E. de
Castro,
photograph and biography not available at the time of
publication.
F. Fleuren photograph and biography not available at the time
of
publication.