Embed Size (px)
Citation preview

UNDERSTANDING THE EXPANSION AND EFFECTS OF
COLORADO’S CONCURRENT ENROLLMENT PROGRAM
by
BRENDA BAUTSCH DICKHONER
B.A., Duke University, 2006
A thesis submitted to the
Faculty of the Graduate School of the
University of Colorado in partial fulfillment
of the requirements for the degree of
Doctor of Philosophy
Public Affairs Program
2017

ii
This thesis for the Doctor of Philosophy degree by
Brenda Bautsch Dickhoner
has been approved for the
Public Affairs Program
by
Todd Ely, Chair
Paul Teske
Kelly Hupfeld
Matt Gianneschi
Date: May 13, 2017

iii
Dickhoner, Brenda Bautsch (PH.D., Public Affairs Program)
Understanding the Expansion and Effects of Colorado’s Concurrent Enrollment Program
Thesis directed by Assistant Professor Todd Ely
ABSTRACT
One of the prominent approaches among states to improve college access and success is
concurrent enrollment, which provides high school students the opportunity to enroll in a college
course for which they may receive both high school and college credit. This study set out to
understand, first, what factors lead some schools to adopt concurrent enrollment more quickly and
implement the program more intensely as compared to other schools. The study also sought to
evaluate how effective concurrent enrollment is at improving college access and success for all
students, including low-income and minority students. The dissertation finds that fiscal capacity,
organizational capacity, school type and prior program offerings are key predictors of the adoption
and implementation of concurrent enrollment programs. Additionally, participation in concurrent
enrollment in high school results in positive gains in college enrollment rates, first-year grade point
averages, and college persistence rates, and results in a decrease in the need for remedial
education. While concurrent enrollment, on average, improves college outcomes for all students,
low-income students experience a greater positive impact on their outcomes than higher income
students. Moreover, Hispanic students who take concurrent enrollment courses see a greater
impact on their likelihood of going to college than white students who participate in the program.
The form and content of this abstract are approved. I recommend its publication.
Approved: Todd Ely
iv
DEDICATION
For Blair, whose love and support means everything. And for Grayson—I hope you always pursue
your dreams no matter how long the road ahead seems.
v
ACKNOWLEDGEMENTS
I am extraordinarily indebted to Dr. Todd Ely, who provided advice, guidance and
mentorship over the past six years. Dr. Ely has an enviable aptitude for statistics and challenged me
to explore various quantitative methods in an effort to carry out a rigorous and respectable research
design. I learned more than I could have imagined, thanks to the patient facilitation of Dr. Ely. He
even made the process enjoyable—as much as such a process can be enjoyed. Drs. Paul Teske and
Kelly Hupfeld lent their public affairs and education policy expertise to provide valuable feedback,
particularly in the beginning stages as I was preparing what would be the roadmap for my research. I
am grateful that Dr. Teske, Tanya Heikkla, Chris Weible, and Peter deLeon—along with many
others—have created such a wonderful and welcoming PhD program for practitioners. The School of
Public Affairs faculty encourages the blending of theory with practical application and warmly
accepts practitioner students such as myself into their scholarly sphere.
I am incredibly grateful that Dr. Matt Gianneschi served on my committee as my outside
reader. Dr. Gianneschi helped author the legislation that created Colorado’s concurrent enrollment
program and has a wealth of knowledge about education policy through his roles in state
government, in the policy sector and as a college leader. Dr. Gianneschi was also one of the
individuals who helped me land on the topic of concurrent enrollment; without him and Dr. Beth
Bean I might still be wandering the doctoral wilderness in search of worthy topic. I am appreciative
of Dr. Bean for not only helping me find a topic and a rich data set, but also for providing moral
support as I worked for her at the Colorado Department of Higher Education (CDHE). Maggie Yang,
Michael Vente and all of the CDHE staff were tremendously helpful and patient with my multiple
data requests. Michelle Camacho Liu, who was the state’s concurrent enrollment administrator
while I was at CDHE, shared an abundance of knowledge with me to help inform the background,

vi
context and discussion portions of this dissertation. Michelle also happens to be a dear friend, and I
am so grateful for her support and friendship in addition to the concurrent enrollment insight.
I owe a great deal of gratitude to Dr. Julie Bell at the National Conference of State
Legislatures, who was my boss when I had the crazy idea to enter a Ph.D. program. Dr. Bell
encouraged me to apply and supported my acceptance into the program with her letter of
recommendation. She also permitted me to work a flexible schedule as I completed my coursework.
Thank you, Dr. Bell, for your belief in me—I truly would not be at this milestone without you.
Alyssa Pearson at the Colorado Department of Education has been an amazing friend and
supervisor this past year as I have completed and defended my dissertation. Thank you, Alyssa, for
your unwavering support, overflowing optimism, delicious baked goods, generosity of spirit—and
for being an inspiration to all! You are an excellent role model for public administrators everywhere.
Last, although certainly not least, I want to acknowledge my family and friends who have
supported me on this long road. My parents instilled in me a love for education at a young age. My
dad made it possible for me to attend the college of my dreams, and my mom made it possible for
me to persist through graduate school. She helps take care of Grayson and moe, brings me food any
time I need it (and when I don’t), and is always there for me to lean on. My mom once said she
would never be satisfied until I earned my doctorate—so I am pleased to finally meet her lofty
expectations. Thank you, Mom and Dad, for all you do and for valuing education so much!
My husband, Blair, has been my rock and is the reason I’ve made it to the finish line. While
this process has been long and grueling at times, one positive outcome is that Blair was able to
pursue multiple hobbies while I worked, including guitar playing, marathon running and beekeeping.
I will be the proud recipient of a doctoral diploma and homemade honey! Finally, I am lucky enough
to have many friends—too many to name—who grabbed a drink with me when I needed one and
understood when I had too much work to go get a drink. Thank you, all!

vii
TABLE OF CONTENTS
I: INTRODUCTION ................................................................................................................................... 1
Problem Significance .......................................................................................................................... 3
Concurrent Enrollment Policy Landscape .......................................................................................... 6
Colorado’s Concurrent Enrollment Programs Act ............................................................................ 14
Contributions to the Field ................................................................................................................ 17
Summary & Research Questions ...................................................................................................... 22
II: LITERATURE REVIEW AND HYPOTHESES .......................................................................................... 24
Policy Diffusion & Innovation Theory ............................................................................................... 24
Education Theory.............................................................................................................................. 30
Summary........................................................................................................................................... 40
III: DATA & METHODS ........................................................................................................................... 41
Data Sources and Collection ............................................................................................................. 41
Research Design ............................................................................................................................... 44
Data & Methods: Summary .............................................................................................................. 69
IV: POLICY DIFFUSION FINDINGS & DISCUSSION.................................................................................. 71
Descriptive Statistics......................................................................................................................... 71
Event History Analysis ...................................................................................................................... 77
OLS Fixed Effects Regression Analysis .............................................................................................. 80
Dynamic Panel Data Model .............................................................................................................. 83
Conclusion & Discussion ................................................................................................................... 87
V: POLICY EVALUATION FINDINGS ....................................................................................................... 93
Descriptive Statistics......................................................................................................................... 93
viii
Effects of Concurrent Enrollment Participation on College Outcomes ............................................ 95
Concurrent Enrollment Effects for Low-Income Students and Minority Students ........................ 104
Effects of Concurrent Enrollment Credit Hour Levels on College Outcomes ................................. 112
Conclusion & Discussion ................................................................................................................. 117
VI: CONCLUSION ................................................................................................................................. 120
Key Findings .................................................................................................................................... 122
Implications for Research and Practice .......................................................................................... 123
Limitations and Future Research .................................................................................................... 135
REFERENCES ....................................................................................................................................... 141

ix
LIST OF TABLES
Table 1. Thematic Analysis of Model State Policy Elements and Standards ........................................ 10
Table 2. Summary of Research Questions and Hypotheses ................................................................. 40
Table 3. Concept Measurement Summary: Policy Diffusion ................................................................ 45
Table 4: Variable Descriptions and Sources ......................................................................................... 46
Table 5: Concurrent Enrollment Adoptions and Survivor Functions, by School Year .......................... 52
Table 6. Concept Measurement Summary: Policy Evaluation ............................................................. 58
Table 7. Descriptions of Pre-College Independent Variables and College Outcome Variables ........... 59
Table 8: Methodological Approaches with Associated Research Questions ....................................... 69
Table 9: Descriptive Statistics for All High Schools, Beginning and End of Study ................................ 73
Table 10: Comparison of Variable Means, by High School Adoption Year ........................................... 74
Table 11: Cox Proportional Hazards Model Results ............................................................................. 78
Table 12. Predictors of Student Participation Rates in Concurrent Enrollment (CE) ........................... 81
Table 13. Dynamic Panel Data Model using Maximum Likelihood for Concurrent Enrollment (CE)
Participation Rates in High Schools ...................................................................................................... 84
Table 14: Summary of Statistically Significant Results across Methods and Hypotheses .................... 86
Table 15: Descriptive Statistics for Overall Sample and by Concurrent Enrollment (CE) Participation 94
Table 16. Propensity Score Matching Average Treatment Effects ....................................................... 98
Table 17. Progression of Logistic Regression Models Estimating the Effect of .................................. 101
Table 18. Average Treatment Effects ................................................................................................. 102
Table 19. Comparison of Average Treatment Effects ........................................................................ 104
Table 20. Progression of Logistic Regression Models Estimating the Effect of Concurrent Enrollment
Participation on College Matriculation .............................................................................................. 106

x
Table 21. Regression Models Estimating the Interaction Effects of Concurrent Enrollment
Participation on College Outcomes .................................................................................................... 108
Table 22. Credit Hours Descriptive Statistics for Concurrent Enrollment Students ........................... 113
Table 23. Sample Means of Key College Outcomes by Concurrent Enrollment Credit Hours ........... 113
Table 24. Progression of Regression Models Estimating the Effect of Concurrent Enrollment
Participation on College Matriculation .............................................................................................. 114
Table 25. Average Treatment Effects of Credit Hours Levels on College Outcomes ......................... 115
Table 26. Comparison of Statewide Evaluations Assessing Effect of Dual Enrollment Programs on
College Matriculation ......................................................................................................................... 133

xi
LIST OF FIGURES
Figure 1. Number of Adopted Bills Pertaining to Dual Enrollment Programs across the U.S., by Year . 9
Figure 2. Distribution of Propensity Score Across Treatment and Comparison Groups ...................... 66
Figure 3. Adoption of Concurrent Enrollment Programs from the 2010-11 School Year to the 2014-15
School Year, by School Districts and High Schools. .............................................................................. 72
Figure 4: Average Percentage of High School Students Participating in Concurrent Enrollment (CE)
within High Schools, by Adoption Year Cohort from 2010-11 to 2014-15.. ......................................... 75
Figure 5. Maps of Colorado high schools and Concurrent Enrollment (CE) participation rates by
covariates of interest.. .......................................................................................................................... 76
Figure 6. Cox Proportional Hazards Regression Smoothed Hazard Functions for Charter Schools and
College Matriculation Rates.. ............................................................................................................... 80
Figure 7. Participation in Concurrent Enrollment, by Graduation Year, Gender and Race/Ethnicity .. 95
Figure 8. Standardized bias differences (%) across all covariates in original and matched samples ... 97
Figure 9. Probability of College Matriculation, by Concurrent Enrollment Participation and Free or
Reduced-Price Lunch (FRL) Status and Race/Ethnicity (Hispanic or white) ....................................... 109
Figure 10. Probability of College Remediation, by Concurrent Enrollment Participation and Free or
Reduced-Price Lunch (FRL) Status ...................................................................................................... 110
Figure 11. Probability of College Persistence, by Concurrent Enrollment Participation and Free or
Reduced-Price Lunch (FRL) Status ...................................................................................................... 112

1
CHAPTER I
INTRODUCTION
In today’s economy, higher education is increasingly necessary to have a productive career
and earn family-sustaining wages (Carnevale, Smith & Strohl, 2013). Access to a high-quality K-12
education that prepares students for postsecondary education, however, is not a guarantee in
America’s school system. On average, low-income and minority students consistently have lower
levels of academic achievement than their peers at all points along the education pipeline, including
high school graduation, college enrollment, and college degree attainment (Bettinger & Long, 2005;
Darling-Hammond, 2010; Kahlenberg, 2004; Terenzini, Cabrera, & Bernal, 2001; U.S. Department of
Education [USDOE], 2006). States across the country have implemented countless policies to better
prepare students for life after high school, but achievement gaps persist.
Colorado, which has the second largest gap in the country in the college degree attainment
between majority and minority students (NCHEMS, 2013), is no exception. Several laws passed by
the Colorado legislature in the last decade have targeted improving the transition from high school
to college.1 The question remains, though, as to how effective are those laws at improving
educational outcomes, particularly when policies create voluntary programs for schools and
students. Colorado’s concurrent enrollment law, for example, was specifically designed to improve
college readiness for traditionally-underserved students by bolstering access to rigorous, college-
level coursework (C.R.S. §22-35-101). Under the policy, qualified students in grades 9 through 12
can take tuition-free college courses at their high school, a postsecondary institution, online, or in a
hybrid format and simultaneously earn high school and college credits (CDE, 2010). This law creates
1 See, for example—SB08-212: Preschool to Postsecondary Education Alignment Act (Colorado Achievement
Plan for Kids); SB 09-256: Individual Career and Academic Plans; HB09-1319: Concurrent Enrollment
Programs Act; HB07-1118: High School Graduation Requirements; SB09-163: The Education Accountability
Act; HB 12-1155: Supplemental Academic Instruction.

2
the operational framework—the funding mechanism, participation requirements, and oversight—
for the concurrent enrollment program. It is a voluntary initiative, however—schools can choose
whether or not to adopt the program.
Proponents of concurrent enrollment argue that it increases academic preparation for
college and provides momentum toward degree attainment by giving students the opportunity to
enter college with credits already accumulated (An, 2013; Hoffman, 2005). Prior research has found
positive associations between concurrent enrollment participation and college access and success
outcomes (Allen & Dadgar, 2012; An, 2013; Giani et al., 2014; Taylor, 2015). Often the previous
research has focused on small-scale, institution-specific programs and used imperfect methods.
Consequently, rigorous, empirical analyses of state-wide programs are still needed (Allen & Dadgar,
2012; Bailey & Karp, 2003; Blanco, 2006; Giani, Alexander, & Reyes, 2014; Hoffman, 2012; Rutschow
& Schneider, 2011). Colorado’s concurrent enrollment program provides fertile ground for such
research. The purpose of this study is to examine the effects of Colorado’s concurrent enrollment
program on college access and success, as well as to analyze decisions by high schools to offer
concurrent enrollment programs and by students to enroll in them.
To address these questions, the dissertation begins with an introduction to the problems
under investigation and background on how concurrent enrollment state policies purport to solve
those problems, both nationwide and in Colorado. This introductory chapter concludes with a
summary of contributions the study will make to research and practice and sets forth formal
research questions. Chapter Two provides a review of relevant literature from the public affairs and
education domains and presents testable hypotheses. Chapter Three includes a description of the
data collection, an explanation of variables and measures, and detailed review of the various
methods employed to answer the research questions. Chapters Four and Five present findings from
the empirical research, with Chapter Four focusing on an analysis of factors that influence the
3
adoption of concurrent enrollment programs at the school level; Chapter Five focuses on an analysis
of the effects of participating in concurrent enrollment on college matriculation and success at the
student level. Chapter 6 summarizes the study and its implications for research and practice.
Problem Significance
Achievement Gaps
Low-income and minority students, on average, lag behind their peers on nearly every
important education milestone (An, 2012; Bettinger & Long, 2005; Darling-Hammond, 2010;
Kahlenberg, 2004; Oakes, 2005). Children from low-income families, for example, are more likely to
have lower reading abilities by the third grade than high-income students (Hernandez, 2011).
Achievement data from the National Assessment of Educational Progress (NAEP) shows that black
and Hispanic students, on average, score two grade levels below white students when taking the
NAEP exam in 4th and 8th grades (USDOE, 2009, 2011). Low literacy levels in early grades have been
linked to diminished achievement in later years, including decreased high school graduation rates
(Hernandez, 2011). Early indicators are important to measure because low-income students are
about five times as likely to drop out of high school as high-income students (Kahlenberg, 2004).
In high school, disparities in curriculum offerings and quality of instruction remain a
significant problem, with low-income and minority students disproportionally receiving lower-
quality instruction and fewer advanced course options. Oakes (1993, 2005) found that even after
controlling for test scores, white and Asian students are far more likely to be placed into honors
courses than their peers. High-achieving Latino students who scored at the 90th percentile on
standardized tests had just a 56 percent chance of being assigned to a college preparatory class, as
compared to a 97 percent chance for Asian students and 93 percent chance for white students
scoring in the same percentile (Oakes, 1993, 2005).

4
Due to a variety of factors, including lack of access to consistently high-quality instruction
and rigorous curriculum, achievement gaps that can be observed as early as pre-Kindergarten
persist for many children throughout their entire educational careers. The transition from high
school to college is no exception—low-income and minority students are less likely to enroll in or
graduate from college than their white, affluent peers (Adelman, 2006; An, 2012; Kahlenberg, 2004).
For low-income, minority students who do attend college, they tend to be less academically
prepared than their peers; studies on the relationship between income and race/ethnicity and
college remediation rates indicate persistent achievement gaps (see, e.g., Bettinger & Long, 2005).
In Colorado—the focus of this study—82 percent of African American students and 70 percent of
Hispanic students need remediation at community colleges, as compared to 50 percent of white
students (Colorado Department of Higher Education, 2016). Also, in Colorado, 53.4 percent of low-
income students are not ready for college-level courses in at least one content area, as compared to
31.4 percent of wealthier students (Colorado Department of Higher Education, 2016).
The fact that half of all white high school graduates who immediately attend a community
college are not academically prepared is indicative of systemic challenges in readying our young
adults for postsecondary education. That statistic already discounts the numerous students who
dropped out of high school or those who graduated high school but chose not to matriculate to
college. Further, while the remedial education rate for white students is concerning in and of itself,
having remedial education rates that are 20 to 30 percentage points higher for minority students is
an alarming trend.
Returns to Education
Closing achievement gaps, particularly around college access and success, remains a
significant imperative for society from an equity perspective, as well as from an economic
perspective. If achievement gaps persist, then the U.S. society and economy will continue to

5
experience negative externalities stemming from lower individual quality of life. Research has time
and again found that individuals without a college credential are far more likely to face severe
challenges throughout life including joblessness, welfare, incarceration, family instability and health
problems (Hout, 2012; Kingston et al., 2003). These challenges are costly and burdensome to the
taxpayers who subsidize prisons, social support systems and healthcare. Researchers, however, have
also long questioned the notion of whether education causes better outcomes or simply reflects
advantages bestowed upon certain individuals as a matter of chance.
Nonetheless, there is substantial empirical evidence that education provides positive
returns on investment for individuals. The literature, for example, on wage premiums for attending
college has consistently found that individuals accrue increased earnings for additional years of
education using a variety of statistical approaches to control for selection bias, including
instrumental variables and natural experiments (Angrist & Krueger, 1992; Hausman & Taylor, 1981;
Hout, 2012, Kane & Rouse, 1995). More recent research has also found that the benefits of higher
education are greater for those who are less likely to attend and graduate—that is, students who
typically perform somewhere in the middle of the spectrum of academic ability (Attewell & Lavin,
2007; Brand & Xie, 2010; Hout, 2012; Maurin & McNally, 2008). While students of higher ability may
graduate from college at higher rates and earn higher wages, their education has a lesser effect on
their success than students of lower academic ability who gain greater wage premiums from higher
education (Brand & Xie, 2010; Hout, 2012). This strand of literature has important implications for
policymakers in that it supports continued efforts by states to expand higher education access to
students who are at risk of not attending.
There is also empirical evidence that societal and economic benefits accrue when higher
education completion rates increase. Some studies have found that increasing the number of
college graduates in a labor market raises the productivity levels of less-educated workers and may

6
also increase their wages (Moretti, 2012; Mas & Moretti, 2009). Researchers have also linked college
graduates with higher rates of volunteerism and positive views of civil liberties and minorities (e.g.
Brand, 2010; Kingston et al., 2003). Putnam (1995, 672), for example, declares that “education is by
far the strongest correlate that I have discovered of civic engagement in all its forms."
From the economic perspective, labor economists project that jobs—in particular, those
that provide family-sustaining wages—will increasingly require postsecondary credentials. The labor
demand for college educated workers is projected to surpass supply by 2020, which could stymie
economic growth (Carnevale, Smith & Strohl, 2013). As stated in a 2010 report by Georgetown’s
Center on Education and the Workforce:
Essentially, postsecondary education or training has become the threshold requirement for access to middle-class status and earnings in good times and in bad. It is no longer the preferred pathway to middle-class jobs—it is, increasingly, the only pathway. (Carnevale, Smith & Strohl, 2013, 13)
As this short review indicates, there is a compelling case for expanding higher education
opportunities to more students. Policymakers often understand this and thus have turned their
attention in recent years to expanding college access through concurrent enrollment. The following
section provides an overview of the national policy landscape surrounding concurrent enrollment.
Concurrent Enrollment Policy Landscape
Concurrent enrollment is a term used in 15 states, including Colorado, to refer to
opportunities for high school students to enroll in a college course for which they may receive both
high school and college credit. Unlike other accelerated learning options such as Advanced
Placement (AP), students earn college credit if they receive a passing grade in the course—just as a
college student would—rather than by earning a certain score on an end-of-course exam (Allen,
2010). This provides a stronger guarantee that the course credit will count toward the student’s

7
college degree. Forty states use the terms “dual enrollment” or “dual credit” to refer to the same
arrangement;2 the terms are used interchangeably in the following section.
Concurrent enrollment programs have been available in public high schools for at least the
last half-century, mostly as an enrichment opportunity for academically-advanced students.
Programs have grown exponentially since the early 2000s when certain policymakers began
expanding concurrent enrollment opportunities to students who are traditionally underserved,
including students of color and low-income students, as well as to students who are not high
academic performers (Hoffman, Vargas, & Santos, 2008a).
In the 2001-02 school year, public high schools across the country reported approximately
1.2 million enrollments in dual credit courses (Kleiner & Lewis, 2005). That number is a duplicated
student count—it is inclusive of each course enrollment during the school year. A decade later,
during 2010-11 school year, dual enrollment participation at public high schools increased to just
over 2 million (Thomas, Marken, Gray & Lewis, 2013). In 2001-02, 71 percent of high schools had
dual enrollment programs; by 2010-11 that figure increased to 82 percent.
Concurrent Enrollment – Promises and Challenges
Concurrent enrollment is promising to policymakers and practitioners because it is seen as a
way to expose more students to rigorous curriculum that high schools may be lacking. Providing
students exposure to college is thought to be a strategy for developing metacognitive skills3,
readying students for the demands of college life, and increasing college aspirations. Policymakers
are also drawn to concurrent enrollment as a way to increase college affordability by offering
college courses at low or no cost to families.
2 In some instances, multiple terms are used within states. 3 Students with well-developed metacognitive learning skills will be able to manage their time effectively, think critically, navigate college resources, maintain study routines, have self-awareness of their strengths and weaknesses, analyze and interpret information, and have the confidence to overcome challenges (Conley, 2010, 2013).

8
The challenges to policy implementation, however, are also multifold. While state policies
around concurrent enrollment have proliferated, expanding access to low-income students and
students of color still remains a challenge. Further, while many states are attempting to increase
access by ensuring there are no costs to students, state budgets are continually under constraint,
leaving little dedicated funding available for concurrent enrollment. Even in states where students
do not shoulder tuition costs, school districts and colleges still need to establish a financially viable
model for operating the program. Cash-strapped states, districts and colleges increasingly have to
find creative ways to fund concurrent enrollment programs or risk scaling back access (Borden et al,
2013; Zinth, 2014b, 2015b).
Another challenge is ensuring course rigor and quality when courses are taught at a high
school or online, as opposed to on the college campus. Offering courses in a high school setting
greatly expands access and eases the logistical hurdles of transportation and scheduling for off-
campus courses, but it requires more oversight to ensure consistency of rigor (Borden et al, 2013;
Lowe, 2010; Zinth, 2015a). It is also challenging to find high school teachers with the necessary
qualifications to teach concurrent enrollment courses, especially in rural areas (Zinth, 2014a). These
challenges—and promises—have spurred a great deal of legislative activity in recent years.
State Policy
According to the Education Commission of the States (ECS), as of 2016, 47 states have
statutes and/or regulations in place governing dual enrollment programs (ECS, 2017). However, a
great deal of variation among the 47 state policies exists regarding funding, eligibility, course type,
instructor qualifications, general oversight and monitoring, and credit transferability (Borden et al.,
2013). Further, state policies continue to evolve as states make modifications to their programs in
these areas. According to data collected by ECS, over the past five years alone, 143 bills were
adopted by state legislatures concerning dual enrollment programs; in the last ten years, states

9
passed a total of 243 bills (ECS, 2017). Figure 1 displays the number of bills signed into law by states
across the country per calendar year. The chart shows low points (2008 and 2010) and high points
(2013), but depicts that the number of adopted bills has remained near the average of 24 bills in
most years over the past decade. Legislative changes have focused on clarifying or expanding
funding streams, integrating career and technical education opportunities, promoting options that
increase the number of qualified instructors, modifying student eligibility requirements, and
implementing provisions to help ensure dual credit courses are as rigorous as traditional college
courses.
Figure 1. Number of Adopted Bills Pertaining to Dual Enrollment Programs in the U.S., 2007-2016. Data collected from the Education Commission of the States (ECS) State Policy Database, retrieved February, 11, 2017. Model Policy Elements
With the high level of legislative activity around dual enrollment, policy researchers have
delved into the numerous state policies and, based on other research and best practices, have
identified key components that states should include in their dual enrollment policies. This section
reviews three prominent sets of model policy elements and program standards, which are
synthesized in Table 1. ECS and Jobs for the Future (JFF) have issued specific guidance for
policymakers. The National Alliance of Concurrent Enrollment Partnerships (NACEP) issued guidance
focused on program oversight and ensuring academic rigor.
22
13
30
10
25 26
38
25 26 28
0
10
20
30
40
2007 2008 2009 2010 2011 2012 2013 2014 2015 2016
Nu
mb
er o
f B
ills

10
Tab
le 1
. Th
emat
ic A
nal
ysis
of
Mo
del
Sta
te P
olic
y El
emen
ts a
nd
Sta
nd
ard
s
The
me
s
Job
s fo
r th
e F
utu
re
“Mo
de
l Sta
te P
olic
y El
em
en
ts”
NA
CEP
“A
ccre
dit
atio
n S
tan
dar
ds”
Ed
uca
tio
n C
om
mis
sio
n o
f th
e S
tate
s “M
od
el C
om
po
ne
nts
of
Stat
e-L
eve
l P
olic
ies”
Pro
gram
Q
ual
ity:
C
ou
rse
rig
or,
in
stru
cto
r q
ual
ific
atio
ns
and
co
urs
e
cre
dit
Qu
alit
y A
ssu
ran
ce
St
ates
sh
ou
ld e
nsu
re t
hat
co
llege
co
urs
es
off
ered
to
h
igh
sch
oo
l stu
den
ts u
se t
he
sam
e sy
llab
i an
d e
xam
s as
co
mp
arab
le c
ou
rses
tau
ght
on
a c
olle
ge c
amp
us
Th
e p
ost
seco
nd
ary
inst
itu
tio
n c
on
ferr
ing
cred
it s
ho
uld
se
t th
e q
ual
ific
atio
ns
for
facu
lty
teac
hin
g d
ual
cre
dit
co
urs
es
D
ual
en
rolle
es
earn
bo
th h
igh
sch
oo
l an
d c
olle
ge c
red
its
up
on
su
cces
sfu
lly c
om
ple
tin
g co
urs
es
Cu
rric
ulu
m
C
olle
ge c
ou
rses
off
ere
d in
th
e h
igh
sc
ho
ol a
re o
f th
e sa
me
qu
alit
y an
d
rigo
r as
th
e co
urs
es o
ffer
ed o
n-
cam
pu
s at
th
e co
llege
/un
iver
sity
Fa
cult
y
C
on
curr
ent
enro
llmen
t in
stru
cto
rs
me
et t
he
acad
emic
req
uir
em
ents
fo
r fa
cult
y an
d in
stru
cto
rs t
each
ing
in t
he
spo
nso
rin
g p
ost
seco
nd
ary
inst
itu
tio
n a
nd
are
pro
vid
ed
dis
cip
line
-sp
ecif
ic p
rofe
ssio
nal
d
evel
op
men
t A
sse
ssm
en
t
St
ud
ents
en
rolle
d in
co
ncu
rre
nt
enro
llmen
t co
urs
es
are
hel
d t
o t
he
sam
e st
and
ard
s o
f ac
hie
vem
en
t as
st
ud
ents
in o
n-c
amp
us
cou
rse
s,
incl
ud
ing
grad
ing
stan
dar
ds
and
as
sess
men
t m
eth
od
s
Ensu
rin
g C
ou
rse
Qu
alit
y
C
ou
rse
s m
eet
sam
e le
vel o
f ri
gor
as
trad
itio
nal
co
llege
co
urs
es
In
stru
cto
rs m
eets
sam
e e
xpec
tati
on
s as
co
llege
fac
ult
y an
d r
ecei
ve
sup
po
rt
Tran
sfe
rab
ility
of
Cre
dit
P
ost
seco
nd
ary
Inst
itu
tio
ns
acce
pt
du
al e
nro
llmen
t cr
edit
as
tran
sfe
r cr
edit
, pro
vid
ed m
easu
res
for
qu
alit
y ar
e en
sure
d
Fin
anci
al
Pro
visi
on
s $
$$
Sust
ain
able
Fu
nd
ing
and
Fin
an
ce
Stat
es s
ho
uld
dev
elo
p f
un
din
g p
olic
ies
that
:
A
llow
hig
h s
cho
ol s
tud
ents
to
tak
e co
llege
co
urs
es f
ree
of
tuit
ion
an
d n
on
-co
urs
e-re
late
d c
har
ges
P
erm
it b
oth
dis
tric
ts a
nd
po
stse
con
dar
y in
stit
uti
on
s to
cl
aim
per
pu
pil
fun
din
g al
loca
tio
ns
to s
up
po
rt t
he
cost
o
f o
ffer
ing
du
al c
red
it c
ou
rses
Fi
nan
ce
R
esp
on
sib
ility
fo
r tu
itio
n d
oes
no
t fa
ll to
par
ents
D
istr
icts
an
d p
ost
seco
nd
ary
inst
itu
tio
ns
are
fully
fu
nd
ed o
r re
imb
urs
ed f
or
par
tici
pat
ing
stu
den
ts

11
Tab
le 1
(co
nt.
)
The
me
s Jo
bs
for
the
Fu
ture
“M
od
el S
tate
Po
licy
Ele
me
nts
” N
AC
EP
“Acc
red
itat
ion
Sta
nd
ard
s”
Edu
cati
on
Co
mm
issi
on
of
the
Sta
tes
“Mo
de
l Co
mp
on
en
ts o
f St
ate
-Le
vel
Po
licie
s”
Stu
de
nt
Acc
ess
an
d
Sup
po
rt
Elig
ibili
ty a
nd
Acc
ess
A
sta
te's
elig
ibili
ty r
equ
ire
me
nts
are
det
erm
ined
by
the
seco
nd
ary
and
po
stse
con
dar
y se
cto
rs t
oge
ther
St
ud
ents
hav
e m
ult
iple
way
s to
dem
on
stra
te r
ead
ines
s,
incl
ud
ing
a co
mb
inat
ion
of
test
s, e
nd
-of-
cou
rse
grad
es,
te
ach
er r
eco
mm
end
atio
ns,
an
d w
ork
po
rtfo
lios.
A
cad
em
ic a
nd
So
cial
Su
pp
ort
s
St
ates
sh
ou
ld r
equ
ire
that
dis
tric
ts c
olle
ges
spec
ify/
do
cum
ent
key
role
s an
d r
esp
on
sib
iliti
es
in
me
mo
ran
da
of
un
der
stan
din
g o
r co
op
erat
ive
agre
em
ents
, in
clu
din
g th
e p
rovi
sio
n o
f a
colle
ge li
aiso
n
for
stu
den
t ad
vise
men
t an
d s
up
po
rt
Stat
es s
ho
uld
pro
vid
e su
pp
ort
an
d f
un
din
g fo
r p
rogr
ams
serv
ing
stu
den
ts w
ho
are
ove
rage
an
d u
nd
er-c
red
ited
an
d
you
th w
ho
hav
e d
rop
ped
ou
t o
f h
igh
sch
oo
l
Stu
de
nts
St
ud
ents
off
icia
lly r
egis
ter
wit
h a
co
llege
St
ud
ents
me
et t
he
colle
ge’s
co
urs
e p
re-r
equ
isit
es
Th
e co
ncu
rren
t en
rollm
ent
pro
gram
p
rovi
des
stu
den
ts w
ith
a h
and
bo
ok
of
righ
ts/r
esp
on
sib
ility
of
colle
ge
stu
den
ts
Acc
ess
A
ll el
igib
le s
tud
ents
may
par
tici
pat
e,
bas
ed o
n d
emo
nst
rati
on
of
abili
ty t
o
acce
ss c
olle
ge-l
evel
co
nte
nt
C
aps
on
th
e m
axim
um
nu
mb
er
of
cou
rse
s al
low
ed s
ho
uld
no
t b
e o
verl
y re
stri
ctiv
e
St
ud
ents
ear
n h
igh
sch
oo
l an
d
colle
ge c
red
it f
or
succ
ess
ful
com
ple
tio
n o
f ap
pro
ved
p
ost
seco
nd
ary
cou
rses
A
ll st
ud
ents
an
d p
aren
ts a
re a
nn
ual
ly
pro
vid
ed w
ish
pro
gram
info
rmat
ion
C
ou
nse
ling
is m
ade
avai
lab
le t
o
stu
den
ts a
nd
par
ents
bef
ore
an
d
du
rin
g p
rogr
am p
arti
cip
atio
n
Re
po
rtin
g an
d P
rogr
am
Eva
luat
ion
Syst
em
fo
r A
cco
un
tab
ility
St
ates
sh
ou
ld r
epo
rt a
nn
ual
ly o
n d
ual
en
rollm
ent
par
tici
pat
ion
an
d im
pac
t an
d d
evel
op
ad
min
istr
ativ
e st
ruct
ure
s to
su
pp
ort
pro
gram
lead
ers
and
du
al
enro
llmen
t p
artn
ersh
ips.
Sta
tes
sho
uld
als
o d
esi
gnat
e a
stat
e b
oar
d o
r go
vern
ing
bo
dy
as h
avin
g th
e au
tho
rity
an
d r
esp
on
sib
ility
to
gu
ide
du
al e
nro
llmen
t p
olic
y.
Alig
ne
d D
ata
Syst
em
s
St
ates
sh
ou
ld d
evel
op
un
it-r
eco
rd s
tate
wid
e d
ata
syst
em
s th
at id
enti
fy d
ual
en
rolle
es
by
dem
ogr
aph
ic
char
acte
rist
ics
and
mo
nit
or
stu
den
t p
rogr
ess
lon
gitu
din
ally
acr
oss
th
e K
-12
an
d h
igh
er e
du
cati
on
sy
ste
ms
Pro
gram
eva
luat
ion
C
on
curr
ent
enro
llmen
t p
rogr
ams
dis
pla
y gr
eate
r ac
cou
nta
bili
ty t
hro
ugh
re
qu
ired
imp
act
stu
die
s, s
tud
ent
surv
eys,
an
d c
ou
rse
and
pro
gram
ev
alu
atio
ns
Ensu
rin
g C
ou
rse
Qu
alit
y (c
on
t.)
D
istr
icts
an
d in
stit
uti
on
s p
ub
licly
re
po
rt o
n s
tud
ent
par
tici
pat
ion
an
d
ou
tco
mes
P
rogr
ams
un
der
go e
valu
atio
n b
ased
o
n a
vaila
ble
dat
a
Sou
rces
: NA
CEP
, 20
11
; War
d &
Var
gas,
20
12
; Zin
th, 2
01
4b
.

12
NACEP “works with state legislators, agencies, and college and university systems to develop
quality concurrent enrollment partnerships and hold them accountable to high standards” (NACEP,
2017). The organization administers the only national set of quality standards for concurrent
enrollment programs, which it uses to accredit individual postsecondary institutions that offer
concurrent enrollment programs across the country. NACEP advocates for states to use the
standards as a quality measure in statewide concurrent enrollment programs. There are currently 17
states that have modeled their quality standards (as set in statue or regulation) on the NACEP
standards, including Colorado. The standards are categorized around curriculum, faculty, students,
assessment and program evaluation and are geared towards ensuring that courses taught by high
school teachers, in particular, are as rigorous and high-quality as courses taught by postsecondary
faculty on college campuses (NACEP, 2011).
ECS identifies 13 policy components organized under the categories of access, finance,
ensuring course quality and transferability of credit (Zinth, 2014b). The guidance to policymakers
notes that the policy components were selected because they “may increase the likelihood that a
more diverse group of students successfully participates in high-quality dual enrollment courses and
receives credit that will be transferable to other public postsecondary institutions in the same state”
(Zinth, 2014b, 4).
Jobs for the Future undertook their policy scan with a lens similar to that used by ECS, but
focused more on the key policy components needed to close achievement gaps. The organization
posits that state policies have the potential to facilitate meaningful partnerships between high
schools and colleges that result in a seamless transition into higher education for students who
might not otherwise attend. Of the 47 statewide policies JFF reviewed, however, they found that
“only a few have established sufficient mechanisms to ensure that all students, including those
underrepresented in higher education, have access to these vital pathways to college” (Ward &

13
Vargas, 2012, 4). The six mechanisms JFF identified as important are categorized under quality
assurance, eligibility and access, academic and social supports, systems for accountability, aligned
data systems and sustainable funding and finance.
After analyzing the different policy elements and standards among ECS, JFF and NACEP, four
themes were identified that provide a coherent grouping of the elements: 1) program quality, 2)
student access and support, 3) reporting and program evaluation, and 4) financial provisions. Given
NACEP’s focus on program quality, its standards are concentrated under that first theme, but they
do also address student access and program evaluation. The ECS and JFF model policy elements
include more guidelines around program evaluation and financial provisions.
In terms of program quality, some states require or encourage their postsecondary
institutions to seek NACEP accreditation as a way to ensure concurrent enrollment courses are
rigorous. Other states defer to local control and leave it to individual colleges to monitor concurrent
enrollment course quality.
There are two model components regarding financial provisions that are recommended by
JFF and ECS. The first concerns keeping costs away from students and families so that the program is
open and affordable to all. The second model policy element focuses on keeping costs low for
districts and colleges. There are a variety of funding approaches across states; JFF and ECS
recommend that states cover the full costs of concurrent enrollment, or, at a minimum, allow both
K-12 and higher education systems to collect per-pupil funding for student enrollments to offset
costs. The latter method is referred to as “double dipping,” although in this case the term is used
positively as it ensures both systems have the means and incentive to participate (Hoffman, 2005;
Lerner & Brand, 2006; Ward & Vargas, 2012; Zinth, 2014b).
An additional theme identified concerns ensuring students have adequate support
throughout the process—including before, during and after the concurrent enrollment course takes

14
place—and equitable access to the program. JFF advocates for more open access wherein students
may demonstrate readiness for college-level coursework through portfolios, end-of-course grades,
and teacher recommendations. In many cases, readiness is demonstrated through a course
placement assessment. Lastly, a theme across all three organizations was the importance of tracking
student data, reporting outcomes, and evaluating the effectiveness of the program in meeting its
intended goals. With these model policy elements in mind, Colorado’s concurrent enrollment
legislation is explored in more detail in the next section.
Colorado’s Concurrent Enrollment Programs Act
Prior to the passage of Colorado’s Concurrent Enrollment Programs Act, there were dual
enrollment opportunities available to Colorado high school students, but there was no state-level
coordination of the programs, which resulted in little accountability or attention to quality and low
participation rates, particularly for low-income and minority students (CDE, 2010; CRS §22‐35‐
102(d)). In 2007, Governor Ritter convened a P-20 Education Coordinating Council to develop
policies that would foster a seamless education system in which all students receive a high-quality
education from pre-school through graduate school and enter the workforce prepared to meet the
demands of today’s economy (Lopez, 2011). One of the forces driving the creation of the P-20
Council was the “Colorado Paradox,” which refers to the fact that Colorado is one of the most highly
educated states due to imported talent, but Colorado’s own K-12 students are not persisting to and
through college at high rates (Lopez, 2011; NCHEMS, 2013). Postsecondary access and success was a
focal point of the council’s work, and in 2009, at the recommendation of the council, legislative
leaders introduced the bipartisan Concurrent Enrollment Programs Act (House Bill 09‐1319 and
Senate Bill 09‐285). The legislation passed unanimously in both chambers of the legislature—a rare
feat.

15
Policy Goals
The concurrent enrollment program was specifically created to reach traditionally
underserved populations. As the legislative declaration of the Concurrent Enrollment Programs Act
states:
Historically, the beneficiaries of concurrent enrollment programs have often been high-achieving students. The expanded mission of concurrent enrollment programs is to serve a wider range of students, particularly those who represent communities with historically low college participation rates. (CRS §22‐35‐102(d)) The program is also seen as a way to fulfill state goals of halving the high school dropout
rate and doubling the number of postsecondary credentials earned by Coloradans (Lopez, 2011; CRS
§22‐35‐102). To reach those goals, the legislation was designed to broaden access to concurrent
enrollment courses and to improve the quality of the programs. Legislation also specifically permits
students to take concurrent career and technical education (CTE) courses, which fits with the
program intent of accelerating students to a credential through multiple pathways.4
Key Policy Features
Colorado’s legislation is seen as model for other states looking to expand concurrent
enrollment. JFF closely evaluated every statewide policy against their six model policy elements, and
they identified Colorado as one of five “exemplar” states, along with Florida, New Mexico, Texas and
Utah (Jobs for the Future [JFF], 2012).
One key feature of the legislation is that it establishes a transparent funding process that
shares costs between high schools and colleges, while keeping costs low for families. The funding
mechanism permits both districts and colleges to collect state funding for students in concurrent
enrollment to help defray costs (CRS §22‐35‐101 et al.). As mentioned in the previous section, this
4 The Concurrent Enrollment Programs Act also creates the “5th year” ASCENT program for students retained
by school districts to receive instruction beyond the senior year. The focus of this dissertation will be on the 9 th-
12th grade Concurrent Enrollment program; ASCENT students will be excluded from the analysis.
16
funding mechanism is a model policy element according to both JFF and ECS (Ward & Vargas, 2012;
Zinth, 2014b). School districts use per pupil revenue (PPR) to cover tuition costs for concurrent
enrollment students. Districts pay tuition to the postsecondary institutions directly on behalf of
students. Previously in Colorado, families would pay for tuition costs and would possibly be
reimbursed by the district later. That process, however, can be prohibitive to low and middle-
income students and reduce access. Partnering postsecondary institutions are allowed to include
concurrent enrollment students in its determination of enrollment numbers for funding purposes.
Lastly, students apply for and authorize the institution to collect the Colorado Opportunity Fund
stipend to pay that portion of the tuition (C.R.S. 22-35-105 (2)). While students and families do not
pay any tuition costs, they may be responsible for books, transportation, technology or fees,
depending on local financial arrangements. Further, if students do not complete the course and do
not have the permission of their principal for a non-completion, they may be required to reimburse
the school for the tuition costs (C.R.S. 22-35-105(4)). Students and parents fill out formal paperwork
to apply for concurrent enrollment, and the terms for repayment, if any, should be specified in the
application (CDE, 2016).
Districts are required by statute to notify families of concurrent enrollment opportunities
and, if any schools within the district want to concurrently enroll students, the district must enter
into a “cooperative agreement” with a postsecondary institution. As set forth in the law,
cooperative agreements must, at a minimum, include the following elements:
The amount of academic credit to be granted for successfully completed course work by concurrently enrolled students;
A requirement that concurrent enrollment course work qualifies as academic credit towards a certificate or degree, or basic skills credit;
A requirement that the local education provider (i.e. school district, charter school or Board of Cooperative Services) pay tuition for courses completed by a student, according to the negotiated amount;
A requirement that the local education provider and the postsecondary institution establish an academic plan of study for concurrently enrollment students, and a plan for the district to provide ongoing counseling and career planning;

17
Confirmation by the district of the student’s unique State Assigned Student Identifier (SASID) for funding and enrollment purposes;
Authorization for payment of the College Opportunity Fund on behalf of the student;
Consideration and identification of ways for concurrent enrollment students to remain eligible for interscholastic high school activities; and
Additional financial provisions. ((C.R.S. 22-35-104(6))
The cooperative agreements set forth the basic ground rules for the partnership between
high schools, districts and postsecondary institutions. Often included in the agreements, in addition
to the components listed above, are the specific fiscal and operational arrangements regarding
course location and instructors. The concurrent enrollment classes must be offered by an eligible
institution of higher education, but can be delivered on the high school campus, college campus,
online, or in a hybrid format. If the courses are taught by high school teachers they must be
credentialed as college adjunct faculty.
The concurrent enrollment program rules specify that all qualified students in the ninth
grade or higher in a public school may take courses for both high school and college credit. To
determine if a student is qualified, institutions of higher education use the same course
prerequisites they use with all other postsecondary students seeking to enroll in the same class on
their campus (CRS § 22-35-104 (4)(a)). High schools and colleges have to collaborate to ensure that
students are properly assessed and meeting prerequisite requirements for course placement.
Colleges are ultimately responsible for the course content and the quality of instruction, even if the
course takes place on a high school campus taught by a high school instructor (who has been
approved as an adjunct faculty member).
Contributions to the Field
Since Colorado is seen as having a model state concurrent enrollment policy (JFF, 2012;
Lopez, 2011), this study uses Colorado as a case study and begins by exploring the factors that led
some schools in the state to adopt concurrent enrollment more quickly and implement it more

18
widely than other schools. After understanding the key conditions at the school level, the author
analyzes student-level behaviors by exploring what types of students are choosing to participate in
the program and what the effects are of taking concurrent enrollment courses on college access and
success. The study considers, in particular, if concurrent enrollment improves postsecondary
outcomes among traditionally-underserved students.
The findings of this study will be valuable to practitioners, policymakers, and other
researchers because state policy continues to be heavily relied upon as a lever for changing
educational outcomes, yet, there is not a clear understanding of whether, or how, state policy
affects behaviors at the institutional and student levels. Policy diffusion behavior is especially
informative at the sub-state level in Colorado because the state has a strong local control culture,
and policies and behaviors can vary by locality. While Colorado provides an appropriate case study
for the questions at hand, other states are also experimenting with education reforms under similar
conditions. Therefore, the findings of this study can be generalized to other states and other related
education policy areas.
Policy Diffusion and Innovation Research
This study also seeks to contribute to policy diffusion and innovation theory. The theory is
most often applied to state governments (Berry & Berry, 2007). There have been studies conducted
of local governments, but the body of research is much smaller and focuses on municipalities
(Shipan & Volden, 2008). Thus, this research will contribute to the continual exploration of the
theory by applying it to a unique unit of analysis—high schools. There is no apparent study on the
diffusion of concurrent enrollment across high schools.
Additionally, the vast majority of the studies conducted using policy innovation and diffusion
have focused on the adoption of a policy without considering what occurs after adoption in the
implementation stage. Scholars have identified this gap in the literature and have called for studies

19
to apply policy diffusion analysis beyond a simple dichotomous measure of adoption to measures of
policy implementation (Shipan & Volden, 2012). This study will seek to fill this gap in the literature
by conducting an analysis of the factors that influence policy implementation, as measured by the
share of students taking concurrent enrollment courses within a high school.
Lastly, more recent diffusion research has focused on the importance of the characteristics
of the policy itself in terms of salience, complexity and compatibility to the diffusion process
(Boushey, 2010, Makse & Volden, 2011, Nicholson-Crotty, 2009). These policy attributes are
theorized to affect how quickly policies are adopted among states and municipalities. Makse and
Volden (2011), for example, analyzed the diffusion of criminal justice laws across states and found
that compatible policies—those that fit seamlessly into current practices—are quicker to diffuse
than complex policies that require a great shift in the status quo. Given that this is a relatively newer
stream of diffusion research, this study will provide a modest contribution to the literature on policy
characteristics by conducting a diffusion analysis of Colorado’s concurrent enrollment policy, which
could be considered a compatible policy according to the typology of policy characteristics (Makse &
Volden, 2011, Shipan & Volden, 2012).
Education Research
This study also seeks to contribute to the field’s understanding of whether—and to what
extent—students participating in concurrent enrollment see improvement in educational outcomes
in terms of college access and college readiness (whether students are prepared to academically
succeed once in college). Education researchers often struggle with controlling for selection bias due
to limitations on available data and analytical methods, and this is true for prior research on
concurrent enrollment (Allen & Dadgar, 2012; An, 2012; Le, Casillas, Robbins, & Langley, 2005). This
study will contribute to the education research field by attempting to better control for selection
bias to more precisely isolate the effects of this particular intervention.
20
Concurrent enrollment programs have been around for decades, but, until recently, studies
of program effectiveness were limited in number and rigor. Karp et al. (2007) found dual enrollment
students in New York City and Florida in career and technical education programs were more likely
to enroll in college, persist to the second year, and have higher GPAs and higher credit
accumulation. Martin (2013) found that dual enrollment students at one North Carolina community
college had higher college grades than non-dual enrollment peers. Allen and Dadger (2012)
evaluated the dual enrollment program at the City University of New York and found that dual
enrollees earned higher GPAs and more credits once in college. Those studies, while finding positive
outcomes, were narrow in focus—investigating particular colleges or programs—and often
employed methods that did not adequately control for selection bias (Giani, Alexander, & Reyes,
2014; Taylor, 2015, USDOE, 2017). There is one study that meets rigorous quasi-experimental design
standards and is broad in scope—An (2013) used a national dataset and found that dual enrollment
programs increase degree attainment rates for first-generation students (USDOE, 2017).
Very recently researchers have published quasi-experimental evaluations of statewide
concurrent enrollment programs. These studies were possible due to the recent expansion of
statewide longitudinal data systems. Cowan and Goldhaber (2014) used Washington’s data system
to analyze the statewide “Running Start” dual enrollment program and found positive effects on
college enrollment, particularly for students who are lower-performers academically. Taylor (2015)
followed Illinois’ graduating class of 2003 to track college entrance and completion rates for dual
enrollment students and found positive effects overall, though the effect sizes were smaller among
low-income students and students of color. Haskell (2016) analyzed 2008 and 2009 high school
graduates in Utah and found reduced time to college degree completion and potential financial
savings to families and the state. Giani, Alexander and Reyes (2014) use the statewide longitudinal
data system in Texas to track 2004 high school graduates into college. Their study found greater

21
enrollment, persistence and completion among dual credit students as compared to non-dual credit
students. Importantly, dual credit students enjoyed greater postsecondary benefits as compared to
students taking other forms of advanced coursework such as Advanced Placement and International
Baccalaureate courses (Giani et al., 2014).
All but one of the above-mentioned studies (Allen & Dadgar, 2012; An, 2013; Cowan &
Goldhaber, 2014; Giani et al., 2014, Karp et al., 2007, Martin, 2013, Taylor, 2015) were recently
evaluated by the What Works Clearinghouse (WWC), and only two met the WWC design standards
with reservations: Giani et al.’s (2014) evaluation of Texas’s dual enrollment program and An’s
(2013) nationally representative study (USDOE, 2017).5
While the Illinois, Utah, Texas and Washington studies indicate that concurrent enrollment
students participating in state-wide programs have more positive postsecondary outcomes than
their non-participating peers, each study is set in its own state policy context. The Texas program
design is substantially different than Colorado’s. The Texas and Illinois studies both use graduating
cohorts from the earlier part of the 2000s, which allows them to follow students further into higher
education, but also negates the ability to identify more recent trends. With the exception of Giani et
al. (2014), none of the studies uses an intensity measure of concurrent enrollment participation (e.g.
number of credit hours taken). And, Giani et al.’s (2014) study does not include data on Texas high
school graduates who attend college out-of-state in their college matriculation model, which could
bias their results. Further, there is value in determining whether concurrent enrollment outcomes
are consistent across states. The concluding chapter of this dissertation considers how Colorado’s
results compare to the findings in these other state studies.
In summary, additional research beyond the emergent state studies is needed for the field
to gain confidence in concurrent enrollment as an effective college readiness intervention,
5 Haskell (2016) was not reviewed by the WWC.

22
particularly give the uniqueness of each state’s policy and the uncertainty regarding consistency of
findings across states. While prior research has found dual enrollment programs result in benefits
for the average student, it is unclear to whom those benefits accrue and to what extent. Few studies
have examined the effects on traditionally underserved populations, and of those that have, the
results are inconsistent. Taylor (2015) found minority and low-income students saw smaller gains in
postsecondary outcomes when compared to their peers in Illinois, while An (2013) found higher
effect sizes for students from disadvantaged backgrounds. It is evident that with 47 states having
statutes governing concurrent enrollment programs much can still be learned about the
effectiveness of these policies.
Summary & Research Questions
Colorado’s concurrent enrollment policy was enacted in 2009, and within five years, 91
percent of the state’s high schools offered concurrent enrollment to some degree. Given the rapid
diffusion of the program, this study will seek to identify the local variables and conditions that affect
the decision to adopt concurrent enrollment programs in high schools in an effort to uncover any
best practices that could be applied to other states trying to scale up similar programs. The first
research question is stated as follows.
RQ 1: What factors influence whether or not high schools adopt concurrent enrollment
programs?
Additionally, because Colorado’s state policy is voluntary, there is ample variance and room
for innovation at the local level in regards to whether and how the program is implemented. High
schools may adopt concurrent enrollment to add another option to an already existing portfolio of
college readiness or credit accrual programs (e.g. Advanced Placement courses, International
Baccalaureate program, honors courses, etc.). Alternatively, a high school may launch concurrent
enrollment as a way to provide access to college-level courses to all or nearly all upper-classmen. A
23
rural school may, for example, enroll all seniors in a concurrent enrollment college-level math
course. Offering a concurrent enrollment math course to a classroom of seniors at a large high
school would only constitute a small percentage of the total senior class, whereas at a small, rural
school it may comprise the majority of the school’s seniors. This potential for variation in the degree
to which students are participating in concurrent enrollment within a high school leads to a sub-
question:
RQ 1a: What factors influence the extent to which concurrent enrollment programs are
utilized by students within high schools?
To date, there is no apparent empirical examination into the school- or district-level
characteristics that lead to faster or deeper program adoption at certain high schools as compared
to others. This study also seeks to understand if students participating in Colorado’s concurrent
enrollment program see improvement in educational outcomes in terms of both their participation
in college and their success once in college. The author considers if the program has positive effects
for Colorado’s traditionally-underserved students in particular. Accordingly, the second and third
research questions are as follows:
RQ2: How does participation in concurrent enrollment affect the college-going rates of
Colorado’s high school students?
RQ3: How does high school participation in concurrent enrollment affect the college
performance and persistence of students?
These two research questions combined with the first question are collectively important
because in order for state-facilitated, voluntary policies to significantly improve educational
outcomes, the policy needs to be both widely diffused in schools and impactful on individual
students. Answers to these questions will be beneficial to policymakers, practitioners and
researchers.

24
CHAPTER II
LITERATURE REVIEW AND HYPOTHESES
Several different literature streams inform the research questions set forth in the previous
chapter. The first research question concerning differences in school-level adoption of concurrent
enrollment is informed by policy innovation and diffusion theory. The second and third research
questions, which are concerned with the individual educational outcomes of participating in
concurrent enrollment, rely on different strands of education theory. Hypotheses are drawn from
the literature and presented throughout the chapter.
Policy Diffusion & Innovation Theory
Policy diffusion and innovation theory submits that political, economic and social factors,
along with competitive and emulative pressures, influence whether or not policy change is adopted
(Mokher & McLendon, 2009, 251). The theory’s roots reside in Walker’s (1969) seminal article on
the diffusion of innovation among American states in which he sought to understand why some
states adopt innovative policies quicker than others. Walker (1969) defined innovation “simply as a
program or policy which is new to the states adopting it” (881). His work was groundbreaking
because he focused not only on the importance of a state’s internal factors (drawn from
organizational innovation literature) but also on the role of competitive and emulative pressures
among states. Walker (1969) observed that national professional communities served as learning
opportunities where ideas were spread among state policy makers and administrators. He also
noted that some states were seen as leaders, and sought to determine if other states were more
likely to emulate policies of the leader states (Walker, 1969).
In the years following, numerous scholars sought to test and refine Walker’s (1969)
propositions (Berry, 1994b; Shipan & Volden, 2012). Some scholars focused solely on the internal
factors, or determinants, that lead states to be early innovators, while other scholars focused their

25
research on regional diffusion and national interaction patterns (Berry, 1994b; Berry & Berry, 2007;
Mokher & McLendon, 2009). In the 1990s, research by Berry & Berry (1990, 1992) significantly
advanced the research genre by offering a methodology—event history analysis—that provided a
way to empirically test the effects of both internal determinants and external diffusion factors in
one model. Since then, policy diffusion and innovation theory has been applied using event history
analysis to a wide range of substantive topics, such as health care (Stream, 1999; Volden 2006), hate
crime laws (Soule & Earl, 2001), electricity deregulation (Ka & Teske, 2002), and education
(Mintrom, 1997; Wong & Shen, 2002). The majority of empirical applications of policy diffusion
focus on state governments, but the theory has also been applied to local municipalities (e.g.
Bingham, 1977; Hoyman & Weinberg, 2006; Lubell et al., 2002). These studies, along with others,
considered different mechanisms that drive the diffusion process, including policy entrepreneurs
(Balla 2001; Mintrom 1997), learning that occurs from effective policies (Gilardi, Füglister, & Luyet,
2009; Volden 2006), competition (Baybeck et al., 2011, Berry & Berry, 1990) and coercive forces
(Karch, 2006; Welch & Thompson, 1980). More recent diffusion research also has focused on the
importance of the characteristics of the policy itself in terms of salience, complexity and
compatibility to the diffusion process (Boushey, 2010, Makse & Volden, 2011, Nicholson-Crotty,
2009). Makse and Volden (2011), for example, found that compatible policies—those that fit
seamlessly into current practices—are quicker to diffuse than complex policies that require a greater
shift in the status quo.
While the policy diffusion and innovation literature is wide and varied, the theory is
generally focused on the following overarching factors: “a polity’s motivation to innovate, the
resources that it has to innovate, the obstacles that stand in the way of this innovation, other co-
current policies that a polity is pursuing and the influence of the external environment” (Hoyman &
Weinberg, 2006, 98-99). These factors often comprise the central elements of empirical models

26
used to understand and predict why certain public entities are quicker to adopt innovative policies
than others. Given the lack of research on what affects policy implementation beyond the initial
state of policy adoption, the same theoretical grounding will be used to explore both adoption and
implementation effects in this study (Shipan & Volden, 2012).
Motivation to Innovate
The policy innovation literature theorizes that if problem severity is high, governmental
entities are more likely to be motivated to adopt new policies (Berry & Berry, 1990, 2007; Hoyman &
Weinberg, 2006; Mohr, 1969). Berry and Berry (2007), in their review of the literature on policy
innovation, state that “problem severity can influence the motivation of state officials to adopt a
policy directly by clarifying the need for the policy, or indirectly by stimulating demand for the policy
by societal groups” (Berry & Berry, 2007, 235). Empirical evidence for this proposition has been
found in several studies covering topics such as welfare, school choice and health care reform
(Allard, 2004; Mintrom & Vergari, 1998; Stream, 1999).
Concurrent enrollment programs can be viewed as a tool for increasing student
achievement levels and improving college readiness (Hoffman, 2005). Thus, districts struggling with
low academic achievement levels may have more incentive to innovate and improve outcomes and
may be more likely to turn to concurrent enrollment as a potential solution. The severity of low
academic achievement in districts and schools should motivate them to adopt concurrent
enrollment, whether that pressure to improve comes from internal leadership, the state (via
performance ratings), or concerned parents. Likewise, if a school has an urgency to improve the
achievement of its students, it could be hypothesized that the school will encourage higher levels of
participation in concurrent enrollment courses. That is, if a high school adopts the program as an
improvement strategy, it would follow that the school would actively encourage and recruit
students to participate in it. A hypothesis on the motivation to innovate is proposed, as follows.
27
Hypothesis 1.1: High schools that have lower academic achievement levels are more likely to adopt
concurrent enrollment and have higher student participation rates.
Resources to Innovate
Policy diffusion and innovation theory also points to the importance of resources, which are
needed both for the innovation itself and to overcome any obstacles to innovate (Berry, 1994b).
There are two types of resources that the literature on policy diffusion and innovation identifies that
are particularly relevant to this study: fiscal capacity and organization size. Generally, past studies
have found that a public entity’s probability of adopting innovative policies is positively related to
the resources at its disposal (Berry & Berry, 2007).
In regards to fiscal capacity, the literature on policy innovation draws from the broader
literature on organizational innovation, which has consistently found that financially-secure
organizations are more likely to innovate than organizations in fiscal trouble or with fewer slack
resources (Berry, 1994a; Bingham, 1977; Cyert and March, 1963; Rogers, 1983). Policy innovation
theory points to the fact that many new policies and programs require extensive funds to be
implemented, and thus agencies with abundant resources may be more inclined to adopt such
programs (Berry & Berry, 2007) and may have a greater capacity to widely implement them.
Therefore, drawing from the literature and theory on financial resources and innovation, the
following hypothesis is proposed. Hypothesis 1.2: High schools with greater fiscal capacity are more
likely to adopt concurrent enrollment and have higher student participation rates.
Theory and research on organizational innovation has long considered the size of an
organization as another key explanatory variable that is positively associated with the likelihood of
innovation (Baldridge and Burnham, 1975; Berry, 1994a; Cyert & March, 1963; Mohr, 1969; Rogers,
2003). Size is considered an important element because it facilitates the presence of other factors
that may affect innovation such as the availability of slack, or surplus, resources and specialized staff

28
(Rogers, 2003). Larger organizations tend to have more resources, and they are more likely to have
the capacity and structure to hire specialized staff. Having administrators whose job it is to stay
attuned to the latest research and innovations in their specific program area makes it more likely
that schools will be aware of new programs and have the capacity to implement them (Baldridge,
1975; Berry, 1994a). As school size increases, however, it may be more likely that the proportion of
eligible students who participate in innovative programs decreases. This is particularly true if larger
schools have a broad array of programs from which students may select. Larger organizations may
have greater numbers of participants compared to smaller organizations, but in terms of
participation rates it seems likely that organizational size may be inversely related to overall
participation rates. Based on the organizational innovation literature and general reasoning, the
following resource hypothesis is proposed. Hypothesis 1.3: The larger a school, the more likely it is to
adopt concurrent enrollment, but the share of students participating may be lower.
External Factors
Policy diffusion scholars have devoted much attention to how competitive and emulative
pressures among states affect policy innovation (Berry, 1994b; Berry & Berry, 2007; Walker, 1969).
Policy innovation and diffusion theory points primarily to two avenues through which external
pressure for policy change occurs: through regional diffusion—that is, through competition with or
emulation of neighboring governments—or through national interaction, which is the idea that
policy ideas spread through networks of policymakers (Berry & Berry, 2007; Walker, 1969). Empirical
tests of diffusion models have found varying results. A national study of the diffusion of concurrent
enrollment policies among states, for example, found that regional diffusion pressures were not a
statistically significant factor (Mokher & McLendon, 2009). On the other hand, a recent study of the
diffusion of charter school legislation among states found the regional diffusion variable to have a
statistically significant and substantive influence on policy adoption (Lee, 2014). Some scholars

29
argue that the geographic focus of policy adoption is an outdated concept given that policymakers
and leaders can learn about innovative programs not just from their geographic neighbors, but from
others across the states—or increasingly across the world (Shipan & Volden, 2012; Volden, Ting &
Carpenter, 2008).
Nonetheless, as an open enrollment state, schools in Colorado have an incentive to compete
with one another for students because those students come with revenue attached. If a high school
sees that a neighboring school is offering advanced or enhanced programming, it seems likely that
competitive and emulative pressures could influence policy innovation decisions and may also lead
to more robust implementation reflected by higher participation rates Thus, although research and
theory is unclear on the influence of regional pressures, this study hypothesizes that geographic
proximity will be influential. Hypothesis 1.4: High schools nearby other schools that have already
adopted concurrent enrollment are more likely to offer the program and have higher participation
rates.
Another external factor that could be relevant to this research is a high school’s proximity to
a community college. There is precedence in the literature for focusing on this factor; the influence
and presence of community colleges was used in the previously-mentioned study of national dual
enrollment policy diffusion (Mokher & McLendon, 2009). The nearness of a community college to a
high school makes the implementation of the concurrent enrollment policy easier in terms of
accessibility to courses delivered at a college campus, credentialing of high school instructors or the
provision of community college instructors (in cases where college faculty teach courses at a high
school’s campus). While some concurrent enrollment is provided by four-year institutions, the large
majority of course enrollments are through community colleges. In Colorado during the 2015-16
school year, for example, 88 percent of concurrent enrollment students took courses through
community colleges (Colorado Department of Higher Education [CDHE], 2017b). Moreover,

30
community colleges are proponents of concurrent enrollment because it is an immediate revenue
generator, as well as a recruitment strategy (Crooks 1998; Morest & Karp 2006). Community
colleges may exert pressure on schools to offer concurrent courses, in which case, if a community
college is geographically close to a particular high school, the policy may diffuse more readily and,
perhaps, more deeply, which would be evidenced by a greater share of students within a high school
taking concurrent enrollment courses. Hypothesis 1.5: High schools with greater proximity to a
community college will be more likely to adopt concurrent enrollment and have higher participation
rates.
Education Theory
Because education is such a broad field, it is necessary to first situate the research through a
specific theoretical lens. Some researchers take an institutional rational choice lens, for example,
and place emphasis on how institutional arrangements constrain and aggregate individual choices
resulting in organizations of different types and quality (Chubb & Moe, 1990). Other researchers
focus on how manipulating inputs within existing organizational and institutional arrangements can
alter performance outputs. These scholars, which devote their time to identifying problems and
evaluating reforms that occur in and around schools, could loosely be grouped under a theoretical
framework of school improvement.
The theoretical reasoning behind concurrent enrollment is grounded in the viewpoint that
there are factors within the control of schools that can be manipulated to improve education
outcomes. Empirical research has linked a variety of factors to the likelihood that students will
attend and be successful in college. Some factors cannot be altered by schools—such as
socioeconomic status—but other factors, including academic preparation and metacognitive skill
development, can be manipulated. Thus, the school improvement framework is an applicable lens
for this inquiry. This section of the literature review provides an overview of education theory and

31
research related to improving student achievement, generally, and college access and success,
specifically.
School Improvement Framework
There are a significant number of education researchers who rely on a theoretical lens that
focuses fundamentally on manipulating inputs within existing school arrangements to alter
performance outputs (Hanushek, 2003; Purkey & Smith, 1983). Scholars coming from the field of
economics refer to these types of studies as education production functions, which are used to
relate “observed student outcomes to characteristics of the students, their families, and other
students in the school, as well as characteristics of schools” (Hanushek, 1979, 354). Education and
economics scholars could be loosely grouped together under a theoretical framework of school
improvement, which asserts that the problems that plague student achievement are “found in and
around the schools, and the schools can be ‘made’ better by relying on existing institutions to
impose the proper reforms” (Chubb & Moe, 1990, 3). This school of thought emerged in the wake of
the 1966 Coleman Report—formally known as Equality of Educational Opportunity (Chubb & Moe,
1990; Hanushek, 1979, 2003; Purkey & Smith, 1983). The Coleman Report (1966), which was the
product of a substantial study covering over 600,000 students in 4,000 schools, found that once the
family background of individual students and the overall racial composition of schools were taken
into account, school characteristics had little effect on achievement levels (Coleman et al.). The
school characteristics included in the Coleman study were numerous and included such factors as
school funding, classroom size, teacher and principal salaries, education levels of teachers, number
of free textbooks, and extracurricular offerings (Coleman et al., 1966).
In a backlash against the report’s findings, researchers spent the following decades
attempting to prove that school-based elements do matter (Hanushek, 2003; Purkey & Smith, 1983).
One rationale for such research is that factors related to family background are not easily changed—

32
at least in the short term—and, therefore, the many factors that can be manipulated at the
classroom, school, or district-level must continually be examined in the effort to improve schools
(Purkey & Smith, 1983). Some researchers chose to focus on organizational and cultural attributes
not included in the Coleman Report; this group of scholars contributed to what is known as the
“effective schools research” (Chubb and Moe, 1990; Edmonds & Frederiksen, 1979; Hersh et al.,
1981; Purkey & Smith, 1983). While encompassing a diverse set of studies and findings, overall, the
effective schools research conducted in the 1970s and early 1980s emphasized the following
elements as key to improving student achievement: “high staff expectations and morale, a
considerable degree of control by the staff over instructional and training decisions in the school,
clear leadership from the principal or other instructional figure, clear goals for the school, and a
sense of order in the school” (Purkey & Smith, 1983, 438). Empirical evidence that these cultural and
organizational elements could affect student achievement (as measured typically through
assessment scores) was heralded as proof that schools matter (Edmonds, 1979; Hersh et al. 1981,
Purkey & Smith, 1983).
Other researchers took a different path and have focused on re-examining the variables
included in the Coleman Report and have found some nuanced, positive effects on student
achievement. Several studies, including the well-known Tennessee STAR experiment, for example,
have found statistically significant, positive effects of small classroom size (below 20 students per
teacher) on student learning in Kindergarten through third grade (Centra & Potter, 1980; Mosteller,
1995; Walberg, 1982). Others, however, have found little evidence that class size affects learning
enough to warrant its financial costs (Hanushek, 1999; Funkhouser, 2009). The debates within the
literature on classroom size are representative of the school improvement research as a whole in
that there are some positive findings but much debate over meaning and replication. Analysis of
other inputs such as school funding, teacher education and teacher salaries constitutes a large, and

33
somewhat controversial, literature. The wide variety of variables, the broad range of statistical
methods used, and the differing levels of empirical quality have resulted in findings that are often
seen as contradictory (Hanushek, 1979). Hanushek (2003) calls for more rigorous research on school
inputs, stating that “if educational policies are to be improved, much more serious attention must
be given to developing solid evidence about what things work and what things do not” (94).
In the last 20 years, scholars have indeed continued to analyze a variety of school-based
programs in search of “solid evidence” of positive effects on student learning. The focus of this more
recent research has been on topics such as standards and curriculum, bilingual education, literacy
programs, and improving the transition from high school into college (Hoffman, 2005; Darling-
Hammond, 2010; Kirst & Venezia, 2004, Hoffman, Vargas & Santos, 2008a, 2008b). Initiatives
focused on aligning secondary and postsecondary systems are often referred to as K-16 or P-20
initiatives. Research on P-20 systems was epitomized in the work of the Stanford Bridge Project in
the late 1990s, which made the case that the underpreparation of high school graduates for higher
education was a pervasive and critical problem (Venezia, Kirst & Antonio, 2003). The researchers
found the coursework offered in high school and college to be disconnected, and they noted that
underrepresented students were “especially likely to be hampered by insufficient access to college
preparatory courses” (Venezia, Kirst & Antonio, 2003, 8). The expansion of dual enrollment
programs was one of the key recommendations of the Stanford Bridge Project to improve the
transition from high school to college. Dual enrollment is seen as an avenue for students to gain
stronger academic preparation for college (Kirst & Venezia, 2004; Venezia, Kirst & Antonio, 2003).
The next section of the literature review will explore in detail the theory behind how academic
preparation and coursework offerings relate to a student’s educational achievement.

34
Academic Preparation
Empirical research studies over the past half century have consistently identified that
disparities in curriculum offerings, including course options, rigor of curriculum, and quality of
courses, contribute to and exacerbate achievement gaps. This stream of literature focuses on the
inequity of educational opportunity between groups of students, and the detrimental effect that has
on academic success. Dreeben’s (1987) study of inner-city elementary students in Chicago, for
example, found that black and white students of similar aptitude performed equally well when
exposed to the same instruction—high or low quality (Dreeben, 1987). The problem is that high-
quality instruction is not offered in every classroom, and low-income, minority students tend to
disproportionately receive inadequate instruction (Darling-Hammond, 2010). This contributes to
persistent achievement gaps as evidenced through several studies that have found that students
who are exposed to rich, challenging curriculum eventually outperform their peers who are placed
into less rigorous classes, even after controlling for socioeconomic background (Alexander & McDill,
1976; Gamaron, 1990; Gamaron & Hannigan, 2000; Oakes, 2005). Peterson (1989), for instance,
conducted an experimental study that randomly placed at-risk 7th graders with similar backgrounds
into varying levels of math classes. Students placed into the highest math class (containing a pre-
algebra curriculum) outperformed the other students on assessments given at the end of the school
year (Peterson, 1989).
Researchers have found that the disproportionate allocation of high-quality instruction to
students occurs primarily through two ways. The first is that schools with minority-majority
populations (i.e. serving mostly Hispanic, black or Native American students) offer fewer
academically-rigorous courses. Instead of having a selection of honors, Advanced Placement, lab
science and foreign language courses like high schools in wealthy districts do, high schools serving

35
large numbers of minority and low-income students often offer mostly remedial and vocational
courses (Pelavin & Kane, 1990; Oakes, 2005; Darling-Hammond, 2010).
The second way that high-quality instruction is allocated away from low-income, minority
students is through tracking. In schools with socioeconomically-diverse populations, white and
upper-income students tend to be placed into college preparatory classes while minority and low-
income students are tracked into lower-level courses (Darling-Hammond, 2010; Oakes, 2005). As
Darling-Hammond (2010) phrases it, “curriculum tracks are generally color coded” (52). Oakes
(2005) has conducted empirical studies over the past several decades that highlight the
pervasiveness of tracking in America’s schools. One of her studies, for example, found that after
controlling for test scores, white and Asian students were far more likely to be placed into honors
courses than their peers (Oakes, 1993). High-achieving Latino students who scored at the 90th
percentile on standardized tests had just a 56.3% chance of being assigned to a college preparatory
class, as compared to 97.3% of Asian students and 93.3% of white students scoring in the same
percentile (Oakes, 1993).
The reasons for the underrepresentation of minority and low-income students in honors, AP
and other challenging secondary courses are many. Tracking begins at an early age and, by the time
students reach high school, tracked students often do not have the prerequisite skills or test scores
to take advanced courses (Darling-Hammond, 2010; Oakes, 2005). More directly, counselors may
advise students from low socioeconomic backgrounds away from challenging postsecondary
pathways and towards low-status careers (Darling-Hammond, 2010). Further, middle- and upper-
income parents tend to be more active in pushing for their children to be placed into advanced
courses and programs and to be assigned to the best teachers. As Darling-Hammond (2010)
explains, high-quality education is scarce and,
Scarce resources tend to get allocated to the students whose parents, advocates or representative have the most political leverage. This typically results in the most highly

36
qualified teachers offering the most enriched curricula to the most advantaged students. (60) Indeed, other empirical work has found tracking patterns in place for teachers in which the
best (most-experienced, most competent) teachers are assigned to the brightest students in upper-
level classes, while inexperienced and ineffective teachers are assigned to lower-level classes and
students (Finley, 1984; Talbert, 1990).
As this section of the literature review demonstrates, disparities in curriculum offerings and
quality of instruction remain a significant problem in today’s schools. Theoretically speaking,
ensuring that all students have access to rigorous coursework in high school through programs such
as concurrent enrollment could improve education outcomes. Concurrent enrollment programs
expand the number of accelerated learning options available to schools, especially when programs
have clear funding streams (Allen, 2010; Karp, Bailey, Hughes, & Fermin, 2005). Making concurrent
enrollment courses more prolific in high schools and targeting them to students of all socioeconomic
backgrounds could be a way to ensure traditionally-underserved students have access to enriched,
advanced curriculum (Karp, Bailey, Hughes, & Fermin, 2005; Venezia, Kirst, & Antonio, 2003). For
students who have been tracked into lower-level courses from an early age and enter high school far
behind their peers academically, some concurrent enrollment programs, including Colorado’s, offer
remedial courses to high school seniors to help students become college ready (Allen, 2010;
Rutschow & Schneider, 2011). This a newer strategy; dual enrollment courses have long been
targeted to high-achieving students, but schools are now expanding the mission of such programs to
serve less academically-prepared students (Allen, 2010; Karp et al., 2007; Rutschow & Schneider,
2011; Venezia, Kirst, & Antonio, 2003).
Metacognitive Learning Skills
When student do not take advanced, college-preparatory coursework, it is not content
knowledge alone that students miss (e.g. algebra vs. pre-algebra), but also the development of
37
higher-order thinking and reasoning skills (Darling-Hammond, 2010). Researchers have found that
classes in the lower tracks often focus on rote memorization, test taking, and behavioral problems
(Eckstrom & Villegas, 1991; Good & Brophy, 1987; Oakes, 2005). In contrast, other research studies
have shown that in college-preparatory tracks, teachers engage students in hands-on group
activities and projects that encourage students to be creative, to problem solve and to think
critically and strategically (Braddock & McPartland, 1993; Garcia, 1993; Wenglinsky, 2002). It is the
latter skills that students need to acquire to ultimately be successful in higher education (Conley,
2007, 2010).
In fact, research on college readiness has long made the point that content knowledge alone
does not predict success in college—there is a host of other knowledge, skills, and behaviors
students must acquire to be successful in postsecondary education (Attinasi, 1989; Byrd and
MacDonald, 2005; Conley, 2005, 2007, 2010; Dickie & Farrell, 1991; Shields, 2002). These other
attributes have often been referred to as “nonacademic” or “noncognitive” skills, which is arguably
a misnomer because the skills and behaviors are directly related to cognition and thinking processes.
Conley (2013) advocates for the terminology “metacognitive learning skills” to be used when
referring to “the full range of behaviors, attitudes, and beliefs students demonstrate while engaging
in the learning process” (Conley, 2013, 21). Metacognition is comprised of “personality and
motivational factors, experiential and contextual intelligence, social skills and interests, and
adjustment and student perceptions” (Educational Policy Improvement Center, 2013, para. 4).
Students with well-developed metacognitive learning skills will be able to manage their time
effectively, think critically, navigate college resources, maintain study routines, have self-awareness
of their strengths and weaknesses, analyze and interpret information, and have the confidence to
overcome challenges (Conley, 2010, 2013).

38
Concurrent enrollment is a venue for students to acquire metacognitive learning skills. As
Karp (2012) explains,
Dual enrollment can be seen as a social intervention in which potential college students learn about the norms, interpersonal interactions, and behaviors expected for college success. By “trying on” the role of a college student, dual enrollees benefit from early exposure and practice, coming to feel comfortable in a college environment and ultimately becoming successful once they matriculate. (22-23)
Karp (2012) tested facets of sociological theory in a qualitative study that measured the degree to
which students in concurrent enrollment courses gained knowledge of college behaviors, norms and
processes. The students in her study took dual enrollment courses at their high school, taught by a
teacher who was credentialed as a college adjunct. Despite not being physically located on a college
campus, Karp found that dual enrollment courses still gave students the opportunity to assume the
“role” of a college student, which helped them gain a deeper knowledge of what would be expected
of them in a college courses. Karp (2012) concludes that “dual enrollees get ready for college
success by learning—before they actually matriculate—all aspects of the college role” (23). This
finding supports other research demonstrating that students who take concurrent enrollment
courses have higher levels of self-efficacy, or confidence, in their academic abilities (Margolis &
McCabe, 2004).
College Affordability
Even if students have acquired the right knowledge, skills and abilities to be successful in
college, college affordability remains a significant barrier to matriculation. Numerous studies have
found that low- and middle-income students are more sensitive to tuition and aid changes than
wealthier students, meaning that when tuition increases or grant aid decreases, there is a bigger
decline in enrollment for low-income students than for upper-income students (see e.g. Heller,
1997; Leslie & Brinkman, 1987; Terenzini, Cabrera, & Bernal, 2001; St. John, 1990). In other research
on college affordability, one study analyzed enrollment rates by income level and standardized tests
39
scores and found that high-income students who scored among the worst on the achievement test
were as likely to go to college as low-income students who performed among the best (Kahlenberg,
2004). Put another way, "the least bright rich kids have as much chance of going to college as the
smartest poor kids." (Kahlenberg, 2004, 24). The study also found that 22 percent of low-income
students with the highest test scores did not go to college, compared to 11 percent of middle-
income students and only 3 percent of high-income students with the same scores (Kahlenberg,
2004).
Concurrent enrollment can be an opportunity to make college more affordable by allowing
students to earn college credit for free, or at a reduced cost, while still in high school, thus reducing
the amount of tuition students will have to pay when they matriculate to college (Hoffman, Vargas,
& Santos, 2008a, 2008b; Jobs for the Future, 2006). In some programs, students are encouraged to
accumulate enough credits to earn a certificate or associate degree at the same time as they earn
their high school diploma.
From this review of the literature, it is theorized here that concurrent enrollment will
improve college access and success for its participants for the following central reasons:
1) Concurrent enrollment provides for rigorous academic preparation and enhanced
content knowledge;
2) Concurrent enrollment courses are a venue for students to acquire metacognitive
learning skills and exposure to higher education; and
3) Courses provide the opportunity for students to earn free, or low cost, college credit,
thus reducing the total amount of a college credential.
Following this theoretical framework, a hypothesis regarding college access is stated as
follows. Hypothesis 2: High school students who participate in concurrent enrollment programs will
have a greater probability of enrolling in higher education. Similarly, the author expects positive

40
outcomes in terms of college success based on the theoretical framework, leading to a third central
hypothesis. Hypothesis 3: First-year college students who had participated in concurrent enrollment
programs in high school will have greater academic success and a higher probability of persisting
than college students who did not participate.
Summary
Based on a comprehensive review of the literature, several hypotheses have been identified
to guide the quantitative analysis of Colorado’s concurrent enrollment program. Table 2 provides a
summary of the research questions and the associated hypotheses. The following chapter will
discuss the data and methods used to test the hypotheses.
Table 2. Summary of Research Questions and Hypotheses
Research Questions Hypotheses
RQ1: What factors influence whether
high schools adopt concurrent
enrollment programs?
RQ1a: What factors influence the extent
to which concurrent enrollment
programs are utilized by students within
high schools?
H1.1: High schools that have lower academic achievement levels
are more likely to adopt concurrent enrollment and have higher
student participation rates.
H1.2: High schools that have greater fiscal capacity are more
likely to adopt concurrent enrollment and have higher student
participation rates.
H1.3: The larger a school, the more likely it is to adopt
concurrent enrollment, but the share of students participating
may be lower.
H1.4: High schools nearby other schools that have already
adopted concurrent enrollment are more likely to offer the
program and have higher student participation rates.
H1.5: High schools with greater proximity to a community
college will be more likely to adopt concurrent enrollment and
have higher student participation rates.
RQ2: How does participation in
concurrent enrollment affect the
college-going rates of Colorado’s high
school students?
H2: High school students who participate in concurrent
enrollment programs will have a greater probability of enrolling
in higher education.
RQ3: How does high school
participation in concurrent enrollment
affect the college performance and
persistence of students?
H3: First-year college students who had participated in
concurrent enrollment programs in high school will have greater
academic success and a higher probability of persisting than
college students who did not participate.

41
CHAPTER III
DATA & METHODS
This chapter describes the data and methods used to explore the hypotheses. The study
begins with an exploration of factors that influence the adoption of concurrent enrollment programs
among and within Colorado high schools using school-level, administrative data in event history
analysis and multivariate regression. The author then undertakes propensity score matching and
fixed effects regression using student-level data to analyze the effects of participating in concurrent
enrollment on college matriculation and success.
Data Sources and Collection
Nearly all the data used in this study were collected through Colorado’s two education
agencies: the Colorado Department of Higher Education (CDHE) and the Colorado Department of
Education (CDE). The author constructed panel data sets by compiling publicly-available data from
the agency websites and by procuring a de-identified and secure cross-section of student-level data
from CDHE. The datasets are timely, comprehensive, and—most important—longitudinal between
K12 and higher education due to data-sharing agreements in place between the two agencies.
Statewide longitudinal data systems are still a relatively new phenomenon having rapidly
expanded in states over the past decade. The wealth of information included in these state data
systems has the potential to help transform the public administration of schools and colleges into a
truly evidence-based sector. There are obstacles along the way to reaching that goal, however,
including the recent backlash from parents and community members around the perceived
overreach of government and businesses in collecting data on students. In fact, between 2013 and
2016, 36 states enacted 74 student data privacy laws, some of which establish important procedures
for protecting student data, but some of which also constrain the ability of state agencies to share
student data with researchers (Data Quality Campaign, 2017). Thus, it is within this landscape that

42
this study occurred, and the author acknowledges that access to such rich and powerful data is not
to be taken for granted in education research. Moreover, there is an important contribution that
can be made to the debate around the value of making student data available to researchers if
studies such as this prove worthwhile to policymakers and practitioners.
High School Panel
The first panel data set was constructed by collecting high school data from CDE, CDHE and
the U.S. Census Bureau for the following academic years: 2009-10, 2010-11, 2011-12, 2012-13,
2013-14, and 2014-15. The full data set includes 388 high schools that served, at a minimum, grades
10, 11 and 12 during the entirety of the study period. High schools that opened recently and were
not in existence for all years of the study, closed during the study period, or only served partial
grades (e.g. 9 and 10) during the study period were excluded from the dataset.6 The resulting panel
is strongly balanced, meaning all schools have data for all years of the study.
Aggregate data on multiple indicators for the 388 high schools were obtained from CDE’s
website. The indicators collected include school performance ratings, school type (i.e. charter,
alternative education campus, or traditional school), student count, district setting, prior dual
enrollment program participation rates, and free and reduced price lunch information. The data that
were procured from the CDHE provide details about which high schools and higher education
institutions offer concurrent enrollment programs and how many high school students were in
enrolled in the program during a given academic year. College matriculation rates by high school
were also obtained from the CDHE. Lastly, data were collected from the U.S. Census Bureau’s
American Community Survey for median household income.
6 Given the geographical focus of the policy diffusion research question and hypotheses, online high schools (n=19) were also excluded from the data set.

43
The dataset provides a sufficient scope of variables and a long-enough time span to analyze
the first research question concerning the diffusion of concurrent enrollment among and within high
schools. The Colorado legislature passed the Concurrent Enrollment Program Act in spring 2009, and
the program was fully operational at the start of the 2010-11 school year. The school panel dataset
used in this study spans from fall 2009 through spring 2015, allowing for an analysis of the first five
years of program implementation.
Student Panel
The second panel data set was created from data collected through CDHE’s Student Unit
Record Data System (SURDS), which houses comprehensive postsecondary data on students who
are enrolled at public colleges and universities in the state, as well as those enrolled at three private
institutions: the University of Denver, Regis University, and Colorado Christian University. The CDHE
supplements SURDS with data from the National Student Clearinghouse (NSC) to provide
information on out-of-state enrollment and enrollment at private institutions. The NSC has a
coverage rate of 96 percent of all students enrolled in a U.S. public or private college (NSC, 2013);
thus, when this study considers college enrollment patterns, the dataset captures nearly all
Colorado high school graduates who attend college, whether in-state or out-of-state, at a public or a
private institution. Further, CDHE has established a partnership with CDE that permits the linkage of
the postsecondary data with K-12 data using the State Assigned Student Identifier (SASID). The
SASID-linked databases provided the means to create a student-level panel dataset that follows
cohorts of high school graduates as they move from the K-12 system into higher education. The high
school graduating cohorts of 2011, 2012 and 2013 are included in the student-level analysis.
The variables included in the second panel data set provide details, by semester, about what
postsecondary institution students are enrolled in, whether they require remedial education, and
how they perform in terms of grade point average, credit accumulation, and persistence. The data

44
that were procured from CDHE around concurrent enrollment include how many credit hours
students take and in which high schools and higher education institutions the students are
concurrently enrolled.
Research Design
The research design begins with an event history analysis of how concurrent enrollment
programs expanded among Colorado high schools. Using the high school as the unit of analysis, the
author also uses regression analysis to see if any of the same factors included in the event history
analysis affect the magnitude of program participation rates. Next, the author conducts multivariate
analyses to evaluate the effects of participating in concurrent enrollment on education achievement
using student-level data. Participation in concurrent enrollment is explored both as a dichotomous
measure (yes/no) and as an intensity level (i.e. number of credits). The different components of this
research design rely on the same dataset but have different guiding questions and units of analysis.
A description of the variables, measure, and methods used in the policy diffusion portion of the
study are presented first, followed by an explanation of the variables, measures and methods
employed for the student-level policy evaluation. The chapter concludes with a summary of the
research design.
Policy Diffusion Variables and Measures
The hypotheses relating to the policy diffusion analysis contain several key concepts related
to policy adoption, motivation to innovate, resources and obstacles, and external factors. Table 3
summarizes the indicators that are used to operationalize the explanatory variables in the five
diffusion hypotheses, and the following sections provide additional details. Table 4 provides a
summary of variable descriptions and data sources.
Concurrent enrollment policy adoption. The key dependent variable for all of the
hypotheses in the policy innovation and diffusion analysis is adoption of concurrent enrollment

45
programs. First, this study employs a dichotomous measure of adoption, with a value of “1”
indicating that the high school has adopted the concurrent enrollment policy and there is at least
one student taking a concurrent enrollment course. The study then includes a second measure of
adoption to assess how the covariates affect the magnitude of student participation within a high
school. That measure is a proportional value calculated by dividing the number of students
participating in concurrent enrollment in a given academic year by the total number of students in
grades 9 through 12 in that same year.7
Table 3. Concept Measurement Summary: Policy Diffusion
Hypotheses Constructs Indicators
1.1: High schools that have lower academic
achievement levels are more likely to adopt
concurrent enrollment and have higher student
participation rates.
Academic
achievement
levels
College enrollment rates
School performance rating
(index of ACT scores,
graduation rates, dropout rates
and achievement on state
standardized tests)
1.2: High schools that have greater fiscal capacity
are more likely to adopt concurrent enrollment
and have higher student participation rates.
Fiscal capacity Median household income
Free and reduced price lunch
eligibility
1.3: The larger a school, the more likely it is to
adopt concurrent enrollment, but the share of
students participating may be lower.
High school size Student count
1.4: High schools nearby other schools that have
already adopted concurrent enrollment are more
likely to offer the program and have higher
student participation rates.
Proximity to
adopters
Number of High Schools within
5 miles offering Concurrent
Enrollment
1.5: High schools with greater proximity to a
community college will be more likely to adopt
concurrent enrollment and have higher student
participation rates.
Proximity to
community
colleges
Distance in miles from nearest
community college
Number of community colleges
within 10 miles
7 Some of the schools included in the study serve more grades than 9-12 (e.g. K-12 schools, or secondary schools serving grades 6 or 7 through 12th grade). In all cases, only the population of grades 9-12 is used as the denominator for calculating the share of students participating in concurrent enrollment.

46
Table 4: Variable Descriptions and Sources Variable Description Source
High school adoption of concurrent enrollment program
Dummy variable (yes = 1; no = 0) indicating whether a high school adopts concurrent enrollment in a given year during the study.
Colorado Department of Higher Education
College matriculation rate (%)
Annual measure of the percent of high school graduates who enroll in a postsecondary institution in the fall immediately following graduation.
Colorado Department of Higher Education
School performance rating (%)
Annual index measure of the percentage of points earned on state performance framework that includes ACT scores, graduation rates, dropout rates and achievement on state standardized tests. The higher the percentage of points earned, the better the school performed on the measures.
Colorado Department of Education
Median household income (logged)
Log of the median household income in the past 12 months (in 2014 Inflation-adjusted dollars) for the five year period running from Jan. 1, 2010 – Dec. 31, 2014. The aggregated 5-year survey was used to obtain neighborhood-level estimates.
U.S. Census Bureau, American Community Survey 5-year estimates (2014)
Free and reduced-price lunch (FRL) eligible (%)
Annual measure of the percentage of students eligible for free or reduced-price lunch.
Colorado Department of Education
Student count (logged) Annual measure of the log of the total student enrollment count in October of each school year.
Colorado Department of Education
Diffusion of concurrent enrollment
Number of high schools within 5 miles offering Concurrent Enrollment.
Author’s calculations using data from the dependent variable and high school addresses
Community college distance
Distance in miles from the high school to the nearest community college.
Author’s calculations using data from the dependent variable and high school addresses
Concentration of community colleges
Number of community colleges within 10 miles of the high school.
Author’s calculations using data from the dependent variable and high school addresses
Charter school Dummy variable (yes = 1; no = 0) indicating whether the school is a charter school.
Colorado Department of Education
PSEO participation Dummy variable (yes = 1; no = 0) indicating whether the high school previously offered Post Secondary Education Options (PSEO).
Colorado Department of Education
District Setting Categorical variable: Denver Metro, Outlying City, Outlying Town, Remote, Urban-Suburban.
Colorado Department of Education

47
Motivation to innovate. The hypothesized motivation to innovate is lower academic
achievement levels, which is operationalized using college matriculation rates and CDE’s school
performance ratings. College matriculation rates measure the proportion of graduates who enroll in
any college in the fall immediately following high school graduation, which relies on CDHE data.
CDE’s performance rating for each school is also included as a measure of student achievement. CDE
provides both numerical ratings and categorical ratings (performance, improvement, priority
improvement and turnaround) in its annual performance review of school districts and schools. The
high school-level performance rating is an index that includes graduation rates, dropout rates, ACT
scores and achievement and growth on the statewide standardized assessment. Both matriculation
rates and school performance ratings are available on a yearly basis. The annual data, when
included in the event history analysis, are lagged one year to avoid problems with causal inference.
If the hypothesis is that lower performance motivates a school to adopt concurrent enrollment, the
data for those indicators need to be from a time prior to the adoption year.
Resources. Fiscal capacity and size are two types of resources important to the analysis of
policy diffusion and innovation that are included in hypotheses 1.2 and 1.3, respectively. Per-pupil
funding at the school level is not available; only district-level data is available. Including the district-
level data masks important funding variance at the high-school level. Instead of including a district-
level variable, two school-level measures are included in an attempt to capture the level of wealth
and resources of individual high school communities. Previous studies have found a positive
correlation between per-pupil spending and the wealth of the local community (e.g. Augenblick,
Myers & Anderson, 1997). Thus, as a measure of a local community’s fiscal capacity, median
household income for the neighborhood immediately surrounding the high school is used in this
study. Neighborhood-level estimates were obtained from the U.S. Census Bureau’s American
Community Survey (ACS) by geocoding each high school’s address and matching it with a census
48
tract number and county code. The ACS 5-year survey data contains the median household income
in the past 12 months (in 2014 Inflation-adjusted dollars) for the five year period running from Jan.
1, 2010 – Dec. 31, 2014. The 5-year survey option was used because it offers neighborhood-level
estimates.
An additional measure included to capture the resources of a school is the proportion of
students eligible for free or reduced price lunch (FRL). Annual data is available from CDE on the
percentage of students qualifying for free or reduced price lunch; the data are lagged one year in
the event history analysis. FRL eligibility rates correspond with funding levels as Colorado’s school
finance formula awards additional per-pupil funds to districts for FRL students. Districts, in turn, use
their own formulas to distribute state funds—as well as federal Title I dollars—to schools most in
need. While the FRL data and the median income indicator are measuring similar information, they
are only moderately negatively correlated. There are instances where one measure may more
accurately account for the fiscal situation of a school than the other. There are wealthy
communities, for example, that have high proportions of FRL students, possibly due to school choice
patterns (e.g. median income in one Denver Metro area school is $108,627 and the percent FRL is
72.4%). In contrast, there are schools that have very low median incomes in the surrounding
neighborhood but also have low FRL counts, most likely due to underreporting by families (e.g.
median income in one remote southwest Colorado school is $39,476 and the percent FRL is 35.3%).
Further, while the FRL indicator captures those schools that may receive additional funding support,
not many high schools are Title I served, meaning districts more often direct the funds ear-marked
for high poverty schools to elementary and middle schools. Schools that are low-income but not
Title I served, or schools that serve middle income families who just fall short of meeting FRL
eligibility will operate differently from schools that serve mostly high-income families.

49
One example of how such differences operationalize in terms of fiscal capacity, is through
parent fundraising. According to an investigative report of parent fundraising at Colorado schools,
fundraising levels vary dramatically by school and are correlated with the wealth of the community
(Schimke, 2016). One school, for example, raised $14,400 through the one-day “Colorado Gives Day”
fundraising campaign in 2016; within the same school district, a school serving a lower-income
population raised only $300 (Schimke, 2016). While that is an extreme example, there are concrete
differences in fundraising capabilities by school dependent upon the wealth of the parent
population, as well as the wealth of the surrounding neighborhood (who are often asked to
contribute to school fundraising campaigns). Even in districts that have school choice, controlling for
the income levels of the neighborhood immediately surrounding the school building is still critical.
Further, funds raised by the school are increasingly used to support instructional and programmatic
needs, as opposed to just supporting extracurricular activities (Schimke, 2016). Consequently, both
median household income and FRL eligibility are included in an attempt to capture the different
fiscal pressures at play at the school level.
The second type of resource important to this study—school size—is measured by counting
the number of students enrolled in the school during the annual October count period, which is the
official method CDE relies on to assess pupil membership. Annual data is available for student count
data, and the data are lagged one year in the event history analysis to avoid causal inference
problems.
External factors. The main external factors to be measured in hypotheses 1.4 and 1.5 are
proximity to schools that have adopted concurrent enrollment and proximity to community
colleges. The first factor is operationalized by calculating for each individual high school how many
other high schools were already offering concurrent enrollment within a five mile radius. The
calculation was done for each school year included in the study so that the values could change as
50
the program spread. The data are lagged one year in the event history analysis to ensure that the
“diffusion of concurrent enrollment” variable is accurately captured as a predictor variable.
The second proximity factor was measured in two ways: 1) by calculating the distance in
miles from the high school to the nearest community college, and 2) by calculating the number of
community colleges within 10 miles of the high school. These measures adequately account for
those high schools that are located in more populous, urban areas with access to multiple colleges.
The author geocoded high school addresses using Texas A&M GeoServices. Once the longitude and
latitude was obtained for each high school, STATA’s geonear command was used to compute
geodetic distances8 between individual high schools and community colleges and among the high
schools themselves. The geocoded data was also used to match high schools with unique census
tract numbers to then link the Colorado administrative dataset with the ACS dataset.
Control variables. Lastly, two additional variables were included in the empirical models to
control for possible confounding factors. These include: 1) an indicator for whether a school was a
charter school or a traditional school, and 2) an indicator for whether the high school offered a
different dual enrollment program prior to 2011. First, an indicator for whether a school is a charter
school is included to control for any potential confounding effects on the variables of interest in the
case that charter schools act differently than traditional district-run schools, particularly in terms of
deciding programmatic offerings. Second, Berry & Berry (2007) suggest that diffusion models likely
need to include variables that capture whether prior policies were in place that could impact the
decision to adopt the policy currently at hand. In this case, there was a dual enrollment program
available to districts in Colorado prior to the Concurrent Enrollment Programs Act passing in 2009.
The program, known as Post Secondary Education Options (PSEO), began phasing out in 2009 and
8 Geodetic distances calculate the length of the shortest curve between two points along the surface of a mathematical model of the earth.

51
was fully phased out by 2011-12. If schools that had PSEO in place wanted to continue to offer
similar opportunities, they had to make the transition to Concurrent Enrollment by 2011-12 (CDHE,
2014). It was not required that they make the transition, however, and PSEO schools could choose
not to offer any dual, or concurrent, enrollment courses once PSEO was phased out (CDHE, 2014).
Although substantially different in nature and mechanism, PSEO participation likely is associated
with concurrent enrollment adoption and so an indicator will be included to control for if a high
school had participated in the PSEO program.
Policy Diffusion Methodology
This section provides an overview of the two methods used to test hypotheses 1.1 through
1.5: event history analysis and ordinary least squares (OLS) fixed effects regression. Event history
analysis was the method used for exploring the diffusion of concurrent enrollment across high
schools in the state, while OLS fixed effects regression was used to explore any factors related to the
intensity of program participation within high schools once concurrent enrollment was adopted.
Event history analysis. Event history analysis was conducted to explore the possible
existence of explanatory relationships in the diffusion of concurrent enrollment programs among
Colorado high schools. According to Wong and Shen (2002), event history analysis “has become
widely accepted as the most effective way to empirically assess the causes of policy innovation in
the states” (168).9 The method allows researchers to identify what factors influence events over
time. In this study, the event was the adoption of concurrent enrollment by high schools (i), and
time was measured in discrete units of school years (t). The study period ran from the beginning of
the 2010-11 school year until the end of the 2014-15 school year. The legislation that created the
concurrent enrollment program passed in the spring 2009. In the 2009-2010 school year a small
9 EHA has also been applied to sub-state entities, see e.g. Hoyman and Weinberg (2006) and Lubell et al.
(2002).

52
number of school piloted the program, and concurrent enrollment was officially operational
statewide in the 2010-11 school year. Thus, the window of this event history analysis captures the
first five years of the implementation of concurrent enrollment in Colorado.
Table 5 displays an overview of the number of high schools in the risk set in each school
year, the number of adoptions each year, and the survivor function. In an event history analysis, the
survivor function expresses the probability that survival time T is equal to or greater than t, where t
represents the actual survival time (Mills, 2011).
S(t) = Pr(T ≥ t)
The output of S(t) in this study is, therefore, simply a proportion of the observations that still had
not adopted concurrent enrollment following school year t.
Table 5: Concurrent Enrollment Adoptions and Survivor Functions, by School Year School Year Number of
Adoptions Cumulative Adoptions
Risk Set Survivor Function
Std. Error
95% Confidence Interval
2010-11 195 195 388 0.50 0.03 [0.45, 0.55]
2011-12 76 272 193 0.30 0.02 [0.26, 0.35]
2012-13 65 337 117 0.13 0.02 [0.10, 0.17]
2013-14 6 343 52 0.12 0.02 [0.09, 0.15]
2014-15 10 353 46 0.09 0.01 [0.07, 0.12]
As Table 5 depicts, the first year saw the largest number of adoptions with fifty percent of
the high schools implementing the program that year. The diffusion of the program continued
rapidly after that, with eighty-seven percent of high schools offering concurrent enrollment by the
third year. As the survivor function indicates, just 9 percent of high schools (n=36) had not adopted
concurrent enrollment by the end of the study period in the 2014-15 school year. The high schools
that did not adopt concurrent enrollment by the end of the study period are considered to be right-
censored. Event history analysis is preferred over other regression models for policy diffusion
studies because it can account for both censored and non-censored observations when producing
53
estimates of the likelihood than an event will occur at a specified point in time (Mills, 2011; Mokher
& McLendon, 2009).
Following Berry and Berry (1990), many public affairs scholars used discrete-time logit or
probit models to perform event history analysis (Allison, 1984; Berry & Berry, 1990; Buckley &
Westerland, 2004; Wong & Shen, 2001). Buckley and Westerland (2004) note that “this approach to
testing diffusion theory with discrete event history analysis is straight-forward, computationally
economical, and easy to execute, but it has several shortcomings” (95). One limitation is that the
discrete-time models assume that the probability of policy adoption in one year is unrelated to the
probability of adoption in previous years, when that may not be the case in actuality (Berry & Berry,
1992; Buckley & Westerland, 2004). The odds, for example, that a high school adopts concurrent
enrollment in the first year of the study are likely different from the odds that a school adopts the
program in the last year of the study when the policy is more popular and eighty-five percent of
other high schools have already adopted it. As a result, scholars have turned to the Cox proportional
hazards model, which allows for the probability of policy adoption to change over time while not
having to specify the functional form (Buckley & Westerland, 2004; Jones & Branton, 2005, Mills,
2011). The semi-parametric nature of the model lends itself to being robust to different data, even if
the author does not know the precise underlying shape of the probability distribution (Mills, 2011).
The Cox method also permits the incorporation of time-dependent variables. For these reasons, this
research design used Cox proportional hazards models to analyze the diffusion of concurrent
enrollment.
The Cox proportional hazards regression model relies on maximum partial likelihood
estimation when computing hazard rates. The hazard rate is the likelihood that the event of interest
will occur in a specified unit of time given that the observation has survived any prior time periods.
The Cox model estimates changes in hazard rates as a function of a set of covariates. While the

54
model does not assume a particular shape of the baseline hazard rate, it does make a strong
assumption that the ratio of hazard between any two observations is proportional across time (Box-
Steffensmeier and Jones 2004; Mills, 2011). If the proportional hazards assumption is violated, the
relative risk may be improperly estimated.
To test the proportional hazards assumption, Schoenfeld residuals were estimated and
plotted to see if there was a pattern in any of the covariates’ residuals that would indicate time-
dependency. The variable for district setting clearly violated the proportional hazards assumption.
As a remedy, the Cox model was stratified on the variable, which essentially sets a separate baseline
hazard function for each value of district setting. Once the stratification was conducted, there were
no further violations of the proportional hazards assumption in individual covariates or for the
model as a whole.
The final Cox model specification can be expressed as: hi (t) = h0(t) exp(xjβ)
where the proportional hazard of high school i adopting concurrent enrollment in school year t is
the result of an unspecified baseline hazard function h0(t) and a vector of the exponent of the
coefficients of parameters (β) for the constant and time-varying covariates (xj) in the model (Mills,
2011). The Efron approximation was used in estimating the Cox model, which more appropriately
handles “tied” data, or when more than one high school adopts concurrent enrollment in the same
time period, than the typically-used Breslow approximation.
Additional model diagnostics that were conducted include the estimation and plotting of
Cox-Snell residuals to assess overall model adequacy and the plotting of martingale residuals to
assess any nonlinearity in the covariates. As a result of analyzing the martingale residuals, two
variables were log-transformed to improve linearity: median income and student count. The results
of the Cox-Snell residual analysis indicated that the full model specification was an adequate fit.

55
Ordinary least squares fixed effects regression. A progression of ordinary least squares
(OLS) regression models were conducted to investigate if any of the covariates included in the event
history analysis model serve as predictors for how deeply a high school implements concurrent
enrollment. The dependent variable in the OLS models is a school-level participation rate created by
dividing the number of students within a high school taking at least one concurrent enrollment
course by the total number of students enrolled at the high school for each academic year within
the study. The first OLS model includes the same variables used in the event history analysis as
predictors. The subsequent models include a series of time and unit fixed effects with and without a
lagged dependent variable.
If the dependent variable and one or more independent variables trend in a direction over
time, including time fixed effects in the regression model is often a necessary precaution
(Wooldridge, 2006). If the dependent variable and one of the key covariates both are trending
upward, for example, the two time series processes may appear to be correlated when they are
actually both trending for reasons related to factors unaccounted for in the model. Employing
dummy variables for each year of the study (excluding the baseline year) controls for spurious trend
relationships. If the time dummy variables end up being statistically significant, and the coefficients
of other variables change in a meaningful way, that is evidence of the need to include time fixed
effects in the regression model (Wooldridge, 2006).
After including time fixed effects, regression models were run with the addition of unit fixed
effects to control for possible omitted variable bias. Fixed effects were included, separately, at the
district and school levels to control for district- or school-specific variation, which could have a
confounding effect on the high school-level model. High schools within districts are likely influenced
by district-level factors such as administrative capacity, the presence of a college preparatory
culture, history of pursing partnerships within the district, or fiscal characteristics. Including district

56
fixed effects results in a within regression analysis where the change in covariates is only analyzed
within each district. This could provide a good amount of control for any unobserved confounding
factors, while also allowing for some across-school variation (within districts that have more than
one high school).
Only including district fixed effects, however, still leaves room for doubt that the model is
accounting for all unobserved variables. School-level characteristics such as leadership, culture,
academic systems (e.g. curriculum and instructional model), and teacher capacity likely also effect
the implementation of concurrent enrollment. One disadvantage of school fixed effects is that they
absorb nearly all of the “action” since there is very little change in the time-varying predictors within
individual schools over the five years of the study (all time invariant predictors are dropped from a
school fixed effects model).
Thus, the author runs both a district- and school-level OLS fixed effects regression model,
which can be formerly expressed as:
Yit= β0 + σTn-1 + Fn-1 + Xitβ + µit
where the dependent variable (Y) is the concurrent enrollment participation rate for each high
school (i) in time period (t) and is a function of time fixed effects (Tn-1), school or district fixed effects
(Fn-1), a vector of the coefficients of parameters (β) for the time-varying covariates (Xit), and the
error term (µit).
Two prominent issues with running OLS regression on time series data are serial correlation
and heteroskedasticity. Serial correlation, or autocorrelation, refers to the correlation of error terms
among observations and is often present in time series data since the same unit is being measured
in repeated time periods (Wooldridge, 2006). If the value of a covariate in one time period is related
to its value in the previous time period, for example, then the error terms are likely to be correlated.
Serial correlation does not bias the estimates but it does result in an underestimation of the

57
standard errors, which in turn inflates the t-statistic and leads to overestimation of statistical
significance. Heteroskedasticity, or a violation of the OLS assumption that error variance is constant,
likewise affects the calculation of standard errors and results in misleading claims of statistical
significance (Wooldridge, 2006). Diagnostics tests were run on the time series data set and found
that both serial correlation and heteroskedasticity were present. To correct for both issues, robust
school-clustered standard errors are used in the regression models.
Another issue with running OLS models on this data set in particular stems from the
functional form of the dependent variable, which is a percentage bound between 0 and 100. Using
OLS simplifies the interpretation of the regression results, and post-estimation analysis found that
only 20 of 1820 (1.10%) of predicted values fall outside of the 0 to 100 range (see Papke, 2005 for a
similar approach). The regression models were also run using fractional logit to ensure that the
results from OLS models are robust and not affected by misspecification error (Papke & Wooldridge,
1996). The fractional logit models substantiated the statistical significance and direction of the OLS
results.
Dynamic panel data model. Even though the OLS models control for year and unit fixed
effects, there remains a need to investigate the effect of the prior year’s participation rate on the
current year. Practical reasoning would lead one to suspect that a high school’s concurrent
enrollment participation rate for one year would be highly predictive of the following year’s
participation rate. Including a lagged dependent variable with fixed effects in the same OLS model,
however, may lead to biased estimates as a result of correlation between the error terms and the
covariates (Allison, 2009; Wooldridge, 2010). Economists refer to models that include lagged
dependent variables as dynamic panel data models, and there are several approaches that can be
used for estimation (Allison, 2009; Williams, Allison & Moral-Benito, 2016; Wooldridge, 2010). This
study employs an approach that uses maximum likelihood estimation and allows for the inclusion of

58
time invariant predictors while still retaining the benefits of fixed effects (Williams, Allison & Moral-
Benito, 2016). Other approaches to modeling dynamic panel data, including traditional fixed effects
methods and generalized method of moments (GMM), exclude time invariant predictors. As
explained above, there is not much within school variation on the time varying predictors, so the
inclusion of additional covariates in the model is beneficial to understanding patterns in concurrent
enrollment participation rates. The dynamic panel data model using maximum likelihood estimation
was run with the dependent variable lagged one year. Full information maximum likelihood (FIML)
was used to treat missing data. About 5 percent of schools are missing data on matriculation rates,
and using FIML allows for those schools to remain in the estimation by using the data that is
available for those schools rather than using list-wise deletion and losing those observations
altogether (Arbuckle, 1996).
Policy Evaluation Variables and Measures
The following section provides details on the dependent, explanatory and control variables
used in the evaluation of concurrent enrollment. Table 6 summarizes the indicators used to
operationalize the variables in the two policy evaluation hypotheses, and Table 7 provides a
summary of variable descriptions.
Table 6. Concept Measurement Summary: Policy Evaluation
Hypotheses Constructs Indicators
H2: High school students who participate in concurrent enrollment programs will have a greater probability of enrolling in higher education.
College access
Concurrent enrollment participation
Immediate enrollment in college following high school graduation
Concurrent enrollment participation (y/n)
Number of concurrent enrollment credit hours
H3: First-year college students who had participated in concurrent enrollment programs in high school will have greater academic success and a higher probability of persisting than college students who did not participate.
Academic success & persistence
Concurrent enrollment participation
Need for remedial education
First-year college grade point average (GPA)
Fall-to-fall college persistence
Concurrent enrollment participation (y/n)
Number of concurrent enrollment credit hours

59
Table 7. Descriptions of Pre-College Independent Variables and College Outcome Variables Variable Description
Concurrent enrollment participation Concurrent enrollment credit hours
Dummy variable (Took any concurrent enrollment course = 1) Categorical variable for number of concurrent enrollment credit hours attempted (0, 1-3, 3-6, 6-12 or 12+)
Student academic characteristics
ACT composite score
English language learner
Special education
Continuous variable (min=12; max=36)
Dummy variable (Students designated as ELL=1)
Dummy variable (Students designated as SPED = 1)
Student and family background
White
African American
Hispanic
Asian
Other race
Gender
Free or reduced-price lunch (FRL)
Dummy variable (white = 1)
Dummy variable (African American = 1)
Dummy variable (Hispanic = 1)
Dummy variable (Asian = 1)
Dummy variable (other race = 1)
Dummy variable (male = 1)
Dummy variable (FRL-eligible students = 1)
School environment
Rural/urban school district
Dummy variable (Rural = 1)
College outcomes
College enrollment
Remedial education need
First-year college grade point
average (GPA)
College Persistence
Dummy variable (Enrolled in college anywhere in the fall
immediately following high school graduation = 1)
Dummy variable (Needed remedial education in at least one
math, reading or writing course = 1)
Cumulative grade point average in the spring semester of a
student’s first-year in college
Dummy variable (If enrolled in year one and enrolled in year two
of college anywhere = 1)
Dependent variables. The dependent variable in Hypothesis 2 is college enrollment, which
was measured by considering those students who enrolled in college in the fall immediately
following high school graduation. Students who enrolled in college anywhere—at an in-state, out-of-
state, public or private institution—are captured. This is a dichotomous variable; students who
enrolled in college were coded as a 1.
There are several dependent variables that are operationalized from Hypothesis 3. First,
students’ need for remedial education in college is included as a measure of academic performance.
The measure includes both students assessed as needing remediation and those enrolled in
remedial courses who did not have an assessment score on file. This is a dichotomous variable;

60
students who need remedial education in college are coded as a 1. While college-level concurrent
enrollment courses require students to be college-ready in the course’s subject area (as determined
by an appropriate assessment), students could need remedial education in a different content area.
For example, a student may take a concurrent enrollment, college-level literature course, but that
student may require remediation in math. Further, some students only take career and technical
education (CTE) concurrent enrollment courses that do not have the same academic prerequisites as
core subject areas. Thus, remedial education is considered to be a worthwhile measure of academic
preparation and success to include in the model.
Second, students’ postsecondary academic success is assessed by considering the
cumulative grade point average after the spring semester of the first year in college. Course-level
data is only available through the state’s administrative data collection, and thus only students who
enrolled in a public college in Colorado are captured in the calculation of remedial rates and grade
point averages (CDHE, 2016). While this is a limitation of the dataset, approximately 75 percent of
high school graduates who enrolled in college did so at an in-state, public institution and are
captured in the state’s data system.
The third dependent variable that is measured in the second hypothesis is college
persistence, which is measured using a dummy variable indicating whether a student who enrolled
in year one of college returned to enroll in year two of college (returned to any institution—not just
the original institution). Because enrollment data is available through both the state administrative
system and the National Student Clearinghouse, the data for this variable includes all students who
enrolled in college anywhere, not just those who enrolled in Colorado.
Concurrent enrollment participation. The key explanatory variable for both hypotheses is
participation in concurrent enrollment. This study employed two measures of participation: 1) a
dichotomous measure of participation, in which students who graduated high school having taken at

61
least one concurrent enrollment course were coded as a 1; and 2) a categorical measure based on
the attempted number of concurrent enrollment credit hours. There are five categories for the
credit hours measure: no credit hours, 1-3 credit hours, 3-6 credit hours, 6-12 credit hours and more
than 12 credit hours. Zero credit hours is set as the baseline category in the analysis. The remaining
four categories were selected after viewing the descriptive statistics and seeing natural breaks
between each category that equate roughly to quartiles.
Demographic pre-college independent variables. The empirical analysis included
demographic and geographic control variables that, based on prior research, are thought to
influence concurrent enrollment participation, college-going behavior and postsecondary outcomes.
These measures include gender, high school free and reduced-price lunch (FRL) status, special
education (SPED), English Language Learner (ELL) status, race/ethnicity, and ACT scores. The data for
FRL, SPED, and ELL students are reported by high schools to the Colorado Department of Education
and indicate whether a high school graduate received free or reduced-price lunch, was identified as
special education, or was identified as ELL, respectively. Race/ethnicity is self-reported by students
to schools and was measured here using dummy variables for African American students, Hispanic
students, white students (the baseline group), Asian students and an “other race” category that
includes American Indian/Alaskan Native or Hawaiian/Pacific Islander students.10 Gender, FRL, SPED,
ELL and race/ethnicity fields are required components of the datasets schools submit to the
Colorado Department of Education and there are no missing data. Lastly, a dummy variable for rural
schools was included (when school-level effects were not utilized) to capture school-level
differences attributable to geographic setting.
10 The categories of race/ethnicities used in this study are representative of the largest groupings of students and were necessary to accurately run the propensity score matching (PSM) analysis. Including separate, smaller sub-groups of students in the analysis did not change the end results but substantially reduced the likelihood of achieving non-biased matches during the PSM analysis.

62
Academic pre-college independent variable. The composite ACT score was used as a proxy
control for academic achievement. ACT scores were an important variable to include because
performance on the college entrance examination is highly correlated with college attendance.
Further, ACT scores are strongly correlated with assessment scores from the statewide
accountability tests administered in 9th and 10th grades, indicating the scores are a good control for
overall academic aptitude.11 ACT subject scores (reading, writing, math and science) also were
collected, but in the effort to achieve a more parsimonious model, composite scores were used.12
During the period of this study, Colorado required all high school juniors to take the ACT
since (ACT, Inc., 2009). The test was provided free to students, and one day of the academic year for
juniors was devoted to taking the ACT. Nonetheless, some students opted-out of taking the
assessment. In addition, when the data from the ACT were matched with postsecondary data from
the CDHE, some records were not matched successfully. As a result, across the three high school
graduating cohorts, 15.0 percent had missing ACT scores. Multiple imputation was initially used as a
treatment for the missing data, and the results did not alter significantly from those that are
presented later in the chapter. Thus, list-wise deletion was ultimately used to eliminate the
observations with missing ACT data for ease of interpretation. This method does have disadvantages
because the population of students with missing data differed from the general population. Those
with missing data were less likely to attend college (24.6%) than the students with ACT scores
(63.2%), and they were less likely to participate in concurrent enrollment (6.8% compared to 15.4%).
11 The statewide assessments administered in 9th and 10th grades had slightly fewer missing values than the ACT assessment and could be used an alternative measure for academic aptitude. However, students taking concurrent enrollment are most likely to do so in the 11th and 12th grade of high school, and with the ACT being administered in the 11th grade and being designed to assess college readiness, it is a timelier source of performance data and, arguably, a more reliable and valid control variable for the hypotheses being tested here than the statewide grade-level assessments. However, regression models were estimated using the 9th and 10th grade data, which confirmed the statistical significance and direction of the resulted presented here. 12 Models that were run with subject scores did not vary from the models run with the composite score.
63
However, nearly one third (32.7%) of students with missing ACT scores were attending an
Alternative Education Campus (AEC). On average throughout the study, only 2.3 percent of students
were enrolled at an AEC. It is common for AECs to have missing data given that they serve a highly
mobile and transient population of at-risk students. AECs typically also have very low college
matriculation rates (16.4% compared to 57.7% at traditional high schools in 2014). It is likely that the
AEC school status (and what that represents) is a bigger predictor of college outcomes than the ACT
scores would be if the data were not missing. As explained later, school fixed effects are used in the
final model of the regression analysis to control for such unobserved bias. Further, as stated above,
the results from regressions that were estimated following multiple imputation for the missing ACT
scores confirmed the findings presented below.
Policy Evaluation Methodology
Multivariate, fixed effects regression and propensity score matching (PSM) were used to
determine relationships between concurrent enrollment participation (the dichotomous measure)
and the key dependent variables. The average treatment effect was calculated for both methods,
which allows for comparisons of the techniques and provides a triangulation of the findings to
assess how college outcomes for students who participate in concurrent enrollment are affected as
compared to non-participating students. When considering how interactions between race/ethnicity
and concurrent enrollment participation affect college outcomes, the author conducted the analysis
solely with fixed effects regression given the significant complications posed by including interaction
terms in PSM (Garrido et al., 2014; Imbens, 2000). The same methodological complications arise
when using categorical predictor variables in PSM; thus, fixed effects regression was used when
analyzing the effect of the number of concurrent enrollment credits on college outcomes.
Overview. Randomized controlled trials are the ideal method because both observed and
unobserved factors are accounted for through the process of randomly assigning individuals to the

64
treatment group (Schneider, Carnoy, Kilpatrick, Schmidt & Shavelson, 2007; Singleton & Straits,
2010). In nonrandomized designs, selection bias—when the participants in the treatment group
differ systematically from those who did not participate in the treatment—is a threat to internal
validity (Singleton & Straits, 2010). In education research, as in the social sciences generally, it is
often difficult to adhere to experimental designs due to practical, situational, or ethical
considerations (Titus, 2007; Winship & Morgan, 1999). As a result, researchers have developed and
refined analytical techniques that attempt to create quasi-experimental conditions that control for
selection bias (Heckman, 1979; Rubin, 1974, 1997; Schneider et al., 2007; Winship & Morgan, 1999).
Both multivariate regression and PSM are techniques that fill that role. Multivariate regression
allows the author to control for confounding or intervening variables that affect the relationship
between the treatment and the outcomes (Singleton & Straits, 2010).
PSM, developed by Rosenbaum and Rubin (1985), has a different focus and controls for
those observed variables that affect whether an individual participates in the treatment or not. The
theory behind PSM asserts that, if assignment to the treatment is driven solely by observable
factors, then after the matching is conducted analysis of the treatment effect can proceed as if
assignment was random (Rosenbaum & Rubin, 1985; Winship & Morgan, 1999). PSM begins by
generating propensity scores based on observable variables that predict the likelihood that an
individual will receive the treatment. Those scores are used to match individuals who received the
treatment with similar individuals who did not receive the treatment. Through the matching process
a control group is essentially created, which then allows the author to mimic experimental
conditions, establish a counterfactual, and estimate the treatment effect (Guo & Fraser, 2010;
Rosenbaum & Rubin, 1985; Rubin, 1997; Winship & Morgan, 1999).
PSM has become popular amongst applied researchers dealing with observational data
(Caliendo & Kopeinig, 2008; Dehejia & Wahba, 2002, 1999; Heckman, Ichimura & Todd, 1997). As
65
the number of studies using PSM has increased, the debate around whether PSM is any better of a
method than standard regression analysis persists (Brand & Halaby, 2006; Shadish & Steiner, 2010;
Shadish, Clark & Steiner, 2008; Shah, Laupacis, Hux & Austin, 2005; Smith & Todd, 2005). Both PSM
and multivariate regression analysis condition only on observable variables and several studies have
found that regression estimates tend to be similar to PSM estimates (Cook, Shadish, &Wong, 2008;
Shadish & Steiner, 2010; Shah, Laupacis, Hux & Austin, 2005). Nonetheless, there are some
advantages to PSM. First, PSM estimations avoid bias caused by a misspecification of the functional
form, which occurs frequently in regression analysis. As Brand & Halaby (2006) explain, “although
matching assumes selection on observables, it does not assume linear selection as does covariate
adjustment through regression” (757).
Second, there are several balancing tests that can be performed using PSM that provide
information regarding the validity of causal inferences from the data set. A data set with covariates
that are balanced between the treatment and control groups is not enough to fully eradicate
selection bias concerns if there are unobservable confounders present; but, having a dataset with
balanced observable covariates and areas of common support is a minimum requirement for making
causal inferences (Shadish & Steiner, 2010). Regression analysis does not typically limit estimates to
areas of common support, or to parameters of variables where both treatment and control
observations exist (Brand & Halaby, 2006).
Third, there are diagnostic tests allowing the author to assess the sensitivity of the
treatment effects to unobservable bias. These tests do not conclusively determine the level of
unobserved bias, but provide ways for the research to lend credence to findings in the case of
theorized selection bias (Caliendo & Kopeinig, 2008).
Propensity score matching. The pre-college exogenous variables described in Table 2 were
used to generate propensity scores, after which the results were evaluated to ensure there was an
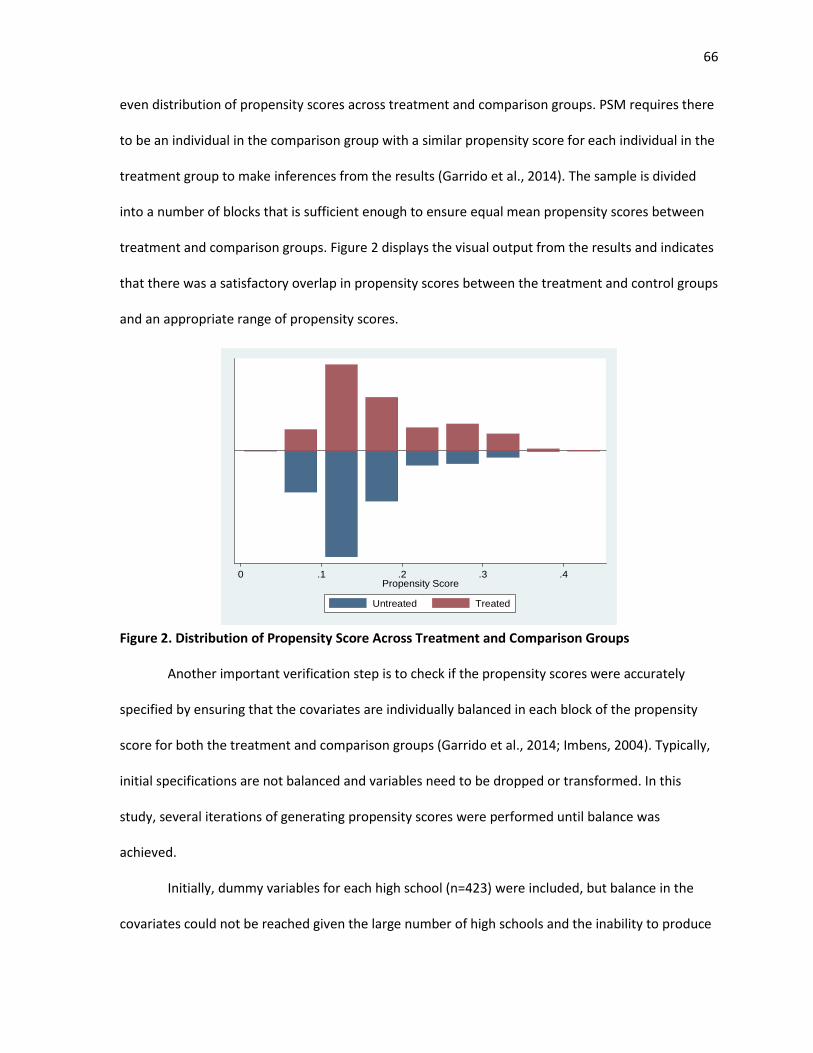
66
even distribution of propensity scores across treatment and comparison groups. PSM requires there
to be an individual in the comparison group with a similar propensity score for each individual in the
treatment group to make inferences from the results (Garrido et al., 2014). The sample is divided
into a number of blocks that is sufficient enough to ensure equal mean propensity scores between
treatment and comparison groups. Figure 2 displays the visual output from the results and indicates
that there was a satisfactory overlap in propensity scores between the treatment and control groups
and an appropriate range of propensity scores.
Figure 2. Distribution of Propensity Score Across Treatment and Comparison Groups
Another important verification step is to check if the propensity scores were accurately
specified by ensuring that the covariates are individually balanced in each block of the propensity
score for both the treatment and comparison groups (Garrido et al., 2014; Imbens, 2004). Typically,
initial specifications are not balanced and variables need to be dropped or transformed. In this
study, several iterations of generating propensity scores were performed until balance was
achieved.
Initially, dummy variables for each high school (n=423) were included, but balance in the
covariates could not be reached given the large number of high schools and the inability to produce
0 .1 .2 .3 .4Propensity Score
Untreated Treated

67
matched samples on each covariate within each high school. In the final specification, school fixed
effects were not included, but an indicator for rural or urban high schools was included to control
for some school-level effects. The race/ethnicity categories were redefined from seven categories to
four categories (Hispanic, white, African American, other race). Additionally, the variable for ACT
scores was converted from a continuous variable to a categorical variable.13 After making those
changes, balance in the covariates was satisfactorily achieved across the blocks using t-tests. Some
level of imbalance is expected and acceptable (Austin, 2009), but to further ensure balance had
been achieved standardized differences were computed for the covariates across the blocks. The
PSM literature has set forth an acceptable amount of imbalance as being maximum standardized
differences of 10 to 25 percent (Garrido et al., 2014). The results of this study achieved standardized
differences no larger than 2.5 percent. Thus, it was concluded that sufficient balance was achieved.
Treated individuals were matched with comparison individuals who had the most similar
propensity score within a certain range of scores, referred to as a caliper. Keeping the matches
within a range, or caliper, prevents poor matches from occurring. Here, a caliper of 0.2 of the
standard deviation of the logit of the propensity score was used based on prior research that has
found that range to produce optimal results (Austin 2011; Rosebaum & Rubin, 1985). One-to-one
matching produces the least biased estimates since the first match is always the strongest match,
especially given the restriction of the caliper which prevents poor matches. One-to-many matching,
on the other hand, increases bias (from poorer matches) but decreases the variance of the
estimates by including more counterfactual information for each treated subject (Caliendo &
Kopienig, 2008). This study used both one-to-one matching and one-to-four matching, in which each
13 ACT scores were divided into the following categories: Low ACT score = 5 to 16; Medium-Low ACT score = 17 to 20; Medium-High ACT score = 21 to 24; High ACT score = 25-36. The analysis was also run using a continuous variable for ACT scores and the average treatment effect sizes did not vary, but there was more bias present during the initial stages of the PSM process due to the inability to find precise matches with the continuous variable.

68
treatment unit is matched to four control units. Other matching techniques such as kernel, radius
and stratification matching were tested, but the one-to-one and one-to-four caliper matching with
replacement produced the best balance in covariates across the treatment and control samples, as
measured by standardized differences.
Regression analysis. Regression models were estimated, separately, for both concurrent
enrollment independent variables (dichotomous and credit hours) on the four college outcome
dependent variables. Initially, bivariate models with the dependent variable and the key
independent variable were run. Then demographic control variables (gender, FRL status,
race/ethnicity) were added, followed by the addition of the controls for academic achievement (ACT
composite score, ELL, SPED). The final models included all of the previous controls and added fixed
effects for high school and graduation year; this was considered the preferred model specification
for both main research questions. Adding fixed effects helps alleviate concerns about omitted
variables. In particular, school-specific features—such as the availability of college guidance
counselors, the presence of a college preparatory culture, school leadership and school location (e.g.
rural, urban, suburban)—vary and could have a confounding effect on the model. Additionally,
adding in time fixed effects for each year of the study (minus the baseline year) controls for any
spurious trend relationships occurring over the three-year time period of the study.
When investigating the effects of concurrent enrollment participation on minority and low-
income students, interaction terms were added to the fixed effects regression models by crossing
each race/ethnicity variable and the FRL variable with concurrent enrollment participation (yes/no).
The author used logistic regression for the dichotomous dependent variables (college enrollment,
remedial education need, and persistence) and OLS regression for the single continuous dependent
variable (first-year GPA). Another way to investigate differential effects by disaggregated groups of
students is to divide the sample by student group and run separate regression models. Using a
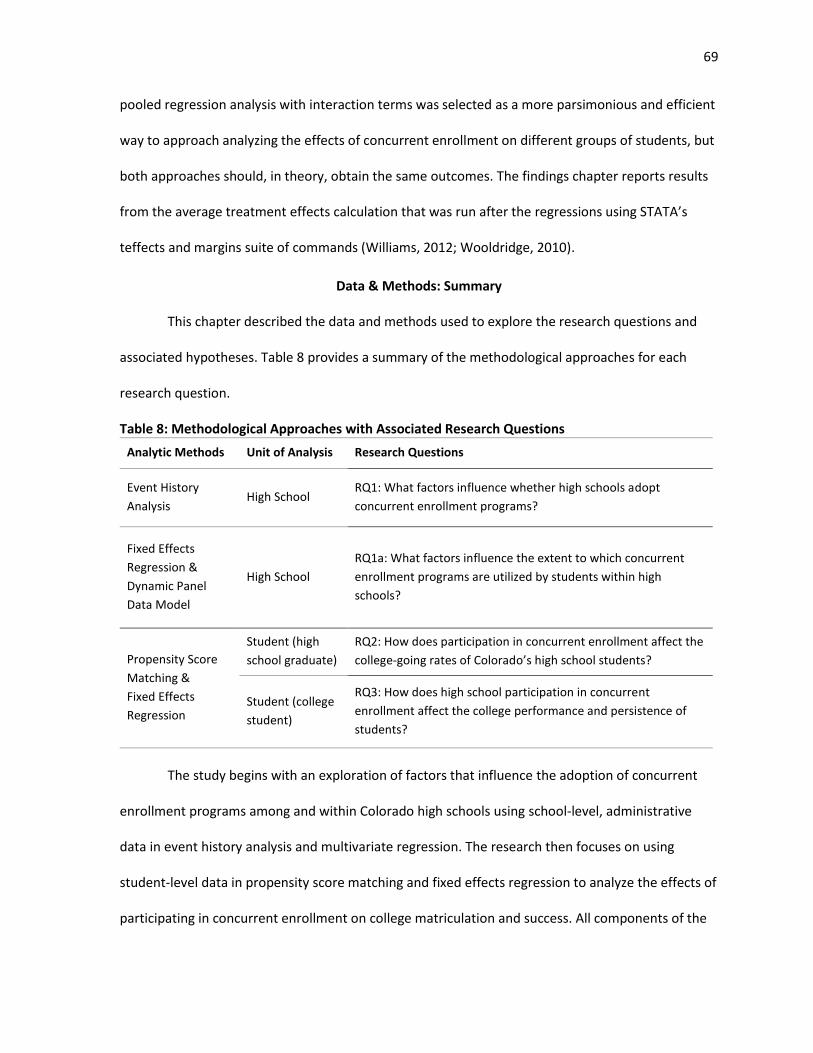
69
pooled regression analysis with interaction terms was selected as a more parsimonious and efficient
way to approach analyzing the effects of concurrent enrollment on different groups of students, but
both approaches should, in theory, obtain the same outcomes. The findings chapter reports results
from the average treatment effects calculation that was run after the regressions using STATA’s
teffects and margins suite of commands (Williams, 2012; Wooldridge, 2010).
Data & Methods: Summary
This chapter described the data and methods used to explore the research questions and
associated hypotheses. Table 8 provides a summary of the methodological approaches for each
research question.
Table 8: Methodological Approaches with Associated Research Questions
Analytic Methods Unit of Analysis Research Questions
Event History
Analysis High School
RQ1: What factors influence whether high schools adopt
concurrent enrollment programs?
Fixed Effects
Regression &
Dynamic Panel
Data Model
High School
RQ1a: What factors influence the extent to which concurrent
enrollment programs are utilized by students within high
schools?
Propensity Score
Matching &
Fixed Effects
Regression
Student (high
school graduate)
RQ2: How does participation in concurrent enrollment affect the
college-going rates of Colorado’s high school students?
Student (college
student)
RQ3: How does high school participation in concurrent
enrollment affect the college performance and persistence of
students?
The study begins with an exploration of factors that influence the adoption of concurrent
enrollment programs among and within Colorado high schools using school-level, administrative
data in event history analysis and multivariate regression. The research then focuses on using
student-level data in propensity score matching and fixed effects regression to analyze the effects of
participating in concurrent enrollment on college matriculation and success. All components of the

70
study rely on data from Colorado’s statewide longitudinal data system, but the research questions
are explored using different units of analysis and methods. This research design allows for a
comprehensive investigation of the effects of Colorado’s concurrent enrollment policy.
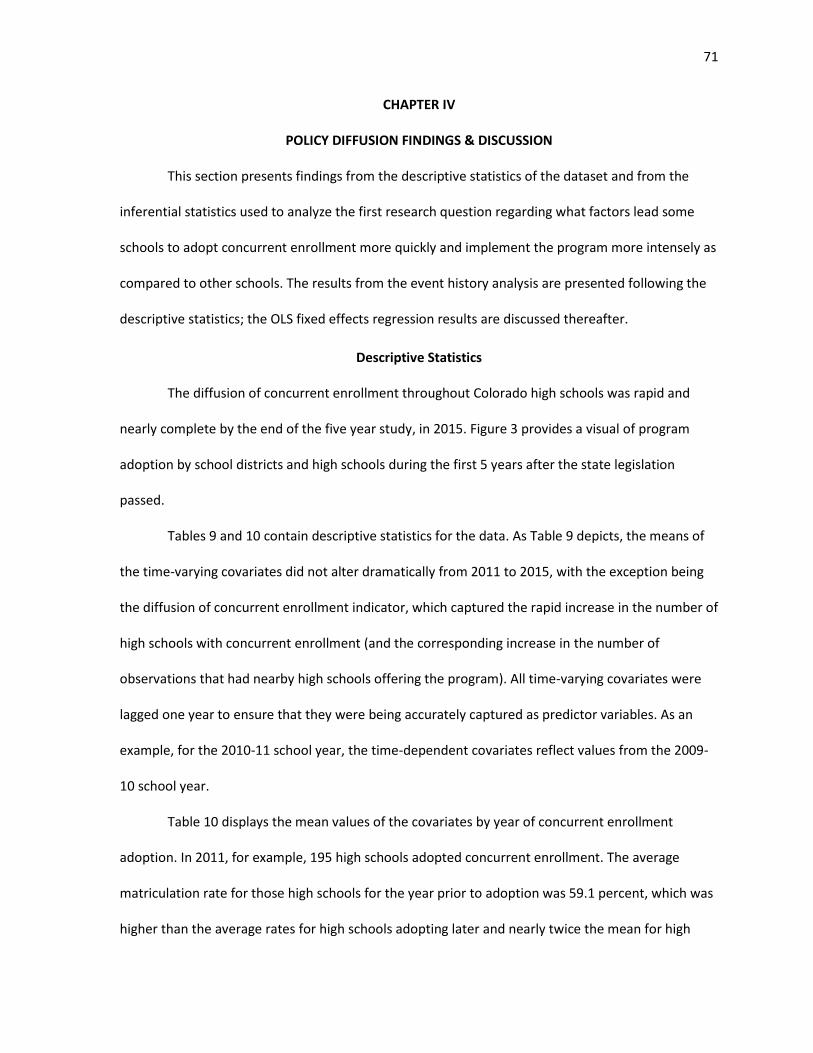
71
CHAPTER IV
POLICY DIFFUSION FINDINGS & DISCUSSION
This section presents findings from the descriptive statistics of the dataset and from the
inferential statistics used to analyze the first research question regarding what factors lead some
schools to adopt concurrent enrollment more quickly and implement the program more intensely as
compared to other schools. The results from the event history analysis are presented following the
descriptive statistics; the OLS fixed effects regression results are discussed thereafter.
Descriptive Statistics
The diffusion of concurrent enrollment throughout Colorado high schools was rapid and
nearly complete by the end of the five year study, in 2015. Figure 3 provides a visual of program
adoption by school districts and high schools during the first 5 years after the state legislation
passed.
Tables 9 and 10 contain descriptive statistics for the data. As Table 9 depicts, the means of
the time-varying covariates did not alter dramatically from 2011 to 2015, with the exception being
the diffusion of concurrent enrollment indicator, which captured the rapid increase in the number of
high schools with concurrent enrollment (and the corresponding increase in the number of
observations that had nearby high schools offering the program). All time-varying covariates were
lagged one year to ensure that they were being accurately captured as predictor variables. As an
example, for the 2010-11 school year, the time-dependent covariates reflect values from the 2009-
10 school year.
Table 10 displays the mean values of the covariates by year of concurrent enrollment
adoption. In 2011, for example, 195 high schools adopted concurrent enrollment. The average
matriculation rate for those high schools for the year prior to adoption was 59.1 percent, which was
higher than the average rates for high schools adopting later and nearly twice the mean for high
72
schools that did not adopt concurrent enrollment during the study period (31.1%). The mean
distance to the nearest community college was higher for schools adopting earlier (2011-2013) than
for schools adopting later, or not adopting at all.
School districts
2010-11 (Year 1 of study) High Schools 2014-15 (Year 5 of study)
Figure 3. Adoption of Concurrent Enrollment Programs from the 2010-11 School Year to the 2014-15 School Year, by School Districts and High Schools. The upper two maps indicate that school districts have at least one high school offering concurrent enrollment if the district boundary is shaded. In the bottom two maps, each dot represents an individual high school that offers concurrent enrollment.
The variable for charter schools also reveals differences between cohorts. Of the 195
schools adopting concurrent enrollment in 2011, only 4 percent were charter schools even though
charters comprise about 13 percent of all high schools in the study. Charter schools are
overrepresented, though, in the later adoption years of 2014 and 2015. Additionally, of those high
schools that did not adopt concurrent enrollment, 43 percent were charter schools. Another point
of interest is the variable for prior participation in dual enrollment (PSEO), which indicates that 63

73
percent of the first cohort of adopters had previously had the PSEO program in place; the mean of
that variable declines as the study progresses. Only 8 percent of the 37 schools that did not adopt
concurrent enrollment had PSEO. Lastly, Denver metro area and rural schools (outlying city, outlying
town and remote schools) tended to adopt concurrent enrollment on the earlier side of the study
period, whereas urban-suburban schools adopted in the later years. Of the non-adopters, about half
are located in the Denver metro area.
Table 9: Descriptive Statistics for All High Schools, Beginning and End of Study
Time-Varying Covariates M (SD)
2011 Min
Max
M (SD)
2015 Min
Max
College matriculation rate (%) 53.33 (21.93)
0 100 53.07 (20.01)
3.8 92.3
School performance rating 63.50 (17.32)
25 100 68.74 (13.71)
27.6 100
Student count (logged) 5.76 (1.30)
1.39 8.16 5.76 (1.32)
1.61 8.16
Diffusion of concurrent enrollment (# of CE High Schools within 5 miles)
0.15 (.611)
0 5 4.56 (5.98)
0 26
Free/reduced-price lunch students (%) 37.68 (23.08)
0 100 42.64 (23.12)
0 100
2011 - 2015
Fixed Covariates M (SD) Min Max
Median household income (logged) 10.89 (.37)
9.68 11.81
Community college distance 11.72 (13.00)
0 67.11
Concentration of community colleges 1.91 (1.35)
1 6
Charter school 0.13 (.33)
0 1
PSEO participation 0.52 (.50)
0 1
District Setting Denver Metro Area 0.34
(.47) 0 1
Outlying City or Town 0.22 (.42)
0 1
Remote 0.23 (.42)
0 1
Urban-Suburban 0.21 (.40)
0 1
N 388
Standard Deviations (SD) in Parentheses

74
Table 10: Comparison of Variable Means, by High School Adoption Year If adoption year was: 2011
2012
2013
2014
2015
Did Not Adopt
Time-Varying Covariates Lagged M* M**
College matriculation rate (%) 59.06 53.15 52.89 54.50 33.53 31.14
School performance rating 65.36 65.95 70.76 77.68 56.43 62.01
Student count (logged) 5.96 5.95 5.72 5.60 5.13 4.67
Diffusion of concurrent enrollment (CE) (# of CE High Schools within 5 miles)
0.22 1.66 1.80 5.83 4.3 2.33
Free/reduced-price lunch students (%) 38.06 36.55 38.71 37.47 45.15 45.06
Fixed Covariates Fixed M (2011-2015) M**
Median household income (logged) 10.90 10.88 10.88 10.84 10.94 10.86
Community college distance 11.65 13.06 12.18 9.24 7.56 9.95
Concentration of community colleges 1.97 1.68 1.77 1.83 1.90 2.33
Charter school 0.04 0.08 0.22 0.33 0.40 0.43
PSEO participation 0.63 0.57 0.43 0.17 0.20 0.08
District Setting
Denver Metro Area 0.40 0.35 0.12 0.00 0.20 0.51
Outlying City 0.26 0.24 0.09 0.17 0.40 0.19
Remote 0.24 0.21 0.31 0.17 0.00 0.16
Urban-Suburban 0.10 0.21 0.48 0.67 0.40 0.14
N 195 76 65 6 10 36
*Means for time-varying covariates for high schools adopting concurrent enrollment in 2011 through 2015 are lagged one year to reflect values for the year prior to adoption **Means for time-varying covariates for high schools that did not adopt are an average of values from 2011-2015
Figure 4 depicts the mean percentage of high school students participating in concurrent
enrollment over time, by adoption year cohorts. In the first year the concurrent enrollment program
was fully operational (2010-2011), 195 high schools adopted concurrent enrollment, and, on
average, about 12 percent of the students in those high schools participated in the program. By
2015, for those same 195 high schools, the mean participation rate increased to 18.2 percent. In
2012, 76 high schools adopted concurrent enrollment, and in those schools about 8.1 percent of
students, on average, took at least one concurrent enrollment course. Participation rates were
similar at the 65 high schools that adopted the program in 2013. Both the 2012 and 2013 cohorts of
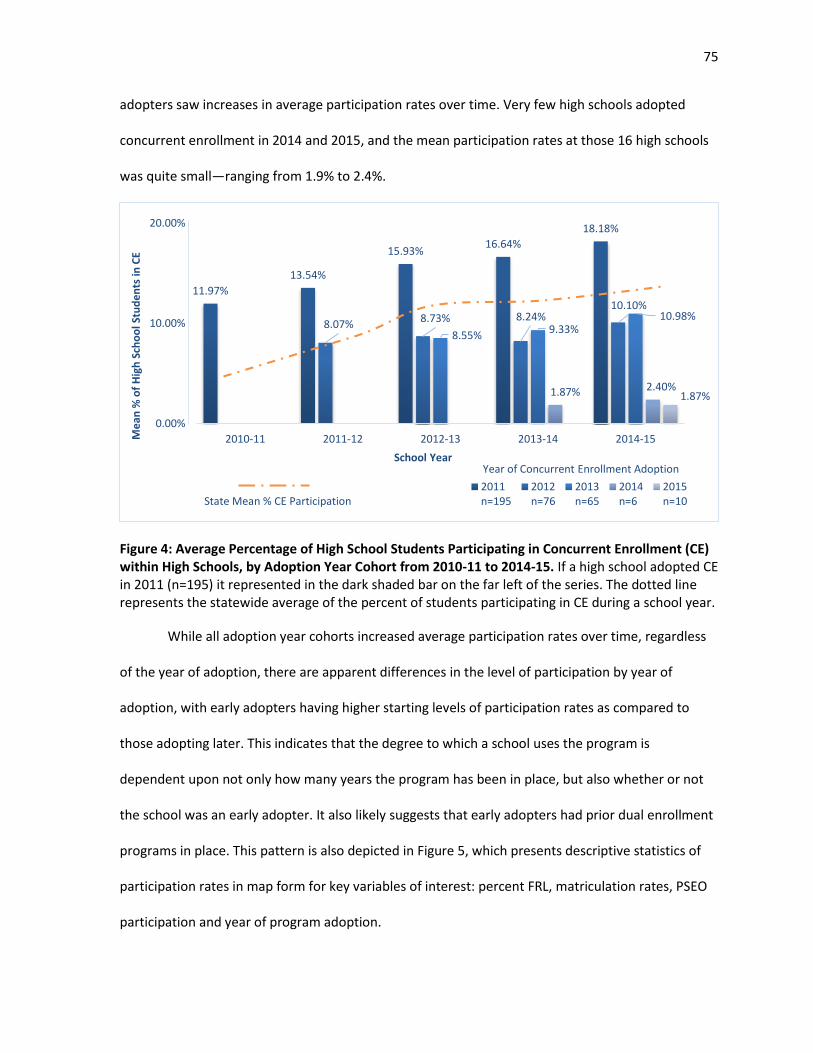
75
adopters saw increases in average participation rates over time. Very few high schools adopted
concurrent enrollment in 2014 and 2015, and the mean participation rates at those 16 high schools
was quite small—ranging from 1.9% to 2.4%.
Figure 4: Average Percentage of High School Students Participating in Concurrent Enrollment (CE) within High Schools, by Adoption Year Cohort from 2010-11 to 2014-15. If a high school adopted CE in 2011 (n=195) it represented in the dark shaded bar on the far left of the series. The dotted line represents the statewide average of the percent of students participating in CE during a school year.
While all adoption year cohorts increased average participation rates over time, regardless
of the year of adoption, there are apparent differences in the level of participation by year of
adoption, with early adopters having higher starting levels of participation rates as compared to
those adopting later. This indicates that the degree to which a school uses the program is
dependent upon not only how many years the program has been in place, but also whether or not
the school was an early adopter. It also likely suggests that early adopters had prior dual enrollment
programs in place. This pattern is also depicted in Figure 5, which presents descriptive statistics of
participation rates in map form for key variables of interest: percent FRL, matriculation rates, PSEO
participation and year of program adoption.
11.97%
13.54%
15.93%16.64%
18.18%
8.07%8.73% 8.24%
10.10%
8.55%9.33%
10.98%
1.87% 2.40%1.87%
0.00%
10.00%
20.00%
2010-11 2011-12 2012-13 2013-14 2014-15Me
an %
of
Hig
h S
cho
ol S
tud
en
ts in
CE
School Year
2011n=195
2012n=76
2013n=65
2014n=6
2015n=10
Year of Concurrent Enrollment Adoption
State Mean % CE Participation

76
Figure 5. Maps of Colorado high schools and Concurrent Enrollment (CE) participation rates by covariates of interest. Each circle represent a high school; the size of the circle reflects the percent of students participating in CE in 2014-15 school year. Shading in the top left map indicates % of students who were FRL eligible in the 2013-14 school year, with darker shading indicating higher FRL rates. The top right map reflects matriculation rates with high rates designated by darker shading; bottom left map displays schools that did not offer PSEO (dark blue) in contrast to those that did offer the prior dual enrollment program (light blue); bottom right map depicts the year of program adoption with darker circles representing high schools who adopted earlier in study.
77
In the Figure 5 maps, each dot represents a high school, with larger circles representing
higher participation rates. The maps generally reveal there is variation across the state on these
indicators. Some schools, for example, have high concurrent enrollment participation rates and high
percentages of FRL students, while other schools with high participation rates have low FRL
percentages. Interestingly, the PSEO map reveals several instances of high schools that have high
participation rates that did not previously have PSEO in place (i.e., large, dark shaded circles). The
year of adoption map appears to be dominated by darker shaded circles representative of early
adopters that have higher participation rates, which was the pattern seen in Figure 4.
Event History Analysis
The findings of the multivariate event history analysis are presented in Table 11. The Cox
proportional hazards model results are displayed as exponentiated coefficients, referred to as
hazard ratios. A ratio that is greater than 1 indicates the high school is more likely to adopt
concurrent enrollment as the values of the covariate increase. Hazard ratios that are less than 1
indicate that a high school is less likely to adopt concurrent enrollment at higher values of the
covariate. A ratio of 1 is interpreted as there being no association between the covariate and the
hazard of adopting concurrent enrollment. Each hypothesis is tested separately with the control
variables included, and then the full model is specified. The results are largely robust across the
models. Three of the five hypotheses contain statistically significant findings and both of the control
variables are statistically significant.
Looking at the Hypothesis 1.1, the coefficient for matriculation rates is statistically
significant at p<0.01, but the direction is the opposite of what was hypothesized. For every 1
percentage increase in matriculation rates, the likelihood of adopting concurrent enrollment
increases by an estimated 1.5 percent. It was hypothesized, based on the literature, that schools
with lower college-going rates might be quicker to adopt the program given its link to improving

78
matriculation and the school’s need to improve outcomes. While the direction is not what was
hypothesized, it is also not surprising; it would be easy to justify having written the hypothesis in the
opposite direction given that high schools with already-established cultures of college readiness
would also be more likely to take advantage of the concurrent enrollment program.
Table 11: Cox Proportional Hazards Model Results
*** p<0.01, ** p<0.05, * p<0.1 Robust standard errors in parentheses Coefficients are expressed as hazard ratios All models are stratified by District Setting (Remote, Outlying City, Urban-Suburban, Denver Metro Area)
The second hypothesis concerning fiscal capacity has mixed findings. High schools with
higher percentages of free and reduced price lunch-eligible students have higher hazard ratios. This
statistically significant coefficient indicates that for every 1 percentage point increase in the
Relevant -Full Model-
Hypotheses Variable Model 1 Model 2 Model 3 Model 4 Model 5
Hypothesis 1.1 Matriculation Rates (%) 1.015*** 1.015***
(0.00308) (0.003)
School Performance 0.992* 0.998
Rating (%) (0.00424) (0.005)
Hypothesis 1.2 Median Household 1.125 1.035
Income (logged) (0.168) (0.159)
FRL eligibility (%) 1.003 1.012***
(0.00264) (0.003)
Hypothesis 1.3 Student Count 1.316*** 1.224***
(logged) (0.0679) (0.082)
Hypothesis 1.4 Diffusion of 0.967 0.976
Concurrent Enrollment (0.026) (0.027)
Hypothesis 1.5 Community college 0.994 0.998
distance (0.005) (0.006)
Community college 1.064 1.015
concentration (0.059) (0.056)
Controls Charter school 0.437*** 0.393*** 0.447*** 0.435*** 0.469***
(0.0905) (0.0820) (0.0916) (0.088) (0.111)
PSEO participation 1.571*** 1.860*** 1.667*** 1.833*** 1.494***
(0.171) (0.206) (0.183) (0.200) (0.164)
Observations 727 782 789 790 722
Likelihood ratio 79.15 75.48 111.6 79.51 108.1
df 4 4 3 5 10 Prob>chi2 0.0319 0.0276 0.0368 0.0265 0.0395
79
percentage of FRL-eligible students, the likelihood of adopting concurrent enrollment increases by
an estimated 1.2 percent.14 The coefficient on median household income is not significantly
different from 1.
Hypothesis 1.3 is statistically significant and in the predicted direction. Larger schools have a
higher chance of adopting concurrent enrollment more quickly than smaller schools. Hypotheses 1.4
and 1.5 were both rejected with nonsignificant results on the diffusion of concurrent enrollment
measure and the proximity to community colleges measures. The model indicated no association
between having more neighbors offering concurrent enrollment and time to adoption. One reason
for this finding may be how quickly the program diffused throughout the state that the impact of
“peer pressure” was not captured in this model. The findings do also reinforce other studies that did
not find statistically significant effects of regional diffusion (Mokher & McLendon, 2009). The
coefficients for distance to the nearest community college and number of nearby community
colleges were also nonsignificant. This is not a surprising finding given the descriptive statistics,
which reveal that high schools that were first to adopt concurrent enrollment were as likely to be
located in rural areas where community colleges are few and far between as in urban areas where
community colleges are more prolific.
Lastly, as expected, both control variables were statistically significant. The chance of
adopting concurrent enrollment was about 1.5 times greater for those high schools that previously
offered the PSEO program compared to those schools that did not have PSEO in place. Charter
schools were half as likely to take up the concurrent enrollment program as compared to traditional
schools as indicated in the results and in Figure 5. The hazard function in Figure 5 provides a visual
display of the large magnitude of the effect of charter schools on the likelihood of adopting
concurrent enrollment. As a means of comparison, the hazard function for matriculation rates is also
14 Percent changes were calculated using the formula (eb – 1)*100.

80
displayed. While the coefficient was highly significant for the matriculation rates indicator, the effect
size was not as large as that of the charter school variable, which is seen in Figure 5. Both graphs
also indicate a relative proportionality in the hazard functions, supporting the Cox proportional
hazards assumption.
Figure 6. Cox Proportional Hazards Regression Smoothed Hazard Functions for Charter Schools and College Matriculation Rates. Non-charter schools (dotted line, left) and high schools with high college matriculation rates (75th percentile - dotted line, right) had a higher likelihood of adopting concurrent enrollment as compared to charter schools (solid line, left) and high schools with low matriculation rates (25th percentile – solid line, right), respectively.
OLS Fixed Effects Regression Analysis
The findings of the OLS regression analysis are presented in Table 12 and Figure 6. The first
model consists of the same variables that were included in the event history analysis (EHA) Cox
proportional hazards regression model. While the Cox regression was stratified by district setting,
the OLS regression version includes district setting categories as dummy variables, with Denver
Metro Area serving as the baseline, or reference, group. The second model builds off of the first and
also includes time fixed effects by adding dummy variables for school year, with the 2010-11 school
year serving as the baseline group. The third model expands on Model 2 by including district fixed
effects. The district fixed effects are absorbed due to the large number of districts (n=178);
consequently, coefficients are not displayed.
.2.3
.4.5
.6
2011 2012 2013 2014 2015School Year
Charter School Non-Charter.3
.4.5
.6.7
2011 2012 2013 2014 2015School Year
Matriculation High Matriculation Low
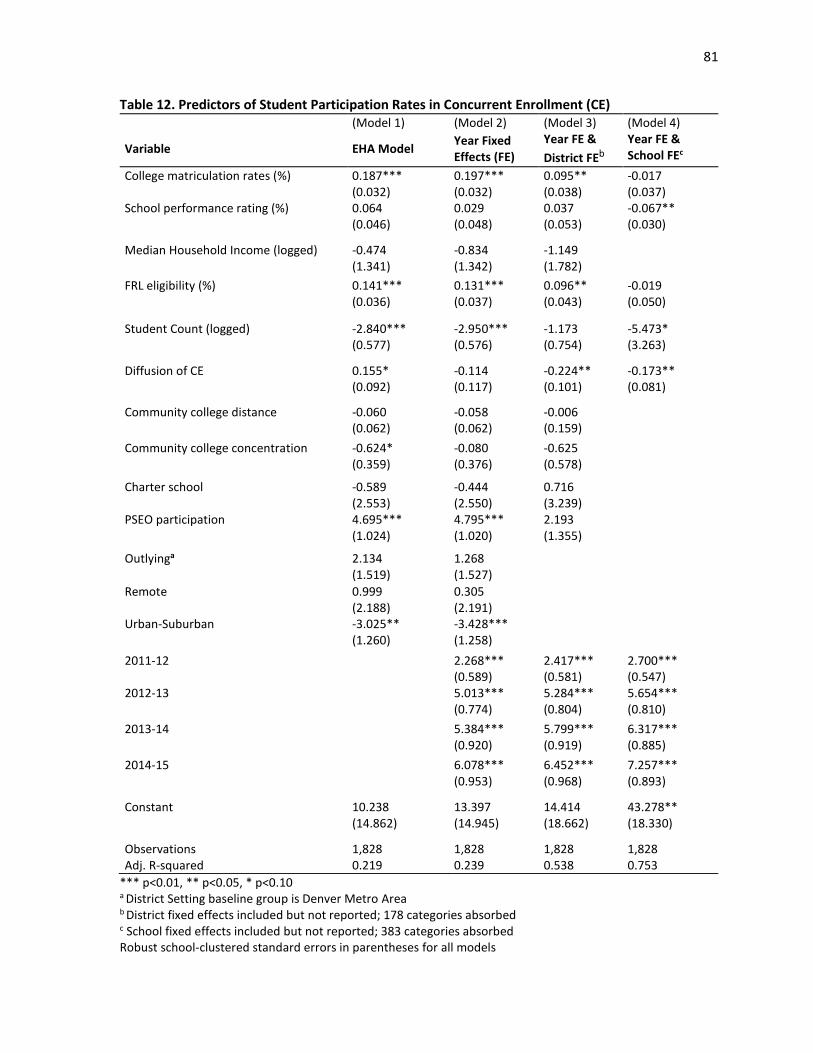
81
Table 12. Predictors of Student Participation Rates in Concurrent Enrollment (CE) (Model 1) (Model 2) (Model 3) (Model 4)
Variable EHA Model Year Fixed Effects (FE)
Year FE &
District FEb
Year FE & School FEc
College matriculation rates (%) 0.187*** 0.197*** 0.095** -0.017 (0.032) (0.032) (0.038) (0.037)
School performance rating (%) 0.064 0.029 0.037 -0.067** (0.046) (0.048) (0.053) (0.030)
Median Household Income (logged) -0.474 -0.834 -1.149
(1.341) (1.342) (1.782)
FRL eligibility (%) 0.141*** 0.131*** 0.096** -0.019 (0.036) (0.037) (0.043) (0.050)
Student Count (logged) -2.840*** -2.950*** -1.173 -5.473* (0.577) (0.576) (0.754) (3.263)
Diffusion of CE 0.155* -0.114 -0.224** -0.173** (0.092) (0.117) (0.101) (0.081)
Community college distance -0.060 -0.058 -0.006 (0.062) (0.062) (0.159)
Community college concentration -0.624* -0.080 -0.625 (0.359) (0.376) (0.578)
Charter school -0.589 -0.444 0.716 (2.553) (2.550) (3.239) PSEO participation 4.695*** 4.795*** 2.193 (1.024) (1.020) (1.355)
Outlyinga 2.134 1.268 (1.519) (1.527)
Remote 0.999 0.305 (2.188) (2.191) Urban-Suburban -3.025** -3.428*** (1.260) (1.258)
2011-12 2.268*** 2.417*** 2.700*** (0.589) (0.581) (0.547) 2012-13 5.013*** 5.284*** 5.654*** (0.774) (0.804) (0.810)
2013-14 5.384*** 5.799*** 6.317*** (0.920) (0.919) (0.885)
2014-15 6.078*** 6.452*** 7.257*** (0.953) (0.968) (0.893)
Constant 10.238 13.397 14.414 43.278** (14.862) (14.945) (18.662) (18.330)
Observations 1,828 1,828 1,828 1,828 Adj. R-squared 0.219 0.239 0.538 0.753
*** p<0.01, ** p<0.05, * p<0.10 a District Setting baseline group is Denver Metro Area b District fixed effects included but not reported; 178 categories absorbed c School fixed effects included but not reported; 383 categories absorbed Robust school-clustered standard errors in parentheses for all models

82
The fourth, and final, model includes school, rather than district, fixed effects, which are
also absorbed (n=383). Including school fixed effects omits several indicators that do not vary over
time (i.e., during the study) within high schools, including median household income, community
college distance, community college concentration, charter school and PSEO participation. School
fixed effects are important to include, however, since the treatment is at the school-level and
characteristics specific to schools such as leadership, culture, academic system, and teacher capacity
likely affect the implementation of concurrent enrollment.
None of the covariates remain statistically significant throughout all models. College
matriculation rates and FRL eligibility are statistically significant in Models 1 through 3 but are not
statistically significant at p<0.1 when school-level fixed effects are added (Model 4), as a result of
the fixed effects controlling for unobserved variables and absorbing across-school and across-time
variation. Regarding the college matriculation variable, while it is lagged one year, there is still a
threat of endogeneity, if an increase in concurrent enrollment participation rates leads to an
increase in matriculation rates.
The variable for the size of the high school is statistically significant at p<0.10 in Model 4.
The coefficient indicates that a 10 percent increase in the count of students in a high school leads to
a 0.52 percent decrease in the participation rate, meaning that smaller high schools are more likely
to have a larger share of their students participating in concurrent enrollment, although the effect
size in this model is substantively small. To put it in more relative terms, an increase of 60 students
at the average high school (going from the mean of 592 students to 652 students) is associated with
approximately 3 fewer students participating in concurrent enrollment (decreasing from about 72
students participating to 69).
The charter school and PSEO covariates are not statistically significant in Model 3, which
includes district fixed effects; however, Model 4 is the preferred specification and both variables are

83
omitted in that model because there is no variance within a school on those indicators. Therefore, it
is unclear from these fixed effects models what the effect of being a charter school or having had
PSEO in place prior to 2009 is on participation rates. The diffusion of concurrent enrollment
measure, which captures the number of neighboring high schools offering the program, is
statistically significant in both the district and school fixed effects models (Model 3 and Model 4).
The coefficient from Model 4 can be interpreted as an increase of 1 additional neighboring high
school offering concurrent enrollment reduces the share of students participating by 0.17 percent.
While the result is not in the predicted direction, the effect size is very small in substantive terms.
In the first two models, before district and school fixed effects were added, a variable for
district setting was included. The coefficient for urban-suburban high schools was statistically
significant at p<0.1, indicating those schools were associated with a 3.4 percentage point lower
participation rate when compared to Denver metro area high schools. The descriptive statistics
showed urban-suburban high schools were slower to adopt concurrent enrollment, and it appears
that those schools also experience a lower overall participation rate once they do adopt concurrent
enrollment. Lastly, the year fixed effects also reflect what was described in the descriptive statistics;
average school-wide participation rates in concurrent enrollment have increased over time. The
2014-15 school year is associated with a 7.3 percentage point increase in the mean participation
rate as compared to the 2010-11 school year.
Dynamic Panel Data Model
Table 13 displays the results from the dynamic panel data model, which includes a lagged
value of the dependent variable and school and year fixed effects, and uses the maximum likelihood
estimator to produce estimates. The model was estimated with the dependent variable lagged one
year, which removes one year (2011) from the dataset. The coefficient for the lagged effect

84
indicates that a high school will see a 0.75 percent increase in this year’s participation rate for every
1 percent increase in last year’s participation rate.
Table 13. Dynamic Panel Data Model using Maximum Likelihood for Concurrent Enrollment (CE) Participation Rates in High Schools
Variable Model 1
CE Participation Rate t-1 0.750*** (0.054)
Matriculation Rates (%) -0.026 (0.037)
School Performance Rating (%) 0.047 (1.171)
Median Household Income (logged) 4.633** (2.334)
FRL eligibility (%) -0.018 (0.035)
Student Count (logged) -7.060*** (1.528)
Diffusion of CE 0.052 (0.153)
Community college distance -0.324*** (0.099)
Community college concentration 0.346 (0.674)
Charter school -6.224*** (1.895)
PSEO participation 5.162*** (1.352)
Observations 388 Likelihood ratio 105.11 df 65 Prob>chi2 0.0012
*** p<0.01, ** p<0.05, * p<0.10 Robust school-clustered standard errors in parentheses
As the results for the other variables in Table 13 show, even with the large effect size of the
lagged dependent variable, other predictor variables remained statistically significant, including
student count, which was statistically significant in the school fixed effects model. In the dynamic
panel data model, however, the student count coefficient is much higher than in the fixed effects
model; here, a one percent increase in student count is associated with a 7.1 percent decrease in
concurrent enrollment participation rates, all else held constant. Other differences between the

85
dynamic panel data model and the district fixed effects model are the non-significance of the school
performance rating and the diffusion of concurrent enrollment variables.
An important advantage of the dynamic panel data model is that it allows for the effects of
time invariant indicators to be observed. The following variables were omitted from the school fixed
effects model and are statistically significant (p<0.01) in the dynamic panel data model: median
household income, distance to the nearest community college, charter school, and PSEO. A one
percent increase in median household income is associated with approximately a 4.6 percent
increase in participation rates within a high school, accounting for the prior year’s participation rate
and holding all else constant. Adding an additional mile to the distance from the nearest community
college results in a small decrease of 0.32 percent in the participation rate, while being a charter
school is associated with a large decrease of 6.2 percent in the share of students in concurrent
enrollment as compared to non-charter schools. High schools that participated in PSEO before
concurrent enrollment see a 5.2 percent increase in participation rates as compared to those
schools that did not have PSEO, all else equal.
Taken altogether, the results provide moderate support for Hypotheses 1.1 through 1.3, and
less support for Hypotheses 1.4 and 1.5 (see Table 14). The following section provides further
discussion of the results and draws conclusions.
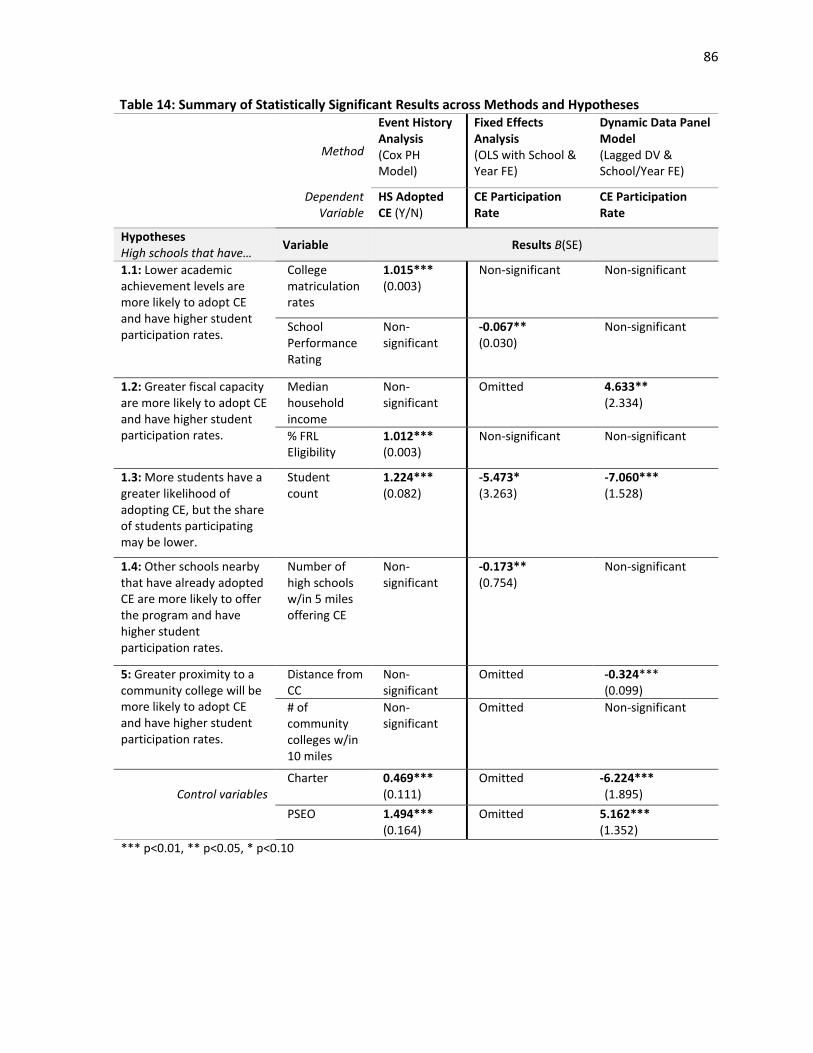
86
Table 14: Summary of Statistically Significant Results across Methods and Hypotheses
Method
Event History Analysis (Cox PH Model)
Fixed Effects Analysis (OLS with School & Year FE)
Dynamic Data Panel Model (Lagged DV & School/Year FE)
Dependent
Variable HS Adopted CE (Y/N)
CE Participation Rate
CE Participation Rate
Hypotheses High schools that have…
Variable Results B(SE)
1.1: Lower academic achievement levels are more likely to adopt CE and have higher student participation rates.
College matriculation rates
1.015*** (0.003)
Non-significant
Non-significant
School Performance Rating
Non-significant
-0.067** (0.030)
Non-significant
1.2: Greater fiscal capacity are more likely to adopt CE and have higher student participation rates.
Median household income
Non-significant
Omitted 4.633** (2.334)
% FRL Eligibility
1.012*** (0.003)
Non-significant Non-significant
1.3: More students have a greater likelihood of adopting CE, but the share of students participating may be lower.
Student count
1.224*** (0.082)
-5.473* (3.263)
-7.060*** (1.528)
1.4: Other schools nearby that have already adopted CE are more likely to offer the program and have higher student participation rates.
Number of high schools w/in 5 miles offering CE
Non-significant
-0.173** (0.754)
Non-significant
5: Greater proximity to a community college will be more likely to adopt CE and have higher student participation rates.
Distance from CC
Non-significant
Omitted -0.324*** (0.099)
# of community colleges w/in 10 miles
Non-significant
Omitted Non-significant
Control variables
Charter
0.469*** (0.111)
Omitted -6.224*** (1.895)
PSEO 1.494*** (0.164)
Omitted 5.162*** (1.352)
*** p<0.01, ** p<0.05, * p<0.10

87
Conclusion & Discussion
This study sought to understand influences on the adoption and utilization of concurrent
enrollment among Colorado high schools using a panel data set spanning the first five years
following the enactment of the Concurrent Enrollment Programs Act of 2009. This pursuit was
particularly compelling given that recent research has shown a positive association between
concurrent enrollment participation and college outcomes, and given that Colorado’s program was
nearly fully diffused within five years. The goal was to use event history and regression analysis to
see if there were any best practices that could be gleaned from the Colorado case study and applied
to other states trying to scale up similar programs. There were several important findings that
resulted from this research, although questions remain.
Academic achievement levels
The first hypothesis posited that schools with lower academic achievement levels would be
more motivated to adopt concurrent enrollment, which is seen as a strategy for boosting
achievement and postsecondary readiness. The variable for school performance rating, which
encompasses information on student academic achievement and growth, is nonsignificant across
models with the exception of the school fixed effects model, in which the effect size is very small.
The college matriculation rate variable is nonsignificant in the participation rate models but is
statistically significant in the event history analysis model. The direction of the coefficient is not
what was hypothesized, but, as noted previously, the finding is not surprising—high schools with
already-established cultures of college readiness are likely to take advantage of an additional college
access program. Given the eventual, widespread diffusion of the program, it is evident that even
high schools with historically low college-going rates have implemented concurrent enrollment as
well.

88
Further, as Table 14 summarizes, schools with higher percentages of FRL students were also
more likely to adopt concurrent enrollment. While that variable is technically included as part of the
school resources hypothesis, there is a well-known inverse relationship between income status and
college-going rates. Thus, the two findings are seemingly contradictory at first glance. Upon
reflecting on the results further, though, it is understandable that both findings occurred
simultaneously. It seems natural that there would be a higher propensity for the adoption of college
preparatory programs in schools where a majority of students matriculate to college. Such schools
already have a college-going culture established, and likely have parents who push for the inclusion
of opportunities that would advance their child’s education. On the other hand, Colorado’s
Concurrent Enrollment Programs Act was specifically passed to expand access to those students
who typically had not been included—that is, low-income and minority students. Given the rapid
diffusion of the program, and the positive, statistically significant coefficient on the FRL variable, one
could conclude that high schools have taken up the opportunity to expand access to new groups of
students as the law intended. Future research could seek to further untangle these effects, and also
explore to what degree those schools that had initially low college-going rates and high FRL rates are
seeing positive gains in their postsecondary outcomes as a result of offering concurrent enrollment.
Fiscal Capacity
From the results for Hypothesis 1.2, there is some evidence that fiscal capacity relates to
concurrent enrollment participation. The EHA results show that schools with higher proportions of
low-income students were quicker to adopt concurrent enrollment, but the median household
income was not statistically significant. When considering effects on participation rates, the
opposite case is seen. The FRL variable is not statistically significant, but the median household
income variable is statistically significant and substantively large in the lagged dependent variable
model. The results of that model suggest that high schools in wealthier communities have higher

89
levels of participation in concurrent enrollment. These somewhat conflicting results mirror the
previous discussion. While schools that have lower-income populations were quick to adopt the
program, perhaps motivated by the intent of the program to expand access, it appears that those
schools with more advantaged populations (likely with strong college going cultures and higher
numbers of eligible students) have higher shares of students actually participating in courses.
Size of High School
School size was a statistically significant variable in both the event history and the regression
analyses. Larger high schools were quicker to adopt concurrent enrollment, leading one to conclude
that organizational resources matter in the initial adoption of a program, as hypothesized. The
hypothesis regarding school size also posited that the number of a students in a school may be
inversely related to the share of students participating in concurrent enrollment. The results
confirmed that supposition, with the regression models indicating that smaller high schools were
more likely to have high proportions of students participating in concurrent enrollment than large
high schools. That is not to say there are not examples of large high schools that have high
percentages of students in concurrent enrollment, but rather, on average and holding all else
constant, it is more likely for smaller schools to more intensely use the program. As discussed
earlier, this can be due to the fact that when a small high school offers a concurrent enrollment
course, for example a math class for seniors, that class comprises a large percentage of its overall
enrollment, whereas offering one class at a large high school will only consist of a small share of the
overall student body.
There is also the consideration that for smaller schools, many located in remote areas,
concurrent enrollment provides access to content the school is not able to deliver on its own. A high
school, for instance, can go through a community college and use its instructors to offer college-
level chemistry, whereas without concurrent enrollment that school would not be able to offer the
90
course at all. Lastly, in smaller schools with fewer administrative resources, once a program has
begun in the school it may be the case that the program is more highly utilized because there are
fewer competing opportunities. In large high schools, it is often the case that students have the
choice of various college readiness and credit accrual programs; for example, in more resourced
schools students often have the choice of concurrent enrollment or advanced placement. In smaller
schools, it may be the case that only one college readiness program is offered, and thus a higher
share of the school’s students are concentrated in that one program.
Type of School: Charters vs. District-run Schools
Charter schools have slower rates of adopting concurrent enrollment and lower overall
participation rates. After investigating further the results of the charter control variable, several
explanations surfaced as to why charters were half as likely to adopt concurrent enrollment. Under
the Concurrent Enrollment Programs Act, charter schools are considered to be Local Education
Agencies (LEAs) and, as such, are treated the same as school districts (also referred to as LEAs). The
legislation permits charter schools that are authorized by their local school district to either enter
into their own memorandum of understanding (MOU) with community colleges, or to be a part of
their authorizer’s MOU (i.e. the district’s MOU). According to the Colorado Department of
Education’s former concurrent enrollment administrator, there could be instances where the district
chooses to exclude charters from their MOU (M. Camacho Liu, personal communication, October 8,
2016). Setting up an MOU with a college requires negotiating financial arrangements, course
offerings, teacher and faculty assignments, and other logistical details. Charter schools, many of
which have lower administrative capacity, may conclude that the process is too cumbersome and
forego participating in concurrent enrollment.
Another disadvantage of not being included in the district’s MOU is that in some cases
districts handle the financial transactions on behalf of its schools. One large urban school district, for
91
example, covers the tuition payments to colleges for students (at district-runs schools) who are
attending concurrent enrollment courses on the college campus. Sending students to a college
campus for courses is typically a cost that would have to be absorbed by the high school. Offering
courses at the high school using the school’s own teachers can be less costly or cost-free, but
charter schools may have limited instructional staff with the necessary academic credentials to
teach concurrent enrollment courses. Thus, if the district is picking up the off-campus tuition tab, it
is a significant benefit, and it appears that the benefit may not be extended to charter schools.
Lastly, an explanation for the results could also be that charter schools, on average, prefer
to pursue other college readiness programs that are often perceived to be more elite or rigorous
(e.g. Advanced Placement or International Baccalaureate). Some charter schools may prefer to
partner with more selective, four-year institutions instead of community colleges, and while that is
permissible under concurrent enrollment, it is more costly to do so.
Prior Dual Enrollment (PSEO) Offerings
The statistically significant effect of the control variable for a prior dual enrollment program
– PSEO – may indicate that some high schools are more disposed to pursuing postsecondary
readiness programs. In many cases, there were likely relationships that had been established with
community colleges through the PSEO program that made implementing concurrent enrollment an
easy transition. Besides any partnership advantages PSEO high schools had, though, there could also
be an established college-going culture in place at those high schools that supports the
implementation of new college preparation programs when they become available. In the diffusion
literature, Berry and Berry (2007) refer to that as a softening of the environment—when one
innovation takes place, it makes it easier for subsequent innovations to occur. Prior research on the
importance of establishing college-going cultures in high schools would also support the claim that
states putting resources into promoting college access programs may see an increasing return on

92
that investment (Hoffman, Vargas & Santos, 2008a; Roderick, Nagaoka, Coca & Moeller, 2008). That
is, once one program is in place it may open the door to continuous improvement and increase the
dedication to ensuring that all students have access to high-quality college preparation curriculum
and supports, which should be at the forefront of secondary school reform.
93
CHAPTER V
POLICY EVALUATION FINDINGS
The findings from the inferential statistics used to analyze the final two research questions
are divided into three sections. The first section investigates the effects of concurrent enrollment
participation on individual outcomes related to college access and success by focusing on the
dichotomous measure of participation. The results from the propensity score matching (PSM) are
presented first, followed by the fixed effects regression results. A comparison of the results from the
different methods is provided.
The second section take the analysis further by considering the effects of concurrent
enrollment participation on the outcomes of low-income and minority students, specifically.
Interaction terms are added to the regression analysis to explore relationships between
race/ethnicity, income and concurrent enrollment participation.
The third section presents the findings from the analysis conducted using the categorical
credit hours variable. Including different levels of concurrent enrollment credit hours in the
regression models allows for the identification of any “dosage effects,” a term that is often used in
research to understand the differential impacts of treatment intensity.
Descriptive Statistics
Table 15 provides descriptive statistics for the overall sample, for those students who
participated in concurrent enrollment and for those who did not participate. Overall, 15.40 percent
of high school students graduating in 2011, 2012 or 2013 participated in concurrent enrollment.
Concurrent enrollment students have a higher mean college matriculation rate, college GPA and
college persistence rate than students who did not participate. They also have a lower average
remedial education rate than non-participating students.

94
Table 15: Descriptive Statistics for Overall Sample and by Concurrent Enrollment (CE) Participation
Treatment Variables Overall Sample M(SD) Min Max
CE Students M(SD)
Non-CE students M(SD)
CE participation (Y/N) 0.15 (0.36)
0
1 1
0
CE attempted hours 1.46 (4.80)
0 79.5 9.45 (8.61)
0
Outcome Variables
College matriculation 0.57 (0.50)
0 1 0.73 (0.44)
0.56 (0.49)
Remedial education 0.35 (0.47)
0 1 0.28 (0.45)
0.36 (0.48)
First-year GPA 2.75 (0.86)
0 4 2.81 (0.83)
2.74 (0.87)
College persistence 0.81 (0.39)
0 1 0.83 (0.38)
0.81 (0.39)
Additional Covariates
FRL 0.26 (.44)
0 1 0.27 (0.44)
0.26 (0.44)
ELL 0.05 (0.22)
0 1 0.03 (0.17)
0.06 (0.23)
SPED 0.07 (0.25)
0 1 0.03 (0.17)
0.07 (0.26)
ACT Composite Score 20.64 (5.25)
12 36 21.30 (4.65)
20.52 (5.34)
White 0.65 (0.48)
0 1 0.66 (0.47)
0.65 (0.48)
Hispanic 0.26 (0.44)
0 1 0.25 (0.43)
0.26 (0.44)
Black 0.05 (0.22)
0 1 0.05 (0.21)
0.05 (0.22)
Asian 0.02 (0.15)
0 1 0.02 (0.14)
0.02 (0.15)
Other Race 0.01 (0.11)
0 1 0.01 (0.09)
0.01 (0.11)
Female 0.50 (.50)
0 1 0.55 (0.50)
0.49 (0.50)
Rural 0.19 (0.39)
0 1 0.30 (.46)
0.17 (0.38)
N 2011 Graduation Year N 2012 Graduation Year N 2013 Graduation Year
N Total
43,716 43,688 44,488 131,892
3,957 7,101 9,255 20,313
39,759 36,587 35,233 111,579
The percentage of students eligible for free or reduced-price lunch (FRL), a proxy for income,
remains nearly the same across the displayed groups. Similarly, the racial/ethnic composition of
students who took concurrent enrollment closely mirrors the composition of the population as a

95
whole. Rural students are overrepresented in the concurrent enrollment population (30%) in
comparison to the population mean (19%), while English language learners (ELL) and special
education (SPED) students are underrepresented amongst concurrent enrollment participants.
Figure 7 provides an additional display of descriptive statistics, breaking out concurrent
enrollment participation rates for each graduation year by gender and race/ethnicity. Participation
rates have been higher for female students than male students during each year of the study.
Hispanic students had higher participation rates than white students in 2011 and 2012 and were one
percentage point below them in 2013. All groups have seen increased participation rates each year
of the study.
Figure 7. Participation in Concurrent Enrollment, by Graduation Year, Gender and Race/Ethnicity
Effects of Concurrent Enrollment Participation on College Outcomes
This section presents findings from the research conducted using the dichotomous measure
of concurrent enrollment participation in estimating effects on the four college outcomes. The
results from the propensity score matching (PSM) are presented first, followed by the fixed effects
regression results. Lastly, a comparison of the results from the different methods is provided.
Propensity Score Matching Findings
As described in the methods section, PSM involves multiple steps that must be taken before
treatment effects can be estimated. An important first step is the matching process wherein
propensity scores are generated based on a set of covariates, and concurrent enrollment students
(the treatment group) are matched with students who have similar propensity scores but did not
0.0%
5.0%
10.0%
15.0%
20.0%
25.0%
Female Male African-American
Hispanic Other Race White
2011
2012
2013

96
participate in concurrent enrollment (the control group). Thus, the first set of findings from the PSM
analysis considers how well the matching process performed in terms of leveling biases that were
present in the unmatched sample.
Matching results. Overall, the sample mean bias was reduced from 9.3 to 0.0 through the
PSM process, which, practically speaking, means that certain groups of students were over- or
under-represented in the unmatched treatment group, but after the matching process occurred, the
treatment and control groups are equally balanced. Figure 8 presents the standardized bias for each
individual covariate, which is a measure of the difference in means between treated and matched
control groups before and after the matching occurs.15 The graphic displays the significant reduction
of bias amongst all covariates in the matched and comparison groups. More specifically, what Figure
8 coveys is that in the unmatched sample ELL, male, and SPED students and those with very low ACT
scores (<16) are underrepresented (the dots are to the left of the vertical line that indicates there is
no difference in sample means between groups). On the other hand, rural students, students eligible
for free and reduced-price lunch (FRL), and Hispanic students were all overrepresented for their
populations in the concurrent enrollment treatment group prior to matching (the dots are to the
right of the zero bias line).
Prior research indicates that being of low-income status, of minority status, or from a rural
school is negatively associated with college enrollment (Fry, 2011; Kahlenberg, 2004; Terenzini,
Cabrera, & Bernal, 2001). If selection biases—in this case assuming students who opt-in to
concurrent enrollment were the type of students who would be more likely to go to college—are
present in this study, these descriptive statistics mean there is at least some evidence that the bias
of how students are selecting enrollment into concurrent programs is not a clear case of the most
15 More technically, the standardized bias is calculated as a percentage of the square root of the average of sample variances in both groups (see, e.g., Caliendo & Kopeinig, 2008).

97
academically proficient students opting-in. One plausible explanation could be that while low-
income, Hispanic and rural students are less likely to attend college, of those who do plan to attend
they will be more inclined to select into concurrent enrollment programs because they are able to
earn college credits for free. Another explanation is that concurrent enrollment is sufficiently
different from programs such as Advanced Placement in that it targets students who are of more
modest academic standing and come from diverse backgrounds. Therefore, the selection bias
problems you would see in a study of high achieving students from higher-income backgrounds
participating in voluntary college readiness programs may not apply—at least as fully—in this case
because the original treatment population appears to be more representative of students who are
typically less likely to attend college. Regardless, as Figure 8 depicts, these imbalances in the original
sample are eradicated the matched sample.
Figure 8. Standardized bias differences (%) across all covariates in original and matched samples
Treatment effects. Once the matching process was performed, the author estimated
average treatment effects (ATE) for each outcome model. The ATE is the difference between the
average outcomes of those who participated in concurrent enrollment and those who did not
-20 0 20 40Standardized % bias across covariates
ACT Low Score
SPED Status
Male
ELL Status
OtherRace
Black
White
Hispanic
ACT High Score
FRL Status
ACT Medium-Low Score
ACT Medium-High Score
Rural
Unmatched
Matched

98
participate. Table 16 displays ATEs from the PSM analysis – both 1:1 matching and 1:4 matching –
for the four college outcome models. The results from the two matching models are very similar.
Table 16. Propensity Score Matching Average Treatment Effects Outcome Matched 1:1
caliper with replacement
Matched 1:4 caliper with replacement
College Enrollment 10.16*** (.004)
10.27*** (.003)
Remedial Education -7.54*** (.004)
-7.57*** (.004)
First-year college GPA
.08*** (.009)
.08*** (.009)
Persistence 2.17*** (.003)
2.15%*** (.003)
Robust standard errors in parentheses *** p<0.01, ** p<0.05, * p<0.10
The PSM results using 1:1 matching suggest that taking concurrent enrollment courses
increases the probability of college matriculation by 10.16 percentage points and reduces the
chance of needing remedial education in the first year of college by 7.54 percentage points. When
considering the sample means, those effect sizes are substantively large—the predicted probability
of attending college increases from 57 percent to over 67 percent for concurrent enrollment
students, while their probability of needing remedial education decreases from 35 percent to 27.5
percent.
Students who took concurrent enrollment in high school have first-year college GPAs that
are, on average, 0.08 points higher than their peers who did not participate in the program.
Substantively, the effect size is on the small side; students with a mean GPA of 2.75 would see their
GPA increase to 2.83, for example. The effect of concurrent enrollment participation on persistence
rates is also statistically significant but substantively small; the probability that freshmen college
students will return for a second year of college is, on average, 2.1 percentage points higher for
concurrent enrollment participants than for non-participants. A student’s average predicated

99
probability of returning for a secondary year of college increases from 81 percent to 83 percent
based on the sample mean as a result of concurrent enrollment participation.
Sensitivity analysis. After the PSM ATE results were tabulated, a sensitivity analysis was
performed to see how robust the findings were to potential unobserved confounders. Rosenbaum
(2002) proposes a bounding approach to determine to what extent an unobserved variable would
have to influence the selection process in order to mitigate any statistically significant findings.
Bounds for the significance levels and confidence intervals of the results are defined by varying the
odds ratios that two individuals with the same observed covariates are assigned to the treatment
group at a different rate due to an unobserved variable. The results of the sensitivity analysis
suggest that the ATE estimates for all outcomes are fairly robust to changes in the likelihood of
treatment assignment due to hidden bias.
The college matriculation treatment effect, for example, is statistically significant until an
unobserved variable caused the odds ratio of participating in concurrent enrollment to differ
between treatment and comparison groups by a factor of 1.75. That finding indicates that the
unobserved variable would need to exert a large influence—one that that is larger than the effect
sizes of any individual covariate included in the PSM model—to undermine the positive effect of
concurrent enrollment on college matriculation.
The ATE on persistence rates had a similar sensitivity factor of 1.65, while the ATE for
remediation rates was robust to hidden bias that would more than double the odds of participation
in concurrent enrollment (Γ=2.5). The GPA results are statistically significant unless the unobserved
variable triples the odds that concurrent enrollment participation differs between the treatment
and comparison groups.
Overall, the sensitivity analysis performed for each model found that the influence of
concurrent enrollment on each outcome is resilient to the presence of moderate and even high

100
amounts of selection bias. As mentioned before, the sensitivity analysis cannot determine the
presence of hidden selection bias, but it lends credence to these findings since the unobserved bias
would have to be quite strong to negate the statistical significance of the results (An 2013;
Rosenbaum, 2002).
Regression Findings
A progression of regression models were estimated to assess the robustness of the PSM
findings. The regression models also permit the addition of school-level fixed effects, which could
not be included in the PSM analysis. Table 17 displays one example of the progression of models
estimated with logistic regression for the dichotomous college matriculation and concurrent
enrollment variables as the dependent and key independent variables, respectively. The same
progression of models was run for all four outcome variables. High school-clustered, robust
standard errors are reported for all models to correct for serial correlation and heteroscedasticity.
Initially, a bivariate model is run indicating a positive, statistically significant relationship between
the two variables. The second model adds demographic (FRL, ELL, SPED, race/ethnicity, and gender)
control variables, and the third model adds the control for academic achievement (ACT composite
score). The fourth model, and final, model includes all of the previous covariates in addition to
graduation year and high school fixed effects. In the regression results displayed in Table 17, the
coefficient for concurrent enrollment participation is statistically significant (p<.01) across all
models, and the direction of the coefficient indicates that participation in concurrent enrollment in
high school results in positive gains in college matriculation rates. As expected, the pseudo R-
squared increases across the model specifications as variables are added. The bivariate model
explains 0.8 percent of the variance, while the final model accounts for 16.5 percent of the variation.
The results from the final model that includes fixed effects are used to generate the average
treatment effects are discussed in the following section.

101
Table 17. Progression of Logistic Regression Models Estimating the Effect of Concurrent Enrollment Participation on College Matriculation (1) (2) (3) (5) Variables
Bivariate Includes demographics
Includes ACT score
Full model w/fixed effects a
Concurrent Enrollment 0.632*** 0.635*** 0.553*** 0.594*** (0.053) (0.045) (0.038) (0.037) FRL -0.676*** -0.382*** -0.348*** (0.036) (0.031) (0.029) ELL -0.784*** -0.192*** -0.178*** (0.049) (0.052) (0.043) SPED -1.060*** -0.223*** -0.314*** (0.039) (0.035) (0.034) Hispanic -0.474*** -0.060* -0.051** (0.036) (0.031) (0.024) Black -0.007 0.522*** 0.611*** (0.053) (0.053) (0.052) Asian 0.590*** 0.574*** 0.575*** (0.055) (0.061) (0.067) Other Race -0.556*** -0.258*** -0.178*** (0.065) (0.065) (0.066) Male -0.316*** -0.347*** -0.369*** (0.015) (0.016) (0.016) ACT Composite Score 0.166*** 0.152*** (0.003) (0.003) 2012 Graduation Year -0.058*** (0.018) 2013 Graduation Year -0.110*** (0.018) Constant 0.455*** 0.988*** -2.581*** -3.771*** (0.044) (0.043) (0.070) (0.076) Observations 131,681 131,681 131,681 131,601b Pseudo R-squared 0.008 0.065 0.141 0.165 Correctly classified 63.27% 67.49% 71.49% 72.76%
Robust, high school-clustered standard errors in parentheses *** p<0.01, ** p<0.05, * p<0.10 a Fixed effect model includes graduation years 2012 and 2013 (2011 as baseline) and dummies for 423 high schools (not displayed)
b 15 high schools predicted failure perfectly; a total of 80 students were dropped as a result
Table 18 provides average treatment effects for the dichotomous concurrent enrollment
variable from the multivariate regression models for the different outcome variables. The coefficient
for the concurrent enrollment variable is statistically significant on all four college outcomes. On
average, and controlling for confounding variables, the probability of going to college is 10.57
percentage points higher for students who participated in concurrent enrollment than for those
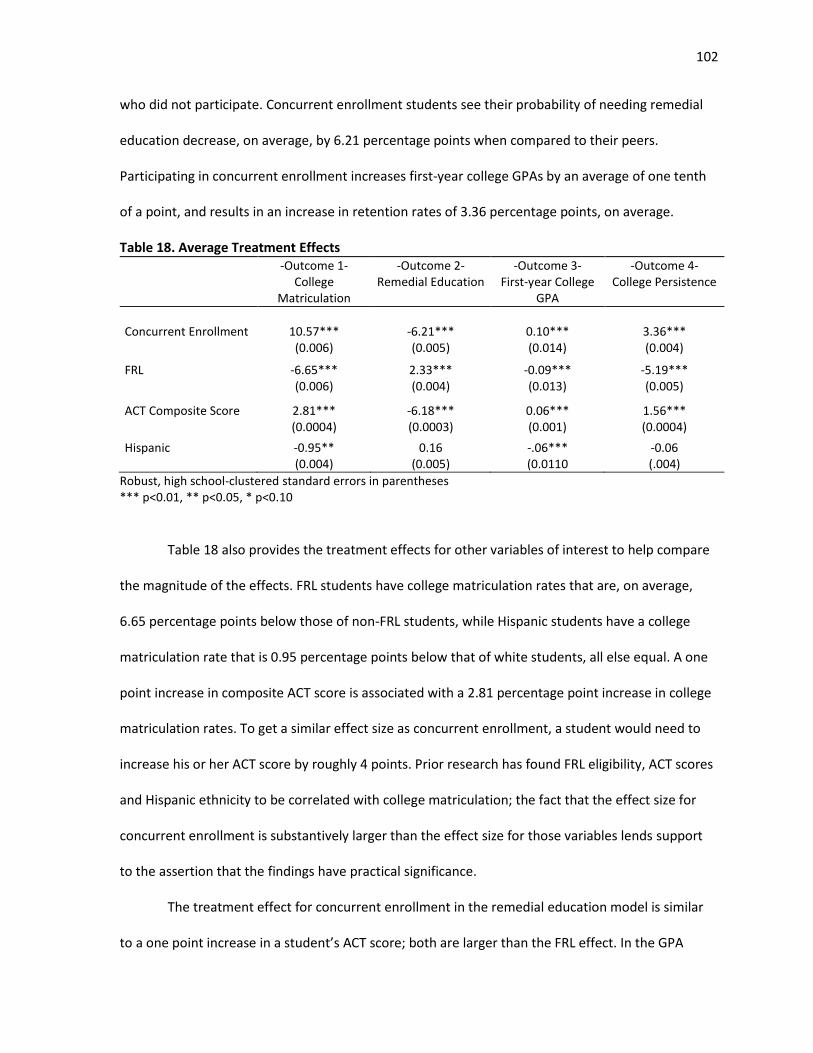
102
who did not participate. Concurrent enrollment students see their probability of needing remedial
education decrease, on average, by 6.21 percentage points when compared to their peers.
Participating in concurrent enrollment increases first-year college GPAs by an average of one tenth
of a point, and results in an increase in retention rates of 3.36 percentage points, on average.
Table 18. Average Treatment Effects -Outcome 1- -Outcome 2- -Outcome 3- -Outcome 4-
College Matriculation
Remedial Education
First-year College GPA
College Persistence
Concurrent Enrollment 10.57*** -6.21*** 0.10*** 3.36*** (0.006) (0.005) (0.014) (0.004)
FRL -6.65*** (0.006)
2.33*** (0.004)
-0.09*** (0.013)
-5.19*** (0.005)
ACT Composite Score 2.81*** (0.0004)
-6.18*** (0.0003)
0.06*** (0.001)
1.56*** (0.0004)
Hispanic -0.95** (0.004)
0.16 (0.005)
-.06*** (0.0110
-0.06 (.004)
Robust, high school-clustered standard errors in parentheses *** p<0.01, ** p<0.05, * p<0.10
Table 18 also provides the treatment effects for other variables of interest to help compare
the magnitude of the effects. FRL students have college matriculation rates that are, on average,
6.65 percentage points below those of non-FRL students, while Hispanic students have a college
matriculation rate that is 0.95 percentage points below that of white students, all else equal. A one
point increase in composite ACT score is associated with a 2.81 percentage point increase in college
matriculation rates. To get a similar effect size as concurrent enrollment, a student would need to
increase his or her ACT score by roughly 4 points. Prior research has found FRL eligibility, ACT scores
and Hispanic ethnicity to be correlated with college matriculation; the fact that the effect size for
concurrent enrollment is substantively larger than the effect size for those variables lends support
to the assertion that the findings have practical significance.
The treatment effect for concurrent enrollment in the remedial education model is similar
to a one point increase in a student’s ACT score; both are larger than the FRL effect. In the GPA

103
model, an increase in a student’s college GPA of one tenth of a point is achieved by taking
concurrent enrollment, and a similar effect size is seen for the FRL variable, although it goes in the
other direction (-0.09). The effect size for FRL students is larger than the concurrent enrollment
treatment in the persistence model, but both are larger than the treatment effect for ACT scores. In
sum, concurrent enrollment has the largest comparative effect size on matriculation rates, with
small comparative effects seen for the other outcome variables.
Comparison of Results
Table 19 provides a comparison of average treatment effects across four methods: 1) PSM
using 1:1 matching with caliper; 2) a multivariate regression using the same covariates that are
included in the PSM model; 3) fixed effects regression; and 4) the difference in means between
students who participated in concurrent enrollment and those who did not. The multivariate
regression results include the same conditioning effect the PSM includes, but there is not a matching
process conducted before estimating the regression. The fixed effects regression uses the results
provided in the previous section (Table 6) derived from regression models that add school and time
fixed effects to the list of covariates included in the PSM models. The unmatched difference in
means provides a baseline of what the treatment effect would be without controlling for any
exogenous factors or adjusting for sample biases.
Overall, the results in Table 19 are fairly consistent between the PSM analysis (matching
1:1), multivariate regression analysis and the fixed effects analysis on the college matriculation and
remedial education outcome results. All three methods provide similar and more modest results for
college matriculation and remedial education than the unmatched, unconditioned difference in
means. This indicates that whether using PSM or regression analysis, confounding effects are being
controlled for in those two outcome models. In the college matriculation model, the PSM method

104
produced the most conservative estimate of the average treatment effect, while the fixed effects
regression produced the most conservative estimate for the remedial education model.
Table 19. Comparison of Average Treatment Effects Outcome
PSM - Matched 1:1
Multivariate regression (using PSM model)
Fixed effects regression
Unmatched Difference in Means
College matriculation 10.16*** (.003)
10.40*** (.003)
10.57*** (.006)
13.66*** (.003)
Remedial education -7.54*** (.004)
-7.52*** (.004)
-6.21*** (.005)
-7.76*** (.005)
First-year college GPA .08*** (.009)
.07*** (.009)
0.10*** (0.014)
.07*** (.009)
College persistence 2.17*** (.003)
2.13*** (.003)
3.36*** (.004)
1.74*** (.003)
Robust standard errors in parentheses *** p<0.01, ** p<0.05, * p<0.10
The college GPA average treatment effects range from 0.07 to 0.1, with the multivariate
regression results mirroring those of the unmatched difference in means. The fixed effects
regression produced the largest average treatment effect (.10) for the GPA outcome model, and for
the college persistence model (3.36). The average treatment effect of concurrent enrollment on
persistence is larger when using PSM, multivariate regression or fixed effects regression than when
looking at the unmatched difference in means. Thus, those methods are adjusting for unobserved
bias in both the college GPA and the college persistence models, although in a way that increases
effect size rather than decreases.
Concurrent Enrollment Effects for Low-Income Students and Minority Students
While participating in concurrent enrollment appears to have beneficial impacts on college
outcomes for the average student, the author is also interested in understanding if and how the
effects of program participation vary depending on the race/ethnicity or income level of students.
105
Robustness Checks
Once again, a progression of regression models were estimated for each dependent variable
to check robustness. As an example, Table 20 displays the progression of models estimated with
logistic regression for the dichotomous college matriculation and concurrent enrollment variables as
the dependent and key independent variables, respectively. The same progression of models was
run for the other three dependent variables (remediation, GPA, and persistence). Initially, a
bivariate model is run indicating a positive, statistically significant relationship between the two
variables. The second model adds demographic (FRL, ELL, SPED, race/ethnicity, and gender) control
variables, and the third model adds the control for academic achievement (ACT composite score).
The fourth model includes the interaction terms of race/ethnicity and FRL eligibility with
participation in concurrent enrollment. The fifth, and final, model includes all of the previous
covariates in addition to cohort year and high school fixed effects.
In the regression results shown in Table 20, the coefficient for concurrent enrollment
participation is statistically significant (p<.01) across all models, and the direction of the coefficient
indicates that participation in concurrent enrollment in high school results in positive gains in
college matriculation rates. The coefficients on the Hispanic and FRL interaction terms indicate a
positive, statistically significant relationship. The progression of regression models for the additional
dependent variables also demonstrated robustness across specifications. The results from the final
model that includes fixed effects and interaction terms for each dependent variable are displayed
and discussed in the following section.

106
Table 20. Progression of Logistic Regression Models Estimating the Effect of Concurrent Enrollment Participation on College Matriculation DV: College Matriculation
(1) (2) (3) (4) (5)
Variables
Bivariate Includes demographics
Includes ACT score
Includes interaction terms
Full model w/fixed effectsa
Concurrent Enrollment 0.632*** 0.635*** 0.553*** 0.471*** 0.523*** (0.053) (0.045) (0.038) (0.044) (0.043) FRL -0.676*** -0.382*** -0.403*** -0.366*** (0.036) (0.031) (0.032) (0.029) ELL -0.784*** -0.192*** -0.185*** -0.172*** (0.049) (0.052) (0.052) (0.044) SPED -1.060*** -0.223*** -0.222*** -0.314*** (0.039) (0.035) (0.035) (0.034) Hispanic -0.474*** -0.060* -0.084*** -0.069*** (0.036) (0.031) (0.031) (0.025) Black -0.007 0.522*** 0.535*** 0.619*** (0.053) (0.053) (0.055) (0.054) Asian 0.590*** 0.574*** 0.562*** 0.562*** (0.055) (0.061) (0.064) (0.069) Other Race -0.556*** -0.258*** -0.263*** -0.178*** (0.065) (0.065) (0.064) (0.065) Male -0.316*** -0.347*** -0.347*** -0.369*** (0.015) (0.016) (0.015) (0.016) ACT Composite Score 0.166*** 0.166*** 0.152*** (0.003) (0.003) (0.003) Hispanic * CE 0.158** 0.126** (0.073) (0.058) Black * CE -0.103 -0.050 (0.088) (0.089) Asian * CE 0.091 0.100 (0.111) (0.123) Other * CE 0.039 -0.009 (0.230) (0.229) FRL * CE 0.123** 0.114** (0.060) (0.057) 2012 Graduation Year -0.058*** (0.018) 2013 Graduation Year -0.108*** (0.018) Constant 0.455*** 0.988*** -2.581*** -2.568*** -3.749*** (0.044) (0.043) (0.070) (0.070) (0.077) Observations 131,681 131,681 131,681 131,681 131,601b Pseudo R-squared 0.008 0.065 0.141 0.141 0.165 Correctly classified 63.27% 67.49% 71.49% 71.52% 72.77%
Robust, high school-clustered standard errors in parentheses *** p<0.01, ** p<0.05, * p<0.10 a Fixed effect model includes graduation years 2012 and 2013 (2011 as baseline) and dummies for 423 high schools (not displayed)
b 15 high schools predicted failure perfectly; a total of 80 students were dropped as a result

107
Interaction Effects
Table 21 displays results from the multivariate regression models using the dichotomous
independent variable of concurrent enrollment participation. The interaction between income (FRL
status) and concurrent enrollment participation was statistically significant in all outcome models at
p<.10 and in three of the four models at p<.05. The interaction between Hispanic students and
concurrent enrollment was statistically significant at p<.05 in the college matriculation model, while
the Asian student interaction term was significant in the remedial education and GPA models
(p<.01). The other interaction terms were not statistically significant. Interpreting interaction terms
in logistic regression models is not as straightforward as in linear regression. Thus, the findings are
presented for each dependent variable as the change in the probability that the outcome will occur
based on the interactions.
College matriculation interaction results. Figure 9 displays the predicted probability of
college matriculation for students who were FRL-eligible compared to those who were not FRL-
eligible by concurrent enrollment participation. The probability of immediately attending college for
FRL students who participate in concurrent enrollment increases by 12.78 percentage points
compared to their FRL peers who do not participate in the program. When looking at higher income
students (not FRL eligible), the difference in matriculation rates between concurrent enrollment
participants and non-participants is 9.92 percentage points. Those differences along with the
variance between those differences (2.86) are statistically significant at p<0.01.
In logistic regression models, it is important to consider, in particular, the statistical
significance of the “variance in differences” since that is in essence capturing the interaction effect.
If the variance in differences is negligible and statistically insignificant then there is not an
interaction effect present (Mitchell & Chen, 2005). This is the case for the interactions between
Asian students, black students and students of other race with concurrent enrollment participation

108
in the college matriculation outcome model. On the other hand, if the variance between differences
is statistically significant, as is the case with the FRL interaction term, then that indicates there is a
meaningful interaction effect between FRL status and concurrent enrollment participation occurring
in this outcome model.
Table 21. Regression Models Estimating the Interaction Effects of Concurrent Enrollment Participation on College Outcomes -Outcome 1- -Outcome 2- -Outcome 3- -Outcome 4- Variables
College Matriculation
Remedial Education
First-year college GPA
College Persistence
Concurrent Enrollment 0.523*** -0.517*** 0.091*** 0.200*** (0.043) (0.054) (0.016) (0.042)
ACT Composite Score 0.152*** -0.566*** 0.057*** 0.114*** (0.003) (0.008) (0.001) (0.003)
Hispanic * CE 0.126** -0.047 0.009 0.011 (0.058) (0.096) (0.024) (0.072) Black * CE -0.050 -0.047 -0.033 0.147 (0.089) (0.139) (0.042) (0.091) Asian * CE 0.100 0.468*** -0.123*** 0.170 (0.123) (0.161) (0.046) (0.169) Other * CE -0.009 0.260 -0.115 -0.194 (0.229) (0.376) (0.122) (0.226) FRL * CE 0.114** -0.241*** 0.052* 0.152** (0.057) (0.092) (0.027) (0.065)
Constant -3.749*** 11.189*** 1.627*** -3.267*** (0.077) (0.159) (0.025) (0.072) Observations 131,601a 61,100b 52,242c 83,291d Pseudo R-squared 0.136 0.426 0.0982 Adj R-squared 0.150 Correctly classified 72.77% 84.87% 81.64%
Robust, high school-clustered standard errors in parentheses *** p<0.01, ** p<0.05, * p<0.10 All models include demographic controls and school and year fixed effects Outcome model 3 is estimated with OLS; all other models are estimated with logistic regression a Includes all high school graduates b Includes high school graduates who immediately enrolled in college at an in-state, public institution c Includes high school graduates who immediately enrolled in college at an in-state, SURDs institution d Includes high school graduates who immediately enrolled in college anywhere

109
FRL Non FRL Hispanic White Variance in Differences
Non-Participant 56.42% 63.57% 60.70% 62.01% FRL v. Non FRL: 2.86*** Hispanic v. White: 2.25**
Concurrent Enrollment Participant
69.19% 73.49% 72.91% 71.97%
Difference in Probability 12.78*** 9.92*** 12.21%*** 9.96%
*** p<0.01, **p<0.05
Figure 9. Probability of College Matriculation, by Concurrent Enrollment Participation and Free or Reduced-Price Lunch (FRL) Status and Race/Ethnicity (Hispanic or white)
The other interaction term that was statistically significant in the college matriculation
model was with Hispanic students and concurrent enrollment participation. Hispanic students who
take concurrent enrollment have, on average, a 12.21 percentage point increase in the probability of
going to college over their non-concurrent enrollment Hispanic peers, as compared to the baseline
group of white students, who see a 9.96 percentage point increase when taking concurrent
enrollment versus not participating in the program (see Figure 9). While the interaction term for
white students is not statistically significant, the difference in the interaction terms (2.25) is
statistically significant at p<0.05, indicating that Hispanic students who take concurrent enrollment
courses see a greater impact on their likelihood of going to college than do white students who
participate in the program.
College remedial education interaction results. As displayed in Figure 10, the probability of
56.42%
63.57%60.70% 62.01%
69.19%73.49% 72.91% 71.97%
30.00%
40.00%
50.00%
60.00%
70.00%
80.00%
FRL Non FRL Hispanic White
Pro
bab
ility
of
Co
llege
Mat
ricu
lati
on
College Matriculation
Non-Participant Concurrent Enrollment Participant
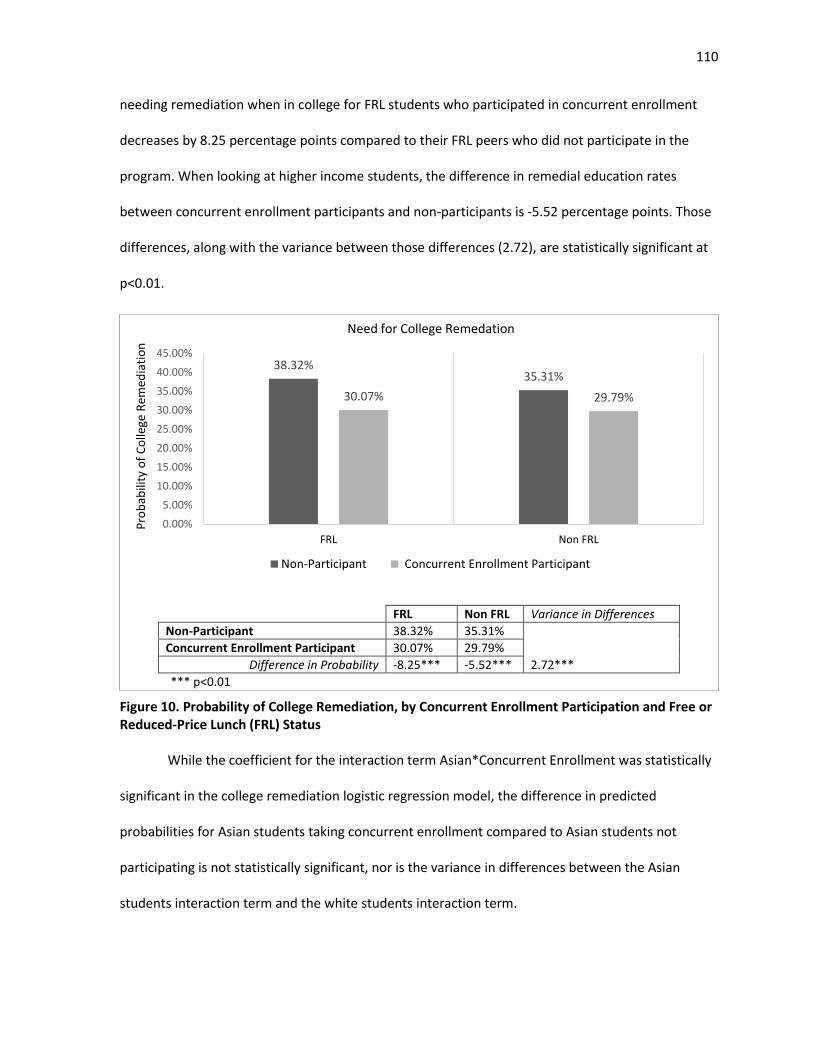
110
needing remediation when in college for FRL students who participated in concurrent enrollment
decreases by 8.25 percentage points compared to their FRL peers who did not participate in the
program. When looking at higher income students, the difference in remedial education rates
between concurrent enrollment participants and non-participants is -5.52 percentage points. Those
differences, along with the variance between those differences (2.72), are statistically significant at
p<0.01.
FRL Non FRL Variance in Differences
Non-Participant 38.32% 35.31%
2.72***
Concurrent Enrollment Participant 30.07% 29.79%
Difference in Probability -8.25*** -5.52***
*** p<0.01
Figure 10. Probability of College Remediation, by Concurrent Enrollment Participation and Free or Reduced-Price Lunch (FRL) Status
While the coefficient for the interaction term Asian*Concurrent Enrollment was statistically
significant in the college remediation logistic regression model, the difference in predicted
probabilities for Asian students taking concurrent enrollment compared to Asian students not
participating is not statistically significant, nor is the variance in differences between the Asian
students interaction term and the white students interaction term.
38.32%35.31%
30.07% 29.79%
0.00%
5.00%
10.00%
15.00%
20.00%
25.00%
30.00%
35.00%
40.00%
45.00%
FRL Non FRL
Pro
bab
ility
of
Co
llege
Rem
edia
tio
n
Need for College Remedation
Non-Participant Concurrent Enrollment Participant

111
College GPA interaction results. The first-year college GPA outcome model is estimated
with linear regression making the interpretation of the interaction terms more straightforward.
White students who take concurrent enrollment have, on average, a positive increase in their first-
year GPA of about one tenth of a point compared to white students without concurrent enrollment
(p<.01). The coefficient on the Asian students interaction term is statistically significant at p<.01 and
negative. Asians students who were in concurrent enrollment do not have a statistically different
GPA than Asian students who did not participate, but the difference between their change in GPA
and the change in GPA for white students (i.e. the difference in differences) is statistically significant,
and that is what is reflected in the coefficient for the interaction term. The change in GPA for Asian
students is, on average, 0.12 points lower than the change in GPA for white students, indicating that
white students participating in concurrent enrollment see a larger effect on their first year GPA than
do Asian students.
The coefficient on the FRL interaction term is statistically significant at p<.10 and positive.
The change in GPA for FRL students is, on average, 0.05 points higher than the change in GPA for
white students, indicating that FRL students participating in concurrent enrollment see a slightly
larger effect on their first year GPA than do non-FRL students.
College persistence interaction results. Figure 11 displays the predicted probability of
college persistence for students who were and were not FRL-eligible by concurrent enrollment
participation. The probability that FRL students who participated in concurrent enrollment will
return for a second year of college increases by 5.50 percentage points when compared to their
non-concurrent enrollment, FRL peers. When looking at higher income students, the difference in
persistence rates between concurrent enrollment participants and non-participants is only 2.72
percentage points. Those differences, along with the variance in those differences (2.78), are
statistically significant at p<0.01. The predicted probability of college persistence for low-income

112
students who take concurrent enrollment (81.7%) is nearly identical to that of higher income
students who do not take concurrent enrollment (82.0%).
FRL Non FRL Variance in Differences
Non-Participant 76.19% 81.69%
2.78***
Concurrent Enrollment Participant 81.96% 84.68%
Difference in Probability 5.50*** 2.72***
*** p<0.01
Figure 11. Probability of College Persistence, by Concurrent Enrollment Participation and Free or Reduced-Price Lunch (FRL) Status
In summary, the results from the interaction effects show that while all students benefit
from concurrent enrollment, low-income students see an even greater increase in positive college
outcomes when compared to higher-income students. This is a critical finding given the policy goal
of increasing outcomes for traditionally underserved students. The interaction terms for minority
students were not as consistent. Nonetheless, one important finding is that Hispanic students who
take concurrent enrollment courses see a greater impact on their likelihood of going to college than
do white students who participate in the program.
Effects of Concurrent Enrollment Credit Hour Levels on College Outcomes
In the last part of this study, the author uses a categorical measure of concurrent enrollment
participation to understand if there are differential effects on college outcomes depending on how
76.19%
81.96%81.69%
84.68%
70.00%
72.00%
74.00%
76.00%
78.00%
80.00%
82.00%
84.00%
86.00%
FRL Non FRL
Pro
bab
ility
of
Co
llege
Ret
enti
on
College Persistence
Non-Participant Concurrent Enrollment Participant
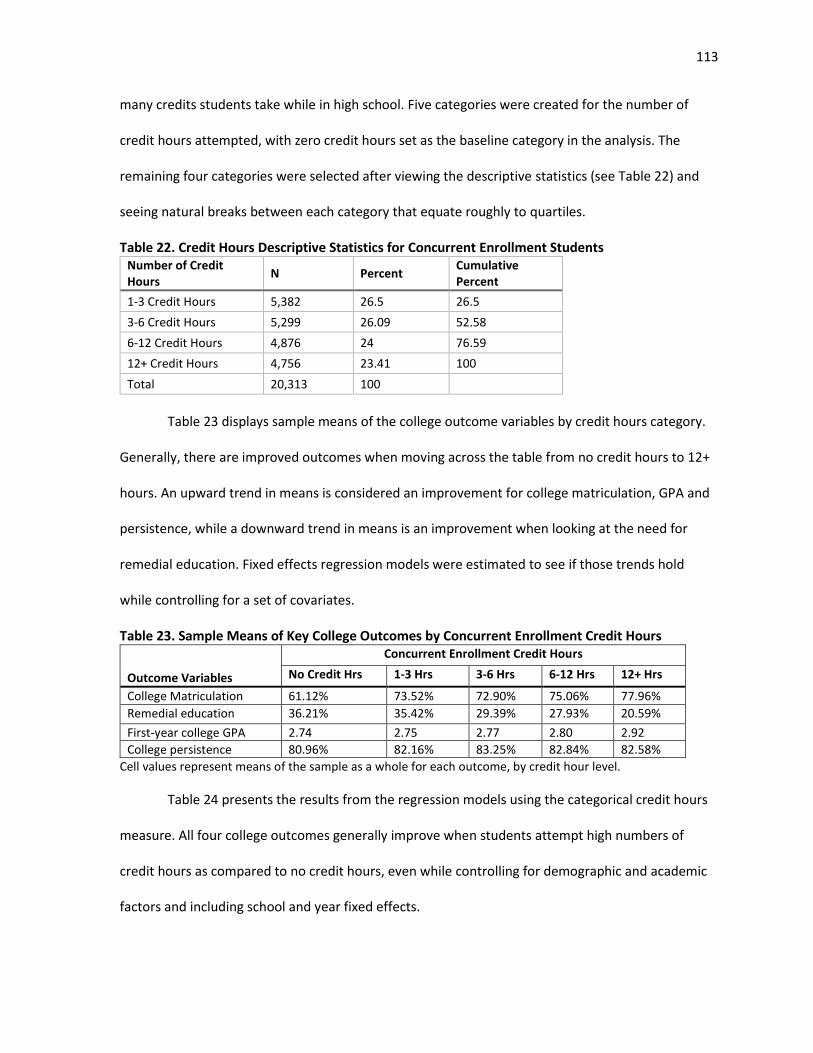
113
many credits students take while in high school. Five categories were created for the number of
credit hours attempted, with zero credit hours set as the baseline category in the analysis. The
remaining four categories were selected after viewing the descriptive statistics (see Table 22) and
seeing natural breaks between each category that equate roughly to quartiles.
Table 22. Credit Hours Descriptive Statistics for Concurrent Enrollment Students Number of Credit Hours
N Percent Cumulative Percent
1-3 Credit Hours 5,382 26.5 26.5
3-6 Credit Hours 5,299 26.09 52.58
6-12 Credit Hours 4,876 24 76.59
12+ Credit Hours 4,756 23.41 100
Total 20,313 100
Table 23 displays sample means of the college outcome variables by credit hours category.
Generally, there are improved outcomes when moving across the table from no credit hours to 12+
hours. An upward trend in means is considered an improvement for college matriculation, GPA and
persistence, while a downward trend in means is an improvement when looking at the need for
remedial education. Fixed effects regression models were estimated to see if those trends hold
while controlling for a set of covariates.
Table 23. Sample Means of Key College Outcomes by Concurrent Enrollment Credit Hours
Outcome Variables
Concurrent Enrollment Credit Hours
No Credit Hrs 1-3 Hrs 3-6 Hrs 6-12 Hrs 12+ Hrs
College Matriculation 61.12% 73.52% 72.90% 75.06% 77.96%
Remedial education 36.21% 35.42% 29.39% 27.93% 20.59%
First-year college GPA 2.74 2.75 2.77 2.80 2.92
College persistence 80.96% 82.16% 83.25% 82.84% 82.58%
Cell values represent means of the sample as a whole for each outcome, by credit hour level.
Table 24 presents the results from the regression models using the categorical credit hours
measure. All four college outcomes generally improve when students attempt high numbers of
credit hours as compared to no credit hours, even while controlling for demographic and academic
factors and including school and year fixed effects.

114
Table 24. Progression of Regression Models Estimating the Effect of Concurrent Enrollment Participation on College Matriculation -Outcome 1- -Outcome 2- -Outcome 3- -Outcome 4- Variables
College Matriculation
Remedial Education
First-year college GPA
College Persistence
1-3 Credit Hours 0.518*** -0.245*** 0.063*** 0.147*** (0.048) (0.058) (0.017) (0.046) 3-6 Credit Hours 0.480*** -0.475*** 0.061*** 0.245*** (0.048) (0.072) (0.019) (0.049) 6-12 Credit Hours 0.650*** -0.749*** 0.105*** 0.309*** (0.051) (0.077) (0.019) (0.050) 12+ Credit Hours 0.828*** -1.116*** 0.209*** 0.387*** (0.073) (0.097) (0.028) (0.083) FRL -0.348*** 0.213*** -0.092*** -0.357*** (0.029) (0.040) (0.013) (0.031) ELL -0.175*** -0.322*** 0.215*** 0.327*** (0.043) (0.087) (0.032) (0.058) SPED -0.315*** 0.407*** -0.037 -0.238*** (0.034) (0.104) (0.029) (0.046) Male -0.368*** -0.180*** -0.273*** -0.433*** (0.016) (0.025) (0.008) (0.020) Hispanic -0.050** 0.016 -0.062*** -0.004 (0.024) (0.042) (0.011) (0.030) Black 0.610*** 0.048 -0.128*** 0.236*** (0.052) (0.054) (0.025) (0.047) Asian 0.575*** -0.555*** 0.000 0.516*** (0.067) (0.072) (0.017) (0.057) Other Race -0.180*** -0.040 -0.102** -0.032 (0.066) (0.128) (0.047) (0.097) ACT Composite Score 0.152*** -0.565*** 0.056*** 0.114*** (0.003) (0.008) (0.001) (0.003) 2012 Graduation Year -0.060*** -0.011 0.018* -0.024 (0.018) (0.033) (0.010) (0.023) 2013 Graduation Year -0.114*** -0.171*** 0.028*** -0.068*** (0.018) (0.034) (0.009) (0.026) Constant -3.737*** 11.222*** 1.630*** -5.419*** (0.077) (0.161) (0.026) (0.073)
Observations 131,601a 61,100b 52,242c 83,291d Pseudo R-squared 0.165 0.467 0.151 (Adj. R-sq) 0.098 Correctly classified 72.76% 84.91% 81.63%
Robust, high school-clustered standard errors in parentheses *** p<0.01, ** p<0.05, * p<0.10 All models include demographic controls and school and year fixed effects Outcome model 3 is estimated with OLS; all other models are estimated with logistic regression a Includes all high school graduates b Includes high school graduates who immediately enrolled in college at an in-state, public institution c Includes high school graduates who immediately enrolled in college at an in-state, SURDs institution d Includes high school graduates who immediately enrolled in college anywhere
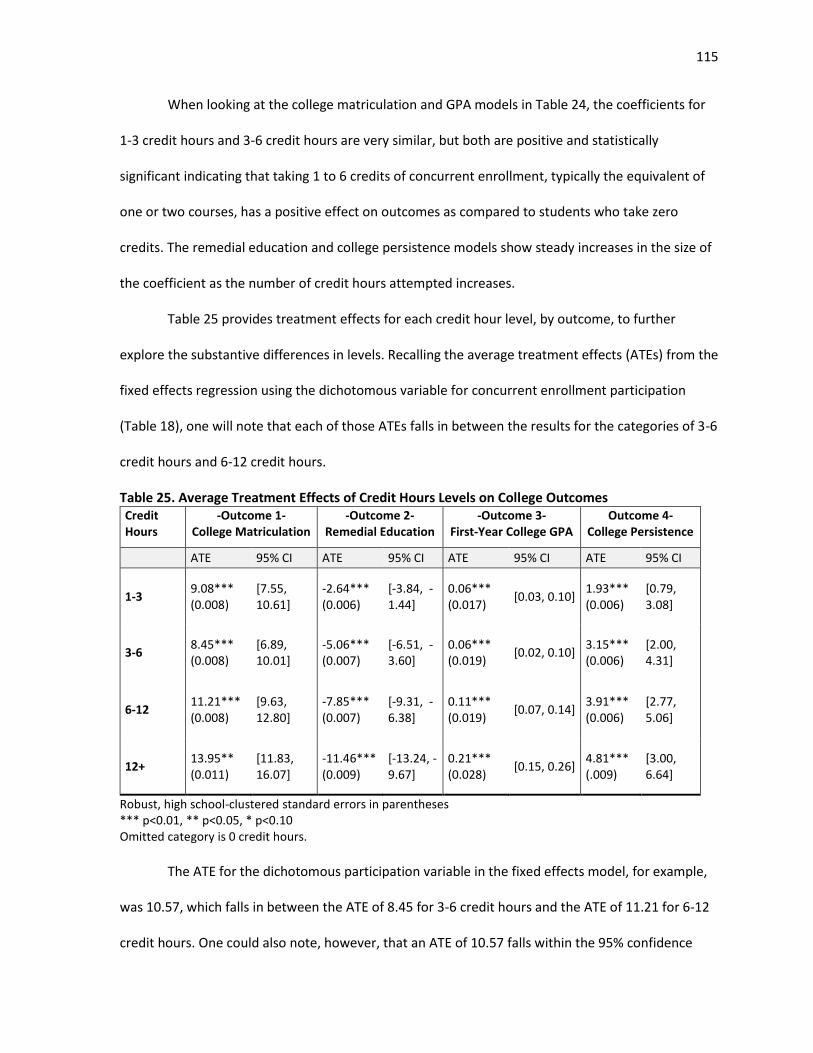
115
When looking at the college matriculation and GPA models in Table 24, the coefficients for
1-3 credit hours and 3-6 credit hours are very similar, but both are positive and statistically
significant indicating that taking 1 to 6 credits of concurrent enrollment, typically the equivalent of
one or two courses, has a positive effect on outcomes as compared to students who take zero
credits. The remedial education and college persistence models show steady increases in the size of
the coefficient as the number of credit hours attempted increases.
Table 25 provides treatment effects for each credit hour level, by outcome, to further
explore the substantive differences in levels. Recalling the average treatment effects (ATEs) from the
fixed effects regression using the dichotomous variable for concurrent enrollment participation
(Table 18), one will note that each of those ATEs falls in between the results for the categories of 3-6
credit hours and 6-12 credit hours.
Table 25. Average Treatment Effects of Credit Hours Levels on College Outcomes Credit Hours
-Outcome 1- College Matriculation
-Outcome 2- Remedial Education
-Outcome 3- First-Year College GPA
Outcome 4- College Persistence
ATE 95% CI ATE 95% CI ATE 95% CI ATE 95% CI
1-3 9.08*** (0.008)
[7.55, 10.61]
-2.64*** (0.006)
[-3.84, -1.44]
0.06*** (0.017)
[0.03, 0.10] 1.93*** (0.006)
[0.79, 3.08]
3-6 8.45*** (0.008)
[6.89, 10.01]
-5.06*** (0.007)
[-6.51, -3.60]
0.06*** (0.019)
[0.02, 0.10] 3.15*** (0.006)
[2.00, 4.31]
6-12 11.21*** (0.008)
[9.63, 12.80]
-7.85*** (0.007)
[-9.31, -6.38]
0.11*** (0.019)
[0.07, 0.14] 3.91*** (0.006)
[2.77, 5.06]
12+ 13.95** (0.011)
[11.83, 16.07]
-11.46*** (0.009)
[-13.24, -9.67]
0.21*** (0.028)
[0.15, 0.26] 4.81*** (.009)
[3.00, 6.64]
Robust, high school-clustered standard errors in parentheses *** p<0.01, ** p<0.05, * p<0.10 Omitted category is 0 credit hours.
The ATE for the dichotomous participation variable in the fixed effects model, for example,
was 10.57, which falls in between the ATE of 8.45 for 3-6 credit hours and the ATE of 11.21 for 6-12
credit hours. One could also note, however, that an ATE of 10.57 falls within the 95% confidence

116
interval for 1-3 credit hours, albeit at the bounds of the interval. The college matriculation outcome
treatment effect does not vary much between 1-3 and 3-6 credit hours, while for the remedial
education outcome the difference between the two categories is more pronounced. The ATE for the
dichotomous participation variable was -6.21, which is included in the confidence intervals for 3-6
and 6-12 credit hours. The GPA outcome shows similar effects for taking 1-3 credit hours and 3-6
credit hours (0.06) as compared to zero credit hours, but there are substantively larger effect sizes
for 6-12 credits and over 12 credits (0.11 and 0.21, respectively). In comparison, the effect size for
the dichotomous participation model was 0.10 of a GPA point. The effect sizes for the college
persistence outcome increase by just around 1 percentage point from one category to the next.
One overall inference from the results is that while those students who take six or more
credits see greater positive effects on college access and success, even those students with only one
or two concurrent enrollment courses (between 1 and 6 credits) see benefits accrue. The college
matriculation outcome, in particular, is still substantively meaningful even for those students taking
fewer credits. The effect sizes for college remediation, GPA and persistence do get considerably
smaller when looking just at those students take 1-3 credits, but the confidence intervals do not
include zero in any of the models.
Selection bias concerns increase when considering the type of student that would take more
than 6 credit hours, since such a student is likely to already be college bound with or without the
treatment. Thus, looking at the treatment effects for the 1-3 and 3-6 credit hour categories, while
providing more conservative estimates, may provide higher confidence in the validity of the results.
Moreover, even though the 1-3 and 3-6 credit hour categories have smaller effect sizes, the ATEs
from the dichotomous college participation model are within the 95% confidence intervals for at
least one of those bottom two credit hour categories. This lends some support to the validity of the
results from the prior analysis conducted using the dichotomous predictor variable.

117
Conclusion & Discussion
The PSM analysis found positive, statistically significant and substantively large effects of
concurrent enrollment participation on college matriculation for Colorado high school graduates—
an increase of 10.16 percentage points in the probability of college enrollment immediately
following high school graduation. The PSM results also suggest that taking participating in
concurrent enrollment reduces the chance of needing remedial education in the first year of college
by 7.5 percentage points. Other research has found that freshmen who start in college-level courses
have higher chances of completing a degree (e.g. Rutschow & Schneider, 2011), so increasing the
rates of college-level course placement is critical. Participating in concurrent enrollment is
associated with an increase in first-year college GPAs of 0.08 points, on average. Lastly, the PSM
analysis found that participating in concurrent enrollment increases the probability of persisting in
college from freshmen to sophomore year by 2.2 percentage points. The findings from the fixed
effects regression analysis and the PSM analysis are quite similar, which corroborates other studies
that have found minimal differences between PSM and regression output (Brand & Halaby, 2006;
Shadish & Steiner, 2010).
When interaction effects were added to the fixed effects regression, the results indicated
that there is a greater increase in positive college outcomes for free and reduced-price lunch (FRL)
students than non-FRL students, which is what one would hope to see given that a primary goal of
concurrent enrollment is to increase college access and success for traditionally underserved groups
of students, including low-income students. Additional results from the interaction term models
indicate that Hispanic students who take concurrent enrollment courses see a greater impact on
their likelihood of going to college than do white students who participate in the program.
While such findings are important contributions to research and practice, the study does
have some limitations. The dataset did not include information on whether the concurrent

118
enrollment course was taught at the high school, at a postsecondary campus, or online. Taking a
course on campus could have more influence on postsecondary readiness than taking a course at
the student’s own school. Further, the quality of concurrent enrollment courses could vary
dependent on the whether the course is taught by high school teachers or by college faculty.
Researchers with access to course setting and instructor data should considering exploring if there
are relationships between those variables and postsecondary outcomes.
Another significant limitation of this study is the potential for omitted variables to threaten
internal validity. Individual motivation is not a directly observable variable and could have a
confounding effect on the analysis. A student, for instance, may be intrinsically motivated to both
select into concurrent enrollment courses and to attend college. The presence of selection bias
means that the effect sizes may be overestimated. However, the sensitivity analysis performed after
the PSM estimations provides credibility to the results and indicates they are robust enough to
withstand the presence of moderate and even high levels of unobserved bias. The sensitivity
analysis found that the unobserved variable would need to exert a large influence—one that that is
larger than the effect sizes of any individual covariate included in the PSM model—to undermine the
positive effect of concurrent enrollment on each outcome.
Furthermore, the final part of this study considered a categorical independent variable to
assess the effects of concurrent enrollment credit hour levels on college outcomes. Generally, as
would be expected, the results show that college outcomes improve when students attempt higher
numbers of credit hours as compared to no credit hours. The top two categories of credit hour levels
(6-12 hours and 12+ hours) likely include more selection bias than the lower two categories of credit
hour levels (1-3 hours and 3-6 hours), because students taking a large number of credit hours may
be intrinsically motivated to pursue advanced educational opportunities, including higher education.

119
The lower two categorical levels perhaps provide a more accurate level of treatment effects, and
even in viewing those findings, one can see meaningful, positive effects on college outcomes.
Overall, across the different methods and model specifications in this study, the findings
remained robust and conveyed the same narrative, which is that participation in concurrent
enrollment in high school results in positive gains in college enrollment rates, first-year grade point
averages, and college persistence rates, and results in a decrease in the need for remedial
education. These are promising findings that contribute to the collective knowledge about what
programs improve postsecondary and workforce readiness for all students.

120
CHAPTER VI
CONCLUSION
The purpose of this study was to investigate how state-level policies, particularly those that
create voluntary programs for schools and students, can meet the intended policy goals and affect
educational outcomes. This research was motivated by two realities: 1) that low-income and
minority students, on average, lag behind their peers on nearly every important education
milestone, including college enrollment and completion; and, 2) that a higher education credential is
increasingly necessary to have a productive career and earn family-sustaining wages. State
policymakers, having observed those same realities, have implemented countless policies to better
prepare students for life after high school. With the development of statewide longitudinal data
systems over the past decade, researchers are now able to investigate if those policies are having
their intended effect of improving outcomes for traditionally underserved students.
One of the prominent approaches among states to expanding college access is concurrent
enrollment, which provides high school students the opportunity to enroll in a college course for
which they may receive both high school and college credit. While concurrent enrollment programs
have been available in public high schools for at least the last half-century, they were typically seen
as an enrichment opportunity for academically advanced students. Programs have grown
exponentially since the early 2000s when policymakers began expanding concurrent enrollment
opportunities to those students who are traditionally underserved, including students of color and
low-income students, as well as to those students who are not high academic performers (Hoffman,
Vargas & Santos, 2008a).
Proponents of concurrent enrollment argue that it increases academic preparation for
college and provides momentum toward degree attainment by giving students the opportunity to
enter college with credits already accumulated (An, 2013; Swanson, 2008). Providing students
121
exposure to college is also thought to be a strategy for developing metacognitive skills, readying
students for the demands of college life, and increasing college aspirations. Moreover, policymakers
are also drawn to concurrent enrollment as a way to increase college affordability by offering
college courses at low or no cost to families.
With the foregoing as a backdrop, this study set out to understand, first, what factors lead
some schools to adopt concurrent enrollment more quickly and implement the program more
intensely as compared to other schools. After understanding the key factors at play at the school
level, the study also sought to evaluate how effective concurrent enrollment is at improving college
access and success for all students, including low-income and minority students. These research
questions are collectively important because the only way state policies can significantly improve
educational outcomes is if programs are both widely diffused in schools and impactful on individual
students.
The data used in this study to evaluate the research questions were collected primarily
through Colorado’s two state education agencies: the Colorado Department of Higher Education
(CDHE) and the Colorado Department of Education (CDE). The author constructed panel data sets by
compiling publicly-available data from the agency websites and by procuring a de-identified and
secure cross-section of student-level data from CDHE. The datasets are timely, comprehensive, and
longitudinal between K-12 and higher education due to data-sharing agreements in place between
the two agencies.
The research began with an event history analysis of the diffusion of concurrent enrollment
across high schools in the state. OLS fixed effects regression and a dynamic panel data model were
used to explore any factors related to the intensity of program participation within high schools
once concurrent enrollment was adopted. Fixed effects regression and propensity score matching
(PSM) were used in a student-level analysis to determine relationships between concurrent

122
enrollment participation and the college access and success outcomes. Participation in concurrent
enrollment was explored both as a dichotomous measure (yes/no) and as an intensity level (number
of credits). The different components of the research design relied on similar administrative data
but had different guiding questions and units of analysis. Taken altogether, there were several
important findings from the multi-level analysis, which were presented in chapters 4 and 5. Key
findings are highlighted here, followed by a discussion of the implications of the findings for
research and practice. This chapter concludes with a description of the limitations and suggestions
for future research.
Key Findings
The diffusion of concurrent enrollment throughout Colorado high schools was rapid and
nearly complete by the end of the five-year event history analysis, which ran from 2010 to 2015.
Results from the analysis found those schools that were more likely to adopt concurrent enrollment
immediately after legislation passed in 2009 had higher college matriculation rates—and also higher
rates of free or reduced-price lunch (FRL) students. Early adopters were also more likely to be larger
high schools, and schools that had previously offered the Post Secondary Education Options (PSEO)
program, Colorado’s first version of dual enrollment. Charter schools were half as likely to adopt
concurrent enrollment as traditional, district-run schools.
Results from the dynamic panel data model, which included a lagged value of the dependent
variable and school and year fixed effects, found that the prior year’s concurrent enrollment
participation rates are a strong predictor of the current year’s participation rate, although there is
still growth in participation rates that occurs year over year. The lagged dependent variable
indicates that a high school will see a 0.75 percent increase in the current year’s participation rate
for every 1 percent increase in the previous year’s participation rate. The variables for median
household income and PSEO participation had a positive, statistically significant association with

123
concurrent enrollment participation rates. School size, distance to the nearest community college,
and the charter school indicator were statistically significant and negatively associated with
participation rates.
The student-level analysis found a positive, statistically significant and substantively large
effect of concurrent enrollment participation on college matriculation for Colorado high school
graduates. The effect sizes for the matriculation outcome are still meaningfully large even when
considering outcomes for students who only took 3 credits (e.g. 1 course) or 6 credits (e.g. 2
courses). The propensity score matching analysis and regression analysis also found that
participation in concurrent enrollment in high school results in positive gains in first-year college
grade point averages and college persistence rates, and results in a decrease in the need for
remedial education. While concurrent enrollment, on average, improves college outcomes for all
students, low-income students experience a greater positive impact on their outcomes than higher
income students. Additionally, Hispanic students who take concurrent enrollment courses see a
greater impact on their likelihood of going to college than do white students who participate in the
program.
Implications for Research and Practice
Policy Diffusion Research
The vast majority of the numerous studies conducted using policy innovation and diffusion
theory focus on the adoption of a policy without considering what occurs after adoption in the
implementation stage. Scholars have identified this gap in the literature and have called for studies
to apply policy diffusion analysis beyond a simple dichotomous measure of adoption and to analyze
policy implementation (Shipan & Volden, 2012). Further, policy diffusion research has largely
focused on states as the unit of analysis. There have been studies conducted of local governments,
but the body of research is much smaller and focuses on municipalities. Thus, as this study considers

124
both policy adoption and policy implementation using high schools as the unit of analysis, the
findings make an important contribution to the literature.
This study began with a dichotomous measure of adoption, but followed it up with an
analysis of policy implementation using a proportional dependent variable measuring the share of
students taking concurrent enrollment courses within a high school. The results showed that some
variables affected both policy adoption and the level of implementation (e.g. charter, PSEO), while
other variables had effects on policy adoption but not on whether a school widely implemented the
program (e.g. matriculation rates and FRL status). The findings also lend some support to one of the
prominent determinants of policy diffusion according to the literature—the importance of size and
organizational capacity—as smaller schools were slower to adopt concurrent enrollment compared
to larger ones. Regarding the effects of fiscal capacity, the findings were mixed. Schools with higher
percentages of FRL students were quicker to adopt, but schools with higher median incomes were
more likely to fully implement the program. Distinctions such as this between policy adoption and
policy implementation are precisely what Shipan and Volden (2012) called for in their review of the
policy diffusion literature.
In this case study, it appears that the characteristics of the policy itself—specifically, the
salience, clarity and compatibility of the law—influenced adoption more than traditional diffusion
factors such as fiscal capacity. This supports more recent diffusion research that has highlighted the
importance of policy characteristics on the diffusion process (Boushey, 2010, Makse & Volden, 2011,
Nicholson-Crotty, 2009). Regarding the clarity of the law, concurrent enrollment does require work
on the part of both schools and districts, but the law is clear and uniform in structure with enough
local flexibility embedded in the law to allow schools and colleges to implement the program in a
way that fits with their local needs and current practices. Further, the financial provisions of the law
permitted both schools and colleges to set up systems to fund and operate the programs in a way
125
that does not unduly burden them, making the law compatible with current practice. These policy
attributes likely affected how quickly the program was adopted and support findings from Makse
and Volden (2011) that found compatible policies—those that fit seamlessly into current practices—
are quicker to diffuse than complex policies that require a great shift in the status quo. Thus, the
study makes a modest contribution to the newer stream of policy diffusion literature that focuses on
the importance of policy characteristics in the adoption stage. Interestingly, though, this study
reaffirmed the significance of some of the more traditional diffusion factors such as fiscal capacity in
the implementation stage of the analysis, as schools with higher median incomes had higher
implementation levels.
Supporting High Schools
If fiscal capacity, organizational capacity, school type and prior program offerings are key
predictors of the adoption and implementation of dual enrollment programs, the question becomes
what can be done with this information in practice? While policymakers and education practitioners
cannot easily change the size or location of schools, or their governance structures, targeted support
and outreach can be provided to schools that are smaller or less resourced. Ensuring all schools have
access to personnel and support—either at the state level, at a regional level (e.g. through their
Board of Cooperative Education Services), or through the district—to administer concurrent
enrollment programs could be a way to improve access across all different types of high schools.
Implementing concurrent enrollment, for example, requires staff to fill out paperwork on
behalf of students and negotiate MOUs with community colleges concerning the courses that will be
offered and who will teach them (i.e. a high school teacher or community college faculty). If a high
school teacher is leading the course, there needs to be collaboration with the partnering college
around course syllabi, curriculum, scope and sequence, professional development, supervision, and
expectations. School counselors need to ensure that the courses students are selecting are aligned

126
with their individual career and academic plans. If schools with less organizational capacity had a
liaison to help them with the logistical and administrative details, it could make program
implementation easier. While some of the larger school districts have district staff who are
dedicated to concurrent enrollment, small districts are less likely to have such positions (M.
Camacho Liu, personal communication, October 8, 2016).
While supporting initial program adoption and implementation is important for any new
educational initiative, schools also need sustained support to ensure the program can continue to be
offered. Many of the concurrent enrollment implementation tasks are on-going—particularly
around student course enrollment paperwork, negotiating with colleges over course offerings and
instructors, and counseling students and parents on course options. If the local funding
arrangements put too much of a burden on school districts, concurrent enrollment programs are at
risk of being scaled back when resources are tight.
Some school districts and colleges have developed strong partnerships that make
adjustments when needed to promote student access. Eagle County School District, for example,
partners with Colorado Mountain College (CMC) to offer concurrent enrollment opportunities. Prior
to 2015, the district paid CMC tuition for courses located on high school campuses, and CMC
reimbursed the school for the cost of the instructor if it was a high school teacher. To ease
operations and help the district increase concurrent enrollment opportunities, CMC now waives
tuition for all courses on high school campuses, and the district is only responsible for covering the
costs of a CMC faculty member if there is not a high school teacher available to teach the course
(CDE, 2016).
The Eagle County Schools and CMC arrangement is an example of a best practice from the
model state policy elements discussed in the introduction. While there are a number of ways to
creatively fund concurrent enrollment programs, the goal should be to ensure that neither system
127
(K-12 or higher education) is unduly burdened by the program (Zinth, 2014b, 2015b; Ward & Vargas,
2012). Given the positive outcomes in this study and others, showing that concurrent enrollment
results in improved college access and success for students (in particular, low-income students), the
hope would be that such evidence would make a case for sustained state funding and support for
concurrent enrollment. States, however, continue to face budgetary challenges, and there is no
shortage of competition for public services that require funding. Thus, as the Education Commission
of the States and Jobs for the Future often recommend, if funding cannot be guaranteed at the
state-level, local arrangements should be developed to be as predictable and adequate as possible
to ensure traditionally underserved students continue to have access to dual enrollment
opportunities (Zinth, 2014b, 2015b; Ward & Vargas, 2012).
Returns on Investment
Investing in supports for schools with lower capacity during the implementation of
concurrent enrollment, or similar college readiness programs, is also important given the results
from the participation rates analysis. Across all schools, participation rates increased year over year,
indicating that schools and families are taking advantage of the opportunities posed by concurrent
enrollment. Given the positive effects of participation on college outcomes, it is encouraging that
participation rates continue to increase.
While larger schools were quicker to adopt concurrent enrollment, which was expected
given the advantages of organizational capacity, smaller schools that offer concurrent enrollment
often have a higher percentage of their students taking concurrent enrollment, as compared to
larger schools. As explained in Chapter 4, it is likely that when a small high school offers a concurrent
enrollment course, for example a math class for seniors, that class comprises a large percentage of
its overall enrollment, whereas offering one class at a large high school will only consist of a small
share of the overall student body. Further, many small schools located in remote areas use

128
concurrent enrollment to provide access to content the school is not able to deliver on its own. A
rural high school, for instance, can go through a community college to offer college-level chemistry,
whereas without concurrent enrollment the school would not be able to offer the course at all.
Another explanation is that there are fewer opportunities in small schools for advanced coursework,
whereas in large high schools, students often have the choice of various college-level courses,
including Advanced Placement.
The implication for practitioners and policymakers is that it is worth investing in concurrent
enrollment support for schools that are small or remote because these schools can take full
advantage of the opportunities available to them. Additional returns on the state investment may
accrue if students from rural areas are able to earn college credits while in high school and apply
those to their college degree so that they graduate more quickly. While this study did not explore
the financial savings to families and the state, it is a worthwhile question for future research,
particularly if such research were to compare the cost effectiveness of concurrent enrollment to
other college access programs.
Lastly, the findings of the PSEO indicator were, as expected, statistically significant and
predictive of concurrent enrollment adoption and the student participation rate. Having had PSEO in
place made it easier to transition to concurrent enrollment in terms of already having college
partnerships in place. Logistically, there was still significant change that had to occur to transition to
concurrent enrollment though, and the intention of the program is different. The Concurrent
Enrollment Programs Act has a clear intent of expanding access to students who are traditionally
underserved. Thus, while PSEO was included as a necessary control variable, there is also an
important linkage to be made to the literature on policy diffusion.
Berry and Berry (2007) refer to a softening of the environment to describe when one
innovation takes place and makes it easier for subsequent innovations to occur. The findings

129
support that theoretical aspect as schools that had PSEO were quicker to adopt concurrent
enrollment. A related implication for practitioners and policymakers is that once a college-going
program is established it may not only continue to grow in terms of student participation year-over-
year, but it may also soften the environment and the make the school more open to other promising
practices. Prior research on the importance of establishing college-going cultures in high schools
would also support the claim that states putting resources into promoting college access programs
may see an increasing return on that investment (Hoffman, Vargas & Santos, 2008a; Roderick,
Nagaoka, Coca & Moeller, 2008).
Expanding Access: Charter Schools
It is unclear to what extent charter schools’ low participation levels in concurrent
enrollment is driven by their lack of access to funding, support, and programming or by a difference
in the nature of charter high schools, many of which are have their own thematic focus that may not
cohere with concurrent enrollment. It could be the case that charter schools prefer to pursue other
college readiness programs that are perceived to be more elite or rigorous (e.g. Advanced
Placement, International Baccalaureate). Or, it may be that some charter schools prefer to partner
with more selective, four-year institutions instead of community colleges, and while that is
permissible under concurrent enrollment, it is more costly to do so. Another explanation could be
that charter schools are not required to employ licensed teachers, and that may decrease
opportunities for offering concurrent enrollment courses at the high school if there is a shortage of
instructors with the necessary qualifications. The author did not collect data on such information, so
further research would need to be conducted to test those speculative claims.
If the low participation at charter schools is related to the lack of shared resources that
could be a learning point for Colorado and for other states. Some districts handle portions of the
logistical and financial transactions of concurrent enrollment on behalf of their district-operated

130
schools. Not including charter schools in those arrangements could reduce the likelihood that
charter schools will offer the program. Charter schools may also have lower administrative capacity
than larger district high schools and, without support from the district or another entity, they may
not be able to offer concurrent enrollment. Ensuring equitable arrangements within the state for all
schools, regardless of charter status, could increase access for students to concurrent enrollment
opportunities.
Meeting Policy Goals?
Colorado’s Concurrent Enrollment Programs Act was specifically passed to expand access to
low-income and minority students who had not typically been included in similar programs. In the
descriptive analysis it was noted that free and reduced-price lunch (FRL) students were slightly
overrepresented in the concurrent enrollment population. When considering race/ethnicity,
Hispanic students had higher participation rates than white students in 2011 and 2012 and were one
percentage point below them in 2013. All groups have seen increased participation rates each year
of the study. The event history analysis performed in this study found that, even after controlling for
confounding factors, high schools with higher percentages of low-income students were quicker to
adopt concurrent enrollment. From these results, one can conclude that the law is functioning as
intended by reaching groups of traditionally-underserved students. Expanding access, however, is
only one-half of the equation; ensuring successful outcomes for students is also a key goal of the
policy.
Did the Policy Improve Outcomes for Low-Income and Minority Students?
This study explored the effects of participating in concurrent enrollment for low-income and
minority students. The results indicate that all students benefit from concurrent enrollment, but
low-income students see an even greater increase in positive college outcomes when compared to
higher-income students. This is a critical finding given the policy goal of increasing outcomes for

131
traditionally underserved students. It corroborates other research that found students of low
socioeconomic status (SES) see greater benefits from dual enrollment than high-SES students (An,
2013). While it makes intuitive sense that students who are already disposed to go to college will
likely enroll regardless of their high school programming, there has been a lack of evidence around
what happens to students who are on the margins of attending. The U.S. education system has
historically provided advanced coursework opportunities (e.g. Advanced Placement, International
Baccalaureate, honors courses, and dual enrollment) to academically advanced students (Darling-
Hammond, 2010; Hoffman, 2005; Hoffman, Vargas, Santos, 2009a; Oakes, 2005). Now, with the
expansion of dual enrollment, researchers are investigating the effects of providing dual enrollment
to those students who are not at the top of their classes. Given the pervasive gaps in academic
achievement rates by race/ethnicity and SES, expanding access to advanced coursework to students
who are middle achievers—those who can meet the minimum academic prerequisites for dual
enrollment but are not top performers—will naturally reach students who have typically been
underrepresented in higher education.
This dissertation contributes to the literature on college access because prior research on
concurrent enrollment is limited and the findings have conflicted at times. While An (2013) found
dual enrollment had a greater effect on college degree attainment for low-SES students when
compared to high-SES students nationally, Taylor (2014) found smaller effect sizes for low-income
students in Illinois. The findings from this study were consistent across all four college outcomes—
college matriculation, remedial education, college GPA, and persistence—indicating that low-
income students receive a greater benefit from participating in concurrent enrollment than
wealthier students.
The findings of this study, however, were not consistent across all outcomes for minority
students. The research found that Hispanic students who take concurrent enrollment courses see a

132
greater impact on their likelihood of going to college than white students who participate in the
program. This is a promising finding since the college-going rate for Hispanic students lags 18
percentage points below that of white students in Colorado (CDHE, 2017a). Hispanic students also
lag behind their peers in college GPA, persistence and completion, and given that the college
success outcomes for Hispanic students were not statistically significant in this study, it is unclear if
the positive benefits related to college access for Hispanic students extend to college success and
degree completion. When additional years of longitudinal data are available, future research should
analyze the effect of the program on college success and degree attainment for minority and low-
income students. Nonetheless, this study finds that Colorado’s Concurrent Enrollment Programs Act
met many of its intended goals around expanding access to concurrent enrollment courses and
increasing college enrollment rates for both low-income and Hispanic students.
Burgeoning Empirical Support for Concurrent Enrollment
Education researchers often struggle with controlling for selection bias due to limitations on
available data and analytical methods, and prior research on concurrent enrollment, specifically, has
left room for improvement (Allen & Dadgar, 2012; An, 2012; Le, Casillas, Robbins, & Langley, 2005).
Though concurrent enrollment programs have been around for decades, only in the past several
years have researchers begun publishing quasi-experimental evaluations of statewide concurrent
enrollment programs, due in part to the recent expansion of statewide longitudinal data systems.
We are now seeing burgeoning evidence that concurrent enrollment has decidedly positive
effects on students, which lends support to the school improvement framework literature that
contends that education inputs can affect student outcomes. While this evaluation of Colorado’s
concurrent enrollment program found positive outcomes, the effect sizes are smaller than those
found in similar studies conducted in Illinois, Texas and Utah, but they are larger than the effect
sizes found in a study conducted in Washington (see Table 26).

133
All studies under comparison used a quasi-experimental design to estimate the effect of
concurrent enrollment participation (using a dichotomous measure) on college matriculation rates.
Only Giani et al.’s (2014) study of the Texas dual enrollment program also used a measure of
participation intensity by including a continuous measure of credit hours earned. Like Giani et al.
(2014), this research found increased effect sizes as concurrent enrollment credit hours increased.
Giani et al., however, did not track college enrollment outside of the state of Texas due to
limitations in their data. Cowan and Goldhaber (2014) assert that excluding out-of-state students
could be a serious measurement error. Their analysis found that up to the half of the effect size in
studies that exclude out-of-state matriculation is due to bias from measurement error. This
dissertation included out-of-state students in the college matriculation analysis, which could be a
reason why the effect size is smaller than other studies—although further investigation would need
to be conducted to confirm that claim.
Table 26. Comparison of Statewide Evaluations Assessing Effect of Dual Enrollment Programs on College Matriculation
Study Citation State of Focus
Increased % Probability of College Matriculation
Method HS Graduation Year Cohort(s)
Haskell (2016) Utah 30.7% PSM 2008 & 2009
Taylor (2015) Illinois 34.0% PSM 2003
Giani et al. (2014) Texas 36.0% PSM 2001
Cowan & Goldhaber (2014) Washington 5.9% Fixed effects regression
2010
Findings presented within this study
Colorado
10.21% PSM 2011, 2012 & 2013
10.57% Fixed effects regression
Note: All displayed results use a dichotomous treatment variable.
Lastly, while rigorous statewide studies are becoming more commonplace on this education
topic, as well as others, there is a constant need to ensure the sustainability of statewide
longitudinal data systems. With studies such as the ones listed in Table 26, it is hoped that

134
policymakers and practitioners will see the value in continuing to support data systems and the
sharing of data with researchers.
Setting a Foundation for a K-14 System?
In closing, one additional implication of the findings is that dual enrollment programs can be
viewed as setting a foundation for a public K-14 education system. It is a fact: a high school diploma
alone does not take an individual very far in today’s economy. Nearly all postsecondary credentials,
even technical certificates or associate’s degrees, can make an individual far more valuable in the
job market. As dual enrollment programs have proliferated across states, school districts and high
schools, some have seen the programs as an opportunity to create a near-seamless system at the
end of which students exit with at least an associate’s degree. The idea of a “free,” public K-14
system has grown in popularity in recent years. One report, referring to the increase in dual
enrollment programs in states notes, “Essentially, without any fanfare, and without the public
rhetoric of K-16, something historic is beginning to emerge in these states: the creation of an
“almost” seamless, free system with new roles for postsecondary education” (Hoffman, 2005, 26).
Shifting the public education paradigm to be one in which all students earn an associate’s
degree through a free and compulsory system of education may not be politically palatable on a
larger scale. While it is one matter for a state to promote a voluntary policy that is, in many cases,
financed within existing means, it is quite another for a state to create a system where the default is
all students may earn an associate’s degree. Such a system would surely require more public
revenue, and states are already under severe budget constraints. Even though the return on the
investment could be considered economically worthwhile, it would be a challenging political feat to
accomplish. As Paul Reville comments, at some point a fundamental shift needs to occur.
We claim to want a system that educates all our students to a high level so that they can successfully participate in our high-skills/high-knowledge 21st-century economy, thereby assuring the growth of that economy and prosperity for them and their families. But we haven't built an engine to drive such an enterprise. We just keep tinkering with the old

135
engine, trying to get it to do a job that is fundamentally different from that for which it was designed. (Reville, 2014, 24)”
Perhaps concurrent enrollment is just more tinkering, but it could lay the foundation for a
fundamentally different system wherein all students have the opportunity to receive a rigorous
secondary education and graduate with an associate’s degree prepared to enter the workforce in a
productive career or pursue additional postsecondary degrees.
Limitations and Future Research
While this research makes important contributions to the field, there are several limitations
that the author acknowledges. From these limitations, ideas for future research may be generated.
Omitted Variable Bias
A significant limitation of this study is the potential for omitted variables to threaten
internal validity. Individual motivation is not a directly observable variable and could have a
confounding effect on the analysis. A student, for instance, may be intrinsically motivated to both
select into concurrent enrollment courses and to attend college. Other unobserved variables that
could influence both selection into concurrent enrollment and the college outcomes under
investigation include parents’ education level, students’ relationship with college guidance
counselors, and peer effects. Additionally, concurrent enrollment is one program among many
intended to increase college-going rates. While the school-level fixed effects help isolate the impact
concurrent enrollment has on a student’s postsecondary outcomes, if multiple college readiness
programs are offered within the same high school in the same time period, it would be challenging
to disentangle the effects of the disparate programs. The presence of omitted variable bias means
that the effect sizes may be overestimated. The sensitivity analysis performed after the quasi-
experimental PSM estimations, however, lends credibility to the practical significance of the results
by indicating they are robust enough to withstand the presence of moderate and even high levels of
unobserved bias.

136
Further, the final part of this study considered a categorical independent variable to assess
the effects of concurrent enrollment credit hour levels on college outcomes. The top two categories
of credit hour levels (6-12 hours and 12+ hours) may reflect more selection bias than the lower two
categories of credit hour levels (1-3 hours and 3-6 hours), because students taking a large number of
credit hours may be intrinsically motivated to pursue advanced educational opportunities, including
higher education. The lower two categories could provide a more accurate level of treatment
effects, and even in viewing those findings, one can see meaningful, positive effects on college
outcomes. The college matriculation outcome, in particular, is still substantively large even for those
students taking fewer credits. Even so, future research should continue to identify ways to better
control for selection bias. If there is ever an instance where a dual enrollment program is capped
and students become waitlisted, there could be an opportunity to conduct a natural experiment.
Concurrent Enrollment Instructors
Another area of exploration for future research that was a limitation of this current study is
how teacher-specific variables affect the research questions. It would be valuable to include, for
example, a measure that controls for the type of postsecondary degree teachers have within high
schools. If a high school wants to offer concurrent enrollment courses in their building with their
own instructors, teachers must hold a master’s degree in the content area of the course (e.g. a
master’s degree in math is required to teach any college-level math course). That level of granular
data is not available for this study, but researchers with access to such data could explore how the
credentialing of teachers within a high school corresponds with the adoption of concurrent
enrollment as well as the intensity of implementation.
In Colorado, finding high school teachers with the needed credentials to run a concurrent
enrollment course is a challenge for all schools—but especially for rural schools (Zinth, 2014a). In
2016, for example, Montezuma-Cortez High School stopped offering concurrent enrollment because

137
they did not have a teacher available who had the necessary credentials. Another area for future
research is to follow trends in concurrent enrollment offerings at rural high schools to see if
program access declines due to barriers around teacher availability.
Course Characteristics
The dataset did not include information on whether the concurrent enrollment course was
taught at the high school, at a postsecondary campus, online or in a hybrid format. Taking a course
on campus could have more influence on postsecondary readiness than taking a course at the
student’s own school given the benefits of being in a physical college environment. Further, the
quality of concurrent enrollment courses could vary dependent on whether the course is taught by
high school teachers or by college faculty. If courses are taught by high school teachers, quality can
also be dependent upon the strength of the relationship between the high school and its partnering
college.
Despite not having access to data on course characteristics, the findings are reassuring in
that there are positive outcomes occurring from the program. The majority of students participating
in dual enrollment—in Colorado and nationally—take courses at their high school (Borden, et al.,
2013). From this research and others, it is evident that taking courses on high school campuses
produces benefits (An, 2013; Giani et al., 2014, Taylor, 2015). In a qualitative investigation, Karp
(2012) found that despite not being physically located on a college campus, dual enrollment courses
still gave students the opportunity to assume the role of a college student, which helped them gain
a deeper knowledge of what would be expected of them in college courses. Nonetheless, the
existing state-level research studies have not explored course setting and instructor characteristics
due to limited data availability; researchers with access to such data should consider if there are
relationships between those variables and postsecondary outcomes. While positive benefits result,
on average, from concurrent enrollment participation, it would be worthwhile to see if there are

138
varying effects from taking concurrent enrollment on a college campus as compared to at a high
school or online.
Policy Diffusion Pressures
Lastly, it is also important to note that during the time of the diffusion study (2010-2015),
the economy was recovering from the Great Recession of 2008. There is reason to believe that
economic factors influenced the diffusion of concurrent enrollment, particularly as community
colleges rely on the program for consistent revenue. Enrollments at community colleges peaked
during and immediately after the recession but have been declining nationwide since 2010 (Smith,
2016). Concurrent enrollment provides community colleges with reliable revenue, and that could
have factored into why the program diffused so quickly. While there were indicators included in the
study to account for the presence of nearby community colleges, as well as year fixed effects, there
was not a separate control for the larger economic forces that may have affected the rapidity with
which concurrent enrollment diffused.
Additionally, it could be beneficial to delve deeper into the emulative pressures that did or
did not influence high schools in their decisions to adopt the program. The indicator for regional
diffusion (number of high schools offering concurrent enrollment within a 5 mile radius) was not
statistically significant in the event history analysis model, but there could be a more appropriate
indicator to capture emulative pressures (for example, rival high schools based on sports
associations or school choice patterns). More recent literature on policy diffusion has found the
geographic focus of policy adoption to be an outdated concept (Shipan & Volden, 2012; Volden, Ting
& Carpernter, 2008). Policymakers and leaders can learn about innovative programs not just from
their geographic neighbors, but from others across the states—or, increasingly, across the world. A
recent publication of the best practices in education from other countries, for example, is making its
way across state legislatures; as a result, one can expect to see legislation enacted emulating
139
educational practices from Finland, Singapore and other high performing countries (National
Conference of State Legislatures, 2016). Geographic patterns of the diffusion of concurrent
enrollment may not be as critical to investigate as other factors that influence policy learning, such
as informal personal networks or competitive pressures (Binz-Scharf, Lazer & Mergel, 2012; Shipan
& Volden, 2012).
Principals, for instance, may influence one another through informal personal networks. The
lack of a measure to account for school leadership was a limitation of this study, although school
fixed effects were used in an attempt to address it. It could be the case that entrepreneurial
principals are more likely to push for offering concurrent enrollment in their schools. Also, perhaps,
they are more likely to influence one another. An informal network could exist within and across
districts, and would support findings in the literature related to both policy entrepreneurs and
informal learning networks (Binz-Scharf, Lazer & Mergel, 2012; Mintrom, 1997).
Thus, the measure used herein for the diffusion of concurrent enrollment may not have
accurately captured the emulative pressures that existed. Considering the rapidity with which the
program spread, it stands to reason that there was some amount of external pressure high schools
felt to adopt the program for which the model did not directly account, whether that pressure was
from other high schools or from community colleges motivated, at least in part, by economic
factors. One indicator that did reveal differences in diffusion patterns was the urban-suburban
indicator. High schools in urban-suburban areas were far slower to adopt concurrent enrollment
than Denver Metro Area schools or rural schools. In Colorado, the urban-suburban designation
refers mostly to Colorado Springs and Greeley. An interesting idea for future research could be to
conduct a qualitative case study analysis of districts within those cities to understand why they were
slower to adopt, what eventually led to the program adoption, and how the concurrent enrollment
programs are faring now that they are in place there.

140
As states continue to expand and promote college access and success programs, research
questions such as the ones presented in this section will be useful to practitioners and policy
makers. The empirical support for concurrent enrollment is growing, but states still have a long road
ahead of them to close achievement gaps. The research presented in this dissertation contributes to
advancing collective knowledge about how states can improve postsecondary outcomes for
students, particularly those who have been traditionally underserved, but future research can—and
should—build off of these findings to provide further guidance to researchers, policymakers and
practitioners.
141
REFERENCES
Adelman, C. (2006). The toolbox revisited: Paths to degree completion from high school through college. Washington, DC: U.S. Department of Education.
Allard, S.W. (2004). Competitive pressures and the emergence of mothers’ aid programs in the United States. Policy Studies Journal 32, 521-544.
Allen, D. (2010). Dual Enrollment A Comprehensive Literature Review & Bibliography. New York: City University of New York.
Allen, D., & Dadgar, M. (2012). Does Dual Enrollment Increase Students’ Success in College? Evidence from a Quasi-Experimental Analysis of Dual Enrollment in New York City. New Directions for Higher Education, 158, 11–19. Allison, P. D. (1984). Event history analysis: Regression for longitudinal event data. Beverly Hills, CA: Sage.
An, B.P. (2013). The Impact of Dual Enrollment on College Degree Attainment: Do Low-SES Students Benefit? Educational Evaluation and Policy Analysis 35(1): 57-75.
Angrist J.D. & Krueger A.B. (1992). Estimating the payoff to schooling using the Vietnam-era draft lottery. NBER Working Paper 4067, National Bureau of Economic Research, Cambridge, MA.
Arbuckle, J. L. (1996). Full information estimation in the presence of incomplete data. Advanced structural equation modeling: Issues and techniques 243: 277 Attewell P. & Lavin D.E. (2007). Passing the Torch: Does Higher Education for the Disadvantaged Pay Off Across the Generations? New York: Russell Sage Found.
Attinasi, L. C. (1989). Getting In: Mexican-Americans’ Perceptions of University Attendance and the Implications for Freshman Year Persistence. Journal of Higher Education 60: 247–277.
Austin, P. C. (2009). Balance Diagnostics for Comparing the Distribution of Baseline Covariates between Treatment Groups in Propensity-Score Matched Samples. Statistics in Medicine 28: 3083–107.
Austin, P.D. (2011).Optimal Caliper Widths for Propensity-Score Matching When Estimating Differences in Means and Differences in Proportions in Observational Studies. Pharmaceutical Statistics10: 150–61.
Bailey, T. R., and Karp, M. M. (2003). Promoting College Access and Success: A Review of Dual Credit and Other High School/College Transition Programs. Washington, DC: U.S. Department.
Baldridge, J.V. and Burnham, R.A. (1975). Organizational Innovation: Individual, Organizational, and Environmental Impacts. Administrative Science Quarterly 20 (June), 165-176.

142
Balla, Steven J. (2001). Interstate Professional Associations and the Diffusion of Policy Innovations. American Politics Research 29(3): 221-45. Baser, O. (2006). Too much ado about propensity score models? Comparing methods of propensity score matching. Value in Health : The Journal of the International Society for Pharmacoeconomics and Outcomes Research, 9(6), 377–85. doi:10.1111/j.1524-4733.2006.00130.x Baybeck, B., Berry, W. D., & Siegel, D. A. (2011). A Strategic Theory of Policy Diffusion via Intergovernmental Competition. Journal of Politics 73(1): 232–47. Berry, F. S. (1994a). Innovation in Public Management: The Adoption of Strategic Planning Public Administration Review, 54(4), 322–330. Berry, F. S. (1994b). Sizing Up State Policy Innovation Research. Policy Studies Journal, 22(3), 442–456. doi:10.1111/j.1541-0072.1994.tb01480.x. Berry, F. S., & Berry, W. D. (1990). State Lottery Adoptions as Policy Innovations: An Event History Analysis. The American Political Science Review, 84(2), 395–415. Berry, F. S., & Berry, W. D. (1992). Tax Innovation in the States: Capitalizing on Political Opportunity. American Journal of Political Science, 36(3), 715–742. Berry, F. S., and Berry W.D. (2007). Innovation and Diffusion Models in Policy Research. In P. A. Sabatier (Ed.), Theories of the Policy Process (2nd ed., pp. 223-260). Boulder, CO: Westview. Bettinger, E. P., & Long, B. (2005). Remediation at the Community College: Student Participation and Outcomes. New Directions For Community Colleges 129: 17-26. Bingham, R. D. (1977). The Diffusion of Innovation Among Local Governments. Urban Affairs Review, 13(2), 223–232. doi:10.1177/107808747701300205 Binz-Scharf, M. C., Lazer, D. M., and Mergel, I. (2012). Searching for Answers: Networks of Practice among Public Administrators. American Review of Public Administration 42(2): 202–25. Biondi-Zoccai, G., Romagnoli, E., Agostoni, P., Capodanno, D., Castagno, D., D’Ascenzo, F., Sangiorgi, G., Modena, M.G. (2011). Are propensity scores really superior to standard multivariable analysis? Contemporary Clinical Trials, 32(5), 731–40. Blanco, C. (2006). Policy Implications. In WICHE (Ed.) Accelerated Learning Options: Moving the Needle on Access and Success (pp. 73-82). Boulder: Western Interstate Commission for Higher Education. Borden, V. M. H., Taylor, J. L., Park, E., & Seiler, D. J. (2013). Dual credit in U.S. higher education: A study of state policy and quality assurance practices. Chicago: Higher Learning Commission. Braddock, J. & McPartland, J. M. (1993). Education of early adolescents. In L. Darling-Hammond (Ed.), Review of research in education (Vol. 19, pp. 135-170). Washington, DC: American Educational Research Association.

143
Brand, J. E. (2010). Civic returns to higher education. Sociological Forces 89:417–34. Brand, J. E., & Halaby, C. N. (2006). Regression and matching estimates of the effects of elite college attendance on educational and career achievement. Social Science Research 35: 749–770. doi:10.1016/j.ssresearch.2005.06.006 Brand, J.E. & Xie, Y. (2010). Who benefits most from college? Evidence for negative selection in heterogeneous economic returns to higher education. Am. Sociol. Rev. 75:273–302 Buckley, J. and Westerland, C. (2004). Duration Dependence, Functional Form, and Corrected Standard Errors: Improving EHA Models of State Policy Diffusion. State Politics and Policy Quarterly 4(1), 94-113. Byrd, K. L., and G. MacDonald. (2005). Defining College Readiness from the Inside Out: First-Generation College Student Perspectives. Community College Review 33: 22–37 Caliendo, M., & Kopeinig, S. (2008). Some practical guidance for the implementation of propensity score matching. Journal of Economic Surveys 22(1), 31–72. Carnevale, A.P., Smith, N. & Strohl, J. (2010). Help Wanted: Projections of Jobs and Education Requirements through 2018. Washington, D.C.: The Georgetown University Center on Education and the Workforce. Carnevale, A.P., Smith, N. & Strohl, J. (2013). Recovery: Job Growth and Education Requirements through 2020. Washington, D.C.: The Georgetown University Center on Education and the Workforce. Centra, J. A. & Potter, D. A. (1980). School and teacher effects: An interrelational model. Review of Educational Research, 50(2), 273-291. Chubb, J. E. & Moe, T. M. (1990). Politics, Markets and America’s Schools. Washington, D.C.: The Brookings Institution. Coleman, J. S., Campbell, E. Q., Hobson, C. J., McPartland, J., Mood, A., Weinfeld, F. D., and York, R. L. (1966). Equality of Educational Opportunity. Washington, D.C.: U.S. Government Printing Office. Colorado Department of Education. (2010). HB 09-1319 and SB09-285 Fact sheet: The concurrent enrollment programs act of 2009. Denver: CDE. Colorado Department of Higher Education. (2014). Annual report on concurrent enrollment 2012-2013 school year. Denver: CDHE. Colorado Department of Higher Education. (2016). 2015 Legislative report on remedial education. Denver: CDHE. Colorado Department of Higher Education. (2017a). 2017 Legislative report on the postsecondary progress and success of high school graduates. Denver: CDHE.

144
Colorado Department of Higher Education. (2017b). Annual report on concurrent enrollment 2015-2016 school year. Denver: CDHE. Colorado Department of Education. (2016). Concurrent Enrollment Policy & Example Practices. Denver: CDE. Retrieved from: https://www.cde.state.co.us/postsecondary/ce_poilcypractice Cook T.D., Shadish W.R., & Wong V.C. (2008). Three conditions under which experiments and observational studies produce comparable causal estimates: new findings from within- study comparisons. Journal of Policy Analysis and Management 27:724-750 Conley, D. 2005. College Knowledge. San Francisco: Jossey-Bass. Conley, D. 2007. Redefining College Readiness, Volume 3. Eugene, OR: Educational Policy Improvement Center. Conley, D. 2010. College and Career Ready. San Francisco: Jossey-Bass. Conley, D. (2013). Rethinking the Notion of 'Noncognitive'. Education Week 32(18), 20-21. Cowan, J., & Goldhaber, D. (2014). How much of a “Running Start” do dual enrollment programs provide students? (CEDR Working Paper 2014-7). Seattle: University of Washington. Crooks, K. A. 1998. “State Enhancement of College-Level Learning for High School Students: A Comprehensive National Policy Study and Case Studies of Progressive States.” PhD diss., State University of New York at Buffalo. Cyert, R.M. & March, J. G. (1973). A Behavioral theory of the firm. Englewood Cliffs, NJ.: Prentice-Hall. Darling-Hammond, L. (2010). The Flat World and Education: How America's Commitment to Equity Will Determine Our Futures. New York: Teachers College Press. Dehejia, R. H., & Wahba, S. (1999). Causal Effects in Nonexperimental Studies: Reevaluating the Evaluation of Training Programs. Journal of the American Statistical Association 94(448), 1053–1062. doi:10.1080/01621459.1999.10473858 Dehejia, R., & Wahba, S. (2002). Propensity score matching methods for nonexperimental causal studies. Review of Economics and Statistics 84(1), 151–161. Dickie, L. O., and J. E. Farrell. (1991). The Transition from High School to College: An Impedance Mismatch? The Physics Teacher 29(7): 440–445. Dreeben, R. (1987). Closing the divide: What teachers and administrators can do to help Black students reach their reading potential, American Educator, 11(4): 28-35. Eckstrom, R. & Villegas, A. M. (1991). Ability grouping in middle grade mathematics: Process and consequences. Research in Middle Level Education, 15(1): 1-20.

145
Education Commission of the States [ECS]. (2016). ECS State Policy Database. Denver, CO. Retrieved February, 11, 2017. Educational Policy Improvement Center. (2013). Metacognitive Learning Skills. Retreived from https://www.epiconline.org/Issues/metacognition/ Finley, M. K. (1984). Teachers and tracking in a comprehensive high school. Sociology of Education 57: 233-243. Fry, R. (2011). Hispanic college enrollment spikes, narrowing gaps with other groups. Washington, D.C.: Pew Hispanic Center. Funkhouser, E. (2009). The effect of kindergarten classroom size reduction on second grade student achievement: Evidence from California. Economics of Education Review, 28(3), 403–414. Garcia, E. (1993). Language, culture, and education. In L. Darling-Hammond (Ed.), Review of research in education (Vol. 19, pp. 51-98). Washington, DC: American Educational Research Association. Garrido, M. M., Kelley, A. S., Paris, J., Roza, K., Meier, D. E., Morrison, R. S., & Aldridge, M. D. (2014). Methods for constructing and assessing propensity scores. Health Services Research, 49(5), 1701–20. doi:10.1111/1475-6773.12182 Giani, M., Alexander, C., & Reyes, P. (2014). Exploring variation in the impact of dual-credit coursework on postsecondary outcomes: A quasi-experimental analysis of Texas students. The High School Journal 97:200-218. doi:10.1353/hsj.2014.0007 Gilardi, F., Füglister, K., & Luyet, S. (2009). Learning from Others: The Diffusion of Hospital Financing Reforms in OECD Countries. Comparative Political Studies 42(4): 549–73. Good, T. L. & Brophy, J. (1987). Looking in classrooms. New York: Harper and Row. Guo, S. & Fraser, M.W. (2010). Propensity Score Analysis: Statistical Methods and Applications (Advanced Quantitative Techniques in the Social Sciences Series). Sage Publications, Inc. Los Angeles, California. Hanushek, E. A. (1979). Conceptual and Empirical Issues in the Estimation of Educational Production Functions. The Journal of Human Resources, 14(3), 351-388. Hanushek, E. A. (1999). Some findings from an independent investigation of the Tennessee STAR experiment and from other investigations of class size effects. Education Evaluation and Policy Analysis, 21(2), 143–163. Hanushek, E. A. (2003) The Failure of Input-based Schooling Policies. The Economic Journal, 113, 64-98. Hausman, J., & Taylor, W. (1981). Panel data and unobservable individual effects. Econometrica: Journal of the Econometric Society, 49(6), 1377–1398. Retrieved from http://www.jstor.org/stable/10.2307/1911406

146
Heckman, J. J. (1979). Sample selection bias as a specification error. Econometrica, 47(1): 153–161. Heckman, J., Ichimura, H., and Todd, P. (1997). Matching as an econometric evaluation estimator: Evidence from evaluating a job training programme. Review of Economic Studes 64(4): 605-654. Heller, D. (1997). Student price response in higher education: An update to Leslie and Brinkman. Journal of Higher Education 68(6), pp. 624-659. Heller, D. E. (2006). State Support of Higher Education: Past, Present, and Future. In D. M. Priest, & E. P. St. John (Eds.), Privatization and Public Universities (pp. 1-7). Bloomington: Indiana University Press. Hernandez, D.J. (2011). How Third-Grade Reading Skills and Poverty Influence High School Graduation. Baltimore, MD: Annie E. Casey Foundation. Hofmann, E. (2012). Why dual enrollment? In Hofmann, E. & Voloch, D., eds., New Directions for Higher Education, no. 158, San Francisco, CA: Jossey-Bass. Hoffman, N. (2005). Add and subtract: Dual enrollment as a state strategy to increase postsecondary success for underrepresented students. Boston, MA: Jobs for the Future Hoffman, N., Vargas, J., & Santos, J. (2008a). On ramp to college: A state policymaker’s guide to dual enrollment. Boston, MA: Jobs for the Future. Hoffman, N., Vargas, J. and Santos, J. (2008b), Blending high school and college: Rethinking the transition. New Directions for Higher Education, 2008: 15–25. doi: 10.1002/he.322 Hout, M. (2012). Social and economic returns to college education in the United States. Annual Review of Sociology, 38(1), 379–400. doi:10.1146/annurev.soc.012809. 102503 Imbens, G. (2004) Nonparametric estimation of average treatment effects under exogeneity: a review. Review of Economics and Statistics 86(1): 4–29 Hoyman, M., & Weinberg, M. (2006). The Process of Policy Innovation: Prison Sitings in Rural North Carolina. Policy Studies Journal, 34(1), 95–112. doi:10.1111/j.1541-0072.2006.00147.x Jobs for the Future. 2006. Dual Enrollment in Rhode Island: Opportunities for State Policy. Report to the Statewide PK-16 Council. Boston: Jobs for the Future. Ka, S. & Teske, P. (2002). Ideology and Professionalism: Electricity Regulation and Deregulation over Time in the American States.” American Politics Research 30: 323-343. Kahlenberg, R. D. (Ed.) (2004) America's untapped resource: Low-income students in higher education. New York: Century Foundation Press. Kane, T., & Rouse, C. (1995). Labor-market returns to two-and four-year college. The American Economic Review, 85(3), 600–614. Retrieved from http://www.jstor.org/stable/10.2307/2118190
147
Karch, A. (2006). National Intervention and the Diffusion of Policy Innovations. American Politics Quarterly 34(4): 403-26. Karp, M. M. (2012). “I don't know, I've never been to college!” Dual enrollment as a college readiness strategy. New Directions for Higher Education, 158, 21–28. doi: 10.1002/he.20011 Karp, M. M., Bailey, T. R., Hughes, K. L., & Fermin, B. J. (2005). Update to state dual enrollment policies: Addressing access and quality. New York: Columbia University, Teachers College, Community College Research Center. Karp, M. M., Calcagno, J. C., Hughes, K. L., Jeong, D. W., & Bailey, T. R. (2007). The postsecondary achievement of participants in dual enrollment: An analysis of student outcomes in two states. St. Paul, MN: University of Minnesota. Kingston, P. W., Hubbard R., Lapp B., Schroeder P., Wilson J. (2003). Why education matters. Sociology of Education 76:53–70. Kirst, M.W., & Venezia, A. (2004). From high school to college: Improving opportunities for success in postsecondary education. San Francisco: Jossey-Bass, An Imprint of Wiley. Lange F. & Topel R. (2006). The social value of education and human capital. Handbook of the Economics of Education 1:459–509. Le, H., Casillas, A., Robbins, S., & Langley, R. (2005). Motivational and skills, social, and self-management predictors of college outcomes: Constructing the Student Readiness Inventory. Educational and Psychological Measurement, 65: 482–508. Lee, J. (2014). The mechanism of state charter school policy adoption: The case of American states. International Journal of Public Administration 37:1, 20-34. Lerner, J. B. & Brand, B. (2006). The college ladder: Linking secondary and postsecondary education for success for all students. Washington, DC: American Youth Policy Forum. Leslie, L. L., & Brinkman, P. T. (1987). Student price response in higher education. Journal of Higher Education, 58, 181-204. Lopez, J. (2011). Colorado’s P-20 Education Coordinating Council: 2007-2010. Denver: P-20 Education Coordinating Council. Lubell, M., Schneider, M., Sholz, J. T., & Mete, M. (2002). Watershed Partnerships and the Emergence of Collective Action Institutions. American Journal of Political Science, 46(1), 148–163. Makse, T., & Volden, C. (2011). The Role of Policy Attributes in the Diffusion of Innovations. Journal of Politics 73(1): 108–24. Margolis, H., & McCabe, P. P. (2004). Self-efficacy a key to improving the motivation of struggling learners. Clearing House, 77(6), 241.

148
Martin, T. C. (2013). Cognitive and noncognitive college readiness of participants in three concurrent-enrollment programs. Community College Journal of Research and Practice, 37(9), 704–718. Mas A. & Moretti, E. (2009). Peers at work. American Economic Review 99:112–45. Maurin E. & McNally S. (2008). Vive la revolution! Long-term educational returns of 1968 to the angry students. Journal of Labor Economics 26:1–33 Mitchell, M.N. and Chen X. 2005. Visualizing main effects and interactions for binary logit model. Stata Journal 5(1): 64-82. Mintrom, M. (1997). Policy Entrepreneurs and the Diffusion of Innovation. American Journal of Political Science, 41(3), 738–770. Mintrom, M., & Vergari, S. (1998). Policy Networks and Innovation Diffusion: The Case of State Education Reforms. The Journal of Politics, 60(1), 126–148. Mohr, L. (1969). Determinants of Innovation in Organizations. American Political Science Review 63(1), 111-126. Mokher, C. G., & Mclendon, M. K. (2009). Uniting Secondary and Postsecondary Education : An Event History Analysis of State Adoption of Dual Enrollment Policies. American Journal of Education, 115(2), 249–277. Morest, V.S., and Karp, M.M. (2006). Twice the Credit, Half the Time? The Growth of Dual Credit at Community Colleges and High Schools. In Bailey, T.R.& Morest V.S. (Eds.) Defending the Community College Equity Agenda, Baltimore: Johns Hopkins University Press.. Moretti E. (2012). The New Geography of Jobs. New York: Houghton Mifflin Harcourt. Morrison, M. C. (2008). The benefits of acceleration: Graduation advantages. Mason City, IA: North Iowa Area Community College. Mosteller, F. (1995). The Tennessee study of class size in the early school grades. The Future of Children, 5(2), 113-127. National Center for Higher Education Management Systems. (2013, February 1). Presentation to the Colorado Commission on Higher Education, February 1, 2013. National Concurrent Enrollment Partnership [NACEP]. (2011). NACEP Concurrent Enrollment Partnership Standards. Chapel Hill, NC. Retrieved from: http://nacep.org/docs/standards/NACEP-Standards-2011.pdf National Concurrent Enrollment Partnership [NACEP]. (2017). NACEP in State Policy. Chapel Hill, NC. National Conference of State Legislatures. (2016). No Time to Lose: How to Build a World-Class Education System State-by-State. Denver, CO: NCSL.

149
National Student Clearinghouse. (2013). Clearinghouse Facts. Retrieved from http://www.studentclearinghouse.org/about/clearinghouse_facts.php Oakes, J. (1993). Ability grouping, tracking, and within-school segregation in the San Jose Unified Shool District. Los Angeles: UCLA. Oakes, J. (2005). Keeping track: How school structure inequality (2nd ed). New Haven, CT: Yale University Press. Peikes, D. N., Moreno, L., & Orzol, S. M. (2008). Propensity score matching: A note of caution for evaluators of social programs. The American Statistician, 62(3), 222-231. Pelavin, S. H. & Kane, M. (1990). Changing the odds: Factors increasing access to college. New York: College Entrance Examination Board. Peterson, P. (1989). Remediation is no remedy. Educational Leadership, 46(60), 24-25. Purkey, S. C., & Smith, M. S. (1983). Effective Schools: A Review. The Elementary School Journal, 83(4), 426–452. Putnam, R. D. (1995). Tuning In, Tuning Out: The Strange Disappearance of Social Capital in America. Political Science and Politics 28(4):664-83. Radunzel, J. & Noble, J. (2012). Predicting Long-Term College Success through Degree Completion Using ACT® Composite Score, ACT Benchmarks, and High School Grade Point Average. Iowa City, IA: ACT, Inc. Reville, P. (2014). Stop the tinkering: We need a new K-12 engine. Education Week, April 23, 28. Robbins, S., Allen, J., Casillas, A., Peterson, C., & Le, H. (2006). Unraveling the differential effects of motivational and skills, social, and self-management measures from traditional predictors of college outcomes. Journal of Educational Psychology, 98: 598-616. Robbins, S., Lauver, K., Le, H., Langley, R., Davis, D., & Carlstrom, A. (2004). Do psychosocial and study skill factors predict college out-comes? A meta-analysis. Psychological Bulletin, 130: 261–288. Rogers, E.M. (2003). Diffusion of Innovations (5th Ed.). New York: The Free Press. Roksa, J. (2008). Structuring access to higher education: The role of differentiation and privatization. Research in Social Stratification and Mobility, 26(1), 57–75. doi:10.1016/j.rssm.2007.11.002 Rosenbaum, P.R. (2002). Observational Studies (2nd ed.). New York: Springer. Rosenbaum, P.R. & Rubin, D.R. (1985). Constructing a Control Group using Multivariate Matched Sampling Methods That Incorporate the Propensity Score. The American Statistician 39(1): 33–8. Rubin, D. B. (1974). Estimating causal effects of treatments in randomized and nonrandomized studies. Journal of Educational Psychology, 66:688–701.

150
Rubin, D. B. (1997). Estimating causal effects from large data sets using propensity scores. Annals of Internal Medicine, 127(8), 757–763. Rutschow, E. Z., & Schneider, E. (2011). Unlocking the gate: What we know about improving developmental education. New York: MDRC. Sawyer, R. (2010). Usefulness of high school average and ACT scores in making college admission decisions. (ACT Research Report No. 2010-2). Iowa City, IA: ACT, Inc. Schneider, B., Carnoy, M., Kilpatrick, J., Schmidt, W. H., & Shavelson, R. J. (2007). Estimating Causal Effects Using Experimentaland Observational Designs. Washington, D.C.: American Educational Research Association. Shadish W.R., Clark M.H., & Steiner P.M. (2008). Can nonrandomized experiments yield accurate answers? A randomized experiment comparing random to nonrandom assignment. Journal of the American Statistical Association 103:1334-1343. Shadish, W. R., & Steiner, P. M. (2010). A Primer on Propensity Score Analysis. Newborn and Infant Nursing Reviews, 10(1), 19–26. doi:10.1053/j.nainr.2009.12.010 Shah B.R., Laupacis A., Hux J.E., & Austin P.C. (2005). Propensity score methods gave similar results to traditional regression modeling in observational studies: a systematic review. Journal of Clinical Epidemiology 58:550-559. Shields, N. (2002). Anticipatory Socialization, Adjustment to University Life, and Perceived Stress: Generational and Sibling Effects. Social Psychology of Education 5: 365–392. Shipan, C. R., & Volden, C. (2008). The Mechanisms of Policy Diffusion. American Journal of Political Science, 52(4), 840–857. Shipan, C. R. & Volden, C. (2012). Policy Diffusion: Seven Lessons for Scholars and Practitioners. Public Administration Review, 72(6), 788–796. doi:10.111/j.1540-6210.2012.02610.x.788 Singleton, R. A. Jr., and Straits, B. C. (2010). Approaches to Social Research (5th ed.). New York, NY: Oxford University Press. Smith, A. A. (2016). Community College Enrollments Drop. Inside Higher Ed. Oct. 18. Retrieved from: www.insidehighered.com/news/2016/10/18/community-colleges-examining-low-and-stagnant-enrollments. Smith, J. A., & Todd, P. E. (2005). Does matching overcome LaLonde’s critique of nonexperimental estimators? Journal of Econometrics 125: 305–353). doi:10.1016/j.jeconom.2004.04.011 Soule, S. A. and Earl, J. (2001). The Enactment of State-Level Hate Crime Law in the United States: Intrastate and Interstate Factors. Sociological Perspectives 44, 281-305. Speroni, C. (2011). Determinants of Students’ Success: The Role of Advanced Placement and Dual Enrollment Programs. New York, NY: National Center for Postsecondary Research, Teachers College, Columbia University.

151
St. John, E. P. (1990). Price response in enrollment decisions: An analysis of the high school and beyond sophomore cohort. Research in Higher Education, 31(2), 161-176. Stream, C. (1999). Health reform in the states: A model of state small group health insurance market reform. Political Research Quarterly 53, 499-525. Strong American Schools. (2008). Diploma to Nowhere. Washington D.C.: Strong American Schools. Swanson, J. (2008). An analysis of the impact of high school dual enrollment course participation on post-secondary academic success, persistence and degree completion. Paper presented at the meeting of the National Association for Gifted Children, Tampa, FL and the National Alliance of Concurrent Enrollment Partnerships, Kansas City, MO. Talbert, J. E. (1990). Teacher tracking: Exacerbating inequalities in the high school. Stanford, CA: Center for Research on the Context of Secondary Teaching, Stanford University. Terenzini, P. T., Cabrera, A. F., & Bernal, E. M. (2001). Swimming Against the Tide : The Poor in American Higher Education. New York City: College Entrance Examination Board. Titus, M. A. (2007). Detecting selection bias, using propensity score matching, and estimating treatment effects: An application to the private returns to a Master’s degree. Research in Higher Education, 48(4), 487–521. doi:10.1007/sl U.S. Department of Education, Institute of Education Sciences, What Works Clearinghouse. (2017). Transition to College intervention report: Dual Enrollment Programs. Retrieved from https://whatworks.ed.gov U.S. Department of Education, National Center for Education Statistics. (2006) Second Follow–up, 2006. Education Longitudinal Study of 2002 (ELS:2002). Venezia, A., Kirst, M., & Antonio, A. (2003). Betraying the college dream: How disconnected K-12 and post-secondary education systems undermine student aspirations. Palo Alto, CA: The Bridge Project, Stanford Institute for Higher Education Research. Volden, C. (2006). States as Policy Laboratories: Emulating Success in the Children’s Health Insurance Program. American Journal of Political Science 50 (2), 294–312. Volden, C., Ting, M. M., & Carpenter, D.P. (2008). A Formal Model of Learning and Policy Diffusion. American Political Science Review 102(3): 319–32. Walberg, H. (1982) What makes schooling effective. Contemporary Education: A Journal of Review, 1, 22-34. Walker, J. L. (1969). The Diffusion of Innovations among the American States. The American Political Science Review, 63(3), 880–899. Ward, D. S. & Vargas, J. (2012). Using Dual Enrollment Policy to Improve College & Career Readiness. A Web Tool for Decision Makers. Boston, MA: Jobs For the Future.

152
Welch, S., & Thompson, K. (1980). The Impact of Federal Incentives on State Policy Innovation. American Journal of Political Science 24(4): 715-26. Wenglinsky, H. (2002). How schools matter: The link between teacher classroom practices and student academic performance. Educational Policy Analysis Archives, 10(2). Williams, R. (2012). Using the margins command to estimate and interpret adjusted predictions and marginal effects. Stata Journal 12: 308–331. Winship, C., & Morgan, S. L. (1999). The estimation of causal effects from observational data. Annual Review of Sociology, 25, 659-707. Wong, K. K., & Shen, F. X. (2002). Politics of State-Led Reform in Education: Market Competition and Electoral Dynamics. Educational Policy (Vol. 16, pp. 161–192). doi:10.1177/0895904802016001009 Wooldridge, J. M. (2010). Econometric Analysis of Cross Section and Panel Data. 2nd ed. Cambridge, MA: MIT Press. Zinth, J. D. (2014a). Dual enrollment: A strategy to improve college-going and college completion among rural students. Denver, CO: Education Commission of the States. Zinth, J. D. (2014b). Increasing Student Access and Success in Dual Enrollment Programs: 13 Model State-Level Policy Components. Denver, CO: Education Commission of the States. Zinth, J. D. (2015a). Dual Enrollment Course Content and Instructor Quality. Denver, CO: Education Commission of the States. Zinth, J. D. (2015b). State Approaches to Funding Dual Enrollment. Denver, CO: Education Commission of the States. Ziomek, R. L., & Svec, J. C. (1995). High school grades and achievement: Evidence of grade Inflation (Research Rep. No. 95–3). Iowa City, IA: ACT.