Embed Size (px)
Citation preview

This is an electronic reprint of the original article.This reprint may differ from the original in pagination and typographic detail.
Powered by TCPDF (www.tcpdf.org)
This material is protected by copyright and other intellectual property rights, and duplication or sale of all or part of any of the repository collections is not permitted, except that material may be duplicated by you for your research use or educational purposes in electronic or print form. You must obtain permission for any other use. Electronic or print copies may not be offered, whether for sale or otherwise to anyone who is not an authorised user.
Olivieri, Hylton; Seppänen, Olli; Alves, Thais da C. L.; Scala, Natalie; Schiavone, Vincent; Liu,Min; Granja, Ariovaldo DenisSurvey comparing Critical Path Method, Last Planner System, and Location-Basedtechniques
Published in:JOURNAL OF CONSTRUCTION ENGINEERING AND MANAGEMENT: ASCE
DOI:10.1061/(ASCE)CO.1943-7862.0001644
Published: 01/12/2019
Document VersionPeer reviewed version
Please cite the original version:Olivieri, H., Seppänen, O., Alves, T. D. C. L., Scala, N., Schiavone, V., Liu, M., & Granja, A. D. (2019). Surveycomparing Critical Path Method, Last Planner System, and Location-Based techniques. JOURNAL OFCONSTRUCTION ENGINEERING AND MANAGEMENT: ASCE, 145(12), [04019077].https://doi.org/10.1061/(ASCE)CO.1943-7862.0001644
A survey comparing Critical Path Method, Last Planner System, and 1
Location-Based techniques 2
Hylton Olivieri1, Olli Seppänen 2, Thais da C. L. Alves 3, Natalie Scala4, Vincent Schiavone5, 3
Min Liu6, Ariovaldo Denis Granja7 4
Abstract 5
In construction, the most relevant systems used for project management (PM) and 6
project production management (PPM) in the planning and control phases are: Critical Path 7
Method (CPM), Last Planner System® (LPS®), and Location-Based techniques (LB). Studies 8
have addressed these systems, mostly in isolated fashions. This study aims to compare and 9
contrast their use in terms of PM and PPM and clarify industry benefits in order to eliminate 10
potential misunderstandings about their use. A survey was administered to construction 11
professionals in Brazil, China, Finland, and the United States. No single system addresses all 12
needs of PM and PPM. CPM is the dominant system when considering these characteristics: 13
primary industry types, type of organization, size of organization, professional position within 14
the organization, and area of work. Contributions to knowledge include that CPM is a contract 15
requirement with perceived benefits associated with critical path analysis; LB and LPS have 16
perceived benefits regarding continuous flow and use of resources, treatment of interferences, 17
and improving production control. All systems were found to have a similar level of benefits 18
for management of contracts, delay and change, and evaluation of the root causes of delays. 19
The industry can benefit from aligning project scheduling methods with project needs. 20
21
1Former Postdoctoral Fellow, Aalto University, Finland, [email protected] 2Professor of Practice, Aalto University, Finland, [email protected] 3Associate Professor, San Diego State University, United States, [email protected] (corresponding author) 4Assistant Professor, Towson University, United States, [email protected] 5 Graduate Assistant, Towson University, United States, [email protected] 6Associate Professor, North Carolina State University, United States, [email protected] 7Associate Professor, University of Campinas, Brazil, [email protected]
Manuscript Click here to access/download;Manuscript;30July2019-SchedulingMethods-Manuscript.docx

Keywords: Construction; Scheduling; Critical Path Method; Last Planner System; 22
Location-based systems 23
Introduction 24
Several systems have been used by project teams to plan, schedule and control projects 25
and production. Due to their importance and being widely recognized by industry and 26
academia, currently the most relevant systems are the Critical Path Method (CPM), Location-27
Based techniques (LB), and the Last Planner® System (LPS), which have been used for several 28
decades. CPM has been applied in construction projects since 1960s (Burns et al. 1996) and in 29
all types of projects (e.g. Hegazy 2005, Shi and Blomquist 2012). It is the most common 30
system used in the United States and United Kingdom for planning and controlling projects 31
(Galloway 2006, Olawale and Sun 2015). Additionally, LB techniques have been used since 32
1929 in innovative projects such as the Empire State Building (Willis and Friedman 1998). 33
Since then, these techniques have been applied in many projects and countries, such as Finland 34
and Brazil, where they are widely used as production planning and control tools (e.g. Kemmer 35
et al. 2008, Lucko et al. 2014). Similarly, LPS has been implemented since 1993 (Ballard 2000) 36
in construction projects around the world (e.g. Alsehaimi et al. 2014), and it is one of the most 37
discussed topics in the conferences of the International Group for Lean Construction (IGLC). 38
Previous studies have investigated the use of CPM (e.g. Tavakoli and Riachi 1990, 39
Galloway 2006), LPS (e.g. Fernandez-Solis et al. 2013, Khanh and Kim 2014), and LB (e.g. 40
Kim et al. 2014) among construction companies and professionals, exploring the observed 41
benefits and limitations of these systems. However, these studies are usually focused on only 42
one system and limited to a specific country, whereas this study obtained data from four 43
different countries as indicated later. Additionally, this paper seeks to distinguish how these 44
systems are used to manage projects versus managing production and identify their perceived 45

benefits as indicated by practitioners. The definitions adopted for Project Management (PM) 46
and Project Production Management (PPM) are considered as follows. 47
Project Management (PM) considers the management of contracts and contractual 48
requirements, including but not limited to the relationship between project stakeholders (e.g., 49
clients, contractors, designers, suppliers, regulatory agencies) and their rights and 50
responsibilities to deliver the project considering its overall requirements. In general, the PMI 51
(2013) indicates that PM addresses five main process groups comprising the life cycle of a 52
project: 1) initiating, 2) planning, 3) executing, 4) monitoring and controlling, and 5) closing. 53
“Project management develops and implements plans to achieve a specific scope that is driven 54
by the objectives of the program or portfolio it is subjected to and, ultimately, to organizational 55
strategies” (PMI 2013, p.7). In the United States, for instance, construction projects usually 56
have project executives, project managers, and project engineers who oversee these areas for 57
the entire project (or subsections of it) and serve as the connection between the owner and those 58
involved in designing, inspecting, and building the project. 59
Project production management (PPM) can be viewed as a subset of project 60
management, which focuses more specifically on operations management. This includes but is 61
not limited to production flow management and control; specifically, how tasks are defined, 62
executed, and controlled where they are executed. PPM focuses on the resources, means and 63
methods of production, and their organization to deliver value to the client. To illustrate this 64
focus on production and operations management, Schmenner (1993, p. 2) provides the 65
following explanation about tasks associated with operations management: “The operations 66
function itself is often divided into two major groupings of tasks: line management and support 67
services. Line management generally refers to those managers directly concerned with the 68
manufacture of the product or the delivery of the service. They are the ones who are typically 69
close enough to the product or service that they can “touch it”.(…) Support services (…) carry 70

titles such as quality control, production planning and scheduling, purchasing, inventory 71
control, production control (…)”. In the construction industry in the United States, these roles 72
are usually attributed to superintendents, field engineers, and foremen who are in direct contact 73
with field resources used to deliver the project. 74
The aim of this study is to compare and contrast the use of CPM, LB and LPS in terms 75
of how they support PM and PPM, using the results obtained through a questionnaire survey 76
from four countries: Brazil, China, Finland and the United States. The research objective is to 77
identify the perceived benefits associated with each method from practitioners’ perspectives. 78
This research is divided into three parts. First, a comprehensive review of relevant literature 79
was done for each of the three systems (CPM, LB and LPS), providing the basis for the 80
definition of ten hypotheses, which are presented in the first sections. Second, in order to test 81
the hypotheses, an on-line questionnaire survey (see supplemental document with the 82
questionnaire) was applied to gather quantitative data. The hypotheses were statistically tested 83
and are discussed. Finally, conclusions are presented, and future research is suggested. 84
Planning and control systems 85
CPM is a planning, scheduling and control method (Kelley and Walker 1959) widely 86
used in construction projects (e.g. Galloway 2006, Benjaoran et al. 2015). This method includes 87
defining logical relationships between activities and using the CPM algorithm to identify the 88
longest path (the critical path) through the network (Kelley and Walker 1959). It is a 89
diagrammatic representation of a plan, presented as an arrow diagram (activity-oriented 90
network) or as a precedence diagram (event-oriented network) (Antill and Woodhead 1990). 91
In current practice, the plans and schedules are usually developed with globally available 92
software packages such as Microsoft Project®, Primavera®, Asta PowerProject, or local 93
packages such as TCM Planner in Finland, which make it possible to plan and visualize the 94
schedules in either precedence diagram or Gantt chart formats. The availability of planning and 95

scheduling software packages has contributed to the widespread use of this method (Hegazy 96
and Menesi 2010, Bragadin and Kähkönen 2016). However, CPM has been considered 97
inappropriate for PPM (Howell and Ballard 1994, Koskela et al. 2014) and criticized due to its 98
shortcomings on generating continuous workflows (Arditi et al. 2002, Olivieri et al. 2018), 99
improving crew balancing (Russell and Wong 1993, Hamzeh et al. 2015) and facilitating the 100
continuity of resources usage such as labor, material, and equipment (Mattila and Park 2003, 101
Benjaoran et al. 2015, Olivieri et al. 2018). Furthermore, the CPM method does not clearly 102
address interferences between activities (Laufer and Tucker 1987) or uncertainties and 103
constraints related to tasks (Koskela and Howell 2002, Hamzeh et al. 2012). 104
Linear, repetitive, and location-based scheduling systems (LB) form a family of 105
workflow-oriented scheduling methods (Lucko et al. 2014), which use locations (e.g. towers, 106
floors or rooms) as fundamental planning elements. Several different methods exist in this 107
category. For example, Harris and Ioannou (1998) introduced the Repetitive Scheduling 108
Method (RSM) named as such because construction is usually characterized by repetition. 109
Other methods include flowline, line-of-balance (Lumsden 1968), linear scheduling (Johnston 110
1981), takt planning (e.g. Frandson et al. 2013) and the Location-Based Management System 111
(e.g. Kenley and Seppänen 2010). In addition to planning and scheduling, these tools can 112
include controlling tools such as control charts or forecasts, providing the ability to plan control 113
actions. Location-based methods can be used manually or by using software tools such as 114
Excel, Vico Schedule Planner, TCM Planner, TILOS and DynaRoad. However, based on our 115
literature review, LB has not normally been associated with the management of delays and 116
changes. In addition, although LB tools are frequently required by owners for subcontractors 117
as a way to determine common goals for the crews (Galloway 2006), the literature does not 118
identify LB tools as a contractual obligation. Overall, the literature suggests that LB 119

emphasizes PPM benefits but also includes some PM functions such as time and location 120
management and dissemination of information (Kenley and Seppänen 2010, Lucko et al. 2014). 121
LPS considers planning and controlling as a social process focused on collaborative 122
planning, reliable commitments, and continuous learning (Ballard 2000). The system contains 123
five main elements which are used to connect the long, medium, and short-term planning levels 124
(e.g. Ballard 1997, Ballard 2000, Koskela et al. 2010): 1) master planning or milestones 125
schedule; 2) phase scheduling, which is the division of the master planning in phases and can 126
be considered the link between the long and medium term plans; 3) look ahead planning, which 127
drives actions on detailing activities and addressing constraints; 4) weekly work plan or 128
commitment planning, where the weekly plan is detailed and root causes for failures are 129
identified and treated and; 5) learning, percentage of plan completed (PPC), which is a metric 130
comparing what was planned with what was completed. LPS focuses on improving the 131
reliability of plans by implementing a social process where plans are collaboratively created 132
and transparent metrics are used to identify the reliability of commitments. LPS includes a 133
continuous learning process where every broken commitment is analysed with a root cause 134
analysis to ensure that the problem does not happen again (Ballard 2000). However, differently 135
from CPM, LPS is usually not a contractual requirement, and shortcomings have been reported 136
about its use in long term planning (Huber and Reiser 2003). In addition, based on our literature 137
review, LPS has not been associated with the management of delays, changes, or contracts in 138
construction. Thus, we would assume that the users of LPS would emphasize benefits related 139
to PPM but not so much those related to contract or change management. 140
Project and production management in construction 141
This section presents the literature review used to develop the hypotheses considered 142
in this study. It starts with a discussion about the use of CPM in construction projects, followed 143
by potential explanations for its widespread use in the construction industry. Additional claims 144

supported by the literature are made regarding the use of LB and LPS, and related hypotheses 145
are presented. Additionally, the hypotheses address received traditions from the field of project 146
management (e.g., CPM use as a contractual requirement) and how these materialize in 147
construction projects (e.g., use of CPM to manage delays and claims). 148
Considering the vast documentation of CPM use in the literature, and also based on the 149
authors’ experiences, CPM is usually a contractual requirement in the United States (Galloway 150
2006) and it is largely used by contractors to address owners’ requests for a baseline schedule 151
once the project is awarded (e.g. Tavakoli and Riachi 1990). Thus, we hypothesize that: 152
Hypothesis 1 (H1): CPM is frequently used due to contractual requirements. 153
CPM was developed to organize the schedule activities toward a common goal, defining 154
orders of the activities based on project technological requirements and using resources to 155
determine durations of activities (Kelley and Walker 1959). The main output of a schedule is 156
a long-term plan. In CPM, based on the order of activities, managers can define prioritizations 157
about what work must be done first and in which sequence (Meredith and Mantel 2012). The 158
critical path, which results from the calculations of the CPM algorithm, provides information 159
about the longest path to complete a project and identifies activities for which a delay can 160
impact the overall end date (Orouji et al. 2014). Previous research about the use of CPM (e.g. 161
Galloway 2006) has not asked the respondents whether logic links are used in most or all of 162
the tasks in their schedules. Therefore, the following hypothesis about the perceived association 163
of CPM and critical path analysis is not trivial: 164
H2: CPM is the tool of choice for critical path analysis. 165
In construction, CPM has been used for strategic decisions and as a contract 166
management tool (Galloway 2006). For example, after the definition of the project duration, 167
cost can be allocated to the activities, creating a connection between the CPM schedule and 168
Earned Value Analysis (EVA) and facilitating project performance analysis (e.g. Brown 1985, 169

Sears et al. 2015). In light of the characteristics identified in the literature about CPM use, we 170
hypothesize the following relationships between CPM and PM tasks: 171
H3: CPM is used to support the management of contractual requirements (e.g. schedule, 172
preconstruction tasks, estimating/bidding, project understanding). 173
CPM has been used to analyse delays and changes (e.g. Arditi and Pattanakitchamroon 174
2006, Yang and Kao 2012), providing an early warning system for delay mitigation (Al-175
Reshaid et al. 2005). Furthermore, in the United States, CPM has been accepted by courts as a 176
proper tool for delay analysis (Levin 1998). Thus, we hypothesize that: 177
H4: CPM is used to support the management of delays and claims. 178
Different from what is indicated in the literature for CPM schedules, the goal of LB 179
systems is to achieve continuous flow, maximize the continuous use of labour, improve 180
productivity, balance production, and improve the visualization of schedules. For example, the 181
LBMS algorithm simplifies the schedules by focusing on repetitive tasks, logic-patterns, and 182
heuristics to enable continuous workflow (Kenley and Seppänen 2010). LB schedules are 183
usually developed based on the order of activities, take into consideration productivity rates of 184
the resources, and define a long-term plan, which will be monitored during the control phase. 185
The focus consists in achieving better workflow and better use of the resources, generating by 186
consequence lower interruptions in production (Kenley and Seppänen 2010) and increasing 187
productivity and production control (Lucko et al. 2014). Through the analysis of the project 188
performance, which can be more visible in LBs, root causes of delays are investigated, aiming 189
to solve production problems (Kenley and Seppänen 2010). Accordingly, we propose the 190
following hypotheses: 191
H5: LB use is credited with generating continuous flow and improving the use of 192
resources. 193
H7A: LB is credited with supporting and improving production control. 194

H8A: LB is credited with supporting and improving the identification of the root causes 195
of delays. 196
Alternatively, LPS emphasizes that activities are inter-related and interfere with one 197
another and have uncertainties and constraints, such as resources availability and preconditions 198
of work, which must be treated before the work starts (Ballard 2000). LPS applies collaborative 199
planning concepts, where workers are involved in the definition of common goals of the 200
production system they are part of, and in a discussion of how to improve their productivity 201
(Ballard 2000). Reported LPS benefits includes reduction of uncertainty and constrains (e.g. 202
Ballard 2000), increased workflow reliability (e.g. Fiallo and Revelo 2002, Olano et al. 2009, 203
Fernandez-Solis et al. 2013), fewer day-to-day problems (e.g. Kim et al. 2007), identification 204
of the root causes of delays (e.g. Ballard 2000), and improved production control (Ballard and 205
Howell 1998). 206
Considering these arguments about LPS, we propose the following hypotheses: 207
H6: LPS is credited with supporting and improving the analysis of constraints. 208
H7B: LPS is associated with supporting and improving production control. 209
H8B: LPS is credited with supporting and improving the identification of the root 210
causes of delays. 211
While all the reported CPM benefits are related to PM topics, such as delays and change 212
management, the reported benefits of LPS and LB are mostly related to PPM topics, such as 213
generating workflow, reducing waste, and improving productivity. Therefore, we would 214
expect, that the users of CPM perceive benefits related to PM but see challenges with PPM. 215
The users of LPS and LB are expected to follow the opposite pattern and emphasize benefits 216
related to PPM. Thus, based on the evidence from the literature review, it is assumed that while 217
the users of CPM might emphasize PM related functions, practitioners using LPS and LB might 218

emphasize PPM functions, given the fundamental focus and use of each tool. Accordingly, we 219
hypothesize the following: 220
H9: The perceived benefits of CPM by users are mostly related to the PM approach. 221
H10: The perceived benefits of LB and LPS by users are mostly related to the PPM 222
approach. 223
Figure 1 shows the hypotheses and summarizes the two main lines of work addressed 224
in the literature review, Project Management and Project Production Management, how the 225
systems discussed relate to each, and what functions they support (e.g. contractual 226
management, management of delay and change, and promotion of continuous workflow). A 227
project manager is usually required to manage the effective implementation of planning, 228
scheduling, estimating and cost control, contract management and purchasing (Edum-Fotwe 229
and McCaffer 2000). Thus, in this paper, topics identified as contract management, such as 230
scheduling and time control, were grouped into PM topics, namely: contractual requirement, 231
critical path analysis, managing contracts, and management of delays and change. On the other 232
hand, topics identified as production control were grouped in PPM topics, namely continuous 233
flow and resources, reduction of uncertainty and constrains, identification of root causes of 234
delays, and improvement of production control. The same approach was used when identifying 235
questions related to each topic. Thus, while questions related to contract management, 236
scheduling and time control were correlated with PM topics, questions exploring production 237
control aspects were correlated with PPM topics. 238
Insert Figure 1 about here 239
240
Research method 241
In this paper, the survey research design process suggested by Forza (2002) was 242
adopted, containing six steps: 1) link to the theoretical level, 2) design, 3) pilot test, 4) collect 243

data for theory testing, 5) analyse data, and 6) generate report. In general, a survey is a 244
collection of information from individuals (Rossi et al. 2013). Additionally, before the data 245
collection started, a research protocol was submitted to the Institutional Review Board at 246
Towson University (protocol # 1612011775) and approved. 247
Based on the literature review, the unit of analysis defined was the production planning 248
and controlling systems CPM, LB, and LPS. The hypotheses were proposed based on the 249
literature review. Aiming to test the hypotheses and gather quantitative data, a questionnaire 250
survey was developed. To gain focus, reduce variation and simplify analysis, purposeful 251
sampling was adopted for the case selection approach (Patton 1990). Architects, engineers, and 252
construction managers working with construction management were defined as the target. 253
Brazil, China, Finland, and the United States were selected as primary data collection countries; 254
these countries have several documented case studies of each type of planning and controlling 255
system. Furthermore, collecting data across multiple countries can allow for future work of 256
cross-culture analysis. 257
The first draft of the questionnaire was developed in English language. The questions 258
were proposed based on the literature review and previous research of Tavakoli et al. (1990), 259
Galloway (2006), and Khan and Kim (2015). After that, the questions were validated by a team 260
formed by professionals from Aalto University (Finland), San Diego State University (USA), 261
Towson University (USA), North Carolina State University (USA) and University of Campinas 262
(Brazil), which are working in a wider research effort investigating management in 263
construction. A pilot test with five master’s students in Brazil and ten master’s students in the 264
United States was done, and after gathering feedback from these students, adjustments were 265
made, such as logic rules and definitions, contributing to the modification and finalization of 266
the document. The questionnaire was then translated to Portuguese, Chinese, and Finnish 267
languages, and two native speakers in each language validated each version. 268

The final version of the questionnaire is structured in four parts (see supplemental 269
document). The first section contains questions about professional experience in production 270
planning and control systems, companies, and culture. At the end of section 1, respondents 271
were able to select the systems they had experience with (CPM, LPS, and/or LB). Aiming to 272
facilitate the respondents’ understanding of the systems and reducing possible doubts about the 273
concepts related to them, a brief description of each system was inserted in the beginning of 274
the survey. The questionnaire was configured to show only questions about the system that the 275
respondent selected. For example, if the respondent indicated the use of CPM and LB, only 276
questions about CPM and LB were presented to be answered. Sections 2, 3 and 4 of the survey 277
contain questions about CPM, LPS, and LB, respectively. The online platform Qualtrics was 278
used as the survey software (Qualtrics 2017). 279
Considering that directly interviewing each of the 500+ anonymous respondents and 280
also directly observing their use of each tool is not feasible, a survey was used to capture their 281
opinions and perceptions. Although this is a limitation, this paper offers the construction 282
engineering and management community a discussion based on what is stated (broadly) in the 283
literature and what practitioners themselves experience. Claims stated in the literature reviewed 284
are based on either smaller samples than what is reported in this paper or observations from a 285
much smaller number of examples. To our knowledge, this is the first study comparing these 286
three systems using a single instrument, with similar survey language for all three methods 287
(covering uses, advantages, disadvantages), and translated to four different languages in order 288
to address practices on different continents (Asia, Europe, and North/South America). 289
A goal of 100 valid responses from each country was established by the research team 290
to support the validity of findings. Moreover, by targeting 100 responses per country normality 291
was assumed, via the Central Limit Theorem (CLT), and allowing for variation without 292
misrepresentation of outliers as trends. Additionally, the team used Galloway’s (2006) research 293

on a similar topic published in this journal, as a comparator. Her study had over 400 responses, 294
like the present one, and different organizations were also contacted to help and distribute the 295
survey. Similar to our study, Galloway (2006) did not indicate the total population numbers to 296
compare to the 430 responses obtained, as it would not be feasible to determine the entire 297
population of construction industry practitioners who could be potentially targeted by these 298
surveys in four different countries. 299
Furthermore, the authors did not use any incentive to promote or increase the response 300
rate; no specific organization or field was targeted by the authors to avoid any bias in the 301
responses received. 302
The survey was distributed via many channels: 1) the survey link was posted by the 303
research team in social media platforms such as LinkedIn and Research Gate, 2) construction 304
industry institutes in the four countries were asked to distribute the survey among companies 305
and construction management professionals, 3) construction companies and universities were 306
contacted to share the survey link with their employees, 4) the research team shared the survey 307
link with their own professional network. The survey was distributed and remained open for 308
collecting data during six months, from January to June of 2017. 309
After finalizing the data collection, data was treated and cleaned through the following 310
steps: 1) data was exported from Qualtrics to the software IBM® SPSS® Statistics 25 (IBM 311
2018); 2) a unique SPSS file was created, containing data from the four countries; 3) aiming to 312
track responses, a code number was inserted for each response; 4) aiming to facilitate analysis, 313
unnecessary columns were excluded, such as dates of responses, and remaining columns were 314
renamed, replacing codes by titles (e.g., country, industry, position); 5) responses were 315
excluded if the respondent did not accept the terms of the survey; 6) as the focus was the four 316
countries, responses were excluded if where the respondent was working in a country other 317
than Brazil, China, Finland or the United States; 7) responses were excluded where the 318

respondent had not selected at least one planning and controlling system (CPM, LPS, or LB). 319
Furthermore, during data cleaning, it was discovered that a logic error existed in the Chinese 320
translation of the survey, which resulted in no system questions appearing for respondents who 321
chose LPS as a system used. Therefore, 54 Chinese participants who had selected LPS as a 322
system did not see any follow-up questions; data for that system in that country was not 323
collected. To ensure consistency in comparative analysis, all Chinese respondents who 324
selected LPS as a method were removed from the data. There were other cases with missing 325
data. Much of the missing data was random but survey fatigue caused some systematically 326
missing data where respondents dropped out of the survey in the middle and did not answer 327
remaining questions. Respondents were not forced to answer any question in the survey that 328
was specific to a method, and some respondents simply skipped questions that were presented 329
to them. In analysis, these missing data points were taken into account by list-wise deletion. 330
Data related to demographics (first part of the questionnaire) was used to obtain the 331
general profile of the respondents. To evaluate the hypotheses, questions related to each topic 332
in the model of Figure 1 were identified and analysed. See Table 1 for each hypothesis and 333
related data. Chi-squared non-parametric tests were run in Excel to analyse differences between 334
planning systems related to each question. Additionally, aiming to identify the perceived 335
benefits that CPM respondents see when using CPM associated with LPS or LB (or both), a 336
filter was applied to identify those respondents with the questions then analysed. 337
Insert Table 1 about here 338
339 Results 340
Demographics 341
The survey initially resulted in a collection of 736 responses. After cleaning the data 342
using the seven steps previously discussed, 532 responses remained: 168 from Brazil, 102 from 343
China, 132 from Finland and 130 from the United States. The profile of the respondents is 344

shown in Table 2, where the percentage indicates the number of responses for each topic with 345
the number of total responses obtained (532). 346
Insert Table 2 about here 347
348
A large number of respondents (67%) work in residential or commercial buildings, 349
followed by smaller percentages in industries such as infrastructure (8%) and Oil and gas (6%). 350
For the other industries indicated in the survey, less than 5% of respondents work in each 351
industry. For the most part, respondents work in organizations that represent construction 352
contractors or subcontractors (32%), whereas 19% are self-identified as belonging to 353
engineering organizations, owner (17%), and construction management (16%). Most 354
respondents (21%) belong to organizations that have between 101-500 employees; however, 355
about 35% of organizations have over 1,000 employees. Most respondents are project 356
managers (17%), followed by project engineers (15%), executive officer (14%), or staff (13%). 357
Schedulers (12%) and superintendents (7%) composed about a fifth of the respondents. Most 358
respondents work in multiple areas related to management (55%), planning and control (52%), 359
budgeting (30%), quality or technology (27%) and production (27%). 360
361 Planning and control systems 362
The survey results show in Table 3 that CPM is used by close to three fourths of 363
respondents (71%), followed by LB (40%) and LPS (28%). The use of the planning and control 364
systems distributed by topic is shown in Table 2, where the percentage indicates the number of 365
responses by topic divided by the number of responses by system. Please note that a respondent 366
may be using multiple systems, so the percentages across rows in Table 2 may add to be greater 367
than 100%. CPM is the dominant system used in all types of primary industry, where responses 368
were obtained. Although LB is not the most used system in residential and commercial 369
buildings, even though the projects usually present characteristics of repetition, a high 370

percentage (46%) of the responses indicates LB use. On the other hand, in addition to buildings 371
(32%), LPS is commonly used in healthcare projects (56%) and other projects (28%), such as 372
datacentres and schools. 373
CPM is the dominant system in all types of organizations, especially construction 374
management (82%), supplier (75%), construction contractor or subcontractor (74%), and 375
engineering (73%) companies. Surprisingly, LB is highly used by designers (48%), besides 376
construction contractors or subcontractors and suppliers (50% each). CPM use is expressively 377
cited by government organizations (69%). In terms of organization size, CPM is the most 378
representative system of all. However, despite the evident dominance of CPM, LB is well used 379
in organizations with less than 50 employees (49%) and between 1001 and 5000 employees 380
(45%). LPS use is expressive in companies that have between 501 and 1000 employees (34%) 381
and between 1001 and 5000 employees (40%). 382
All kinds of professionals have indicated CPM as the dominant system, including 383
schedulers (81%), department heads (80%), project managers (74%) and project engineers 384
(71%), which indicates that CPM is widely used in different levels of management. On the 385
other hand, LB is highly used by superintendents (54%) and those in staff positions (55%), LPS 386
is well referred by department heads (39%) as well. When analysing by area, CPM is the most 387
representative system of all, especially in quality or technology (78%), in management (75%), 388
planning and control (75%), budgeting (75%), and supply chain (75%). LB and LPS systems 389
are highly used in production (60% and 40%, respectively), planning and control (52% an 36%, 390
respectively), and consultancy (47% and 38%, respectively) areas. 391
Table 3 shows the number of users in each country who indicated use of the systems, 392
working alone or combined with other systems. 393
Insert Table 3 about here 394
395
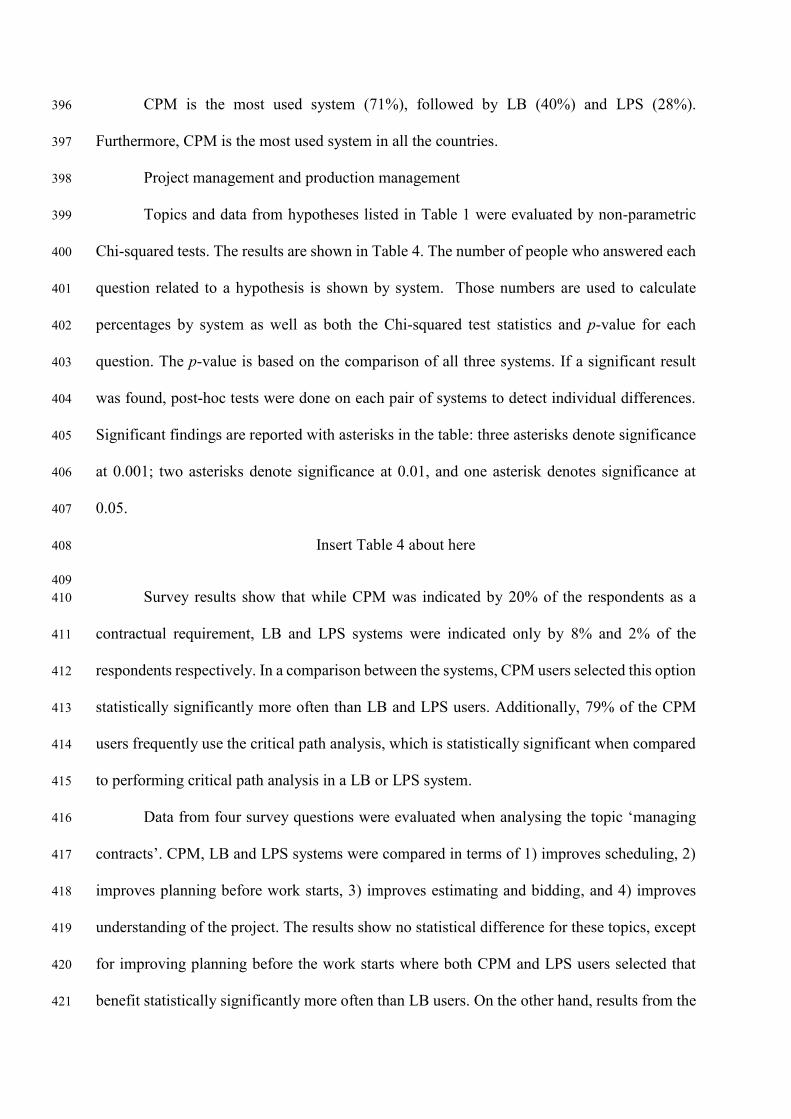
CPM is the most used system (71%), followed by LB (40%) and LPS (28%). 396
Furthermore, CPM is the most used system in all the countries. 397
Project management and production management 398
Topics and data from hypotheses listed in Table 1 were evaluated by non-parametric 399
Chi-squared tests. The results are shown in Table 4. The number of people who answered each 400
question related to a hypothesis is shown by system. Those numbers are used to calculate 401
percentages by system as well as both the Chi-squared test statistics and p-value for each 402
question. The p-value is based on the comparison of all three systems. If a significant result 403
was found, post-hoc tests were done on each pair of systems to detect individual differences. 404
Significant findings are reported with asterisks in the table: three asterisks denote significance 405
at 0.001; two asterisks denote significance at 0.01, and one asterisk denotes significance at 406
0.05. 407
Insert Table 4 about here 408
409 Survey results show that while CPM was indicated by 20% of the respondents as a 410
contractual requirement, LB and LPS systems were indicated only by 8% and 2% of the 411
respondents respectively. In a comparison between the systems, CPM users selected this option 412
statistically significantly more often than LB and LPS users. Additionally, 79% of the CPM 413
users frequently use the critical path analysis, which is statistically significant when compared 414
to performing critical path analysis in a LB or LPS system. 415
Data from four survey questions were evaluated when analysing the topic ‘managing 416
contracts’. CPM, LB and LPS systems were compared in terms of 1) improves scheduling, 2) 417
improves planning before work starts, 3) improves estimating and bidding, and 4) improves 418
understanding of the project. The results show no statistical difference for these topics, except 419
for improving planning before the work starts where both CPM and LPS users selected that 420
benefit statistically significantly more often than LB users. On the other hand, results from the 421

questions related to management of delay and change showed statistically significant 422
differences only related to the benefits of reducing delays and minimizing disputes between the 423
contractor and owner. With respect to disputes, LPS had a statistically significant difference 424
compared to LB users. For other questions, no statistically significant differences existed 425
between the perceived benefits identified by the users of each system. 426
Two questions were analysed when evaluating continuous flow and continuous use of 427
resources. In terms of workflow improvement and evaluation of workflow, LB and LPS users 428
indicated benefit of improved workflow or evaluated that workflow works well or very well 429
when using LB or LPS compared to CPM. When evaluating the perceived benefits in the 430
context of improving constraints analysis and how this analysis works, LPS users expressed 431
the benefit of improving constraint analysis statistically significantly more often than CPM or 432
LB users; those users also favourably evaluated constraint analysis statistically significantly 433
more often than CPM users. LPS is considered a well-known system used for the treatment of 434
interferences between activities as well as reduction of uncertainty and constraints. In terms of 435
improving production control, LB and LPS users both have statistically significant perceived 436
benefits when compared to CPM users for the questions related to production control. 437
Similarly, both LB and LPS have perceived benefits associated with faster response to 438
problems. On the other hand, CPM, LB and LPS systems have no statistically significant 439
differences when comparing the evaluation of root cause of delays. However, the benefit of 440
root cause analysis was statistically significant for LPS users when compared to both LB and 441
CPM users. 442
Because CPM is the dominant scheduling system in the survey, it is possible that 443
respondents who selected just CPM are not fully aware of the strengths and drawbacks of the 444
system compared to other tools. To evaluate this, we analysed separately those CPM users who 445
also used either LPS or LB. These results are shown in Table 5. Overall, these results are in 446

line with the results of the full sample (Table 4). However, there are some minor differences in 447
the patterns of statistically significant results. The discussion below focuses on the differences. 448
CPM was still dominant as a contractual requirement, but surprisingly it was no longer 449
chosen the tool of choice for critical path analysis with statistically significant results. CPM 450
was also credited with improving planning before work starts alongside the LPS when 451
compared to LB methods. Additionally, the benefit of CPM improving estimating and bidding 452
was emphasized in the partial sample that used multiple systems. CPM and LPS both were seen 453
to increase understanding of the project when compared to LB methods, while there was no 454
statistical significance on this aspect with the full sample. With respect to delay management, 455
the perceived advantage of LPS for the benefit of minimizing disputes between contractor and 456
owner does not exist in the partial sample. 457
Differences arose when evaluating continuous flow and continuous use of resources. 458
With the full sample, users of both LB and LPS indicated statistically significantly more often 459
benefit of improved workflow over CPM users. With the partial sample, this result was no 460
longer statistically significant, and the benefit of LPS compared to CPM decreased. With the 461
partial sample, LPS users selecting well to very well workflow rose from 69% of respondents 462
to 74% of respondents, and LPS and LB both statistically significantly overperformed CPM. 463
This is significant because the subset sample is certainly comparing the performance of LPS 464
and/or LB to CPM. In a similar fashion, the statistical significance was consistent for the 465
constraint analysis function of LPS (Hypothesis 6). 466
In terms of improving production control as a benefit, the systems do not show 467
statistically significant differences within the limited sample (the full sample had a statistically 468
significant effect for LB and LPS methods), indicating that the respondents who use CPM with 469
LB and/or LPS think that each system has a role to play in production control. However, for 470
evaluation of production control, LB and LPS were statistically significant in the full sample 471

and in the partial sample. For root cause working well to very well, LB and LPS are statistically 472
significant when compared to CPM. 473
Insert Table 5 about here 474
475 Discussion 476
A comparison between the findings of literature review and survey results is presented 477
in this section alongside Table 6, which presents a summary of results. 478
Hypothesis 1 considers the use of CPM as a contractual requirement. Galloway (2006) 479
applied a survey in the United States where 63% of the respondents indicated contract 480
requirement as the main reason for using CPM scheduling. Furthermore, 72.5% of the owners 481
who answered the same survey specify CPM schedule in their contracts. Thus, it is expected 482
that CPM is largely used within the construction sector due to its contractual requirements. 483
Findings from this current survey indicates that CPM is used by 71% of the respondents, and 484
20% of those indicated contractual requirement as the main reason for using CPM, which is 485
statistically significantly higher compared with other systems. Hence, this hypothesis is 486
supported by survey results. In contrast to Galloway (2006), we were not asking respondents 487
if CPM was indeed a contractual requirement, but instead we inserted contractual requirement 488
as one of the options for the main reason for using CPM. This might explain the differences 489
between percentages presented by Galloway (2006) and these results. However, given the 490
contractual requirement of CPM, professionals do not seem to view using the method 491
begrudgingly; as previously discussed, CPM is viewed favourably and hypothesis 1 is 492
supported. 493
Hypothesis 2 refers to the associated use of critical path analysis and CPM. The critical 494
path analysis is a fundamental basis of CPM (Kelley and Walker 1959). Accordingly, it is 495
expected that the use of CPM is associated with critical path analysis. A statistically significant 496
higher share of CPM users compared to LB and LPS users indicated frequent or moderate use 497

of this analysis when managing schedules (79%); survey results support this hypothesis. This 498
result was no longer statistically significant when a limited sample including those respondents 499
who used CPM together with LB or LPS was considered; however, CPM still achieved the 500
highest share of responses (CPM: 75%, LB: 68%, LPS: 61%). This continues to support the 501
literature and established industry trends and supports hypothesis 2. 502
Hypothesis 3 explores the use of CPM with managing contracts, which is indicated by 503
findings from the literature review. Furthermore, due to the fact that CPM is usually a 504
contractual requirement, it is expected that CPM supports the management of contracts. Results 505
from the questions associated with this topic show that all systems have perceived benefits 506
associated with improving schedules (CPM 70%, LB 63%, LPS 76%), planning before work 507
starts (CPM 52%, LB 36%, LPS 49%), estimating/bidding (CPM 30%, LB 27%, LPS 20%) 508
and understanding of the project (CPM 52%, LB 42%, CPM 49%). The differences were 509
statistically significant only with improving planning before the work starts, where CPM and 510
LPS both had statistically significant higher perceived benefits than LB. Additionally, with the 511
limited sample of CPM users who also used also another system, improving the estimating and 512
bidding phase was significantly perceived as a benefit related to CPM. In the limited sample, 513
understanding the project was statistically significant for CPM and LPS when compared to LB. 514
Thus, although CPM has been used for managing contracts in terms of scheduling, other 515
systems also have a role to play related to this category. Considering the results of the full 516
sample, hypothesis 3 is not supported. 517
Hypothesis 4 refers to the use of CPM for delay and claim management. CPM has 518
historically been used for contract claims and analysis of delays (e.g. Wickwire and Smith 519
1974, Hegazy and Menesi 2010). On the other hand, literature exploring the use of LB and LPS 520
systems associated with claim and delays analysis is scarce. However, when analysing 521
questions in this survey related to reducing delays and reduction of disputes between contractor 522

and owner, LPS, and not CPM, was statistically significantly perceived to reduce delays and 523
minimize disputes. Thus, because delays and claims are managed with all the systems, and LPS 524
outperformed CPM twice, hypothesis 4 is not supported. This approach might be justified 525
due to the social characteristic aspects of LB and LPS, which aims for collaborative definition 526
and discussion involving the project team and subcontractors (e.g. Ballard 2000, Kenley and 527
Seppänen 2010), which increases the level of trust and reflects in reduction of delays, for 528
example. The respondents could have thought about the role of LB and LPS in preventing 529
claims rather than analysing a claim in dispute. 530
Hypothesis 5 explores the ability of the systems for generating continuous flow and 531
continuous use of resources. As expected, LB and LPS users reported improved workflow as a 532
benefit statistically significantly more often than CPM users (CPM: 44%, LB 54%, LPS 64%). 533
Additionally, a significantly higher share of LB and LPS users were satisfied with the workflow 534
functions of their system than CPM users. Therefore, hypothesis 5 is supported. 535
Due to its social aspects and findings from literature review, LPS is usually well 536
associated with the reduction of interferences between activities, uncertainty, and constraints, 537
as explored by Hypothesis 6. Indeed, 49% of LPS users indicated improving constraints 538
analysis is a benefit of this system, which is a statistically significant difference compared with 539
CPM users (23%) and LB users (27%). Similarly, when constraint analysis was evaluated, 540
65% of LPS users reported that it works well or very well which was a statistically significant 541
difference compared with CPM users, where just 46% of the users evaluated this topic 542
favourably. With the partial sample, the differences hold and also include LB overperforming 543
CPM in constraint analysis evaluation. Therefore, hypothesis 6 is supported. 544
Hypotheses 7A and 7B refer to the support and improvement of production control. 545
These hypotheses received full support from the survey results. Both LB and LPS systems had 546
perceived benefits associated with production control. Both LPS and LB had statistically 547

significant benefits with improvement of production control (64% and 58% of users, 548
respectively), good evaluation of how the production control process works (76%% and 73% 549
of users, respectively), and higher benefits associated with faster response to problems (53% 550
and 29% of users, respectively), which all contribute to the improvement of production 551
processes. The significance of the p-value was stronger with the partial sample for evaluation 552
of production control process and response time for problems. However, in the partial sample, 553
overall improvement of production control was not statistically significant. This indicates that 554
while users of LB and LPS saw these systems stronger with respect to production control 555
functions, they considered that CPM also had a role to play in improving production control. 556
Considering the results of the full sample, hypotheses 7A and 7B are supported. 557
Hypotheses 8A and 8B refer to the identification of root causes of delays. A 558
statistically significantly higher share of LPS users selected this benefit when comparing with 559
CPM and LB users (CPM: 23%, LB: 22%, LPS: 36%). However, the evaluation about working 560
well or very well had no statistically significant differences across the systems (CPM: 38%, 561
LB: 50%, LPS: 45%). However, when the partial sample was considered, both LB and LPS 562
were statistically significantly evaluated better than CPM (CPM: 29%, LB 44%, LPS 50%) in 563
evaluation of root causes. Considering the full sample, hypothesis 8 is partially supported. 564
In the full sample, 38% of CPM indicated that root cause evaluation works very well or well; 565
this was not statistically significantly lower than the result for LB and LPS. This finding might 566
be associated with the expressive use of CPM for managing contracts (Galloway 2006) and 567
delays (e.g. Hegazy and Menesi 2010). For example, if CPM is mandated to be used, and a 568
delay occurs, personnel will find a root cause regardless if the planning method facilitates a 569
quick identification of such. A limitation of this topic could be respondents’ understandings of 570
root cause analysis, which may impact the results. 571

Hypothesis 9 refers to CPM perceived benefits being mostly related to the PM 572
approach, including the topics illustrated in Figure 1: 1) contractual requirement; 2) critical 573
path analysis; 3) managing contracts; and 4) management of delay and change. In general, the 574
survey results support topics 1 and 2, showing that CPM users selected these benefits 575
significantly more often than the users of LB and LPS systems. On the other hand, there was 576
not strong support for management of contracts and delay and change management. The 577
differences related to improving scheduling, estimating or bidding, improving understanding 578
of the project had no significant perceived differences between the systems. Very few users of 579
any system selected claims documentation as their primary goal of scheduling systems, and 580
LPS users selected the benefits related to delay reduction and minimizing disputes significantly 581
more often than CPM users. Because contract management and delays are an important part of 582
PM functions, it seems that all systems could have a role to play within the scope of PM. Thus, 583
hypothesis 9 is not supported. 584
Hypothesis 10 discusses that LB and LPS perceived benefits are mostly related to PPM, 585
including the topics illustrated in Figure 1: 1) continuous flow and resources; 2) interferences, 586
uncertainty and constraints; 3) improving production control; and 4) identification of the root 587
cause of delays. In general, the survey results for the full sample support most topics, except 588
for the evaluation of root causes. Thus, the results of the full sample support hypothesis 10. 589
Insert Table 6 about here 590
591
Support to hypotheses 6 and 10 depends on whether the full or partial sample was used. 592
It can be argued that the respondents who are familiar with multiple approaches are able to 593
differentiate between the benefits of the systems better. Based on these differences it seems 594
that CPM users who are not familiar with the other systems may not even be aware of the 595
relative strengths and limitations of CPM. 596

Conclusion 597
This research explores the differences between CPM, LB and LPS in terms of PM, 598
PPM, and related topics. First, the results show that CPM is the most dominant system when 599
the following characteristics are considered: primary industry types, type of organization, size 600
of organization, and professional position within the organization and area of work. Secondly, 601
while CPM is a contract requirement and has perceived benefits associated with critical path 602
analysis, LB and LPS have perceived benefits related to continuous flow and continuous use 603
of resources, treatment of interferences, reduction of uncertainty and constraints, and 604
improving production control. All systems were found to have a similar level of benefits in 605
terms of management of contracts, and management of delay and change, and evaluation of the 606
root causes of delays. Finally, LB and LPS have particular topics associated with both PM and 607
PPM as the analyses conducted for hypotheses 1 through 4 have shown. Conversely, CPM was 608
not found to support project production management as observed in the analyses regarding 609
hypotheses 5 through 8, which were strongly supported by the data favouring LPS and LB as 610
better suited to support PPM. 611
Theoretical implications of this study contribute to supporting well-established notions, 612
especially in the Lean literature, that LPS and LB offer more support to project production 613
management with generation and maintenance of continuous flow. Additionally, as identified 614
in the literature, a growing body of research has been focusing on the integration of the systems, 615
and this study offers insights in terms of how practitioners might use these systems. 616
Specifically, our results show that CPM is used for critical path analysis, LB and LPS are used 617
for improving production control and workflow functions, and support faster response and 618
reduction of interferences between activities, uncertainty, and constraints. There is no 619
difference between the systems for the management of contracts, delay and claim management, 620
and evaluation of root causes of delays. However, for projects that require production control 621
and faster response to problems, LB and LPS may be preferred methods, respectively. 622
Furthermore, the popularity of CPM may be masking the benefits of the other methods; if more 623
professionals used LB and LPS, they may find more success with those methods. 624
Clearly, the needs of the project may drive the best management technique to be used 625
for planning and scheduling. These trends exist internationally, and across the industry, 626
regardless of country. Industry norms are challenged as no statistical difference exists among 627
the three systems in most of the topics associated with managing contracts (i.e., improves 628
scheduling, bidding, and estimating; improves understanding of the project), and some of the 629
delay and claim management benefits (i.e., evaluation of delays). It is clear that these findings 630
can help to eliminate misunderstanding about the benefits of these systems to the industry. 631
Future development of case studies may help address questions related to improving the 632
performance of projects in terms of efficient contract management, value generation, and flow 633
creation. Future research by the authors will compare CPM, LB, and LPS from the perspective 634
of countries, exploring underlying differences among the systems and countries. 635
Practical implications include identifying areas of interest to further integrate these 636
systems into a single platform or to develop systems that are able to address all relevant features 637
that any of these systems might address individually. CPM has an enormous advantage in terms 638
of use in the construction industry due to the familiarity of practitioners with this approach, the 639
existence of well-established software platforms to operationalize its use, and its acceptance as 640
a legal document. However, to break through the status quo and incorporate other tools and 641
ideas more suitable to the management of operations, the change might need to start in 642
academia where the new generation of practitioners will be trained and familiarized with the 643
need to more closely manage production as an extension of managing contracts. The insights 644
on the strength and weakness of each method from industry practitioners’ first-hand experience 645
sets a foundation of a starting point for further development of scheduling methods. This 646

research identifies the utility and function for each method and identifies potential areas of 647
interest for the integration of the analysed systems by promoting synergies between the 648
methods. 649
650
Acknowledgements 651
The authors would like Dominique Hawkins for her assistance with the data when preparing 652
this manuscript. 653
654
Data Availability Statement 655
Data generated or analyzed during the study are available from the corresponding author by 656
request. 657
658
References 659
Al-Reshaid, K., Kartam, N., Tewari, N., and Al-Bader, H., 2005. A project control process in 660
pre-construction phases: Focus on effective methodology. Engineering, Construction and 661
Architectural Management, 12 (4), 351–372. 662
Alsehaimi, A.O., Fazenda, P.T., and Koslela, L., 2014. Improving construction management 663
practice with the last planner system: A case study. Engineering, Construction and 664
Architectural Management, 21 (1), 51–64. 665
Antill, J.M., and Woodhead, R.W., 1990. Critical path methods in construction practice. New 666
York: John Wiley & Sons. 667
Arditi, D., Tokdemir, O.B., and Suh, K., 2002. Challenges in line-of-balance scheduling. 668
Journal of Construction Engineering and Management, 128 (6), 545–556. 669
Arditi, D., Pattanakitchamroon, T., 2006. Selecting a delay analysis method in resolving 670
construction claims. International Journal of Project Management, 24, 145–155. 671

Ballard, H.G., 1997. Look ahead planning, the missing link to production control. In: Proc. of 672
5th Annual Conference of the International Group for Lean Construction. Gold Coast. 673
Ballard, H.G., and Howell, A., 1998. Shielding production: Essential step in production control. 674
Lean Construction Journal, 1 (1), 38–45. 675
Ballard, H.G., 2000. The last planner system of production control. Thesis (Doctor of 676
Philosophy), School of Civil Engineering, University of Birmingham. 677
Benjaoran, V., Tabyang, W., and Sooksil, N., 2015. Precedence relationship options for the 678
resource levelling problem using a genetic algorithm. Construction Management and 679
Economics, 33 (9), 711–723. 680
Bragadin, M.A. and Kähkönen, K., 2016. Schedule health assessment of construction projects. 681
Construction Management and Economics, 34 (12), 875–897. 682
Brown, J.W., 1985. Evaluation of projects using critical path analysis and earned value in 683
combination. Project Management Journal, 16 (3), 59–63. 684
Burns, S.A., Liu, L., and Feng, C.W., 1996. The LP/IP hybrid method for construction time-685
cost trade-off analysis. Construction Management and Economics, 14 (3), 265–276. 686
Edum-Fotwe, F.T. and McCaffer, R., 2000. Developing project management competency: 687
perspectives from the construction industry. Intnl. J. of Project Management, 18, 111–124. 688
Fernandez-Solis, J.L., Porwal, V., Lavy, S., Shafaat, A., Rybkowski, Z.K., Son, K., and Lagoo, 689
N., 2013. Survey of motivations, benefits, and implementation challenges of Last Planner 690
System users. J. of Construction Engineering and Management, 139 (4), 354–360. 691
Fiallo, C.M., and Revelo, P.H.V, 2002. Applying the last planner system to a construction 692
project: Case study in Quito, Ecuador. In: Proc. of 10th Annual Conference of the International 693
Group for Lean Construction. Gramado. 694
Forza, C., 2002. Survey research in operations management: A process-based perspective. 695
Intnl. J. of Operations & Production Management, 22 (2), 152–194. 696
Frandson, A., Berghede, K., and Tommelein, I.D., 2013. Takt time planning for construction 697
of exterior cladding. In: Proc. of 21th Annual Conference of the International Group for Lean 698
Construction. Fortaleza. 699
Galloway, P.D., 2006. Survey of the construction industry relative to the use of CPM 700
scheduling for construction projects. J. of Construction Engineering and Management, 132 (7), 701
697–711. 702
Hamzeh, F., Ballard, G., and Tommelein, I.D., 2012. Rethinking look ahead planning to 703
optimize construction workflow. Lean Construction Journal, 1 (1), 15–34. 704
Hamzeh, F., Kankoul, E., and Rouhana, C., 2015. How can ‘tasks made ready’ during 705
lookahead planning impact reliable workflow and project duration? Construction Management 706
and Economics, 33 (4), 243–258. 707
Harris, R.B., and Ioannou, P.G., 1998. Scheduling projects with repeating activities. J. of 708
Construction Engineering and Management, 124 (4), 269–278. 709
Hegazy, T., 2005. Computerized system for efficient scheduling of highway construction. J. of 710
the Transportation Research Board, 1907, 8–14. 711
Hegazy, T. and Menesi, W., 2010. Critical path segments scheduling technique. J. of 712
Construction Engineering and Management, 136 (10), 1078–1085. 713
Howell, G.A., and Ballard, G., 1994. Lean production theory: Moving beyond “Can-Do”. In: 714
Proceeding of International Workshop on Lean Construction. Santiago de Chile. 715
Huber, B., and Reiser, P., 2003. The marriage of CPM and lean construction. In: Proceeding 716
of 11th Annual Conference of the International Group for Lean Construction. Blacksburg. 717
IBM, 2018. [online]. Available from: https://www.ibm.com/fi-en/marketplace/spss-statistics 718
[Accessed 19 January 2018]. 719
Johnston, D.W., 1981. Linear scheduling method for highway construction. J. of the 720
Construction Division, 107 (2), 247–261. 721

Kelley, J.E. and Walker, M., 1959. Critical path planning and scheduling. In: Proceeding of 722
Eastern Joint Computer Conference. 723
Kenley, R. and Seppänen, O., 2010. Location-based management for construction: Planning, 724
scheduling and control. Abingdon: Spon Press. 725
Kemmer, S.L., Heineck, L.F.M., and Alves, T.C.L., 2008. Using the line-of-balance for 726
production system design. In: Proc. of 16th Annual Conference of the International Group for 727
Lean Construction. Manchester. 728
Khanh, H.D., and Kim, S.Y., 2016. A survey on production planning system in construction 729
projects based on last planner system. KSCE Journal of Civil Engineering, 20 (1), 1–11. 730
Kim, Y.W., Park, C., and Ballard, G., 2007. A case study on rebar supply chain management 731
by GS E&C. In: Proc. of 15th Annual Conference of the International Group for Lean 732
Construction. Michigan. 733
Kim, W., Ryu, D., Jung, Y., 2014. Application of linear scheduling method (LSM) for nuclear 734
power plant (NPP) construction. Nuclear Engineering and Design, 270, 65–75. 735
Koskela, L., 1999. Management of production in construction: A theoretical view. In: Proc. of 736
7th Annual Conference of the International Group for Lean Construction. Berkeley. 737
Koskela, L., and Howell, G., 2002. The underlying theory of project management is obsolete. 738
In: Proceeding of the PMI Research Conference, PMI, 293–302. 739
Koskela, L., Startton, R., and Koskenvesa, A., 2010. Last planner and critical chain in 740
construction management: Comparative analysis. In: Proc. of 18th Annual Conference of the 741
International Group for Lean Construction. Haifa. 742
Koskela, L., Howell, G., Pikas, E., and Dave, B., 2014. If CPM is so bad, why have been using 743
it so long. In: Proc. of 22th Annual Conference of the International Group for Lean 744
Construction. Oslo. 745

Laufer, A., and Tucker, R.L., 1987. Is construction project planning really doing its job? A 746
critical examination of focus, role and process. Construction Management and Economics, 5 747
(3), 243–266. 748
Levin, P., 1998. Construction contract claims, changes and dispute resolution. New York: 749
ASCE Press. 750
Lucko, G., Alves, T.C.L., and Angelim, V.L., 2014. Challenges and opportunities for 751
productivity improvement studies in linear, repetitive, and location-based scheduling. 752
Construction Management and Economics, 32 (6), 575–594. 753
Lumsden, P., 1968. The line of balance method. London: Pergamon Press. 754
Mattila, K.G., and Park, A., 2003. Comparison of linear scheduling model and repetitive 755
scheduling method. J. of Construction Engineering and Management, 129 (1), 56–64. 756
Meredith, J.R., and Mantel, S.J., 2012. Project management: a managerial approach. Danvers: 757
John Wiley & Sons. 758
Olano, R.M., Alarcón, L.F., and Razuri, C., 2009. Understanding the relationship between 759
planning reliability and schedule performance: A case study. In: Proceeding of 17th Annual 760
Conference of the International Group for Lean Construction. Taipei. 761
Olawale, Y., and Sun, M., 2015. Construction project control in the UK: Current practice, 762
existing problems and recommendations for future improvement. International Journal of 763
Project Management, 33, 623–637. 764
Olivieri, H., Seppänen, O., and Granja, A.D., 2016. Integrating LBMS, LPS and CPM: A 765
practical process. In: Proc. of 24th Annual Conference of the International Group for Lean 766
Construction. Boston. 767
Olivieri, H., Seppänen, O., and Granja, A.D., 2018. Improving workflow and resource usage 768
in construction schedules through location-based management system (LBMS). Construction 769
Management and Economics, 36 (2), 109–124. 770

Orouji, H., Haddad, O.B., Fallah-Meddipour, E., and Marino, M.A., 2014. Extraction of 771
decision alternatives in project management: Application of hybrid PSO-SFLA. J. of 772
Management in Engineering, 30 (1), 50–59. 773
Patton, M.Q., 1990. Qualitative evaluation and research methods. Thousand Oaks: Sage 774
Publications. 775
PMI, 2013. A guide to the project management body of knowledge: PMBOK guide. Project 776
Management Institute. 777
Qualtrics, 2017. [online]. Available from: http://www.qualtrics.com/ [Accessed 14/12/2017]. 778
Rossi, P.H., Wright, J.D., and Anderson, A.B., 2013. Handbook of survey research. Academic 779
Press. 780
Russell, A.D. and Wong, W.C.M., 1993. New generation of planning structures. J. of 781
Construction Engineering and Management, 119 (2), 196–214. 782
Sacks, R., 2016. What constitutes good production flow in construction? Construction 783
Management and Economics, 34 (9), 641–656. 784
Schmenner, R.W. (1993). Production/Operations Management. Englewood Cliffs, N.J.: 785
Prentice Hall, 825 pp. 786
Sears, S.K., Sears, G.A., Clough, R.H., Rounds, J.L., and Segner, R.O., 2015. Construction 787
project management. New Jersey: John Wiley & Sons. 788
Shi, Q., and Blomquist, T., 2012. A new approach for project scheduling using fuzzy 789
dependency structure matrix. International Journal of Project Management, 30(4), 503–510. 790
Tavakoli, A., and Riachi, R., 1990. CPM use in ENR top 400 contractors. J. of Management in 791
Engineering, 6 (3), 282–295. 792
Wickwire, J.M., and Smith, R.F., 1974. The use of critical path method techniques in contract 793
claims. Public Contract Law Journal, 7 (1), 1–45. 794

Willis, C, and Friedman, D., 1998. Building the Empire State Building. New York: W.W. 795
Norton & Company. 796
Yang, J.B., and Kao, C.K., 2012. Critical path effect based delay analysis method for 797
construction projects. Intnl. J. of Project Management, 30, 385–397. 798
799

Figure Caption List: 800
Figure 1: Systems characteristics and related functions 801
802

803 804
Table 1: Reported functions fulfilled by each system and related questions 805
Topics and hypotheses Analyzed data H9. Project Management
Joint analysis of H1 through H4.
H1. Contractual requirement
Number of “contract requirements,” option selected in questions 8, 24 and 38
H2. Critical path analysis
Number of answers for “frequently” and “moderate” in questions 16, 31 and 46
H3. Managing contracts Number of answers for “improves scheduling”, “improves planning before work starts”, “improves estimating / bidding” and “improves understanding of the project” in questions 21, 35 and 50
H4. Management of delay and change
Number of answers for “claims documentation” in questions 8, 24 and 38, “reduce delays” and “minimizes disputes between contractor and owner in questions 21, 35 and 50, and “delays analysis – options definitively works very well and works well” in questions 23, 37 and 52
H10. Production Management
Joint analysis of H5 through H8A/B.
H5. Continuous flow and continuous use of resources
Number of answers for “improves workflow” in questions 21, 35 and 50, and “workflow – options definitively works very well and works well” in questions 23, 37 and 52
H6. Treatment of interferences between activities, reduction of uncertainty and constraints
Number of answers for “improves constraints analysis” in questions 21, 35 and 50, and “constraints analysis – options definitively works very well and works well” in questions 23, 37 and 52
H7A and H7B. Improving production control
Number of answers for “improves production control” and “faster response to problems” in questions 21, 35 and 50, and “effective production control – options definitively works very well and works well” in questions 23, 37 and 52
H8A and H8B. Identification of the root causes of delays
Number of answers for “improve root causes analysis of deviations and action plans” in questions 21, 35 and 50, and “root causes analysis of deviations and action plans – options definitively works very well and works well” in questions 23, 37 and 52
806
807

Table 2: Profile of the respondents and used planning and control systems 808
Topic Total and
% of responses
Planning and control system (within system % of responses) CPM LB LPS
Primary Industry
Buildings 356 (67%) 248 (70%) 163 (46%) 114 (32%) Infrastructure 43 (8%) 33 (77%) 12 (28%) 2 (5%) Oil and gas 34 (6%) 25 (74%) 12 (35%) 9 (26%) Other 32 (6%) 18 (56%) 10 (31%) 9 (28%) Pharmaceutical 23 (4%) 20 (87%) 3 (13%) 3 (13%) Power 20 (4%) 15 (75%) 5 (25%) 3 (15%) Healthcare 9 (2%) 8 (89%) 4 (44%) 5 (56%) Process 9 (2%) 7 (78%) 3 (33%) 2 (22%) Transportation 6 (1%) 6 (100%) 1 (17%) 0 (0%) Aerospace 0 (0%) 0 (0%) 0 (0%) 0 (0%)
Type of organization
Contractor or subcontractor 171 (32%) 126 (74%) 86 (50%) 66 (39%) Engineering 101 (19%) 74 (73%) 31 (31%) 23 (23%) Owner 90 (17%) 61 (68%) 30 (33%) 18 (20%) Construction management 87 (16%) 71 (82%) 31 (36%) 27 (31%) Other 39 (7%) 19 (49%) 16 (41%) 12 (31%) Designers 23 (4%) 14 (61%) 11 (48%) 0 (0%) Government 13 (2%) 9 (69%) 4 (31%) 1 (8%) Supplier 8 (2%) 6 (75%) 4 (50%) 0 (0%)
Organization size
101-500 employees 113 (21%) 87 (77%) 37 (33%) 36 (32%) Under 50 employees 96 (18%) 59 (61%) 47 (49%) 22 (23%) 1001-5000 employees 97 (18%) 70 (72%) 44 (45%) 39 (40%) Over 5000 employees 92 (17%) 72 (78%) 34 (37%) 20 (22%) 50-100 employees 78 (15%) 53 (68%) 30 (38%) 11 (14%) 501-1000 employees 56 (11%) 39 (70%) 21 (38%) 19 (34%)
Position within the organization
Project manager 92 (17%) 68 (74%) 39 (42%) 24 (26%) Project engineer 82 (15%) 58 (71%) 38 (46%) 22 (27%) Executive officer 77 (14%) 54 (70%) 22 (29%) 28 (36%) Staff position 67 (13%) 41 (61%) 37 (55%) 14 (21%) Scheduler 64 (12%) 52 (81%) 18 (28%) 15 (23%) Department head 56 (11%) 45 (80%) 19 (34%) 22 (39%) Other 57(11%) 40 (70%) 19 (33%) 15 (26%) Superintendent 37 (7%) 22 (59%) 20 (54%) 7 (19%)
Area (respondents were able to select more than one option)
Management 292 (55%) 219 (75%) 110 (38%) 87 (30%) Planning and control 277 (52%) 208 (75%) 144 (52%) 100 (36%) Budgeting 162 (30%) 121 (75%) 71 (44%) 53 (33%) Quality or technology 144 (27%) 112 (78%) 60 (42%) 51 (35%) Production 144 (27%) 98 (68%) 86 (60%) 58 (40%) Supply chain 100 (19%) 75 (75%) 47 (47%) 36 (36%) Consultancy 77 (14%) 50 (65%) 36 (47%) 29 (38%) Product development/specification 52 (10%) 35 (67%) 24 (46%) 15 (29%) Other 24 (5%) 15 (63%) 8 (33%) 7 (29%)
809 810
811

Table 3: System use by country 812
813
814 815
816
System U.S. Brazil Finland China Total a. Only CPM 70 (13%) 76 (14%) 34 (6%) 62 (12%) 242 (45%) b. Only LB 3 (1%) 41 (8%) 28 (5%) 32 (6%) 104 (20%) c. Only LPS 13 (2%) 11 (2%) 6 (1%) 0 (0%) 30 (6%) d. CPM + LB + LPS 12 (2%) 14 (3%) 26 (5%) 0 (0%) 52 (10%) e. CPM + LPS 30 (6%) 9 (2%) 8 (2%) 0 (0%) 47 (9%) f. CPM + LB 1 (0.2%) 14 (3%) 16 (3%) 8 (2%) 39 (7%) g. LB + LPS 1 (0.2%) 3 (1%) 14 (3%) 0 (0%) 18 (3%) Subtotal 1 130 (24%) 168 (32%) 132 (25%) 102 (19%) 532 (100%) Total CPM (alone or combined): a+d+e+f
113 (21%) 113 (21%) 84 (16%) 70 (13%) 380 (71%)
Total LB (alone or combined): b+d+f+g
17 (3%) 72 (14%) 84 (16%) 40 (8%) 213 (40%)
Total LPS (alone or combined): c+d+e+g
56 (11%) 37 (7%) 54 (10%) 0 (0%) 147 (28%)

Table 4: Hypotheses – Complete dataset 817
Topic Answers
Occurrences / total
(percentage)
Analys
is
CPM1 LB2 LPS3 χ2 df p
H9. Project management H1. Contractual
requirement Contract requirement 73/357 (20%)***2,3
15/178 (8%)
3/125 (2%) 31.26 2 0.000
H2. Critical path analysis Frequently / moderate
266/336 (79%)***3
*2
111/157 (71%)
68/112 (61%) 15.59 2 0.000
H3. Managing contracts
Benefits: improves scheduling
226/322 (70%)
114/180 (63%)
97/128 (76%) 5.66 2 0.058
Benefits: improves planning before work starts
168/322 (52%)***2
65/180 (36%)
63/128 (49%)***2 12.28 2 0.002
Benefits: improves estimating / bidding
95/322 (30%)
48/180 (27%)
25/128 (20%) 5.99 2 0.097
Benefits: improves understanding of the project
169/322 (52%)
75/180 (42%)
63/128 (49%) 5.42 2 0.066
H4. Management of delay and
change
Main reason: claims documentation 9/357 (3%) 6/178 (3%) 2/125 (2%) 0.93 2 0.629
Benefits: reduce delays 145/322 (45%)
72/180 (40%)
75/128 (59%)**1,3 10.86 2 0.004
Benefits: Minimize disputes between contractor and
owner
85/322 (26%)
34/180 (19%)
40/128 (31%)*2 6.53 2 0.038
Evaluation: delays (works very well / works well)
141/275 (51%)
82/139 (59%) # 2.21 1 0.137
H10. Project production management
H5. Continuous flow and
continuous use of resources
Benefits: improves workflow
141/322 (44%)
97/180 (54%)*1
82/128 (64%)***1 16 2 0.000
Evaluation: workflow (works very well / works
well)
112/280 (40%)
103/141 (73%)***1
70/102 (69%)***1 51.51 2 0.000
H6. Treatment of interferences, reduction of
uncertainty and constraints
Benefits: improving constraints analysis
75/322 (23%)
49/180 (27%)
63/128 (49%)***12 30.2 2 0.000
Evaluation: constraints analysis (works very well /
works well)
125/273 (46%)
80/139 (58%)
65/100 (65%)***1 12.62 2 0.002
H7A and H7B. Improving production
control
Benefits: improves production control
133/322 (41%)
105/180 (58%)***1
82/128 (64%)***1 24.7 2 0.000
Evaluation: production control (works very well /
works well)
121/275 (44%)
102/139 (73%)**1
77/101 (76%)***1 49.49 2 0.000
Benefits: faster response to problems
69/322 (21%)
53/180 (29%)
68/128 (53%)***1,
2 43.75 2 0.000
H8A and H8B. Root causes of
delays
Benefits: root causes 73/322 (23%)
40/180 (22%)
46/128 (36%)**1,2 9.76 2 0.01
Evaluation: root causes (works very well / works
well)
104/273 (38%)
69/139 (50%)
45/100 (45%) 5.32 2 0.070
818

Note: ***p<0.001; **p<0.01; *p<0.05; superscript numbers indicate system where 819
comparison is significant (1=CPM, 2=LB 3=LPS); #data is not available 820

Table 5: Hypotheses: Only data related to use of CPM along with LPS and/or LB 821
Topic Answers Occurrences / total (percentage) Analysis
CPM1 LB2 LPS3 χ2 df p
H9. Project management
H1. Contractual requirement Contract requirement
27/136 (20%)***2,
3
3/67 (4%) 2/83 (2%) 19.75 2 0.000
H2. Critical path analysis Frequently / moderate 99/132
(75%) 43/63 (68%) 46/76 (61%) 4.80 2 0.091
H3. Managing contracts
Benefits: improves scheduling
91/128 (71%)
50/83 (60%) 66/91 (73%) 3.71 2 0.156
Benefits: improves planning before work starts
74/128 (58%)***2
28/83 (34%) 45/91 (49%)**2 11.72 2 0.003
Benefits: improves estimating / bidding
42/128 (33%)*3
19/83 (23%) 16/91 (18%) 6.90 2 0.032
Benefits: improves understanding of the project
71/128 (55%)*2
32/83 (39%) 52/91 (57%)*2 7.53 2 0.023
H4. Management of delay and
change
Main reason: claims documentation 4/136 (3%) 3/67 (4%) 1/83 (1%) 1.48 2 0.477
Benefits: reduce delays 58/128 (45%)
29/83 (35%)
56/91 (62%)***2
*1 12.69 2 0.002
Benefits: Minimize disputes between contractor and
owner
38/128 (30%)
18/83 (22%) 30/91 (33%) 2.87 2 0.238
Evaluation: delays (works very well / works well)
53/113 (47%)
32/57 (56%) # 3.84 1 0.255
H10. Project production management
H5. Continuous flow and
continuous use of resources
Benefits: improves workflow
58/128 (45%)
42/83 (51%) 57/91 (63%)*1 6.48 1 0.039
Evaluation: workflow (works very well / works
well)
34/112 (30%)
40/56 (71%)***1 53/72 (74%)***1 42.96 2 0.000
H6. Treatment of interferences, reduction of
uncertainty and constraints
Benefits: improving constraints analysis
34/128 (27%)
20/83 (24%) 50/91 (55%)***12 24.4 2 0.000
Evaluation: constraints analysis (works very well /
works well)
38/113 (34%)
30/58 (52%)*1 50/71 (70%)***1 *2 23.9 2 0.000
H7A and H7B. Improving production
control
Benefits: improves production control
65/128 (51%)
46/83 (55%) 59/91 (65%) 4.3 2 0.116
Evaluation: production control (works very well /
works well)
39/112 (35%)
42/58 (72%)***1 58/71 (82%)***1 45.9 2 0.000
Benefits: faster response to problems
28/128 (22%)
31/83 (37%)*1
53/91 (58%)***1,
**2 30.15 2 0.000
H8A and H8B. Root causes of
delays
Benefits: root causes 32/128 (25%)
17/83 (20%)
36/91 (40%)**2
*1 8.89 2 0.012
Evaluation: root causes (works very well / works
well)
32/111 (29%)
26/59 (44%)*1 35/70 (50%)**1 9.04 2 0.011
Note: ***p<0.001; **p<0.01; *p<0.05, superscript numbers indicate system where 822
comparison is significant (1=CPM, 2=LB 3=LPS); #data is not available; respondents/total n 823

Table 6: Summary of results for the complete dataset 824
Hypotheses Support
H1: CPM is frequently used due to contractual requirements. Supported
H2: CPM is the tool of choice for critical path analysis. Supported
H3: CPM is used to support the management of contractual requirements (e.g. schedule, preconstruction tasks, estimating/bidding, project understanding).
Not supported
H4: CPM is used to support the management of delays and claims. Not supported
H5: LB use is credited with generating continuous flow and improving the use of resources. Supported
H6: LPS is credited with supporting and improving the analysis of constraints. Supported
H7A: LB is credited with supporting and improving production control. Supported
H7B: LPS is associated with supporting and improving production control. Supported
H8A: LB is credited with supporting and improving the identification of the root causes of delays. Not supported
H8B: LPS is credited with supporting and improving the identification of the root causes of delays. Partially supported
H9: The perceived benefits of CPM by users are mostly related to the PM approach. Not supported
H10: The perceived benefits of LB and LPS by users are mostly related to the PPM approach. Supported
825

Figure 1: Systems characteristics and related functions
Figure Click here to access/download;Figure;Figure1.pdf

Supplemental Data File
Click here to access/downloadSupplemental Data File
Questionnaire-CPM-LPS-LB.docm