Embed Size (px)
Citation preview
1
The Marine Life Information Network® for Britain and Ireland (MarLIN)
Review of Biodiversity for Marine Spatial Planning within the Firth of Clyde
Report to:
The SSMEI Clyde Pilot from the Marine Life Information Network (MarLIN).
Contract no. R70073PUR
Olivia Langmead
Emma Jackson
Dan Lear
Jayne Evans
Becky Seeley
Rob Ellis
Nova Mieszkowska
Harvey Tyler-Walters
FINAL REPORT
October 2008
Reference:
Langmead, O., Jackson, E., Lear, D., Evans, J., Seeley, B. Ellis, R., Mieszkowska, N. and Tyler-Walters, H. (2008). The Review of Biodiversity for Marine Spatial Planning within the Firth of Clyde. Report to the SSMEI Clyde Pilot from the Marine Life Information Network (MarLIN). Plymouth: Marine Biological Association of the United Kingdom. [Contract number R70073PUR]

Firth of Clyde Biodiversity Review
2
Firth of Clyde Biodiversity Review
3
Contents
Executive summary................................................................................11
1. Introduction...................................................................................15
1.1 Marine Spatial Planning................................................................15
1.1.1 Ecosystem Approach..............................................................15
1.1.2 Recording the Current Situation ................................................16
1.1.3 National and International obligations and policy drivers..................16
1.2 Scottish Sustainable Marine Environment Initiative...............................17
1.2.1 SSMEI Clyde Pilot ..................................................................17
2. Aims ............................................................................................18
3. Methodology ..................................................................................19
3.1 Data collection, collation and database construction ............................19
3.2 Data Archiving...........................................................................25
3.3 Project GIS...............................................................................25
3.4 Data Analysis and Quality Control ...................................................27
3.4.1 Spatial resolution .................................................................27
3.4.2 Data filtering.......................................................................29
3.4.3 Predictive seabed habitat types ................................................33
3.5 Identification of important areas for marine biodiversity .......................35
3.5.1 Nationally Important Marine Feature (NIMF) criteria .......................35
3.5.2 UK Biodiversity Action Plan (BAP) criteria ....................................36
3.5.3 Nationally Rare and Scarce criteria ............................................38
3.5.4 Scottish Biodiversity List criteria ...............................................38
3.5.5 Local Biodiversity Action Plan (LBAP) criteria................................39
3.5.6 Internationally important species and habitats ..............................39
3.5.7 Approaches to identifying areas of important marine biodiversity .......45
3.6 A combined hotspot approach........................................................46
3.6.1 Species richness ...................................................................49
3.6.2 Average taxonomic distinctness ................................................50
3.6.3 Priority species ....................................................................51
3.6.4 Biotope richness...................................................................52
3.6.5 Average biotope distinctness....................................................52
3.6.6 Priority biotopes ..................................................................53
3.6.7 Data output ........................................................................53
3.6.8 Combining the measure for hotspot identification ..........................54
Firth of Clyde Biodiversity Review
4
3.6.9 Analysis of predictive seabed habitat type data ............................ 54
3.6.10 Agreement among measures.................................................... 54
3.6.11 Confidence ........................................................................ 54
4. Results and interpretation ................................................................. 56
4.1 Locally important species and habitats ............................................ 56
4.2 Distribution of priority species ...................................................... 59
4.3 Distribution of priority habitats ..................................................... 80
4.4 Species Hotspots ....................................................................... 93
4.5 Biotope Hotspots......................................................................100
4.6 Combined scores for species and biotopes .......................................106
4.7 Predictive seabed habitat type diversity .........................................111
4.8 Concordance among measures......................................................114
4.9 Gaps analysis ..........................................................................114
4.9.1 Spatial distribution of data ....................................................115
4.9.2 Species and habitat data.......................................................116
4.9.3 Variation in data quality .......................................................117
5. Conclusions and recommendations ......................................................119
5.1 The occurrence, distribution and extent of intertidal and subtidal species and habitats .........................................................................................119
5.1.1 Limitations .......................................................................120
5.1.2 Recommendations for future data collation and collection for MSP....120
5.2 Application of existing criteria for the identification of important marine biodiversity within MSP ......................................................................122
5.3 Identification of areas of biodiversity interest within the Firth of Clyde ...122
5.4 Recommendations for using the results of the current study in MSP.........123
6. References ..................................................................................126

Firth of Clyde Biodiversity Review
5
List of Tables
Table 1. Quality assessment (QA) criteria. ...................................................20
Table 2. Marine Data Archive Centres (mDACs); role, remit and status. ................25
Table 3. Filtering process for species data: proportion of records discarded at each stage.................................................................................................29
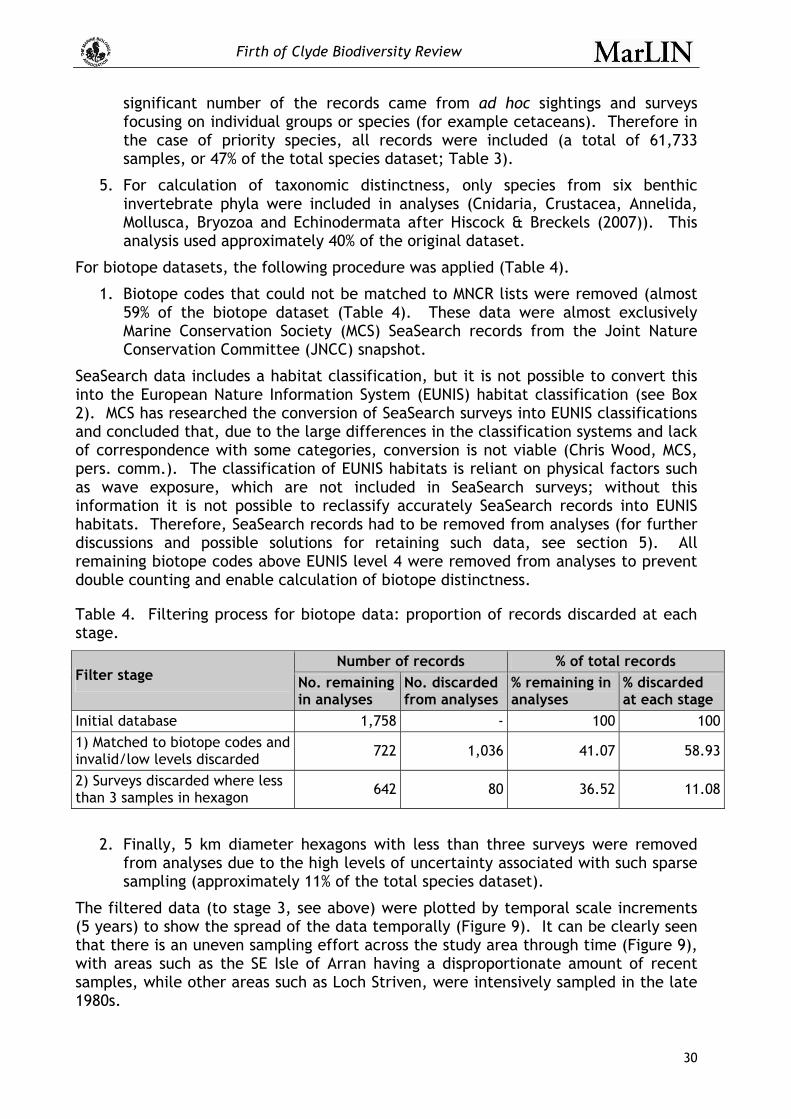
Table 4. Filtering process for biotope data: proportion of records discarded at each stage.................................................................................................30
Table 5. Comparison of the criteria for international, national and local species and habitats priority lists..............................................................................43
Table 6. Examples of the measures used identify “hotspots”.............................46
Table 7. Matrix used to calculate confidence rating for each hexagon..................55
Table 8. Agreement between the different measures used in the hotspot analysis and hotspot scores.................................................................................... 115
List of Figures
Figure 1. The Scottish Sustainable Marine Environment Initiative Clyde Pilot study area. .................................................................................................18
Figure 2. The spatial distribution of data by quality across the Firth of Clyde for species sample data...............................................................................21
Figure 3. The spatial distribution of data by quality across the Firth of Clyde for habitat sample data...............................................................................22
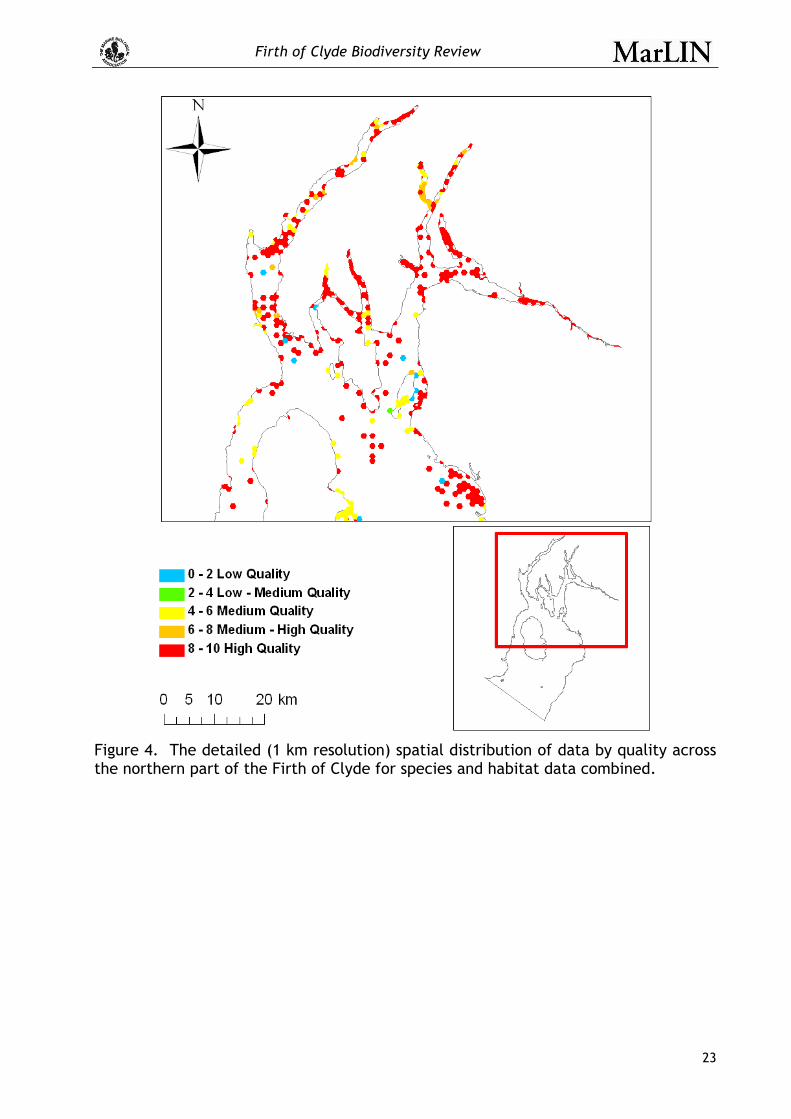
Figure 4. The detailed (1 km resolution) spatial distribution of data by quality across the northern part of the Firth of Clyde for species and habitat data combined........23
Figure 5. The detailed (1 km resolution) spatial distribution of data by quality across the southern part of the Firth of Clyde for species and habitat data combined........24
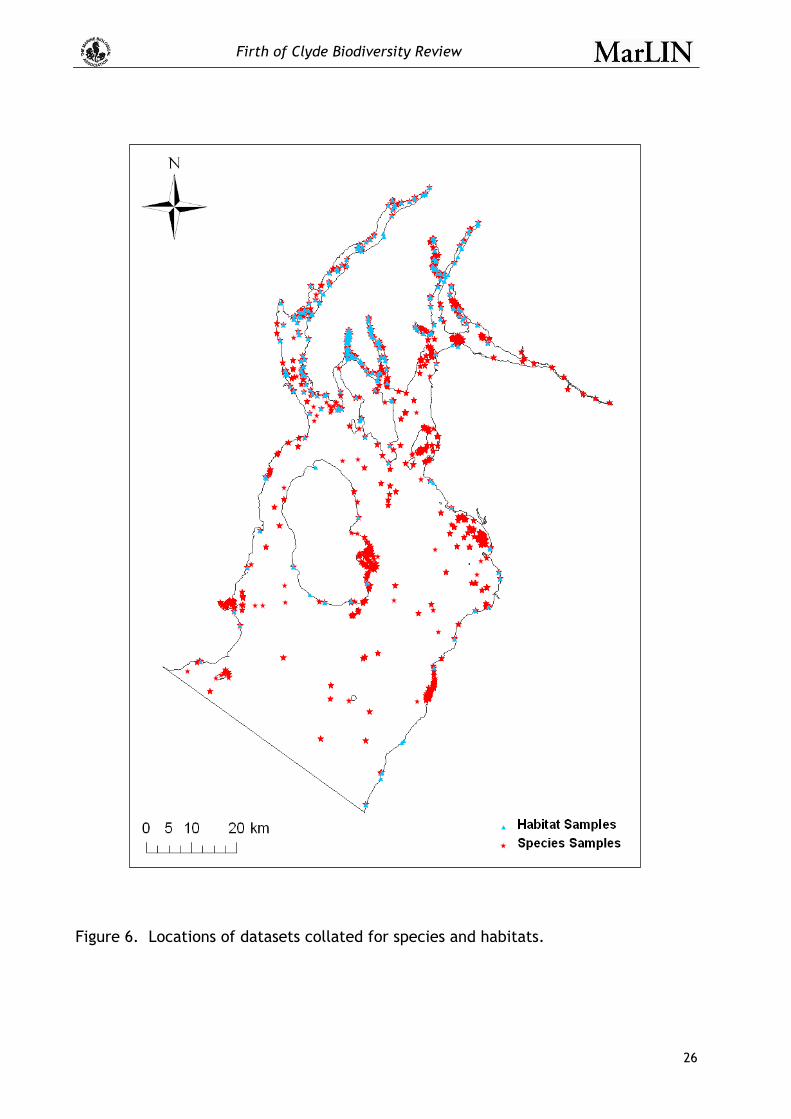
Figure 6. Locations of datasets collated for species and habitats........................26
Figure 7. The mean number of samples for hexagons of different size and the area of the Firth of Clyde not covered by hexagons with sample data. ...........................27
Figure 8. Number of samples encompassed by hexagon units of a) 1 km diameter, b) 2.5 km diameter, c) 7.5 km diameter and d) 10 km diameter.............................28
Figure 9. Spatio-temporal spread of species data, plotted by sample year (aggregated at 5 year intervals). ...............................................................................32
Figure 10. Spatial distribution of a) species and b) habitat records (number of samples per 5 km diameter hexagon). .........................................................33
Figure 11. Map of predictive seabed habitat types for the Firth of Clyde. .............34
Figure 12. Procedure for identifying marine biodiversity hotspots from survey data .48
Figure 13. Average species distinctness (∆+) funnel plot showing data points within predictive seabed habitat type A1 (littoral rock and other hard substrata) for each hexagon. ............................................................................................51

Firth of Clyde Biodiversity Review
6
Figure 14. Distribution of protected areas in the region surrounding the Firth of Clyde................................................................................................ 57
Figure 15. Areas of local importance within the northern Firth of Clyde according to local expert knowledge. Features were mapped at a coarse level and vary widely in size, so this map is only indicative of locations and not the actual boundaries of features. ........................................................................................... 58
Figure 16. Areas of local importance within the southern Firth of Clyde according to local expert knowledge. Features were mapped at a coarse level and vary widely in size, so this map is only indicative of locations and not the actual boundaries of features. ........................................................................................... 59
Figure 17. Known distribution of Biodiversity Action Plan (BAP) species in the Firth of Clyde within the data set collated for this project (see section 4.9 and Appendix 4). 61
Figure 18. Distribution of Local Biodiversity Action Plan (LBAP) species records in the Firth of Clyde...................................................................................... 62
Figure 19. Distribution of candidate Nationally Important Marine Features (cNIMF) species records in the Firth of Clyde. ......................................................... 63
Figure 20. Distribution of candidate Nationally Important Marine Features (cNIMF) species plotted with NIMF designation criteria: a) decline, b) proportional importance, c) rarity and d) threat of decline. ............................................................. 64
Figure 21. Distribution of OSPAR species records in the Firth of Clyde. ................ 65
Figure 22. Distribution of nationally rare and scarce species records in the Firth of Clyde................................................................................................ 66
Figure 23. Distribution of Scottish Biodiversity List species records in the Firth of Clyde................................................................................................ 67
Figure 24. Distribution of cetacean and seal records in the Firth of Clyde. ............ 68
Figure 25. Distribution of marine reptile records (loggerhead and leatherback turtles) in the Firth of Clyde.............................................................................. 69
Figure 26. Distribution of priority demersal and benthic fish records in the Firth of Clyde................................................................................................ 70
Figure 27. Distribution of priority Annelida species records in the Firth of Clyde. ... 71
Figure 28. Distribution of priority ribbon worm (Nemertina) species records in the Firth of Clyde...................................................................................... 72
Figure 29. Distribution of priority sponge (Porifera) species records in the Firth of Clyde................................................................................................ 73
Figure 30. Distribution of priority sea squirt (Tunicata) species records in the Firth of Clyde................................................................................................ 74
Figure 31. Distribution of priority crustacean (Crustacea) species records in the Firth of Clyde. ........................................................................................... 75
Figure 32. Distribution of priority echinoderm (Echinodermata) species records in the Firth of Clyde...................................................................................... 76
Figure 33. Distribution of priority molluscan (Mollusca) species records in the Firth of Clyde................................................................................................ 77
Firth of Clyde Biodiversity Review
7
Figure 34. Distribution of priority cnidarian (Cnidaria) species records in the Firth of Clyde. ...............................................................................................78
Figure 35. Distribution of priority maerl species records in the Firth of Clyde.........79
Figure 36. Distribution of Habitats Directive Annex I habitats in the Firth of Clyde area. .................................................................................................81
Figure 37. Distribution of Biodiversity Action Plan (BAP) habitats in the Firth of Clyde area. .................................................................................................82
Figure 38. Distribution of local Biodiversity Action Plan (LBAP) habitats in the Firth of Clyde area. .........................................................................................83
Figure 39. Distribution of Scottish Biodiversity List habitats in the Firth of Clyde area........................................................................................................84
Figure 40. Distribution of candidate Nationally Important Marine Feature (cNIMF) habitats in the Firth of Clyde area. ............................................................85
Figure 41. Distribution of OSPAR listed habitat records in the Firth of Clyde. .........86
Figure 42. Distribution of priority habitat A1 (littoral rock and other hard substrata) records in the Firth of Clyde.....................................................................87
Figure 43. Distribution of priority habitat A2 (littoral sediment) records in the Firth of Clyde. ...............................................................................................88
Figure 44. Distribution of priority habitat A3 (infralittoral rock and other hard substrata) records in the Firth of Clyde. ......................................................89
Figure 45. Distribution of priority habitat A4 (circalittoral rock and other hard substrata) records in the Firth of Clyde. ......................................................90
Figure 46. Distribution of priority habitat A5 (sublittoral sediment) records in the Firth of Clyde. .....................................................................................91
Figure 47. Distribution of priority habitat B3 (rocks, cliffs, ledges and shores including the supralittoral) records in the Firth of Clyde...............................................92
Figure 48. Species hotspot scores for the Firth of Clyde...................................95
Figure 49. Species richness scores, averaged by seabed habitat type, for the Firth of Clyde (3 = high, 2 = medium, 1 = low). ........................................................96
Figure 50. Priority species scores for the Firth of Clyde. ..................................97
Figure 51. Taxonomic distinctness scores for the Firth of Clyde (3 = high, 2 = medium, 1 = low). ............................................................................................98
Figure 52. Confidence levels for species data used to identify hotspot measures (see section 3.6.11 for method of assessing confidence). ........................................99
Figure 53. Biotope hotspot scores for the Firth of Clyde................................. 101
Figure 54. Biotope richness scores for the Firth of Clyde. ............................... 102
Figure 55. Biotope distinctness scores for the Firth of Clyde. .......................... 103
Figure 56. Priority biotope scores for the Firth of Clyde................................. 104
Figure 57. Confidence levels for biotope data used to identify hotspot measures (see section 3.6.11 for method of assessing confidence). ...................................... 105
Firth of Clyde Biodiversity Review
8
Figure 58. Combined hotspot scores plotted against Scottish Biodiversity List species records. ...........................................................................................107
Figure 59. Confidence levels for data used to identify combined hotspot measures (see section 3.6.11 for method of assessing confidence). ................................108
Figure 60. Species hotspots plotted against records of Scottish Biodiversity list species.............................................................................................109
Figure 61. Species hotspots plotted against NIMF species records......................110
Figure 62. Number of predictive seabed habitat types in each 5 km diameter hexagon for the Firth of Clyde. ..........................................................................112
Figure 63. Diversity (H’ – see section 3.6.9) of predictive seabed habitat types in each 5 km diameter hexagon for the Firth of Clyde..............................................113
Figure 64. Distribution of a) under represented (less than 20% of hexagons containing seabed type have associated samples) and b) unrepresented seabed habitat types (no samples for those seabed types in any of the hexagonal units)..........................116
Firth of Clyde Biodiversity Review
9
List of Appendices
Appendix 1. Data provider contacts, their affiliation and outcomes of requests for data................................................................................................ 129
Appendix 2. Metadata schema for project ................................................. 131
Appendix 3 Permission document ............................................................ 133
Appendix 4. Priority species and habitat lists for the Firth of Clyde................... 135
Appendix 5. Source priority species and habitats lists. .................................. 149
Appendix 6. Analyses for scoring diversity indices ........................................ 175
Appendix 7. Harbour porpoise encounter rates per standard hour (JNCC cetacean data). The resolution of these data were too coarse to be included in analyses. ... 189
Appendix 8. Hotspot Annexes................................................................. 191
Appendix 9. Results for 5 hexagons for extra records including records to genus level in analysis......................................................................................... 193

Firth of Clyde Biodiversity Review
10
List of Abbreviations
BAP Biodiversity Action Plan BGS British Geological Survey BODC British Oceanographic Data Centre Cefas Centre for Environment, Fisheries and Aquaculture Sciences COAST Community of Arran Seabed Trust DASSH Data Archive for Seabed Species and Habitats EUNIS European Nature Information System ESRI Environmental Systems Research Institute FRS Fisheries Research Services GIS Geographic Information System IACMST Inter-Agency Committee on Marine Science and Technology UKHO UK Hydrographic Office JNCC Joint Nature Conservation Committee LRC Local Record Centre MarClim Marine Biodiversity and Climate Change MarLIN Marine Life Information Network MBA Marine Biological Association MCS Marine Conservation Society mDAC Marine Data Archive Centre MDIP Marine Data Information Partnership MEDAG Marine Environmental Data Advisory Group MEDIN Marine Environmental Data Information Network MESH Mapping European Seabed Habitats MNCR Marine Nature Conservation Review NIMF Nationally Important Marine Feature NMBL National Marine Biological Library NTS (Scotland) National Trust for Scotland OS Ordnance Survey QA Quality Assessment SAMS Scottish Association for Marine Science SEPA Scottish Environmental Protection Agency SNH Scottish Natural Heritage SMRU Sea Mammal Research Unit SSMEI Scottish Sustainable Marine Environment Initiative WoRMS World Register of Marine Species
Firth of Clyde Biodiversity Review
11
Marine Life Information Network (MarLIN)
The Review of Biodiversity for Marine Spatial Planning within the Firth of Clyde
Executive summary
The SSMEI Clyde Pilot is aimed at the development and delivery of more integrated and sustainable management of the marine and coastal areas of the Firth of Clyde. This will be achieved through an effective and integrated stakeholder regulator partnership, the development of a Marine Spatial Plan, together with improved decision support mechanisms and integrated decision making.
Aims
The aim of this report was to collect, collate and review the existing marine biodiversity knowledge on the Firth of Clyde and use this to identify areas of biodiversity interest and gaps in current knowledge. This comprised four key objectives.
1. Collate data on the occurrence, distribution and extent of intertidal and subtidal species (excluding birds) and habitats (biotopes) within the Firth of Clyde.
2. Review existing criteria relating to the identification of important marine biodiversity and define how this can be applied at the local level of the Firth of Clyde.
3. Assess the extent to which the available data may be used to identify areas of biodiversity interest and undertake an analysis for the Firth of Clyde.
4. Produce a project GIS and final report including an analysis of data gaps.
Data collection, collation and database construction
An extensive literature review of the biodiversity of the Firth of Clyde was carried out. The results of the literature review were combined with expert knowledge and online metadata catalogues to identify relevant data holders. Data holders were contacted, and key organizations were visited where possible. Written permission to use the data was obtained, together with permission to archive the datasets in a national archive where possible.
The resulting data collation constitutes the most comprehensive analysis of biodiversity for this region to date. A total of ca 133,000 data records were collated into an ESRI geodatabase to allow the spatial representation and analyses of species and habitat data, based on predictive seabed habitat types and 5 km diameter hexagons.
Identification of important marine biodiversity: criteria and approaches
Existing criteria for the identification of important marine biodiversity were reviewed.

Firth of Clyde Biodiversity Review
12
These included:
1. national (UK-wide) criteria for identifying candidate Nationally Important Marine Features (cNIMF) (species and habitats), UK Biodiversity Action Plan (BAP) species and habitats, nationally rare and scarce species;
2. criteria specific to devolved national and local levels, such as the Scottish Biodiversity List for marine species and habitats and local Biodiversity Action Plan species and habitats; and
3. international criteria such as the OSPAR selection criteria for species and habitats that spans the North East Atlantic biogeographic region.
Overlap between criteria was identified, and key differences between criteria discussed.
Approaches to identifying areas of important marine biodiversity were outlined and included approaches based on:
1. priority species and habitats;
2. ecosystem structure and functioning;
3. sensitivity of species/habitats to specific pressures arising from anthropogenic activities; and
4. biodiversity hotspots.
Records of conservation priority species are distributed unevenly through the Firth of Clyde. They are mostly aggregated in the sea lochs and in coastal areas, indicating a strong relationship between recorded biodiversity and sampling effort. An even more exaggerated pattern can be seen for recorded priority habitats, which are all coastal and almost entirely restricted to the sea lochs.
Combined hotspot approach
Six measures of diversity were analysed in this study to provide information about diversity at two levels of ecological organization: a) the species composition of communities and b) the diversity of biotopes (which includes aspects of the physical environment). The measures were 1) species richness, 2) average taxonomic distinctness (this was calculated for the six dominant invertebrate phyla not the entire species dataset for comparability), 3) number of priority species, 4) biotope richness, 5) average biotope distinctness and 6) the number of priority biotopes.
The results of the analysis allowed not only the identification of biodiversity hotspots for species and habitats but gave an overall picture of the recorded distribution of other “important” locations for biodiversity. These areas included BAP, LBAP and nationally rare and scare species, OSPAR and Annex I Habitats and candidate NIMFs.
Ninety of the 435 5km diameter hexagons within the Firth of Clyde had sufficient data to inform our measures of species hotpots. Of these, five key areas were identified as species hotpots: Northern Loch Fyne and Loch Shira; Irvine Bay; East of Dunoon in the upper Firth of Clyde; East of Rothesay, Bute; and the Kyle of Bute and Loch Striven. Eleven areas were identified as species “cold spots” in the analysis, scoring low for all of the measures (e.g. north of Ardmore point, Turnberry Bay, Troon point and the deeper parts of Irvine Bay and Lunderston Bay in the Upper Firth of Clyde).
Biotope information was mostly confined to the sea lochs apart from a few areas in the south east of the Firth (areas off Irvine, Turnberry Bay, Ballantrae Bay). This was
Firth of Clyde Biodiversity Review
13
because biotope information was taken from Marine Nature conservation Review (MNCR) data, which was limited to the coastal regions. Ten biotope hotspots were identified, including an area in the northern part of Loch Fyne, Loch Goil, in the mouth of Holy Loch and Ardlamont Point.
Only 38 hexagons had enough data to combine hotspot measures for species and biotopes and were confined almost entirely to the sea lochs (with the exception of two areas, near Troon and Girvan).
The mouth of Loch Shira was categorised as a hotspot for both species and biotopes, with nine further locations scoring highly including Loch Goil, the mouth of Holy Loch, the north of Loch Striven, Kyles of Bute, Ardlamont Point and Loch Fyne, near Tarbert.
Conclusions and recommendations
In conclusion, the study was limited by the availability of quality data. Hence, it was only possible to map the distribution of priority species, priority biotopes and hotspots in restricted areas of the Firth of Clyde. The issue of data coverage had implications for each stage of this project; from data collection to setting of spatial resolution, analyses, and the application of existing criteria for the identification of areas of important marine biodiversity.
The following recommendations are made.
• The time take to acquire data from disparate organizations should not be underestimated.
• Visiting data holders was an extremely productive way of mobilizing their data, as it gave the authors the opportunity to explain the importance of the study and its data needs. It also allowed data to be collected in situ.
• Data acquisition was promoted by the projects connection with a defined project, the SSMEI and the Firth of Clyde pilot. Data providers ‘bought in’ to the project’s aims and could see clear advantages in being associated with a Scottish project.
• Data providers should be made aware of the projects time frame and clear deadlines set for data acquisition.
• Data standardization (from multiple formats) and quality control are a major time constraint that should not be underestimated.
• Data collation should be undertaken in liaison with the relevant national marine Data Archive Centres.
• Using a standard scale of unit across the study area removes any spatial bias and allows a comparison of the relative importance of different areas in terms of biodiversity.
• No single measure of biodiversity is appropriate and a combination of approaches (biodiversity measures, biodiversity hotspot analysis, representativeness of all features, sensitivity assessments) should be used in the MSP.
Predictive seabed habitat type was not a good surrogate for biotope richness. Therefore, it could not be used to compensate for poor spatial coverage of survey data.
Firth of Clyde Biodiversity Review
14
• An examination of the relationships between recorded habitats and predicted habitats would allow the confidence in using the predictive seabed maps as a surrogate to be assessed but was beyond the scope of the current study.
The maps produced for this study must be considered within the context of expert knowledge of this study area. They are based on the data available but this may miss important sites that have not been formally surveyed. Hotspots reflect data availability but may not be a definitive representation of regional patterns of biodiversity. As a result, it was not possible to apply national criteria for the identification of important marine features at a local level. In particular, estimates of ‘decline’ and ‘threat’ are dependant on long–term data series (which are very limited in the study area), and expert knowledge of the locality. The next stage of this project, stakeholder review, is vital to the refinement of the diversity hotspot maps.
Firth of Clyde Biodiversity Review
15
Marine Life Information Network (MarLIN)
Review of Biodiversity for Marine Spatial Planning within the Firth of Clyde
1. Introduction
The Firth of Clyde hosts a wide variety of marine habitats and species along its 620 km coastline and within the 3,650 km2 of its sea and seabed (Figure 1). Human activities have already had a great effect on those habitats and species (e.g. heavy industry and fisheries) and, as seas become increasingly well used, there is an urgent requirement to manage local marine resources and protect biodiversity. Protection is required both to ensure the continued provision of marine ecosystem goods and services and also to safeguard areas to protect our marine natural history legacy for future generations.
1.1 Marine Spatial Planning
The currently disjointed nature of marine management is well documented (Ducrotoy & Pullen, 1999, Crowder et al., 2006). Marine Spatial Planning (MSP), delivered through Marine Spatial Plans (MSPs), is a means to bring integrated sustainable management and development of local marine resources to overcome this often sectoral or issue-based piecemeal approach.
Marine Spatial Planning is defined as “strategic, forward-looking planning for regulating, managing and protecting the marine environment, including through allocation of space, that addresses the multiple, cumulative, and potentially conflicting uses of the sea” (Defra, 2005).
MSP is seen as a way of improving decision making and delivering a more Ecosystem-Based Approach to managing marine activities. In essence, it is a planning tool that enables integrated, forward-looking and consistent decision making on the use of the sea. The main elements of MSP include an interlinked system of plans, policies and regulations; the components of environmental management systems (e.g. setting objectives, initial assessment, implementation, monitoring, audit and review); and some of the many tools that are already used for land use planning. Whatever the building blocks, the essential consideration is that they need to work across sectors and give a geographic context in which to make decisions about the use of resources, development, conservation and the management of activities in the marine environment. In addition, MSPs may also enable integration of policies that do not have a spatial dimension and can play a key role in coordinating policies with a marine dimension and aligning priorities. A central principle of MSP is The Ecosystem Approach (or Ecosystem-Based Approach), which is realized in part through recording the current situation in order to build an understanding of the patterns of biodiversity distribution. This is key to identifying important areas for marine biodiversity that require safeguarding; and the process is driven by national and international obligations and policies.
1.1.1 Ecosystem Approach
The guiding principle for the development of MSPs is the ‘Ecosystem Approach’ to sustainable development (see Box 1). This is a holistic method for the management of human activities; it looks at all the links among living and non-living resources, rather than considering single issues in isolation. Ecosystem based plans focus on the

Firth of Clyde Biodiversity Review
16
multiple activities occurring within specific areas that are defined by an ecosystem, rather than by artificial boundaries.
Box 1. The Ecosystem Approach
“The Ecosystem Approach is a strategy for the integrated management of land, water and living resources that promotes conservation and sustainable use in an equitable way. The application of the Ecosystem Approach will help to reach a balance of the three objectives of the Convention: conservation; sustainable use; and the fair and equitable sharing of the benefits arising out of the utilization of genetic resources.” Convention on Biological Diversity, 2000.
“The Ecosystem Approach is the comprehensive integrated management of human activities, based on best available scientific knowledge about the ecosystem and its dynamics, in order to identify and take action on influences which are critical to the health of the marine ecosystems, thereby achieving sustainable use of ecosystem goods and services and maintenance of ecosystem integrity.” EU Marine Strategy Stakeholder Workshop, Denmark, 4-6 December 2002.
1.1.2 Recording the Current Situation
The importance of MSP is to bring together all the relevant strategies and policies into one place and where possible integrate these to provide a framework for consistent decision making. Building an understanding of the patterns of biodiversity distribution, and in particular identifying the location of important areas for marine biodiversity that may require safeguarding, is one key element in the wider process of documenting and recording the current situation. It is also important for highlighting gaps in our knowledge and targeting future monitoring efforts.
1.1.3 National and International obligations and policy drivers
National (Scottish and UK-wide) policy drivers leading the present interest in MSP follow.
1. The Scottish Executive Strategic Framework for Scotland’s Marine Environment.
2. The commitment in the Labour Party General Election Manifesto, through a Marine Act, to introduce a new framework for the seas, based on marine spatial planning, balancing conservation, energy and resource needs.
3. The Government’s vision for the marine environment as set out in the first Marine Stewardship Report.
4. The Government’s Review of Marine Nature Conservation, particularly the Irish Sea Pilot Project.
5. The Government’s Regulatory Review of Development in Coastal and Marine Waters.
6. The UK’s Sustainable Development Strategy: Securing the Future.
At an international level, the policy drivers include the following.
1. The Bergen Declaration of the 5th North Sea Conference formally endorses ecosystem based management and includes commitments on spatial planning in the North Sea.
2. OSPAR commitments on the Ecosystem Approach and consideration of spatial planning.

Firth of Clyde Biodiversity Review
17
3. The development of the Thematic Strategy for the Protection and Conservation of the European Marine Environment (European Marine Strategy) that identified Strategic Goals including:
• to protect, allow recovery and, where practicable, restore the function and structure of marine ecosystems in order to achieve and maintain good environmental status of these ecosystems;
• to control the use of marine services and goods and other activities in marine areas that have or may have a negative impact on status of the marine environment to levels that are sustainable and that do not compromise uses and activities of future generations nor the capacity of marine ecosystems to respond to changes; and
• to apply the principles of good governance, both within Europe and globally.
1.2 Scottish Sustainable Marine Environment Initiative
The Scottish Sustainable Marine Environment Initiative (SSMEI) is a unique and innovative approach to develop an overall marine planning framework for Scotland. The SSMEI aims to develop and then test the benefits of possible new management framework options for the sustainable development of Scotland's marine resources through the establishment of a number of pilot projects. The Scottish Sustainable Marine Environment Initiative (SSMEI) was instigated by the Scottish Government in November 2002. The framework options should embrace the concept of the Ecosystem-Based Approach to protection measures, and will be tested through the implementation of a number of pilot management schemes. An important aspect of the project is that it runs across several government agencies within Scotland and links directly with other relevant UK initiatives.
The Pilot projects are an important step forward in MSP. A significant aspect of the SSMEI process, unlike other MSP projects that have gone before, is that these plans are intended to be implemented by the relevant bodies as a material consideration in planning consents and inform the development of future terrestrial development plans.
1.2.1 SSMEI Clyde Pilot
The SSMEI Clyde Pilot is aimed at the development and delivery of more integrated and sustainable management of the marine and coastal areas of the Firth of Clyde (Figure 1). This will be achieved through an effective and integrated stakeholder regulator partnership, the development of a Marine Spatial Plan, together with improved decision support mechanisms and integrated decision making.
The MSP will include a voluntary approach to solutions that can be achieved through co-operation and compromise rather than the implementation of new legislation, a novel approach. An example of such an approach has been the creation of the Community Marine Conservation Area in Lamlash Bay, which was formerly a voluntary agreement between the local community and fishermen but has recently been designated as Scotland’s first No-Take Zone. Local Coastal Partnerships have been recognised by stakeholders as an important mechanism for the delivery of such voluntary agreements.

Firth of Clyde Biodiversity Review
18
Figure 1. The Scottish Sustainable Marine Environment Initiative Clyde Pilot study area.
2. Aims
The aim of the project reported on here was to collect, collate and review the existing marine biodiversity knowledge on the Firth of Clyde and use this to identify areas of biodiversity interest and gaps in current knowledge.

Firth of Clyde Biodiversity Review
19
This comprised four key objectives.
1. Collate data on the occurrence, distribution and extent of intertidal and subtidal species (excluding birds) and habitats (biotopes) within the Firth of Clyde.
2. Review existing criteria relating to the identification of important marine biodiversity and define how this can be applied at the local level of the Firth of Clyde.
3. Assess the extent to which the available data may be used to identify areas of biodiversity interest and undertake and analysis for the Firth of Clyde.
4. Produce a project GIS and final report including an analysis of data gaps.
3. Methodology
The study involved an intense period of data collection and collation, followed by quality assurance. Subsequent data analysis examined the distribution of priority and important species and habitats, and the examination of biodiversity hotspots.
3.1 Data collection, collation and database construction
A search of the electronic resources maintained and managed by the National Marine Biological Library (NMBL) (over 240,000 articles in the peer-reviewed and grey literature) was completed prior to commencing the data collation exercise. This yielded published data that were used directly and it also indicated organizations collecting or holding data within the Firth of Clyde study area. The SSMEI team had previously undertaken a similar search and the lists were compared to ensure all potential data sources had been identified.
Key data holders were also identified from initial discussions with the SSMEI team and SNH, in addition to the expert knowledge of the project team. The following online data and metadata catalogues were also queried to return data within the study area.
• Marine Life Information Network (MarLIN).
• Mapping European Seabed Habitats (MESH).
• Marine Environmental Data Information Network (MEDIN) Metadata Discovery Portal.
Additionally, data collected as part of the MarClim (Marine Biodiversity and Climate Change) project (2001-2005), co-ordinated by the Marine Biological Association (MBA), were included in the data catalogue.
Site visits were arranged to key organizations and individuals identified as holding data relevant to the study area. Visits allowed a level of engagement with the data providers and provided an opportunity to discuss the aims of the project and the mechanisms by which the data would be captured, transformed and utilized. Visits also identified other relevant data holders and allowed the capture of anecdotal and non-published information regarding important species and habitats within the Firth of Clyde. It was not possible to visit all relevant parties during the time scheduled in the region and a number of contacts were made via phone and email.
The lengthy mobilization time for certain data prevented their use in the study (e.g. seal haul out data (SMRU), harbour porpoise and basking shark data (University of

Firth of Clyde Biodiversity Review
20
Plymouth), basking shark data (MCS)). Other data were discarded due to their coarse resolution, such as the JNCC cetacean data.
Data holders were informally consulted regarding their specific local knowledge of the region and additional local experts were identified for their knowledge of the Firth of Clyde and contacted. Consultees included representatives of the angling industry, dive industry, local recreational divers and conservationists. Stakeholder opinions were used to identify locally important marine sites for education, research and recreation. A detailed list of all contacts and outcomes is provided in Appendix 1.
A project data catalogue was established for the storage and management of data captured during the duration of the project. Metadata for each dataset was completed at the time of data capture and entered into an ISO 19115 and UK GEMINI compatible metadata catalogue (Appendix 2). For each dataset, an assessment was made on the quality of the data based on criteria set out in the ISO 19115 standard for geospatial metadata (ISO, 2006) and using guidelines set out in Rackham & Walker (2006) (Table 1).
Table 1. Quality assessment (QA) criteria.
Overall QA Spatial accuracy
Taxonomic accuracy
Methodological accuracy QA procedure
High Good quality data, internally quality assessed, high confidence of accuracy of position and species identification
Accurate positioning system used i.e. GPS
Surveyors with expert knowledge or data verified by taxonomic expert, few errors expected
Standard methodology used and documented in detail
Rigorous internal (and possibly external) QA procedures documented
Medium Good quality data, may lack internal QA, full documentation or may have some spatial/ taxonomic ambiguity
Positions estimated from charts or OS maps by surveyor
Surveyors with good natural history background potential errors in difficult to identify groups
Standard methodology used but not supported by documentation
Some internal (or external) QA on a more ad hoc basis not necessarily documented or standardized
Low Data with spatial/ taxonomic ambiguities and/or little documentation and/or no internal QA
Positions estimated from charts or OS maps by DASSH1
Volunteer/ other non-expert surveyors errors possible for non-common and easy to identify species
Little information on methodology or indications that no set methodology was used
No QA procedures documented
Unknown Unknown Unknown Unknown Unknown Unknown
Data were also graded on survey quality using the following three categories with respect to field surveyors:
• professional and academic;
1 Data Archive for Seabed Species and Habitats (DASSH)
Firth of Clyde Biodiversity Review
21
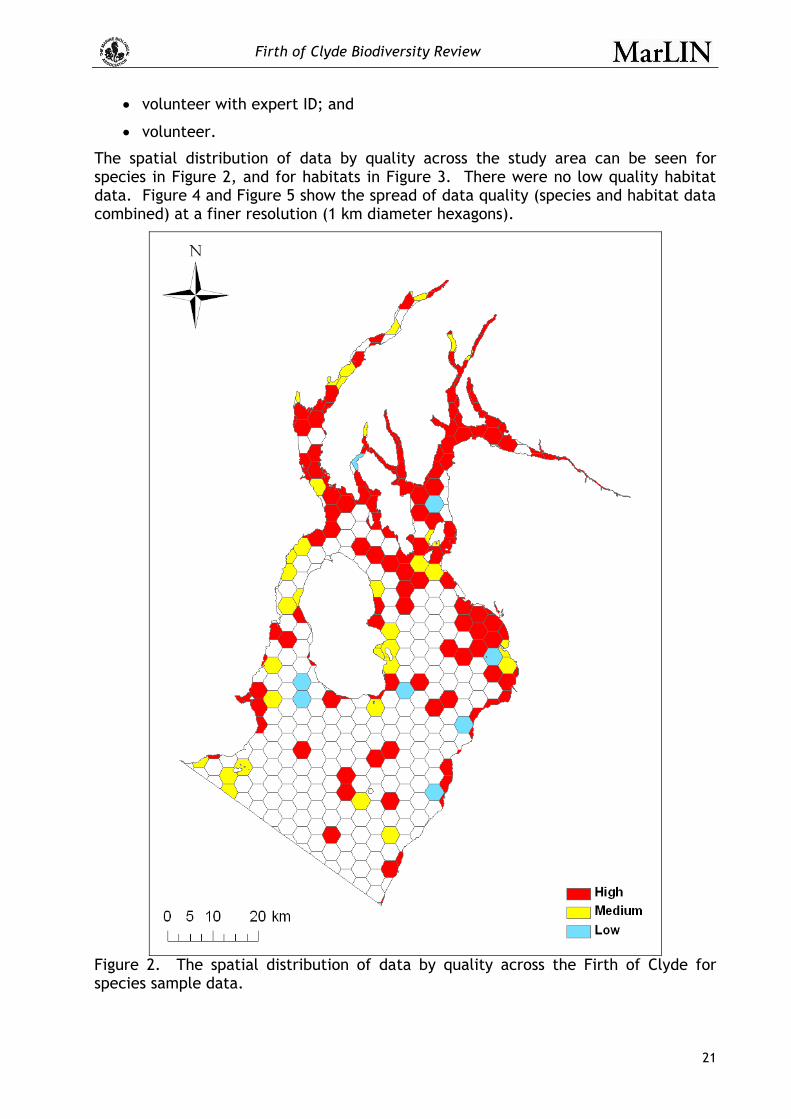
• volunteer with expert ID; and
• volunteer.
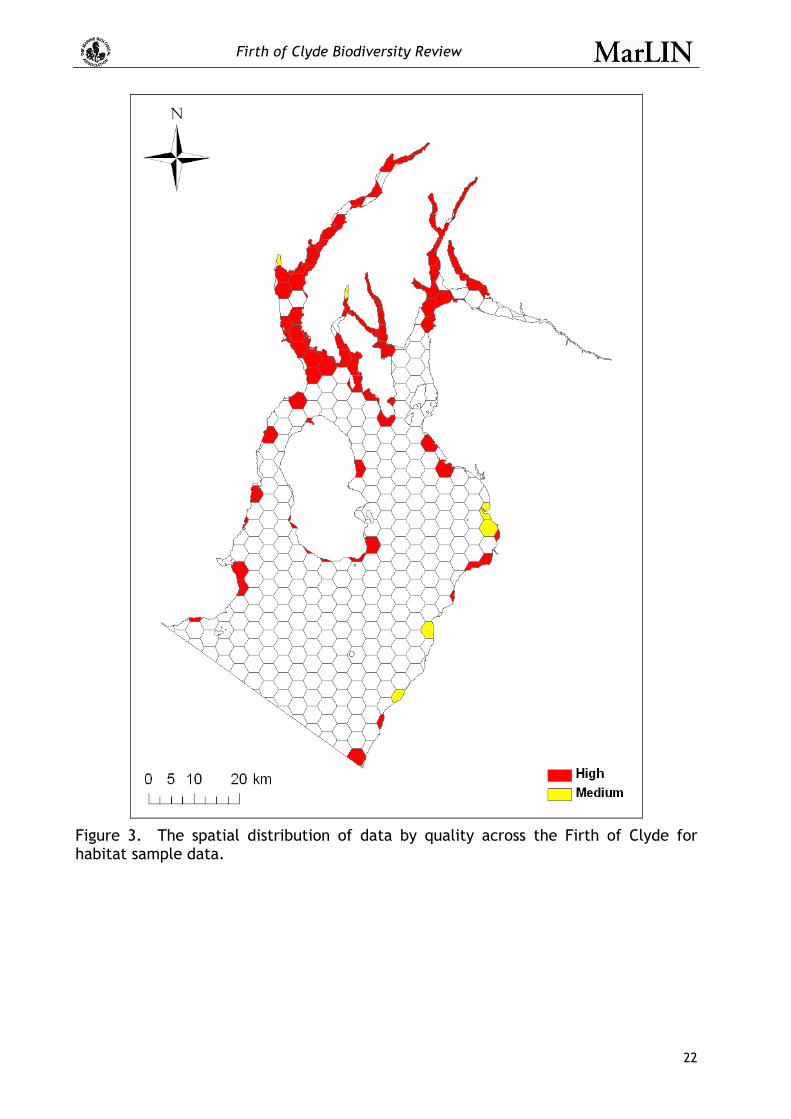
The spatial distribution of data by quality across the study area can be seen for species in Figure 2, and for habitats in Figure 3. There were no low quality habitat data. Figure 4 and Figure 5 show the spread of data quality (species and habitat data combined) at a finer resolution (1 km diameter hexagons).
Figure 2. The spatial distribution of data by quality across the Firth of Clyde for species sample data.
Firth of Clyde Biodiversity Review
22
Figure 3. The spatial distribution of data by quality across the Firth of Clyde for habitat sample data.
Firth of Clyde Biodiversity Review
23
Figure 4. The detailed (1 km resolution) spatial distribution of data by quality across the northern part of the Firth of Clyde for species and habitat data combined.

Firth of Clyde Biodiversity Review
24
Figure 5. The detailed (1 km resolution) spatial distribution of data by quality across the southern part of the Firth of Clyde for species and habitat data combined.
Firth of Clyde Biodiversity Review
25
3.2 Data Archiving
The Marine Environmental Data Information Network (MEDIN) provides guidance and best practice information on the archiving, management and dissemination of data in the marine sector. MEDIN was established in April 2008 by the merger of MEDAG (Marine Environmental Data Advisory Group) and MDIP (Marine Data Information Partnership) under the auspices of IACMST (Inter-Agency Committee on Marine Science and Technology).
A key mechanism for the delivery and management of data within the MEDIN framework is the network of marine Data Archive Centres (mDACs, Table 2).
Table 2. Marine Data Archive Centres (mDACs); role, remit and status.
Data archive centre Role/remit Status
British Geological Survey (BGS)
Sea floor geophysics and geology
MEDIN accredited mDAC
British Oceanographic Data Centre (BODC)
Water column oceanography MEDIN accredited mDAC
Data Archive for Seabed Species and Habitats (DASSH)
Benthic marine life MEDIN accredited mDAC
UK Hydrographic Office (UKHO)
Hydrography and navigation data
MEDIN accreditation pending
During the data collation exercise data providers were requested to provide written permission to allow any data used by the project to be archived at the appropriate MEDIN mDAC (metadata schema can be found in Appendix 2 and the permission form in Appendix 3). By archiving the data within the MEDIN framework of mDACs, the long-term storage and availability of the data can be assured. Additionally, permission was sought to progress relevant biodiversity data to the National Biodiversity Network.
3.3 Project GIS
All GIS work undertaken was carried out using ESRI ArcGIS 9.2. A geodatabase was established to manage the spatial information collated during the project. Initial layers were created to display the distribution of species and habitats within the study area. This was achieved by plotting records by latitudinal and longitudinal coordinates (using the WGS84 coordinate system2) onto a base map of the Firth of Clyde (Figure 1). Information about each taxa or habitat record was then overlaid for each location. The locations of all the species and habitat datasets collated are shown in Figure 6. To ensure the project geodatabase was compatible with the version used by the SSMEI team (ArcGIS 9.1), an ArcGIS 9.1 geodatabase was created with the spatial data and layers generated.
2 The World Geodetic System defines a reference frame for the Earth, for use in geodesy and navigation. The latest revision is WGS 84 dating from 1984 (last revised in 2004), which will be valid up to about 2010.
Firth of Clyde Biodiversity Review
26
Figure 6. Locations of datasets collated for species and habitats.

Firth of Clyde Biodiversity Review
27
3.4 Data Analysis and Quality Control
Once the data were compiled into the geodatabase, a series of procedures were carried out to establish the spatial resolution for analyses and filter the data to remove low quality data, after which analyses were carried out.
3.4.1 Spatial resolution
The identification of suitable spatial units is governed by the sampling coverage at a particular study area. For the Firth of Clyde, a GIS layer containing a 5 km diameter hexagonal grid was generated using the Jenness Enterprises repeating shapes tool (Jenness, 2005). In total, 435 hexagons were generated for the Firth of Clyde study area. Hexagonal units were chosen because these are most commonly used for spatial planning (Bassett & Edwards, 2003, Worm et al., 2003, Oetting et al., 2006), and because they offered the best alignment to complex features, such as the UK coastline, ensuring a better level of coverage. A 5 km hexagon was selected as the optimal unit since lower resolution would mean samples3 were so sparse that many spatial units were empty or had low (<3) samples. Larger units would have lost resolution in the data and also meant that greater areas of the Firth of Clyde would not have been used in the analysis (see Figure 7 and Figure 8).
Figure 7. The mean number of samples for hexagons of different size and the area of the Firth of Clyde not covered by hexagons with sample data.
3 For the purposes of this work, a ‘sample’ is defined as a data collection unit that is unique in space and time, i.e. one sediment core sample replicate, one whale watching cruise, one video survey transect.

Firth of Clyde Biodiversity Review
28
a)
b)
c)
d)
Figure 8. Number of samples encompassed by hexagon units of a) 1 km diameter, b) 2.5 km diameter, c) 7.5 km diameter and d) 10 km diameter.

Firth of Clyde Biodiversity Review
29
3.4.2 Data filtering
The data were subjected to a series of temporal and spatial filters to remove low quality or inadequate information. For species datasets the procedure outlined in Table 3 was applied.
1. For monitoring data, only the most recent surveys at each location were included in analyses. Much of these data orignate from impact assessments and the survey sites may have changed over the course of the monitoring period, becoming degraded or recovering. For this reason, only the most up to date information for each site was included (the temporal cut-off varied by location). The removal of older surveys in the filtering process removed approximately 35% of the total records for species) (Table 3).
2. Data points that fell outside of the Firth of Clyde study area were removed from analyses (approximately 3.5% of the total species dataset (Table 3).
3. Many of the species records were only accurate to genus level, which can cause artificial inflation of species richness because, for example, a database query would identify Gibbula sp. and Gibbula umbilicalis as two different species from the genus Gibbula when only one may be present in a sample. Therefore, only records accurate to species level were included in the analysis. Recorded species names were checked against the World Register of Marine Species database (WoRMS, 2007) to ensure all species names were standardized in terms of spelling and synonyms. This step in the filtering process removed almost 14% of the total number of species records (Table 3).
Table 3. Filtering process for species data: proportion of records discarded at each stage.
Number of records % of total records Filter stage No. remaining
in analyses No. discarded from analyses
% remaining in analyses
% discarded at each stage
Initial database 130,865 - 100 - 1) Removal of all repeat survey data apart from most recent at each location
84,481 46,384 64.56 35.44
2) Removal of any data points that fell outside the Firth of Clyde study area
79,883 4,598 61.04 3.51
3) Species matched to WoRMS lists and invalid/lower than species level names were discarded
61,733 18,150 47.17 13.87
4) Samples discarded where less than 3 occurred in a hexagon 57,466 4,267 43.91 3.26
5) Data filtered to retain the 6 benthic invertebrate phyla for taxonomic distinctness analyses 52,373 5,093 40.02 3.89
4. Finally, 5 km diameter hexagons with less than three samples were removed from analyses due to the high levels of uncertainty associated with such sparse sampling (approximately 3.26% of the total species dataset). The only exception to this was when scoring occurrences of priority species, where a
Firth of Clyde Biodiversity Review
30
significant number of the records came from ad hoc sightings and surveys focusing on individual groups or species (for example cetaceans). Therefore in the case of priority species, all records were included (a total of 61,733 samples, or 47% of the total species dataset; Table 3).
5. For calculation of taxonomic distinctness, only species from six benthic invertebrate phyla were included in analyses (Cnidaria, Crustacea, Annelida, Mollusca, Bryozoa and Echinodermata after Hiscock & Breckels (2007)). This analysis used approximately 40% of the original dataset.
For biotope datasets, the following procedure was applied (Table 4).
1. Biotope codes that could not be matched to MNCR lists were removed (almost 59% of the biotope dataset (Table 4). These data were almost exclusively Marine Conservation Society (MCS) SeaSearch records from the Joint Nature Conservation Committee (JNCC) snapshot.
SeaSearch data includes a habitat classification, but it is not possible to convert this into the European Nature Information System (EUNIS) habitat classification (see Box 2). MCS has researched the conversion of SeaSearch surveys into EUNIS classifications and concluded that, due to the large differences in the classification systems and lack of correspondence with some categories, conversion is not viable (Chris Wood, MCS, pers. comm.). The classification of EUNIS habitats is reliant on physical factors such as wave exposure, which are not included in SeaSearch surveys; without this information it is not possible to reclassify accurately SeaSearch records into EUNIS habitats. Therefore, SeaSearch records had to be removed from analyses (for further discussions and possible solutions for retaining such data, see section 5). All remaining biotope codes above EUNIS level 4 were removed from analyses to prevent double counting and enable calculation of biotope distinctness.
Table 4. Filtering process for biotope data: proportion of records discarded at each stage.
Number of records % of total records Filter stage No. remaining
in analyses No. discarded from analyses
% remaining in analyses
% discarded at each stage
Initial database 1,758 - 100 100 1) Matched to biotope codes and invalid/low levels discarded 722 1,036 41.07 58.93
2) Surveys discarded where less than 3 samples in hexagon 642 80 36.52 11.08
2. Finally, 5 km diameter hexagons with less than three surveys were removed from analyses due to the high levels of uncertainty associated with such sparse sampling (approximately 11% of the total species dataset).
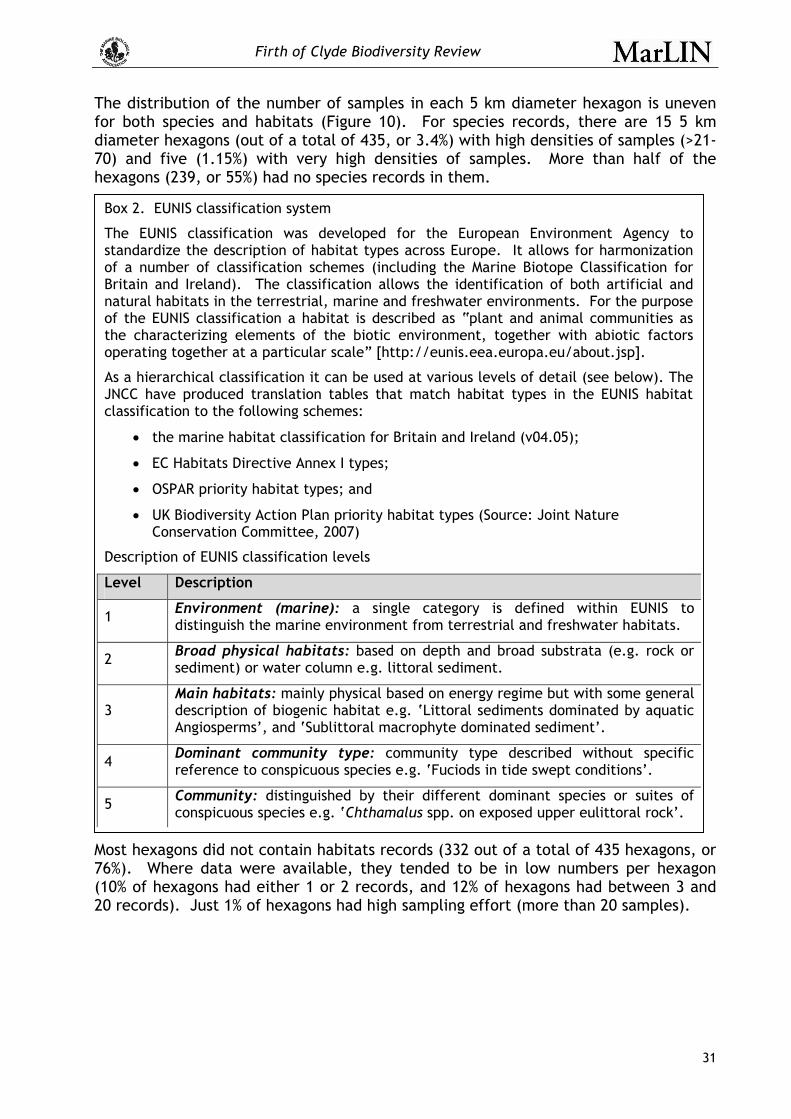
The filtered data (to stage 3, see above) were plotted by temporal scale increments (5 years) to show the spread of the data temporally (Figure 9). It can be clearly seen that there is an uneven sampling effort across the study area through time (Figure 9), with areas such as the SE Isle of Arran having a disproportionate amount of recent samples, while other areas such as Loch Striven, were intensively sampled in the late 1980s.
Firth of Clyde Biodiversity Review
The distribution of the number of samples in each 5 km diameter hexagon is uneven for both species and habitats (Figure 10). For species records, there are 15 5 km diameter hexagons (out of a total of 435, or 3.4%) with high densities of samples (>21-70) and five (1.15%) with very high densities of samples. More than half of the hexagons (239, or 55%) had no species records in them.
M7(2
Box 2. EUNIS classification system
The EUNIS classification was developed for the European Environment Agency to standardize the description of habitat types across Europe. It allows for harmonization of a number of classification schemes (including the Marine Biotope Classification for Britain and Ireland). The classification allows the identification of both artificial and natural habitats in the terrestrial, marine and freshwater environments. For the purpose of the EUNIS classification a habitat is described as “plant and animal communities as the characterizing elements of the biotic environment, together with abiotic factors operating together at a particular scale” [http://eunis.eea.europa.eu/about.jsp].
As a hierarchical classification it can be used at various levels of detail (see below). The JNCC have produced translation tables that match habitat types in the EUNIS habitat classification to the following schemes:
• the marine habitat classification for Britain and Ireland (v04.05);
• EC Habitats Directive Annex I types;
• OSPAR priority habitat types; and
• UK Biodiversity Action Plan priority habitat types (Source: Joint Nature Conservation Committee, 2007)
Description of EUNIS classification levels
Level Description
1 Environment (marine): a single category is defined within EUNIS to distinguish the marine environment from terrestrial and freshwater habitats.
2 Broad physical habitats: based on depth and broad substrata (e.g. rock or sediment) or water column e.g. littoral sediment.
3 Main habitats: mainly physical based on energy regime but with some general description of biogenic habitat e.g. ‘Littoral sediments dominated by aquatic Angiosperms’, and ‘Sublittoral macrophyte dominated sediment’.
4 Dominant community type: community type described without specific reference to conspicuous species e.g. ‘Fuciods in tide swept conditions’.
5 Community: distinguished by their different dominant species or suites of conspicuous species e.g. ‘Chthamalus spp. on exposed upper eulittoral rock’.
31
ost hexagons did not contain habitats records (332 out of a total of 435 hexagons, or 6%). Where data were available, they tended to be in low numbers per hexagon 10% of hexagons had either 1 or 2 records, and 12% of hexagons had between 3 and 0 records). Just 1% of hexagons had high sampling effort (more than 20 samples).
Firth of Clyde Biodiversity Review
32
Figure 9. Spatio-temporal spread of species data, plotted by sample year (aggregated at 5 year intervals).

Firth of Clyde Biodiversity Review
33
a)
b)
Figure 10. Spatial distribution of a) species and b) habitat records (number of samples per 5 km diameter hexagon).
3.4.3 Predictive seabed habitat types
Terrestrial habitat mapping techniques are often difficult to apply to the marine environment given the higher costs associated with direct surveys. Therefore, an alternative approach was developed (JNCC, 2004). The approach involves the creation of a model of the environment based on observed correlations between habitats and environmental data, such as depth or current speed. This technique has been used for broad scale national and international projects such as UKSeaMap (Connor et al., 2006) and MESH4.
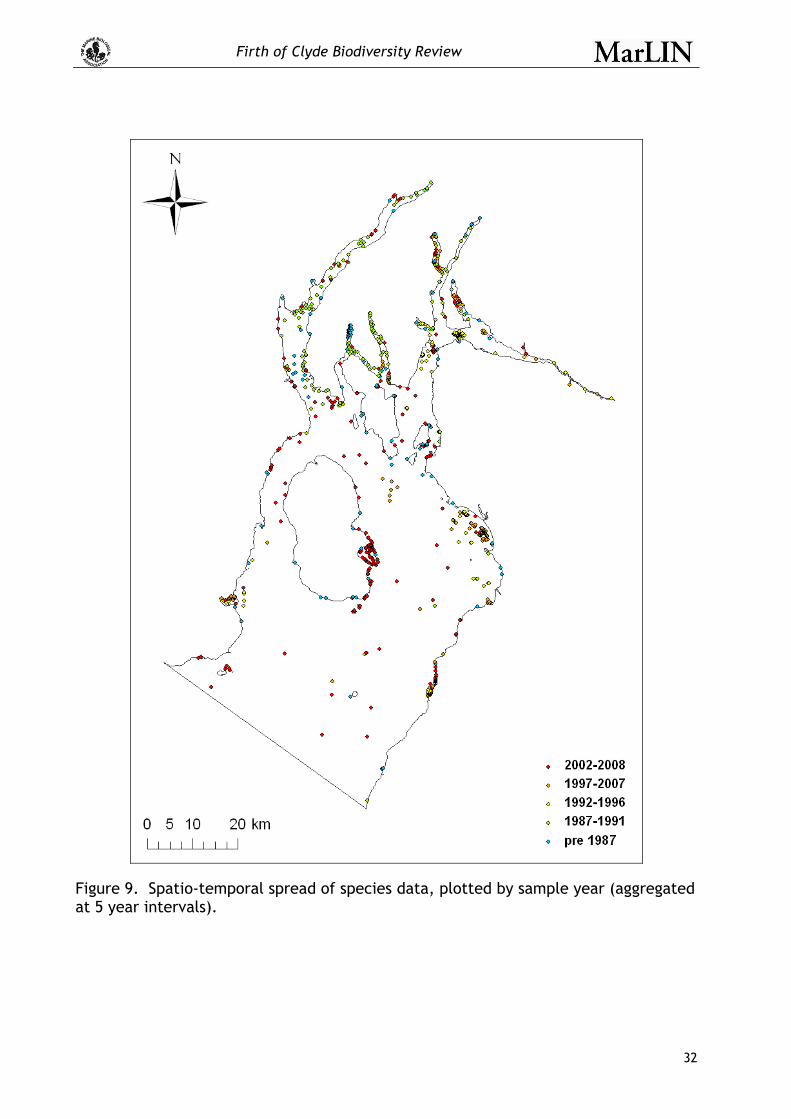
A fine scale study was carried out to map modelled habitats for the Firth of Clyde study area (Tresadern, 2008). Cartographic modelling was used and the following environmental characteristics were incorporated: 1) height and bathymetry, 2) seabed type, 3) biology, 4) energy regime and 5) salinity. While the resultant maps broadly agreed with the coarser scale UKSeaMap and MESH outputs, no ground-truthing has yet taken place so overall accuracy is unknown. Furthermore, the quality of the predictive seabed habitat map (or model that underpins it) is related to the data used to construct it, which in most cases are not ideally fit for this purpose. However, the predictive seabed type map (Figure 11) represents the best knowledge
4 Mapping European Seabed Habitats (MESH) - http://www.searchmesh.net/
Firth of Clyde Biodiversity Review
34
available on seabed habitat types in the Firth of Clyde at present. Hence, it was used in the design of the analysis.
Figure 11. Map of predictive seabed habitat types for the Firth of Clyde.
GIS layers of the predictive seabed habitat type provided by SSMEI (Tresadern, 2008) were imported into the project geodatabase. These predicted seabed habitats were aggregated to EUNIS level 2 (see Box 2) for all subsequent analyses to reduce the number of types and allow greater data coverage and improve confidence.
Firth of Clyde Biodiversity Review
35
3.5 Identification of important areas for marine biodiversity
The priority species and habitats lists for the Firth of Clyde are given in Appendix 4 and the original national and international source lists are shown in Appendix 5.
3.5.1 Nationally Important Marine Feature (NIMF) criteria
The criteria to identify Nationally Important Marine Features (NIMF) (species and habitats) were identified by the Review of Marine Nature Conservation (Connor et al., 2003). Within the context of NIMF, national refer to the UK, rather than Scotland. The criteria (Box 3) include proportional importance, rarity, decline and threat of decline. Under the guidance of the Marine Priority List Review Group of the UK Priority Species and Habitats Review Working Group, a final set of criteria for NIMF species and habitats were developed together with guidelines for their application.
Box 3. Nationally Important Marine Features (NIMF) criteria.
CRITERION 1: Proportional Importance
A high proportion of the populations of a species (at any time of its life cycle) occurs within the UK. This may be related to either global or regional extent of the feature. Species are categorised as follows:
Global importance: a high proportion of the global population of a species (at any time of its life cycle) occurs within the UK. ‘High proportion’ is considered to be more than 25%.
Regional importance: a high proportion of the regional population of a species (at any time of its life cycle) occurs within the UK. ‘Regional’ refers to the north-east Atlantic (OSPAR) area. ‘High proportion’ is considered to be more than 30%.
CRITERION 2: Rarity
Marine species that are sessile or of restricted mobility (at any time in their life cycle) are considered nationally rare if distribution is restricted to a limited number of locations. For pragmatic reasons, species are considered rare if recorded in eight or less 10 km squares (0.5%) within the 3 mile territorial seas limit of UK waters. The figure is calculated for the UK as a whole and with the Isle of Man so that rarity is assessed in a relevant geographical area and for a distance offshore that includes most of the variable habitats before the level sediment plain is reached (see Sanderson et al., 1996 for explanation.)
NB. A mobile species qualifies as nationally rare if the total population size is known, inferred or suspected to be fewer than 250 mature individuals. Vagrant species should not be considered under this criterion.
CRITERION 3: Decline
An observed, estimated, inferred or suspected significant decline (exceeding expected or known natural fluctuations) in numbers, extent or quality of a marine species in the UK (quality refers to life history parameters). The decline may be historic, recent or current. Alternatively, a decline at a global or regional level, where there is cause for concern that the proportional importance criteria will be met within the foreseeable future. Decline in extent and quality of species at different scales should be assessed as follows:
Extent: Within the UK population of the species:
• There has been a recent significant decline in numbers of individuals/geographical range, OR
• Numbers of individuals/geographical range are presently in marked decline, OR
• The present population is at significantly lower levels than in the past as a result of human activity.
Firth of Clyde Biodiversity Review
36
Box 3. Nationally Important Marine Features (NIMF) criteria (continued).
Quality: The species has suffered a significant decline in one of more of the following:
• Loss of genetic diversity
• Loss of fecundity
• Reduction in the numbers of mature individuals
• Fragmentation of the population
CRITERION 4: Threat of decline
It is estimated, inferred or suspected that a species will suffer a significant decline (as defined under the “decline” criterion) in the foreseeable future as a result of human activity. This assessment will need to take into account inherent sensitivity, and expected degree of exposure to the effects of human activity. A species may also qualify under this criterion if there is real cause for concern that it would fulfil the proportional importance criterion in the near future due to threat of global or regional decline.
NIMF were identified in the exercise undertaken by Hiscock et al. (2006). However, it should be noted that the list of NIMF species and habitats is currently a candidate list only.
The current list of candidate NIMF species is not definitive and there are gaps in coverage across the major taxonomic groups (Hiscock et al., 2006). Some specialists approached to review groups indicated that they did not believe in the relevant concepts; polychaetes are not represented for this reason. For other groups, relevant specialists were too busy and, whilst some obvious candidates could be included, a proper analysis was not undertaken (e.g. sponges). Nevertheless, the candidate list provides the best current indication of species to be protected.
3.5.2 UK Biodiversity Action Plan (BAP) criteria
The UK Biodiversity Action Plan (BAP) criteria for marine species and habitats (Box 4) originated in terrestrial systems and the development of these criteria were purposefully designed for compatibility with the existing terrestrial and freshwater criteria. Like NIMF, this is also a UK wide listing.
Box 4. UK Biodiversity Action Plan criteria (BAP).
CRITERION 1: International threat
Assess the species’ status in either a global or a European context.
i) Use the best available knowledge e.g.
• IUCN global Red Lists
• Red Lists from individual European countries
• other (specified) authoritative sources that assess threat or decline.
ii) Where possible, use the new IUCN categories (CR, EN, VU): if Red Lists use the old IUCN criteria, treat the Rare category with caution.
iii) Red listing in >50% of countries with adequate data within the biogeographic or European range of the species, would qualify a species as internationally threatened. If this evidence is cited, please indicate the range of the species and list the countries that include it in a Red List.
iv) The revised IUCN Red List Categories and Criteria (version 3.1, published in 2001) and guidelines on their application at global and national levels are available electronically at: www.iucn.org/themes/ssc/red-lists.htm. See www.redlist.org for lists of globally threatened species.
Firth of Clyde Biodiversity Review
37
CRITERION 2: International responsibility + moderate decline in the UK
Under this criterion, a species that has declined by more than 25% in the last 25 years in the UK may qualify if the UK supports 25% or more of the global or European population. Please quantify your answer as far as possible and provide all supporting information
i) The European or global proportion can be measured in terms of grid square records, sites, numbers of individuals etc. Please provide as much data as possible.
ii) Make a special note if the species is endemic or near-endemic.
iii) The species needs to have declined by 25% or more over the past 25 years.
Box 4. UK Biodiversity Action Plan criteria (BAP) (continued).
CRITERION 3: Marked decline in the UK
A species that has declined by 50% or more over the past 25 years qualifies under this criterion.
i) Decline may have been measured or may be deduced from other evidence.
ii) If no direct evidence exists, deterioration or loss of habitat; threat to a food plant; or other relevant factors may be used as surrogates (i.e. inferred decline).
iii) Decline can be expressed in a number of possible ways, for instance as population size, range or number of occupied sites.
iv) In the absence of a 25-year run of data, decline rate will be automatically extrapolated from a shorter (or longer) period.
v) Evidence and sound reasoning must be given in support of the claim.
vi) Please give the types of record (e.g. 10 km square, 1 km square, site data) and time-span of the supporting data.
In relation to the run of data available, please provide a judgement on how appropriate the extrapolation to 25 years is, and how able the data are to be used in this context. Equally, if you have used an alternative means of measuring rate of decline, please provide the working and outline its usage in this context. If some data were ignored, or discontinuous or more than one data set was used (covering different time periods) this should be highlighted.
CRITERION 4: Other important factor(s)
Even if a species does not qualify under Criteria 1, 2 or 3 there may still be a case for listing it as Priority. However, evidence of extreme threat is required. Justifications may include reasons such as those listed below.
1. It is predicted that the species will decline by 50% in a current 25 year period, or in the next 25 years.
2. The species is believed to be long-lived (>25 years) with a low recovery potential and if action is not taken to reverse current trends then the species is likely to become extinct in the next 100 years.
3. The species is declining and is a good ‘indicator’ that represents an issue causing the decline of a range of less easily incorporated species. The species may represent a unique or favoured habitat or food source for an established or proposed BAP species.
4. The species is known to have been more abundant and widespread (i.e. population or extent twice as large+) in the recent past and, whilst the species is recovering, the factors that caused the original decline are still operating or the species’ population has not recovered to a point where it is likely to be viable in the long term.
5. The species is threatened globally or in the European seas so that the UK could become a future ‘stronghold’.
The key difference between the cNIMF criteria and BAP criteria is that the latter require quantitative measures of decline and extreme threat (supported by evidence). This is a major constraint on the number of species and habitats included since data to support these measures is often not widely available for many marine species.

Firth of Clyde Biodiversity Review
38
The criteria for identifying candidate NIMF species and habitats do not require the same quantitative rigour that proved so difficult to apply in identifying marine BAP species and habitats. The NIMF list is therefore a much better representation of marine species and habitats that are rare, in decline or threatened with decline. However, all of the BAP species and habitats are also NIMF and so the candidate NIMF list provides the most suitable measure to address the criterion ‘Area important for a priority marine feature’.
3.5.3 Nationally Rare and Scarce criteria
In addition to NIMFs and BAPs there is a list of Nationally Rare and Scarce species (Sanderson, 1996). Again, national in this context refers to UK-wide, rather than Scottish. The rare species are included as NIMFs since these criteria constitute one of the NIMF criteria but the scarce species are outside of the NIMF criteria (Box 5).
Box 5. Nationally Rare and Scarce Criteria.
NATIONALLY RARE:
Benthic marine species that are native and occur in eight or fewer of the 10 x 10 km squares (of the Ordnance Survey national grid) containing sea within the 3 mile territorial limit for Great Britain.
NATIONALLY SCARCE:
Species that occur in nine to 55 of the above squares.
In addition to these UK-wide criteria, there are also national criteria e.g. Scottish Biodiversity List and criteria at a finer scale, namely Local BAPs.
3.5.4 Scottish Biodiversity List criteria
The Scottish Biodiversity List comprises species and habitats considered to be of principal importance for the purpose of conservation of biodiversity in Scotland (Box 6). The Scottish Biodiversity List has been developed to meet the requirements of Section 2 (4) of the Nature Conservation (Scotland) 2004 Act for the conservation of biodiversity.
Box 6. Scottish Biodiversity List criteria (marine species and habitats).
CRITERION 1: Importance
All marine habitats and species included on the priority list for the UK, and which are present in Scotland.
CRITERION 2: Rarity
Species that are rare in Scottish waters, where rarity is assessed as species that occur in less than six (c. 1%) of the total number of ten km squares or less than three (c. 5%) of the ICES rectangles. A mobile species qualifies as nationally rare if the total population size is known, inferred or suspected to be fewer than 250 mature individuals. Vagrant species should not be included under this criterion.
Rare habitats are those that occur in six or fewer locations in Scottish waters.
CRITERION 3: Data deficient
Habitats that are known to be particularly important for supporting marine plant and animal assemblages that are data deficient.
CRITERION 4: Decline
An observed, estimated, inferred or suspected significant decline (exceeding expected or known natural fluctuations) in numbers, extent or quality of a marine habitat or species in Scotland (for species, quality relates to life history parameters). Significant decline should be assessed as 25% reduction of area or numbers, or other appropriate threshold (which must be stated and justified).
Firth of Clyde Biodiversity Review
39
3.5.5 Local Biodiversity Action Plan (LBAP) criteria
The criteria used to select Local Biodiversity Action Plan (LBAP) LBAP habitats and species is based on the BAP criteria (Box 7). This is implemented at a local scale; if a BAP species is present then it is automatically included on the LBAP list. LBAPS were proposed as a way of stimulating effective local action for national priorities identified in the UK Biodiversity Action Plan, as well as for species and habitats which are particularly cherished or valued in local areas of Scotland. It was envisaged as a way of refocusing the conservation work that was already underway within local authority areas but with new nationally agreed objectives.
Box 7. LBAP criteria for habitats and species.
Species criteria
CRITERION 1: Decline – species that have undergone a locally dramatic decline.
CRITERION 2: Rarity – species that are locally rare.
CRITERION 3: Threatened – species that are locally under threat.
CRITERION 4: Importance – species that have a significant number of their UK population in the locality.
CRITERION 5: Sentinel species – species that have a high profile and will therefore illustrate wider environmental issues.
CRITERION 6: Indicator species – species that can be used as indicators of habitat quality.
CRITERION 7: Characteristic species – species that are characteristic of the locality.
Habitats criteria
CRITERION 1: Decline - habitats that have a high rate of local decline.
CRITERION 2: Importance - where the local area has a high proportion of the UK resource.
CRITERION 3: Rarity - habitats that are locally rare.
CRITERION 4: Threatened - habitats that are locally under threat.
CRITERION 5: Fragmented - habitats that are locally fragmented but with the potential for repair.
CRITERION 6: Distinctive - are important for key species; and are locally distinctive.
3.5.6 Internationally important species and habitats
The UK has obligations to protect internationally important species and habitats that are listed on a variety of directives and conventions and mainly include vertebrate species. These include the Convention for the Protection of the Marine Environment of the North-East Atlantic (OSPAR). This was adopted in Paris, France in September 1992 and entered into force in March 1998. These criteria (Box 8 and Box 9) were developed to identify an initial list of species and habitats that are considered to be under immediate threat or subject to rapid decline, and were formally adopted by OSPAR in 2003.

Firth of Clyde Biodiversity Review
40
Box 8. OSPAR selection criteria for species.
CRITERION 1: Global importance
Global importance of the OSPAR area for a species. Importance on a global scale, of the OSPAR Area, for the species is when a high proportion of a species at any time of the life cycle occurs in the OSPAR Area. ‘High proportion’ is considered to be more than 75%, when known.
CRITERION 2: Local importance
Importance within the OSPAR Area, of the regions for the species where a high proportion of the total population of a species within the OSPAR Area for any part of its life cycle is restricted to a small number of locations in the OSPAR Area. ‘High proportion’ is considered to be 90% of the population in a small number of locations of 50 km x 50 km grid squares. This is dependent on scientific judgement regarding natural abundance, range or extent and adequacy of recording. A different scale may be needed for different taxa.
CRITERION 3: Rarity
A species is rare if the total population size is small. In case of a species that is sessile or of restricted mobility at any time of its life cycle, a species is rare if it occurs in a limited number of locations in the OSPAR Area, and in relatively low numbers. In case of a highly mobile species, the total population size will determine rarity.
‘A limited number of locations’ could be in a small number of 50 km x 50 km grid squares, but a different scale may be needed for different taxa. This is dependent on scientific judgement regarding natural abundance, range or extent and adequacy of recording Species which are present in high abundance outside of the OSPAR Area and only occur at the edges of the OSPAR Area will not generally qualify as ‘rare’ species.
CRITERION 4: Sensitivity
A ‘very sensitive’ species is one if very easily adversely affected by a human activity, and/or if affected is expected to only recover over a very long period, or not at all. A ‘sensitive’ species is one if easily adversely affected by a human activity, and/or if affected is expected to recover in a long period.
A ‘very long period’ may be considered to be more than 25 years and ‘long period’ in the range of 5 to 25 years. The time frame should be on an appropriate scale for that species.
Sensitivity to human activities is measured by
a. life history characteristics
b. dependence on other specific ecological attributes e.g. restricted / specific habitats requirements.
CRITERION 5: Keystone species
A species that has a controlling influence on a community.
CRITERION 6: Decline
Decline means an observed or indicated significant decline in numbers, extent or quality (quality refers to life history parameters). The decline may be historic, recent or current. ‘Significant’ need not be in a statistical sense.
‘Decline’ is divided into the following categories:
1. Extirpated (extinct within the OSPAR Area): a population of a species formerly occurring in the maritime area is defined as extirpated:
• if it was still occurring in the area at any time during the last 100 years
• and if there is a high probability, or it has been proved, that the last individuals have since died or moved away.
• or if surveys in the area have repeatedly failed to record a living individual in its former range and / or known or expected habitats at appropriate times (taking into account diurnal, seasonal, annual patterns of behaviour) for at least 10 years.
Firth of Clyde Biodiversity Review
41
Box 8. OSPAR selection criteria for species (continued).
2. Severely declined: a population of species occurring in the maritime area is defined as severely declined
• if individual numbers show an extremely high and rapid decline in the area over an appropriate time frame, or the species has already disappeared from the major part of its former range in the area.
• or if individual numbers are at a severely low level due to a long continuous and distinct general decline in the past.
3. Significantly declined: means a considerable decline in number, extent or quality beyond the natural variability and in an appropriate time frame for that species.
4. High probability of a significant decline in number, extent or quality in the future.
Box 9. OSPAR selection criteria for habitats.
CRITERION 1: Global importance (importance of the OSPAR Area for the habitat in a global context
A high proportion of the habitat occurs in the OSPAR Area. ‘High proportion’ is considered to be more than 75%, when known. This criterion may require knowledge of the distribution of habitats at a global scale.
CRITERION 2: Regional importance (importance of the sub-regions of the OSPAR Area for the habitat)
A high proportion of the habitat occurs within a specific biogeographic region and/or region of national responsibility within the OSPAR Area. ‘High proportion’ is considered to be more than 75%, when known.
CRITERION 3: Rarity
A habitat is assessed as being rare if it is restricted to a limited number of locations or to small, few and scattered locations in the OSPAR area.
‘The ‘limited number of locations’ is set at 2% of the 50 km x 50 km grid squares for each of the following three bathymetric zones:
a. littoral (intertidal zone and splash zone)
b. sublittoral (down to 200 m depth)
c. bathyal / abyssal (below 200 m depth)
The assessment is dependent on scientific judgement regarding natural abundance, range or extent and adequacy of recording.
CRITERION 4: Sensitivity
A ‘very sensitive’ habitat is one that is very easily adversely affected by a human activity and/or would be expected to, recover only over a very long period, or not at all. A ‘sensitive’ habitat is one that is easily adversely affected by a human activity and would be expected to recover only over a long period.
Sensitivity will be expressed in terms of:
a. impact of human activities (resistance)
b. capacity to recover (resilience), including a reflection of its degree of isolation or confinement to a small area.
A ‘very long period’ is considered to be more than 25 years and a ‘long period’ in the range of 5 to 25 years, dependent on the habitat. It is considered that the sensitivity of a habitat differs according to specific impacts of different human activities and, as such, should be applied at the end of the selection process with respect to the specific impacts of human activities.
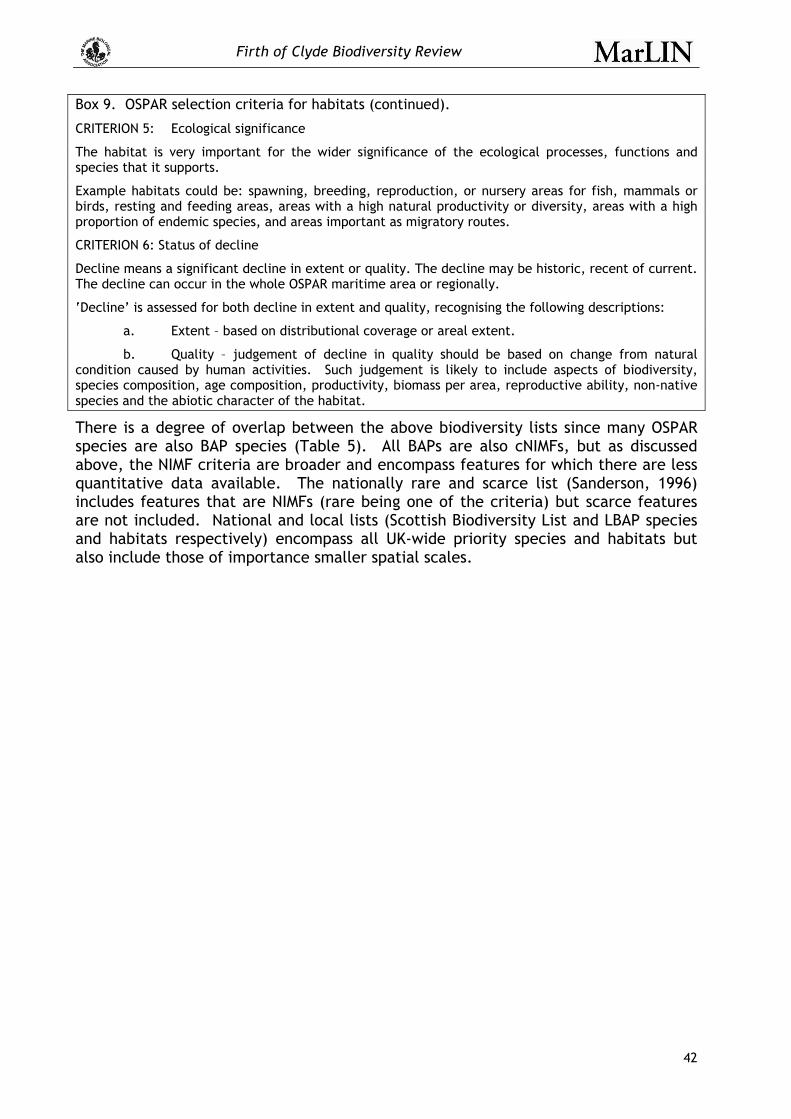
Firth of Clyde Biodiversity Review
42
Box 9. OSPAR selection criteria for habitats (continued).
CRITERION 5: Ecological significance
The habitat is very important for the wider significance of the ecological processes, functions and species that it supports.
Example habitats could be: spawning, breeding, reproduction, or nursery areas for fish, mammals or birds, resting and feeding areas, areas with a high natural productivity or diversity, areas with a high proportion of endemic species, and areas important as migratory routes.
CRITERION 6: Status of decline
Decline means a significant decline in extent or quality. The decline may be historic, recent of current. The decline can occur in the whole OSPAR maritime area or regionally.
‘Decline’ is assessed for both decline in extent and quality, recognising the following descriptions:
a. Extent – based on distributional coverage or areal extent.
b. Quality – judgement of decline in quality should be based on change from natural condition caused by human activities. Such judgement is likely to include aspects of biodiversity, species composition, age composition, productivity, biomass per area, reproductive ability, non-native species and the abiotic character of the habitat.
There is a degree of overlap between the above biodiversity lists since many OSPAR species are also BAP species (Table 5). All BAPs are also cNIMFs, but as discussed above, the NIMF criteria are broader and encompass features for which there are less quantitative data available. The nationally rare and scarce list (Sanderson, 1996) includes features that are NIMFs (rare being one of the criteria) but scarce features are not included. National and local lists (Scottish Biodiversity List and LBAP species and habitats respectively) encompass all UK-wide priority species and habitats but also include those of importance smaller spatial scales.
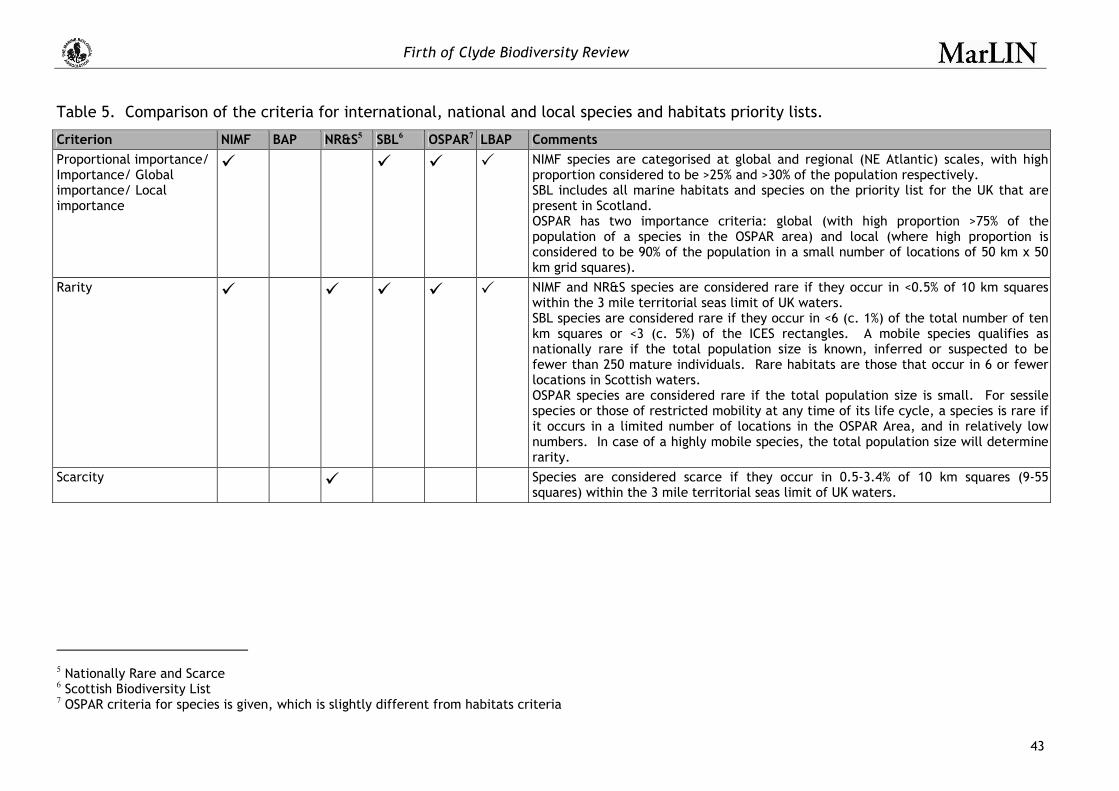
Firth of Clyde Biodiversity Review
43
Table 5. Comparison of the criteria for international, national and local species and habitats priority lists.
Criterion NIMF BAP NR&S5 SBL6 OSPAR7 LBAP Comments Proportional importance/ Importance/ Global importance/ Local importance
NIMF species are categorised at global and regional (NE Atlantic) scales, with highproportion considered to be >25% and >30% of the population respectively. SBL includes all marine habitats and species on the priority list for the UK that arepresent in Scotland. OSPAR has two importance criteria: global (with high proportion >75% of thepopulation of a species in the OSPAR area) and local (where high proportion isconsidered to be 90% of the population in a small number of locations of 50 km x 50km grid squares).
Rarity NIMF and NR&S species are considered rare if they occur in <0.5% of 10 km squareswithin the 3 mile territorial seas limit of UK waters. SBL species are considered rare if they occur in <6 (c. 1%) of the total number of tenkm squares or <3 (c. 5%) of the ICES rectangles. A mobile species qualifies asnationally rare if the total population size is known, inferred or suspected to befewer than 250 mature individuals. Rare habitats are those that occur in 6 or fewerlocations in Scottish waters. OSPAR species are considered rare if the total population size is small. For sessilespecies or those of restricted mobility at any time of its life cycle, a species is rare ifit occurs in a limited number of locations in the OSPAR Area, and in relatively lownumbers. In case of a highly mobile species, the total population size will determinerarity.
Scarcity Species are considered scarce if they occur in 0.5-3.4% of 10 km squares (9-55squares) within the 3 mile territorial seas limit of UK waters.
5 Nationally Rare and Scarce 6 Scottish Biodiversity List 7 OSPAR criteria for species is given, which is slightly different from habitats criteria

44
Criterion NIMF BAP NR&S5 SBL6 OSPAR7 LBAP Comments Decline/International responsibility and moderate decline in the UK/Marked decline in the UK
The key difference is that for NIMFs, significant decline is ‘observed, estimated,inferred or suspected’. For BAP species, moderate decline relates to a 25% decreasewhere the UK supports 25% or more of the global or European population, and markeddecline, a 50% decrease over the last 25 years. SBL considers decline as an observed, estimated, inferred or suspected significantdecline (exceeding expected or known natural fluctuations) in numbers, extent orquality of a marine habitat or species in Scotland. A significant decline is assessed as25% reduction of area or numbers, or other appropriate threshold. OSPAR considers decline in 4 categories: 1) extirpated (extinct), 2) severely declined(high and rapid decline or major range reduction or low number of individuals due tolong continuous decline), 3) significantly declined (considerable decline in number,extent or quality) and 4) high probability of a significant decline in number, extent orquality in the future.
Threat of decline NIMFs are ‘estimated, inferred or suspected’ to suffer a significant decline in theforeseeable future as a result of human activity’. For BAPS, this threat isencompassed in Criterion 4, under 1. ‘it is predicted that the species will decline by50% in a current 25 year period’; 2. ‘it is likely to become extinct in the next 100years’; and 4. ‘the species was known to have been more abundant and widespread inthe recent past…’.
International threat BAP species are assessed in either global or European context using IUCN global RedLists and Red Lists from individual European countries and other sources.
Data deficient SBL habitats that are known to be particularly important for supporting marine plantand animal assemblages that are data deficient.
Sensitivity A very sensitive species is one if very easily adversely affected by a human activity,and/or if affected is expected to only recover over a very long period, or not at all.A ‘sensitive’ species is one if easily adversely affected by a human activity, and/or ifaffected is expected to recover in a long period.
Keystone species A species that has a controlling influence on a community.
Sentinel species A species that has a high profile and will therefore illustrate wider environmentalissues.
Indicator species A species that can be used as an indicator of habitat quality.
Characteristic species A species that is characteristic of the locality.

Firth of Clyde Biodiversity Review
45
3.5.7 Approaches to identifying areas of important marine biodiversity
There are various ways in which marine biodiversity can be analysed, mapped and incorporated into Marine Spatial Planning. These include:
• identification of areas containing local, regional, national or international priority species;
• identification of areas, habitats or species of particular importance for ecosystem structure and functioning;
• identification of species and habitats likely to be sensitive to human activities and natural events; and
• identification of biodiversity hotspots.
Priority species and habitats - areas containing species or habitats of local, national and international importance can be identified to allow biodiversity to be protected at each of these scales. At a local scale, in addition to identifying areas where “important” species and habitats occur, biodiversity can be measured as species diversity and habitat diversity, both of which can be calculated in a number of ways (for example species richness, an index of diversity or taxonomic distinctness).
Regardless of the statistic or score used, measures of biodiversity are scale dependent, limited by extent (i.e. area of search, whether measured at a local, national or international scale) and resolution (the size of the sample unit, for example diversity could be examined within one sediment core, or within a planning unit, for example the 5 km diameter hexagonal units used here). In practice, both extent and resolution are defined according to conservation and management objectives or by survey limitations and methodologies, rather than by scales driven by ecosystem function.
Ecosystem structure and functioning - an Ecosystem Approach to representing marine biodiversity requires all species and habitats to be represented within protected areas and in sufficient amounts (area and population size) to allow the ecosystem to function “normally”. Despite gaps in data coverage, it may be possible to use the available data to identify areas (using predefined units such as the 5 km diameter hexagons) that allow a certain proportion of each of the habitats and species to be included in protected areas within the MSP.
Decision support software such as Marxan (Ball & Possingham, 2000) can be used to identify a number of possible areas. However, accurate targets for the proportions of each species and habitats ideally should be identified using a panel of experts who understand the minimum requirements. Such information often does not exist and arbitrary targets are chosen. Frequently, areas are identified by algorithms used in software such as Marxan based on targets but which also incorporate weightings and “locked-in” regions. These may include regions already designated for protection (e.g. Sites of Special Scientific Interest, Special Areas for Conservation) and areas identified through interviews with local scientists and managers as of high conservation importance (Beck & Odaya, 2001).
Sensitivity – another approach to incorporating important marine biodiversity into a MSP is based on sensitivity. This involves mapping landscapes, biotopes and/or species sensitive to specific pressures arising from anthropogenic activities within an area (Tyler-Walters & Hiscock, 2005). The information collated (in its entirety) during the course of this study and provided to SSMEI in the form of GIS layers could

Firth of Clyde Biodiversity Review
46
potentially be used in conjunction with sensitivity information available on MarLIN web pages to produce sensitivity maps.
Biodiversity hotspots - prioritising areas for protection comes down to cost effectiveness of the protection, in essence protecting the highest number of important species and habitats for the least cost (the exact species and habitats depend on which criteria are applied, see section 3.4). This idea drives the identification of “hotspots“. The definition of “hotpots” in the literature is variable, again reflecting management and conservation objectives, as illustrated in Table 6. Some studies focus on areas where the number of rare or declining species or habitats (or other priority species and habitats) is high. This may be because it is assumed that by focusing on priority species there will be an effective umbrella for overall species richness of an area, which is not always the case (Bonn et al., 2002). However, protecting structural or ecosystem engineer species may be effective. Some studies may use the term hotspots to describe species or habitat richness or diversity measured using specific indices (e.g. Shannon Wiener Index or Taxonomic distinctness) (see Box 10). Other studies combine a number of different measures (Reid, 1998), for example, the number of endemic species in combination with areas of threatened or declining habitats (Myers et al., 2000). A further approach is to score areas based on a number of measures (Hiscock & Breckels, 2007) to help identify locations which would protect the greatest diversity for minimum cost.
Table 6. Examples of the measures used identify “hotspots”
Measure References Endemic species Myers et al. (2000), Phillips (2001), Hughes et al. (2002) Species richness Hughes et al. (2002), Myers et al. (2000), Phillips (2001), Price
(2002), Worm et al. (2003) Priority species Hiscock & Breckels (2007) Priority habitats Hiscock & Breckels (2007), Myers et al. (2000) Habitat richness Hiscock & Breckels (2007) Taxonomic Distinctness Hiscock & Breckels (2007), Price (2002) Biotope distinctness Hiscock & Breckels (2007)
α-diversity Hooper et al. (2002), Price (2002), Worm et al. (2003)
β-diversity Hooper et al. (2002), Vanderklift et al. (1998)
γ-diversity Hooper et al. (2002), Vanderklift et al. (1998)
3.6 A combined hotspot approach
In the current study, six measures of diversity were analysed to provide information about diversity at two levels of ecological organization: a) the species composition of communities and b) the diversity of biotopes (which includes aspects of the physical environment). The measures were:
1. species richness;
2. average taxonomic distinctness (see Box);
3. number of priority species (see section 3.5);
4. biotope richness;
5. average biotope distinctness; and
6. number of priority biotopes (see section 3.5).
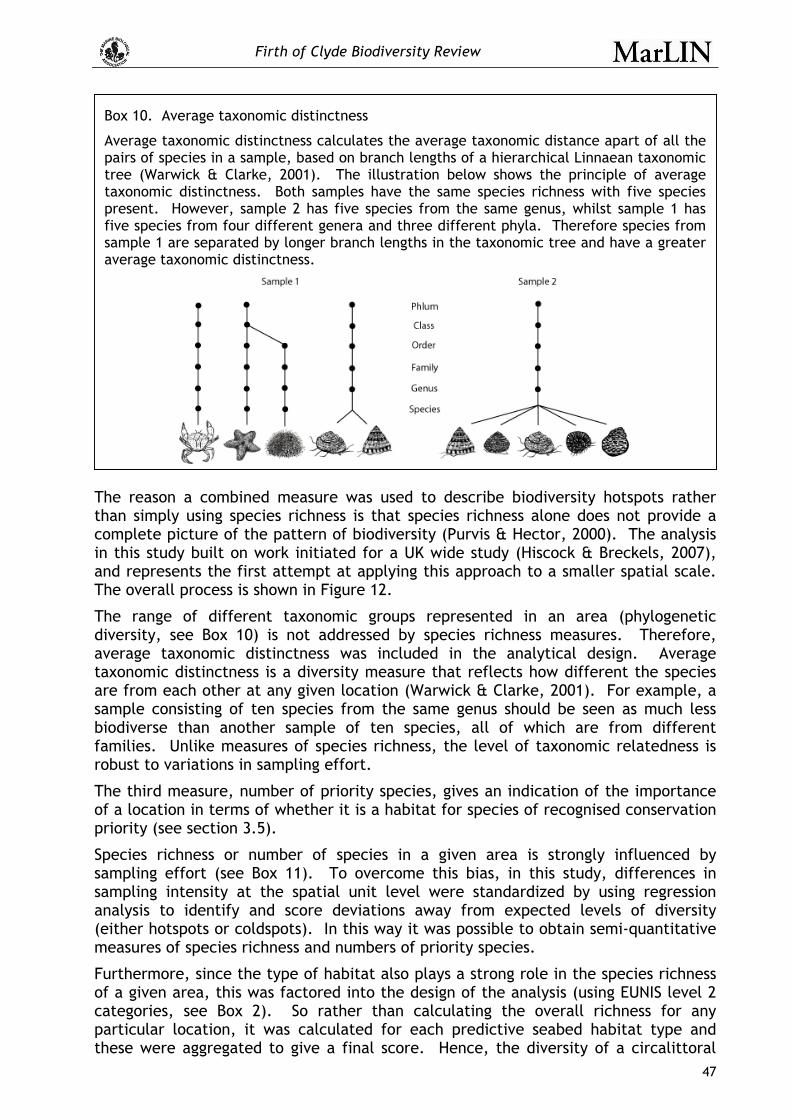
Firth of Clyde Biodiversity Review
TtciaT
Tdatasbfr
Top
Sssa(m
Focpt
Box 10. Average taxonomic distinctness
Average taxonomic distinctness calculates the average taxonomic distance apart of all thepairs of species in a sample, based on branch lengths of a hierarchical Linnaean taxonomictree (Warwick & Clarke, 2001). The illustration below shows the principle of averagetaxonomic distinctness. Both samples have the same species richness with five speciespresent. However, sample 2 has five species from the same genus, whilst sample 1 hasfive species from four different genera and three different phyla. Therefore species fromsample 1 are separated by longer branch lengths in the taxonomic tree and have a greateraverage taxonomic distinctness.
47
he reason a combined measure was used to describe biodiversity hotspots rather han simply using species richness is that species richness alone does not provide a omplete picture of the pattern of biodiversity (Purvis & Hector, 2000). The analysis n this study built on work initiated for a UK wide study (Hiscock & Breckels, 2007), nd represents the first attempt at applying this approach to a smaller spatial scale. he overall process is shown in Figure 12.
he range of different taxonomic groups represented in an area (phylogenetic iversity, see Box 10) is not addressed by species richness measures. Therefore, verage taxonomic distinctness was included in the analytical design. Average axonomic distinctness is a diversity measure that reflects how different the species re from each other at any given location (Warwick & Clarke, 2001). For example, a ample consisting of ten species from the same genus should be seen as much less iodiverse than another sample of ten species, all of which are from different amilies. Unlike measures of species richness, the level of taxonomic relatedness is obust to variations in sampling effort.
he third measure, number of priority species, gives an indication of the importance f a location in terms of whether it is a habitat for species of recognised conservation riority (see section 3.5).
pecies richness or number of species in a given area is strongly influenced by ampling effort (see Box 11). To overcome this bias, in this study, differences in ampling intensity at the spatial unit level were standardized by using regression nalysis to identify and score deviations away from expected levels of diversity either hotspots or coldspots). In this way it was possible to obtain semi-quantitative easures of species richness and numbers of priority species.
urthermore, since the type of habitat also plays a strong role in the species richness f a given area, this was factored into the design of the analysis (using EUNIS level 2 ategories, see Box 2). So rather than calculating the overall richness for any articular location, it was calculated for each predictive seabed habitat type and hese were aggregated to give a final score. Hence, the diversity of a circalittoral
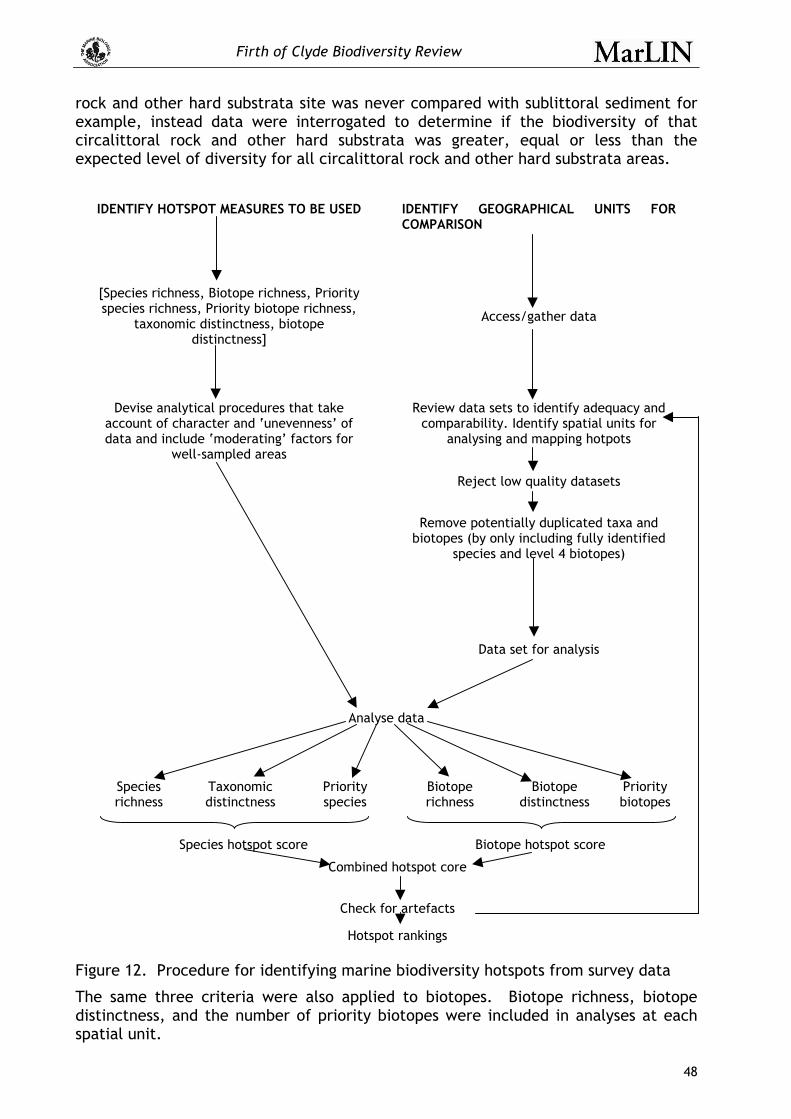
Firth of Clyde Biodiversity Review
48
rock and other hard substrata site was never compared with sublittoral sediment for example, instead data were interrogated to determine if the biodiversity of that circalittoral rock and other hard substrata was greater, equal or less than the expected level of diversity for all circalittoral rock and other hard substrata areas.
IDENTIFY HOTSPOT MEASURES TO BE USED
IDENTIFY GEOGRAPHICAL UNITS FOR COMPARISON
[Species richness, Biotope richness, Priority species richness, Priority biotope richness,
taxonomic distinctness, biotope distinctness]
Access/gather data
Devise analytical procedures that take account of character and ‘unevenness’ of data and include ‘moderating’ factors for
well-sampled areas
Review data sets to identify adequacy and comparability. Identify spatial units for
analysing and mapping hotpots
Reject low quality datasets
Remove potentially duplicated taxa and biotopes (by only including fully identified
species and level 4 biotopes)
Data set for analysis
Analyse data
Species richness
Taxonomic distinctness
Priority species
Biotope richness
Biotope distinctness
Priority biotopes
Species hotspot score
Biotope hotspot score
Combined hotspot core
Check for artefacts
Hotspot rankings
Figure 12. Procedure for identifying marine biodiversity hotspots from survey data
The same three criteria were also applied to biotopes. Biotope richness, biotope distinctness, and the number of priority biotopes were included in analyses at each spatial unit.
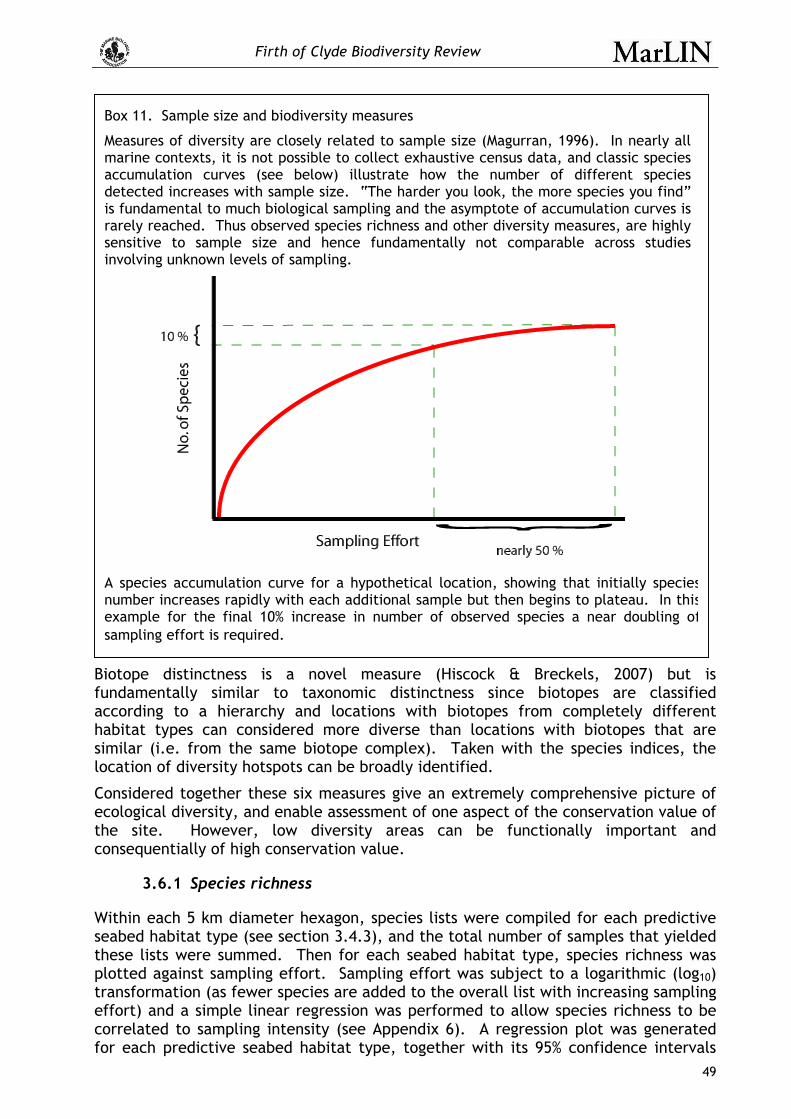
Firth of Clyde Biodiversity Review
49
Biotope distinctness is a novel measure (Hiscock & Breckels, 2007) but is fundamentally similar to taxonomic distinctness since biotopes are classified according to a hierarchy and locations with biotopes from completely different habitat types can considered more diverse than locations with biotopes that are similar (i.e. from the same biotope complex). Taken with the species indices, the location of diversity hotspots can be broadly identified.
Considered together these six measures give an extremely comprehensive picture of ecological diversity, and enable assessment of one aspect of the conservation value of the site. However, low diversity areas can be functionally important and consequentially of high conservation value.
3.6.1 Species richness
Within each 5 km diameter hexagon, species lists were compiled for each predictive seabed habitat type (see section 3.4.3), and the total number of samples that yielded these lists were summed. Then for each seabed habitat type, species richness was plotted against sampling effort. Sampling effort was subject to a logarithmic (log10) transformation (as fewer species are added to the overall list with increasing sampling effort) and a simple linear regression was performed to allow species richness to be correlated to sampling intensity (see Appendix 6). A regression plot was generated for each predictive seabed habitat type, together with its 95% confidence intervals
Box 11. Sample size and biodiversity measures
Measures of diversity are closely related to sample size (Magurran, 1996). In nearly all marine contexts, it is not possible to collect exhaustive census data, and classic species accumulation curves (see below) illustrate how the number of different species detected increases with sample size. “The harder you look, the more species you find” is fundamental to much biological sampling and the asymptote of accumulation curves is rarely reached. Thus observed species richness and other diversity measures, are highly sensitive to sample size and hence fundamentally not comparable across studies involving unknown levels of sampling.
A species accumulation curve for a hypothetical location, showing that initially speciesnumber increases rapidly with each additional sample but then begins to plateau. In thisexample for the final 10% increase in number of observed species a near doubling ofsampling effort is required.

Firth of Clyde Biodiversity Review
50
(see Appendix 6). These indicated the range where 95% of the data would fall if measurements were repeated. Each hexagon was scored from 1-3 depending on its position relative to these confidence intervals. If a location fell within the confidence intervals, it was assigned a score of 2, if it fell below the lower confidence limit, it was considered to be poor for that richness measure and assigned a score of 1. Locations that fell above the 95 % confidence limits were considered to have high values for the particular richness measure and were assigned a score of 3. Finally, to obtain one species richness score per hexagon, the median score was calculated from all the scores for each predictive seabed habitat types present. The median was used rather than the mean to aggregate scores within a hexagon since the scores were organized on a categorical scale (low = 1, expected = 2 and high = 3). Thus it was intuitive to maintain this organization and use the median (mid-point) of the scores rather than artificially create a continuous scale using the mean and lose the original significance of the numbers. Sample size was accounted for in the scoring for each predictive habitat type within a given hexagon unit (section 3.6.1). On the assumption that sample size is a function of spatial extent of each habitat, this method was not biased by different relative spatial extents of each habitat within a given hexagon.
3.6.2 Average taxonomic distinctness
Not all the species data were used in this part of the analysis as different sampling methods can result in different species being observed at different locations. Therefore, only species from six phyla were analysed (annelids, bryozoans, crustaceans, cnidarians, echinoderms and molluscs), as these phyla are widely distributed and have full taxonomic classifications.
Species lists for these six phyla were compiled for each predictive seabed habitat type (aggregated to EUNIS level 2) occurring within each 5 km diameter hexagon. The habitat type specific species lists were then used to calculate the average taxonomic distinctness, using PRIMER version 6. The analysis generated a funnel plot for each predictive seabed habitat type indicating the 95% confidence intervals for random ‘expected’ distinctness based on 1000 random permutations of the same number of species from a master list for each predictive seabed habitat type (i.e. all the species from the Firth of Clyde found in that predictive seabed habitat type). An example is shown in Figure 13, and all plots are shown in Appendix 6. Data points outside the 95% confidence interval departed significantly from random expectation (Clarke & Warwick, 1998). Hexagons with deviations below the funnel were assigned a score of 1, as these show below expected levels of taxonomic distinctness, while those above the funnel were scored 3, being higher than expected. The hexagons that fell within the area of the 95% confidence intervals (funnel area) were scored 2.
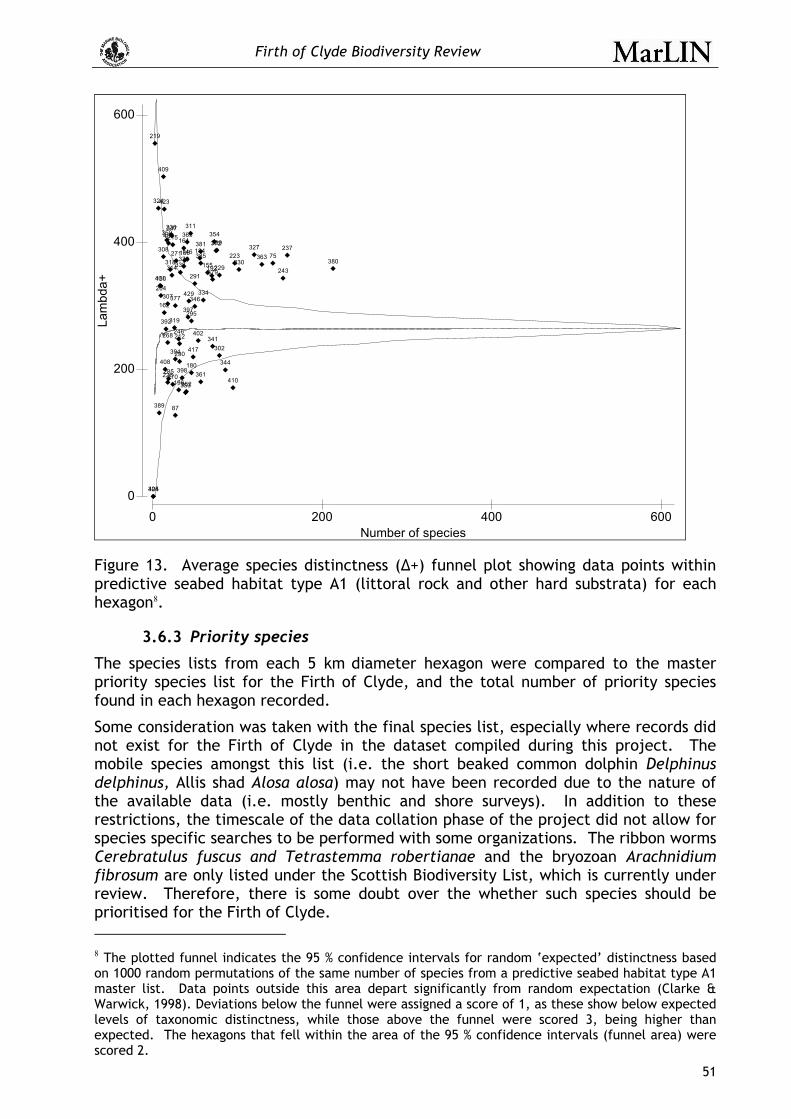
Firth of Clyde Biodiversity Review
51
0 200 400 600Number of species
0
200
400
600La
mbd
a+
75
87
146
150
155
162
164
166
170
180
184
192
196
204
212
215
219
223
226
229230
236
237
243
246268
271
285
290
291
295
302
305
307
308
311
314318
319
324
327
334
338
341
344
346
347350
352353
354
361
363
365372
373
377
379
380
381
385
389
392
394
397
398
399
401
402
407
408
409
410
417
423
424
429
Figure 13. Average species distinctness (∆+) funnel plot showing data points within predictive seabed habitat type A1 (littoral rock and other hard substrata) for each hexagon8.
3.6.3 Priority species
The species lists from each 5 km diameter hexagon were compared to the master priority species list for the Firth of Clyde, and the total number of priority species found in each hexagon recorded.
Some consideration was taken with the final species list, especially where records did not exist for the Firth of Clyde in the dataset compiled during this project. The mobile species amongst this list (i.e. the short beaked common dolphin Delphinus delphinus, Allis shad Alosa alosa) may not have been recorded due to the nature of the available data (i.e. mostly benthic and shore surveys). In addition to these restrictions, the timescale of the data collation phase of the project did not allow for species specific searches to be performed with some organizations. The ribbon worms Cerebratulus fuscus and Tetrastemma robertianae and the bryozoan Arachnidium fibrosum are only listed under the Scottish Biodiversity List, which is currently under review. Therefore, there is some doubt over the whether such species should be prioritised for the Firth of Clyde. 8 The plotted funnel indicates the 95 % confidence intervals for random ‘expected’ distinctness based on 1000 random permutations of the same number of species from a predictive seabed habitat type A1 master list. Data points outside this area depart significantly from random expectation (Clarke & Warwick, 1998). Deviations below the funnel were assigned a score of 1, as these show below expected levels of taxonomic distinctness, while those above the funnel were scored 3, being higher than expected. The hexagons that fell within the area of the 95 % confidence intervals (funnel area) were scored 2.

Firth of Clyde Biodiversity Review
52
Structural biogenic species such as horse mussels (Modiolus modiolus) and seagrass (Zostera marina) may be recorded as either habitats or species. This poses a problem, since a species record does not necessarily mean that there is a horse mussel or seagrass bed. Rather this indicates that at least one individual was encountered. For this reason only recorded observations of species and habitats were used and no inferences were made from species to habitats.
In the case of Beggiatoa habitat, this was flagged on priority lists but removed from analyses, since this is an indicator of extreme organic enrichment and a very impoverished benthic community. While it is rare, and appears on the LBAP list, it is not a biodiverse or even desirable condition.
For analyses, no restriction was placed on the number of records in each hexagon to allow all records to be included. This was particularly important to ensure the inclusion of mobile species sightings that often occurred as single records in locations with little other sampling effort. However, not all data could be included, for example it was not possible to use the JNCC cetaceans atlas since the resolution of these data are too coarse (Appendix 7).
A regression analysis was conducted on priority species (see section 3.6.1) and each hexagon was scored by setting 10 and 90 percentile limits to the regression. Hexagons at or below the 10th percentile were scored 1, hexagons above the 90th percentile were scored 3 and the remaining hexagons were scored 2 (Figure A6.10, Appendix 6).
3.6.4 Biotope richness
A biotope is the smallest geographical unit of the biosphere or of a habitat that can be delimited by convenient boundaries and is characterized by its biota (Lincoln et al., 1998). Biotope recording did not occur during all surveys and there are fewer biotope records than survey stations in the database. However, all the biotope data available were plotted on GIS and the number of biotopes recorded at each location established. Biotope richness was standardized for sampling intensity and allocated a score from 1-3 using the same method used for species richness (Figure A6.13, Appendix 6).
3.6.5 Average biotope distinctness
This method works in the same way as average taxonomic distinctness and allows insights into the variety of biotopes present at any particular location. Using the EUNIS habitat classification, all biotopes fit within a hierarchical system (Box 2 and Box 12) similar in principle to the Linnaean tree for species taxonomy. Therefore it is possible to determine how distantly related two biotopes are by determining the branch lengths between them as you can for species (Box). It may be preferable to target conservation on locations with a high level of different habitat types as well as being highly species rich or taxonomically distinct. Locations were given a score from 1-3 for average biotope distinctness under the same selection criteria as for average taxonomic distinctness.
This analysis was carried out by compiling lists of biotopes occurring in each 5 km diameter hexagon and translating them to level 4 of the EUNIS classification. A master biotope aggregation file was prepared that included all the biotopes recorded in the Firth of Clyde and their hierarchical classification. The analysis generated a funnel plot indicating the 95% confidence intervals for random ‘expected’ distinctness based on 1000 random permutations of the same number of biotopes from the master Firth of Clyde biotope list. Data points outside this area departed significantly from
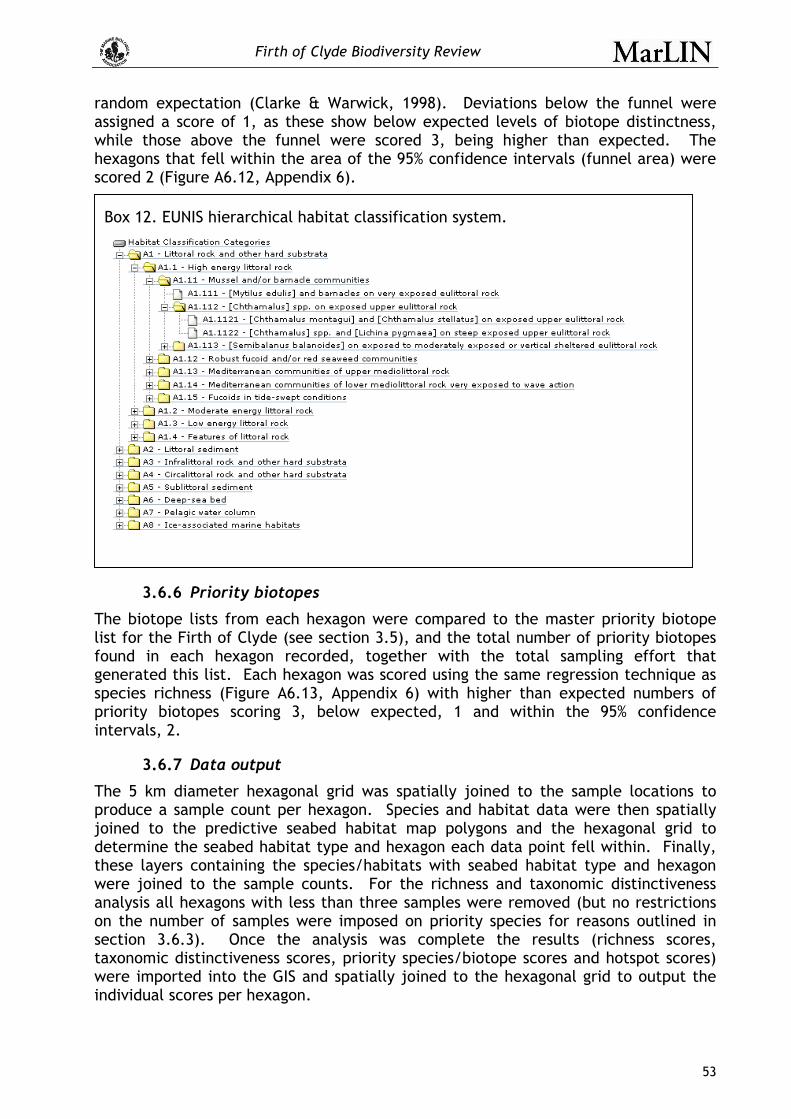
Firth of Clyde Biodiversity Review
53
random expectation (Clarke & Warwick, 1998). Deviations below the funnel were assigned a score of 1, as these show below expected levels of biotope distinctness, while those above the funnel were scored 3, being higher than expected. The hexagons that fell within the area of the 95% confidence intervals (funnel area) were scored 2 (Figure A6.12, Appendix 6).
3.6.6 Priority biotopes
The biotope lists from each hexagon were compared to the master priority biotope list for the Firth of Clyde (see section 3.5), and the total number of priority biotopes found in each hexagon recorded, together with the total sampling effort that generated this list. Each hexagon was scored using the same regression technique as species richness (Figure A6.13, Appendix 6) with higher than expected numbers of priority biotopes scoring 3, below expected, 1 and within the 95% confidence intervals, 2.
3.6.7 Data output
The 5 km diameter hexagonal grid was spatially joined to the sample locations to produce a sample count per hexagon. Species and habitat data were then spatially joined to the predictive seabed habitat map polygons and the hexagonal grid to determine the seabed habitat type and hexagon each data point fell within. Finally, these layers containing the species/habitats with seabed habitat type and hexagon were joined to the sample counts. For the richness and taxonomic distinctiveness analysis all hexagons with less than three samples were removed (but no restrictions on the number of samples were imposed on priority species for reasons outlined in section 3.6.3). Once the analysis was complete the results (richness scores, taxonomic distinctiveness scores, priority species/biotope scores and hotspot scores) were imported into the GIS and spatially joined to the hexagonal grid to output the individual scores per hexagon.
Box 12. EUNIS hierarchical habitat classification system.

Firth of Clyde Biodiversity Review
54
3.6.8 Combining the measure for hotspot identification
The species hotspot scores were calculated by taking the median of the species richness, priority species number and taxonomic distinctness scores. Similarly, the biotope hotspot scores were calculated by taking the median of the biotope richness, priority biotope number and biotope distinctness scores (for a discussion on the rationale for using the median, see section 3.6.1). Combined species and biotope hotspots were scored by adding the biotope and species scores and then categorising the sum into six separate ‘ranks’, with six being the highest score (a ‘hotspot’). With the exception of priority species, the measures used to calculate the final hotspot score were standardised by sample size. However, in order to check whether the final score was correlated with sample size we carried out a Spearman rank correlation, which showed no significant correlation.
3.6.9 Analysis of predictive seabed habitat type data
Species and habitat data were patchy within the Firth of Clyde and primarily limited to the sea lochs and areas adjacent to the coast. Predictive seabed habitat types within the Firth of Clyde provided full coverage of the region. The ability to identify potential hotspots in biodiversity was explored following the theory that increased habitat diversity leads to increased faunal diversity (Leopold, 1933).
The 5 km diameter hexagonal grid was spatially joined to the predictive seabed habitat map and the areas of each type of seabed were identified for each hexagonal unit. Using area as a proxy for abundance and predictive seabed habitat type instead of species, the diversity (Shannon Wiener H’) of predictive seabed habitat types was calculated within each hexagonal unit using PRIMER v6. The results were categorised and a map of predictive seabed habitat type hotspots was constructed. This was compared to the biotope richness analyses in order to assess whether predictive seabed habitat diversity could be used as a surrogate for biotope richness in the absence of survey data coverage.
3.6.10 Agreement among measures
An assessment of the agreement between measures of biodiversity was calculated in order to examine how well the combined scores represented their individual parts, and also to identify the potential for redundancy. To examine agreement we utilised Cohen’s Kappa statistic. The Kappa coefficient can verify that agreement exceeds chance levels and is calculated using the equation:
( )( )C
COK−−
=1
Where K is the Kappa coefficient, where O is the sum of observed agreements, and C is the sum of the products of the proportions of agreements (chance agreement). The Kappa coefficient is always less than or equal to 1. A value of 1 implies perfect agreement and values less than 1 imply less than perfect agreement. A negative value indicates that the two ratings (in this case biodiversity scores) agreed less than would be expected just by chance.
3.6.11 Confidence
A confidence rating was calculated for each hexagon based on the quality of the data and the number of samples present, using a three point categorical scale from high to low (Table 1). The quality for each hexagon was calculated by assigning numerical values to each sample (high, medium and low were allocated 3, 2 and 1 respectively)
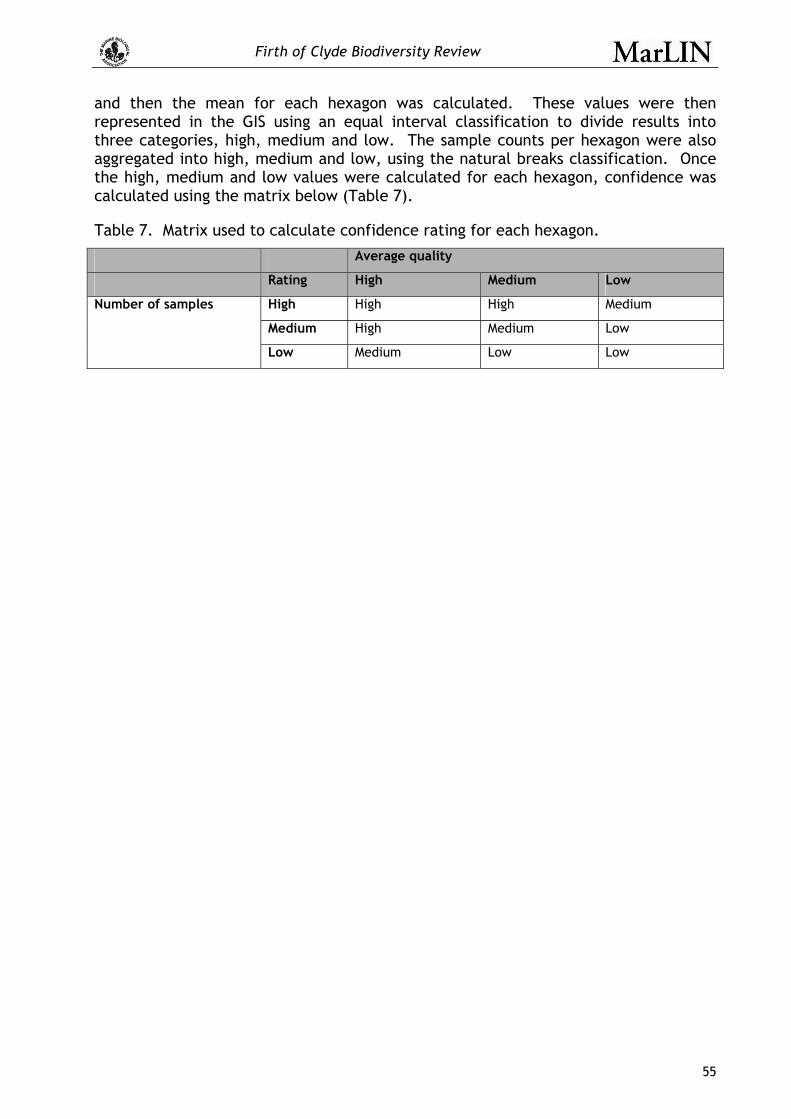
Firth of Clyde Biodiversity Review
55
and then the mean for each hexagon was calculated. These values were then represented in the GIS using an equal interval classification to divide results into three categories, high, medium and low. The sample counts per hexagon were also aggregated into high, medium and low, using the natural breaks classification. Once the high, medium and low values were calculated for each hexagon, confidence was calculated using the matrix below (Table 7).
Table 7. Matrix used to calculate confidence rating for each hexagon.
Average quality
Rating High Medium Low
High High High Medium
Medium High Medium Low
Number of samples
Low Medium Low Low
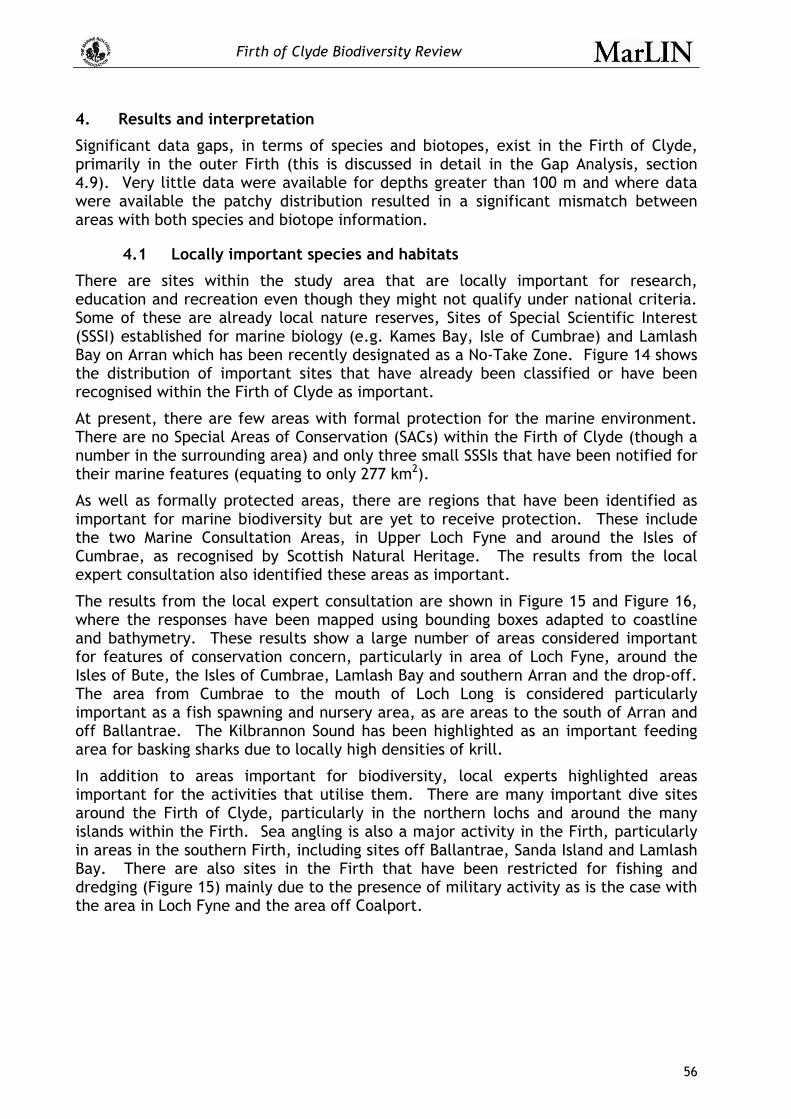
Firth of Clyde Biodiversity Review
56
4. Results and interpretation
Significant data gaps, in terms of species and biotopes, exist in the Firth of Clyde, primarily in the outer Firth (this is discussed in detail in the Gap Analysis, section 4.9). Very little data were available for depths greater than 100 m and where data were available the patchy distribution resulted in a significant mismatch between areas with both species and biotope information.
4.1 Locally important species and habitats
There are sites within the study area that are locally important for research, education and recreation even though they might not qualify under national criteria. Some of these are already local nature reserves, Sites of Special Scientific Interest (SSSI) established for marine biology (e.g. Kames Bay, Isle of Cumbrae) and Lamlash Bay on Arran which has been recently designated as a No-Take Zone. Figure 14 shows the distribution of important sites that have already been classified or have been recognised within the Firth of Clyde as important.
At present, there are few areas with formal protection for the marine environment. There are no Special Areas of Conservation (SACs) within the Firth of Clyde (though a number in the surrounding area) and only three small SSSIs that have been notified for their marine features (equating to only 277 km2).
As well as formally protected areas, there are regions that have been identified as important for marine biodiversity but are yet to receive protection. These include the two Marine Consultation Areas, in Upper Loch Fyne and around the Isles of Cumbrae, as recognised by Scottish Natural Heritage. The results from the local expert consultation also identified these areas as important.
The results from the local expert consultation are shown in Figure 15 and Figure 16, where the responses have been mapped using bounding boxes adapted to coastline and bathymetry. These results show a large number of areas considered important for features of conservation concern, particularly in area of Loch Fyne, around the Isles of Bute, the Isles of Cumbrae, Lamlash Bay and southern Arran and the drop-off. The area from Cumbrae to the mouth of Loch Long is considered particularly important as a fish spawning and nursery area, as are areas to the south of Arran and off Ballantrae. The Kilbrannon Sound has been highlighted as an important feeding area for basking sharks due to locally high densities of krill.
In addition to areas important for biodiversity, local experts highlighted areas important for the activities that utilise them. There are many important dive sites around the Firth of Clyde, particularly in the northern lochs and around the many islands within the Firth. Sea angling is also a major activity in the Firth, particularly in areas in the southern Firth, including sites off Ballantrae, Sanda Island and Lamlash Bay. There are also sites in the Firth that have been restricted for fishing and dredging (Figure 15) mainly due to the presence of military activity as is the case with the area in Loch Fyne and the area off Coalport.

Firth of Clyde Biodiversity Review
57
Figure 14. Distribution of protected areas in the region surrounding the Firth of Clyde.

Firth of Clyde Biodiversity Review
58
Figure 15. Areas of local importance within the northern Firth of Clyde according to local expert knowledge. Features were mapped at a coarse level and vary widely in size, so this map is only indicative of locations and not the actual boundaries of features.
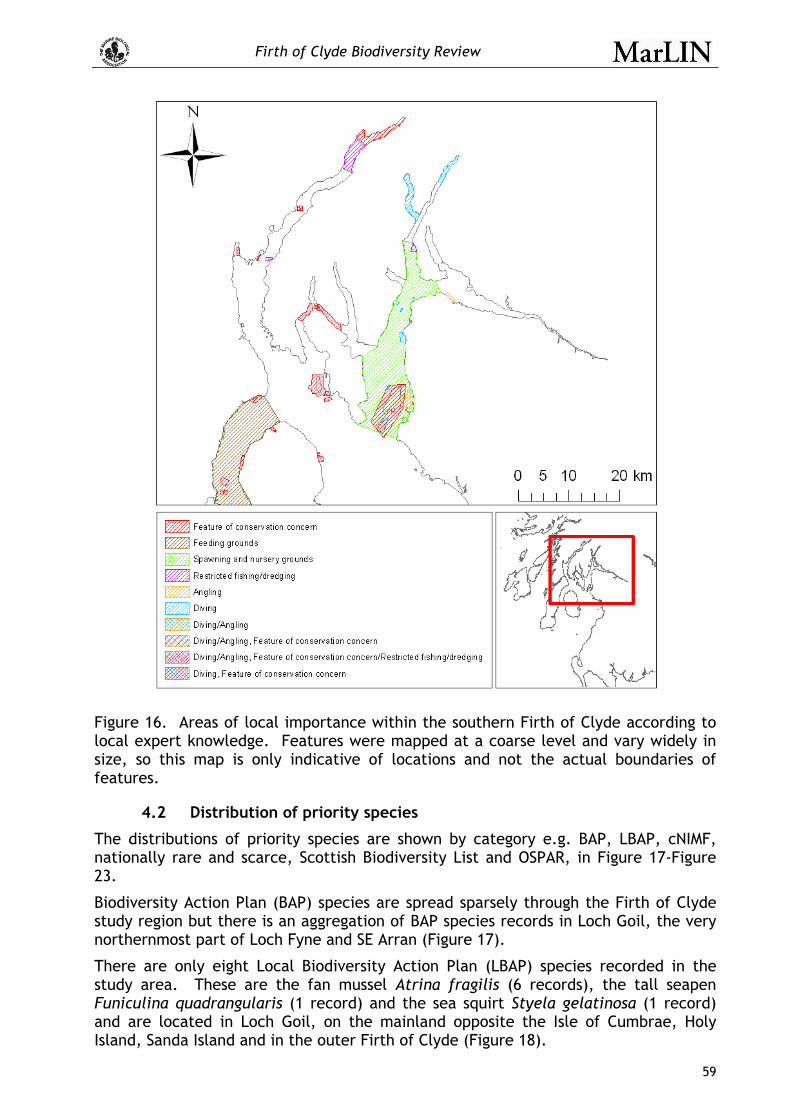
Firth of Clyde Biodiversity Review
59
Figure 16. Areas of local importance within the southern Firth of Clyde according to local expert knowledge. Features were mapped at a coarse level and vary widely in size, so this map is only indicative of locations and not the actual boundaries of features.
4.2 Distribution of priority species
The distributions of priority species are shown by category e.g. BAP, LBAP, cNIMF, nationally rare and scarce, Scottish Biodiversity List and OSPAR, in Figure 17-Figure 23.
Biodiversity Action Plan (BAP) species are spread sparsely through the Firth of Clyde study region but there is an aggregation of BAP species records in Loch Goil, the very northernmost part of Loch Fyne and SE Arran (Figure 17).
There are only eight Local Biodiversity Action Plan (LBAP) species recorded in the study area. These are the fan mussel Atrina fragilis (6 records), the tall seapen Funiculina quadrangularis (1 record) and the sea squirt Styela gelatinosa (1 record) and are located in Loch Goil, on the mainland opposite the Isle of Cumbrae, Holy Island, Sanda Island and in the outer Firth of Clyde (Figure 18).
Firth of Clyde Biodiversity Review
60
Candidate Nationally Important Marine Features (cNIMF) species are widely distributed through the study area but records are most dense at the following locations: Loch Goil; Gare Loch; Loch Striven; Kyles of Bute; Irvine Bay; SE Arran and Loch Fyne (Figure 19). Their distribution is arranged by the NIMF criteria (see 3.5.1, Figure 20), which again appears to closely reflect sample intensity.
OSPAR species are distributed across the study area (Figure 21) both along the coast and in the outer Firth of Clyde. Aggregations of records correspond to areas of high sampling effort, for example in SE Arran and Loch Goil (Figure 4 and Figure 5).
The distribution of nationally rare and scarce species appears to be restricted to the northern part of the Firth of Clyde (Figure 22). These are comprised of the deeplet sea anemone Bolocera tuediae, the spoon worm Amalosoma eddystonense, the sea anemone Gonactinia prolifera, the brachiopod Terebratulina retusa, the red seaweed Callophyllis cristata, an amphipod Austrosyrrhoe fimbriatus at Loch Fyne, and Bolocera tuediae at Loch Long.
Finally the distribution of Scottish Biodiversity List species appears to be fairly well spread across the Firth of Clyde, with species recorded in the sea lochs, around the Isle of Arran as well as in the outer Firth (Figure 23).
When the distributions of these priority species are broken down by taxa, it is apparent that the marine mammal data are sparse (cetaceans and seals, Figure 24). There are a few more records for marine reptiles (loggerhead and leatherback turtles) and these are evenly scattered through the study area, rather than concentrated into specific areas (Figure 25). Priority demersal and benthic fish species however, are mostly concentrated in the sea lochs and around the southwestern coast of Arran (Figure 26).
Priority invertebrates were mapped by phyla, and while some show too few records to gain any insight into their distributions (Annelida, Figure 27; Nemertina, Figure 28; Porifera, Figure 29; Tunicata, Figure 30) others show a patchy distribution (Crustacea, Figure 31; Echinodermata, Figure 32; Mollusca, Figure 33 and Cnidaria, Figure 34) with high densities of records in the sea lochs. Records of priority Rhodophyta species (maerl) are found at few locations, both in the lochs (Loch Fyne and Loch Goil) but also on the coast of the Firth near the Isle of Cumbrae (Figure 35).
The maps for each of the priority species designations illustrate the different spatial distributions for each priority species list and regional patterns of biodiversity at the level of taxonomic groupings but also highlight the strong relationship between biodiversity and sampling effort, which is carefully adjusted for in the hotspot analysis (Box 11).
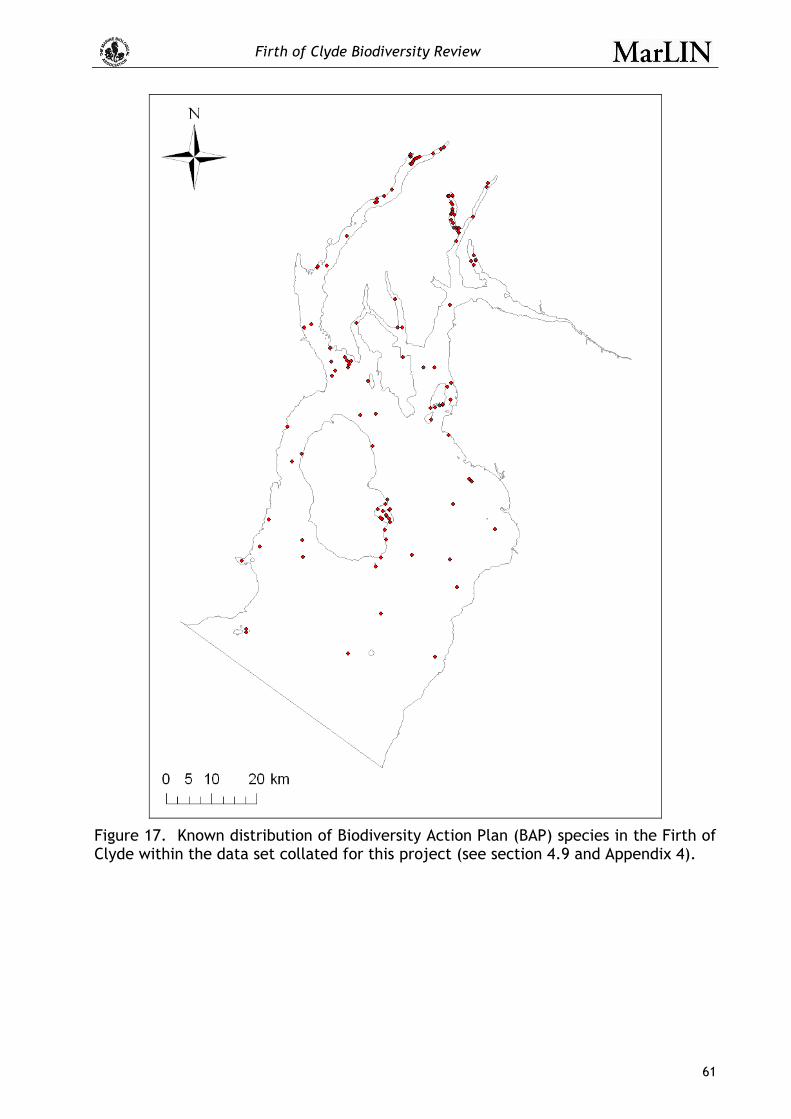
Firth of Clyde Biodiversity Review
61
Figure 17. Known distribution of Biodiversity Action Plan (BAP) species in the Firth of Clyde within the data set collated for this project (see section 4.9 and Appendix 4).

Firth of Clyde Biodiversity Review
62
Figure 18. Distribution of Local Biodiversity Action Plan (LBAP) species records in the Firth of Clyde.
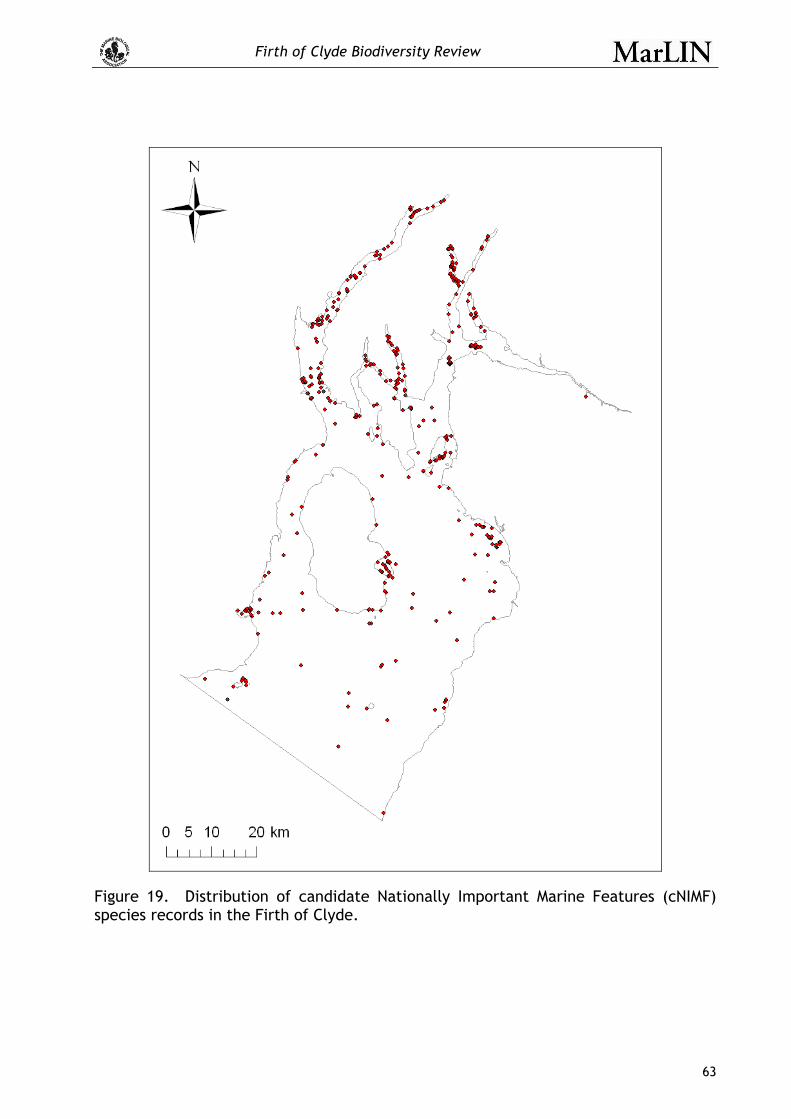
Firth of Clyde Biodiversity Review
63
Figure 19. Distribution of candidate Nationally Important Marine Features (cNIMF) species records in the Firth of Clyde.
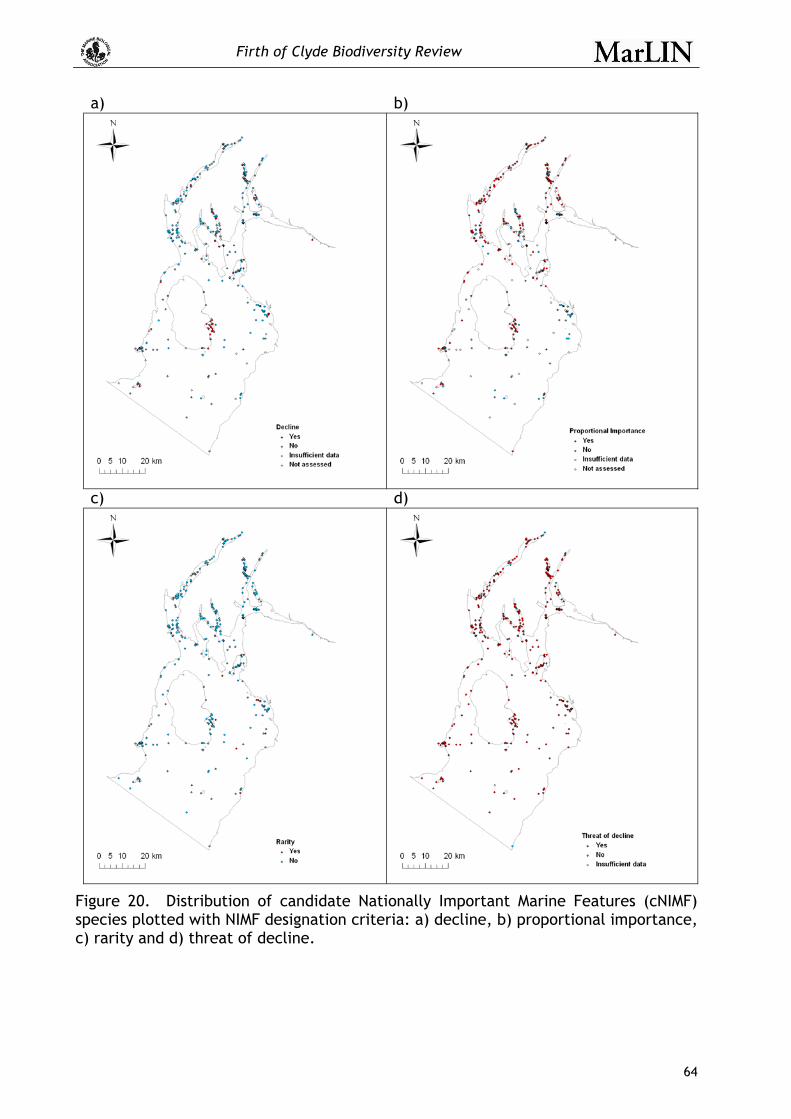
Firth of Clyde Biodiversity Review
64
a) b)
c) d)
Figure 20. Distribution of candidate Nationally Important Marine Features (cNIMF) species plotted with NIMF designation criteria: a) decline, b) proportional importance, c) rarity and d) threat of decline.

Firth of Clyde Biodiversity Review
65
Figure 21. Distribution of OSPAR species records in the Firth of Clyde.
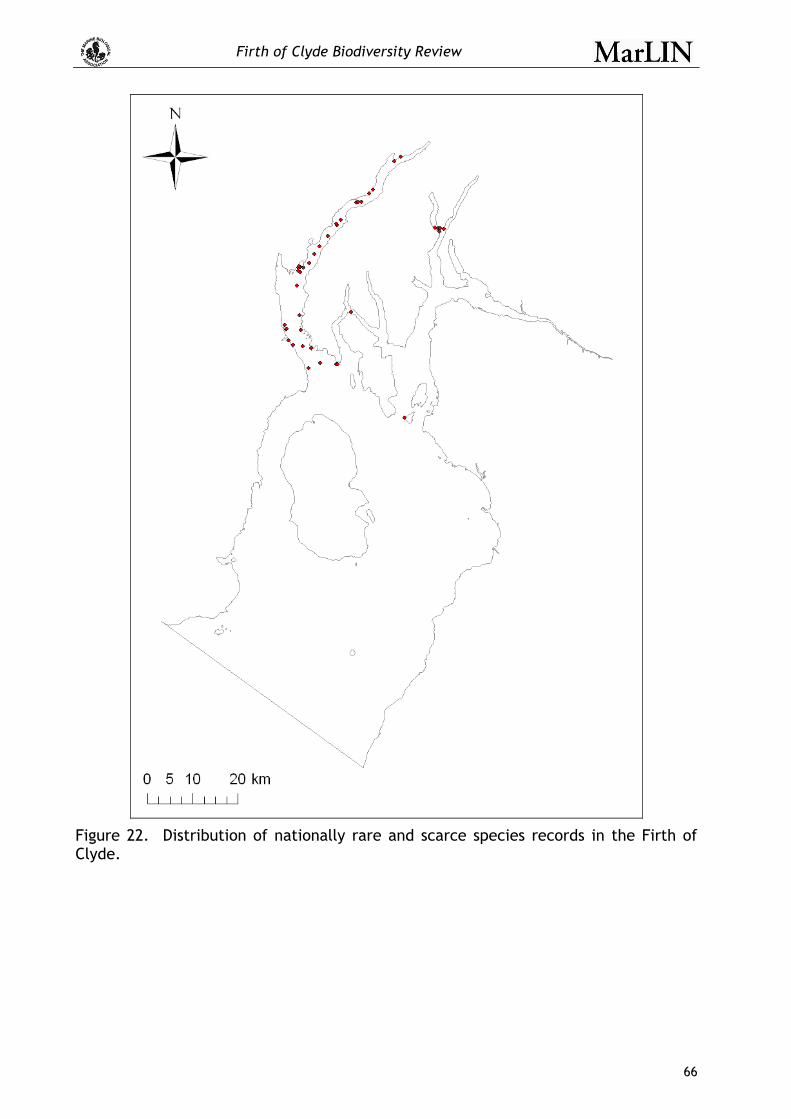
Firth of Clyde Biodiversity Review
66
Figure 22. Distribution of nationally rare and scarce species records in the Firth of Clyde.
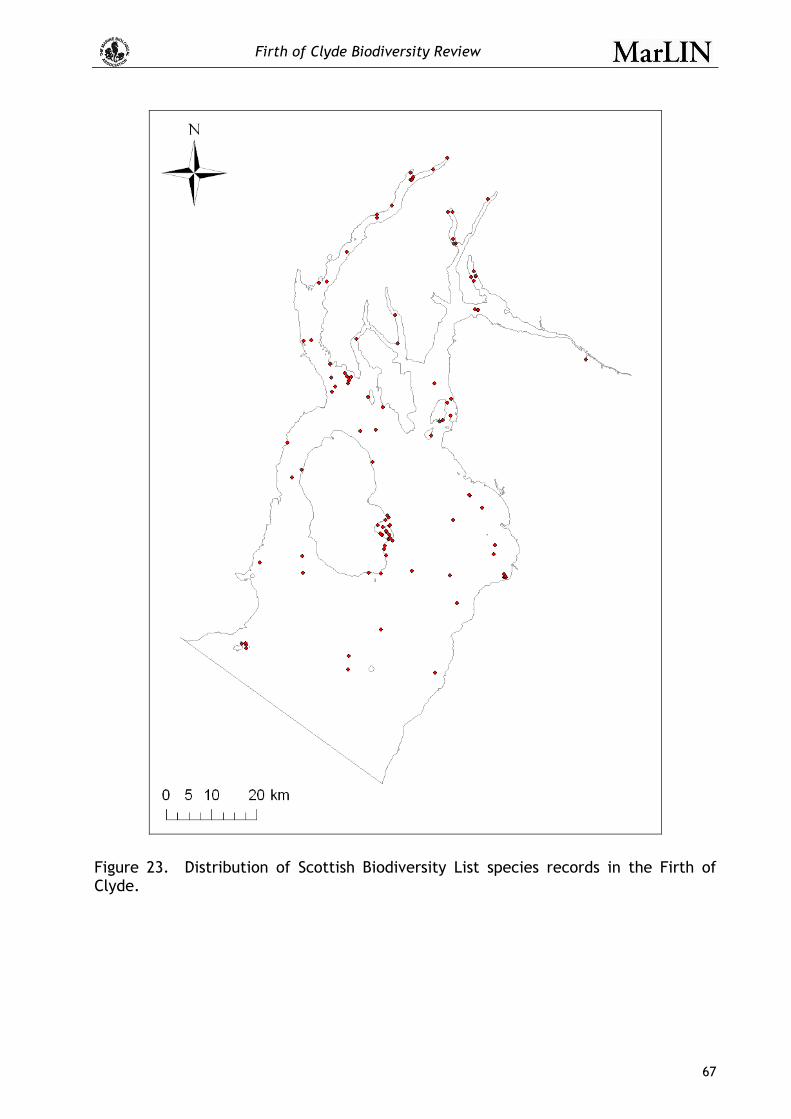
Firth of Clyde Biodiversity Review
67
Figure 23. Distribution of Scottish Biodiversity List species records in the Firth of Clyde.
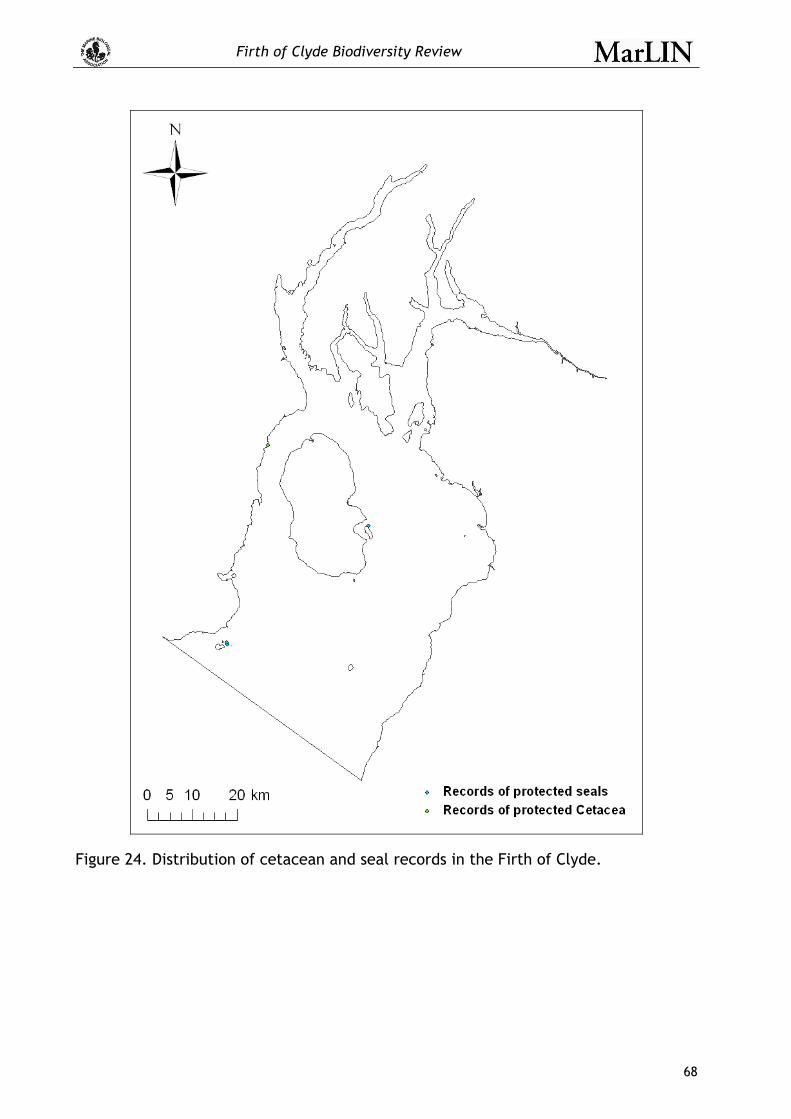
Firth of Clyde Biodiversity Review
68
Figure 24. Distribution of cetacean and seal records in the Firth of Clyde.
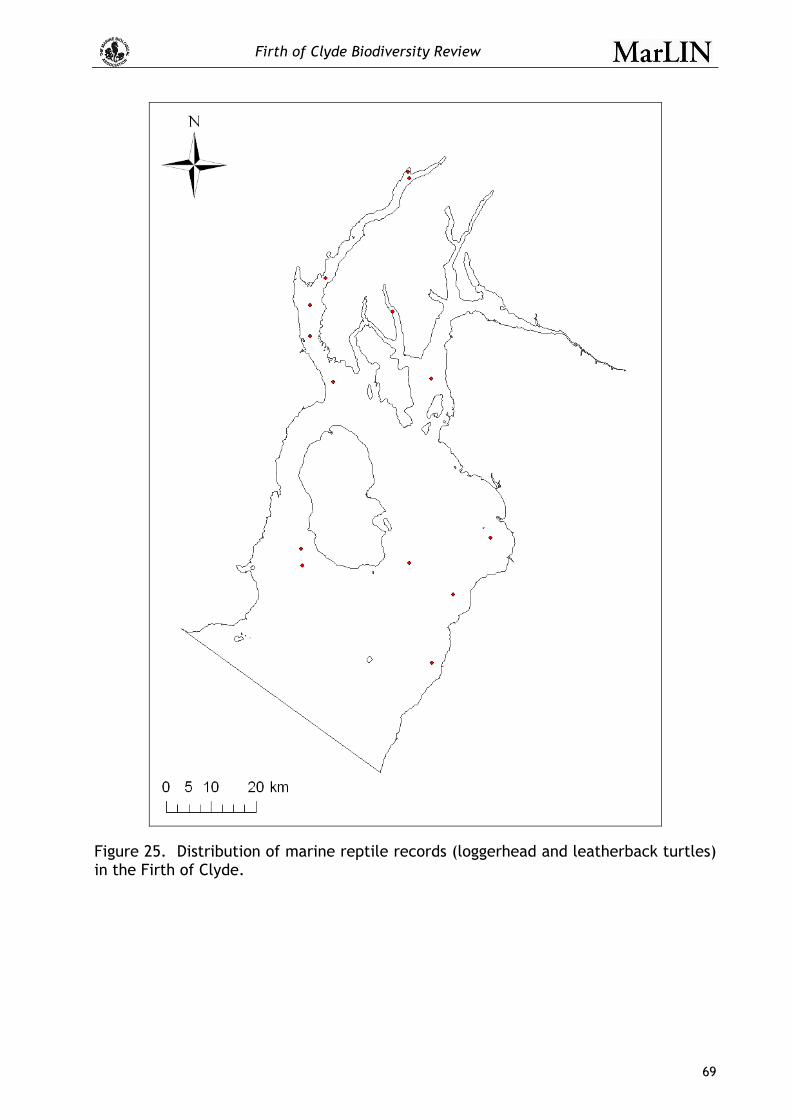
Firth of Clyde Biodiversity Review
69
Figure 25. Distribution of marine reptile records (loggerhead and leatherback turtles) in the Firth of Clyde.
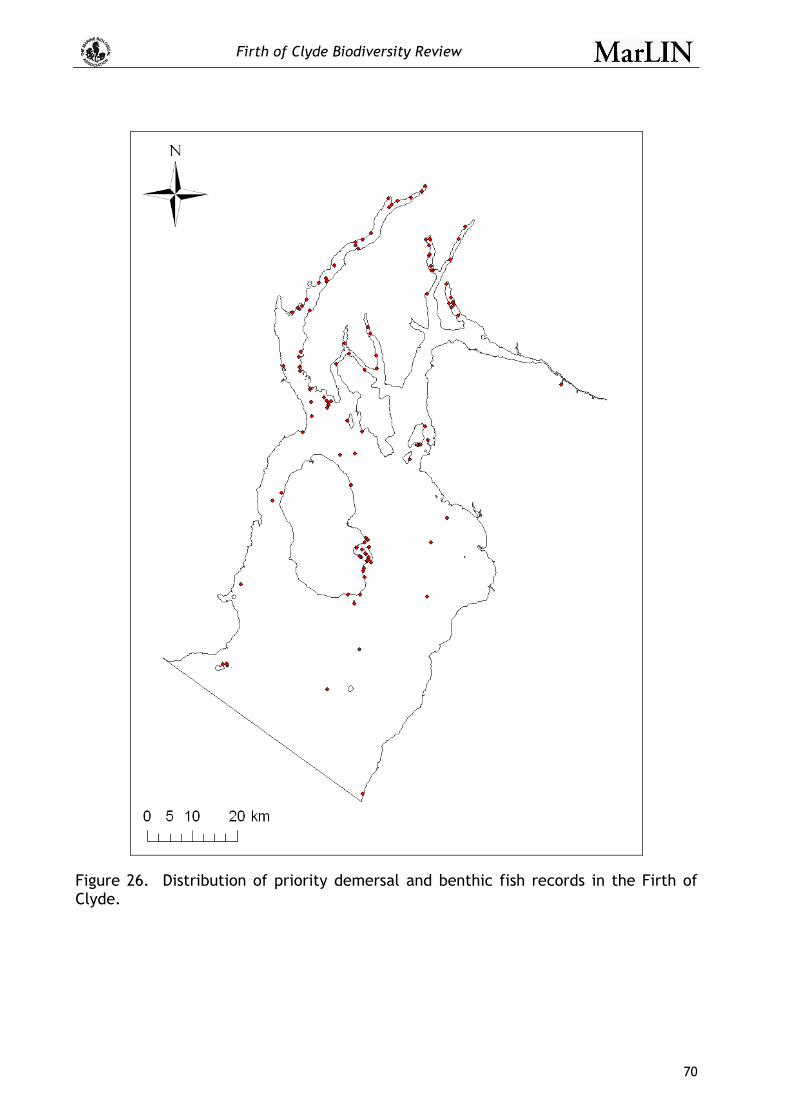
Firth of Clyde Biodiversity Review
70
Figure 26. Distribution of priority demersal and benthic fish records in the Firth of Clyde.

Firth of Clyde Biodiversity Review
71
Figure 27. Distribution of priority Annelida species records in the Firth of Clyde.
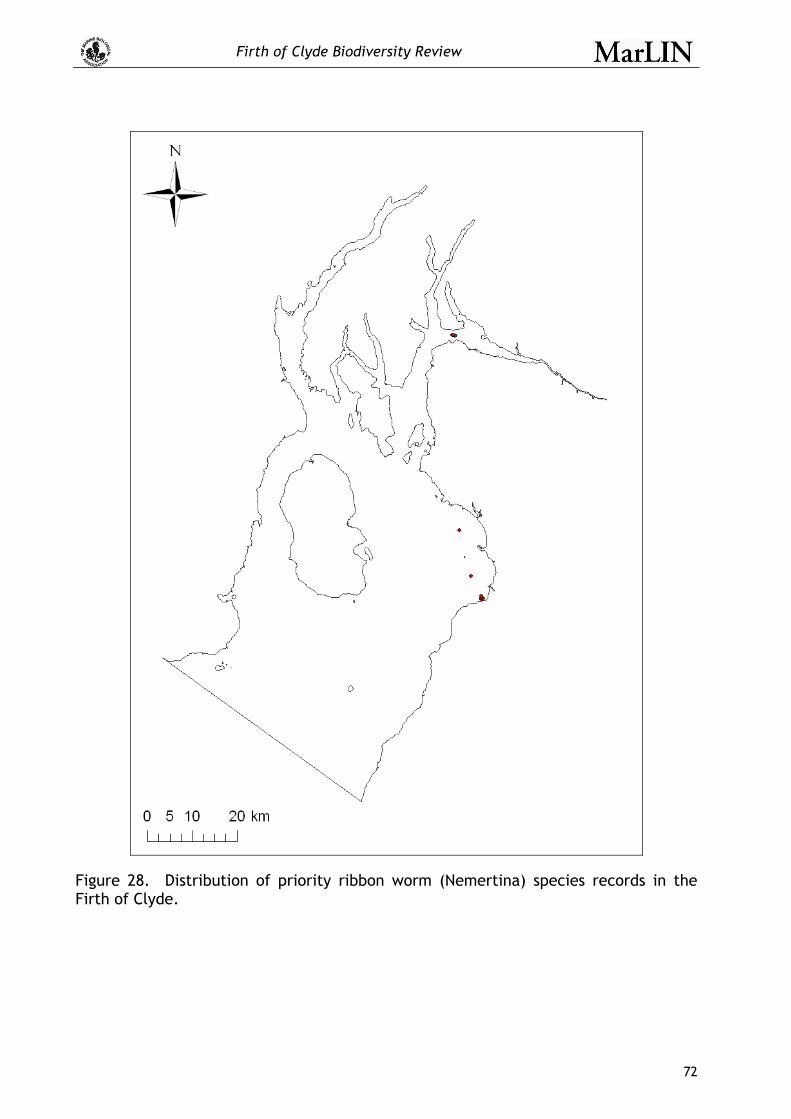
Firth of Clyde Biodiversity Review
72
Figure 28. Distribution of priority ribbon worm (Nemertina) species records in the Firth of Clyde.
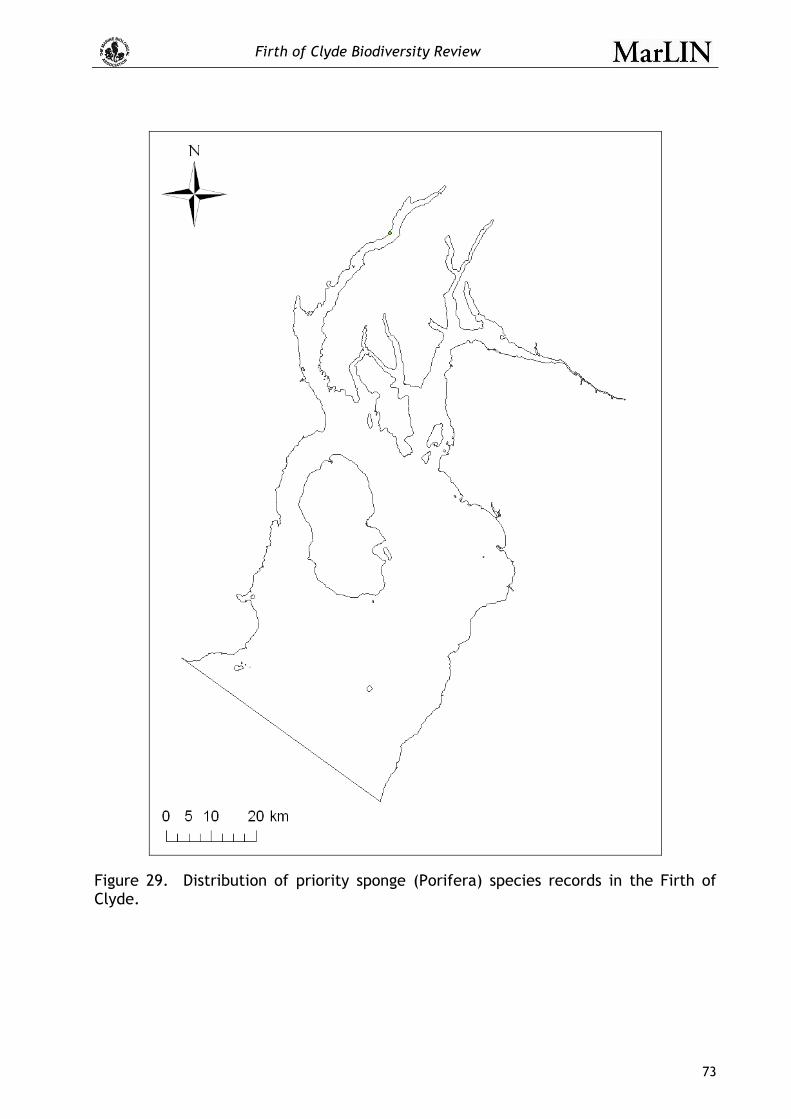
Firth of Clyde Biodiversity Review
73
Figure 29. Distribution of priority sponge (Porifera) species records in the Firth of Clyde.
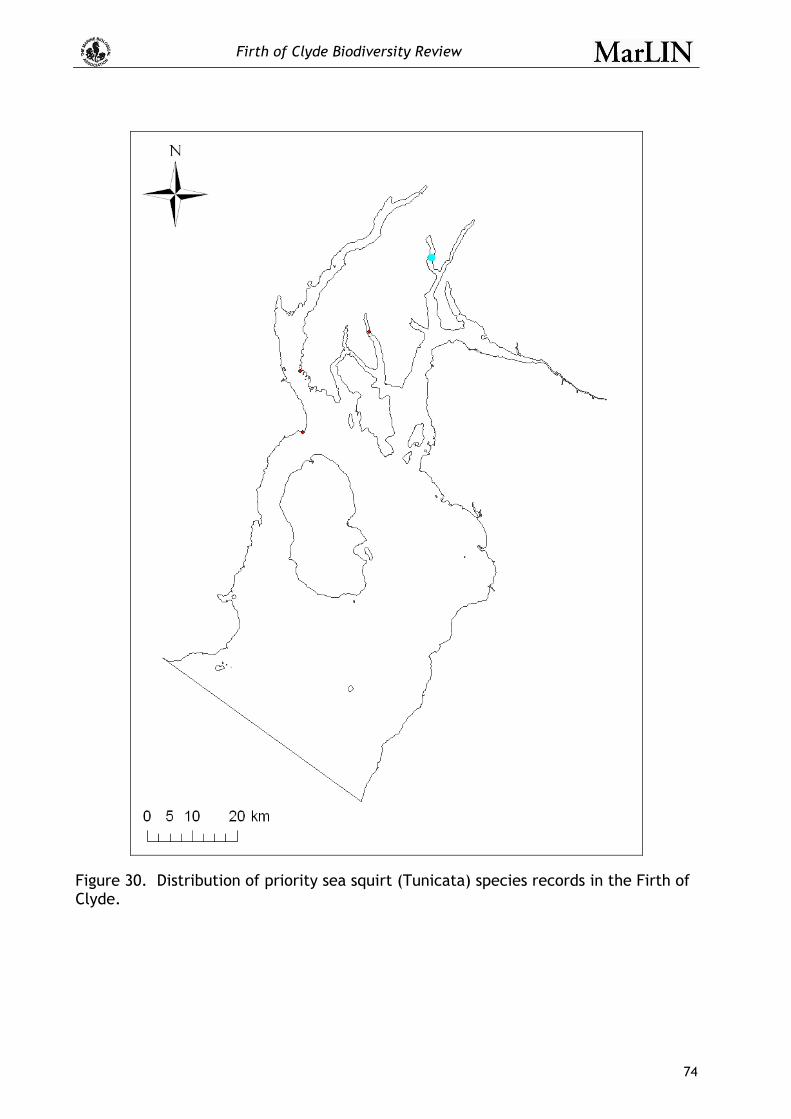
Firth of Clyde Biodiversity Review
74
Figure 30. Distribution of priority sea squirt (Tunicata) species records in the Firth of Clyde.

Firth of Clyde Biodiversity Review
75
Figure 31. Distribution of priority crustacean (Crustacea) species records in the Firth of Clyde.
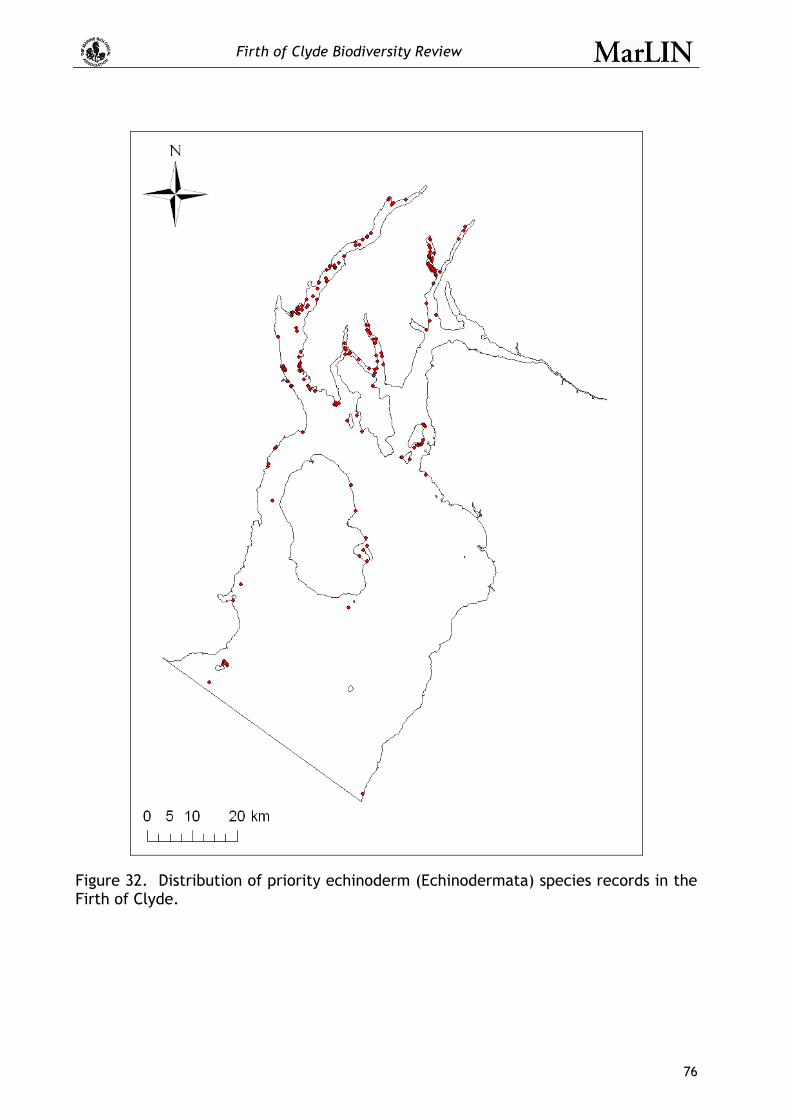
Firth of Clyde Biodiversity Review
76
Figure 32. Distribution of priority echinoderm (Echinodermata) species records in the Firth of Clyde.
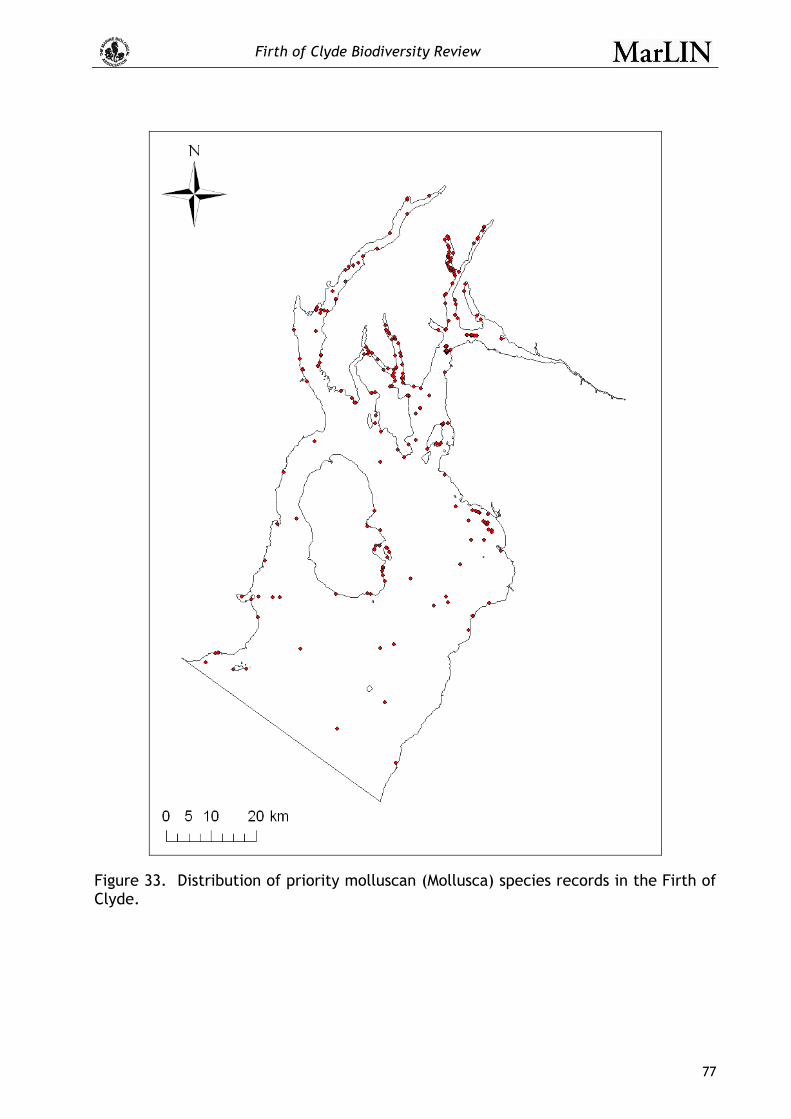
Firth of Clyde Biodiversity Review
77
Figure 33. Distribution of priority molluscan (Mollusca) species records in the Firth of Clyde.
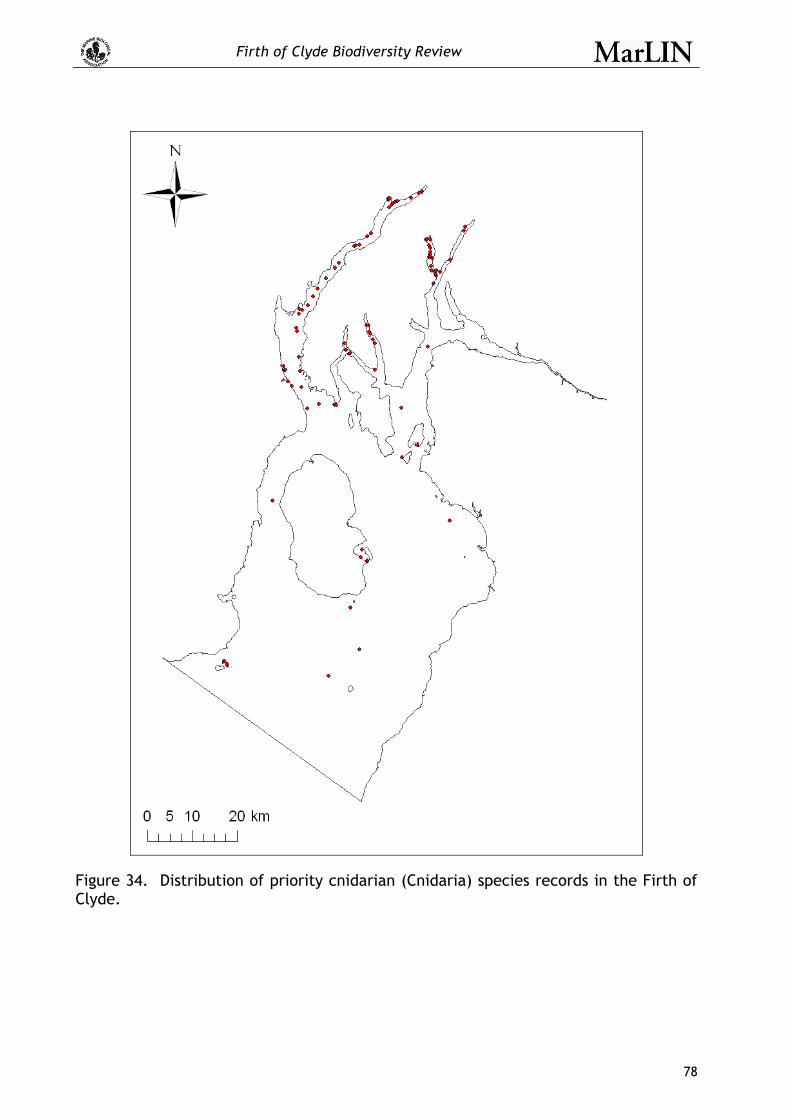
Firth of Clyde Biodiversity Review
78
Figure 34. Distribution of priority cnidarian (Cnidaria) species records in the Firth of Clyde.
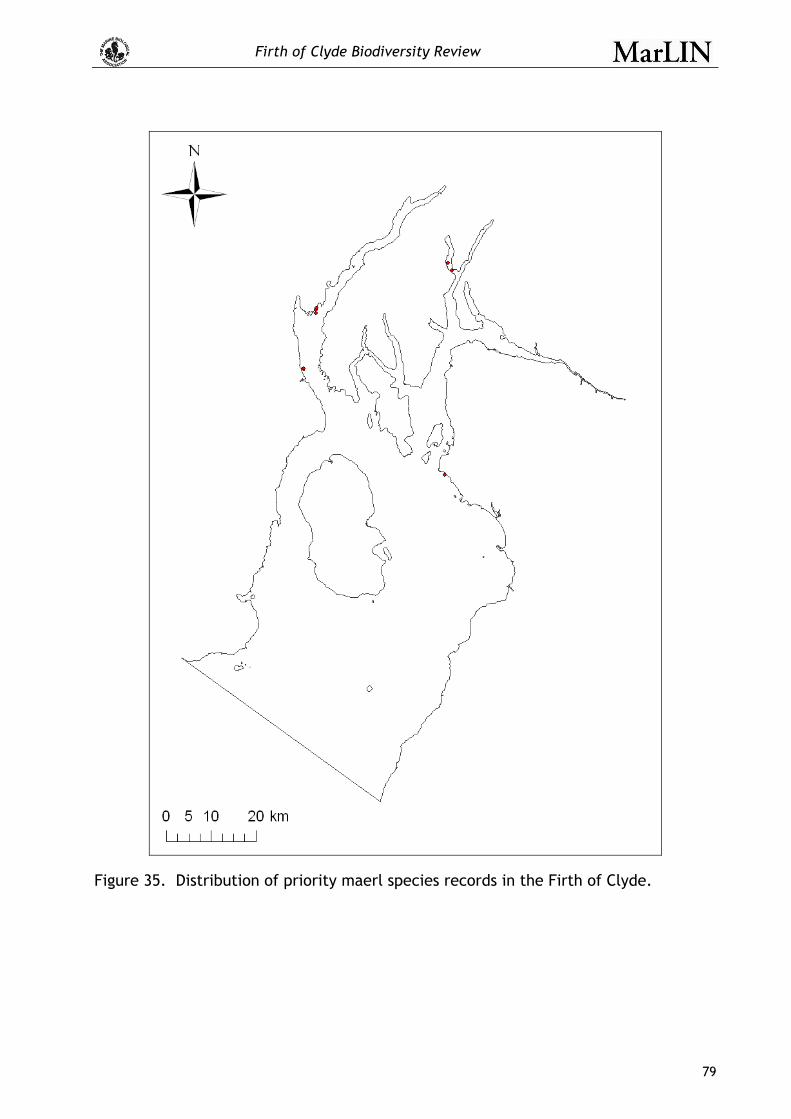
Firth of Clyde Biodiversity Review
79
Figure 35. Distribution of priority maerl species records in the Firth of Clyde.
Firth of Clyde Biodiversity Review
80
4.3 Distribution of priority habitats
The distribution of habitats of conservation importance (Habitats Directive Annex 1, BAP, LBAP, candidate NIMF, OSPAR, Scottish Biodiversity List) is very uneven across the Firth of Clyde. Almost all priority habitats are located in the sea lochs, which is a strong reflection of the distribution of sampling effort (Figure 4 and Figure 5).
Annex 1 habitats are the most widely distributed around the Firth (Figure 36) but are restricted to coastal areas. High densities of records are found in the Kyles of Bute, Loch Striven, Loch Fyne, Loch Long and Gare Loch. All other coastal areas have fairly sparse numbers of records of Annex 1 habitats.
BAP habitats, LBAP habitats and Scottish Biodiversity List habitats all show a very similar distribution pattern with high densities of records in the Kyles of Bute and Loch Striven, Loch Goil and Gare Loch, with the other sea lochs such as Loch Fyne, and the lower part of Loch Long showing lower densities of records (Figure 37, Figure 38 and Figure 39). Outside of the sea lochs, there are few recorded habitats with these designations; habitats that are listed on all three have been recorded at the most southern point of the Isle of Arran, Ballantrae Bay, and there is a also a BAP and Scottish Biodiversity List habitat at the southern end of Bute.
The pattern for candidate NIMF and OSPAR habitats is similar to the BAP, LBAP and Scottish Biodiversity List habitats in terms of their distribution in the sea lochs but there are just three records for these habitats outside of the sea lochs (Figure 40 and Figure 41). These are at Ballantrae Bay and in the Kilbrannan Sound (cNIMF) and at the southernmost part of the Isle of Arran.
When habitats are broken down into their EUNIS Level 2 types (see Box 2 and Box), the patterns of distribution are revealed. The habitat complex type A1 (littoral rock and other hard substrata) is mostly recorded in the sea lochs but there are some areas around the Isle of Arran and along the western coast of the outer Firth and near Ayr on the eastern coast (Figure 42). Priority habitat A2 (littoral sediment) is also recorded both in the lochs and along the coast of the outer Firth, though distributed more on the eastern coast from near the Isle of Cumbrae to Ballantrae Bay (Figure 43). On the western coast of the outer Firth, records are restricted to near Campbeltown and in the Kilbrannan Sound.
Habitat complex A3 (infralittoral rock and other hard substrata) is predominately recorded in the sea lochs, with isolated records at the southern tip of the Isle of Bute, southwestern Arran and near Ballantrae Bay (Figure 44). By contrast, records of the priority habitat A4 (circalittoral rock and other hard substrata) are entirely restricted in distribution to the sea lochs (Loch Fyne, the northern part of Loch Striven, the Kyles of Bute, Loch Long and Loch Goil, Figure 45), as is priority habitat B3 (rocks, cliffs, ledges and shores including the supralittoral). Similarly priority habitat A5 (sublittoral sediment) is almost restricted to the sea lochs with one record off the southern tip of the Isle of Arran, and another near Ballantrae Bay (Figure 46).
Overall, these patterns of biodiversity must be interpreted with caution. Given their strong dependence on the distribution of sampling effort, the overall patterns represented on these maps (i.e. high densities of priority habitats in the sea lochs) must not be taken as the only areas where priority habitats occur, since the lack of data in other regions means that they have not been recorded but are nevertheless still likely to occur, for example there is a high probability that there will be areas of sublittoral sediment in the outer Firth region.

Firth of Clyde Biodiversity Review
81
Figure 36. Distribution of Habitats Directive Annex I habitats in the Firth of Clyde area.
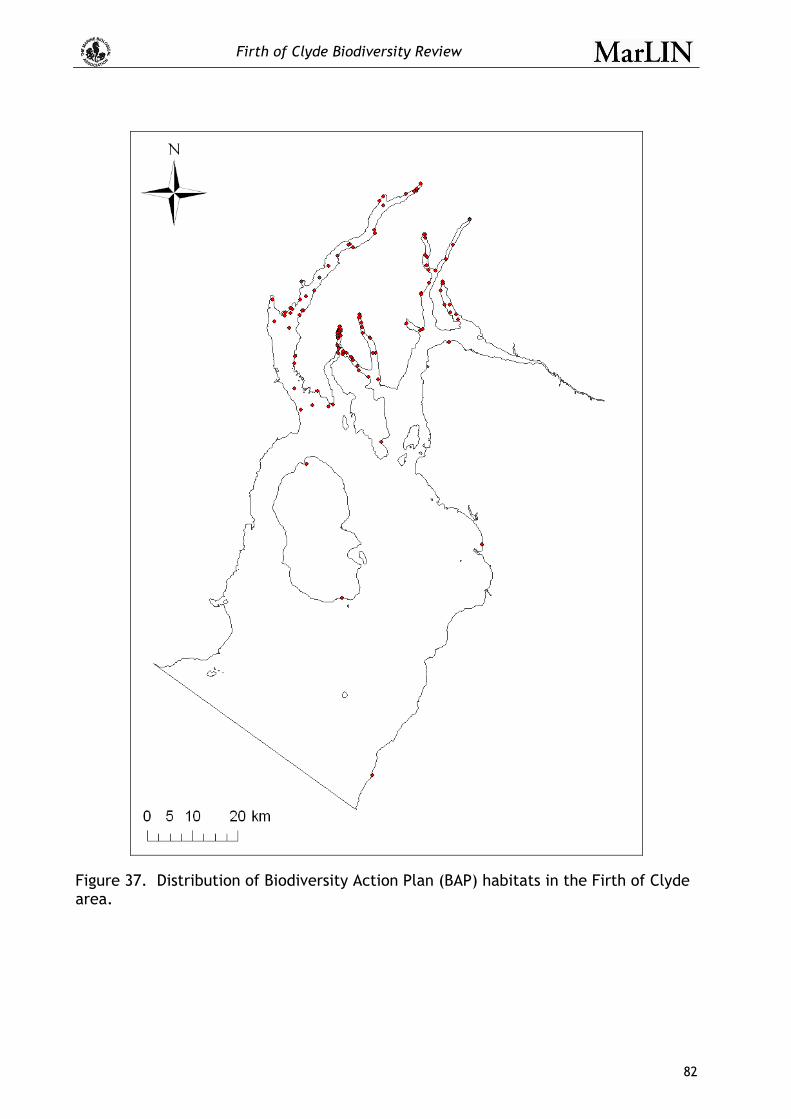
Firth of Clyde Biodiversity Review
82
Figure 37. Distribution of Biodiversity Action Plan (BAP) habitats in the Firth of Clyde area.

Firth of Clyde Biodiversity Review
83
Figure 38. Distribution of local Biodiversity Action Plan (LBAP) habitats in the Firth of Clyde area.

Firth of Clyde Biodiversity Review
84
Figure 39. Distribution of Scottish Biodiversity List habitats in the Firth of Clyde area.
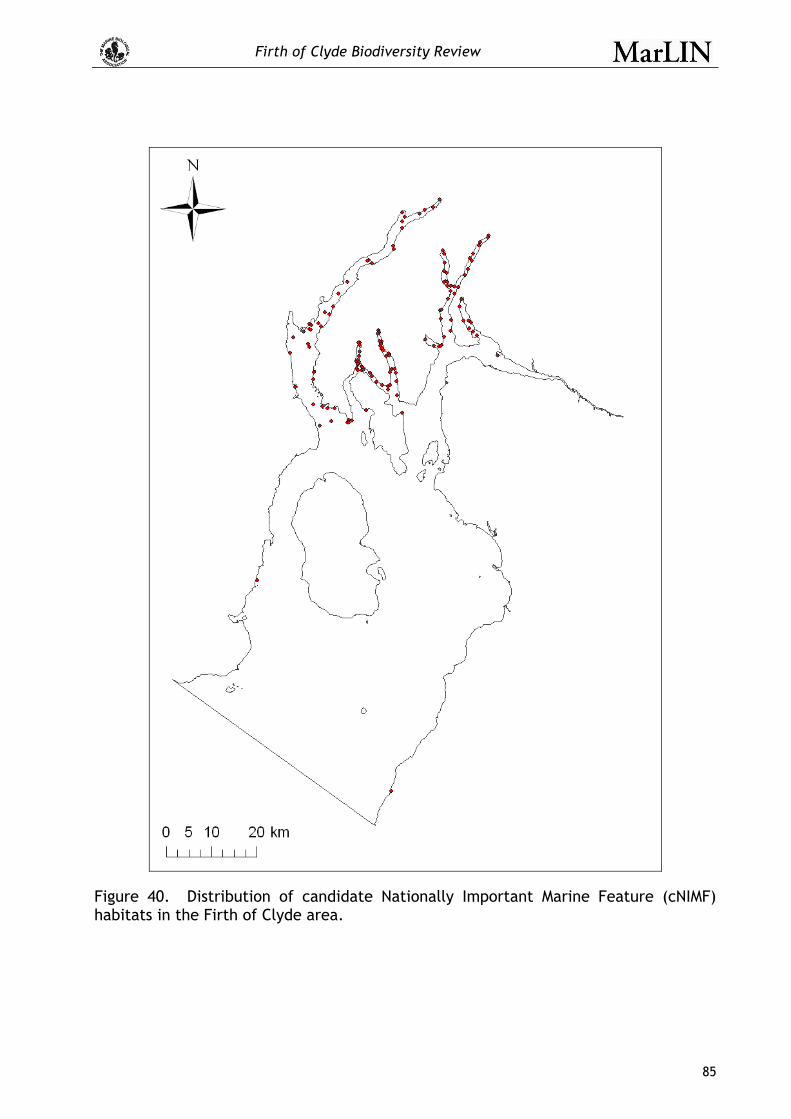
Firth of Clyde Biodiversity Review
85
Figure 40. Distribution of candidate Nationally Important Marine Feature (cNIMF) habitats in the Firth of Clyde area.

Firth of Clyde Biodiversity Review
86
Figure 41. Distribution of OSPAR listed habitat records in the Firth of Clyde.
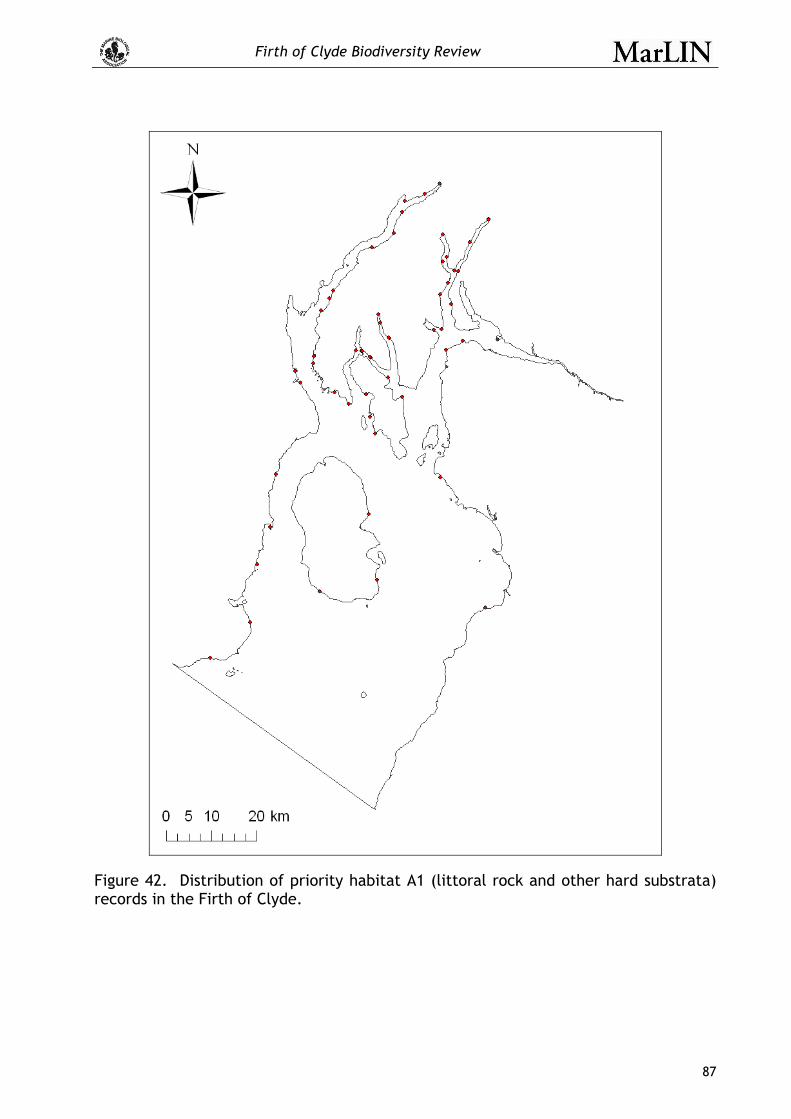
Firth of Clyde Biodiversity Review
87
Figure 42. Distribution of priority habitat A1 (littoral rock and other hard substrata) records in the Firth of Clyde.

Firth of Clyde Biodiversity Review
88
Figure 43. Distribution of priority habitat A2 (littoral sediment) records in the Firth of Clyde.
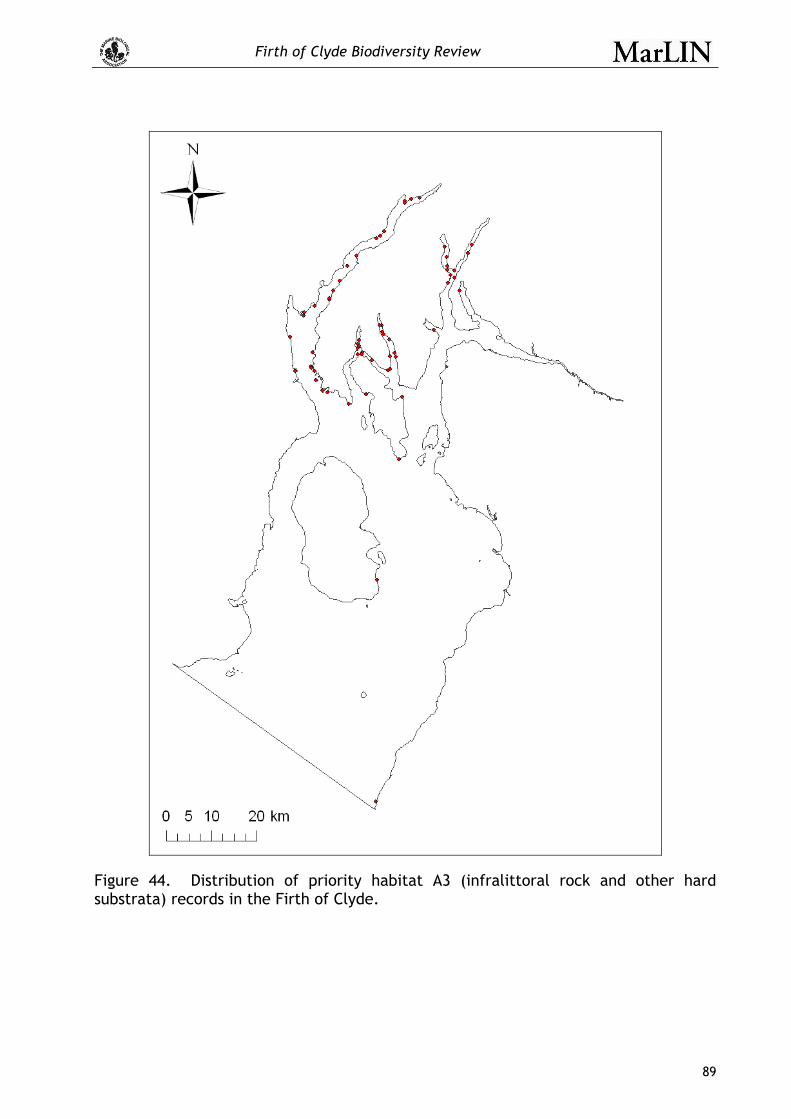
Firth of Clyde Biodiversity Review
89
Figure 44. Distribution of priority habitat A3 (infralittoral rock and other hard substrata) records in the Firth of Clyde.

Firth of Clyde Biodiversity Review
90
Figure 45. Distribution of priority habitat A4 (circalittoral rock and other hard substrata) records in the Firth of Clyde.
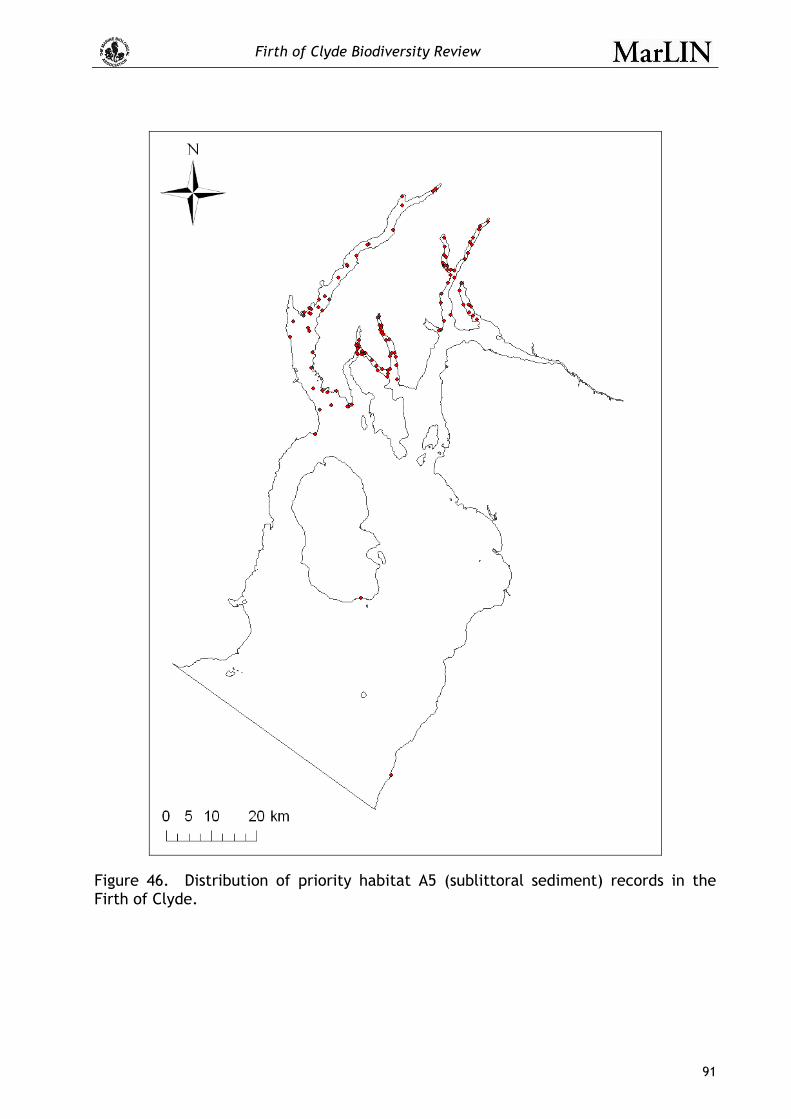
Firth of Clyde Biodiversity Review
91
Figure 46. Distribution of priority habitat A5 (sublittoral sediment) records in the Firth of Clyde.
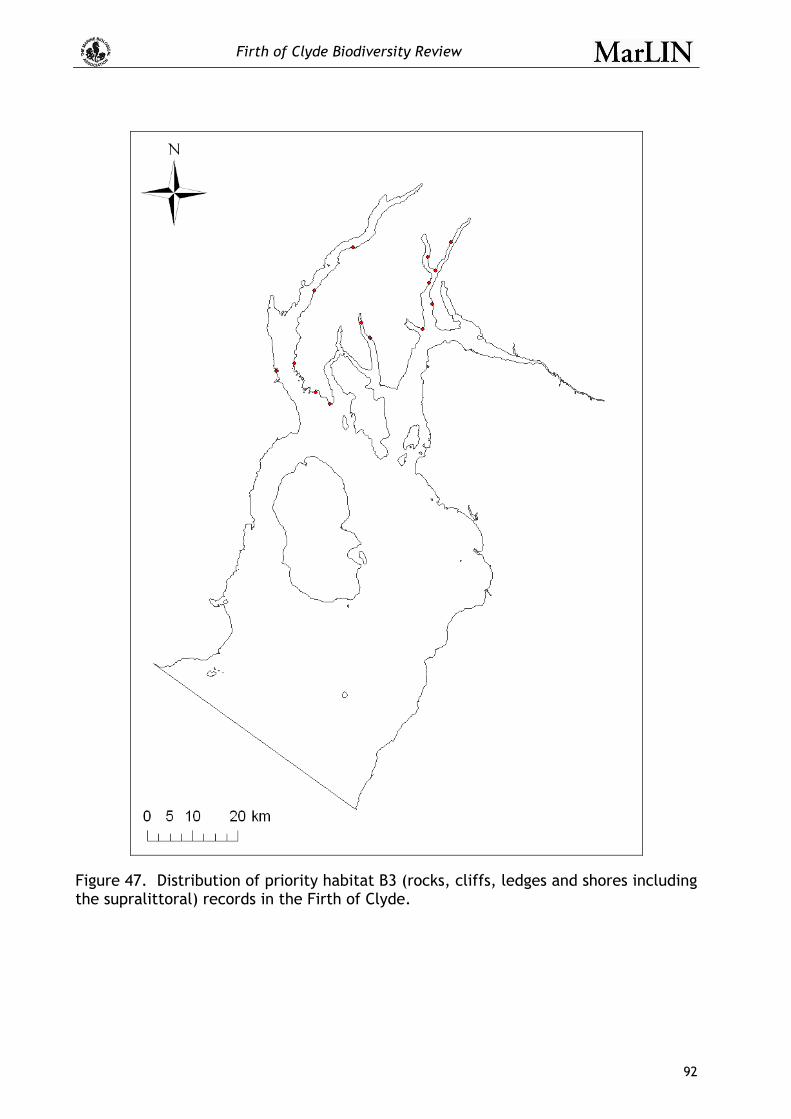
Firth of Clyde Biodiversity Review
92
Figure 47. Distribution of priority habitat B3 (rocks, cliffs, ledges and shores including the supralittoral) records in the Firth of Clyde.
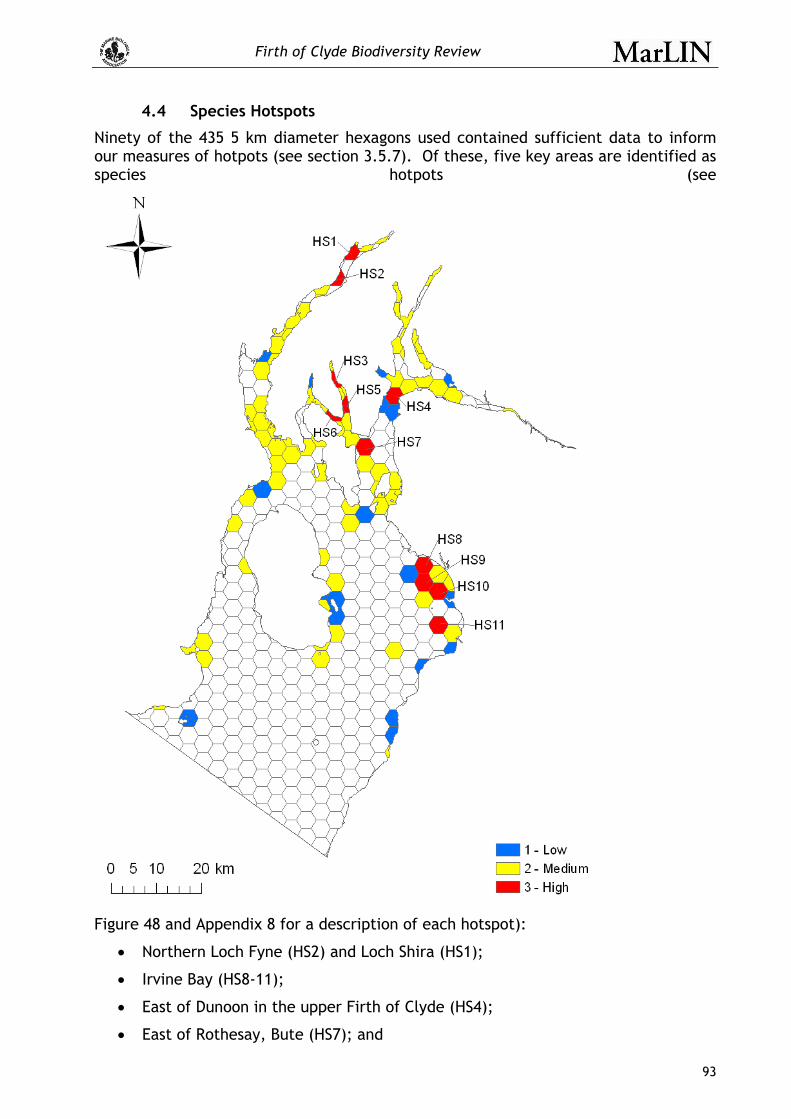
Firth of Clyde Biodiversity Review
93
4.4 Species Hotspots
Ninety of the 435 5 km diameter hexagons used contained sufficient data to inform our measures of hotpots (see section 3.5.7). Of these, five key areas are identified as species hotpots (see
Figure 48 and Appendix 8 for a description of each hotspot):
• Northern Loch Fyne (HS2) and Loch Shira (HS1);
• Irvine Bay (HS8-11);
• East of Dunoon in the upper Firth of Clyde (HS4);
• East of Rothesay, Bute (HS7); and

Firth of Clyde Biodiversity Review
94
• The Kyles of Bute (HS6) and Loch Striven (HS3 and 5)
Northern Loch Fyne and Loch Shira have high species richness (Figure 49) and numbers of priority species (Figure 50) but expected levels (i.e. not high) of taxonomic distinctness (Figure 51). This suggests that diversity is not especially high at higher taxonomic levels but is at species level. A similar pattern was found at the Kyles of Bute and Loch Striven, with the taxonomic distinctness of the six invertebrate phyla scoring low while the other biodiversity measures score highly.
A measure of confidence was calculated (see section 3.6.11) for each hexagon to indicate confidence in the data behind the species and biotopes scores. All hotspot areas have high data confidence except northern Loch Fyne (HS2) which has medium confidence (Figure 52, Appendix 8).
Irvine Bay scores highly in terms of species richness (Figure 49) and taxonomic distinctness (Figure 51) but has below expected numbers of priority species (Figure 50). This is likely to be related to the seabed habitat type in this bay, being composed of sandy sediments that are mobile and generally not home to large numbers of rare and/or declining species.
A similar pattern of biodiversity measures is found East of Dunoon in the upper Firth of Clyde and East of Rothesay, Bute where high species richness (Figure 49) and taxonomic distinctness (Figure 51) are contrasted by low to expected numbers of priority species (Figure 50). Since these areas comprise complex seabed habitats, it is not clear why the number of priority species should be low.
Species richness was classed as high in 18 of the 106 hexagon units with sufficient data to analyse (Figure 49). Areas of high species richness additional to the species hotspots identified above included Glenan Bay, East of Loch Tarbert (Loch Fyne), west of Skipness (Tarbert), Kilchousland Bay (near Campbeltown) and North of Brodick Bay on Arran.
Eleven areas were identified as species biodiversity “cold spots” in the analysis, scoring low for all measures (e.g. north of Ardmore point, Turnberry Bay, Troon point and the deeper parts of Irvine Bay and Lunderston Bay in the Upper Firth of Clyde). However, for areas around Sanda Island, Holy island and an area off Port Ann, Loch Fyne, species richness and taxonomic distinctness (Figure 49 and Figure 51 respectively) were low but the number of priority species was high (Figure 50). Interestingly both Sanda Island and Holy island were identified as important areas during consultations with local stakeholders (Figure 16). Caution must be extended when classifying areas as biodiversity “cold spots”, since this does not mean that they have low intrinsic conservation value. It cannot be assumed that areas of low biodiversity are functionally less important to the ecosystem.

Firth of Clyde Biodiversity Review
95
Figure 48. Species hotspot scores for the Firth of Clyde.
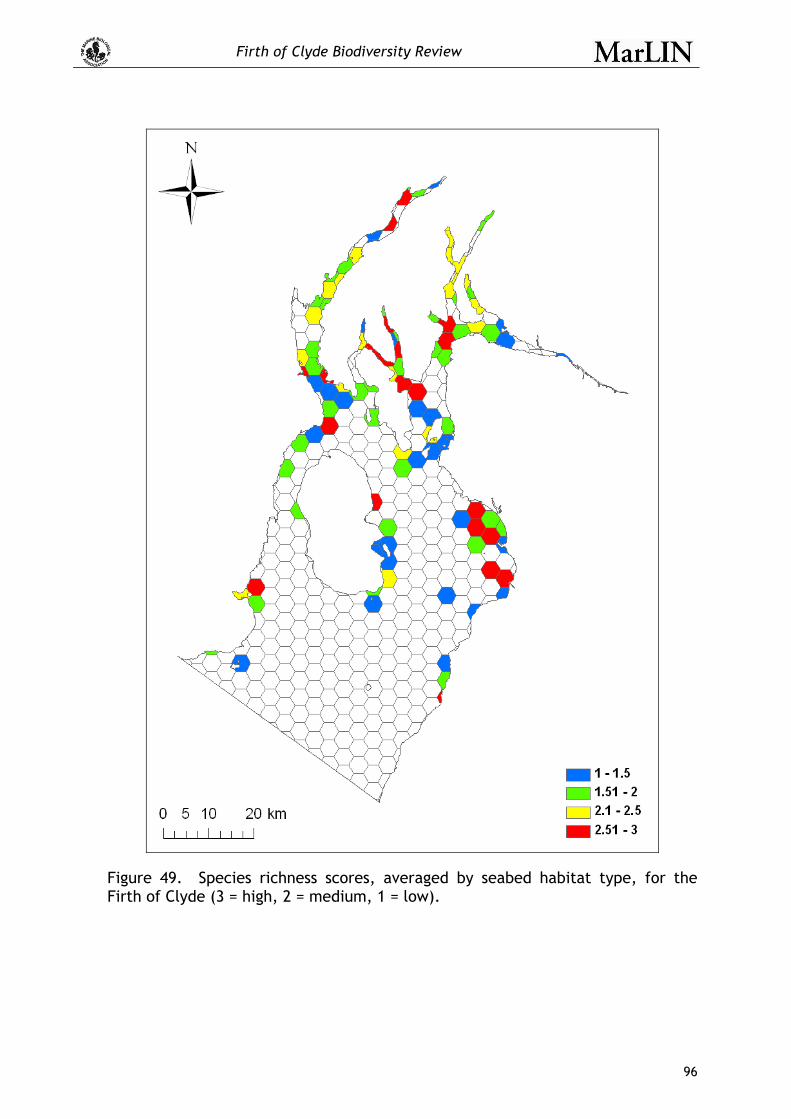
Firth of Clyde Biodiversity Review
96
Figure 49. Species richness scores, averaged by seabed habitat type, for the Firth of Clyde (3 = high, 2 = medium, 1 = low).

Firth of Clyde Biodiversity Review
97
Figure 50. Priority species scores for the Firth of Clyde.
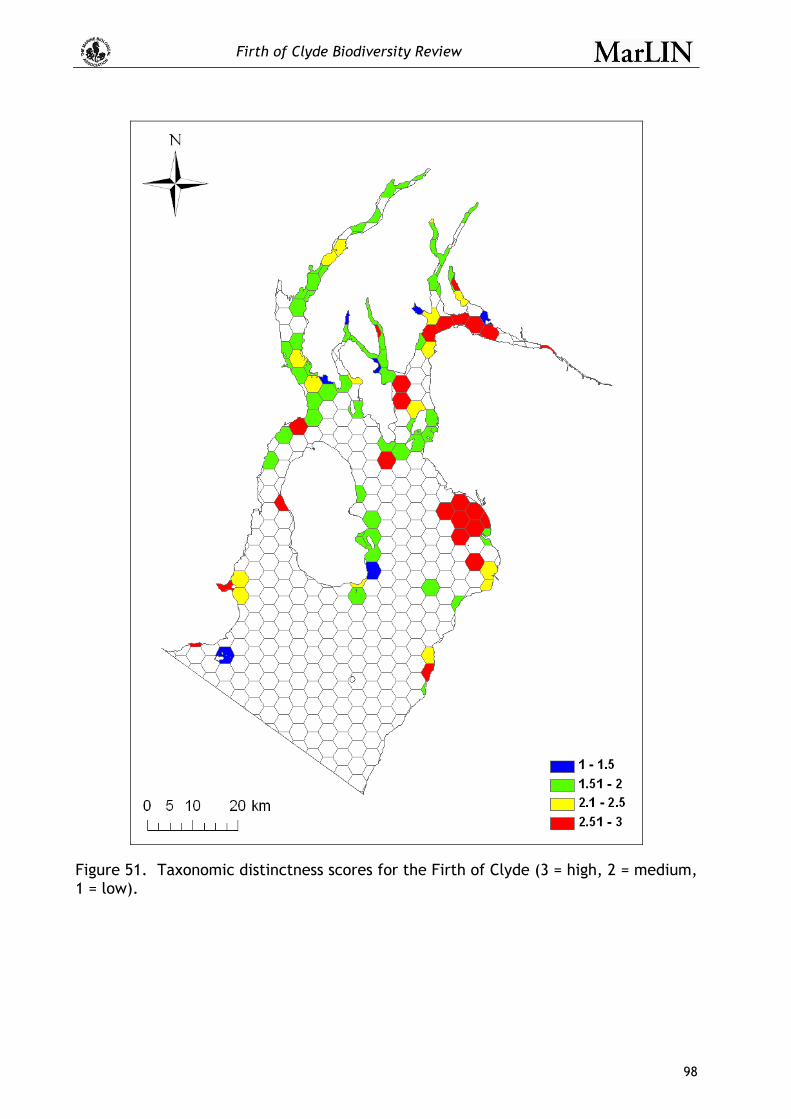
Firth of Clyde Biodiversity Review
98
Figure 51. Taxonomic distinctness scores for the Firth of Clyde (3 = high, 2 = medium, 1 = low).
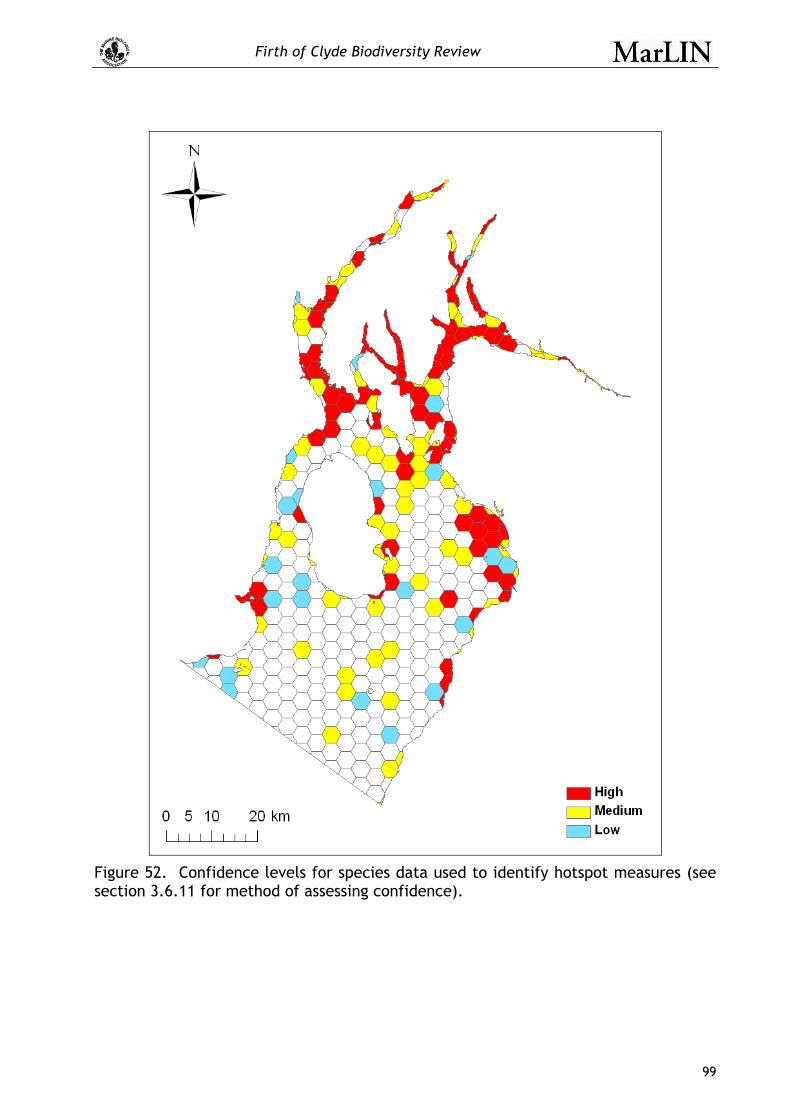
Firth of Clyde Biodiversity Review
99
Figure 52. Confidence levels for species data used to identify hotspot measures (see section 3.6.11 for method of assessing confidence).
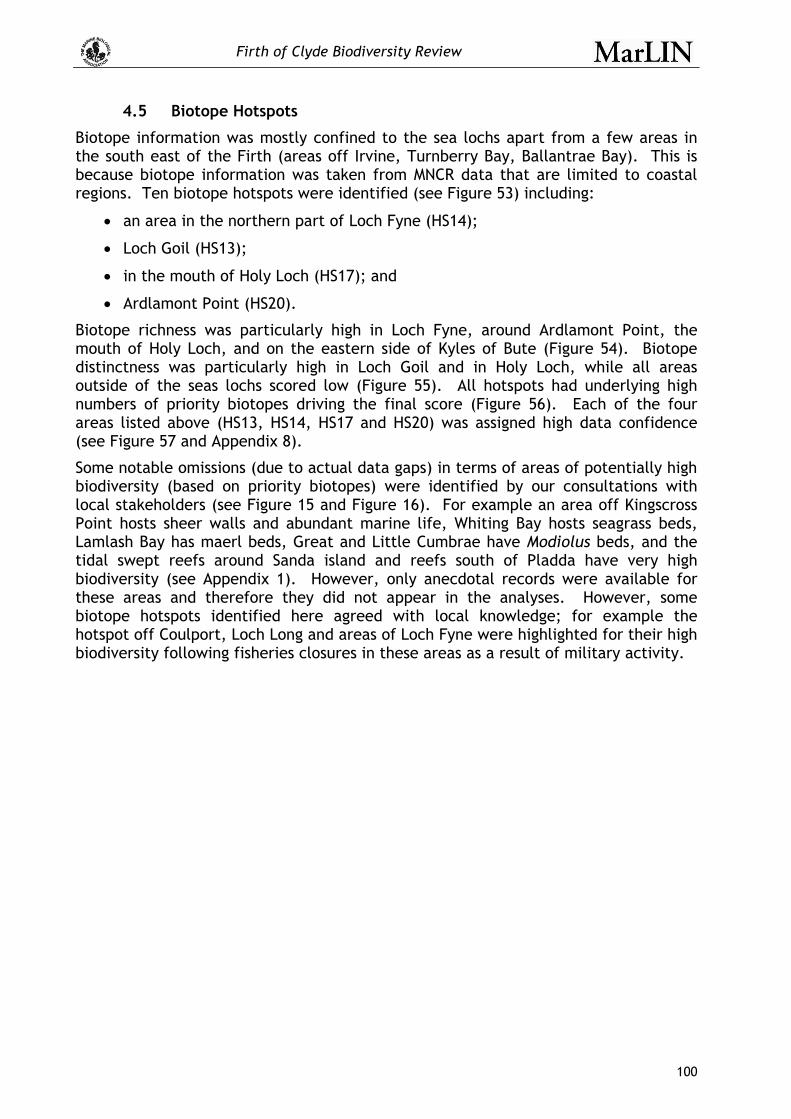
Firth of Clyde Biodiversity Review
100
4.5 Biotope Hotspots
Biotope information was mostly confined to the sea lochs apart from a few areas in the south east of the Firth (areas off Irvine, Turnberry Bay, Ballantrae Bay). This is because biotope information was taken from MNCR data that are limited to coastal regions. Ten biotope hotspots were identified (see Figure 53) including:
• an area in the northern part of Loch Fyne (HS14);
• Loch Goil (HS13);
• in the mouth of Holy Loch (HS17); and
• Ardlamont Point (HS20).
Biotope richness was particularly high in Loch Fyne, around Ardlamont Point, the mouth of Holy Loch, and on the eastern side of Kyles of Bute (Figure 54). Biotope distinctness was particularly high in Loch Goil and in Holy Loch, while all areas outside of the seas lochs scored low (Figure 55). All hotspots had underlying high numbers of priority biotopes driving the final score (Figure 56). Each of the four areas listed above (HS13, HS14, HS17 and HS20) was assigned high data confidence (see Figure 57 and Appendix 8).
Some notable omissions (due to actual data gaps) in terms of areas of potentially high biodiversity (based on priority biotopes) were identified by our consultations with local stakeholders (see Figure 15 and Figure 16). For example an area off Kingscross Point hosts sheer walls and abundant marine life, Whiting Bay hosts seagrass beds, Lamlash Bay has maerl beds, Great and Little Cumbrae have Modiolus beds, and the tidal swept reefs around Sanda island and reefs south of Pladda have very high biodiversity (see Appendix 1). However, only anecdotal records were available for these areas and therefore they did not appear in the analyses. However, some biotope hotspots identified here agreed with local knowledge; for example the hotspot off Coulport, Loch Long and areas of Loch Fyne were highlighted for their high biodiversity following fisheries closures in these areas as a result of military activity.

Firth of Clyde Biodiversity Review
101
Figure 53. Biotope hotspot scores for the Firth of Clyde.
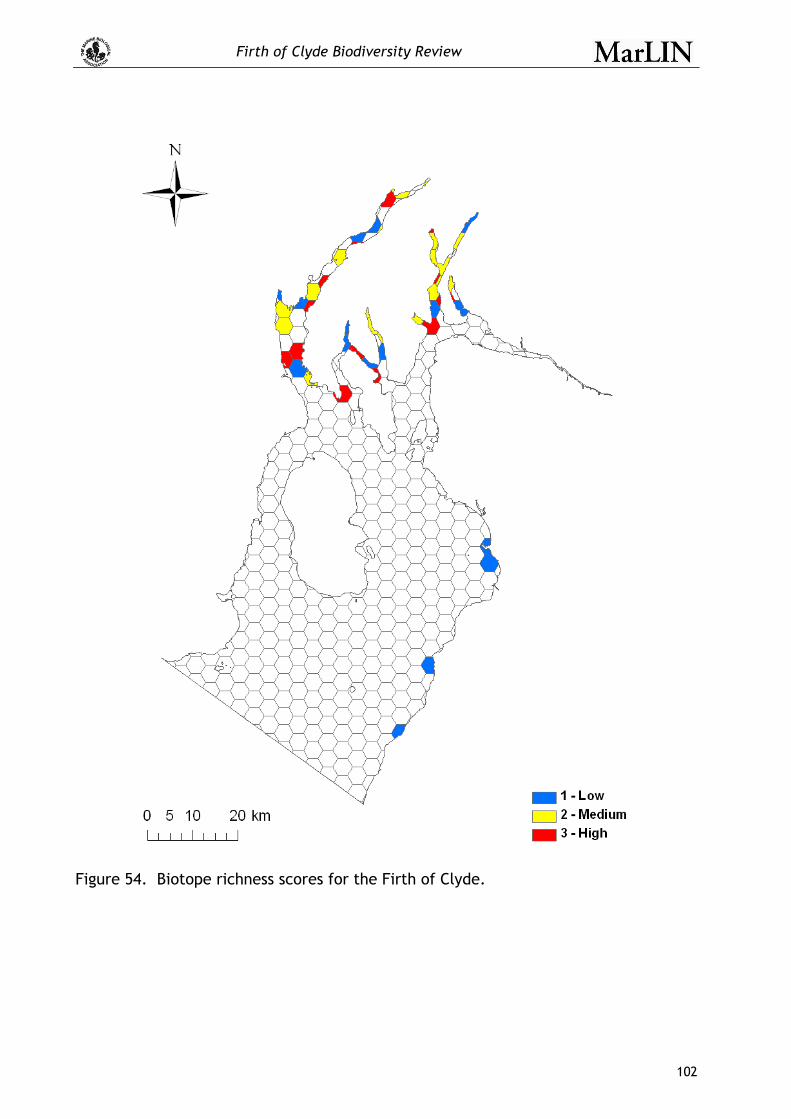
Firth of Clyde Biodiversity Review
102
Figure 54. Biotope richness scores for the Firth of Clyde.
Firth of Clyde Biodiversity Review
103
Figure 55. Biotope distinctness scores for the Firth of Clyde.
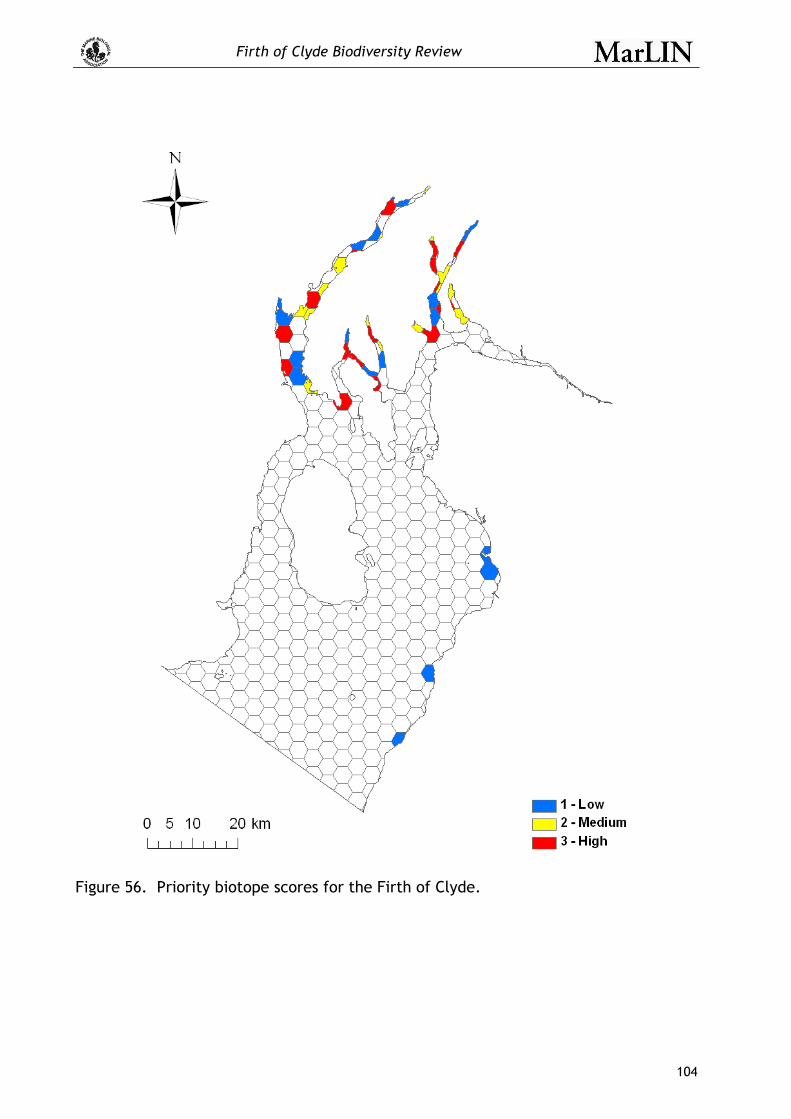
Firth of Clyde Biodiversity Review
104
Figure 56. Priority biotope scores for the Firth of Clyde.
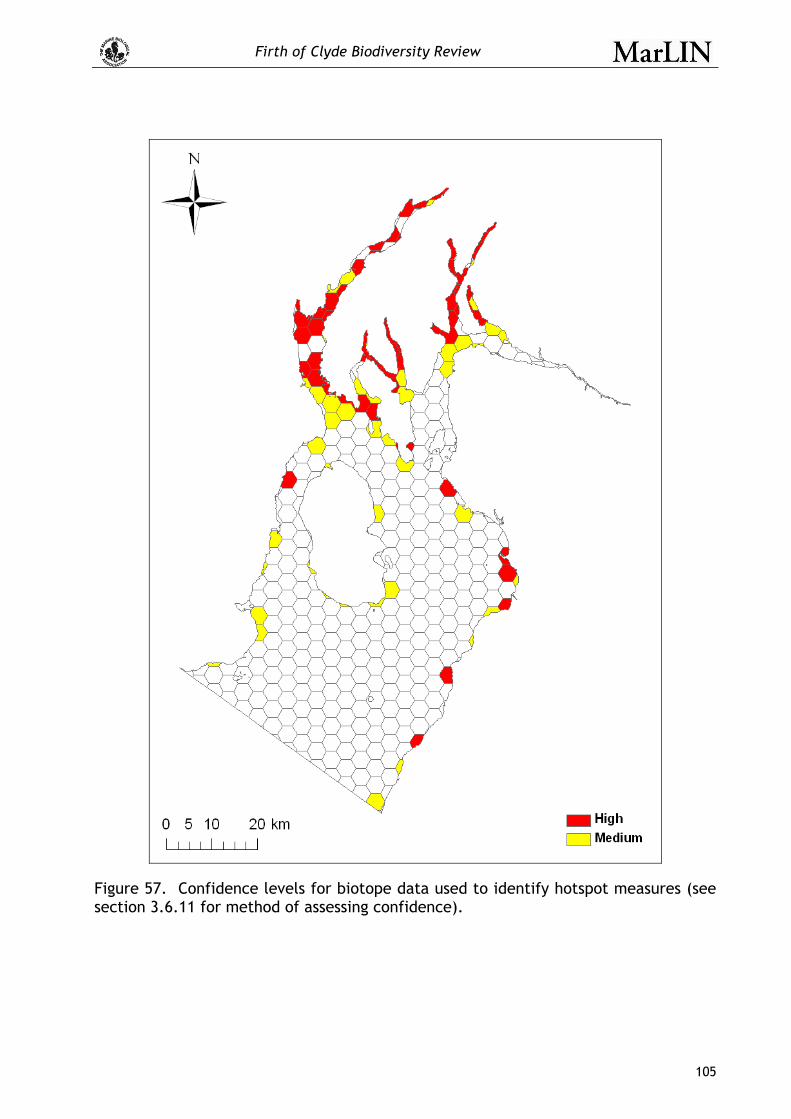
Firth of Clyde Biodiversity Review
105
Figure 57. Confidence levels for biotope data used to identify hotspot measures (see section 3.6.11 for method of assessing confidence).
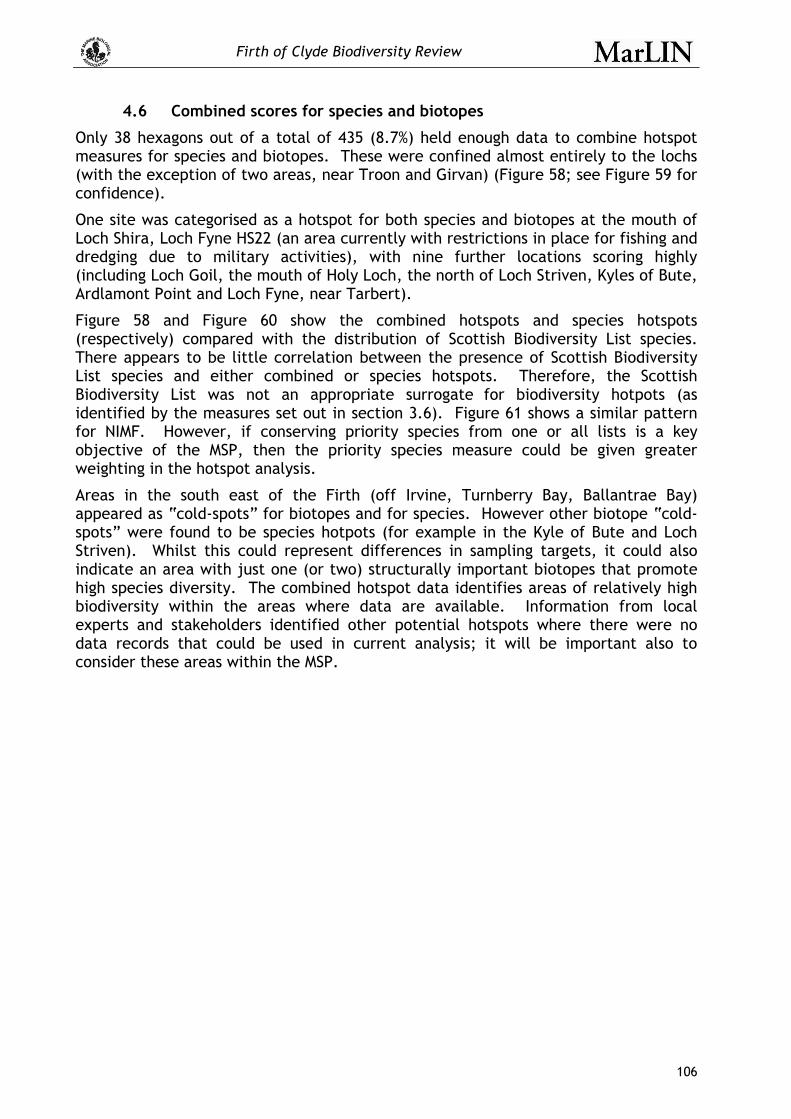
Firth of Clyde Biodiversity Review
106
4.6 Combined scores for species and biotopes
Only 38 hexagons out of a total of 435 (8.7%) held enough data to combine hotspot measures for species and biotopes. These were confined almost entirely to the lochs (with the exception of two areas, near Troon and Girvan) (Figure 58; see Figure 59 for confidence).
One site was categorised as a hotspot for both species and biotopes at the mouth of Loch Shira, Loch Fyne HS22 (an area currently with restrictions in place for fishing and dredging due to military activities), with nine further locations scoring highly (including Loch Goil, the mouth of Holy Loch, the north of Loch Striven, Kyles of Bute, Ardlamont Point and Loch Fyne, near Tarbert).
Figure 58 and Figure 60 show the combined hotspots and species hotspots (respectively) compared with the distribution of Scottish Biodiversity List species. There appears to be little correlation between the presence of Scottish Biodiversity List species and either combined or species hotspots. Therefore, the Scottish Biodiversity List was not an appropriate surrogate for biodiversity hotpots (as identified by the measures set out in section 3.6). Figure 61 shows a similar pattern for NIMF. However, if conserving priority species from one or all lists is a key objective of the MSP, then the priority species measure could be given greater weighting in the hotspot analysis.
Areas in the south east of the Firth (off Irvine, Turnberry Bay, Ballantrae Bay) appeared as “cold-spots” for biotopes and for species. However other biotope “cold-spots” were found to be species hotpots (for example in the Kyle of Bute and Loch Striven). Whilst this could represent differences in sampling targets, it could also indicate an area with just one (or two) structurally important biotopes that promote high species diversity. The combined hotspot data identifies areas of relatively high biodiversity within the areas where data are available. Information from local experts and stakeholders identified other potential hotspots where there were no data records that could be used in current analysis; it will be important also to consider these areas within the MSP.
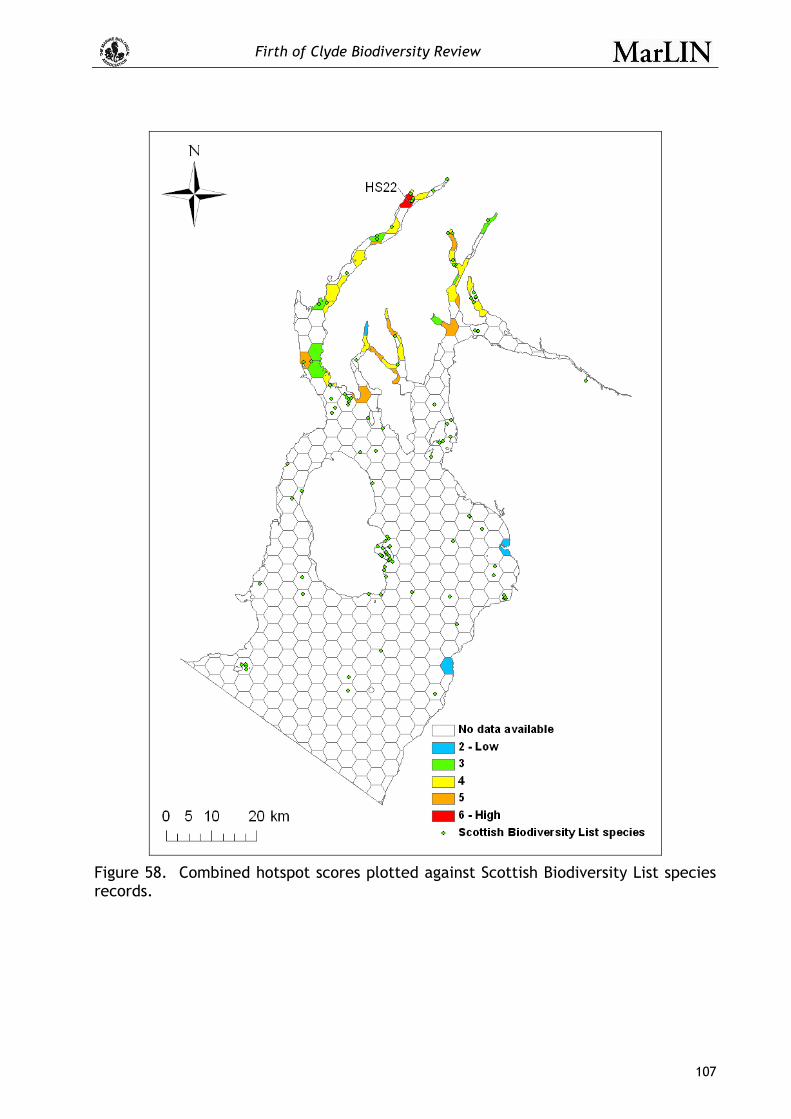
Firth of Clyde Biodiversity Review
107
Figure 58. Combined hotspot scores plotted against Scottish Biodiversity List species records.

Firth of Clyde Biodiversity Review
108
Figure 59. Confidence levels for data used to identify combined hotspot measures (see section 3.6.11 for method of assessing confidence).

Firth of Clyde Biodiversity Review
109
Figure 60. Species hotspots plotted against records of Scottish Biodiversity list species.

Firth of Clyde Biodiversity Review
110
Figure 61. Species hotspots plotted against NIMF species records.

Firth of Clyde Biodiversity Review
111
4.7 Predictive seabed habitat type diversity
The highest number of predictive seabed types occurs in the upper reaches of the Firth, especially in the lochs and the coastal margins (Figure 62). The highest diversity of predicted seabed habitat types occurred across the entrances to the sealochs (Loch Fyne and to the western and eastern sides of the Isle of Bute) but not actually within the lochs (with the exception of Gare Loch, Figure 63). There are also hotspots for predicted seabed habitat diversity in the outer Firth, around the Isle of Cumbrae and in the Kilbrannan Sound and the north of the Isle of Arran.
For areas where biotope richness is available, there seems to be little agreement between the hotspots for biotope richness and predictive seabed type diversity hotspots (see section 4.8). Of the 13 biotope richness hotspots just two were seabed habitat type diversity hotspots, with a further five having expected levels of seabed habitat type diversity and six having below expected levels of seabed habitat type diversity “cold spots”. This indicates that predictive seabed habitat type diversity is not a good surrogate for biotope richness and cannot be used as such in the absence of biotope survey data for identifying hotspots.
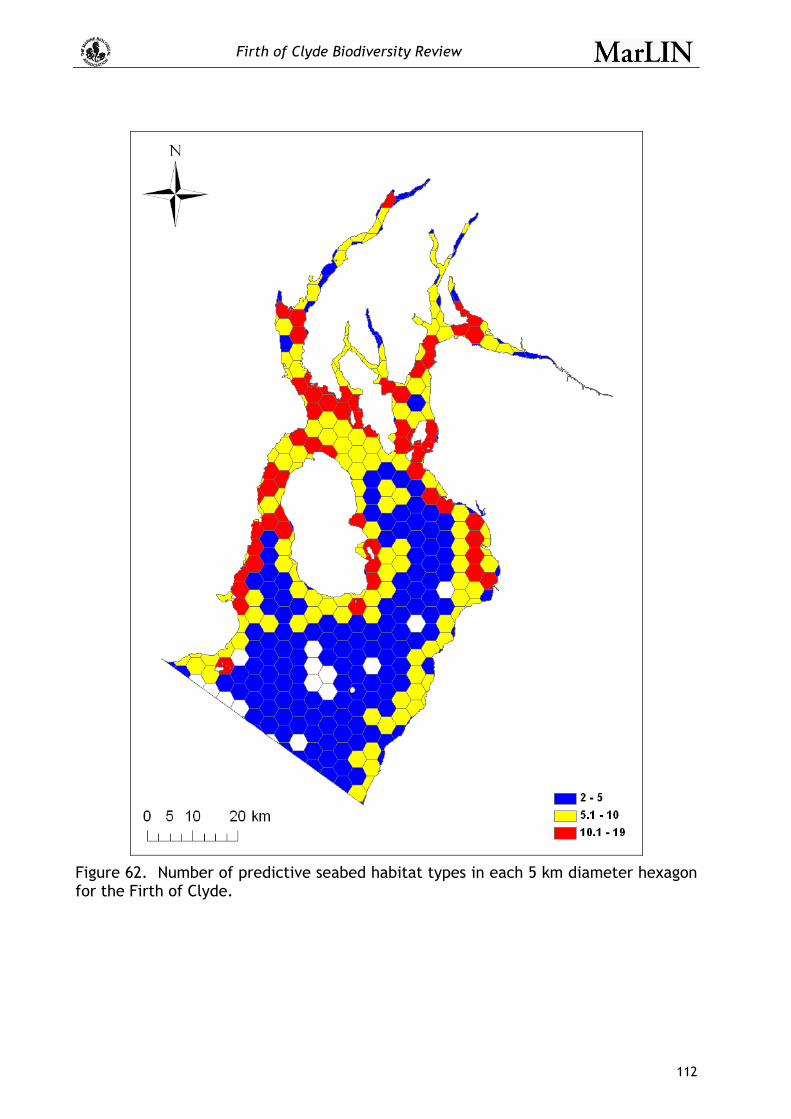
Firth of Clyde Biodiversity Review
112
Figure 62. Number of predictive seabed habitat types in each 5 km diameter hexagon for the Firth of Clyde.
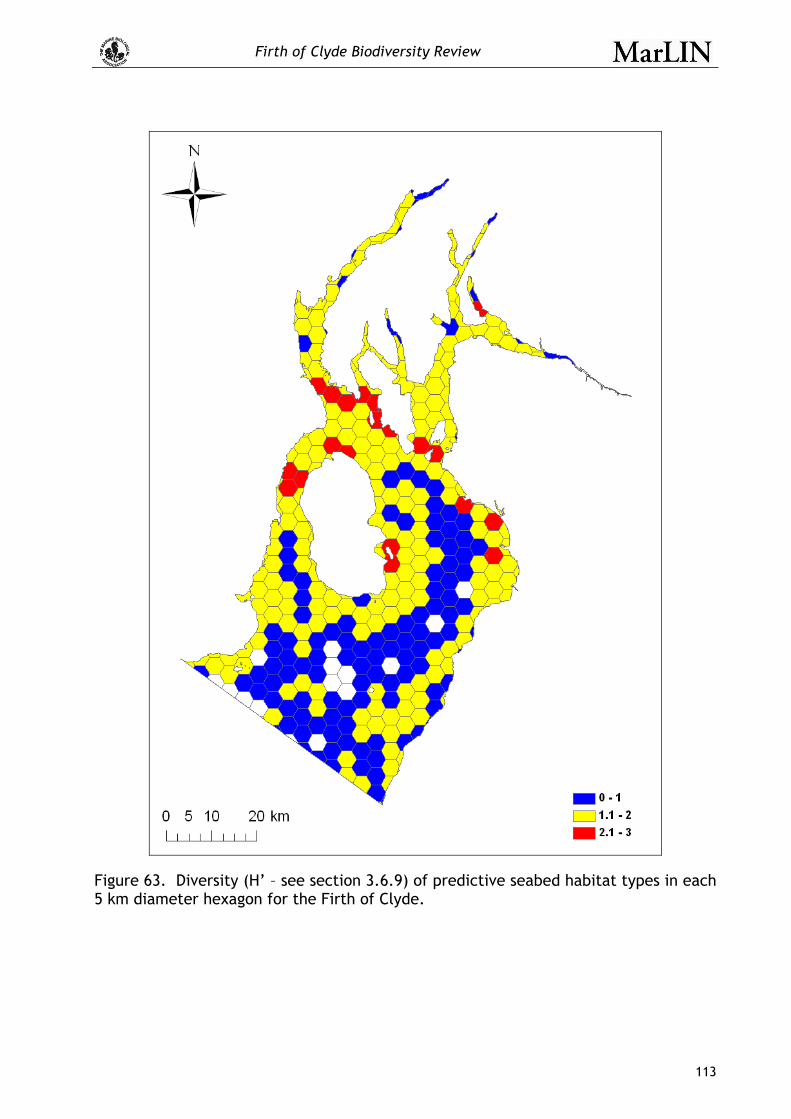
Firth of Clyde Biodiversity Review
113
Figure 63. Diversity (H’ – see section 3.6.9) of predictive seabed habitat types in each 5 km diameter hexagon for the Firth of Clyde.
Firth of Clyde Biodiversity Review
114
4.8 Concordance among measures
In section 3.5.7 we described alternative approaches to identifying areas of important marine biodiversity for use in marine spatial planning (MSP). The individual layers created within the worked example presented in this report constitute of one of these approaches (a hotspot approach) and can be used separately or in combination with other approaches for MSP.
The hotspots themselves highlight specific areas where protection would give the most “value for money”, that is they would protect high numbers of species and habitats (including priority features). Hotspots could also be used within decision support software such as Marxan to weight particular areas for inclusion within a network design for protected areas. Each of the layers could be used within a MSP GIS to highlight areas that require safeguarding for different reasons depending on the specific objectives of the plan. It is therefore useful to know the independence of each measure and how the combined scores represent the individual parts.
Table 8 shows the agreement between the different scores (for example whether for one hexagon species richness and biotope distinctness both scored highly). As individual measures, most of the scores are independent of each other. Importantly, the combined scores (i.e. species and biotope hotspot scores and species and biotope combined scores) show fair to very good agreement with their constituent parts, indicating that the combined scores provide a fairly comprehensive picture of the data. For example, species hotspot scores show good agreement with species richness and priority species scores and biotope hotspot captures both richness and priority biotopes well.
Few of the scores showed agreement with the number or diversity of physiographic types from the predictive seabed habitats. The predictive seabed habitat layers could be used separately, for example to produce landscape sensitivity maps for MSP, rather than as a proxy to identify important biodiversity. Interestingly mean species richness showed fair to moderate agreement with priority biotopes and biotope distinctness respectively.
It is clear from this analysis that no one measure captures all aspects of marine biodiversity and that, in the context of Marine Spatial Planning, multiple measures should be used.
The measures used in this study are not exclusive and other measures to support specific planning requirements could be added to the overall analysis to perhaps weight the hotspot calculation to reflect conservation priorities. For example, the priority species measure could be given higher priority for identifying areas for placing high levels of protection, or species/biotope richness could be given a greater weighting to identify those areas where large numbers of species/biotopes were represented.
4.9 Gaps analysis
Despite the wealth of information available for identifying important marine biodiversity within the Firth of Clyde, there are some significant gaps both spatially and in terms of the type of information available (for example for certain groups of species and seabed habitats).
Figure 4 and Figure 5 illustrate the availability of all data (with an indication of quality) for the identification of important biodiversity areas within the current study. For the worked example of the hotspot approach in this report only the hexagons
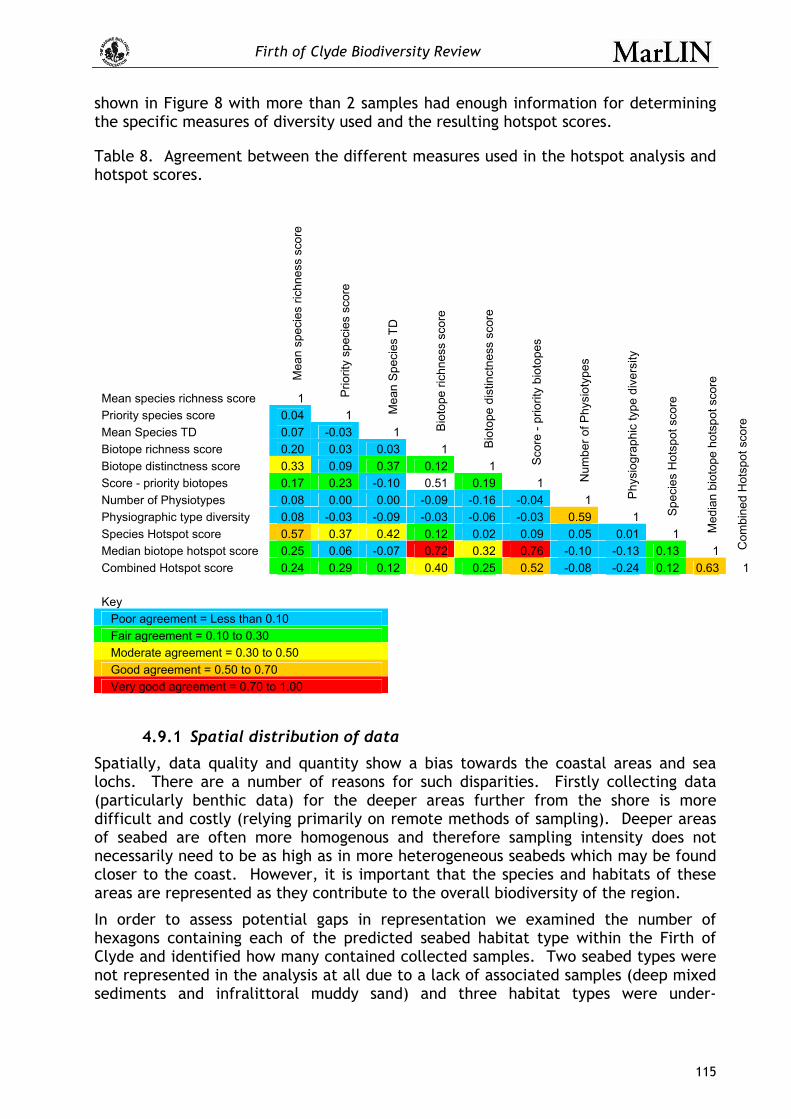
Firth of Clyde Biodiversity Review
115
shown in Figure 8 with more than 2 samples had enough information for determining the specific measures of diversity used and the resulting hotspot scores.
Table 8. Agreement between the different measures used in the hotspot analysis and hotspot scores.
Mea
n sp
ecie
s ric
hnes
s sc
ore
Mean species richness score 1 Prio
rity
spec
ies
scor
e
Priority species score 0.04 1 Mea
n S
peci
es T
D
Mean Species TD 0.07 -0.03 1 Bio
tope
rich
ness
sco
re
Biotope richness score 0.20 0.03 0.03 1 Bio
tope
dis
tinct
ness
sco
re
Biotope distinctness score 0.33 0.09 0.37 0.12 1 Sco
re -
prio
rity
biot
opes
Score - priority biotopes 0.17 0.23 -0.10 0.51 0.19 1 Num
ber o
f Phy
siot
ypes
Number of Physiotypes 0.08 0.00 0.00 -0.09 -0.16 -0.04 1 Phy
siog
raph
ic ty
pe d
iver
sity
Physiographic type diversity 0.08 -0.03 -0.09 -0.03 -0.06 -0.03 0.59 1 Spe
cies
Hot
spot
sco
re
Species Hotspot score 0.57 0.37 0.42 0.12 0.02 0.09 0.05 0.01 1 Med
ian
biot
ope
hots
pot s
core
Median biotope hotspot score 0.25 0.06 -0.07 0.72 0.32 0.76 -0.10 -0.13 0.13 1 Com
bine
d H
otsp
ot s
core
Combined Hotspot score 0.24 0.29 0.12 0.40 0.25 0.52 -0.08 -0.24 0.12 0.63 1 Key
Poor agreement = Less than 0.10 Fair agreement = 0.10 to 0.30 Moderate agreement = 0.30 to 0.50 Good agreement = 0.50 to 0.70 Very good agreement = 0.70 to 1.00
4.9.1 Spatial distribution of data
Spatially, data quality and quantity show a bias towards the coastal areas and sea lochs. There are a number of reasons for such disparities. Firstly collecting data (particularly benthic data) for the deeper areas further from the shore is more difficult and costly (relying primarily on remote methods of sampling). Deeper areas of seabed are often more homogenous and therefore sampling intensity does not necessarily need to be as high as in more heterogeneous seabeds which may be found closer to the coast. However, it is important that the species and habitats of these areas are represented as they contribute to the overall biodiversity of the region.
In order to assess potential gaps in representation we examined the number of hexagons containing each of the predicted seabed habitat type within the Firth of Clyde and identified how many contained collected samples. Two seabed types were not represented in the analysis at all due to a lack of associated samples (deep mixed sediments and infralittoral muddy sand) and three habitat types were under-
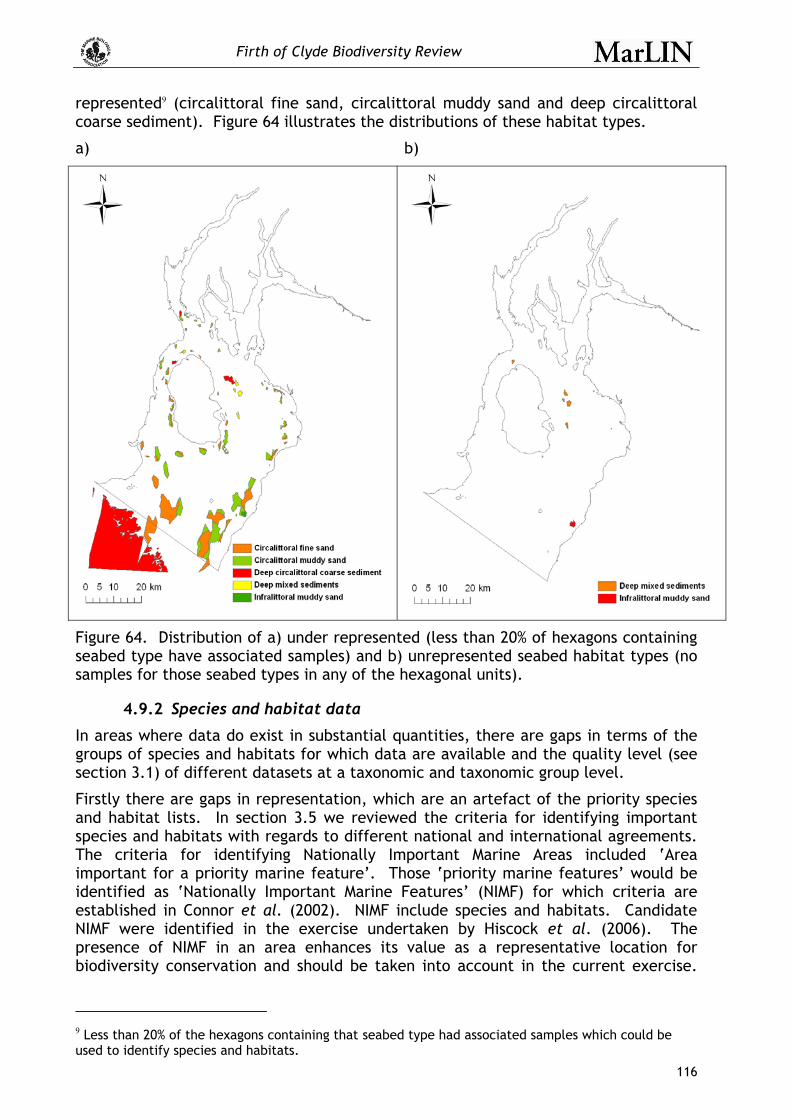
Firth of Clyde Biodiversity Review
116
represented9 (circalittoral fine sand, circalittoral muddy sand and deep circalittoral coarse sediment). Figure 64 illustrates the distributions of these habitat types.
a) b)
Figure 64. Distribution of a) under represented (less than 20% of hexagons containing seabed type have associated samples) and b) unrepresented seabed habitat types (no samples for those seabed types in any of the hexagonal units).
4.9.2 Species and habitat data
In areas where data do exist in substantial quantities, there are gaps in terms of the groups of species and habitats for which data are available and the quality level (see section 3.1) of different datasets at a taxonomic and taxonomic group level.
Firstly there are gaps in representation, which are an artefact of the priority species and habitat lists. In section 3.5 we reviewed the criteria for identifying important species and habitats with regards to different national and international agreements. The criteria for identifying Nationally Important Marine Areas included ‘Area important for a priority marine feature’. Those ‘priority marine features’ would be identified as ‘Nationally Important Marine Features’ (NIMF) for which criteria are established in Connor et al. (2002). NIMF include species and habitats. Candidate NIMF were identified in the exercise undertaken by Hiscock et al. (2006). The presence of NIMF in an area enhances its value as a representative location for biodiversity conservation and should be taken into account in the current exercise.
9 Less than 20% of the hexagons containing that seabed type had associated samples which could be used to identify species and habitats.
Firth of Clyde Biodiversity Review
117
However, it should be noted that the list of NIMF species and habitats is currently a candidate list only.
The criteria for identifying candidate NIMF species and habitats do not require the same quantitative rigour that proved so difficult to apply in identifying marine BAP species and habitats. The cNIMF list is therefore a much better representation of marine species and habitats that are rare, in decline or threatened with decline. However, all of the BAP species and habitats are also NIMF and so the candidate NIMF list provides the most suitable measure to address the criterion ‘Area important for a priority marine feature’.
Nevertheless, the list of NIMF species is not very ‘even’ in coverage across the major taxonomic groups. Some of the specialists approached to review groups indicated that they did not believe in the relevant concepts and, for instance, ‘to a man’ for the polychaetes declined to put any species forward. For other groups, relevant specialists were too busy and, although some obvious candidates could be included, a proper analysis was not undertaken: for instance, sponges. Although the candidate list, along with the other priority lists, nevertheless provides the best current indication of species to be protected, they do not represent the entire suite of marine biodiversity. Secondly, identifying important areas of marine biodiversity in terms of total diversity is very sensitive to data availability, collection methods and survey effort. In this study we used only benthic species and habitats data (and for species taxonomic diversity we limited the analysis to six taxonomic groups) because this section of data are the most comprehensive (ease of sampling and static nature of many species). That is not to say that the analysis method presented here could not, and should not, be carried out on other taxonomic groups and species from the pelagic realm but the data gaps (in terms of quality and quantity) must first be filled. Currently pelagic species information does exist but the spatial resolution of the information is poor (see cetacean data from Appendix 7). Also because these species are highly mobile, identifying important areas requires greater temporal analysis and is currently confounded by the method of sampling (for example cetacean sightings are limited to where these species spend significant time at the sea surface).
4.9.3 Variation in data quality
With the current acceptance of the need to record information in a way that is not only fit for purpose but extends the use of the data beyond purpose10, the problems encountered with trying to use some of the past data should be avoided in the future. Also despite the short comings of some of the data, there are possible ways of retaining lower quality data (while this is outside of the scope of this work, recommendations will be made). The two main quality issues that prevented data retention in analyses were inaccurate or estimated spatial positioning and taxonomic or habitat classification ambiguities (e.g. species only identified to genus or family). Estimated or low resolution position data could be included by repeating the analysis for each of the possible areas (hexagonal units) that the feature could exist in (where it had not been identified from other areas). An examination of these reiterations would allow an assessment of where the hotspots might change with the inclusion of this data and therefore identify potential areas where further research is needed to confirm the location of these features.
10 Guidelines are currently being produced under the MEDIN framework (see section 3.2) to standardise biological data recording to extend the use of data beyond purpose.
Firth of Clyde Biodiversity Review
118
Species records that were only identified to genus or family could be included if these were unique genera or families within the seabed type within a hexagonal unit (i.e. there are no other species of that family or genus). We examined five randomly selected hexagons to identify the number of additional genera that would be included in the analysis using this approach (see Appendix 9). In some cases over 10 additional genera could have been included. Whilst individual species richness and taxonomic distinctness measures may be influenced by these additions, it is less likely that the relative scores would change significantly. Such data were also associated with low quality datasets and therefore should be used with caution.
In the worked approach used in this study 59% of biotope records (mainly SeaSearch data) were excluded from analyses due to problems with translation of the biotopes to the EUNIS classification that could not be overcome. These data could be included as a separate entity within the overall analysis, by recalculating the biotope measures using these data separately to create new GIS layers. Scores for the overall assessment of important areas could be calculated by incorporating these additional measures. However, without knowing the relationship with the other classifications used it would be unclear where information had been duplicated. Instead, we recommend that separate layers of biotope richness and distinctness be produced using the biotope data in the alternative classification to examine whether different or additional areas are highlighted as important in terms of biotope diversity.
Firth of Clyde Biodiversity Review
119
5. Conclusions and recommendations
The dataset compiled during this project and its subsequent analysis revealed patterns in the relative importance of biodiversity in different areas of the Firth of Clyde, based on the available information.
The approach employed here to identify important areas of marine biodiversity was in effect a systematic review11 and followed the set steps involved in such a review, as outlined in the Cochrane Handbook.
1. Formulating a problem (approaches to identifying areas of important biodiversity)
2. Locating and selecting studies
3. Critical appraisal of studies
4. Collecting data
5. Analyzing and presenting results
6. Interpreting results
7. Improving and updating reviews
Such a method has the advantage that it is repeatable (for example it can be updated easily when new data becomes available), precise and unbiased.
5.1 The occurrence, distribution and extent of intertidal and subtidal species and habitats
This study constitutes the most comprehensive analysis of biodiversity for this region to date, despite gaps in the available data (see section 4.9 and below). A total of ca 133,000 data records were collated. The analysis of patterns of biodiversity encompassed an examination of the distribution patterns of species and habitats of conservation concern, together with detailed biodiversity hotspot analyses.
Estimates of areas of important biodiversity are extremely dependent on the state of current knowledge, and hence data coverage. Equally important is the fact that estimates of current distribution of species and biotopes are dependent on sampling or survey effort, and on the age of the dataset concerned. The analysis method worked through in this report to identify biodiversity ’hot spots’ and ‘cold spots’ compensates for sample intensity, and gives an estimate of relative biodiversity, but only in very limited areas where the data meets set criteria in terms of quality and quantity for the analysis. Setting criteria for the inclusion and omission of datasets is therefore crucial for carrying out the sort of objective, defendable assessment upon which evidence based decisions are made.
The disadvantage with taking a systematic review approach is that large amounts of data are omitted due to quality issues, and the analysis does not incorporate subjective qualitative information. Although the more qualitative information (for
11 A summary of research that uses explicit methods to perform a thorough literature and data search and critical appraisal of individual studies to identify the valid and applicable evidence to address a specific question. University of York (March 2001), Undertaking systematic reviews of research on effectiveness: CRD's guidance for those carrying out or commissioning reviews. CRD Report 4 (2nd edition). Cited 2007-06-27
Firth of Clyde Biodiversity Review
120
example consultations with stakeholders), lower quality data, coarser or modelled data (for example the predictive seabed habitat map) are omitted from the analyses, they can still be, and were, collected and presented separately in the review and used to help with formulating a MSP in the absence of more detailed quantitative information.
5.1.1 Limitations
The main limitations on this study, and ultimately to the inclusion of biodiversity data in a Marine Spatial Plan in the Firth of Clyde area, are related to 1) data accessibility and 2) data coverage.
1. Fundamental accessibility of data within the project timeframe.
• Data collection was a time and resource intensive activity. Future studies must have clearly defined time-frames for data collection activities. During this project, the lengthy mobilization time for certain data prevented their use in the study (e.g. seal haul out data (SMRU), harbour porpoise and basking shark data (University of Plymouth), basking shark data (MCS)). Other data were discarded due to their coarse resolution, such as the JNCC cetacean data. Mobilization of data requires a targeted approach, and data holder engagement through site visits and, hence, the allocation of staff time.
• More complete and widely available metadata from the data providers would have significantly improved the effectiveness and the timescale of the data collation exercise.
• The data were provided in varied formats (e.g. some datasets had replicates aggregated while others had replicates recorded separately, an important issue for analyses that are dependent on sampling effort). This meant additional time had to be spent reformatting and restructuring datasets and this delayed the analysis phase of the project.
2. Data coverage.
• The spatial coverage of species and biotope survey data in the Firth of Clyde necessitated the use of large spatial units for mapping. Smaller spatial units could potentially be used in other areas where there is better coverage but there will inevitably be a trade-off between having sufficient samples in each spatial unit to make any comparisons meaningful and losing resolution in the spread of data by aggregating across too large an area. This highlights the need for new surveys to be undertaken across the study area, particularly in the outer Firth, where records are especially poor.
• The biotope analyses were concentrated in areas of the sea lochs, again due to the spatial coverage of data. Furthermore, species hotspot analyses indicate the extremely uneven data coverage and highlight large areas for which little is known. This emphasises the limitations that data availability place on large-scale analyses such as the present one.
5.1.2 Recommendations for future data collation and collection for MSP
Data availability and accessibility are paramount in MSP, as in coastal management planning and ‘State of the Seas’ reporting. The difficulties inherent in marine data acquisition in the UK were major obstacles to the Irish Sea Regional Seas Planning Pilot (JNCC, 2004) and Charting Progress (Defra, 2005), and this study was no exception.

Firth of Clyde Biodiversity Review
121
For future collations of data we make the following recommendations.
• The time taken to acquire data from disparate organizations should not be underestimated.
• Visiting data holders was an extremely productive way of mobilizing their data, as it gave the authors the opportunity to explain the importance of the study and its data needs. It also allowed data to be collected in situ.
• Data acquisition was promoted by the project’s connection with a defined project, the SSMEI and the Firth of Clyde pilot. Data providers ‘bought in’ to the projects aims and could see clear advantages in being associated with a Scottish project.
• Data providers should be made aware of the project’s time frame and clear deadlines set for data acquisition.
• Data standardization (from multiple formats) and quality control are a major time constraint that should not be underestimated.
Past large scale data collation projects have found data acquisition difficult (see (Cowling, 2005)). This is why the UK Government set up the Marine Data Information Partnership, now the Marine Environmental Data Information Network (MEDIN). The growing network of marine Data Archive Centres and requirement for UK wide metadata and data standardization should enable projects such as this to collate data in less time in the not too distant future. The project team’s association with the Data Archive for Seabed Species and Habitats was of considerable benefit to the project data acquisition and analysis.
• Data collation should be undertaken in liaison with the relevant national marine Data Archive Centres.
The gaps in data coverage are best filled by up to date surveys of the relevant areas. A sample bias is apparent in the distribution maps for priority species and habitats and inherent in the data, and may result from surveys focusing on areas of known occurrences of specific features. This bias highlights that future surveys should take a more objective approach to surveying areas and report on nil results, in order that a true representation of distributions is available.
Nevertheless, legacy data also has a role to play, and should be examined prior to re-survey. Legacy data also has the advantage of providing a ‘before’ and ‘after’ snapshot, which could be used to identify changes in the biodiversity of the Firth of Clyde over time.
For future data recording we recommend setting up protocols that promote high data quality (in line with the work being carried out by MEDIN) primarily in order to extend the use of the data beyond its initial purpose.
We recommend using a standard habitat classification (EUNIS) for the simple reason that it allows a comparison between like and like and avoids double badging (an important consideration when assessing relative biotope richness). This again will mean that large amounts of data cannot be used in the analysis of hotspots but could be used separately and with caution for MSP or focusing future survey work.
Further to this we recommend that more work be carried out to examine whether it is possible for the SeaSearch biotope classification to be translated to EUNIS without significant resurveying, and that the way Seasearch data are recorded in the future be revised so that the information is translatable.
Firth of Clyde Biodiversity Review
122
5.2 Application of existing criteria for the identification of important marine biodiversity within MSP
The aim of the current study was to examine the available data and suggest ways in which areas of important biodiversity could be identified for the Firth of Clyde for the purposes of MSP.
The first decision made prior to identifying areas was the scale of planning unit. One option for utilising the information within a MSP would be to use a two-tiered scale of resolution, a finer scale or unit for the coastal areas and sea lochs and a coarser scale for the open Firth. In addition, the size and shape of planning units could be adapted depending on data availability, management issues and specific spatial issues relevant to marine spatial planning. For the purposes of the worked example of a hotspot approach presented here we chose 5 km diameter hexagons as a standard unit (see section 3.4 for the reasoning behind this).
• Using a standard scale of unit across the study area removes any spatial bias and allows a comparison of the relative importance of different areas in terms of biodiversity.
Another decision that must be taken early on in such a study is what approach to use to identify important areas for marine biodiversity. If the decision is to identify concentrations of priority species and habitats then a decision on which criteria are the most important is required. It is clear that the different lists available (BAP, NIMF, nationally rare and scarce, OSPAR, Scottish Biodiversity List and LBAP) are all created at different scales from local to international and the criteria span from extremely quantitative to rather more forgiving.
The key consideration is, however, which criteria can be applied at a local level. Only the LBAP criteria are designed to be applied at such small spatial scales and most of the other criteria simply cannot be adequately translated (for example nationally rare and scarce and NIMF criteria look at rarity at a UK-wide scale, while OSPAR criteria it is at a NE Atlantic regional sea scale). However, because LBAP criteria are based on BAP criteria and have specific data requirements for demonstrating decline, NIMF criteria are possibly better suited to application for MSP at local scales.
There is no easy solution to this issue and undoubtedly this complex problem will recur in the future until, for example, LIMF criteria (Locally Important Marine Features) are developed specifically to address this problem.
We could not apply these criteria at a local level during this study due to insufficient data to determine levels of, for example, decline. The recent review of BAPs and identification of candidate NIMFs ((Hiscock et al., 2006)) drew heavily on a large number of national experts on particular species groups or habitats. Such a review was outside the remit of this study.
5.3 Identification of areas of biodiversity interest within the Firth of Clyde
The approach used in this report, identified a number of locations that are biodiversity hotpots for species or biotopes or both.
One site, at the mouth of Loch Shira, was categorised as a combined hotspot for both species and biotopes. A further nine locations scored highly for the final combined biodiversity hotspot score (see Appendix 8).
Firth of Clyde Biodiversity Review
123
Overall, the following areas included combined biodiversity hotspots in the Firth of Clyde.
• Mouth of Loch Shira
• Loch Goil;
• the mouth of Holy Loch;
• the north of Loch Striven;
• Kyles of Bute;
• Ardlamont Point; and
• Loch Fyne, near Tarbert.
In addition, the following locations included biodiversity hotspots for species or biotopes alone.
• Northern Loch Fyne;
• Loch Striven;
• East of Dunoon in the upper Firth;
• East of Rothesay;
• Irvine Bay;
• Loch Long;
• Gare Loch and Loch Long;
• Loch Fyne around Barmore Island;
• Ardlamont Point, and
• Kames Bay.
The analysis also revealed several areas of particular species richness. These were:
• Glenan Bay;
• East of Loch Tarbert;
• West of Skipness;
• Kilchousland Bay; and
• North of Brodick Bay, Arran
All of the above areas may be considered to be of importance for marine biodiversity in the Firth of Clyde. But all the analysis is based on the current data, which is in itself patchy and dependant on sampling bias.
5.4 Recommendations for using the results of the current study in MSP
It is clear that no one measure provides a complete representation of biodiversity, and that a range of measures needs to be used (see Table 8). The biodiversity ‘hotspot’ approach has the advantage of combining different measures representative of priority features and diversity of features into one measure (where data allow) presenting the information as one relative rank of biodiversity importance for marine spatial planners to view. The concordance analysis demonstrated that the biodiversity hotspot scores represented the relative levels of species or biotope
Firth of Clyde Biodiversity Review
124
richness, number of priority species or biotopes, and taxonomic and biotope distinctness.
The individual biodiversity measures (e.g. species richness, biotope distinctness, seabed type diversity etc) and the distribution of priority species in respect to the various criteria could be used separately or in combination as part of the MSP. However, it should be noted that all of these measures, and species richness in particular, are highly dependent upon sampling intensity. For example, species richness could only be included in our analysis once it had been ‘normalised’ for sampling effort and locations of more than expected levels of species richness, relative to sampling effort, identified.
Other methods to identifying important areas for biodiversity are reviewed in section 3.5.7, and the GIS layers (including a layer showing areas identified by experts to be locally important) allowing these alternative approaches to be employed for MSP are available with this report and project GIS.
A hotspot approach aims to prioritise areas for protection based on cost effectiveness, in essence protecting the highest number of important species and habitats for the least cost. Whilst such a method (in particular where it combines different measures) can synthesise lots of information into a more simplified form for management and planning, there is a concern that this may obscure some of the finer detail that could also be important.
Taking an Ecosystem Approach to representing marine biodiversity requires all species and habitats to be represented within protected areas and in sufficient amounts (area and population size) to allow the ecosystem to function “normally”. Despite gaps in data coverage, it may be possible to use the available data to identify areas (using predefined units such as the 5 km diameter hexagons) that allow a certain proportion of each of the habitats and species to be included in protected areas within the Marine Spatial Plan (MSP). Decision support software such as Marxan (Ball & Possingham, 2000) can be used to identify a number of possible areas.
• We recommend that a combination of approaches (biodiversity measures, biodiversity hotspots, representativeness of all features and sensitivity assessments) be used in the MSP.
The predictive seabed habitat type was explored as a potential surrogate for biotope survey data. But comparisons of seabed habitat type diversity with biotope richness indicate that this is not a viable option for the Firth of Clyde study area. However, the predictive seabed map may be used for examining coarse level representativeness, in protected areas, of all the habitats found in the Firth of Clyde within protected areas.
• An examination of the relationships between recorded habitats and predicted habitats would allow the confidence in using the predictive seabed maps as a surrogate to be assessed but was beyond the scope of the current study.
All maps generated in the course of this study must be considered within the context of expert knowledge of this study area. The maps are based on the data available but these reflect data availability and may miss important sites that have not been formally surveyed. As such, they may not be a definitive representation of regional patterns of biodiversity. The next stage of this project, stakeholder review (which our initial consultation with local experts can contribute to), is vital to allow refinement of the maps and improve on data gaps either through data archaeology or further survey work.

Firth of Clyde Biodiversity Review
125
Additional future work may also include the assessment of sensitivity of the identified hotspots or key species or habitats to anthropogenic or environmental factors. Such assessments could provide additional layers and contextual information for the development of a marine spatial plan for the SSMEI Clyde Pilot study area.

Firth of Clyde Biodiversity Review
126
6. References
Ball I.R. and Possingham H.P. (2000). Marxan (v1.8.2): Marine reserve design using spatially explicit annealing, Great Barrier Reef Marine Park Authority, Townsville, Australia. Available online as of April 2004 at www.ecology.uq.edu.au/marxan.htm.
Beck M.W. and Odaya M. (2001). Ecoregional planning in marine environments: identifying priority sites for conservation in the northern Gulf of Mexico. Aquatic Conservation: Marine and Freshwater Ecosystems, 11, 235–242.
Bonn A., Rodrigues S.L. and Gaston K.J. (2002). Threatened and endemic species: are they good indicators of patterns of biodiversity on a national scale? Ecology Letters, 5, 733-741.
Clarke K.R. and Warwick R.M. (1998). A taxonomic distinctness index and its statistical properties. Journal of Applied Ecology, 35, 523-531.
Connor D.W., Allen J.H., Golding N., Lieberknecht L.M., Northen K.O. and Reker J.B. (2003). The National Marine Habitat Classification for Britain and Ireland Joint Nature Conservation Committee, Peterborough, pp.
Connor D.W., Breen J., Champion A., Gilliland P.M., Huggett D., Johnston C., Laffoley D.d.A., Lieberknecht L., Lumb C., Ramsay K. and Shardlow M. (2002). Rationale and criteria for the identification of nationally important marine nature conservation features and areas in the UK. Version 02.11. Joint Nature Conservation Committee (on behalf of the statutory nature conservation agencies and Wildlife and Countryside Link) for the Defra Working Group on the Review of Marine Nature Conservation, Peterborough, 23 pp.
Connor D.W., Gilliland P.M., Golding N., Robinson P., Todd D. and Verling E. (2006). UKSeaMap: the mapping of seabed and water column features of UK Seas. Joint Nature Conservation Committee (JNCC), Peterborough, pp.
Cowling M. (2005). Marine Data and Information - Where to now? Report to IACMST from Glasgow Marine Technology Centre University of Glasgow, Glasgow, pp.
Defra (2005). Charting Progress. An integrated assessment of the state of UK seas. Defra, London, pp.
Hiscock K. and Breckels M. (2007). Marine Biodiversity Hotspots in the UK. A report identifying and protecting areas for marine biodiversity prepared by the Marine Biological Assocation, Plymouth for the WWF. Marine Biological Association, Plymouth, 116 pp.
Hiscock K. and Harris R. (2007). Nationally Important Marine Features and Biodiversity Action Plan Marine Priority Habitats and Species: Supplementary Report. Report to the Joint Nature Conservation Committee from the Marine Biological Association, JNCC Contract F90-01-892 Marine Biological Association, Plymouth, 48 pp.
Hiscock K., Harris R. and Lukey J. (2006). Nationally Important Marine Features and Biodiversity Action Plan Marine Priority Habitats and Species. Report to the Joint Nature Conservation Committee from the Marine Biological Association, JNCC Contract F90-01-892, Marine Biological Association, Plymouth, 48 pp.
Firth of Clyde Biodiversity Review
127
Hooper J.N.A., Kennedy J.A. and Quinn R.J. (2002). Biodiversity ‘hotspots’, patterns of richness and endemism, and taxonomic affinities of tropical Australian sponges (Porifera). Biodiversity and Conservation, 11, 851-885.
Hughes T.P., Bellwood D.R. and Connolly S.R. (2002). Biodiversity hotspots, centres of endemicity, and the conservation of coral reefs. Ecology Letters, 5, 775-784.
ISO (2006). ISO 19115:2003/Cor 1:2006 Geographic Information - Metadata. International Organization for Standardization.
Jenness J. (2005). Repeating Shapes (repeat_shapes.avx) extension for ArcView 3.x. http://www.jennessent.com/arcview/repeat_shapes.htm
JNCC (2004). The Irish Sea Pilot Final Report. Joint Nature Conservation Committee. , Peterborough, pp. http://www.jncc.gov.uk/page-2767
JNCC (2007a). Local Biodiversity Action Plan for Argyll and Bute. (19/03/2008). http://www.ukbap.org.uk/lbap.aspx?ID=358
JNCC (2007b). UK List of Priority Species and Habitats. (19/03/2008). http://www.ukbap.org.uk/NewPriorityList.aspx
Joint Nature Conservation Committee (2007). EUNIS marine classification correlation table http://www.jncc.gov.uk/pdf/EUNIS_200706_correlationtable.pdf, JNCC, Peterborough, pp.
Leopold A. (1933). Game Management, New York: Charles Scribners.
Lincoln R., Boxshall G. and Clark P. (1998). A dictionary of ecology, evolution and systematics (2nd ed.), Cambridge: Cambridge University of Press.
Magurran A.E. (1996). Ecological Diversity and Its Measures, London, UK: Chapman & Hall.
Myers N., Mittermeier R.A., Mittermeier C.G., da Fonseca G.A.B. and Kent J. (2000). Biodiversity hotspots for conservation priorities. Nature, 403, 853-858.
OSPAR (2004). Initial OSPAR List of Threatened and/or Declining Species and Habitats. (19/03/2008). http://www.ospar.org/eng/html/welcome.html
Phillips J.A. (2001). Marine macroalgal biodiversity hotspots: why is there high species richness and endemism in southern Australian marine benthic flora? Biodiversity and Conservation, 10, 1555-1577.
Price A.R.G. (2002). Simultaneous ''hotspots'' and "coldspots'' of marine biodiversity and implications for global conservation. Marine Ecology Progress Series, 241, 23-27.
Purvis A. and Hector A. (2000). Getting the measure of biodiversity. Nature, 405, 212-219.
Rackham L. and Walker R. (2006). Metadata Guidelines for Geospatial Datasets in the UK. Part 3 Metadata Quality commissioned by the Department for Communities and Local Government. http://www.gigateway.org.uk/pdf/guidelines/MetadataGuidelines3.pdf
Reid W.V. (1998). Biodiversity hotspots. Trends in Ecology & Evolution, 13, 275-280.
Sanderson W. (1996). Rarity of marine benthic species in Great Britain: development and application of assessment criteria. Aquatic Conservation, 6, 245-256.

Firth of Clyde Biodiversity Review
128
Scottish Biodiversity Forum (2005). The Scottish Biodiversity List. (19/03/2008). http://www.biodiversityscotland.gov.uk/pageType2.php?id=35&type=2&navID=92
Tresadern S. (2008). The Process of Developing a Seabed Habitat Map for the Firth of Clyde. A study carried out for the SSMEI Clyde Pilot by ERT Scotland (Ltd). ERT Scotland (Ltd), Aberdeen, 46 pp.
Tyler-Walters H. and Hiscock K. (2005). Impact of human activities on benthic biotopes and species. Report to Department for Environment, Food and Rural Affairs from the Marine Life Information Network (MarLIN) Marine Biological Association of the UK. [Contract no. CDEP 84/5/244], Plymouth, pp.
Vanderklift M.A., Ward T.J. and Phillips J.C. (1998). Use of assemblages derived from different taxonomic levels to select areas for conserving marine biodiversity. Biological Conservation, 86, 307-315.
Warwick R.M. and Clarke K.R. (2001). Practical measures of marine biodiversity based on relatedness of species. Oceanography and Marine Biology: an Annual Review, 39, 207-231.
Worm B., Lotze H.K. and Myers R.A. (2003). Predator diversity hotspots in the blue ocean. Proceedings of the National Academy of Sciences of the United States of America, 100, 9884.
WoRMS (2007). World Register of Marine Species. (11/04/2007). http://www.marinespecies.org
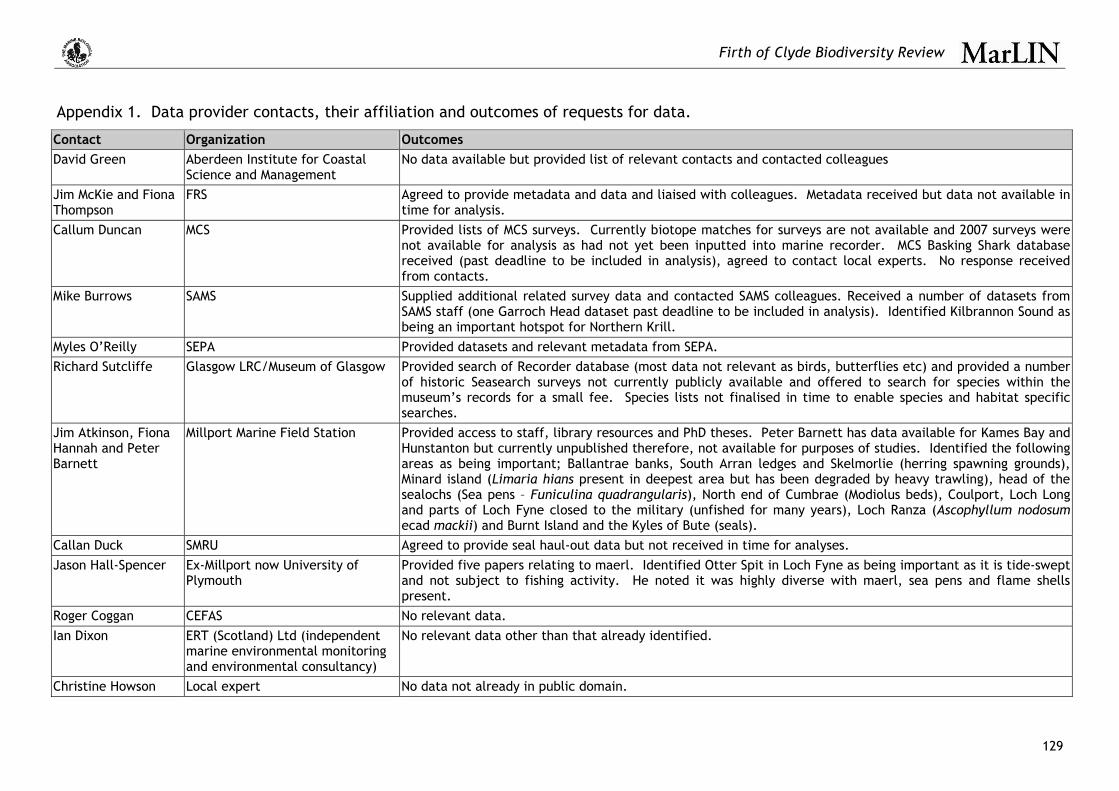
Firth of Clyde Biodiversity Review
129
Appendix 1. Data provider contacts, their affiliation and outcomes of requests for data.
Contact Organization Outcomes David Green Aberdeen Institute for Coastal
Science and Management No data available but provided list of relevant contacts and contacted colleagues
Jim McKie and Fiona Thompson
FRS Agreed to provide metadata and data and liaised with colleagues. Metadata received but data not available in time for analysis.
Callum Duncan MCS Provided lists of MCS surveys. Currently biotope matches for surveys are not available and 2007 surveys were not available for analysis as had not yet been inputted into marine recorder. MCS Basking Shark database received (past deadline to be included in analysis), agreed to contact local experts. No response received from contacts.
Mike Burrows SAMS Supplied additional related survey data and contacted SAMS colleagues. Received a number of datasets from SAMS staff (one Garroch Head dataset past deadline to be included in analysis). Identified Kilbrannon Sound as being an important hotspot for Northern Krill.
Myles O’Reilly SEPA Provided datasets and relevant metadata from SEPA. Richard Sutcliffe Glasgow LRC/Museum of Glasgow Provided search of Recorder database (most data not relevant as birds, butterflies etc) and provided a number
of historic Seasearch surveys not currently publicly available and offered to search for species within the museum’s records for a small fee. Species lists not finalised in time to enable species and habitat specific searches.
Jim Atkinson, Fiona Hannah and Peter Barnett
Millport Marine Field Station Provided access to staff, library resources and PhD theses. Peter Barnett has data available for Kames Bay and Hunstanton but currently unpublished therefore, not available for purposes of studies. Identified the following areas as being important; Ballantrae banks, South Arran ledges and Skelmorlie (herring spawning grounds), Minard island (Limaria hians present in deepest area but has been degraded by heavy trawling), head of the sealochs (Sea pens – Funiculina quadrangularis), North end of Cumbrae (Modiolus beds), Coulport, Loch Long and parts of Loch Fyne closed to the military (unfished for many years), Loch Ranza (Ascophyllum nodosum ecad mackii) and Burnt Island and the Kyles of Bute (seals).
Callan Duck SMRU Agreed to provide seal haul-out data but not received in time for analyses. Jason Hall-Spencer Ex-Millport now University of
Plymouth Provided five papers relating to maerl. Identified Otter Spit in Loch Fyne as being important as it is tide-swept and not subject to fishing activity. He noted it was highly diverse with maerl, sea pens and flame shells present.
Roger Coggan CEFAS No relevant data. Ian Dixon ERT (Scotland) Ltd (independent
marine environmental monitoring and environmental consultancy)
No relevant data other than that already identified.
Christine Howson Local expert No data not already in public domain.

Firth of Clyde Biodiversity Review
130
Contact Organization Outcomes Dylan Todd SNH Provided MESH layers. Predominantly based on survey data available from JNCC Marine Recorder Snapshot. Paul Robinson JNCC Provided public access to JNCC database, including MNCR surveys. Colin Speedie Basking shark expert Provided effort based basking shark survey data associated mammal sightings. Data not available in time for
analysis. He noted that the drop-off in the outer Firth of Clyde represents an important feeding area for basking sharks.
Lissa Goodwin University of Plymouth Agreed to provide effort based Harbour porpoise survey. Data not available in time for analysis. Steven Mason NTS Scotland (Arran) Agreed to undertake search of species list undertaken – Species list not in time for analysis. Tom Pearson Millport (now retired) No response. Tim Dunn JNCC Aberdeen Provided link to Cetacean Atlas Data Douglas Hoad Clydeport No response. Howard Wood COAST Sent list of COAST surveys. Much of COAST data in from of SEASEARCH surveys which are included in JNCC
snapshot and received from MCS. He also identified a number of areas including the Otter Ferry area in Loch Fyne important for flame shells and maerl, Pladda, especially reef 300m south of Island) as important for it’s biodiversity it has tide-swept reefs with little fishing impact from dredging. He also identified only occurrence of Corynactis viridis he knows of in the Clyde and many hydroids and anemones present. Sanda Island as being important due to the tide-swept reefs featuring a huge variety of anemones hydroids, sponges and fish such as wrasse. Lamlash Bay was highlighted as being important for species and communities having large areas of maerl to the north of the bay and a seagrass bed. Other areas of seagrass, maerl and rocky reef around Arran were identified (See Figure 15/16 for full list). Bennan head was also noted as an important fish spawning ground.
Peter Hayward University of Swansea No response after initial email and telephone conversations. Has some student field course data from Cumbrae area.
Tony Wass ASW Fishing Charters Identified the area from Cumbrae to Loch Long and Ballantrae Banks as being an important area for juvenile fish and for spawning however he noted that many spawning areas disturbed by fishing. Indicated that the first mile from shore around the whole Clyde is particularly important for juvenile fish. The following areas were also considered to be important areas for recreational angling; Banks of Largs and Fairlie , Entrance to Loch Ryan, Ballantrae beach, Greenock Esplanade, Holy Isle, Pladda, Sanda, the wrecks of Longwy and Ailsa Craig.
John Liddiard Freelance Underwater Photographer and Diving Journalist
Identified the wrecks of the Akka, Wallachia and Europa and also Ailsa Craig as important recreational dive sites.
Owen Paisley Seasearch Coordinator Upper Loch Fyne important for Pachycerianthus. Inchmarnock (West of Bute) important for Maerl and Flame shell beds. Otter spit important for Maerl beds.
Various Recreational dive operators Identified the following areas as being important for recreational diving; Gantock Rocks, Little Cumbrae, Wemyss Bay, Loch Goil and the head of Loch Long, in addition to the wrecks of the Akka, Greenock, Wallachia, Beale, Kintyre, Europa, Champion, Iona, Curassier and Lady Isabella.
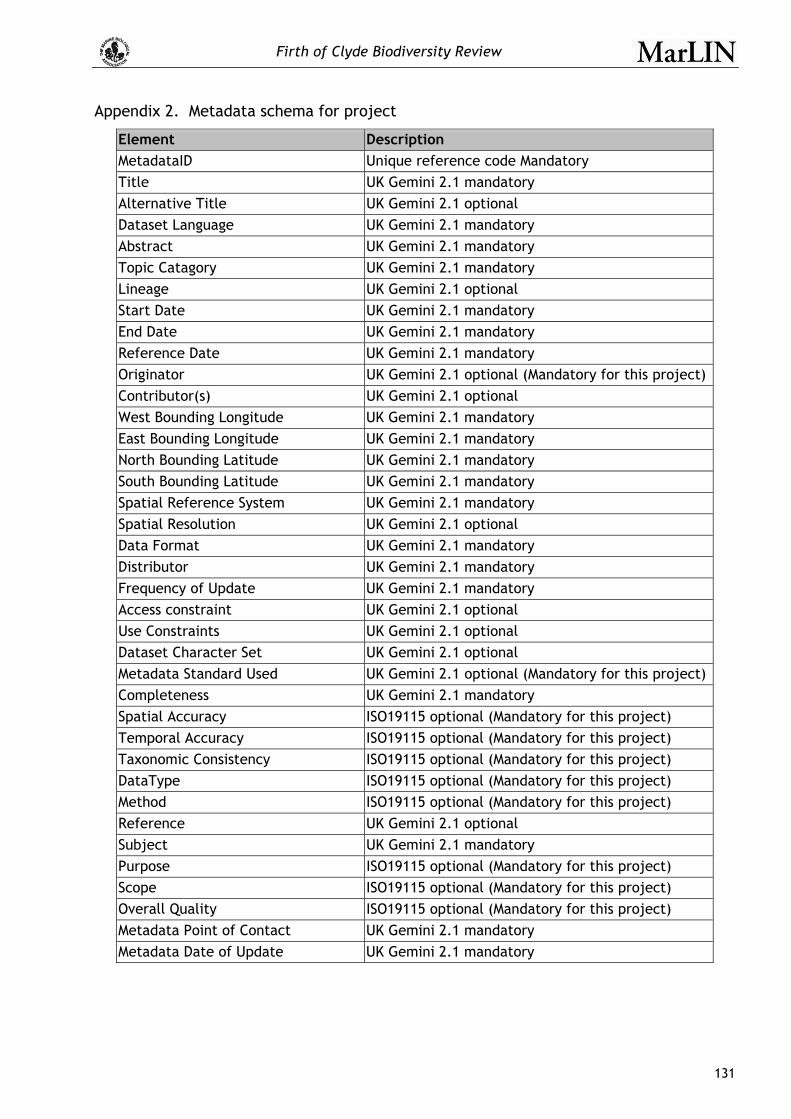
Firth of Clyde Biodiversity Review
131
Appendix 2. Metadata schema for project
Element Description MetadataID Unique reference code Mandatory Title UK Gemini 2.1 mandatory Alternative Title UK Gemini 2.1 optional Dataset Language UK Gemini 2.1 mandatory Abstract UK Gemini 2.1 mandatory Topic Catagory UK Gemini 2.1 mandatory Lineage UK Gemini 2.1 optional Start Date UK Gemini 2.1 mandatory End Date UK Gemini 2.1 mandatory Reference Date UK Gemini 2.1 mandatory Originator UK Gemini 2.1 optional (Mandatory for this project) Contributor(s) UK Gemini 2.1 optional West Bounding Longitude UK Gemini 2.1 mandatory East Bounding Longitude UK Gemini 2.1 mandatory North Bounding Latitude UK Gemini 2.1 mandatory South Bounding Latitude UK Gemini 2.1 mandatory Spatial Reference System UK Gemini 2.1 mandatory Spatial Resolution UK Gemini 2.1 optional Data Format UK Gemini 2.1 mandatory Distributor UK Gemini 2.1 mandatory Frequency of Update UK Gemini 2.1 mandatory Access constraint UK Gemini 2.1 optional Use Constraints UK Gemini 2.1 optional Dataset Character Set UK Gemini 2.1 optional Metadata Standard Used UK Gemini 2.1 optional (Mandatory for this project) Completeness UK Gemini 2.1 mandatory Spatial Accuracy ISO19115 optional (Mandatory for this project) Temporal Accuracy ISO19115 optional (Mandatory for this project) Taxonomic Consistency ISO19115 optional (Mandatory for this project) DataType ISO19115 optional (Mandatory for this project) Method ISO19115 optional (Mandatory for this project) Reference UK Gemini 2.1 optional Subject UK Gemini 2.1 mandatory Purpose ISO19115 optional (Mandatory for this project) Scope ISO19115 optional (Mandatory for this project) Overall Quality ISO19115 optional (Mandatory for this project) Metadata Point of Contact UK Gemini 2.1 mandatory Metadata Date of Update UK Gemini 2.1 mandatory

Firth of Clyde Biodiversity Review
132
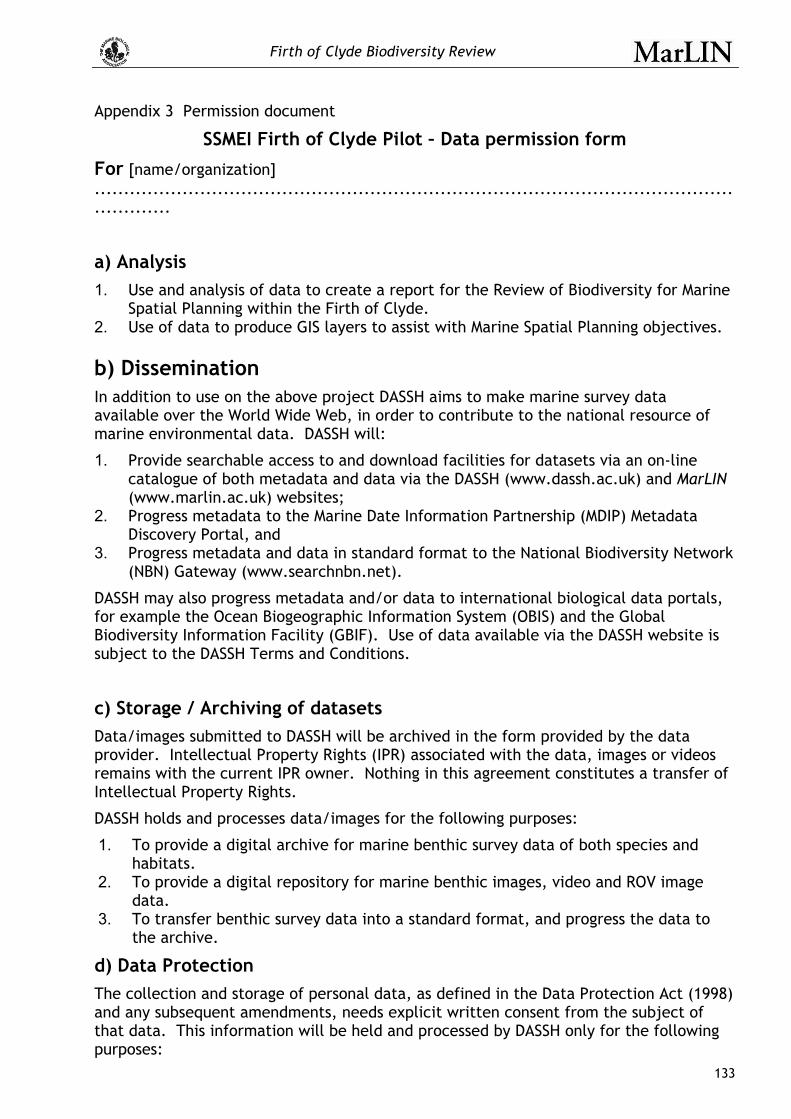
Firth of Clyde Biodiversity Review
133
Appendix 3 Permission document
SSMEI Firth of Clyde Pilot – Data permission form
For [name/organization] ..........................................................................................................................
a) Analysis 1. Use and analysis of data to create a report for the Review of Biodiversity for Marine
Spatial Planning within the Firth of Clyde. 2. Use of data to produce GIS layers to assist with Marine Spatial Planning objectives.
b) Dissemination In addition to use on the above project DASSH aims to make marine survey data available over the World Wide Web, in order to contribute to the national resource of marine environmental data. DASSH will:
1. Provide searchable access to and download facilities for datasets via an on-line catalogue of both metadata and data via the DASSH (www.dassh.ac.uk) and MarLIN (www.marlin.ac.uk) websites;
2. Progress metadata to the Marine Date Information Partnership (MDIP) Metadata Discovery Portal, and
3. Progress metadata and data in standard format to the National Biodiversity Network (NBN) Gateway (www.searchnbn.net).
DASSH may also progress metadata and/or data to international biological data portals, for example the Ocean Biogeographic Information System (OBIS) and the Global Biodiversity Information Facility (GBIF). Use of data available via the DASSH website is subject to the DASSH Terms and Conditions.
c) Storage / Archiving of datasets Data/images submitted to DASSH will be archived in the form provided by the data provider. Intellectual Property Rights (IPR) associated with the data, images or videos remains with the current IPR owner. Nothing in this agreement constitutes a transfer of Intellectual Property Rights.
DASSH holds and processes data/images for the following purposes:
1. To provide a digital archive for marine benthic survey data of both species and habitats.
2. To provide a digital repository for marine benthic images, video and ROV image data.
3. To transfer benthic survey data into a standard format, and progress the data to the archive.
d) Data Protection The collection and storage of personal data, as defined in the Data Protection Act (1998) and any subsequent amendments, needs explicit written consent from the subject of that data. This information will be held and processed by DASSH only for the following purposes:

Firth of Clyde Biodiversity Review
134
1. To maintain the contact details of data providers, owners of intellectual property rights and original recorders of records & where appropriate display their name(s) on the DASSH, MarLIN, MDIP and NBN websites for copyright purposes.
2. To comply with international metadata standards for the collection of data. Agreement
a) I confirm that I consent (on behalf of myself / my organization) to the use of data in the Review of Biodiversity for Marine Spatial Planning within the Firth of Clyde.
b) I confirm that I consent (on behalf of myself / my organization) to the storage and display of the data specified in the Appendix (overleaf) for the purposes set out in the statements above.
Please check applicable statement
Metadata only archived
Metadata and data archived in DASSH
Metadata and data archived by DASSH and disseminated on the DASSH website
Metadata and data archived by DASSH, disseminated on the DASSH website and sent to the National Biodiversity Network
c) I agree to DASSH recording and processing the information about myself / my organization.
I understand that this information will be used only for the purposes set out in the statement above and my consent is conditional upon the DASSH complying with its duties and obligations under the Data Protection Act.
Name [please print]…………………………………………………………… …….
Signature……………………………………………….Date…………………………
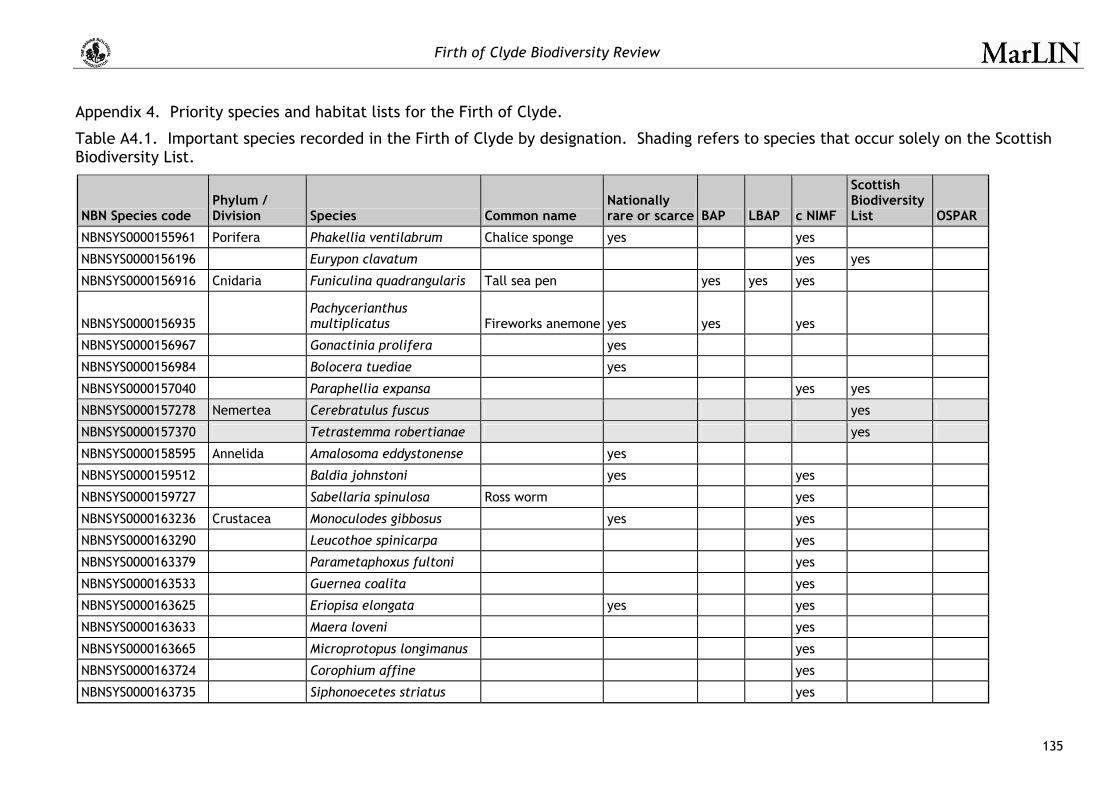
Firth of Clyde Biodiversity Review
135
Appendix 4. Priority species and habitat lists for the Firth of Clyde.
Table A4.1. Important species recorded in the Firth of Clyde by designation. Shading refers to species that occur solely on the Scottish Biodiversity List.
NBN Species code Phylum / Division Species Common name
Nationally rare or scarce BAP LBAP c NIMF
Scottish Biodiversity List OSPAR
NBNSYS0000155961 Porifera Phakellia ventilabrum Chalice sponge yes yes
NBNSYS0000156196 Eurypon clavatum yes yes
NBNSYS0000156916 Cnidaria Funiculina quadrangularis Tall sea pen yes yes yes
NBNSYS0000156935 Pachycerianthus multiplicatus Fireworks anemone yes yes yes
NBNSYS0000156967 Gonactinia prolifera yes
NBNSYS0000156984 Bolocera tuediae yes
NBNSYS0000157040 Paraphellia expansa yes yes
NBNSYS0000157278 Nemertea Cerebratulus fuscus yes
NBNSYS0000157370 Tetrastemma robertianae yes
NBNSYS0000158595 Annelida Amalosoma eddystonense yes
NBNSYS0000159512 Baldia johnstoni yes yes
NBNSYS0000159727 Sabellaria spinulosa Ross worm yes
NBNSYS0000163236 Crustacea Monoculodes gibbosus yes yes
NBNSYS0000163290 Leucothoe spinicarpa yes
NBNSYS0000163379 Parametaphoxus fultoni yes
NBNSYS0000163533 Guernea coalita yes
NBNSYS0000163625 Eriopisa elongata yes yes
NBNSYS0000163633 Maera loveni yes
NBNSYS0000163665 Microprotopus longimanus yes
NBNSYS0000163724 Corophium affine yes
NBNSYS0000163735 Siphonoecetes striatus yes

Firth of Clyde Biodiversity Review
136
NBN Species code Phylum / Division Species Common name
Nationally rare or scarce BAP LBAP c NIMF
Scottish Biodiversity List OSPAR
NBNSYS0000163769 Parvipalpus capillaceus yes
NBNSYS0000164551 Palinurus elephas Crayfish, Crawfish or Spiny lobster yes yes
NBNSYS0000165627 Mollusca Liostomia clavula yes
NBNSYS0000166224 Modiolus modiolus Horse mussel yes
NBNSYS0000166254 Atrina fragilis Fan Mussel yes yes yes yes yes
NBNSYS0000166396 Devonia perrieri yes
NBNSYS0000166568 Arctica islandica Icelandic cyprine yes yes
NBNSYS0000166895 Brachiopoda Terebratulina retusa yes
NBNSYS0000167009 Bryozoa Arachnidium fibrosum yes
NBNSYS0000167480 Echinodermata Antedon petasus yes
NBNSYS0000167664 Echinus esculentus Edible sea urchin yes
NBNSYS0000167717 Psolus phantapus yes
NBNSYS0000167733 Cucumaria frondosa yes yes
NBNSYS0000167741 Ocnus planci yes
NBNSYS0000167872 Chordata Diazona violacea Football sea squirt yes
NBNSYS0000167904 Styela gelatinosa Loch Goil sea squirt yes yes yes yes
NBNSYS0000167937 Pyura microcosmus yes
NBNSYS0000168023 Lampetra fluviatilis River lamprey yes
NBNSYS0000168045 Cetorhinus maximus Basking shark yes yes yes
NBNSYS0000168111 Raja batis Common skate yes
NBNSYS0000168150 Anguilla anguilla Common eel yes yes
NBNSYS0000168173 Clupea harengus Herring yes yes yes
NBNSYS0000168189 Salmo salar Atlantic salmon yes yes
NBNSYS0000168193 Osmerus eperlanus yes
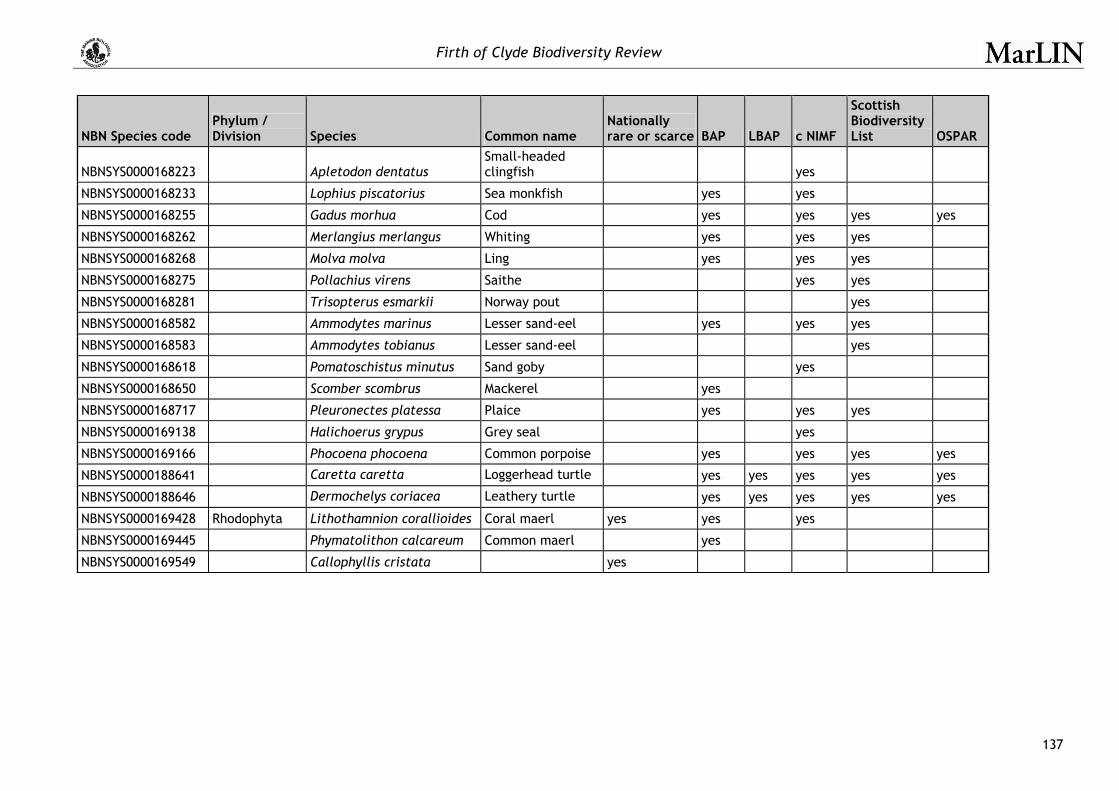
Firth of Clyde Biodiversity Review
137
NBN Species code Phylum / Division Species Common name
Nationally rare or scarce BAP LBAP c NIMF
Scottish Biodiversity List OSPAR
NBNSYS0000168223 Apletodon dentatus Small-headed clingfish yes
NBNSYS0000168233 Lophius piscatorius Sea monkfish yes yes
NBNSYS0000168255 Gadus morhua Cod yes yes yes yes
NBNSYS0000168262 Merlangius merlangus Whiting yes yes yes
NBNSYS0000168268 Molva molva Ling yes yes yes
NBNSYS0000168275 Pollachius virens Saithe yes yes
NBNSYS0000168281 Trisopterus esmarkii Norway pout yes
NBNSYS0000168582 Ammodytes marinus Lesser sand-eel yes yes yes
NBNSYS0000168583 Ammodytes tobianus Lesser sand-eel yes
NBNSYS0000168618 Pomatoschistus minutus Sand goby yes
NBNSYS0000168650 Scomber scombrus Mackerel yes
NBNSYS0000168717 Pleuronectes platessa Plaice yes yes yes
NBNSYS0000169138 Halichoerus grypus Grey seal yes
NBNSYS0000169166 Phocoena phocoena Common porpoise yes yes yes yes
NBNSYS0000188641 Caretta caretta Loggerhead turtle yes yes yes yes yes
NBNSYS0000188646 Dermochelys coriacea Leathery turtle yes yes yes yes yes
NBNSYS0000169428 Rhodophyta Lithothamnion corallioides Coral maerl yes yes yes
NBNSYS0000169445 Phymatolithon calcareum Common maerl yes
NBNSYS0000169549 Callophyllis cristata yes
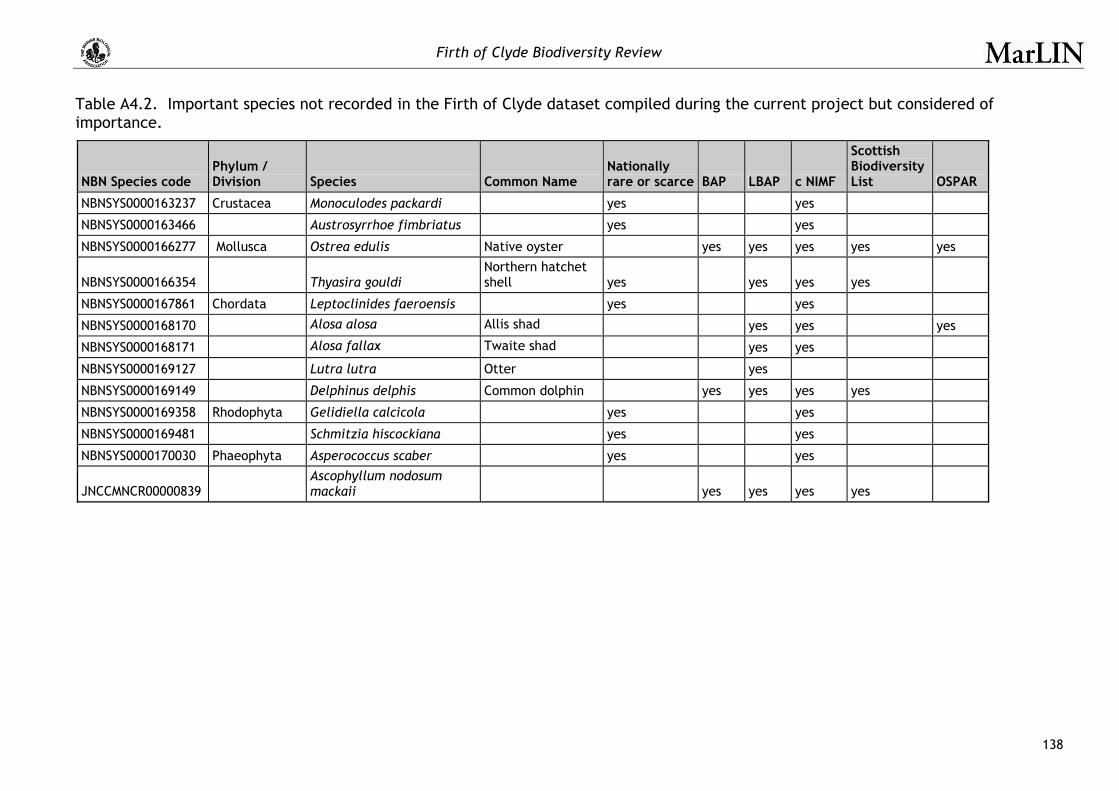
Firth of Clyde Biodiversity Review
138
Table A4.2. Important species not recorded in the Firth of Clyde dataset compiled during the current project but considered of importance.
NBN Species code Phylum / Division Species Common Name
Nationally rare or scarce BAP LBAP c NIMF
Scottish Biodiversity List OSPAR
NBNSYS0000163237 Crustacea Monoculodes packardi yes yes
NBNSYS0000163466 Austrosyrrhoe fimbriatus yes yes
NBNSYS0000166277 Mollusca Ostrea edulis Native oyster yes yes yes yes yes
NBNSYS0000166354 Thyasira gouldi Northern hatchet shell yes yes yes yes
NBNSYS0000167861 Chordata Leptoclinides faeroensis yes yes
NBNSYS0000168170 Alosa alosa Allis shad yes yes yes
NBNSYS0000168171 Alosa fallax Twaite shad yes yes
NBNSYS0000169127 Lutra lutra Otter yes
NBNSYS0000169149 Delphinus delphis Common dolphin yes yes yes yes
NBNSYS0000169358 Rhodophyta Gelidiella calcicola yes yes
NBNSYS0000169481 Schmitzia hiscockiana yes yes
NBNSYS0000170030 Phaeophyta Asperococcus scaber yes yes
JNCCMNCR00000839 Ascophyllum nodosum mackaii yes yes yes yes

Firth of Clyde Biodiversity Review
139
Table A4.3. Important biotopes recorded in the Firth of Clyde by designation. EUNIS level 1-3 habitats have been excluded from the list.
EUNIS Code Biotope Code Annex I BAP LBAP candidate NIMF Scottish Biodiversity List
OSPAR
A1.1 High Energy Littoral Rock
LR.HLR
A1.11 LR.HLR.MusB Reefs Mussel and/or barnacle communities
A1.12 Reefs
A1.2 Moderate Energy Littoral Rock
LR.MLR
A1.21 Reefs Intertidal boulder communities
Fucus serratus and under-boulder fauna on exposed to moderately exposed lower eulittoral boulders AND Underboulder communities
A1.22 LR.MLR.MusF.MytFR Reefs
A1.3 Low Energy Littoral Rock
LR.LLR
A1.31 LR.LLR.F Large shallow inlets and bays AND Reefs
Estuarine rocky habitats
Ascophyllum nodosum on very sheltered mid eulittoral rock AND Fucus vesiculosus on variable salinity mid eulittoral boulders & stable mixed substrata AND Ascophyllum nodosum & Fucus vesiculosus on variable salinity mid eulittoral rock AND Fucus ceranoides on reduced salinity eulittoral rock
A1.4 Communities of littoral rockpools
LR.FLR

Firth of Clyde Biodiversity Review
140
EUNIS Code Biotope Code Annex I BAP LBAP candidate NIMF Scottish Biodiversity List
OSPAR
A1.41 LR.FLR.Rkp Reefs Coralline crust-dominated shallow eulittoral rockpools AND Fucoids and kelp in deep eulittoral rockpools AND Seaweeds in sediment-floored eulittoral rockpools
A1.42 LR.FLR.Rkp Reefs
A2.2 Littoral sand and muddy sand
LS.LSa
A2.21 Mudflats and sandflats not covered by seawater at low tide
Mytilus edulis and Fabricia sabella in littoral mixed sediment
A2.22 LS.LSa.MoSa.BarSa Mudflats and sandflats not covered by seawater at low tide
A2.23 LS.LSa.FiSa.Po Mudflats and sandflats not covered by seawater at low tide
A2.24 LS.LSa.MuSa Large shallow inlets and bays AND Mudflats and sandflats not covered by seawater at low tide
Intertidal mudflats
Polychaete / bivalve dominated muddy sand shores
A2.3 Littoral mud LS.LMu
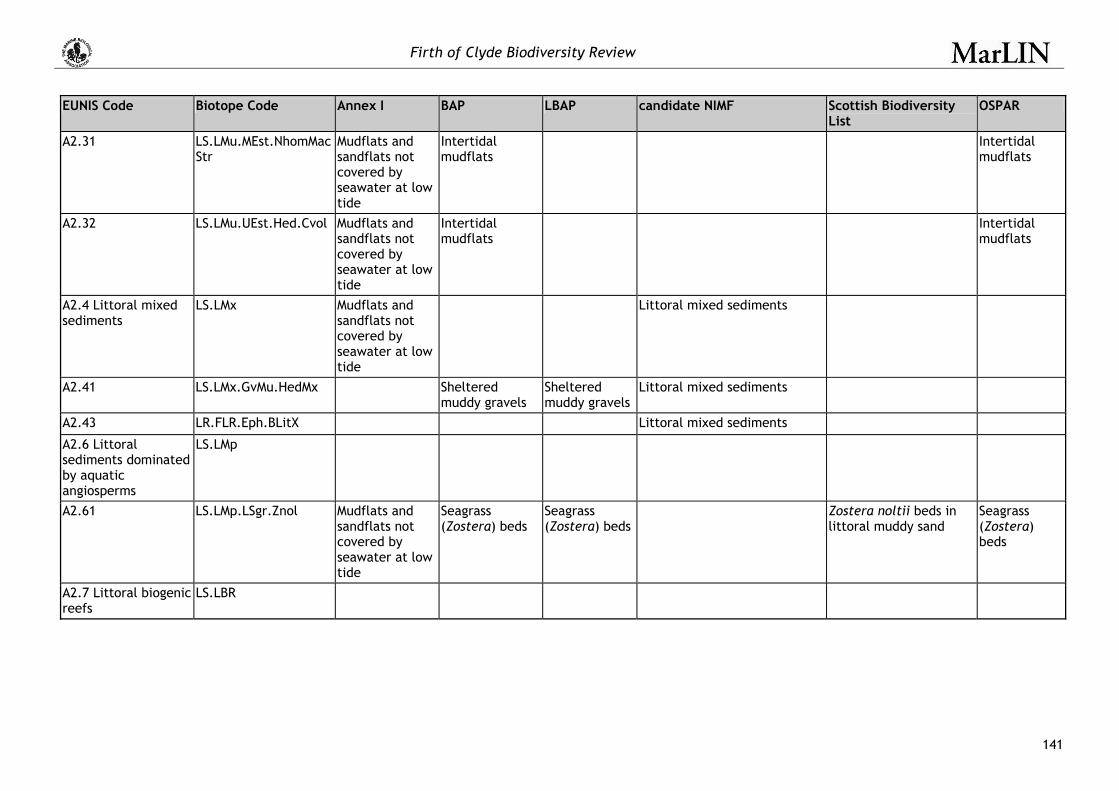
Firth of Clyde Biodiversity Review
141
EUNIS Code Biotope Code Annex I BAP LBAP candidate NIMF Scottish Biodiversity List
OSPAR
A2.31 LS.LMu.MEst.NhomMacStr
Mudflats and sandflats not covered by seawater at low tide
Intertidal mudflats
Intertidal mudflats
A2.32 LS.LMu.UEst.Hed.Cvol Mudflats and sandflats not covered by seawater at low tide
Intertidal mudflats
Intertidal mudflats
A2.4 Littoral mixed sediments
LS.LMx Mudflats and sandflats not covered by seawater at low tide
Littoral mixed sediments
A2.41 LS.LMx.GvMu.HedMx Sheltered muddy gravels
Sheltered muddy gravels
Littoral mixed sediments
A2.43 LR.FLR.Eph.BLitX Littoral mixed sediments
A2.6 Littoral sediments dominated by aquatic angiosperms
LS.LMp
A2.61 LS.LMp.LSgr.Znol Mudflats and sandflats not covered by seawater at low tide
Seagrass (Zostera) beds
Seagrass (Zostera) beds
Zostera noltii beds in littoral muddy sand
Seagrass (Zostera) beds
A2.7 Littoral biogenic reefs
LS.LBR
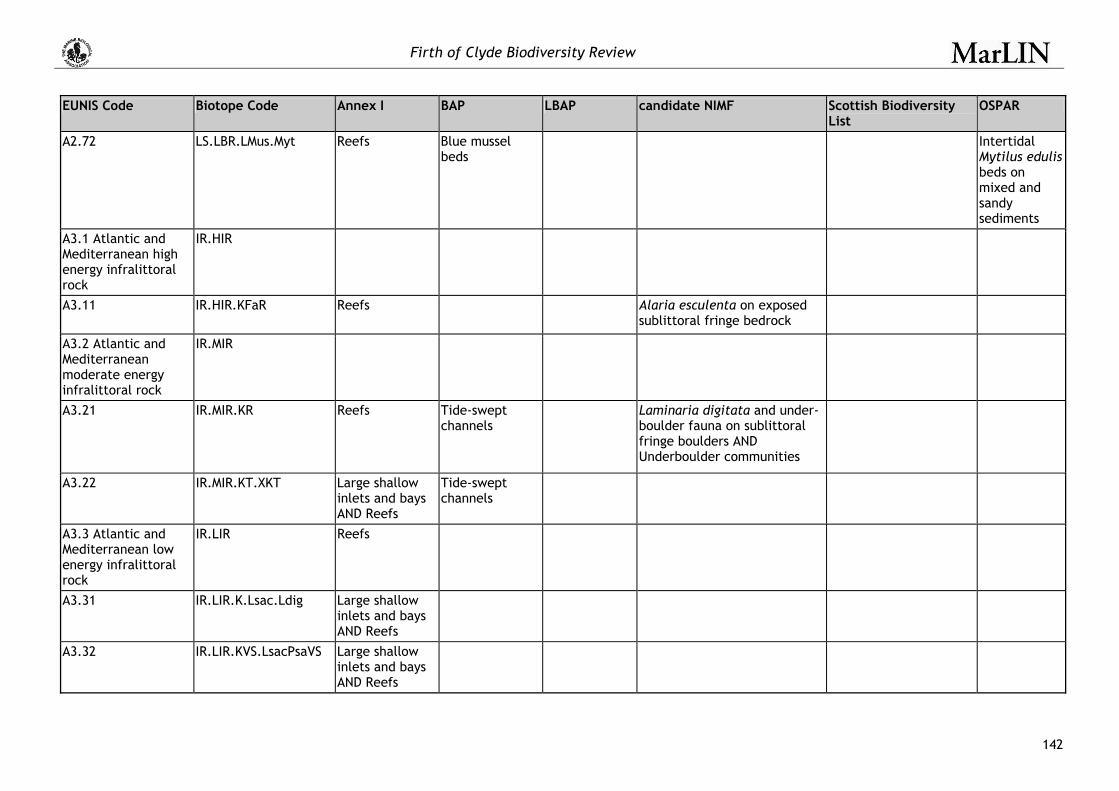
Firth of Clyde Biodiversity Review
142
EUNIS Code Biotope Code Annex I BAP LBAP candidate NIMF Scottish Biodiversity List
OSPAR
A2.72 LS.LBR.LMus.Myt Reefs Blue mussel beds
Intertidal Mytilus edulis beds on mixed and sandy sediments
A3.1 Atlantic and Mediterranean high energy infralittoral rock
IR.HIR
A3.11 IR.HIR.KFaR Reefs Alaria esculenta on exposed sublittoral fringe bedrock
A3.2 Atlantic and Mediterranean moderate energy infralittoral rock
IR.MIR
A3.21 IR.MIR.KR Reefs Tide-swept channels
Laminaria digitata and under-boulder fauna on sublittoral fringe boulders AND Underboulder communities
A3.22 IR.MIR.KT.XKT Large shallow inlets and bays AND Reefs
Tide-swept channels
A3.3 Atlantic and Mediterranean low energy infralittoral rock
IR.LIR Reefs
A3.31 IR.LIR.K.Lsac.Ldig Large shallow inlets and bays AND Reefs
A3.32 IR.LIR.KVS.LsacPsaVS Large shallow inlets and bays AND Reefs

Firth of Clyde Biodiversity Review
143
EUNIS Code Biotope Code Annex I BAP LBAP candidate NIMF Scottish Biodiversity List
OSPAR
A3.34 IR.LIR.Lag.FcerEnt Coastal lagoons AND Reefs
Saline lagoons Saline lagoons
A4.2 Atlantic and Mediterranean moderate energy circalittoral rock
CR.MCR
A4.21 CR.MCR.EcCr Reefs
A4.3 Atlantic and Mediterranean low energy circalittoral rock
CR.LCR
A4.31 CR.LCR.BrAs Reefs Neocrania anomala and Protanthea simplex on very wave-sheltered circalittoral rock AND Neocrania anomala, Dendrodoa grossularia and Sarcodictyon roseum on variable salinity circalittoral rock
A4.7 Features of circalittoral rock
CR.FCR
A4.71 CR.FCR.Cv Reefs
A5.1 Sublittoral coarse sediment
SS.SCS
A5.12 SS.SCS.ICS Sandbanks which are slightly covered by sea water all the time
Subtidal sands and gravels

Firth of Clyde Biodiversity Review
144
EUNIS Code Biotope Code Annex I BAP LBAP candidate NIMF Scottish Biodiversity List
OSPAR
A5.13 SS.SCS.CCS Subtidal sands and gravels
Neopentadactyla mixta in circalittoral shell gravel or coarse sand
A5.2 Sublittoral sand SS.Ssa
A5.23 SS.SSa.IFiSa Sandbanks which are slightly covered by sea water all the time
Subtidal sands and gravels
A5.24 SS.SSa.IMuSa.EcorEns Subtidal sands and gravels
A5.25 SS.SSa.CFiSa Subtidal sands and gravels
A5.3 Sublittoral mud SS.Smu
A5.31 SS.SMu.SMuLS Coastal lagoons Subtidal sands and gravels
Saline lagoons Sublittoral mud in low or reduced salinity (lagoons)
A5.34 SS.SMu.IFiMu.Are Large shallow inlets and bays
Philine aperta and Virgularia mirabilis in soft stable infralittoral mud
A5.36 SS.SMu.CFiMu.SpnMeg Mud habitats in deep water
Mud habitats in deep water
Seapens and burrowing megafauna in circalittoral fine mud AND Burrowing megafauna and Maxmuelleria lankesteri in circalittoral mud AND Brissopsis lyrifera and Amphiura chiajei in circalittoral mud
Sea-pen and burrowing megafauna communities
A5.37 SS.SMu.OMu.StyPse Mud habitats in deep water
Mud habitats in deep water
A5.4 Sublittoral mixed sediments
SS.SMx
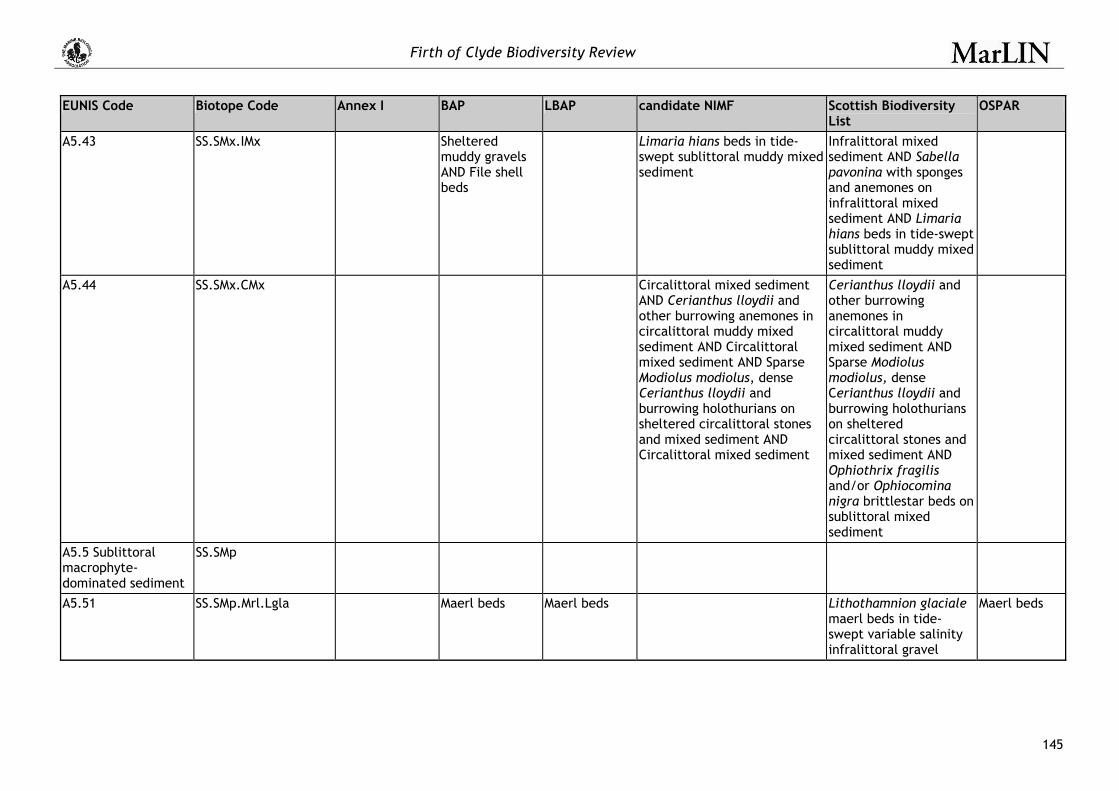
Firth of Clyde Biodiversity Review
145
EUNIS Code Biotope Code Annex I BAP LBAP candidate NIMF Scottish Biodiversity List
OSPAR
A5.43 SS.SMx.IMx Sheltered muddy gravels AND File shell beds
Limaria hians beds in tide-swept sublittoral muddy mixed sediment
Infralittoral mixed sediment AND Sabella pavonina with sponges and anemones on infralittoral mixed sediment AND Limaria hians beds in tide-swept sublittoral muddy mixed sediment
A5.44 SS.SMx.CMx Circalittoral mixed sediment AND Cerianthus lloydii and other burrowing anemones in circalittoral muddy mixed sediment AND Circalittoral mixed sediment AND Sparse Modiolus modiolus, dense Cerianthus lloydii and burrowing holothurians on sheltered circalittoral stones and mixed sediment AND Circalittoral mixed sediment
Cerianthus lloydii and other burrowing anemones in circalittoral muddy mixed sediment AND Sparse Modiolus modiolus, dense Cerianthus lloydii and burrowing holothurians on sheltered circalittoral stones and mixed sediment AND Ophiothrix fragilis and/or Ophiocomina nigra brittlestar beds on sublittoral mixed sediment
A5.5 Sublittoral macrophyte-dominated sediment
SS.SMp
A5.51 SS.SMp.Mrl.Lgla Maerl beds Maerl beds Lithothamnion glaciale maerl beds in tide-swept variable salinity infralittoral gravel
Maerl beds
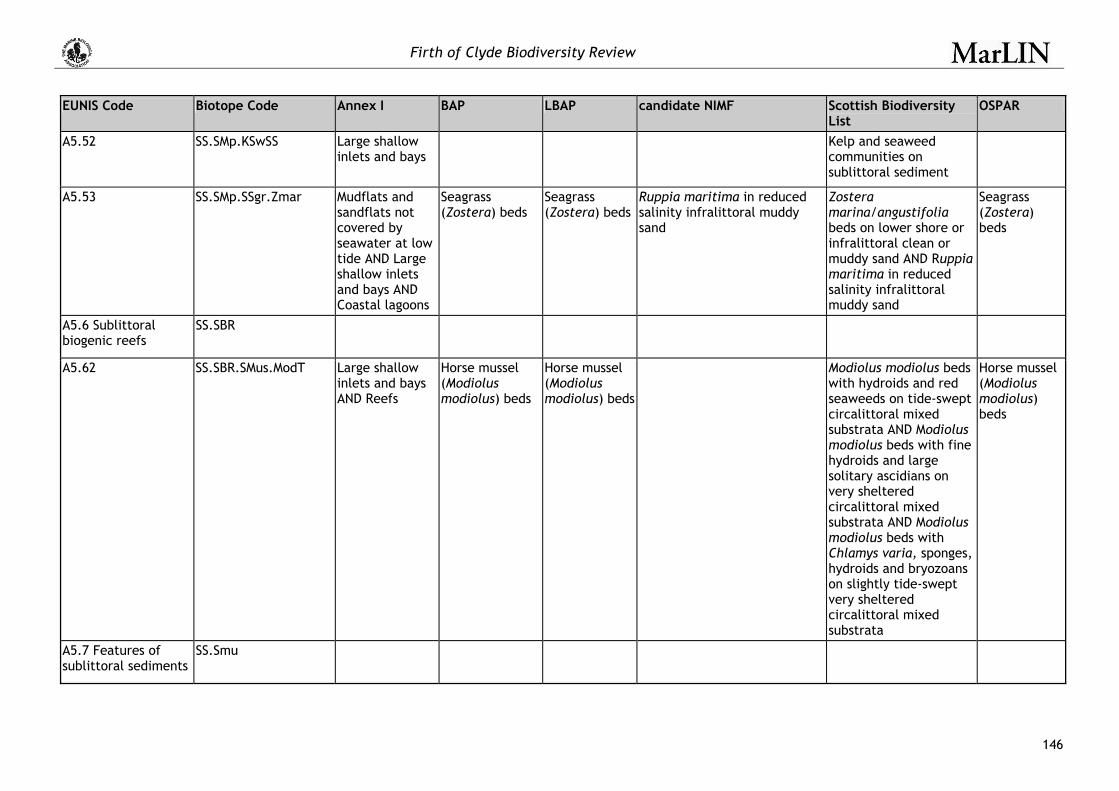
Firth of Clyde Biodiversity Review
146
EUNIS Code Biotope Code Annex I BAP LBAP candidate NIMF Scottish Biodiversity List
OSPAR
A5.52 SS.SMp.KSwSS Large shallow inlets and bays
Kelp and seaweed communities on sublittoral sediment
A5.53 SS.SMp.SSgr.Zmar Mudflats and sandflats not covered by seawater at low tide AND Large shallow inlets and bays AND Coastal lagoons
Seagrass (Zostera) beds
Seagrass (Zostera) beds
Ruppia maritima in reduced salinity infralittoral muddy sand
Zostera marina/angustifolia beds on lower shore or infralittoral clean or muddy sand AND Ruppia maritima in reduced salinity infralittoral muddy sand
Seagrass (Zostera) beds
A5.6 Sublittoral biogenic reefs
SS.SBR
A5.62 SS.SBR.SMus.ModT Large shallow inlets and bays AND Reefs
Horse mussel (Modiolus modiolus) beds
Horse mussel (Modiolus modiolus) beds
Modiolus modiolus beds with hydroids and red seaweeds on tide-swept circalittoral mixed substrata AND Modiolus modiolus beds with fine hydroids and large solitary ascidians on very sheltered circalittoral mixed substrata AND Modiolus modiolus beds with Chlamys varia, sponges, hydroids and bryozoans on slightly tide-swept very sheltered circalittoral mixed substrata
Horse mussel (Modiolus modiolus) beds
A5.7 Features of sublittoral sediments
SS.Smu

Firth of Clyde Biodiversity Review
147
EUNIS Code Biotope Code Annex I BAP LBAP candidate NIMF Scottish Biodiversity List
OSPAR
A5.72 SS.SMu.IFiMu.Beg Mud habitats in deep water
Mud habitats in deep water
Beggiatoa spp. on anoxic sublittoral mud
B3.1 Supralittoral rock (lichen or splash zone)
LR.FLR
B3.11 LR.FLR.Lic Reefs

Firth of Clyde Biodiversity Review
148
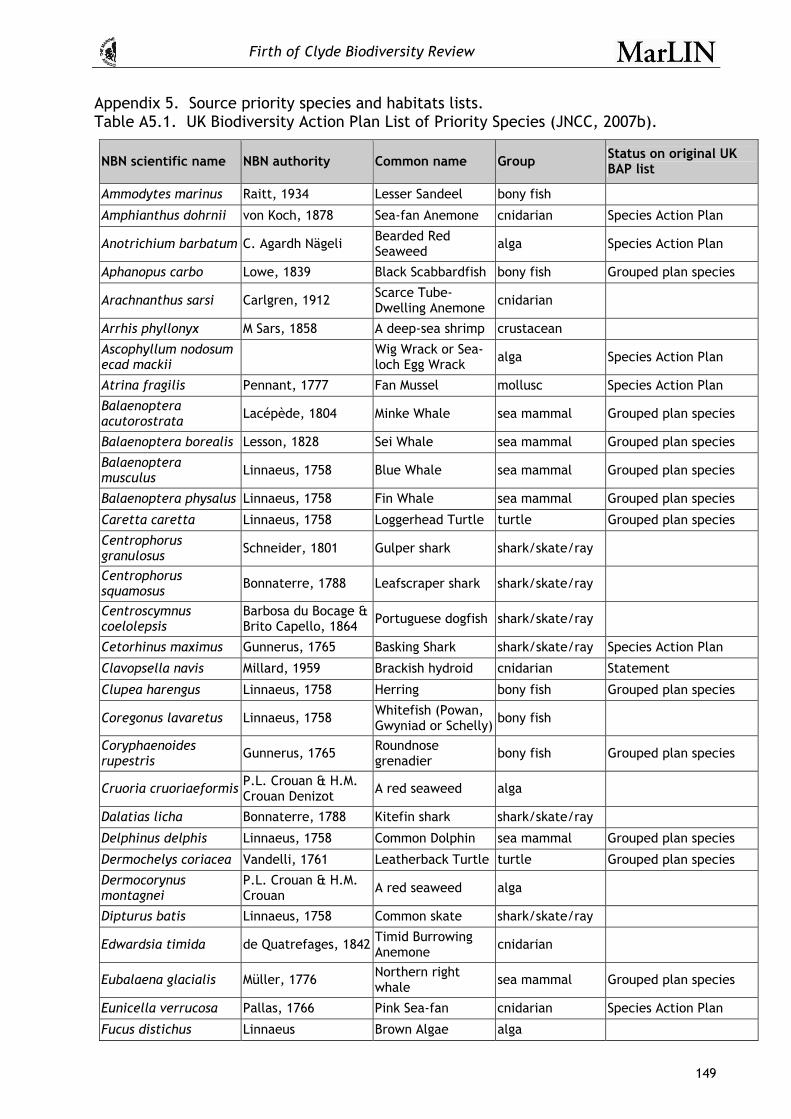
Firth of Clyde Biodiversity Review
149
Appendix 5. Source priority species and habitats lists. Table A5.1. UK Biodiversity Action Plan List of Priority Species (JNCC, 2007b).
NBN scientific name NBN authority Common name Group Status on original UK BAP list
Ammodytes marinus Raitt, 1934 Lesser Sandeel bony fish
Amphianthus dohrnii von Koch, 1878 Sea-fan Anemone cnidarian Species Action Plan
Anotrichium barbatum C. Agardh Nägeli Bearded Red Seaweed alga Species Action Plan
Aphanopus carbo Lowe, 1839 Black Scabbardfish bony fish Grouped plan species
Arachnanthus sarsi Carlgren, 1912 Scarce Tube-Dwelling Anemone cnidarian
Arrhis phyllonyx M Sars, 1858 A deep-sea shrimp crustacean
Ascophyllum nodosum ecad mackii Wig Wrack or Sea-
loch Egg Wrack alga Species Action Plan
Atrina fragilis Pennant, 1777 Fan Mussel mollusc Species Action Plan
Balaenoptera acutorostrata Lacépède, 1804 Minke Whale sea mammal Grouped plan species
Balaenoptera borealis Lesson, 1828 Sei Whale sea mammal Grouped plan species
Balaenoptera musculus Linnaeus, 1758 Blue Whale sea mammal Grouped plan species
Balaenoptera physalus Linnaeus, 1758 Fin Whale sea mammal Grouped plan species
Caretta caretta Linnaeus, 1758 Loggerhead Turtle turtle Grouped plan species
Centrophorus granulosus Schneider, 1801 Gulper shark shark/skate/ray
Centrophorus squamosus Bonnaterre, 1788 Leafscraper shark shark/skate/ray
Centroscymnus coelolepsis
Barbosa du Bocage & Brito Capello, 1864 Portuguese dogfish shark/skate/ray
Cetorhinus maximus Gunnerus, 1765 Basking Shark shark/skate/ray Species Action Plan
Clavopsella navis Millard, 1959 Brackish hydroid cnidarian Statement
Clupea harengus Linnaeus, 1758 Herring bony fish Grouped plan species
Coregonus lavaretus Linnaeus, 1758 Whitefish (Powan, Gwyniad or Schelly) bony fish
Coryphaenoides rupestris Gunnerus, 1765 Roundnose
grenadier bony fish Grouped plan species
Cruoria cruoriaeformis P.L. Crouan & H.M. Crouan Denizot A red seaweed alga
Dalatias licha Bonnaterre, 1788 Kitefin shark shark/skate/ray
Delphinus delphis Linnaeus, 1758 Common Dolphin sea mammal Grouped plan species
Dermochelys coriacea Vandelli, 1761 Leatherback Turtle turtle Grouped plan species
Dermocorynus montagnei
P.L. Crouan & H.M. Crouan A red seaweed alga
Dipturus batis Linnaeus, 1758 Common skate shark/skate/ray
Edwardsia timida de Quatrefages, 1842 Timid Burrowing Anemone cnidarian
Eubalaena glacialis Müller, 1776 Northern right whale sea mammal Grouped plan species
Eunicella verrucosa Pallas, 1766 Pink Sea-fan cnidarian Species Action Plan
Fucus distichus Linnaeus Brown Algae alga
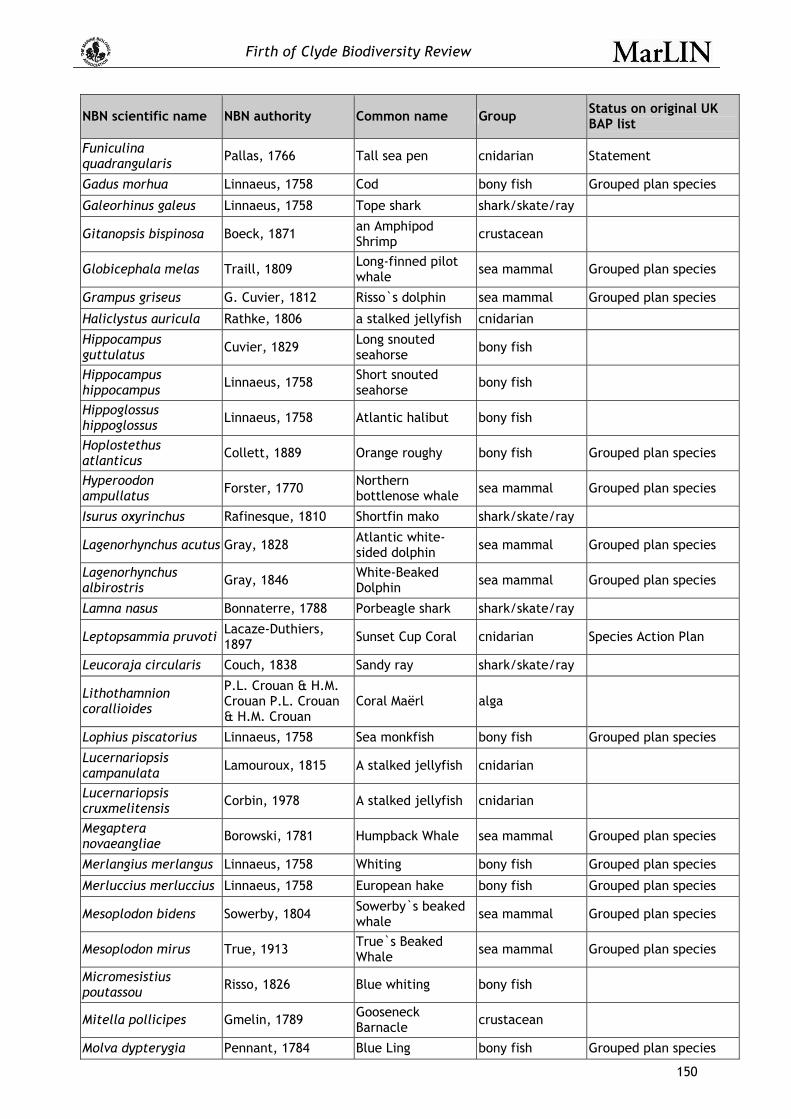
Firth of Clyde Biodiversity Review
150
NBN scientific name NBN authority Common name Group Status on original UK BAP list
Funiculina quadrangularis Pallas, 1766 Tall sea pen cnidarian Statement
Gadus morhua Linnaeus, 1758 Cod bony fish Grouped plan species
Galeorhinus galeus Linnaeus, 1758 Tope shark shark/skate/ray
Gitanopsis bispinosa Boeck, 1871 an Amphipod Shrimp crustacean
Globicephala melas Traill, 1809 Long-finned pilot whale sea mammal Grouped plan species
Grampus griseus G. Cuvier, 1812 Risso`s dolphin sea mammal Grouped plan species
Haliclystus auricula Rathke, 1806 a stalked jellyfish cnidarian
Hippocampus guttulatus Cuvier, 1829 Long snouted
seahorse bony fish
Hippocampus hippocampus Linnaeus, 1758 Short snouted
seahorse bony fish
Hippoglossus hippoglossus Linnaeus, 1758 Atlantic halibut bony fish
Hoplostethus atlanticus Collett, 1889 Orange roughy bony fish Grouped plan species
Hyperoodon ampullatus Forster, 1770 Northern
bottlenose whale sea mammal Grouped plan species
Isurus oxyrinchus Rafinesque, 1810 Shortfin mako shark/skate/ray
Lagenorhynchus acutus Gray, 1828 Atlantic white-sided dolphin sea mammal Grouped plan species
Lagenorhynchus albirostris Gray, 1846 White-Beaked
Dolphin sea mammal Grouped plan species
Lamna nasus Bonnaterre, 1788 Porbeagle shark shark/skate/ray
Leptopsammia pruvoti Lacaze-Duthiers, 1897 Sunset Cup Coral cnidarian Species Action Plan
Leucoraja circularis Couch, 1838 Sandy ray shark/skate/ray
Lithothamnion corallioides
P.L. Crouan & H.M. Crouan P.L. Crouan & H.M. Crouan
Coral Maërl alga
Lophius piscatorius Linnaeus, 1758 Sea monkfish bony fish Grouped plan species
Lucernariopsis campanulata Lamouroux, 1815 A stalked jellyfish cnidarian
Lucernariopsis cruxmelitensis Corbin, 1978 A stalked jellyfish cnidarian
Megaptera novaeangliae Borowski, 1781 Humpback Whale sea mammal Grouped plan species
Merlangius merlangus Linnaeus, 1758 Whiting bony fish Grouped plan species
Merluccius merluccius Linnaeus, 1758 European hake bony fish Grouped plan species
Mesoplodon bidens Sowerby, 1804 Sowerby`s beaked whale sea mammal Grouped plan species
Mesoplodon mirus True, 1913 True`s Beaked Whale sea mammal Grouped plan species
Micromesistius poutassou Risso, 1826 Blue whiting bony fish
Mitella pollicipes Gmelin, 1789 Gooseneck Barnacle crustacean
Molva dypterygia Pennant, 1784 Blue Ling bony fish Grouped plan species

Firth of Clyde Biodiversity Review
151
NBN scientific name NBN authority Common name Group Status on original UK BAP list
Molva molva Linnaeus, 1758 Ling bony fish Grouped plan species
Orcinus orca Linnaeus, 1758 Killer Whale sea mammal Grouped plan species
Ostrea edulis Linnaeus, 1758 Native Oyster mollusc Species Action Plan
Pachycerianthus multiplicatus Carlgren, 1912 Fireworks anemone cnidarian
Padina pavonica Linnaeus Thivy Peacock’s tail alga
Palinurus elephas Fabricius, 1787 Crayfish, Crawfish or Spiny Lobster crustacean
Phoca vitulina Linnaeus, 1758 Eastern Atlantic harbour seal/common seal
sea mammal
Phocoena phocoena Linnaeus, 1758 Harbour Porpoise sea mammal Species Action Plan
Phymatolithon calcareum
Pallas Adey & D.L. McKibbin Common Maërl alga
Physeter macrocephalus Linnaeus, 1758 Sperm Whale sea mammal Grouped plan species
Pleuronectes platessa Linnaeus, 1758 Plaice bony fish Grouped plan species
Prionace glauca Linnaeus, 1758 Blue shark shark/skate/ray
Raja undulata Lacepede, 1802 Undulate ray shark/skate/ray
Reinhardtius hippoglossoides Walbaum, 1792 Greenland halibut bony fish Grouped plan species
Rostroraja alba Lacepède, 1803 White or Bottlenosed skate shark/skate/ray
Scomber scombrus Linnaeus, 1758 Mackerel bony fish Grouped plan species
Solea vulgaris Quensel, 1806 Sole bony fish Grouped plan species
Squalus acanthias Linnaeus, 1758 Spiny dogfish shark/skate/ray
Squatina squatina Linnaeus, 1758 Angel shark shark/skate/ray
Stenella coeruleoalba Meyen, 1833 Striped dolphin sea mammal Grouped plan species
Styela gelatinosa Traustedt, 1886 Loch Goil Sea Squirt tunicate Statement
Swiftia pallida Madsen, 1970 Northern Sea Fan cnidarian
Tenellia adspersa Nordmann, 1844 Lagoon sea slug mollusc Statement
Thunnus thynnus Linnaeus, 1758 Blue-fin tuna bony fish
Trachurus trachurus Linnaeus, 1758 Horse Mackerel bony fish Grouped plan species
Tursiops truncatus Montagu, 1821 Bottlenosed dolphin sea mammal Grouped plan species
Ziphius cavirostris G. Cuvier, 1823 Cuvier`s beaked whale sea mammal Grouped plan species
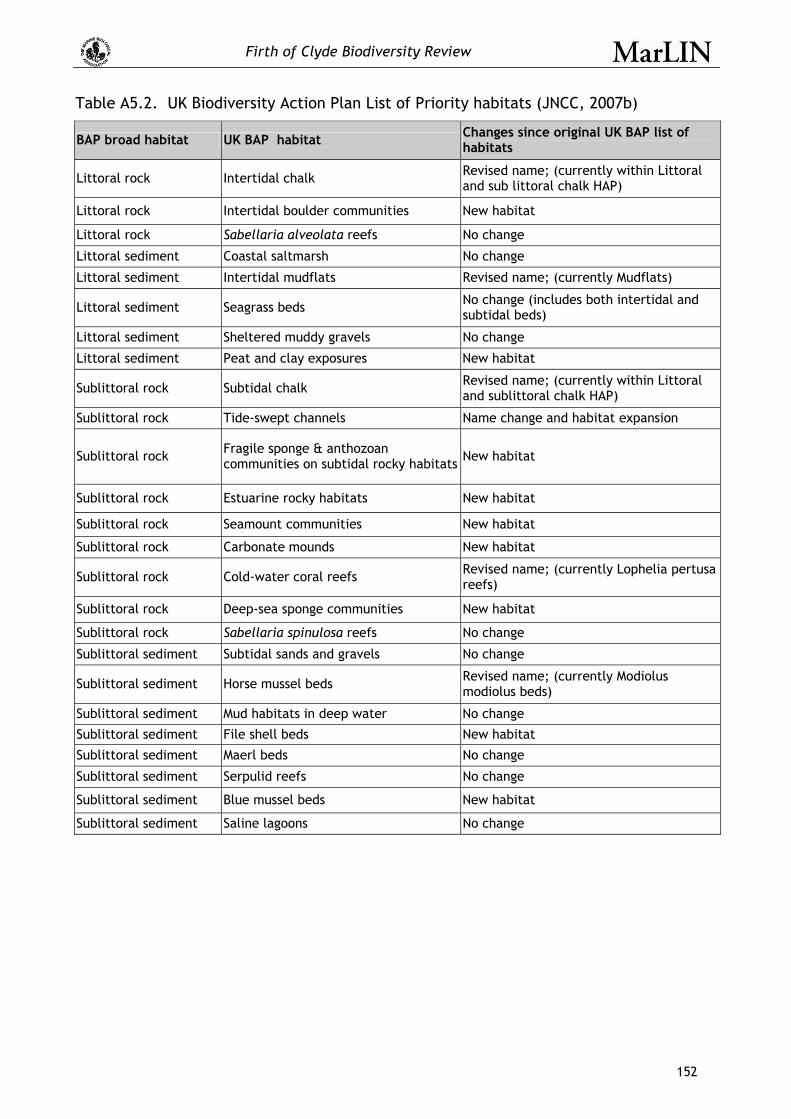
Firth of Clyde Biodiversity Review
152
Table A5.2. UK Biodiversity Action Plan List of Priority habitats (JNCC, 2007b)
BAP broad habitat UK BAP habitat Changes since original UK BAP list of habitats
Littoral rock Intertidal chalk Revised name; (currently within Littoral and sub littoral chalk HAP)
Littoral rock Intertidal boulder communities New habitat
Littoral rock Sabellaria alveolata reefs No change
Littoral sediment Coastal saltmarsh No change
Littoral sediment Intertidal mudflats Revised name; (currently Mudflats)
Littoral sediment Seagrass beds No change (includes both intertidal and subtidal beds)
Littoral sediment Sheltered muddy gravels No change
Littoral sediment Peat and clay exposures New habitat
Sublittoral rock Subtidal chalk Revised name; (currently within Littoral and sublittoral chalk HAP)
Sublittoral rock Tide-swept channels Name change and habitat expansion
Sublittoral rock Fragile sponge & anthozoan communities on subtidal rocky habitats New habitat
Sublittoral rock Estuarine rocky habitats New habitat
Sublittoral rock Seamount communities New habitat
Sublittoral rock Carbonate mounds New habitat
Sublittoral rock Cold-water coral reefs Revised name; (currently Lophelia pertusa reefs)
Sublittoral rock Deep-sea sponge communities New habitat
Sublittoral rock Sabellaria spinulosa reefs No change
Sublittoral sediment Subtidal sands and gravels No change
Sublittoral sediment Horse mussel beds Revised name; (currently Modiolus modiolus beds)
Sublittoral sediment Mud habitats in deep water No change
Sublittoral sediment File shell beds New habitat
Sublittoral sediment Maerl beds No change
Sublittoral sediment Serpulid reefs No change
Sublittoral sediment Blue mussel beds New habitat
Sublittoral sediment Saline lagoons No change

Firth of Clyde Biodiversity Review
153
Table A5.3. Local Biodiversity Action Plan for Argyll and Bute (JNCC, 2007a). Species for which action plans have been prepared
Group Species Fish Allis shad (Alosa alosa)
Fish Twaite shad (Alosa fallax)
Fish Basking shark (Cetorhinus maximus)
Local species Ascophyllum nodosum mackii beds
Local species Atlantic salmon
Local species Turtles
Mammals Common dolphin (Delphinus delphis)
Mammals Grouped plan for baleen whales
Mammals Grouped plan for toothed whales
Mammals Harbour porpoise (Phocoena phocoena)
Molluscs Fan mussel (Atrina fragilis)
Molluscs Native oyster (Ostrea edulis)
Molluscs Northern hatchett shell (Thyasira gouldi)
Sea anemones Tall sea pen (Funiculina quadrangularis)
Sea squirts Sea squirt (Styela gelatinosa)
Table A5.4. Local Biodiversity Action Plan for Argyll and Bute (Source:(JNCC, 2007a)). Habitats for which action plans have been prepared
Group Habitat Priority Habitats Coastal saltmarsh
Priority Habitats Maerl beds
Priority Habitats Modiolus modiolus beds
Priority Habitats Mud habitats in deep water
Priority Habitats Mudflats
Priority Habitats Saline lagoons
Priority Habitats Seagrass beds
Priority Habitats Serpulid reefs
Priority Habitats Sheltered muddy gravels

Firth of Clyde Biodiversity Review
154
Table A5.5. OSPAR Species (OSPAR, 2004).
Scientific Name Common Name OSPAR Regions where the species occur
OSPAR Regions where the species is under threat and/or in decline
Invertebrates Arctica islandica (Linnaeus, 1767) Ocean quahog I, II, III, IV II Megabalanus azorics (Pilsbry, 1916) Azorean barnacle V All where it occurs Nucella lapillus (Linnaeus, 1758) Dog whelk All II, III, IV Ostrea edulis (Linnaeus, 1758) Flat oyster I, II, III, IV II Patella ulyssiponensis aspera (Roding, 1798) Azorean limpet V All where it occurs
Fish Acipenser sturio (Linnaeus, 1758) Atlantic sturgeon II, IV All where it occurs Alosa alosa (Linnaeus, 1758) Allis shad II, III, IV All where it occurs Cetorhinus maximus (Gunnerus, 1763) Basking shark All All where it occurs
Coregonus lavaretus oxyrinchus (Linnaeus, 1758) Houting II All where it occurs
Dipturus batis (Linnaeus, 1758) (synonym: Raja batis) Common skate All All where it occurs
Raja montagui (Fowler, 1910) (synonym: Dipturus montagui) Spotted ray II, III, IV, V All where it occurs
Gadus morhua (Linnaeus, 1758) – populations in the OSPAR regions II and III
Cod All II, III
Hoplostethus atlanticus (Collect, 1889) Orange roughey I, V All where it occurs
Petromyzoan marinus (Linnaeus, 1758) Sea lamprey I, II, III, IV All where it occurs
Salmo salar (Linnaeus, 1758) Salmon I, II, III, IV All where it occurs Thunnus thynnus (Linnaeus, 1758) Bluefin tuna V All where it occurs Caretta caretta (Linnaeus, 1758) Loggerhead turtle IV, V All where it occurs Dermochelys coriacea (Vandelli, 1761) Leatherback turtle All All where it occurs
Mammals Balaena mysticens (Linnaeus, 1758) Bowhead whale I All where it occurs Balaenoptera musculus (Linnaeus, 1758) Blue whale All All where it occurs
Eubalaena glacialis (Muller, 1776) Northern right whale All All where it occurs Phocoena phocoena Harbour porpoise All II, III
Table A5.6. OSPAR Habitats List (OSPAR, 2004).
Description OSPAR Regions where the habitat occur
OSPAR Regions where te habitat is under threat and/or in decline
Carbonate mounds I,V V Deep-sea sponge aggregations I, III, IV, V V Oceanic ridges with hydrothermal vents/fields I, V V
Intertidal mudflats I, II, III, IV All where they occur Littoral chalk communities II All where they occur Lophelia pertusa reefd All All where they occur Ostrea edulis beds II, III, IV All where they occur Seamounts I, IV, V All where they occur Sea-pen and burrowing megafauna communities I, II, III, IV II, III
Zostera beds I, II, III, IV All where they occur
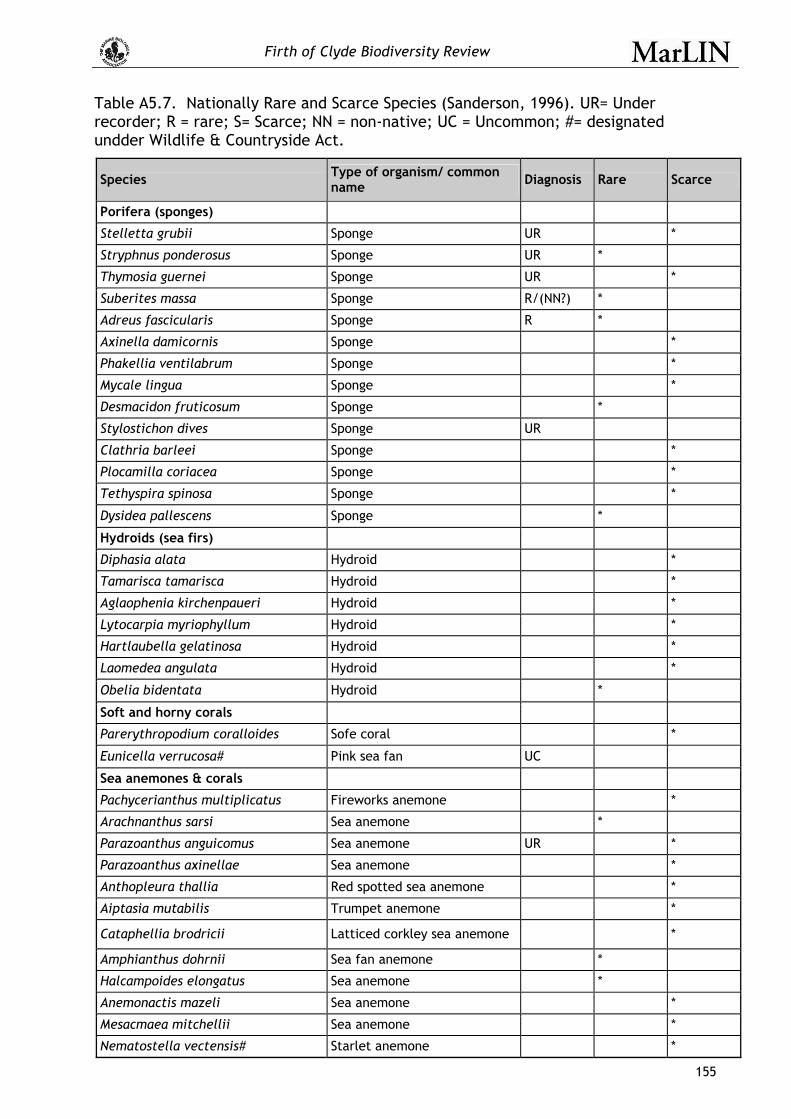
Firth of Clyde Biodiversity Review
155
Table A5.7. Nationally Rare and Scarce Species (Sanderson, 1996). UR= Under recorder; R = rare; S= Scarce; NN = non-native; UC = Uncommon; #= designated undder Wildlife & Countryside Act.
Species Type of organism/ common name Diagnosis Rare Scarce
Porifera (sponges)
Stelletta grubii Sponge UR *
Stryphnus ponderosus Sponge UR *
Thymosia guernei Sponge UR *
Suberites massa Sponge R/(NN?) *
Adreus fascicularis Sponge R *
Axinella damicornis Sponge *
Phakellia ventilabrum Sponge *
Mycale lingua Sponge *
Desmacidon fruticosum Sponge *
Stylostichon dives Sponge UR
Clathria barleei Sponge *
Plocamilla coriacea Sponge *
Tethyspira spinosa Sponge *
Dysidea pallescens Sponge *
Hydroids (sea firs)
Diphasia alata Hydroid *
Tamarisca tamarisca Hydroid *
Aglaophenia kirchenpaueri Hydroid *
Lytocarpia myriophyllum Hydroid *
Hartlaubella gelatinosa Hydroid *
Laomedea angulata Hydroid *
Obelia bidentata Hydroid *
Soft and horny corals
Parerythropodium coralloides Sofe coral *
Eunicella verrucosa# Pink sea fan UC
Sea anemones & corals
Pachycerianthus multiplicatus Fireworks anemone *
Arachnanthus sarsi Sea anemone *
Parazoanthus anguicomus Sea anemone UR *
Parazoanthus axinellae Sea anemone *
Anthopleura thallia Red spotted sea anemone *
Aiptasia mutabilis Trumpet anemone *
Cataphellia brodricii Latticed corkley sea anemone *
Amphianthus dohrnii Sea fan anemone *
Halcampoides elongatus Sea anemone *
Anemonactis mazeli Sea anemone *
Mesacmaea mitchellii Sea anemone *
Nematostella vectensis# Starlet anemone *
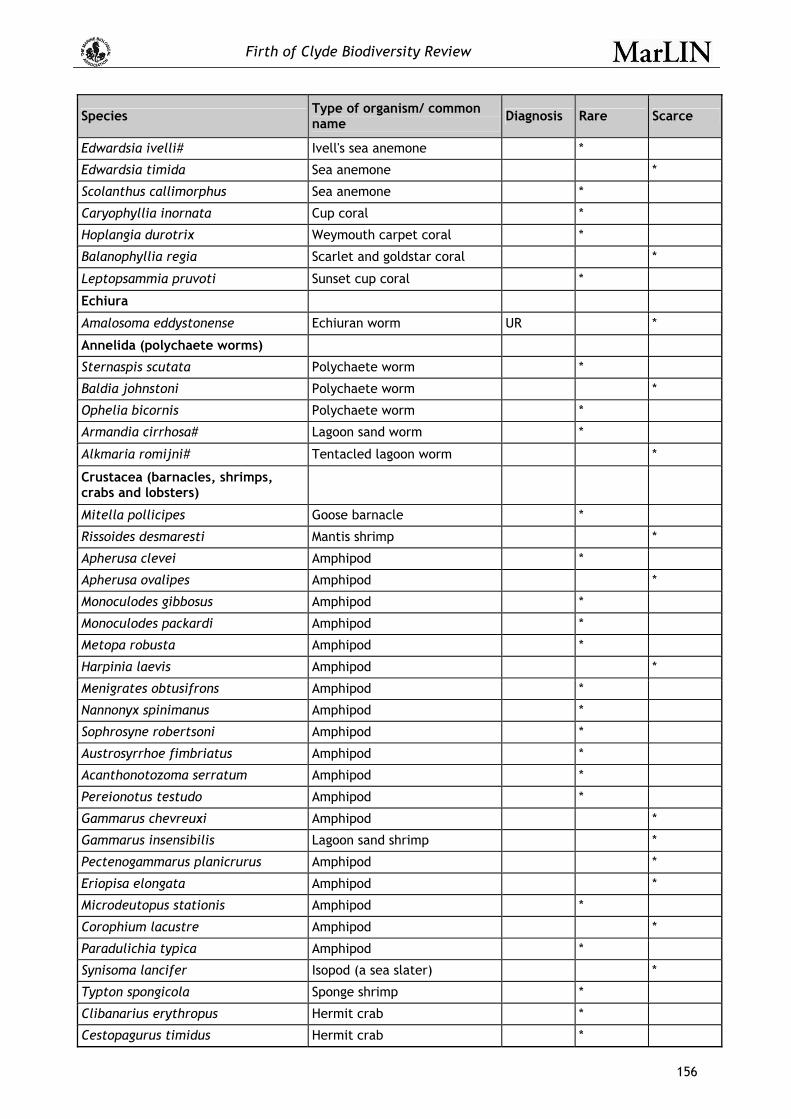
Firth of Clyde Biodiversity Review
156
Species Type of organism/ common name Diagnosis Rare Scarce
Edwardsia ivelli# Ivell's sea anemone *
Edwardsia timida Sea anemone *
Scolanthus callimorphus Sea anemone *
Caryophyllia inornata Cup coral *
Hoplangia durotrix Weymouth carpet coral *
Balanophyllia regia Scarlet and goldstar coral *
Leptopsammia pruvoti Sunset cup coral *
Echiura
Amalosoma eddystonense Echiuran worm UR *
Annelida (polychaete worms)
Sternaspis scutata Polychaete worm *
Baldia johnstoni Polychaete worm *
Ophelia bicornis Polychaete worm *
Armandia cirrhosa# Lagoon sand worm *
Alkmaria romijni# Tentacled lagoon worm *
Crustacea (barnacles, shrimps, crabs and lobsters)
Mitella pollicipes Goose barnacle *
Rissoides desmaresti Mantis shrimp *
Apherusa clevei Amphipod *
Apherusa ovalipes Amphipod *
Monoculodes gibbosus Amphipod *
Monoculodes packardi Amphipod *
Metopa robusta Amphipod *
Harpinia laevis Amphipod *
Menigrates obtusifrons Amphipod *
Nannonyx spinimanus Amphipod *
Sophrosyne robertsoni Amphipod *
Austrosyrrhoe fimbriatus Amphipod *
Acanthonotozoma serratum Amphipod *
Pereionotus testudo Amphipod *
Gammarus chevreuxi Amphipod *
Gammarus insensibilis Lagoon sand shrimp *
Pectenogammarus planicrurus Amphipod *
Eriopisa elongata Amphipod *
Microdeutopus stationis Amphipod *
Corophium lacustre Amphipod *
Paradulichia typica Amphipod *
Synisoma lancifer Isopod (a sea slater) *
Typton spongicola Sponge shrimp *
Clibanarius erythropus Hermit crab *
Cestopagurus timidus Hermit crab *
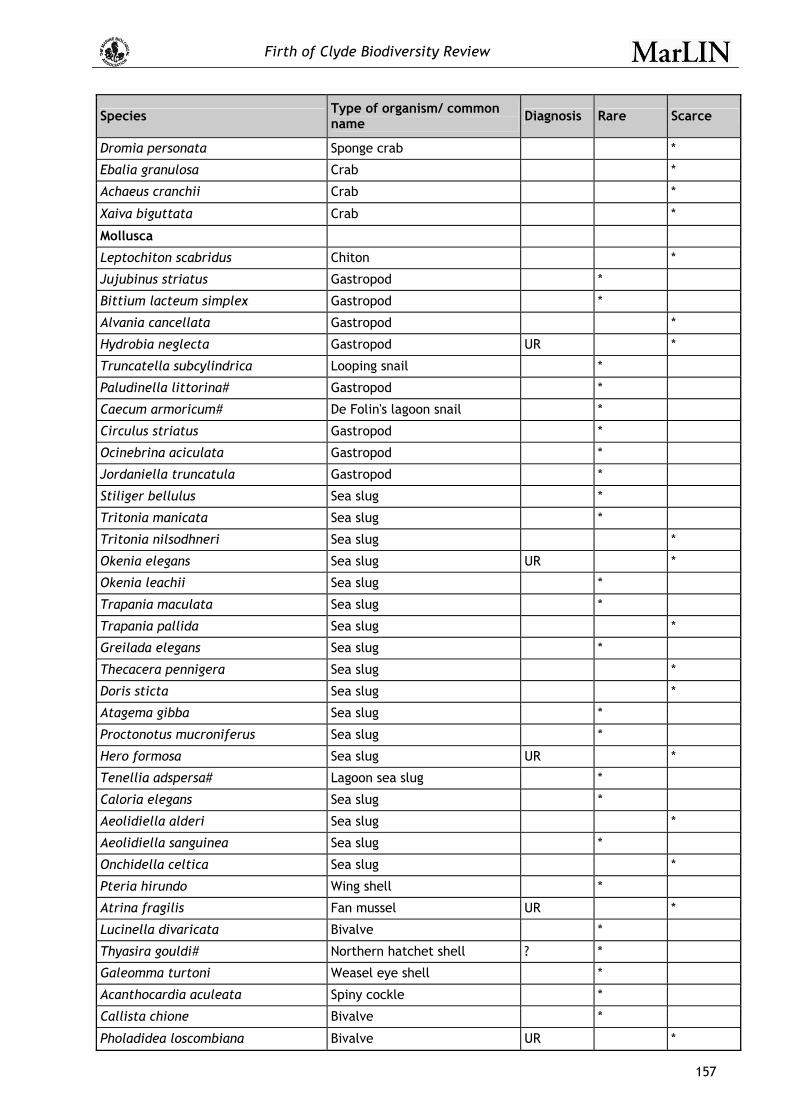
Firth of Clyde Biodiversity Review
157
Species Type of organism/ common name Diagnosis Rare Scarce
Dromia personata Sponge crab *
Ebalia granulosa Crab *
Achaeus cranchii Crab *
Xaiva biguttata Crab *
Mollusca
Leptochiton scabridus Chiton *
Jujubinus striatus Gastropod *
Bittium lacteum simplex Gastropod *
Alvania cancellata Gastropod *
Hydrobia neglecta Gastropod UR *
Truncatella subcylindrica Looping snail *
Paludinella littorina# Gastropod *
Caecum armoricum# De Folin's lagoon snail *
Circulus striatus Gastropod *
Ocinebrina aciculata Gastropod *
Jordaniella truncatula Gastropod *
Stiliger bellulus Sea slug *
Tritonia manicata Sea slug *
Tritonia nilsodhneri Sea slug *
Okenia elegans Sea slug UR *
Okenia leachii Sea slug *
Trapania maculata Sea slug *
Trapania pallida Sea slug *
Greilada elegans Sea slug *
Thecacera pennigera Sea slug *
Doris sticta Sea slug *
Atagema gibba Sea slug *
Proctonotus mucroniferus Sea slug *
Hero formosa Sea slug UR *
Tenellia adspersa# Lagoon sea slug *
Caloria elegans Sea slug *
Aeolidiella alderi Sea slug *
Aeolidiella sanguinea Sea slug *
Onchidella celtica Sea slug *
Pteria hirundo Wing shell *
Atrina fragilis Fan mussel UR *
Lucinella divaricata Bivalve *
Thyasira gouldi# Northern hatchet shell ? *
Galeomma turtoni Weasel eye shell *
Acanthocardia aculeata Spiny cockle *
Callista chione Bivalve *
Pholadidea loscombiana Bivalve UR *
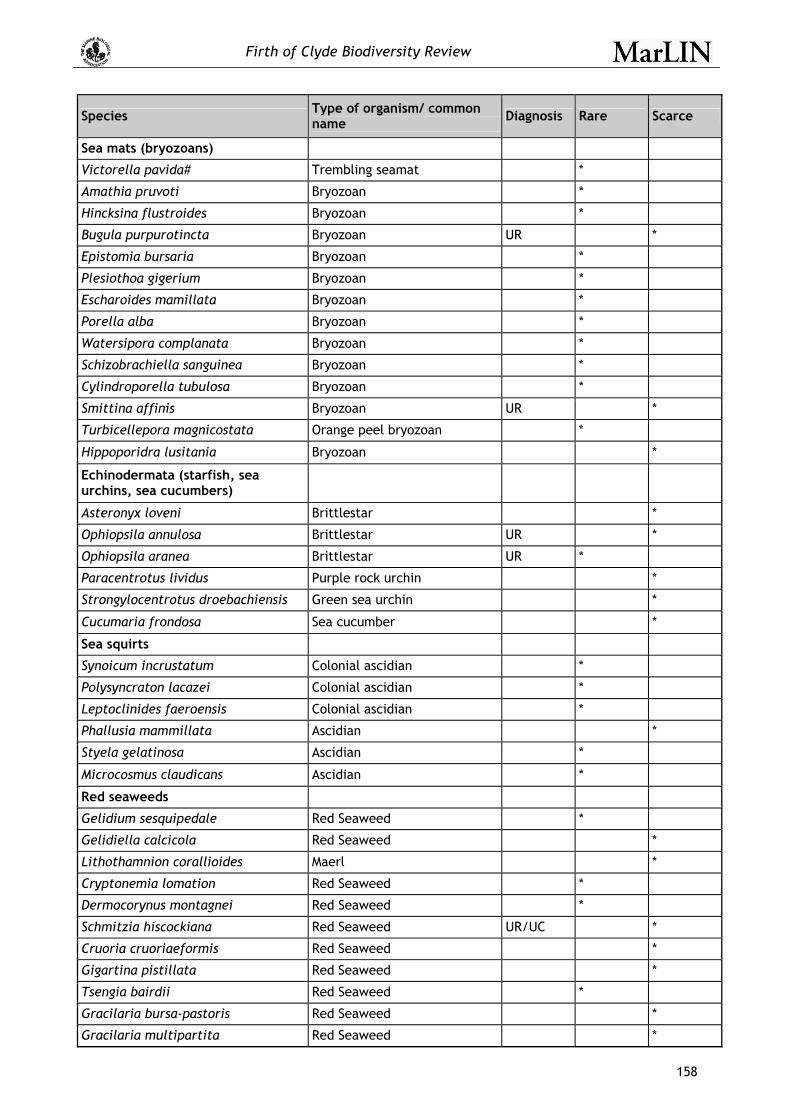
Firth of Clyde Biodiversity Review
158
Species Type of organism/ common name Diagnosis Rare Scarce
Sea mats (bryozoans)
Victorella pavida# Trembling seamat *
Amathia pruvoti Bryozoan *
Hincksina flustroides Bryozoan *
Bugula purpurotincta Bryozoan UR *
Epistomia bursaria Bryozoan *
Plesiothoa gigerium Bryozoan *
Escharoides mamillata Bryozoan *
Porella alba Bryozoan *
Watersipora complanata Bryozoan *
Schizobrachiella sanguinea Bryozoan *
Cylindroporella tubulosa Bryozoan *
Smittina affinis Bryozoan UR *
Turbicellepora magnicostata Orange peel bryozoan *
Hippoporidra lusitania Bryozoan *
Echinodermata (starfish, sea urchins, sea cucumbers)
Asteronyx loveni Brittlestar *
Ophiopsila annulosa Brittlestar UR *
Ophiopsila aranea Brittlestar UR *
Paracentrotus lividus Purple rock urchin *
Strongylocentrotus droebachiensis Green sea urchin *
Cucumaria frondosa Sea cucumber *
Sea squirts
Synoicum incrustatum Colonial ascidian *
Polysyncraton lacazei Colonial ascidian *
Leptoclinides faeroensis Colonial ascidian *
Phallusia mammillata Ascidian *
Styela gelatinosa Ascidian *
Microcosmus claudicans Ascidian *
Red seaweeds
Gelidium sesquipedale Red Seaweed *
Gelidiella calcicola Red Seaweed *
Lithothamnion corallioides Maerl *
Cryptonemia lomation Red Seaweed *
Dermocorynus montagnei Red Seaweed *
Schmitzia hiscockiana Red Seaweed UR/UC *
Cruoria cruoriaeformis Red Seaweed *
Gigartina pistillata Red Seaweed *
Tsengia bairdii Red Seaweed *
Gracilaria bursa-pastoris Red Seaweed *
Gracilaria multipartita Red Seaweed *
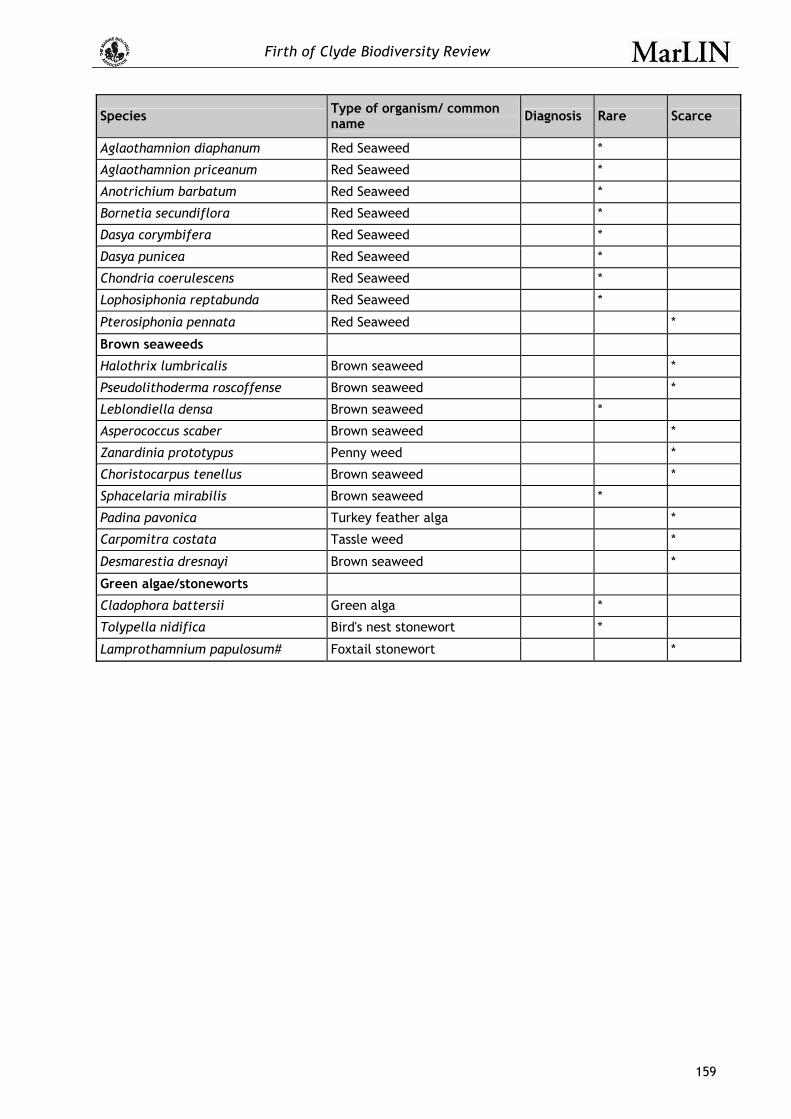
Firth of Clyde Biodiversity Review
159
Species Type of organism/ common name Diagnosis Rare Scarce
Aglaothamnion diaphanum Red Seaweed *
Aglaothamnion priceanum Red Seaweed *
Anotrichium barbatum Red Seaweed *
Bornetia secundiflora Red Seaweed *
Dasya corymbifera Red Seaweed *
Dasya punicea Red Seaweed *
Chondria coerulescens Red Seaweed *
Lophosiphonia reptabunda Red Seaweed *
Pterosiphonia pennata Red Seaweed *
Brown seaweeds
Halothrix lumbricalis Brown seaweed *
Pseudolithoderma roscoffense Brown seaweed *
Leblondiella densa Brown seaweed *
Asperococcus scaber Brown seaweed *
Zanardinia prototypus Penny weed *
Choristocarpus tenellus Brown seaweed *
Sphacelaria mirabilis Brown seaweed *
Padina pavonica Turkey feather alga *
Carpomitra costata Tassle weed *
Desmarestia dresnayi Brown seaweed *
Green algae/stoneworts
Cladophora battersii Green alga *
Tolypella nidifica Bird's nest stonewort *
Lamprothamnium papulosum# Foxtail stonewort *

Firth of Clyde Biodiversity Review
160
Table A5.8. Candidate NIMF Species List (Hiscock & Harris, 2007).
Record Number Scientific name Record
Number Scientific name
1 Adreus fascicularis 52 Aspididelectra melolontha
2 Alkmaria romijni 53 Celleporina decipiens
3 Armandia cirrhosa 54 Celleporina tubulosa
4 Baldia johnstoni 55 Codonellina lacunata
5 Boccardia (sp. undetermined) 56 Epistomia bursaria
6 Sabella flabellata 57 Escharoides mamillata
7 Sabellaria alveolata 58 Haplopoma bimucronatum
8 Sabellaria spinulosa 59 Hippoporidra lusitania
9 Sternaspis scutata 60 Microporella appendiculata
10 Stygocapitella subterranea 61 Palmicallaria elegans
11 Ascophyllum nodosum mackaii 62 Schizobrachiella sanguinea
12 Asperococcus scaber 63 Schizomavella cristata
13 Choristocarpus tenellus 64 Schizomavella hondti
14 Desmarestia dresnayi 65 Schizomavella ochracea
15 Fucus distichus 66 Schizomavella teresae
16 Halothrix lumbricalis 67 Schizoporella cornualis
17 Leblondiella densa 68 Smittina affinis
18 Padina pavonica 69 Smittoidea amplissima
19 Pseudolithoderma roscoffense 70 Turbicellepora magnicostata
20 Sphacelaria mirabilis 71 Watersipora complanata
21 Zanardinia prototypus 72 Amathia pruvoti
22 Cladophora battersii 73 Farrella repens
23 Aglaothamnion diaphanum 74 Mimosella gracilis
24 Aglaothamnion feldmanniae 75 Mimosella verticillata
25 Aglaothamnion priceanum 76 Clibanarius erythropus
26 Anotrichium barbatum 77 Palinurus elephas
27 Apoglossocolax pusilla 78 Mitella (Pollicipes) pollicipes
28 Bornetia secundiflora 79 Allomelita pellucida
29 Chondria coerulescens 80 Amphitholina cuniculus
30 Cruoria cruoriaeformis 81 Arrhis phyllonyx
31 Cryptonemia lomation 82 Austrosyrrhoe fimbriatus
32 Cryptonemia seminervis 83 Byblis gaimardii
33 Dasya corymbifera 84 Cerapus crassicornis
34 Dasya punicea 85 Colomastix pusilla
35 Dermocorynus montagnei 86 Corophium affine
36 Gelidiella calcicola 87 Dulichia tuberculata
37 Gracilaria bursa-pastoris 88 Epimeria tuberculata
38 Laurencia pyramidalis 89 Eriopisa elongata
39 Lithothamnion corallioides 90 Euonyx chelatus
40 Lophosiphonia reptabunda 91 Gammarus chevreuxi
41 Polysiphonia foetidissima 92 Gammarus insensibilis
42 Pterosiphonia pennata 93 Gitanopsis bispinosa
43 Schmitzia hiscockiana 94 Guernea coalita
44 Tsengia bairdii 95 Haploops setosa
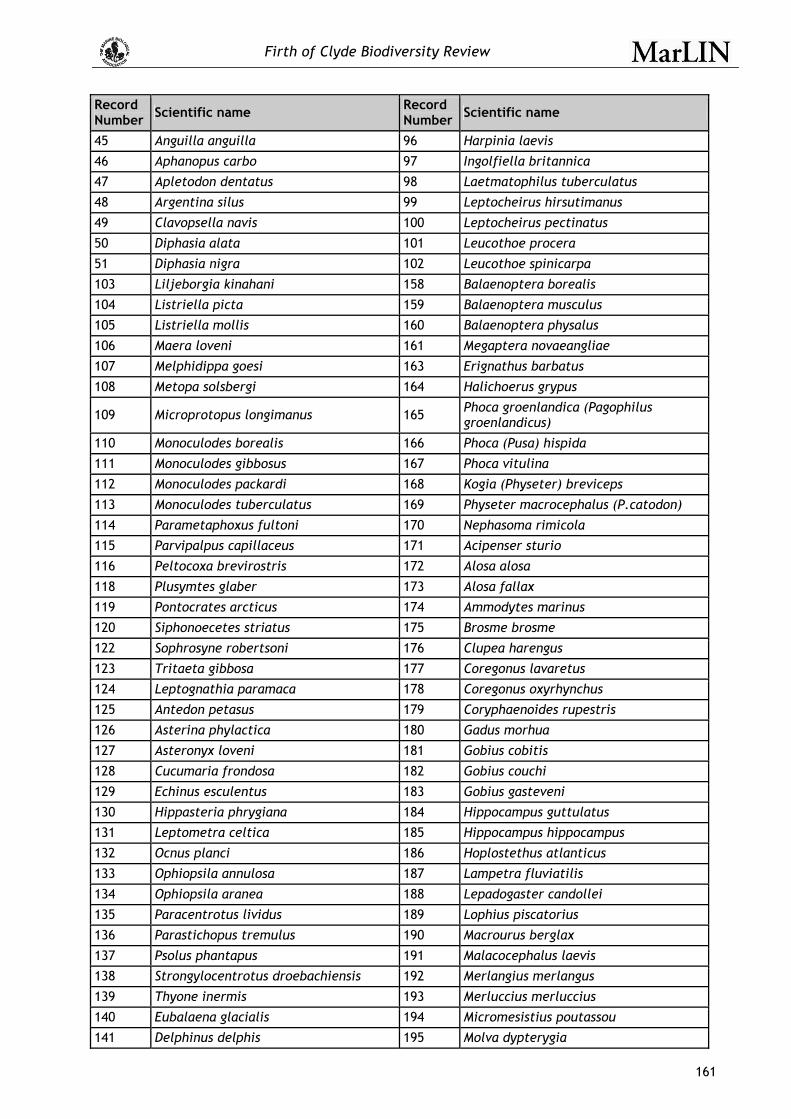
Firth of Clyde Biodiversity Review
161
Record Number Scientific name Record
Number Scientific name
45 Anguilla anguilla 96 Harpinia laevis
46 Aphanopus carbo 97 Ingolfiella britannica
47 Apletodon dentatus 98 Laetmatophilus tuberculatus
48 Argentina silus 99 Leptocheirus hirsutimanus
49 Clavopsella navis 100 Leptocheirus pectinatus
50 Diphasia alata 101 Leucothoe procera
51 Diphasia nigra 102 Leucothoe spinicarpa
103 Liljeborgia kinahani 158 Balaenoptera borealis
104 Listriella picta 159 Balaenoptera musculus
105 Listriella mollis 160 Balaenoptera physalus
106 Maera loveni 161 Megaptera novaeangliae
107 Melphidippa goesi 163 Erignathus barbatus
108 Metopa solsbergi 164 Halichoerus grypus
109 Microprotopus longimanus 165 Phoca groenlandica (Pagophilus groenlandicus)
110 Monoculodes borealis 166 Phoca (Pusa) hispida
111 Monoculodes gibbosus 167 Phoca vitulina
112 Monoculodes packardi 168 Kogia (Physeter) breviceps
113 Monoculodes tuberculatus 169 Physeter macrocephalus (P.catodon)
114 Parametaphoxus fultoni 170 Nephasoma rimicola
115 Parvipalpus capillaceus 171 Acipenser sturio
116 Peltocoxa brevirostris 172 Alosa alosa
118 Plusymtes glaber 173 Alosa fallax
119 Pontocrates arcticus 174 Ammodytes marinus
120 Siphonoecetes striatus 175 Brosme brosme
122 Sophrosyne robertsoni 176 Clupea harengus
123 Tritaeta gibbosa 177 Coregonus lavaretus
124 Leptognathia paramaca 178 Coregonus oxyrhynchus
125 Antedon petasus 179 Coryphaenoides rupestris
126 Asterina phylactica 180 Gadus morhua
127 Asteronyx loveni 181 Gobius cobitis
128 Cucumaria frondosa 182 Gobius couchi
129 Echinus esculentus 183 Gobius gasteveni
130 Hippasteria phrygiana 184 Hippocampus guttulatus
131 Leptometra celtica 185 Hippocampus hippocampus
132 Ocnus planci 186 Hoplostethus atlanticus
133 Ophiopsila annulosa 187 Lampetra fluviatilis
134 Ophiopsila aranea 188 Lepadogaster candollei
135 Paracentrotus lividus 189 Lophius piscatorius
136 Parastichopus tremulus 190 Macrourus berglax
137 Psolus phantapus 191 Malacocephalus laevis
138 Strongylocentrotus droebachiensis 192 Merlangius merlangus
139 Thyone inermis 193 Merluccius merluccius
140 Eubalaena glacialis 194 Micromesistius poutassou
141 Delphinus delphis 195 Molva dypterygia
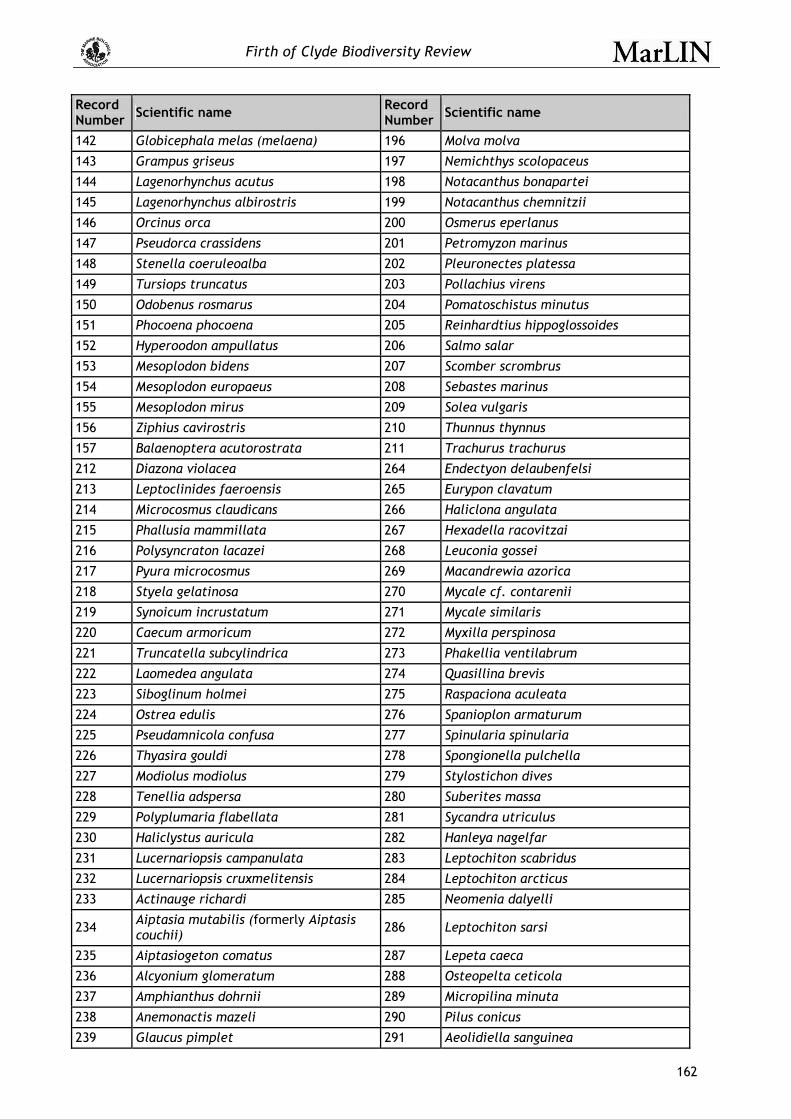
Firth of Clyde Biodiversity Review
162
Record Number Scientific name Record
Number Scientific name
142 Globicephala melas (melaena) 196 Molva molva
143 Grampus griseus 197 Nemichthys scolopaceus
144 Lagenorhynchus acutus 198 Notacanthus bonapartei
145 Lagenorhynchus albirostris 199 Notacanthus chemnitzii
146 Orcinus orca 200 Osmerus eperlanus
147 Pseudorca crassidens 201 Petromyzon marinus
148 Stenella coeruleoalba 202 Pleuronectes platessa
149 Tursiops truncatus 203 Pollachius virens
150 Odobenus rosmarus 204 Pomatoschistus minutus
151 Phocoena phocoena 205 Reinhardtius hippoglossoides
152 Hyperoodon ampullatus 206 Salmo salar
153 Mesoplodon bidens 207 Scomber scrombrus
154 Mesoplodon europaeus 208 Sebastes marinus
155 Mesoplodon mirus 209 Solea vulgaris
156 Ziphius cavirostris 210 Thunnus thynnus
157 Balaenoptera acutorostrata 211 Trachurus trachurus
212 Diazona violacea 264 Endectyon delaubenfelsi
213 Leptoclinides faeroensis 265 Eurypon clavatum
214 Microcosmus claudicans 266 Haliclona angulata
215 Phallusia mammillata 267 Hexadella racovitzai
216 Polysyncraton lacazei 268 Leuconia gossei
217 Pyura microcosmus 269 Macandrewia azorica
218 Styela gelatinosa 270 Mycale cf. contarenii
219 Synoicum incrustatum 271 Mycale similaris
220 Caecum armoricum 272 Myxilla perspinosa
221 Truncatella subcylindrica 273 Phakellia ventilabrum
222 Laomedea angulata 274 Quasillina brevis
223 Siboglinum holmei 275 Raspaciona aculeata
224 Ostrea edulis 276 Spanioplon armaturum
225 Pseudamnicola confusa 277 Spinularia spinularia
226 Thyasira gouldi 278 Spongionella pulchella
227 Modiolus modiolus 279 Stylostichon dives
228 Tenellia adspersa 280 Suberites massa
229 Polyplumaria flabellata 281 Sycandra utriculus
230 Haliclystus auricula 282 Hanleya nagelfar
231 Lucernariopsis campanulata 283 Leptochiton scabridus
232 Lucernariopsis cruxmelitensis 284 Leptochiton arcticus
233 Actinauge richardi 285 Neomenia dalyelli
234 Aiptasia mutabilis (formerly Aiptasis couchii) 286 Leptochiton sarsi
235 Aiptasiogeton comatus 287 Lepeta caeca
236 Alcyonium glomeratum 288 Osteopelta ceticola
237 Amphianthus dohrnii 289 Micropilina minuta
238 Anemonactis mazeli 290 Pilus conicus
239 Glaucus pimplet 291 Aeolidiella sanguinea
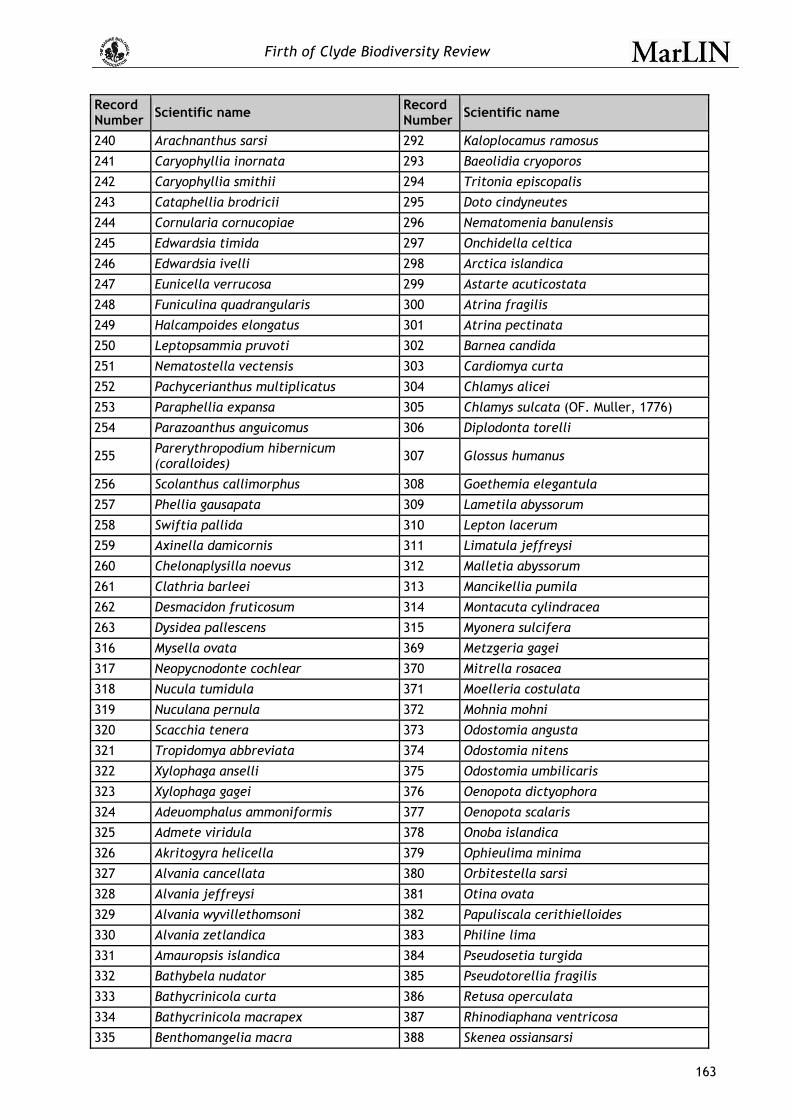
Firth of Clyde Biodiversity Review
163
Record Number Scientific name Record
Number Scientific name
240 Arachnanthus sarsi 292 Kaloplocamus ramosus
241 Caryophyllia inornata 293 Baeolidia cryoporos
242 Caryophyllia smithii 294 Tritonia episcopalis
243 Cataphellia brodricii 295 Doto cindyneutes
244 Cornularia cornucopiae 296 Nematomenia banulensis
245 Edwardsia timida 297 Onchidella celtica
246 Edwardsia ivelli 298 Arctica islandica
247 Eunicella verrucosa 299 Astarte acuticostata
248 Funiculina quadrangularis 300 Atrina fragilis
249 Halcampoides elongatus 301 Atrina pectinata
250 Leptopsammia pruvoti 302 Barnea candida
251 Nematostella vectensis 303 Cardiomya curta
252 Pachycerianthus multiplicatus 304 Chlamys alicei
253 Paraphellia expansa 305 Chlamys sulcata (OF. Muller, 1776)
254 Parazoanthus anguicomus 306 Diplodonta torelli
255 Parerythropodium hibernicum (coralloides) 307 Glossus humanus
256 Scolanthus callimorphus 308 Goethemia elegantula
257 Phellia gausapata 309 Lametila abyssorum
258 Swiftia pallida 310 Lepton lacerum
259 Axinella damicornis 311 Limatula jeffreysi
260 Chelonaplysilla noevus 312 Malletia abyssorum
261 Clathria barleei 313 Mancikellia pumila
262 Desmacidon fruticosum 314 Montacuta cylindracea
263 Dysidea pallescens 315 Myonera sulcifera
316 Mysella ovata 369 Metzgeria gagei
317 Neopycnodonte cochlear 370 Mitrella rosacea
318 Nucula tumidula 371 Moelleria costulata
319 Nuculana pernula 372 Mohnia mohni
320 Scacchia tenera 373 Odostomia angusta
321 Tropidomya abbreviata 374 Odostomia nitens
322 Xylophaga anselli 375 Odostomia umbilicaris
323 Xylophaga gagei 376 Oenopota dictyophora
324 Adeuomphalus ammoniformis 377 Oenopota scalaris
325 Admete viridula 378 Onoba islandica
326 Akritogyra helicella 379 Ophieulima minima
327 Alvania cancellata 380 Orbitestella sarsi
328 Alvania jeffreysi 381 Otina ovata
329 Alvania wyvillethomsoni 382 Papuliscala cerithielloides
330 Alvania zetlandica 383 Philine lima
331 Amauropsis islandica 384 Pseudosetia turgida
332 Bathybela nudator 385 Pseudotorellia fragilis
333 Bathycrinicola curta 386 Retusa operculata
334 Bathycrinicola macrapex 387 Rhinodiaphana ventricosa
335 Benthomangelia macra 388 Skenea ossiansarsi
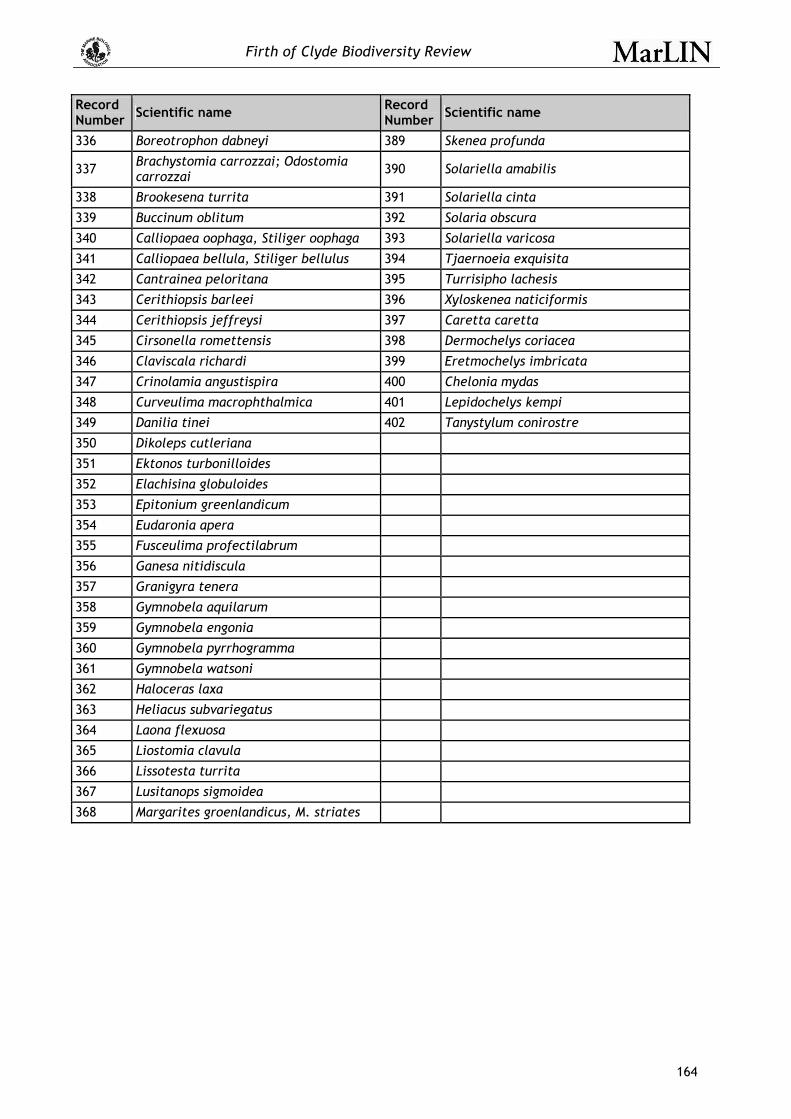
Firth of Clyde Biodiversity Review
164
Record Number Scientific name Record
Number Scientific name
336 Boreotrophon dabneyi 389 Skenea profunda
337 Brachystomia carrozzai; Odostomia carrozzai 390 Solariella amabilis
338 Brookesena turrita 391 Solariella cinta
339 Buccinum oblitum 392 Solaria obscura
340 Calliopaea oophaga, Stiliger oophaga 393 Solariella varicosa
341 Calliopaea bellula, Stiliger bellulus 394 Tjaernoeia exquisita
342 Cantrainea peloritana 395 Turrisipho lachesis
343 Cerithiopsis barleei 396 Xyloskenea naticiformis
344 Cerithiopsis jeffreysi 397 Caretta caretta
345 Cirsonella romettensis 398 Dermochelys coriacea
346 Claviscala richardi 399 Eretmochelys imbricata
347 Crinolamia angustispira 400 Chelonia mydas
348 Curveulima macrophthalmica 401 Lepidochelys kempi
349 Danilia tinei 402 Tanystylum conirostre
350 Dikoleps cutleriana
351 Ektonos turbonilloides
352 Elachisina globuloides
353 Epitonium greenlandicum
354 Eudaronia apera
355 Fusceulima profectilabrum
356 Ganesa nitidiscula
357 Granigyra tenera
358 Gymnobela aquilarum
359 Gymnobela engonia
360 Gymnobela pyrrhogramma
361 Gymnobela watsoni
362 Haloceras laxa
363 Heliacus subvariegatus
364 Laona flexuosa
365 Liostomia clavula
366 Lissotesta turrita
367 Lusitanops sigmoidea
368 Margarites groenlandicus, M. striates
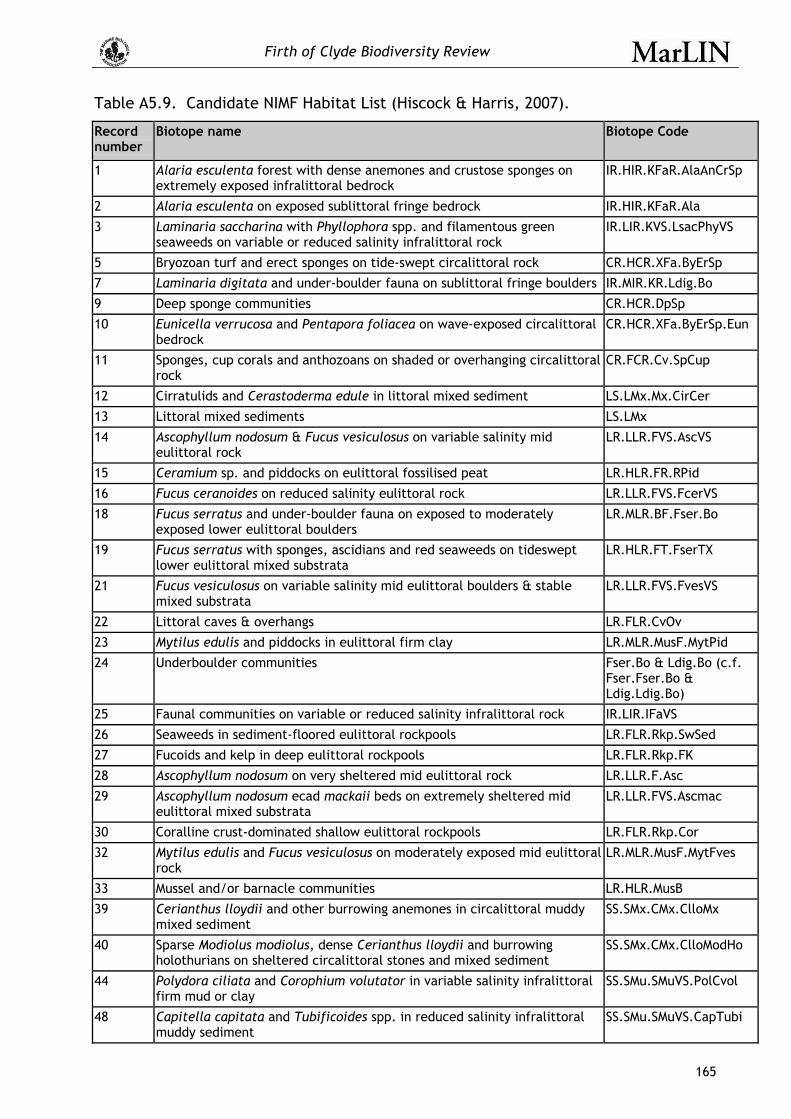
Firth of Clyde Biodiversity Review
165
Table A5.9. Candidate NIMF Habitat List (Hiscock & Harris, 2007).
Record number
Biotope name Biotope Code
1 Alaria esculenta forest with dense anemones and crustose sponges on extremely exposed infralittoral bedrock
IR.HIR.KFaR.AlaAnCrSp
2 Alaria esculenta on exposed sublittoral fringe bedrock IR.HIR.KFaR.Ala
3 Laminaria saccharina with Phyllophora spp. and filamentous green seaweeds on variable or reduced salinity infralittoral rock
IR.LIR.KVS.LsacPhyVS
5 Bryozoan turf and erect sponges on tide-swept circalittoral rock CR.HCR.XFa.ByErSp
7 Laminaria digitata and under-boulder fauna on sublittoral fringe boulders IR.MIR.KR.Ldig.Bo
9 Deep sponge communities CR.HCR.DpSp
10 Eunicella verrucosa and Pentapora foliacea on wave-exposed circalittoral bedrock
CR.HCR.XFa.ByErSp.Eun
11 Sponges, cup corals and anthozoans on shaded or overhanging circalittoral rock
CR.FCR.Cv.SpCup
12 Cirratulids and Cerastoderma edule in littoral mixed sediment LS.LMx.Mx.CirCer
13 Littoral mixed sediments LS.LMx
14 Ascophyllum nodosum & Fucus vesiculosus on variable salinity mid eulittoral rock
LR.LLR.FVS.AscVS
15 Ceramium sp. and piddocks on eulittoral fossilised peat LR.HLR.FR.RPid
16 Fucus ceranoides on reduced salinity eulittoral rock LR.LLR.FVS.FcerVS
18 Fucus serratus and under-boulder fauna on exposed to moderately exposed lower eulittoral boulders
LR.MLR.BF.Fser.Bo
19 Fucus serratus with sponges, ascidians and red seaweeds on tideswept lower eulittoral mixed substrata
LR.HLR.FT.FserTX
21 Fucus vesiculosus on variable salinity mid eulittoral boulders & stable mixed substrata
LR.LLR.FVS.FvesVS
22 Littoral caves & overhangs LR.FLR.CvOv
23 Mytilus edulis and piddocks in eulittoral firm clay LR.MLR.MusF.MytPid
24 Underboulder communities Fser.Bo & Ldig.Bo (c.f. Fser.Fser.Bo & Ldig.Ldig.Bo)
25 Faunal communities on variable or reduced salinity infralittoral rock IR.LIR.IFaVS
26 Seaweeds in sediment-floored eulittoral rockpools LR.FLR.Rkp.SwSed
27 Fucoids and kelp in deep eulittoral rockpools LR.FLR.Rkp.FK
28 Ascophyllum nodosum on very sheltered mid eulittoral rock LR.LLR.F.Asc
29 Ascophyllum nodosum ecad mackaii beds on extremely sheltered mid eulittoral mixed substrata
LR.LLR.FVS.Ascmac
30 Coralline crust-dominated shallow eulittoral rockpools LR.FLR.Rkp.Cor
32 Mytilus edulis and Fucus vesiculosus on moderately exposed mid eulittoral rock
LR.MLR.MusF.MytFves
33 Mussel and/or barnacle communities LR.HLR.MusB
39 Cerianthus lloydii and other burrowing anemones in circalittoral muddy mixed sediment
SS.SMx.CMx.ClloMx
40 Sparse Modiolus modiolus, dense Cerianthus lloydii and burrowing holothurians on sheltered circalittoral stones and mixed sediment
SS.SMx.CMx.ClloModHo
44 Polydora ciliata and Corophium volutator in variable salinity infralittoral firm mud or clay
SS.SMu.SMuVS.PolCvol
48 Capitella capitata and Tubificoides spp. in reduced salinity infralittoral muddy sediment
SS.SMu.SMuVS.CapTubi
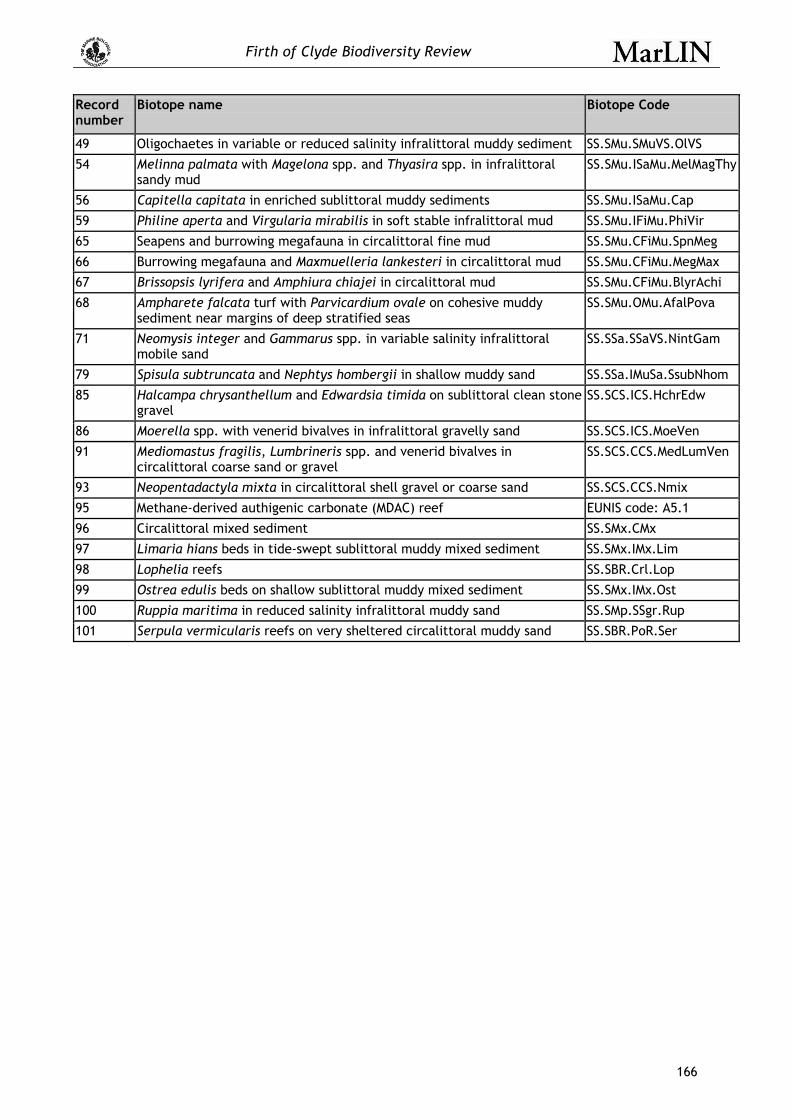
Firth of Clyde Biodiversity Review
166
Record number
Biotope name Biotope Code
49 Oligochaetes in variable or reduced salinity infralittoral muddy sediment SS.SMu.SMuVS.OlVS
54 Melinna palmata with Magelona spp. and Thyasira spp. in infralittoral sandy mud
SS.SMu.ISaMu.MelMagThy
56 Capitella capitata in enriched sublittoral muddy sediments SS.SMu.ISaMu.Cap
59 Philine aperta and Virgularia mirabilis in soft stable infralittoral mud SS.SMu.IFiMu.PhiVir
65 Seapens and burrowing megafauna in circalittoral fine mud SS.SMu.CFiMu.SpnMeg
66 Burrowing megafauna and Maxmuelleria lankesteri in circalittoral mud SS.SMu.CFiMu.MegMax
67 Brissopsis lyrifera and Amphiura chiajei in circalittoral mud SS.SMu.CFiMu.BlyrAchi
68 Ampharete falcata turf with Parvicardium ovale on cohesive muddy sediment near margins of deep stratified seas
SS.SMu.OMu.AfalPova
71 Neomysis integer and Gammarus spp. in variable salinity infralittoral mobile sand
SS.SSa.SSaVS.NintGam
79 Spisula subtruncata and Nephtys hombergii in shallow muddy sand SS.SSa.IMuSa.SsubNhom
85 Halcampa chrysanthellum and Edwardsia timida on sublittoral clean stone gravel
SS.SCS.ICS.HchrEdw
86 Moerella spp. with venerid bivalves in infralittoral gravelly sand SS.SCS.ICS.MoeVen
91 Mediomastus fragilis, Lumbrineris spp. and venerid bivalves in circalittoral coarse sand or gravel
SS.SCS.CCS.MedLumVen
93 Neopentadactyla mixta in circalittoral shell gravel or coarse sand SS.SCS.CCS.Nmix
95 Methane-derived authigenic carbonate (MDAC) reef EUNIS code: A5.1
96 Circalittoral mixed sediment SS.SMx.CMx
97 Limaria hians beds in tide-swept sublittoral muddy mixed sediment SS.SMx.IMx.Lim
98 Lophelia reefs SS.SBR.Crl.Lop
99 Ostrea edulis beds on shallow sublittoral muddy mixed sediment SS.SMx.IMx.Ost
100 Ruppia maritima in reduced salinity infralittoral muddy sand SS.SMp.SSgr.Rup
101 Serpula vermicularis reefs on very sheltered circalittoral muddy sand SS.SBR.PoR.Ser
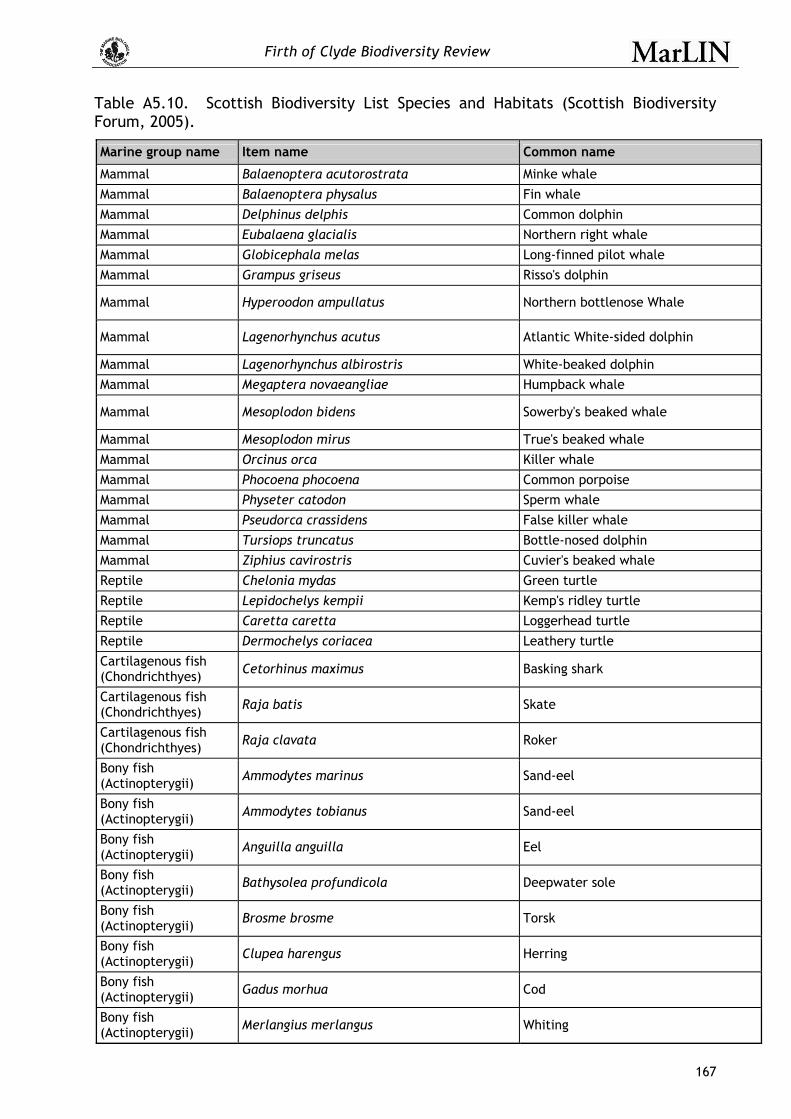
Firth of Clyde Biodiversity Review
167
Table A5.10. Scottish Biodiversity List Species and Habitats (Scottish Biodiversity Forum, 2005).
Marine group name Item name Common name
Mammal Balaenoptera acutorostrata Minke whale
Mammal Balaenoptera physalus Fin whale
Mammal Delphinus delphis Common dolphin
Mammal Eubalaena glacialis Northern right whale
Mammal Globicephala melas Long-finned pilot whale
Mammal Grampus griseus Risso's dolphin
Mammal Hyperoodon ampullatus Northern bottlenose Whale
Mammal Lagenorhynchus acutus Atlantic White-sided dolphin
Mammal Lagenorhynchus albirostris White-beaked dolphin
Mammal Megaptera novaeangliae Humpback whale
Mammal Mesoplodon bidens Sowerby's beaked whale
Mammal Mesoplodon mirus True's beaked whale
Mammal Orcinus orca Killer whale
Mammal Phocoena phocoena Common porpoise
Mammal Physeter catodon Sperm whale
Mammal Pseudorca crassidens False killer whale
Mammal Tursiops truncatus Bottle-nosed dolphin
Mammal Ziphius cavirostris Cuvier's beaked whale
Reptile Chelonia mydas Green turtle
Reptile Lepidochelys kempii Kemp's ridley turtle
Reptile Caretta caretta Loggerhead turtle
Reptile Dermochelys coriacea Leathery turtle
Cartilagenous fish (Chondrichthyes) Cetorhinus maximus Basking shark
Cartilagenous fish (Chondrichthyes) Raja batis Skate
Cartilagenous fish (Chondrichthyes) Raja clavata Roker
Bony fish (Actinopterygii) Ammodytes marinus Sand-eel
Bony fish (Actinopterygii) Ammodytes tobianus Sand-eel
Bony fish (Actinopterygii) Anguilla anguilla Eel
Bony fish (Actinopterygii) Bathysolea profundicola Deepwater sole
Bony fish (Actinopterygii) Brosme brosme Torsk
Bony fish (Actinopterygii) Clupea harengus Herring
Bony fish (Actinopterygii) Gadus morhua Cod
Bony fish (Actinopterygii) Merlangius merlangus Whiting
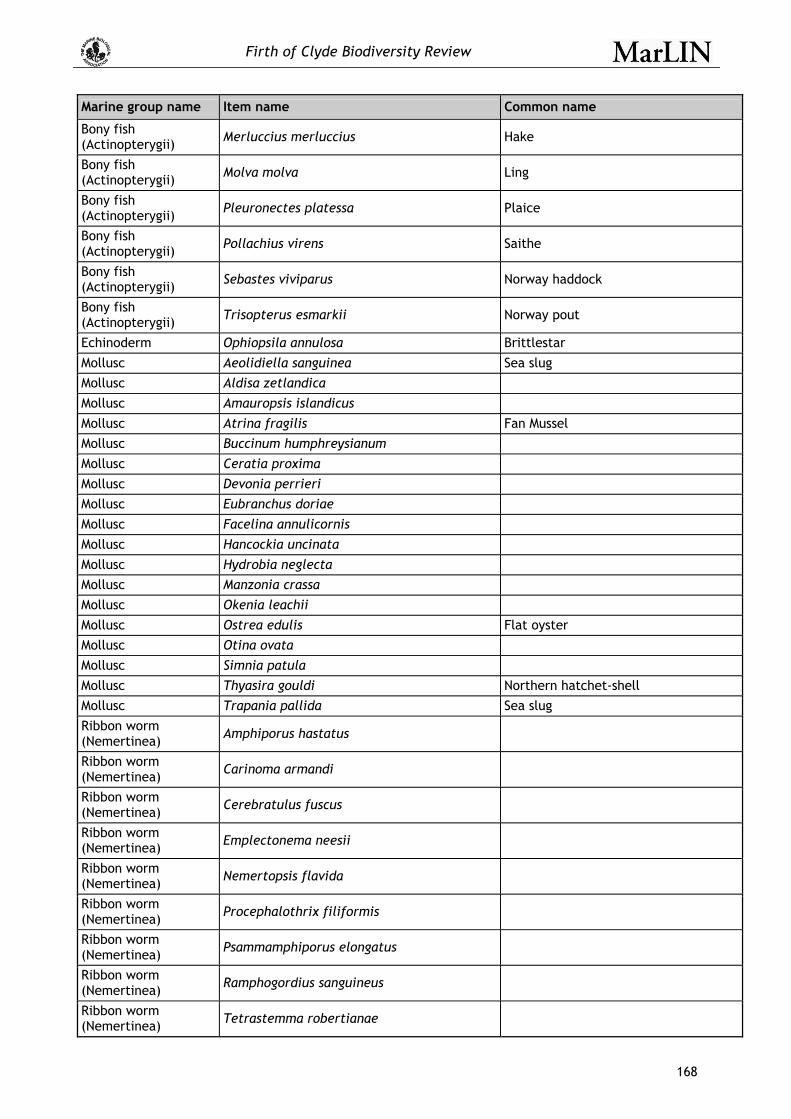
Firth of Clyde Biodiversity Review
168
Marine group name Item name Common name
Bony fish (Actinopterygii) Merluccius merluccius Hake
Bony fish (Actinopterygii) Molva molva Ling
Bony fish (Actinopterygii) Pleuronectes platessa Plaice
Bony fish (Actinopterygii) Pollachius virens Saithe
Bony fish (Actinopterygii) Sebastes viviparus Norway haddock
Bony fish (Actinopterygii) Trisopterus esmarkii Norway pout
Echinoderm Ophiopsila annulosa Brittlestar
Mollusc Aeolidiella sanguinea Sea slug
Mollusc Aldisa zetlandica
Mollusc Amauropsis islandicus
Mollusc Atrina fragilis Fan Mussel
Mollusc Buccinum humphreysianum
Mollusc Ceratia proxima
Mollusc Devonia perrieri
Mollusc Eubranchus doriae
Mollusc Facelina annulicornis
Mollusc Hancockia uncinata
Mollusc Hydrobia neglecta
Mollusc Manzonia crassa
Mollusc Okenia leachii
Mollusc Ostrea edulis Flat oyster
Mollusc Otina ovata
Mollusc Simnia patula
Mollusc Thyasira gouldi Northern hatchet-shell
Mollusc Trapania pallida Sea slug
Ribbon worm (Nemertinea) Amphiporus hastatus
Ribbon worm (Nemertinea) Carinoma armandi
Ribbon worm (Nemertinea) Cerebratulus fuscus
Ribbon worm (Nemertinea) Emplectonema neesii
Ribbon worm (Nemertinea) Nemertopsis flavida
Ribbon worm (Nemertinea) Procephalothrix filiformis
Ribbon worm (Nemertinea) Psammamphiporus elongatus
Ribbon worm (Nemertinea) Ramphogordius sanguineus
Ribbon worm (Nemertinea) Tetrastemma robertianae
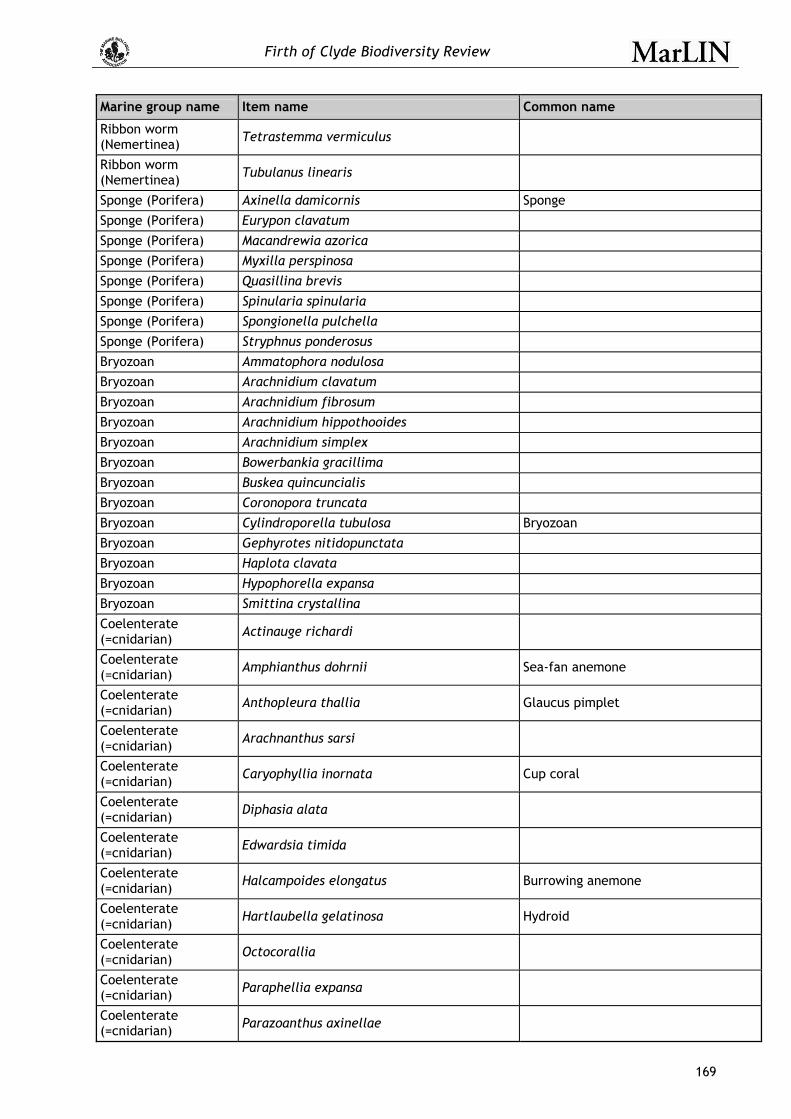
Firth of Clyde Biodiversity Review
169
Marine group name Item name Common name
Ribbon worm (Nemertinea) Tetrastemma vermiculus
Ribbon worm (Nemertinea) Tubulanus linearis
Sponge (Porifera) Axinella damicornis Sponge
Sponge (Porifera) Eurypon clavatum
Sponge (Porifera) Macandrewia azorica
Sponge (Porifera) Myxilla perspinosa
Sponge (Porifera) Quasillina brevis
Sponge (Porifera) Spinularia spinularia
Sponge (Porifera) Spongionella pulchella
Sponge (Porifera) Stryphnus ponderosus
Bryozoan Ammatophora nodulosa
Bryozoan Arachnidium clavatum
Bryozoan Arachnidium fibrosum
Bryozoan Arachnidium hippothooides
Bryozoan Arachnidium simplex
Bryozoan Bowerbankia gracillima
Bryozoan Buskea quincuncialis
Bryozoan Coronopora truncata
Bryozoan Cylindroporella tubulosa Bryozoan
Bryozoan Gephyrotes nitidopunctata
Bryozoan Haplota clavata
Bryozoan Hypophorella expansa
Bryozoan Smittina crystallina
Coelenterate (=cnidarian) Actinauge richardi
Coelenterate (=cnidarian) Amphianthus dohrnii Sea-fan anemone
Coelenterate (=cnidarian) Anthopleura thallia Glaucus pimplet
Coelenterate (=cnidarian) Arachnanthus sarsi
Coelenterate (=cnidarian) Caryophyllia inornata Cup coral
Coelenterate (=cnidarian) Diphasia alata
Coelenterate (=cnidarian) Edwardsia timida
Coelenterate (=cnidarian) Halcampoides elongatus Burrowing anemone
Coelenterate (=cnidarian) Hartlaubella gelatinosa Hydroid
Coelenterate (=cnidarian) Octocorallia
Coelenterate (=cnidarian) Paraphellia expansa
Coelenterate (=cnidarian) Parazoanthus axinellae
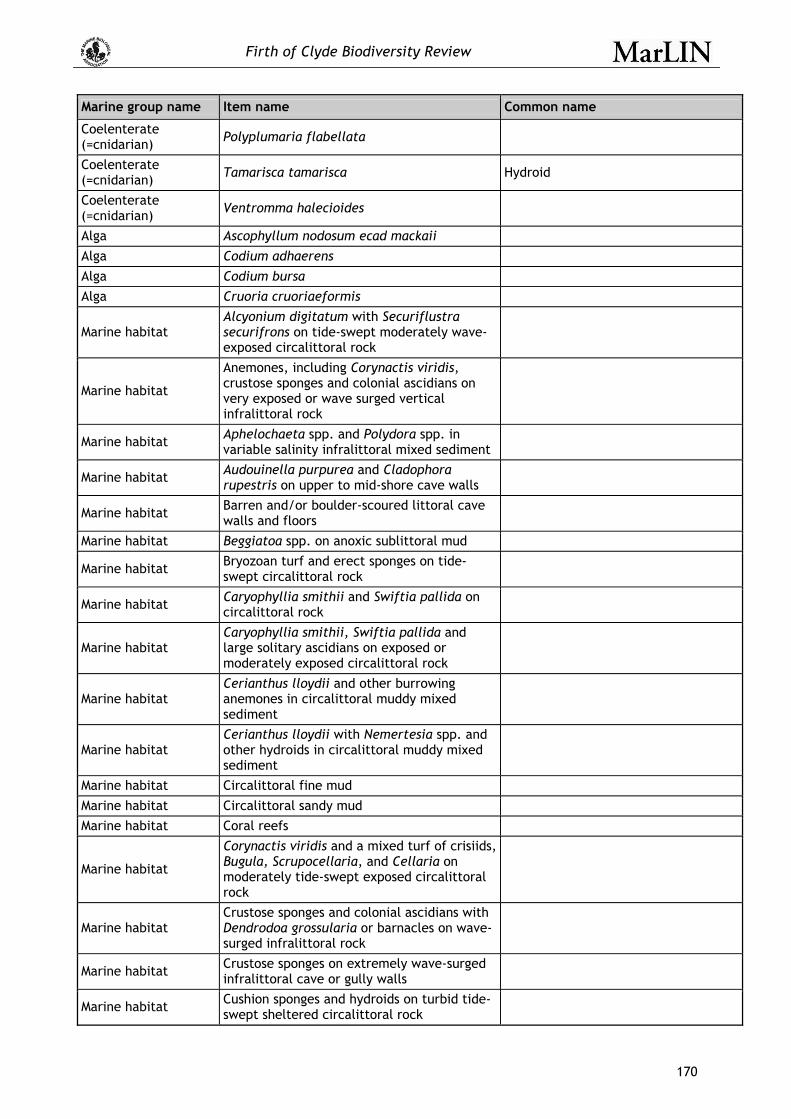
Firth of Clyde Biodiversity Review
170
Marine group name Item name Common name
Coelenterate (=cnidarian) Polyplumaria flabellata
Coelenterate (=cnidarian) Tamarisca tamarisca Hydroid
Coelenterate (=cnidarian) Ventromma halecioides
Alga Ascophyllum nodosum ecad mackaii
Alga Codium adhaerens
Alga Codium bursa
Alga Cruoria cruoriaeformis
Marine habitat Alcyonium digitatum with Securiflustra securifrons on tide-swept moderately wave-exposed circalittoral rock
Marine habitat
Anemones, including Corynactis viridis, crustose sponges and colonial ascidians on very exposed or wave surged vertical infralittoral rock
Marine habitat Aphelochaeta spp. and Polydora spp. in variable salinity infralittoral mixed sediment
Marine habitat Audouinella purpurea and Cladophora rupestris on upper to mid-shore cave walls
Marine habitat Barren and/or boulder-scoured littoral cave walls and floors
Marine habitat Beggiatoa spp. on anoxic sublittoral mud
Marine habitat Bryozoan turf and erect sponges on tide-swept circalittoral rock
Marine habitat Caryophyllia smithii and Swiftia pallida on circalittoral rock
Marine habitat Caryophyllia smithii, Swiftia pallida and large solitary ascidians on exposed or moderately exposed circalittoral rock
Marine habitat Cerianthus lloydii and other burrowing anemones in circalittoral muddy mixed sediment
Marine habitat Cerianthus lloydii with Nemertesia spp. and other hydroids in circalittoral muddy mixed sediment
Marine habitat Circalittoral fine mud
Marine habitat Circalittoral sandy mud
Marine habitat Coral reefs
Marine habitat
Corynactis viridis and a mixed turf of crisiids, Bugula, Scrupocellaria, and Cellaria on moderately tide-swept exposed circalittoral rock
Marine habitat Crustose sponges and colonial ascidians with Dendrodoa grossularia or barnacles on wave-surged infralittoral rock
Marine habitat Crustose sponges on extremely wave-surged infralittoral cave or gully walls
Marine habitat Cushion sponges and hydroids on turbid tide-swept sheltered circalittoral rock
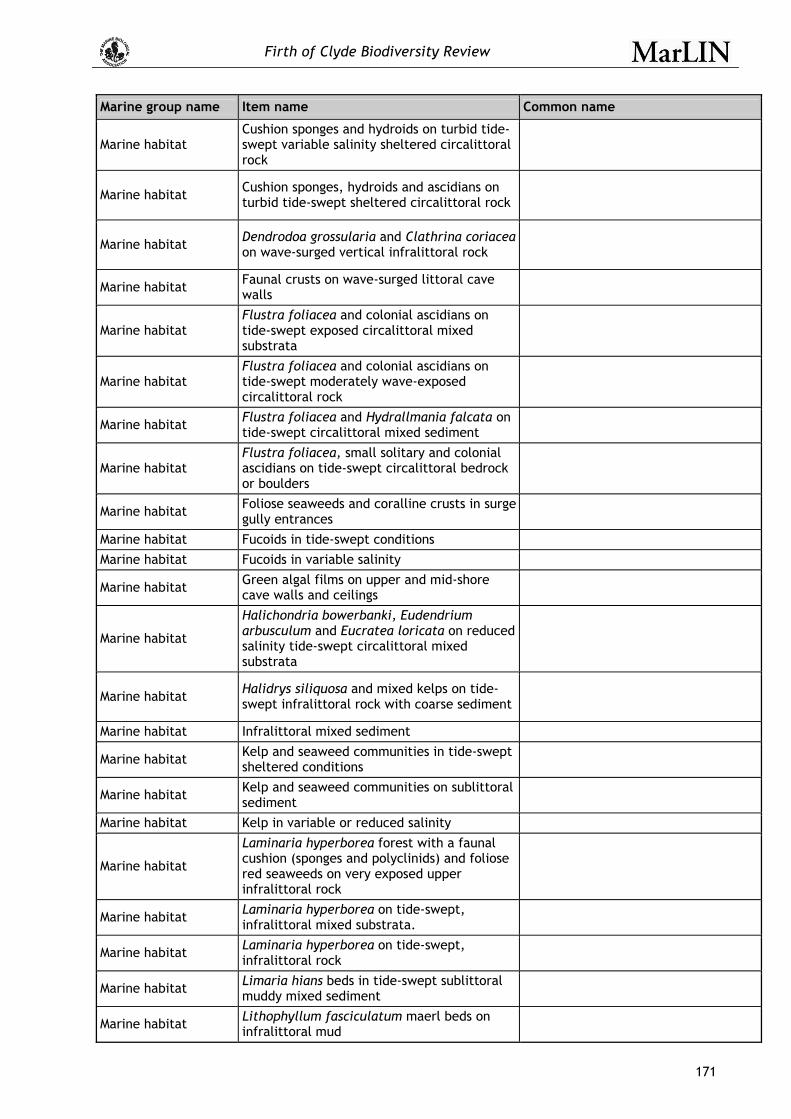
Firth of Clyde Biodiversity Review
171
Marine group name Item name Common name
Marine habitat Cushion sponges and hydroids on turbid tide-swept variable salinity sheltered circalittoral rock
Marine habitat Cushion sponges, hydroids and ascidians on turbid tide-swept sheltered circalittoral rock
Marine habitat Dendrodoa grossularia and Clathrina coriacea on wave-surged vertical infralittoral rock
Marine habitat Faunal crusts on wave-surged littoral cave walls
Marine habitat Flustra foliacea and colonial ascidians on tide-swept exposed circalittoral mixed substrata
Marine habitat Flustra foliacea and colonial ascidians on tide-swept moderately wave-exposed circalittoral rock
Marine habitat Flustra foliacea and Hydrallmania falcata on tide-swept circalittoral mixed sediment
Marine habitat Flustra foliacea, small solitary and colonial ascidians on tide-swept circalittoral bedrock or boulders
Marine habitat Foliose seaweeds and coralline crusts in surge gully entrances
Marine habitat Fucoids in tide-swept conditions
Marine habitat Fucoids in variable salinity
Marine habitat Green algal films on upper and mid-shore cave walls and ceilings
Marine habitat
Halichondria bowerbanki, Eudendrium arbusculum and Eucratea loricata on reduced salinity tide-swept circalittoral mixed substrata
Marine habitat Halidrys siliquosa and mixed kelps on tide-swept infralittoral rock with coarse sediment
Marine habitat Infralittoral mixed sediment
Marine habitat Kelp and seaweed communities in tide-swept sheltered conditions
Marine habitat Kelp and seaweed communities on sublittoral sediment
Marine habitat Kelp in variable or reduced salinity
Marine habitat
Laminaria hyperborea forest with a faunal cushion (sponges and polyclinids) and foliose red seaweeds on very exposed upper infralittoral rock
Marine habitat Laminaria hyperborea on tide-swept, infralittoral mixed substrata.
Marine habitat Laminaria hyperborea on tide-swept, infralittoral rock
Marine habitat Limaria hians beds in tide-swept sublittoral muddy mixed sediment
Marine habitat Lithophyllum fasciculatum maerl beds on infralittoral mud
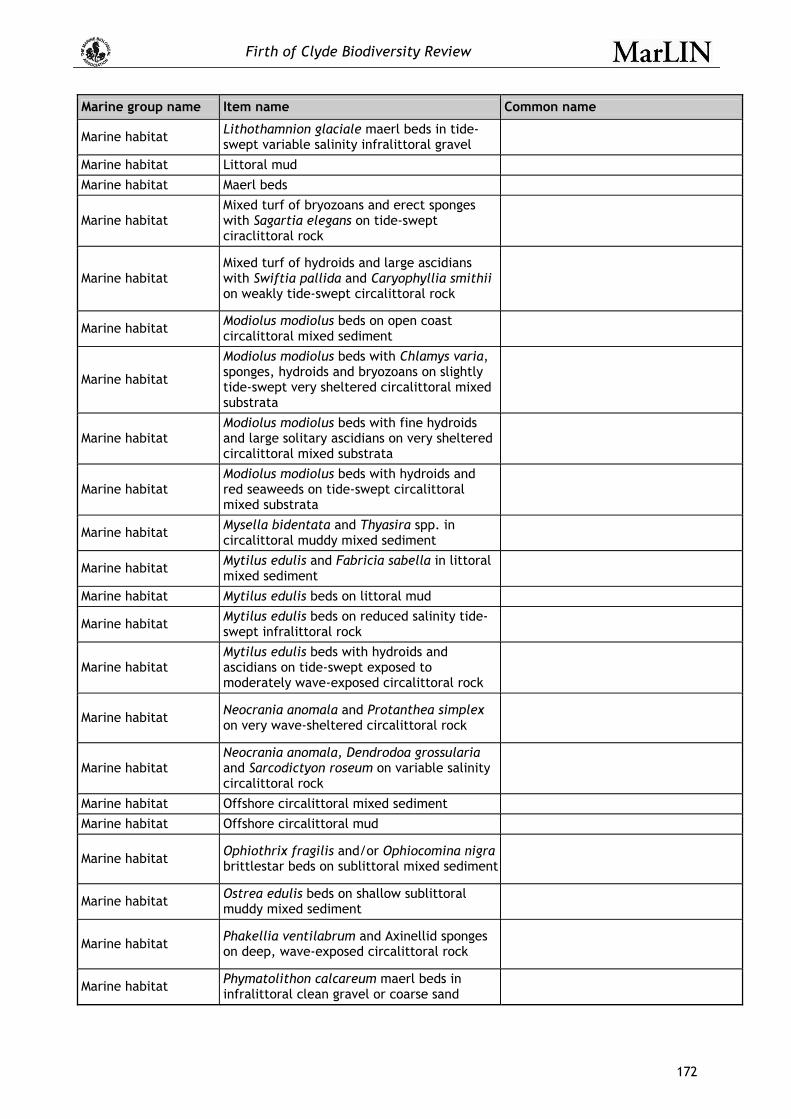
Firth of Clyde Biodiversity Review
172
Marine group name Item name Common name
Marine habitat Lithothamnion glaciale maerl beds in tide-swept variable salinity infralittoral gravel
Marine habitat Littoral mud
Marine habitat Maerl beds
Marine habitat Mixed turf of bryozoans and erect sponges with Sagartia elegans on tide-swept ciraclittoral rock
Marine habitat Mixed turf of hydroids and large ascidians with Swiftia pallida and Caryophyllia smithii on weakly tide-swept circalittoral rock
Marine habitat Modiolus modiolus beds on open coast circalittoral mixed sediment
Marine habitat
Modiolus modiolus beds with Chlamys varia, sponges, hydroids and bryozoans on slightly tide-swept very sheltered circalittoral mixed substrata
Marine habitat Modiolus modiolus beds with fine hydroids and large solitary ascidians on very sheltered circalittoral mixed substrata
Marine habitat Modiolus modiolus beds with hydroids and red seaweeds on tide-swept circalittoral mixed substrata
Marine habitat Mysella bidentata and Thyasira spp. in circalittoral muddy mixed sediment
Marine habitat Mytilus edulis and Fabricia sabella in littoral mixed sediment
Marine habitat Mytilus edulis beds on littoral mud
Marine habitat Mytilus edulis beds on reduced salinity tide-swept infralittoral rock
Marine habitat Mytilus edulis beds with hydroids and ascidians on tide-swept exposed to moderately wave-exposed circalittoral rock
Marine habitat Neocrania anomala and Protanthea simplex on very wave-sheltered circalittoral rock
Marine habitat Neocrania anomala, Dendrodoa grossularia and Sarcodictyon roseum on variable salinity circalittoral rock
Marine habitat Offshore circalittoral mixed sediment
Marine habitat Offshore circalittoral mud
Marine habitat Ophiothrix fragilis and/or Ophiocomina nigra brittlestar beds on sublittoral mixed sediment
Marine habitat Ostrea edulis beds on shallow sublittoral muddy mixed sediment
Marine habitat Phakellia ventilabrum and Axinellid sponges on deep, wave-exposed circalittoral rock
Marine habitat Phymatolithon calcareum maerl beds in infralittoral clean gravel or coarse sand
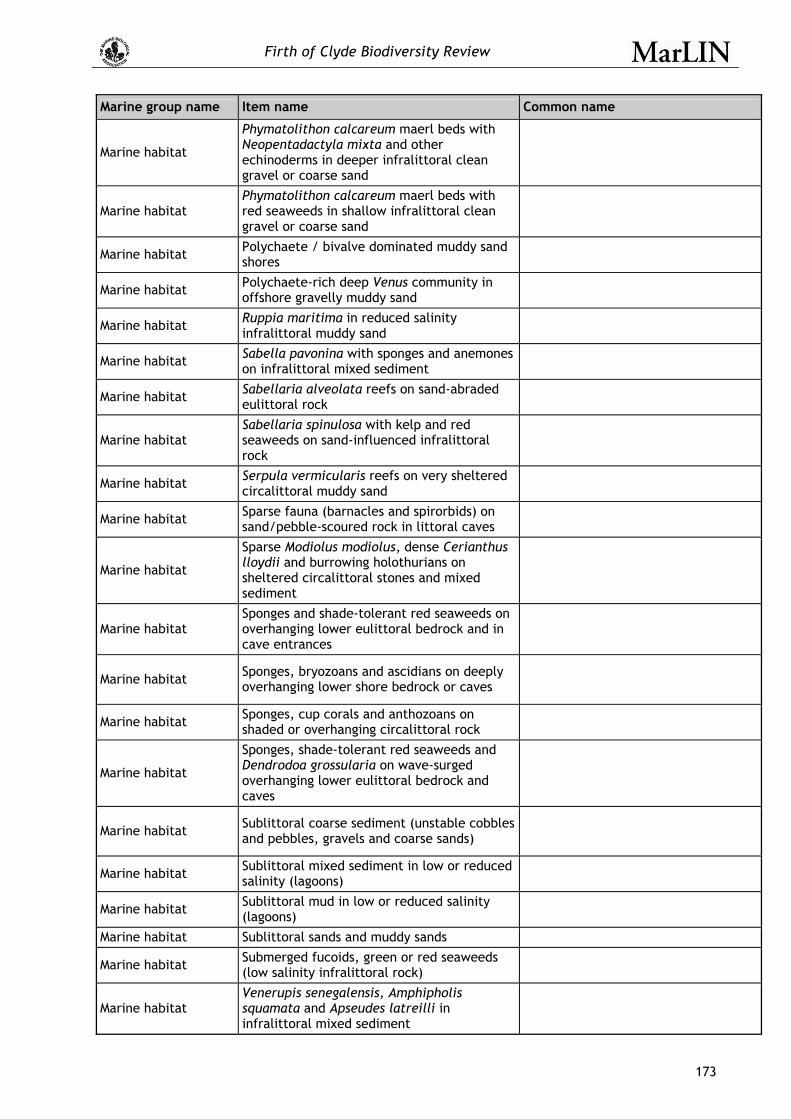
Firth of Clyde Biodiversity Review
173
Marine group name Item name Common name
Marine habitat
Phymatolithon calcareum maerl beds with Neopentadactyla mixta and other echinoderms in deeper infralittoral clean gravel or coarse sand
Marine habitat Phymatolithon calcareum maerl beds with red seaweeds in shallow infralittoral clean gravel or coarse sand
Marine habitat Polychaete / bivalve dominated muddy sand shores
Marine habitat Polychaete-rich deep Venus community in offshore gravelly muddy sand
Marine habitat Ruppia maritima in reduced salinity infralittoral muddy sand
Marine habitat Sabella pavonina with sponges and anemones on infralittoral mixed sediment
Marine habitat Sabellaria alveolata reefs on sand-abraded eulittoral rock
Marine habitat Sabellaria spinulosa with kelp and red seaweeds on sand-influenced infralittoral rock
Marine habitat Serpula vermicularis reefs on very sheltered circalittoral muddy sand
Marine habitat Sparse fauna (barnacles and spirorbids) on sand/pebble-scoured rock in littoral caves
Marine habitat
Sparse Modiolus modiolus, dense Cerianthus lloydii and burrowing holothurians on sheltered circalittoral stones and mixed sediment
Marine habitat Sponges and shade-tolerant red seaweeds on overhanging lower eulittoral bedrock and in cave entrances
Marine habitat Sponges, bryozoans and ascidians on deeply overhanging lower shore bedrock or caves
Marine habitat Sponges, cup corals and anthozoans on shaded or overhanging circalittoral rock
Marine habitat
Sponges, shade-tolerant red seaweeds and Dendrodoa grossularia on wave-surged overhanging lower eulittoral bedrock and caves
Marine habitat Sublittoral coarse sediment (unstable cobbles and pebbles, gravels and coarse sands)
Marine habitat Sublittoral mixed sediment in low or reduced salinity (lagoons)
Marine habitat Sublittoral mud in low or reduced salinity (lagoons)
Marine habitat Sublittoral sands and muddy sands
Marine habitat Submerged fucoids, green or red seaweeds (low salinity infralittoral rock)
Marine habitat Venerupis senegalensis, Amphipholis squamata and Apseudes latreilli in infralittoral mixed sediment

Firth of Clyde Biodiversity Review
174
Marine group name Item name Common name
Marine habitat Verrucaria mucosa and/or Hildenbrandia rubra on upper to mid shore cave walls
Marine habitat Very tide-swept faunal communities
Marine habitat Zostera marina/angustifolia beds on lower shore or infralittoral clean or muddy sand
Marine habitat Zostera noltii beds in littoral muddy sand
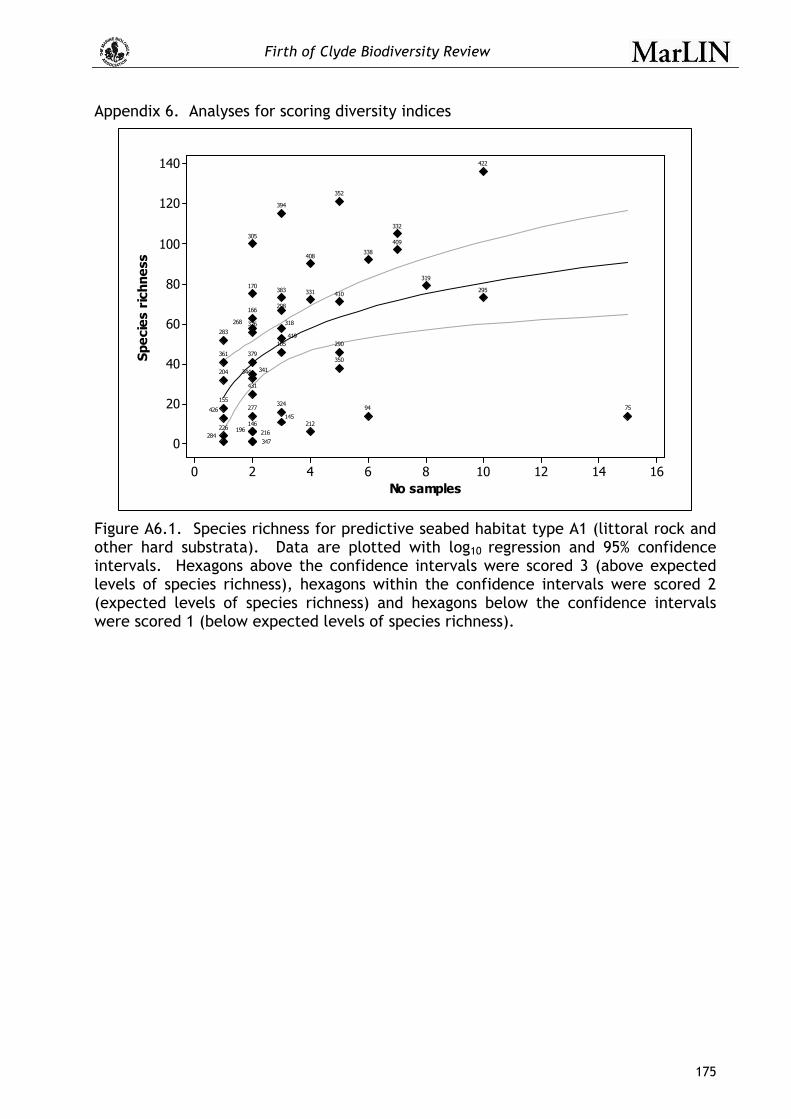
Firth of Clyde Biodiversity Review
175
Appendix 6. Analyses for scoring diversity indices
1614121086420
140
120
100
80
60
40
20
0
No samples
Spec
ies
rich
ness
295
226
268
277
283
298
290
216146
305
284
212
204
196
170
15594
145
105
318
409
166
350
75
431
426
422
419
410
408
383
379
394
352
319
347
344 341
338
332
331
326
324
361
Figure A6.1. Species richness for predictive seabed habitat type A1 (littoral rock and other hard substrata). Data are plotted with log10 regression and 95% confidence intervals. Hexagons above the confidence intervals were scored 3 (above expected levels of species richness), hexagons within the confidence intervals were scored 2 (expected levels of species richness) and hexagons below the confidence intervals were scored 1 (below expected levels of species richness).
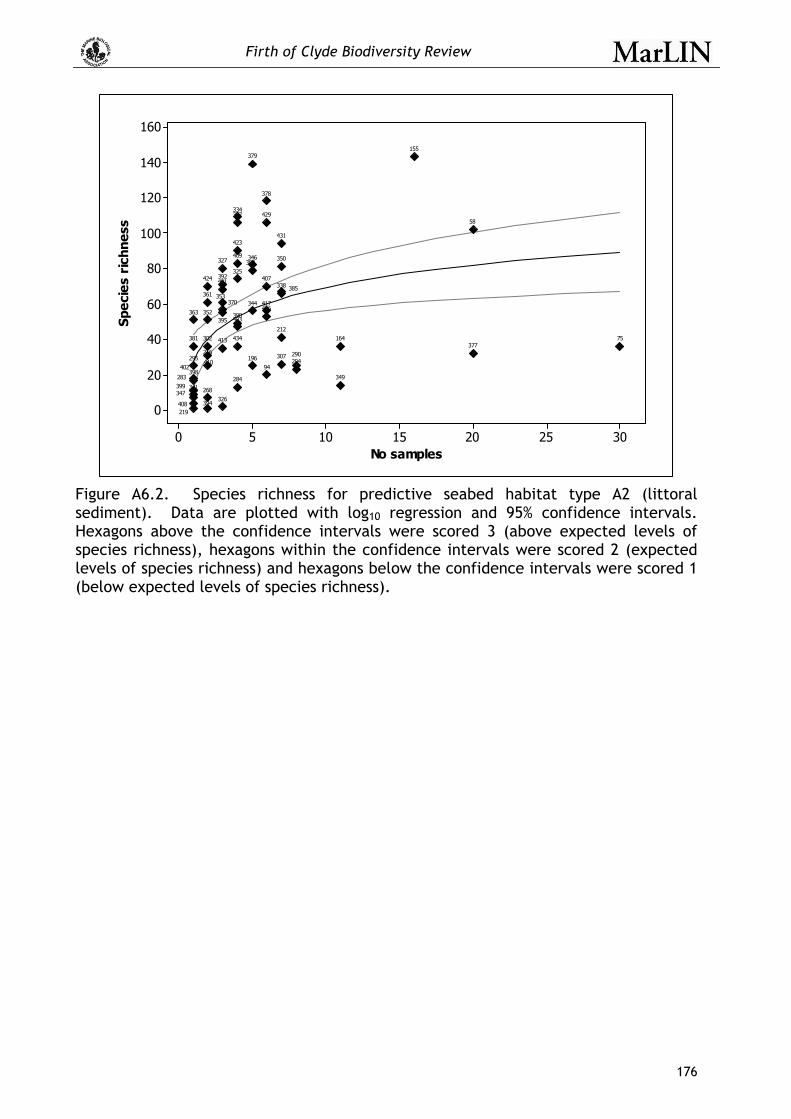
Firth of Clyde Biodiversity Review
176
302520151050
160
140
120
100
80
60
40
20
0
No samples
Spec
ies
rich
ness
352
341
325
326
327
334
338
344
346
347
307
350
219
353
349
302
290
361
268
295216
212
204196
164
155
94
75
58
283
424
402
403
407
408
409
410
401
417
423
429
431
434
363
284
413381
370
377
426
378
379
385
389
392
394
399
395390
398
397
Figure A6.2. Species richness for predictive seabed habitat type A2 (littoral sediment). Data are plotted with log10 regression and 95% confidence intervals. Hexagons above the confidence intervals were scored 3 (above expected levels of species richness), hexagons within the confidence intervals were scored 2 (expected levels of species richness) and hexagons below the confidence intervals were scored 1 (below expected levels of species richness).
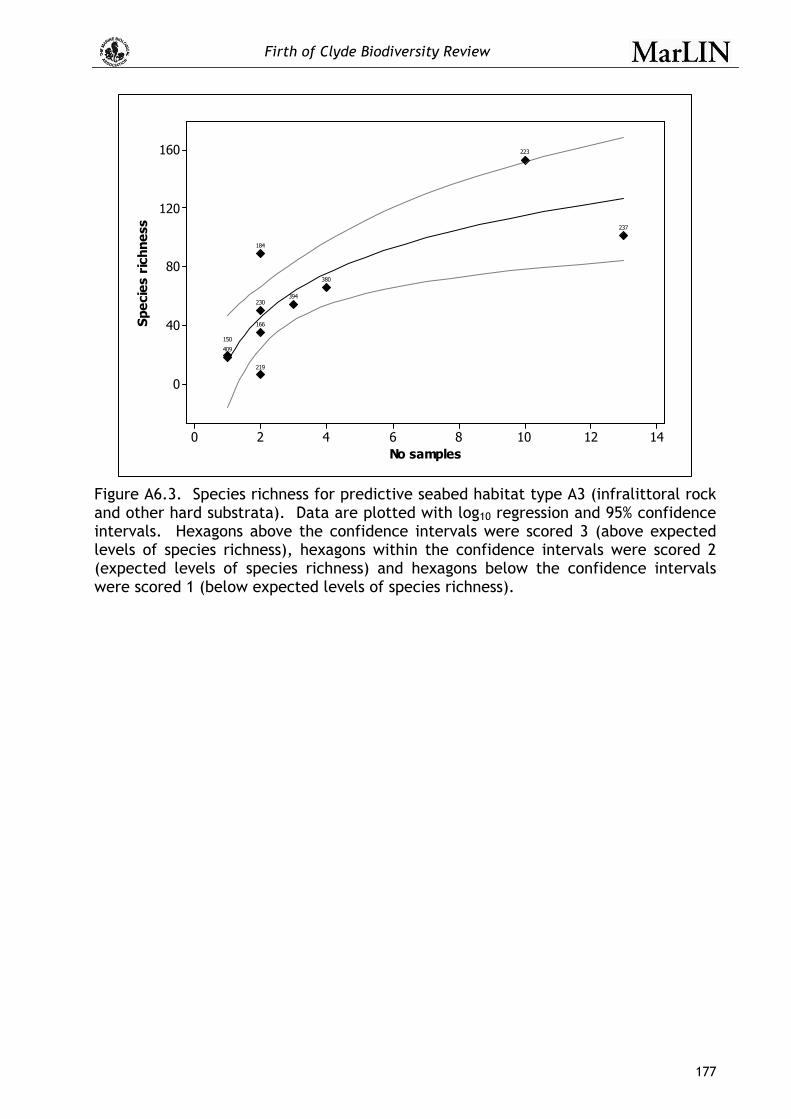
Firth of Clyde Biodiversity Review
177
14121086420
160
120
80
40
0
No samples
Spec
ies
rich
ness
394
184
409
166
219
223
230
237
380
150
Figure A6.3. Species richness for predictive seabed habitat type A3 (infralittoral rock and other hard substrata). Data are plotted with log10 regression and 95% confidence intervals. Hexagons above the confidence intervals were scored 3 (above expected levels of species richness), hexagons within the confidence intervals were scored 2 (expected levels of species richness) and hexagons below the confidence intervals were scored 1 (below expected levels of species richness).
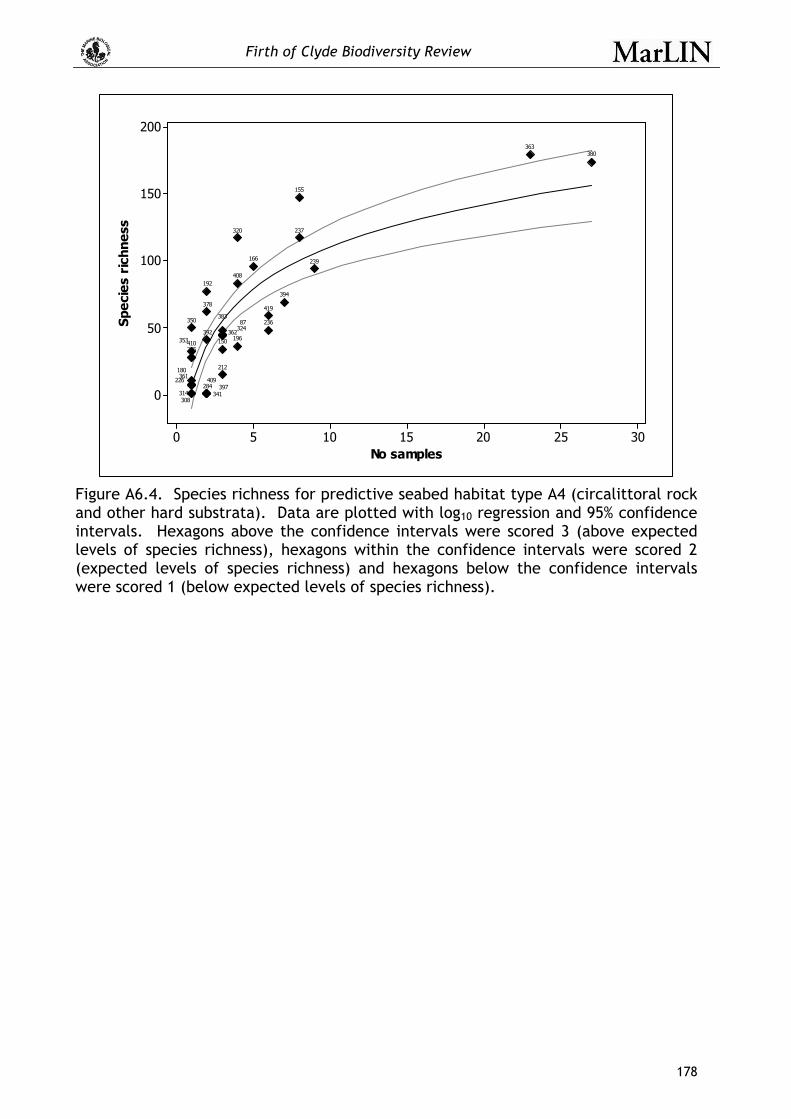
Firth of Clyde Biodiversity Review
178
302520151050
200
150
100
50
0
No samples
Spec
ies
rich
ness
236
237
239
295
180
308314
284226
212
192
166
155
320
392150 196
378
87
419
410
409
408
397
380
383
324
363
362
361
353
350
341
394
Figure A6.4. Species richness for predictive seabed habitat type A4 (circalittoral rock and other hard substrata). Data are plotted with log10 regression and 95% confidence intervals. Hexagons above the confidence intervals were scored 3 (above expected levels of species richness), hexagons within the confidence intervals were scored 2 (expected levels of species richness) and hexagons below the confidence intervals were scored 1 (below expected levels of species richness).
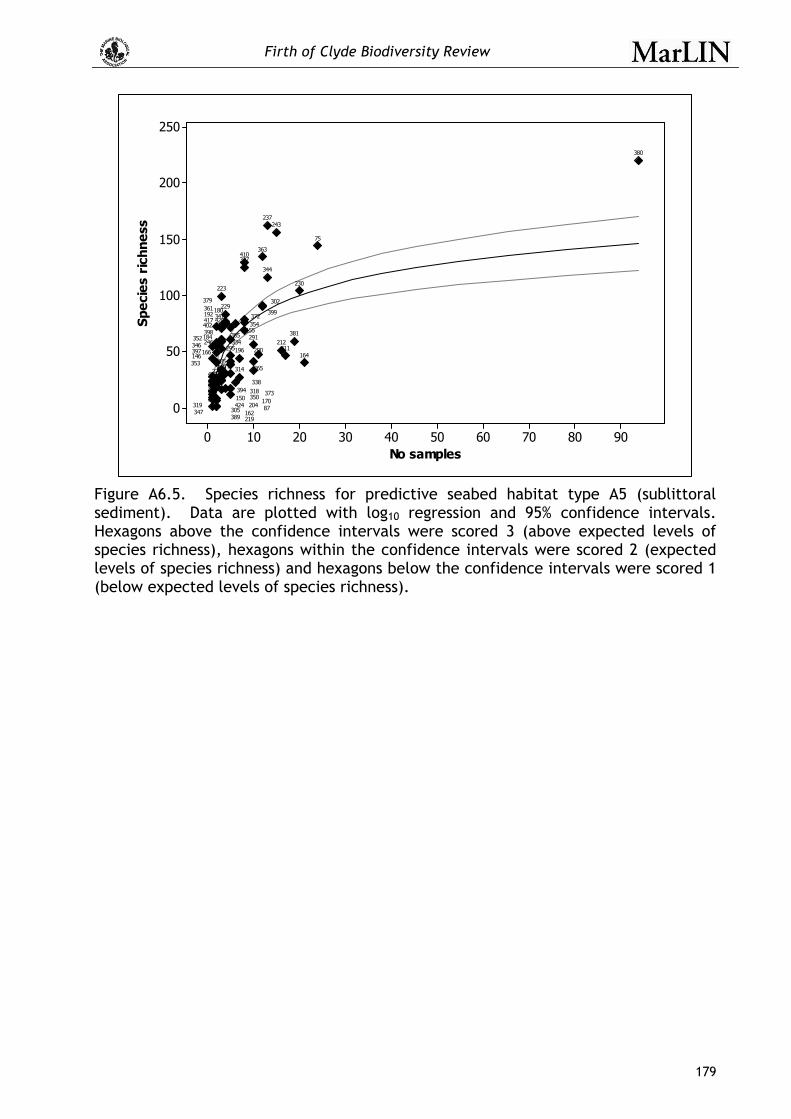
Firth of Clyde Biodiversity Review
179
9080706050403020100
250
200
150
100
50
0
No samples
Spec
ies
rich
ness
302229
230
237
246
268271285
290
324
295
219305
307308
311
314
318
319
291
180
75
87
146
150
155
162
164
226
170
223
184
192
196
204
212
215
243
166
402381385
389
392
394395
397
398
380
401
410
407408409
325
417
236
424
429399
341
423
379
338
344
346
347
350
352
353
373
361
363
365
372
327
334
377
354
Figure A6.5. Species richness for predictive seabed habitat type A5 (sublittoral sediment). Data are plotted with log10 regression and 95% confidence intervals. Hexagons above the confidence intervals were scored 3 (above expected levels of species richness), hexagons within the confidence intervals were scored 2 (expected levels of species richness) and hexagons below the confidence intervals were scored 1 (below expected levels of species richness).
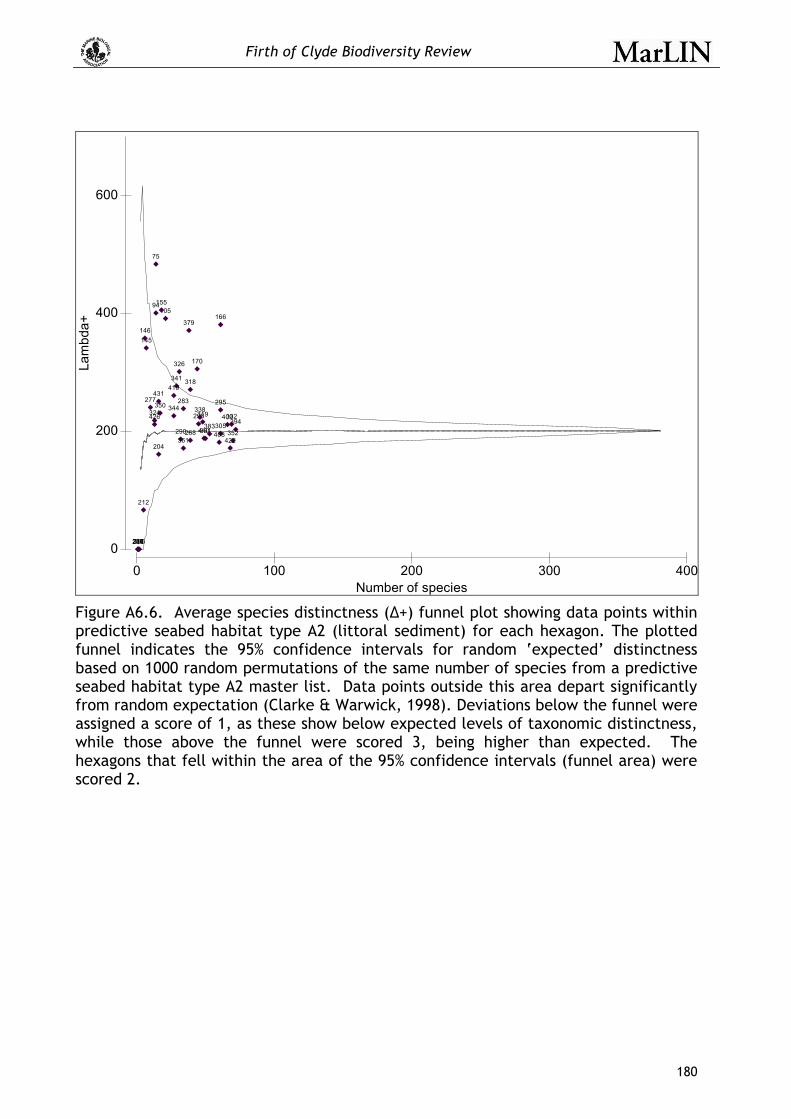
Firth of Clyde Biodiversity Review
180
0 100 200 300 400Number of species
0
200
400
600
Lam
bda+
75
94105
145146
155
166
170
196
204
212
216226
268
277 283
284
290
295
298305
318
319324
326
331
332338
341
344
347
350
352361
379
383394
408
409
410
419
422
426
431
Figure A6.6. Average species distinctness (∆+) funnel plot showing data points within predictive seabed habitat type A2 (littoral sediment) for each hexagon. The plotted funnel indicates the 95% confidence intervals for random ‘expected’ distinctness based on 1000 random permutations of the same number of species from a predictive seabed habitat type A2 master list. Data points outside this area depart significantly from random expectation (Clarke & Warwick, 1998). Deviations below the funnel were assigned a score of 1, as these show below expected levels of taxonomic distinctness, while those above the funnel were scored 3, being higher than expected. The hexagons that fell within the area of the 95% confidence intervals (funnel area) were scored 2.

Firth of Clyde Biodiversity Review
181
0 100 200 300 400Number of species
0
200
400
600
Lam
bda+
58
75
94
155
164
196204
212
216
219
268
283
284
290
295
302
307
325
326
327334
338341344
346347
349
350
352
353
361
363370
377
378
379
381
385
389
390
392
394395
397
398
401
402
403
407
408409410
413
417
423424
426
429
431
434
Figure A6.7. Average species distinctness (∆+) funnel plot showing data points within predictive seabed habitat type A3 (infralittoral rock and other hard substrata) for each hexagon. The plotted funnel indicates the 95% confidence intervals for random ‘expected’ distinctness based on 1000 random permutations of the same number of species from a predictive seabed habitat type A3 master list. Data points outside this area depart significantly from random expectation (Clarke & Warwick, 1998). Deviations below the funnel were assigned a score of 1, as these show below expected levels of taxonomic distinctness, while those above the funnel were scored 3, being higher than expected. The hexagons that fell within the area of the 95% confidence intervals (funnel area) were scored 2.

Firth of Clyde Biodiversity Review
182
0 50 100 150 200 250 300Number of species
0
200
400
600
800
Lam
bda+
150
166
184
219
223
230237380
394
409
Figure A6.8. Average species distinctness (∆+) funnel plot showing data points within predictive seabed habitat type A4 (circalittoral rock and other hard substrata) for each hexagon. The plotted funnel indicates the 95% confidence intervals for random ‘expected’ distinctness based on 1000 random permutations of the same number of species from a predictive seabed habitat type A4 master list. Data points outside this area depart significantly from random expectation (Clarke & Warwick, 1998). Deviations below the funnel were assigned a score of 1, as these show below expected levels of taxonomic distinctness, while those above the funnel were scored 3, being higher than expected. The hexagons that fell within the area of the 95% confidence intervals (funnel area) were scored 2.

Firth of Clyde Biodiversity Review
183
0 100 200 300 400 500Number of species
0
200
400
600
Lam
bda+
87
150
155
166
180
192
196
212
226
236237239
284
295
320
324
341
350
353
361
362
363
378
380
383
392
394
397
408
409
410
419
Figure A6.9. Average species distinctness (∆+) funnel plot showing data points within predictive seabed habitat type A4 (circalittoral rock and other hard substrata) for each hexagon. The plotted funnel indicates the 95% confidence intervals for random ‘expected’ distinctness based on 1000 random permutations of the same number of species from a predictive seabed habitat type A4 master list. Data points outside this area depart significantly from random expectation (Clarke & Warwick, 1998). Deviations below the funnel were assigned a score of 1, as these show below expected levels of taxonomic distinctness, while those above the funnel were scored 3, being higher than expected. The hexagons that fell within the area of the 95% confidence intervals (funnel area) were scored 2.
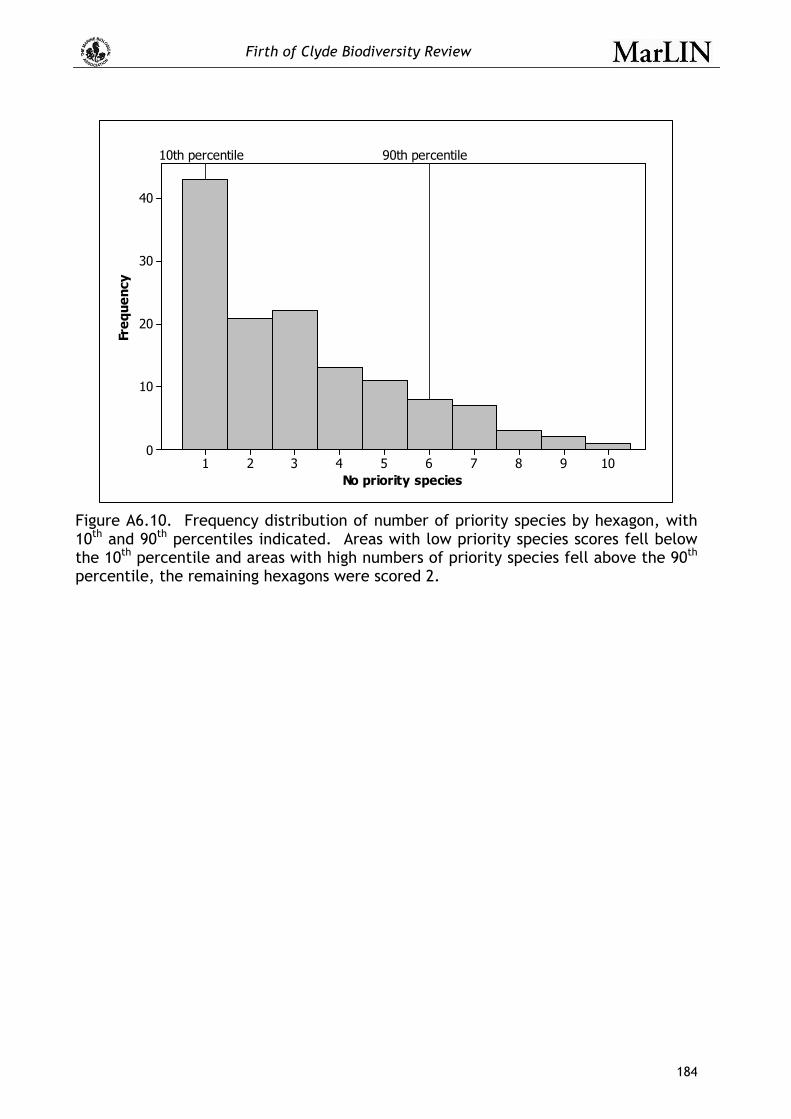
Firth of Clyde Biodiversity Review
184
10987654321
40
30
20
10
0
No priority species
Freq
uenc
y
10th percentile 90th percentile
Figure A6.10. Frequency distribution of number of priority species by hexagon, with 10th and 90th percentiles indicated. Areas with low priority species scores fell below the 10th percentile and areas with high numbers of priority species fell above the 90th percentile, the remaining hexagons were scored 2.
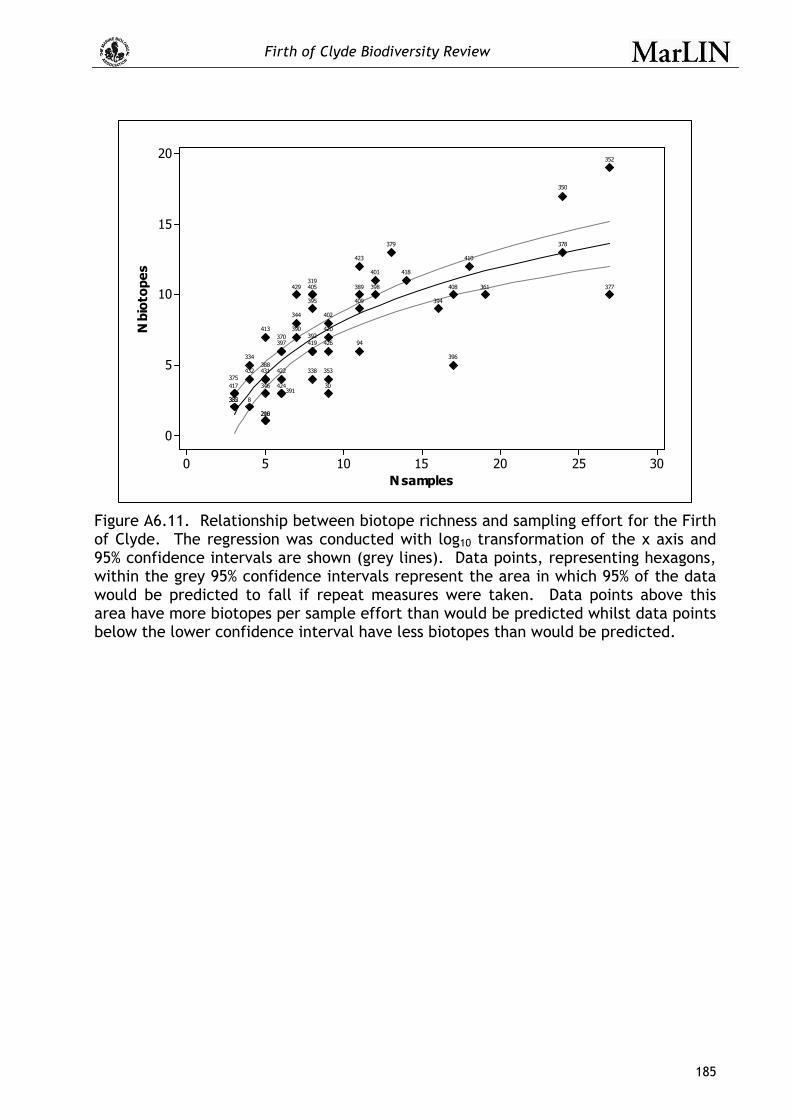
Firth of Clyde Biodiversity Review
185
302520151050
20
15
10
5
0
N samples
N bi
otop
es
432 431
429
426
424
423
422
420
419
418
417
413
410
409
408405
402
401
398
397
396
395 394
392
391
390
389
388
385
379 378
377
375
370
361
353
352
350
346
344
338
334
332
319
216200
94
30
8
Figure A6.11. Relationship between biotope richness and sampling effort for the Firth of Clyde. The regression was conducted with log10 transformation of the x axis and 95% confidence intervals are shown (grey lines). Data points, representing hexagons, within the grey 95% confidence intervals represent the area in which 95% of the data would be predicted to fall if repeat measures were taken. Data points above this area have more biotopes per sample effort than would be predicted whilst data points below the lower confidence interval have less biotopes than would be predicted.

Firth of Clyde Biodiversity Review
186
0 20 40 60 80 100Number of biotopes
30
40
50
60
70
80
90
100De
lta+
8
30
94319
332
334
338
344
346
350
352
353 361370
375
377
378
379
385
388
389
390
391
392
394395
396
397
398
401
402
405
408
409410
413
417
418
419420
422
423424
426
429
431
432
Figure A6.12. Average biotope distinctness (∆+) funnel plot showing data points for all hexagons. The plotted funnel indicates the 95% confidence intervals for random ‘expected’ distinctness based on 1000 random permutations of the same number of biotopes from a regional biotopes master list. Data points outside this area depart significantly from random expectation (Clarke & Warwick, 1998).
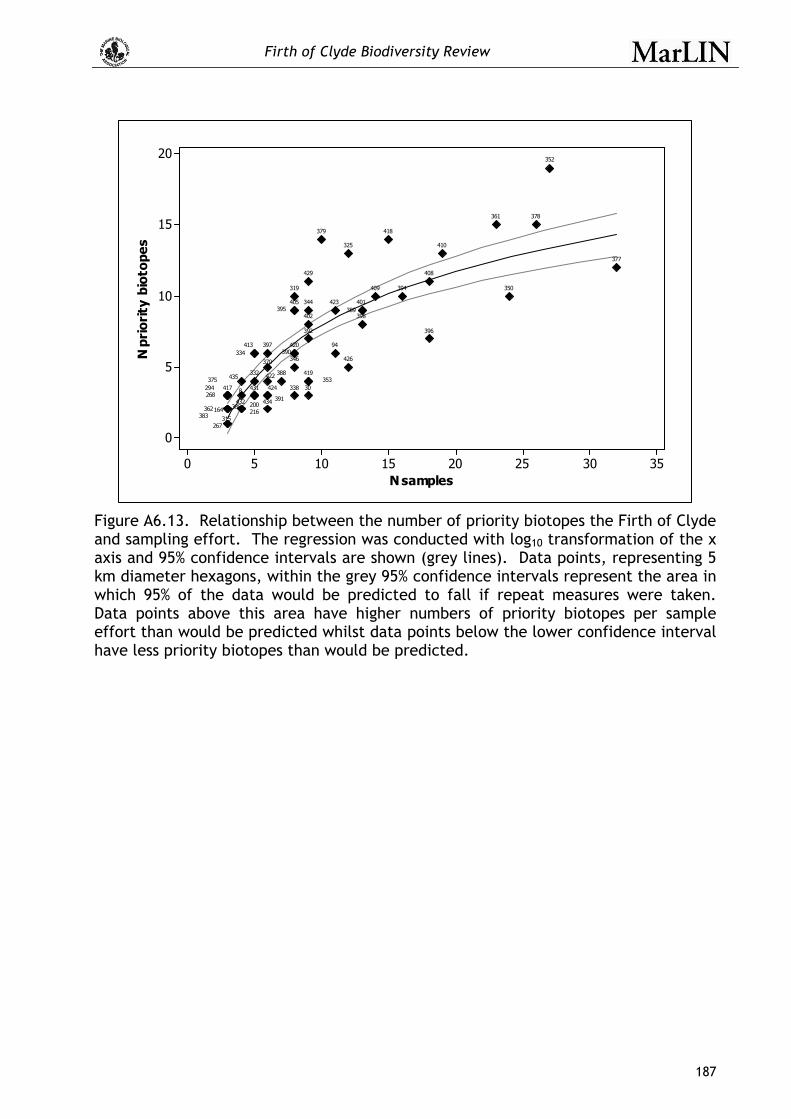
Firth of Clyde Biodiversity Review
187
35302520151050
20
15
10
5
0
N samples
N pr
iori
ty b
ioto
pes
435
434432
431
429
426
424
423
422
420
419
418
417
413
410
409
408
405
402
401
398
397
396
395
394
392
391
390
389
388
385383
379
378
377
375
370
362
361
353
352
350
346
344
338
334
332
325
319
315
294268
267
216200
164
94
308
Figure A6.13. Relationship between the number of priority biotopes the Firth of Clyde and sampling effort. The regression was conducted with log10 transformation of the x axis and 95% confidence intervals are shown (grey lines). Data points, representing 5 km diameter hexagons, within the grey 95% confidence intervals represent the area in which 95% of the data would be predicted to fall if repeat measures were taken. Data points above this area have higher numbers of priority biotopes per sample effort than would be predicted whilst data points below the lower confidence interval have less priority biotopes than would be predicted.

Firth of Clyde Biodiversity Review
188
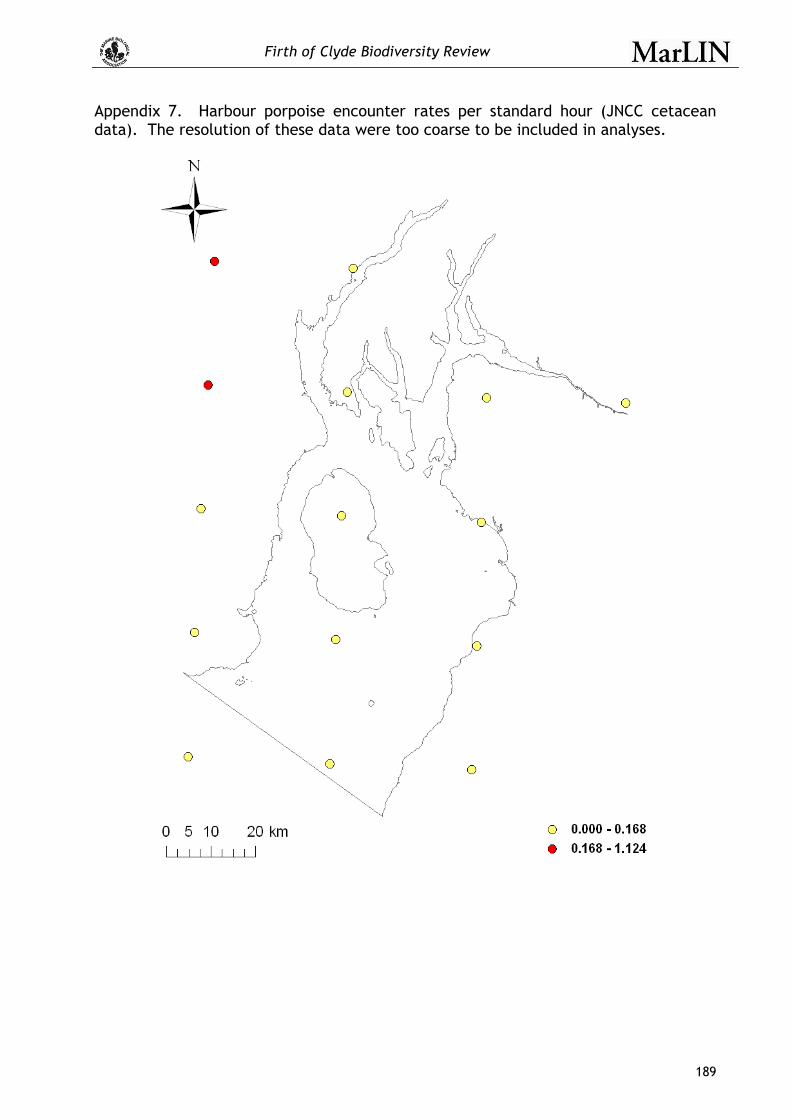
Firth of Clyde Biodiversity Review
189
Appendix 7. Harbour porpoise encounter rates per standard hour (JNCC cetacean data). The resolution of these data were too coarse to be included in analyses.

Firth of Clyde Biodiversity Review
190

Firth of Clyde Biodiversity Review
191
Appendix 8. Hotspot Annexes.
Species Hotspot Results
Hotspot 1 Hotspot 2 Hotspot 3 Hotspot 4 Hotspot 5 Hotspot 6 Hotspot 7 Hotspot 8 Hotspot 9 Hotspot 10 Hotspot 11
Hexagon id 429 422 378 363 353 346 320 243 229 223 192
Location name Mouth of Loch Shira
Northern Loch Fyne
Loch Striven East of Dunoon in the upper Firth of Clyde
Loch Striven Kyles of Bute
East of Rothesay
Irvine Bay Irvine Bay Irvine Bay Irvine Bay
Occurrence within MPA (including voluntary)
Upper Loch Fyne - SNH Marine Consultation Area
Amount of coastline (km)
5.157537 4.536602 8.198506 5.247338 5.296627 8.389386 0.404858 0.579602 0.000000 0.000000 0.000000
Area of heagon (km2)
7.013352 5.262960 3.100042 10.619183 4.264731 4.070534 12.150104 12.151708 12.178482 12.178482 12.178482
Number of Physiographic types
11 6 3 11 6 8 12 10 8 11 12
Physiographic Diversity
1.947294 1.534531 0.723723 1.899168 1.182951 1.749472 1.726022 2.248739 2.289345 1.705601 1.845180
Species Richness Mean
3 3 3 3 3 3 3 3 3 3 3
Taxonomic distinctiveness mean
3 3 3 3 3 3 2 1 2 2
Priority species score
2 2 2 2 2 2 3 3 3 3 3
Species Hotspot 3 3 3 3 3 3 3 3 3 3 3
Quality High Medium High High High High High High High High High
Confidence High Medium High High High High High High High High High
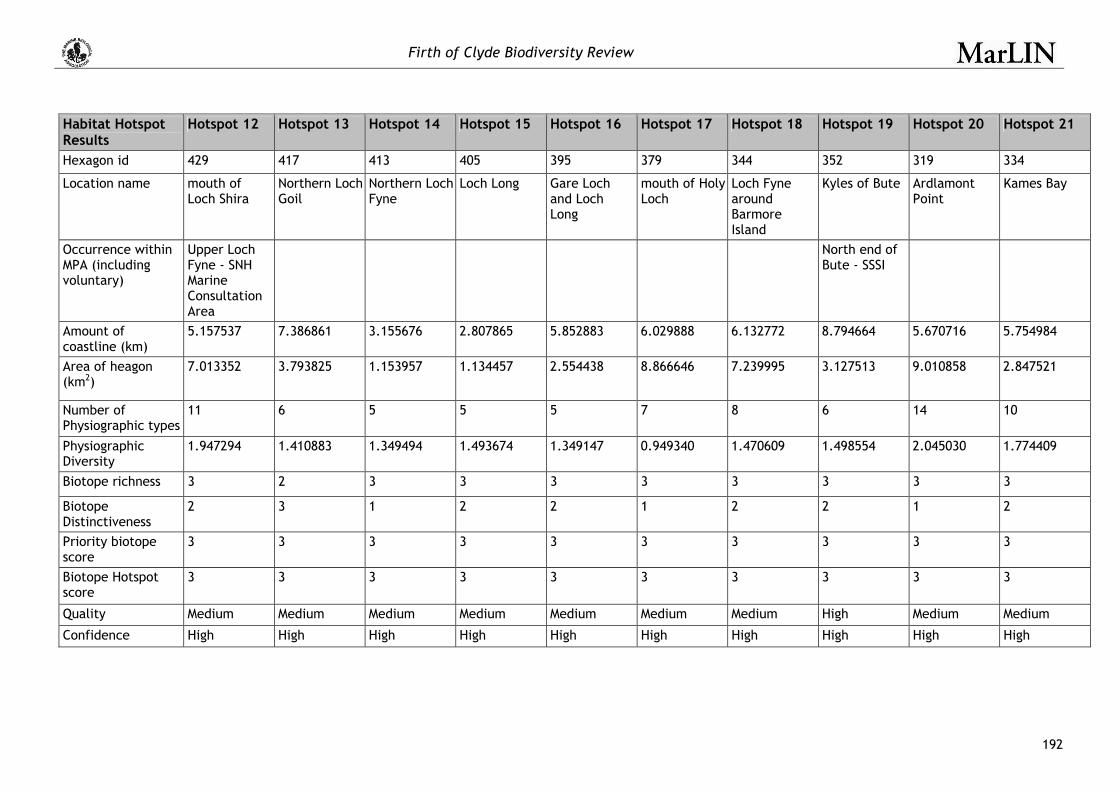
Firth of Clyde Biodiversity Review
192
Habitat Hotspot Results
Hotspot 12 Hotspot 13 Hotspot 14 Hotspot 15 Hotspot 16 Hotspot 17 Hotspot 18 Hotspot 19 Hotspot 20 Hotspot 21
Hexagon id 429 417 413 405 395 379 344 352 319 334
Location name mouth of Loch Shira
Northern Loch Goil
Northern Loch Fyne
Loch Long Gare Loch and Loch Long
mouth of Holy Loch
Loch Fyne around Barmore Island
Kyles of Bute Ardlamont Point
Kames Bay
Occurrence within MPA (including voluntary)
Upper Loch Fyne - SNH Marine Consultation Area
North end of Bute - SSSI
Amount of coastline (km)
5.157537 7.386861 3.155676 2.807865 5.852883 6.029888 6.132772 8.794664 5.670716 5.754984
Area of heagon (km2)
7.013352 3.793825 1.153957 1.134457 2.554438 8.866646 7.239995 3.127513 9.010858 2.847521
Number of Physiographic types
11 6 5 5 5 7 8 6 14 10
Physiographic Diversity
1.947294 1.410883 1.349494 1.493674 1.349147 0.949340 1.470609 1.498554 2.045030 1.774409
Biotope richness 3 2 3 3 3 3 3 3 3 3
Biotope Distinctiveness
2 3 1 2 2 1 2 2 1 2
Priority biotope score
3 3 3 3 3 3 3 3 3 3
Biotope Hotspot score
3 3 3 3 3 3 3 3 3 3
Quality Medium Medium Medium Medium Medium Medium Medium High Medium Medium
Confidence High High High High High High High High High High

Firth of Clyde Biodiversity Review
193
Combined Hotspot results Hotspot 22
Hexagon id 429
Location name mouth of Loch Shira
Occurrence within MPA (including voluntary) Upper Loch Fyne - SNH Marine Consultation Area
Amount of coastline (km) 5.157537
Area of heagon (km2) 7.013352
Number of Physiographic types 11
Physiographic Diversity 2
Species Richness Mean 3
Taxonomic distinctiveness mean 2
Priority species score 3
Species Hotspot 3
Biotope richness 3
Biotope Distinctiveness 2
Priority biotope score 3
Biotope Hotspot score 3
Quality High
Confidence High
Appendix 9. Results for 5 hexagons for extra records including records to genus level in analysis.
Hex ID 58 162 230 327 385Total extra genera represented 15 1 18 21 4