Embed Size (px)
Citation preview

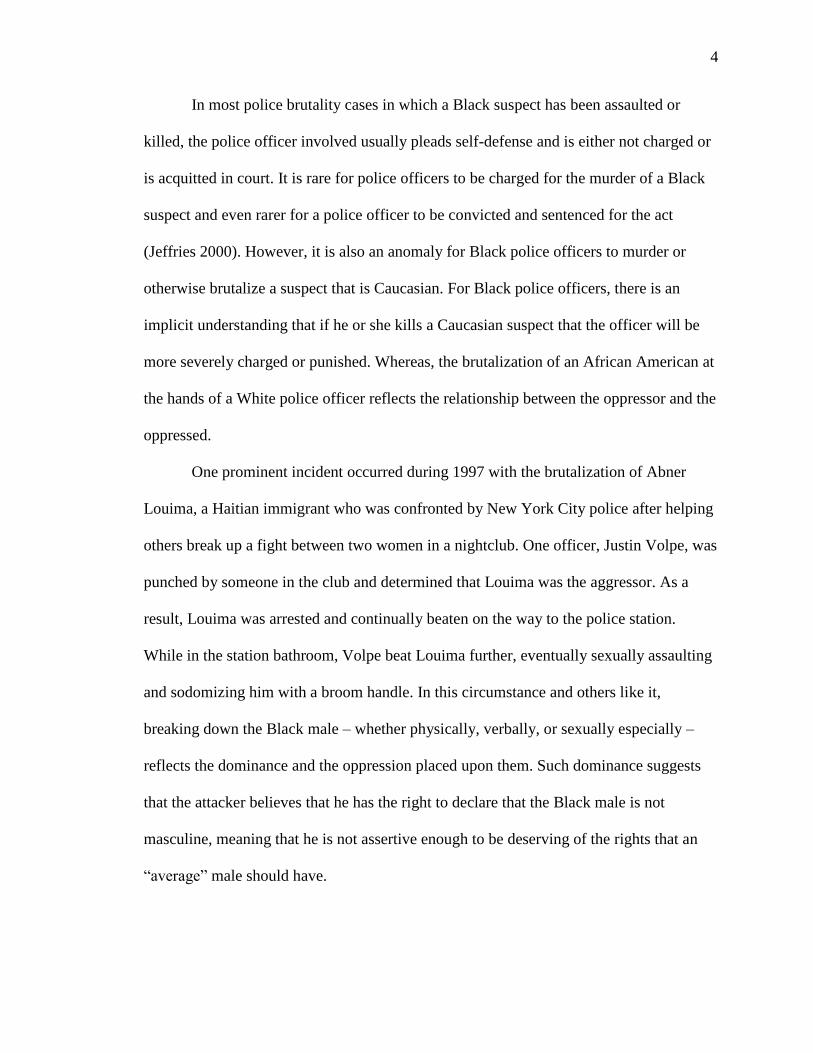
Olivia D Dorsey. A Visual Analysis of Phases of Police Brutality Against Unarmed
African Americans from 1979 to 2014. A Master’s Project for the M.S. in I.S. degree.
November, 2015. 31 pages. Advisor: David Gotz
This report describes the process used to create an online resource that compiles a sample
dataset regarding police brutality incidents against African Americans between 1979 to
the present and also analyzes the similarity between these incidents by contextualizing
them into “phases of police brutality.” However, this dataset is only a small sample of the
total population and may not be entirely representative of that population. Data regarding
these incidents were collected from various news sources including crowdsourced
database efforts, local news websites, and national news websites.
The online resource can be accessed via the following address:
http://visualizingpolicebrutality.org/
Headings:
Websites – Design
Police Brutality
Data Visualization
Visual Analytics

A VISUAL ANALYSIS OF PHASES OF POLICE BRUTALITY AGAINST
UNARMED AFRICAN AMERICANS FROM 1979 TO 2014
by
Olivia D. Dorsey
A Master’s paper submitted to the faculty
of the School of Information and Library Science
of the University of North Carolina at Chapel Hill
in partial fulfillment of the requirements
for the degree of Master of Science in
Information Science.
Chapel Hill, North Carolina
November 2015
Approved by
_______________________________________
David Gotz

1
Table of Contents
Table of Contents ................................................................................................................ 1
Introduction ......................................................................................................................... 2 Literature Review................................................................................................................ 3
1.1 Police Brutality ..................................................................................................... 3
1.2 The Relationship African Americans and Law Enforcement .............................. 5
1.3 The Role of Race in Creating Suspects ................................................................ 6
2.1 Defining Visual Analytics......................................................................................... 7
2.2 Design Principles in Visual Analytics ...................................................................... 8
2.2.1 Tools ................................................................................................................ 10
2.2.2 Usability as a Factor for Evaluation................................................................. 11
3.1 Storytelling as a Vehicle for Analysis .................................................................... 11
Methodology ..................................................................................................................... 12 Creating the Project........................................................................................................... 16 Evaluation ......................................................................................................................... 21
Discussion and Conclusion ............................................................................................... 24
Bibliography ..................................................................................................................... 26

2
Introduction
In recent years, incidents involving African Americans who have been brutalized
by police have received a fair amount of attention by the news media. One could say that
the current focus on police brutality has been catalyzed by the shooting death of Michael
Brown on August 9, 2014 in Ferguson, Missouri. Not only has the incident concentrated
the media and subsequently, the public’s attention on police brutality but it has also given
further insight into the relationship between the African American community and law
enforcement.
While police brutality against this group of individuals has existed for a long
period of time, all of the data surrounding these incidents is very siloed, being available
only through resources such as news websites and very few crowdsourced efforts. Due to
the lack of the reliability of reporting state and local cases of police brutality by both
victims and the police, there is currently not a comprehensive source for data related to
police brutality incidents against African Americans (Turque et al. 1991). However, it is
not unknown that there is a relationship between one’s race and the number of
unfavorable interactions that he/she is likely to have with police. In 1997, the Bureau of
Justice conducted a survey that concluded that Blacks were nearly “70 percent more
likely to have had contact with police than whites (Bureau of Justice 1997; Jeffries
2001).” This lack of data regarding the details of these incidents deprives research
communities, law enforcement agencies, and public communities of important
information and conclusions about this information. While news websites do a fairly

3
good job of reporting these events, each source is isolated and each incident is not
reported in the amount of detail that one may want. More than that, incidents that have
occurred in the decades before the creation of the World Wide Web have fallen through
the cracks.
Literature Review
1.1 Police Brutality
Police brutality is defined as “the use of excessive physical force or verbal assault
and psychological intimidation” (Walker 2011). According to Marger (2012), “racism is
an ideology, or belief system, designed to justify and rationalize racial and ethnic
inequality.” Both concepts have existed for a long period of time, with the intent to keep
African Americans subjugated and submissive. Specifically, Gunar Myrdal (1994), the
author of An American Dilemma, argued that using law enforcement to do so has always
been a part of U.S. history. In the past, police were used to not only capture runaway
slaves, but also to enforce segregation during the Jim Crow era. (Murphy & Wood 1984).
Officials who would capture runaway slaves would specifically seek out individuals of
color, thus allowing for such racism to continue. After the emancipation of slaves in
1865, Jim Crow laws would serve to segregate and restrict African Americans from
engaging in liberties that were available to White Americans. Although the Jim Crow
laws ended in 1965, this relationship between the oppressor and the oppressed has
endured and gives insight as to why African Americans are distrustful of law
enforcement.
Law enforcement has also historically held a prominent role in sustaining and
encouraging mobs and lynchings against African Americans.
4
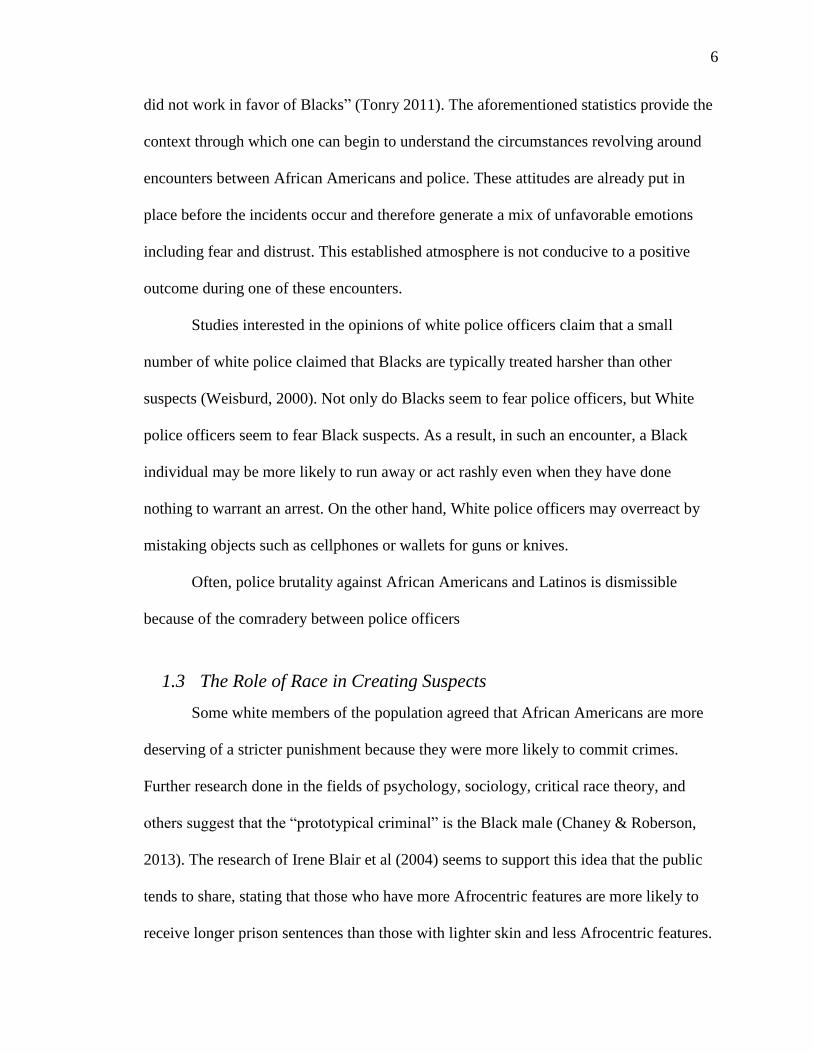
In most police brutality cases in which a Black suspect has been assaulted or
killed, the police officer involved usually pleads self-defense and is either not charged or
is acquitted in court. It is rare for police officers to be charged for the murder of a Black
suspect and even rarer for a police officer to be convicted and sentenced for the act
(Jeffries 2000). However, it is also an anomaly for Black police officers to murder or
otherwise brutalize a suspect that is Caucasian. For Black police officers, there is an
implicit understanding that if he or she kills a Caucasian suspect that the officer will be
more severely charged or punished. Whereas, the brutalization of an African American at
the hands of a White police officer reflects the relationship between the oppressor and the
oppressed.
One prominent incident occurred during 1997 with the brutalization of Abner
Louima, a Haitian immigrant who was confronted by New York City police after helping
others break up a fight between two women in a nightclub. One officer, Justin Volpe, was
punched by someone in the club and determined that Louima was the aggressor. As a
result, Louima was arrested and continually beaten on the way to the police station.
While in the station bathroom, Volpe beat Louima further, eventually sexually assaulting
and sodomizing him with a broom handle. In this circumstance and others like it,
breaking down the Black male – whether physically, verbally, or sexually especially –
reflects the dominance and the oppression placed upon them. Such dominance suggests
that the attacker believes that he has the right to declare that the Black male is not
masculine, meaning that he is not assertive enough to be deserving of the rights that an
“average” male should have.

5
Nonetheless, this blatant disregard for the Black body and the destruction of it
also has ties to slavery, as Blacks were considered to be chattel—commodities that were
only intended to be used and then disposed of when they were no longer useful. During
slavery, the subjugation of Black males was important for discouraging slaves from rising
up and rebelling against their masters. Oppressing the slave to the point where he had no
power ensured that the master stayed in control. The incident between Abner Louima and
Justin Volpe mirrors this, as the words that Volpe spoke to his colleagues after he
committed the act was “I took down a man tonight.” This conquering of the African
American body is an assertion of dominance, meant to ensure that he stays in his place.
Such assertions of dominance in the law enforcement community are well known against
dangerous suspects, but are also known to occur when encountering African American
suspects, regardless of the danger they may or may not actually pose.
1.2 The Relationship African Americans and Law Enforcement
There is a consistent trend of hostility between African Americans and members
of law enforcement. Jeffries (2001) claims that there were at least twenty-two high profile
cases of white police violence against African American males between 1991 and 2001.
Holmes and Cobb (2003) further suggest that “police-minority tensions stem inevitably,
from enduring racial and ethnic divisions in American Society.”
The difference between the relationships of Blacks and police, as opposed to the
relationships of Whites and police become more apparent when looking at Public
Opinion surveys. For instance, according to Tonry (2011)’s findings, 68% of Whites and
18% of Blacks stated that they had confidence in law enforcement. Additional findings
show that 38% of Whites and 89% of Blacks believed that “the criminal justice system
6
did not work in favor of Blacks” (Tonry 2011). The aforementioned statistics provide the
context through which one can begin to understand the circumstances revolving around
encounters between African Americans and police. These attitudes are already put in
place before the incidents occur and therefore generate a mix of unfavorable emotions
including fear and distrust. This established atmosphere is not conducive to a positive
outcome during one of these encounters.
Studies interested in the opinions of white police officers claim that a small
number of white police claimed that Blacks are typically treated harsher than other
suspects (Weisburd, 2000). Not only do Blacks seem to fear police officers, but White
police officers seem to fear Black suspects. As a result, in such an encounter, a Black
individual may be more likely to run away or act rashly even when they have done
nothing to warrant an arrest. On the other hand, White police officers may overreact by
mistaking objects such as cellphones or wallets for guns or knives.
Often, police brutality against African Americans and Latinos is dismissible
because of the comradery between police officers
1.3 The Role of Race in Creating Suspects
Some white members of the population agreed that African Americans are more
deserving of a stricter punishment because they were more likely to commit crimes.
Further research done in the fields of psychology, sociology, critical race theory, and
others suggest that the “prototypical criminal” is the Black male (Chaney & Roberson,
2013). The research of Irene Blair et al (2004) seems to support this idea that the public
tends to share, stating that those who have more Afrocentric features are more likely to
receive longer prison sentences than those with lighter skin and less Afrocentric features.
7
Since Black males are frequently portrayed as “aggressive and criminal,” it is no surprise
that police will impression these same characteristics on Black people in real-life
encounters.
African Americans have frequently accused police officers of racial profiling and
of assaulting innocent African American suspects. In fact, according to several
researchers, Blacks are more likely to not only be involved in incidents of police
brutality, but are also more likely to make complaints regarding it (Smith & Holmes,
2003; Kane & White 2009).
2.1 Defining Visual Analytics
Thomas and Cook define visual analytics as “the science of analytical reasoning
facilitated by interactive visual interfaces (Thomas and Cook 2005).” While this
definition is adequate, I propose an addition: Visual Analytics must also include a
communicative portion that allows results to not only be displayed, but also to be shared
and discussed in order to make changes to the status quo. The distinguishing factor
between visual analytics and a similar field, data visualization, is that visual analytics
accounts for the analysis of data (Keim 2008). The field of data visualization solely
focuses on how the data is displayed.
According to Keim et al (2008), the purpose of visual analytics is to make
“processing data and information transparent for an analytic discourse.” Depending on
the user’s task, the user decides what data he or she views and how the data is analyzed.
Being able to make such decisions places the user in control and allows him or her to
complete a task with satisfaction.

8
The process of visualizing data is important in terms of effectively understanding
a dataset as well as the context that surrounds it. Such understanding allows those who
are analyzing the data to communicate findings and make decisions that support the
conclusions made.
Visual Analytics is frequently studied in order to make visualizations composed
of large, complex amounts of data easier to navigate and analyze. While my dataset is
much smaller than sets that are considered to be a part of the realm of “big data,”
analyzing a sample of incidents during this time period also proves valuable as it sets the
foundation for how this type of data should be reported, collected, and visualized in the
future for multiple audiences.
2.2 Design Principles in Visual Analytics
There are a variety of different techniques for conveying visualizations and much
research has been done on when to use certain ones. The use of a particular technique
typically depends upon the tasks that the user will need to complete.
When creating a visualization, one must keep in mind that users are more
receptive of aesthetically-pleasing visualizations. A study mentioned in the Proceedings
of the ACM SIGCHI Conference on Human Factors in Computing Systems concluded
that there was a correlation of .91 between a display’s usefulness and its perceived beauty
by the user (Tractinsky, 1997). The initial attraction that a user feels towards a
visualization is useful for gaining the user’s trust, but can also help the reader complete
his or her tasks, as well as interpret and explore the data in a comfortable environment.
According to Cawthon and Moere, users will spend more time understanding and
interpreting visualizations that are better designed (2007). This means that they are more

9
likely to accept and work through what might be more frustrating situations in the context
of unattractive visualization environments.
However, a well-designed visual must not be so complex that the user cannot
navigate the interface. In fact, simplification is a necessary technique for any
visualization. A study in 1979 showed that the recall of information displayed decreases
when the complexity of the visualization increases (Lusk & Kersnick, 1979). This is
because overloading the user with details can be distracting, making it more difficult to
discern the meaning of the visualization. If done well, simplification can effortlessly
guide the user to other aspects of visualization that enhance the experience.
Simplification also provides the opportunity to emphasize other pieces of data.
Emphasizing certain points of a visualization comes down to the basic principle of
creating contrast, or differences, within the display (Evergreen & Metzner, 2013).
Other elements that help support the emphasis of data include animation, weight,
and color. With more data visualizations being present on the web, users increasingly
expect motion and interactivity to accompany data (Evergreen & Metzner, 2013).
Animation can refocus the attention of the user and allow them to discern even subtle
differences in changing data. Weight can highlight data that is interpreted as significant
and it can also indicate to the user that he or she has made a selection. In terms of
utilizing color to emphasize data, it is important to focus on the contrast that the colors
have and to avoid choosing colors that are too distracting to the user’s experience
(Evergreen & Metzner, 2013).
10
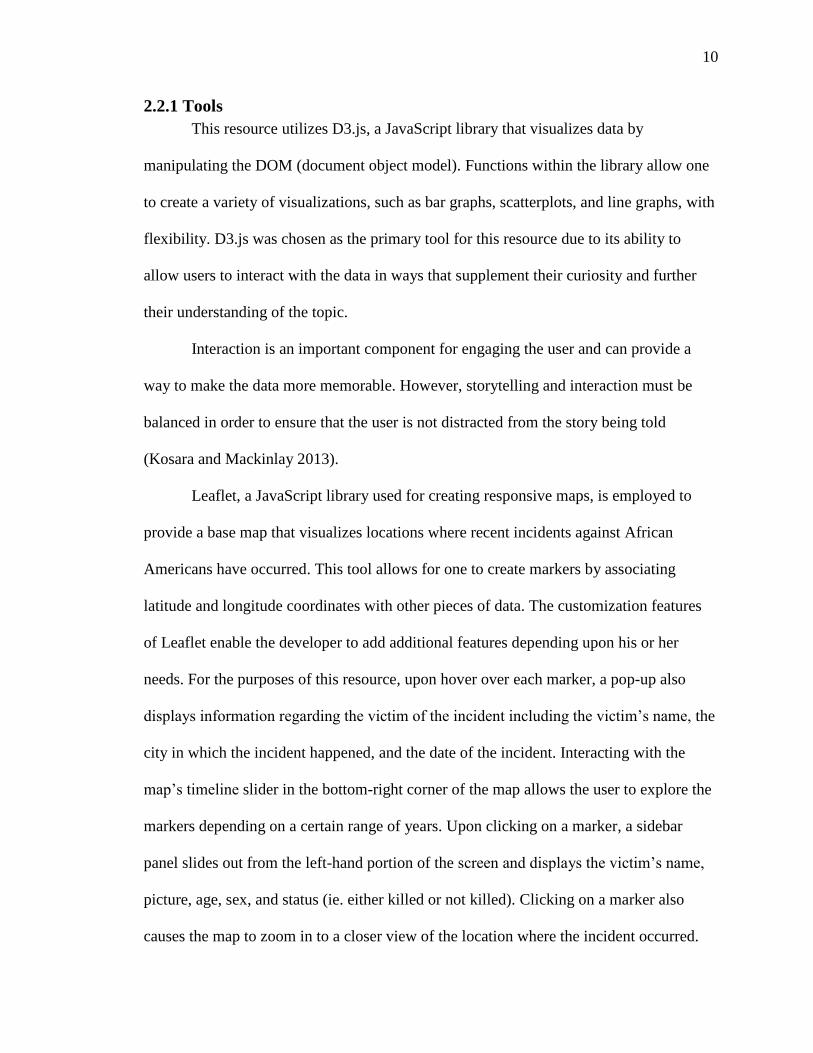
2.2.1 Tools
This resource utilizes D3.js, a JavaScript library that visualizes data by
manipulating the DOM (document object model). Functions within the library allow one
to create a variety of visualizations, such as bar graphs, scatterplots, and line graphs, with
flexibility. D3.js was chosen as the primary tool for this resource due to its ability to
allow users to interact with the data in ways that supplement their curiosity and further
their understanding of the topic.
Interaction is an important component for engaging the user and can provide a
way to make the data more memorable. However, storytelling and interaction must be
balanced in order to ensure that the user is not distracted from the story being told
(Kosara and Mackinlay 2013).
Leaflet, a JavaScript library used for creating responsive maps, is employed to
provide a base map that visualizes locations where recent incidents against African
Americans have occurred. This tool allows for one to create markers by associating
latitude and longitude coordinates with other pieces of data. The customization features
of Leaflet enable the developer to add additional features depending upon his or her
needs. For the purposes of this resource, upon hover over each marker, a pop-up also
displays information regarding the victim of the incident including the victim’s name, the
city in which the incident happened, and the date of the incident. Interacting with the
map’s timeline slider in the bottom-right corner of the map allows the user to explore the
markers depending on a certain range of years. Upon clicking on a marker, a sidebar
panel slides out from the left-hand portion of the screen and displays the victim’s name,
picture, age, sex, and status (ie. either killed or not killed). Clicking on a marker also
causes the map to zoom in to a closer view of the location where the incident occurred.
11
The data underlying all of the visualizations are contained in a MySQL database.
This allows the data to be stored in a manner that is organized enough to allow for easy
access through PHP and JavaScript. By accessing the data through PHP, I am able to
format it into JSON and further parse it based on the needs of each specific tool.
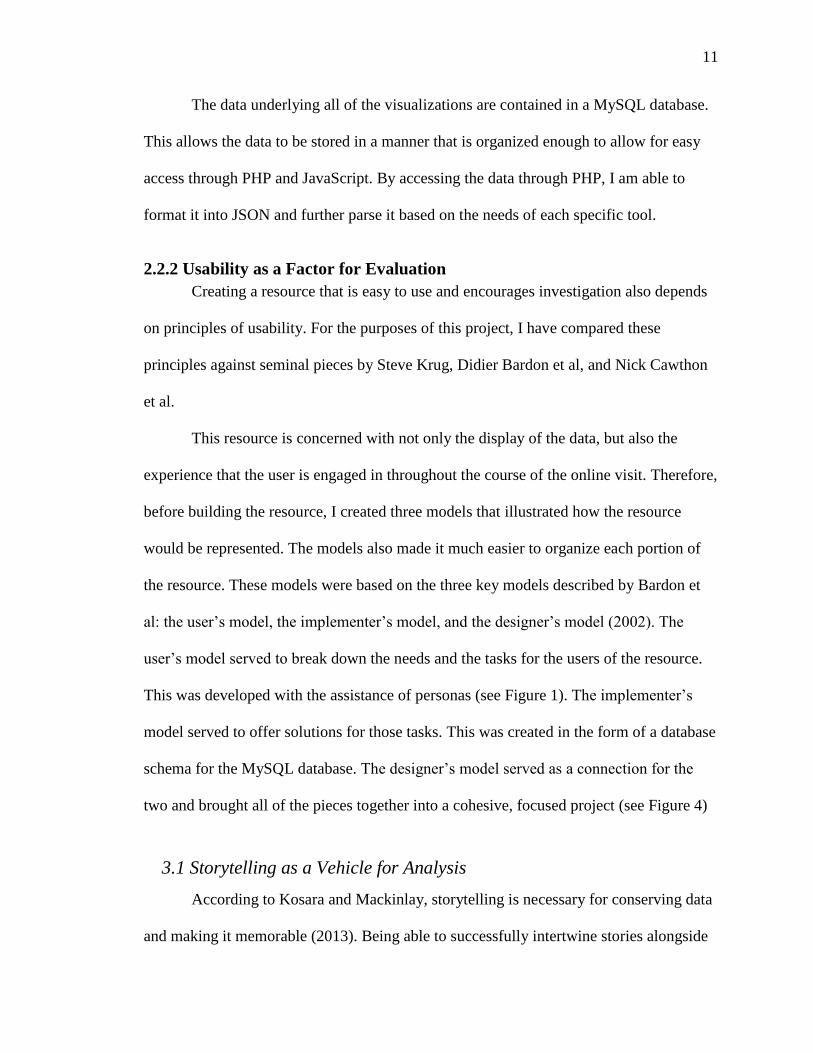
2.2.2 Usability as a Factor for Evaluation
Creating a resource that is easy to use and encourages investigation also depends
on principles of usability. For the purposes of this project, I have compared these
principles against seminal pieces by Steve Krug, Didier Bardon et al, and Nick Cawthon
et al.
This resource is concerned with not only the display of the data, but also the
experience that the user is engaged in throughout the course of the online visit. Therefore,
before building the resource, I created three models that illustrated how the resource
would be represented. The models also made it much easier to organize each portion of
the resource. These models were based on the three key models described by Bardon et
al: the user’s model, the implementer’s model, and the designer’s model (2002). The
user’s model served to break down the needs and the tasks for the users of the resource.
This was developed with the assistance of personas (see Figure 1). The implementer’s
model served to offer solutions for those tasks. This was created in the form of a database
schema for the MySQL database. The designer’s model served as a connection for the
two and brought all of the pieces together into a cohesive, focused project (see Figure 4)
3.1 Storytelling as a Vehicle for Analysis
According to Kosara and Mackinlay, storytelling is necessary for conserving data
and making it memorable (2013). Being able to successfully intertwine stories alongside

12
of data visualizations can ensure that data is presented in a clear and effective way.
Moreover, when done successfully, a user will leave the visualization having learned and
understood the information presented. Storytelling also provides the opportunity to
encourage users to look beyond the text and have a more impactful experience while
looking at the data.
Work by Sturm suggests that the power of caring is crucial to creating a story that
others relate to on a deeper level. By creating a sense of care, one can engage the user in
a way that makes him or her get engrossed in the information and take action (Sturm,
2012). By wrapping facts into a context, as through a story, people are more likely to
understand those facts.
Storytelling requires not only a focus on the plot, but also a focus on the
characters. People tend to care more and sympathize with characters who have
unfortunate circumstances happen to them (Gerke, 2010). People also care more about
characters whose quirks make them more relatable.
Kosara and Mackinlay suggest that the evaluation of the stories that visualizations
tell should be measured against the traditional evaluations for both storytelling and
visualizations (2013).
Methodology
As stated previously, police brutality is defined as “the use of excessive physical
force or verbal assault and psychological intimidation” (Walker 2011). This resource,
“Visualizing Police Brutality,” focuses on the climax of all three in which for the victim
the end result is physical assault or death.

13
This collective resource will be valuable for those who are trying to navigate
these occurrences and understand why they are happening, with the possibility of
instigating change to current police protocols. This resource will also serve as a starting
point for compiling and visualizing this data so that it may be built upon in the future.
These incidents are not abnormal occurrences and as such, this resource explores
the phases in which these particular acts of violence occur. I have defined these phases in
four sections: 1. The Initial Build-up, 2. The Act of Brutality, 3. Immediate Reactions,
and 4. The Subsequent Aftermath. The Initial Build-up examines the historical
relationship between the African American community and law enforcement and how
this relationship may further escalate police brutality incidents. The Act of Brutality
discusses racial profiling and looks the incidents as a whole in an effort to understand
which age groups are involved in these incidents and how many victims die in these
incidents. Immediate Reactions utilizes the Twitter API in order to examine the content
of tweets from users during the Michael Brown shooting on August 9, 2014 and the
Miriam Carey shooting on October 3, 2013. These users were located in Ferguson and
Washington, D.C. respectively during these incidents. The Aftermath section discusses
the police brutality court cases in my dataset and also touches upon media perceptions of
victims.
The user has the ability to explore the data at each of these levels. Analyzing each
of these phases within a sample of incidents between 1979 and 2014 reveals the
similarities between each of these cases and supports the claim that what is truly
abnormal is each result. Each of the aforementioned phases is similar to that of Dr.
14
Katheryn K. Russell’s roundabout, which consists of a series of predictable events that
follow an incident of police brutality (Russell 2000).
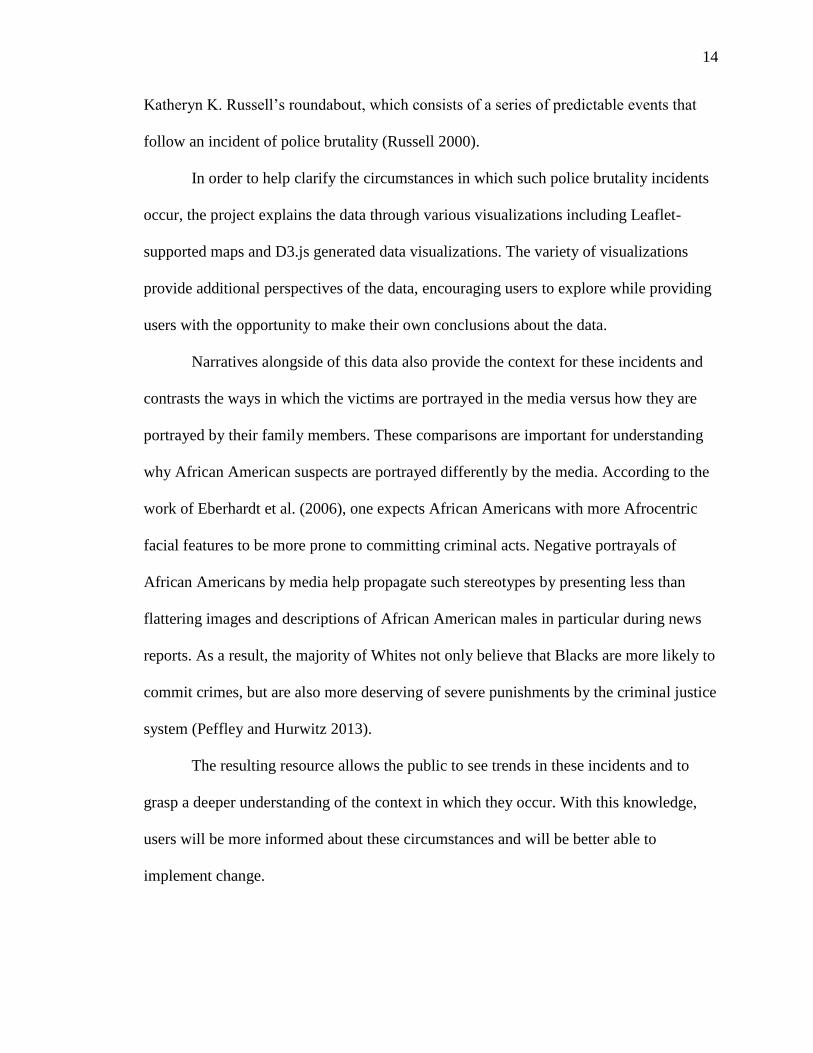
In order to help clarify the circumstances in which such police brutality incidents
occur, the project explains the data through various visualizations including Leaflet-
supported maps and D3.js generated data visualizations. The variety of visualizations
provide additional perspectives of the data, encouraging users to explore while providing
users with the opportunity to make their own conclusions about the data.
Narratives alongside of this data also provide the context for these incidents and
contrasts the ways in which the victims are portrayed in the media versus how they are
portrayed by their family members. These comparisons are important for understanding
why African American suspects are portrayed differently by the media. According to the
work of Eberhardt et al. (2006), one expects African Americans with more Afrocentric
facial features to be more prone to committing criminal acts. Negative portrayals of
African Americans by media help propagate such stereotypes by presenting less than
flattering images and descriptions of African American males in particular during news
reports. As a result, the majority of Whites not only believe that Blacks are more likely to
commit crimes, but are also more deserving of severe punishments by the criminal justice
system (Peffley and Hurwitz 2013).
The resulting resource allows the public to see trends in these incidents and to
grasp a deeper understanding of the context in which they occur. With this knowledge,
users will be more informed about these circumstances and will be better able to
implement change.
15
Building for specific users
During the course of this project, I was forced to place myself in the shoes of a
potential user and think about what a user of this resource would want to get from it.
Developing a set of personas was useful for this pursuit. A user would want to see when
and where incidents have occurred and what happened as a result of each incident. Where
do these incidents occur? Did the victim die? Was the officer who killed the victim
acquitted or convicted? How old was the victim? The answers to these questions would
have the most priority in this project, therefore visualizations that related to these
questions would need to be the most visible. This is why I decided to place the Leaflet
map of each of these incidents on the homepage.
The majority of these users would likely not be experts in utilizing technology nor
would they be experts in knowing everything about these events. As a result, any
extraneous information would make navigation of the resource confusing. From here, I
decided that I would need to use layman’s terms as much as possible to present my
findings. For users who are more familiar with police brutality and critical race theory,
they have the option of following sources that I will have cited at the bottom of each page
and on the “Resources” page of the website.

16
Personas for “Visualizing Police Brutality”
Figure 1
Creating the Project
This resource contains several components that were accounted for, including:
data collection, data analysis and visualization, design of the web resource, and delivery

17
of the narrative prose. Each required a significant amount of attention to detail to ensure
that everything was displayed as accurately and unbiased as possible. Below, I further
explain how each component was tackled.
Data Collection
Due to the limitations of web crawlers and parsers, the data for this resource was
collected from a variety of sources, including the FatalEncounters database (Burghart,
2012), Deadspin Police-Shooting Database (Deadspin, 2014), and local and national
news websites. The data was also collected manually, requiring human scanning of
various news articles. Searching was done primarily through Google. Keywords that were
used to look for these articles include varied combinations of “African American” or
“Black” and “unarmed” and “police” or “police brutality.” For instance, one such search
query was: “police unarmed African American.” This manual method was done to ensure
that cases not recorded in the aforementioned resources would be accounted for.
Due to the method of data collection and the incompleteness of some of the
resources used, the correlations made with this data will likely be exposed to selection
bias. Not only that, but there will likely be incidents that have been missed due to the
manual collection method that I and the creators of the aforementioned resources used.
Therefore, this sample of data is not guaranteed to be representative of all cases of police
brutality against unarmed African Americans. It is only my sincere hope that this project
will be a springboard from which an accurate, reliable resource can be created.
Data collection itself is a very time-consuming and important process. However,
during the process, I collected information regarding the victim of each incident,

18
including: the first and last name of the individual, the date of the incident, the latitude
and longitude of the area in which the incident happened, the sex and age of the
individual, the state where the incident occurred, the state’s region (ie. Northeast),
whether the individual was killed or not (yes or no), whether the individual was mentally
ill (yes or no), the URL of a photo of the individual, and the result of the court case
regarding the incident (if applicable).
I compiled both the manually collected data and the data from sources into two
Microsoft Excel spreadsheets, one for information relating to victims and one for
information relating to incidents. Afterwards, I developed a database schema that
consisted of two tables: one for incidents and one for victims. Each incident and each
victim was assigned a primary key, however, the incident ID served as a foreign key to
tie the two tables together. This would ensure that multiple individuals being involved in
an event was a scenario that could be accounted for.
A screenshot of the incident table in the MySQL database.
Figure 2
Then the data was transplanted into the MySQL database. The data was later
pulled from the database with PHP and parsed with JSON in order to display it in the
visualizations on the website.

19
Data Analysis and Visualization
After the data was collected, I analyzed the data for any similarities or differences
between incidents or victims. This required me to ask questions of the data, such as: Is
there any correlation between a victim’s age and gender and how likely they are to be in
an incident? Or how many incidents has each state been involved with during this period
of time? These questions, as well as additional ones, were placed in the context of the
four phases of police brutality that I defined: 1. The Initial Build-up, 2. The Act of
Brutality, 3. Immediate Reactions, and 4. The Subsequent Aftermath.
A screenshot of “The Act of Brutality” page.
Figure 3
After data analysis, I designed the visualizations and coded them using D3. Due
to my target user groups, I decided to use simple graphs that were easy to understand.
This consisted of a bar graph, line graph, and two donut charts. Beyond using the graphs
to display the data, I also made the graphs interactive so that users could look at the data
in more detail. For instance, on “The Act of Brutality” page, I created a donut chart that
could filter the data based on the gender of the victims in my dataset. This can be seen in
further detail on the figure above.

20
Design of the Web Resource
Originally, I thought that I would be able to create this resource by using my
content management system (CMS) of choice, WordPress. Unfortunately, as I began
developing with WordPress, I started to realize that it was too restricting in terms of
being able to display the visualizations the way that I wanted to. While the CMS would
have saved time in terms of creating a solid structure, I decided to use Bootstrap to create
the framework of the website and incorporate HTML5, CSS3, PHP, MySQL, and jQuery
as needed. This would give me the flexibility that I needed to display the visualizations in
the clearest way for the user. Bootstrap would also inevitably give way to responsive
layouts that could be interacted with on mobile devices as well. After sketching out
various ways to design the resource, I was able to implement it using Bootstrap.
Initial sketches of the resource
Figure 4
21
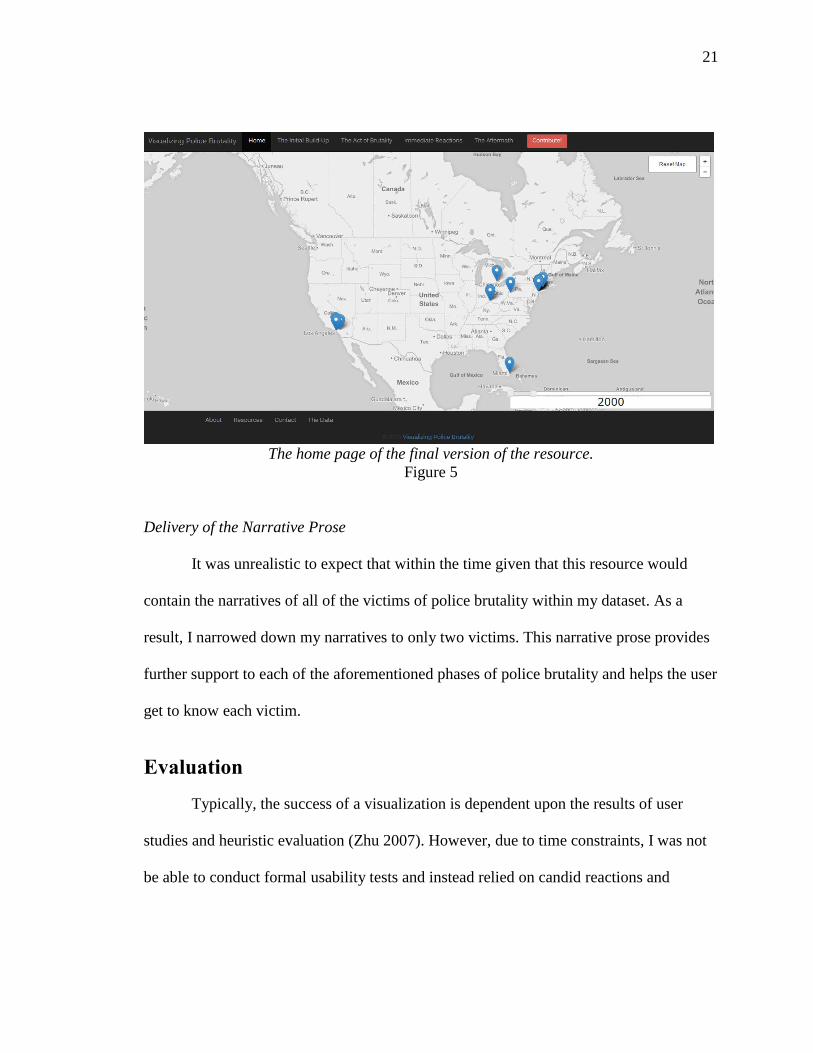
The home page of the final version of the resource.
Figure 5
Delivery of the Narrative Prose
It was unrealistic to expect that within the time given that this resource would
contain the narratives of all of the victims of police brutality within my dataset. As a
result, I narrowed down my narratives to only two victims. This narrative prose provides
further support to each of the aforementioned phases of police brutality and helps the user
get to know each victim.
Evaluation
Typically, the success of a visualization is dependent upon the results of user
studies and heuristic evaluation (Zhu 2007). However, due to time constraints, I was not
be able to conduct formal usability tests and instead relied on candid reactions and

22
responses from a small pool of users with varying knowledge of police brutality incidents
involving African Americans.
Feedback
Towards the end of my project, I began showing “Visualizing Police Brutality” to
various individuals. These individuals consisted of my classmates, as well as friends, and
all were willing to offer their opinion on the resource.
While navigating the site, one person
suggested that there should be a rollover
feature on the map of incidents on the
homepage. This way, visitors to the website
would not have to click on each marker to
find out more information about the victim. I
agreed with this statement, as clicking on
every marker just to find out the name of a victim
could be very cumbersome. After implementing the
rollover feature by editing the Leaflet JS code, it became much easier to browse the map
and see the name of the victim, more details about the location of the incident, and the
date in which the incident occurred.
When I initially designed “Visualizing Police
Brutality,” I displayed all of the markers on the page
at once. Another individual I talked to suggested that in
order to garner more of an emotional response to the resource, I should create a way to
The timeline feature.
Figure 7
The rollover feature.
Figure 6
23
gradually increase the amount of markers that appear on the map. This would allow users
to feel the impact of how many incidents have occurred during the 35 year period. My
solution for this was to develop a timeline slider which would add or remove markers
depending on the year that the slider moved to and depending on the year of each
incident.
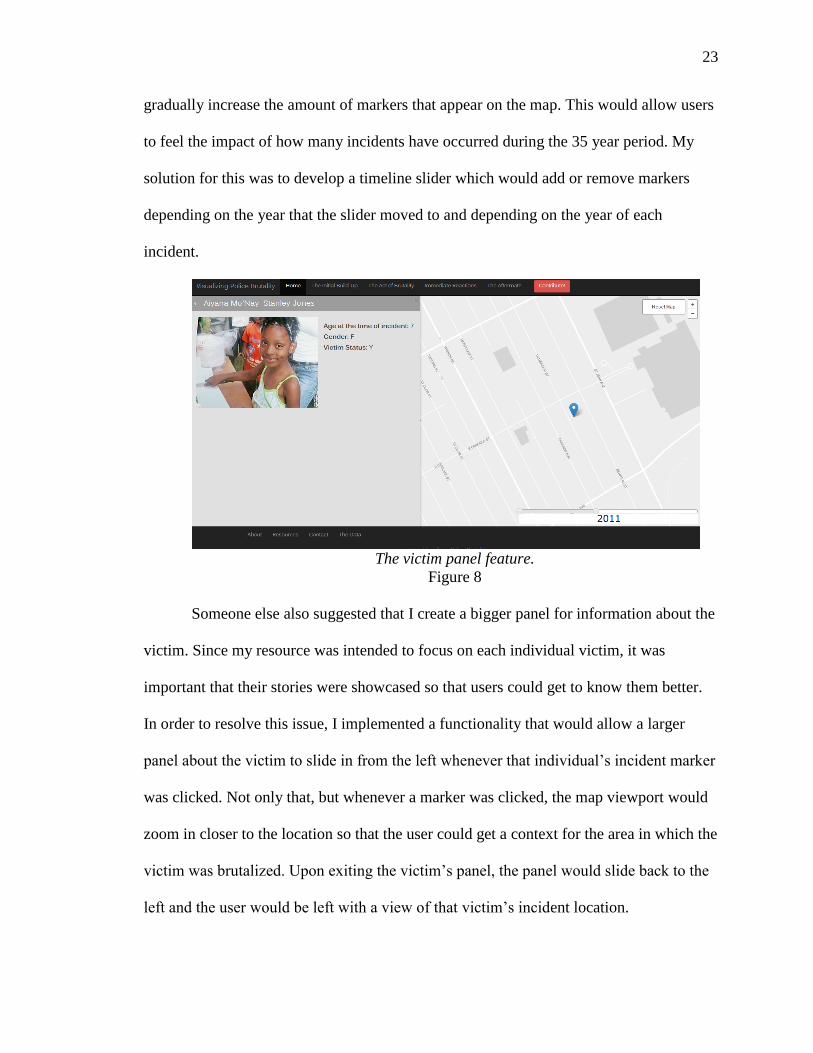
The victim panel feature.
Figure 8
Someone else also suggested that I create a bigger panel for information about the
victim. Since my resource was intended to focus on each individual victim, it was
important that their stories were showcased so that users could get to know them better.
In order to resolve this issue, I implemented a functionality that would allow a larger
panel about the victim to slide in from the left whenever that individual’s incident marker
was clicked. Not only that, but whenever a marker was clicked, the map viewport would
zoom in closer to the location so that the user could get a context for the area in which the
victim was brutalized. Upon exiting the victim’s panel, the panel would slide back to the
left and the user would be left with a view of that victim’s incident location.

24
Discussion and Conclusion
Lessons Learned
This project was an effort to create a comprehensive resource of incidents of
police brutality against unarmed African Americans. While the result has a long way to
go before becoming truly comprehensive, it serves as a solid foundation in the right
direction.
By utilizing techniques of visual analytics, data visualization, and storytelling, I
was able to effectively incorporate narratives and facts within my project while also
nurturing the curiosity of my users. Adding the map of incidents to the homepage
primarily assists with this goal by keeping users engaged with the content from the onset
of their visit.
The most difficult portion of the creation of this project involved collecting data.
Since web crawling is very limited, I was forced to rely on previous crowdsourcing
attempts and news websites to gather my data. Although I was careful not to incorporate
errors in my collection process, by using such manual methods of collecting, it is unlikely
that I collected the data without fault.
Going Forward
This project will likely not conclude after this stage, as I intend for it to expand
and become a comprehensive source for incidents of police brutality against African
Americans. Elements that will be expanded include the pages for each phase of police
brutality. For instance, “The Initial Build-up” page will include additional evidence
relating to the relationship between the African American community and law

25
enforcement, such as the dissection of anti-police rap lyrics. This section will also be
expanded with detailed demographic information so that users can begin to make
connections between these incidents and the communities that they occur in.
Crowdsourcing will become another new element of this resource. While it will
take significantly longer to develop features for accepting user content, this feature is
necessary to ensure that others can assist me in editing and maintaining the project’s
content. Moderation techniques will also need to be taken into consideration to help
ensure that people do not enter incorrect information or erase any information from the
resource.
The next phase of this project will also call for assistance from the families of
police brutality victims. This will provide them with the opportunity to tell others about
their family members in a positive way, rather than allowing the media to negatively
portray them. Family members will be welcomed to send in photographs and provide
biographical information for their loved ones. Such a collaboration is crucial to the
success of the project and could potentially bring these families together in a positive way
that will also help incite change.

26
Bibliography
Bardon, D., Berry, D., Bjerke, C., & Roberts, D. (2002). Crafting the Compelling User
Experience. International Journal of Human-Computer Interaction, 14(3-4), 535–
558. doi:10.1080/10447318.2002.9669133
Blair, I. V., Judd, C. M., & Chapleau, K. M. (2004). The Influence of Afrocentric Facial
Features in Criminal Sentencing. Pyschological Science, 15(10), 674–679.
Retrieved from http://www.jstor.org/stable/40064026.
Bureau of Justice Statistics and the National Institute of Justice, Police Use of Force:
Collection of National Data (N.P., 1997).
Burghart, B. (2012). Fatal Encounters. Retrieved from http://www.fatalencounters.org/
Deadspin. (2014). U.S. Police Shootings Data (Responses). Retrieved from
https://docs.google.com/spreadsheets/d/1cEGQ3eAFKpFBVq1k2mZIy5mBPxC6
nBTJHzuSWtZQSVw/edit?pli=1#gid=1144428085
Eberhardt, J. L., Favies, P. G., Purdie-Vaughns, V.J., & Johnson, S. I. (2006). Looking
deathworthy: perceived stereotypicality of Black definition predicts capital-
sentencing outcomes. Psychological Science, 17(5), 383-386.
Evergreen, S., & Metzner, C. (2013). Design Principles for Data Visualization in
Evaluation. New Directions for Evaluation, 2013(140), 5–20. doi:DOI:
10.1002/ev.20071
Gerke, Jeff. 2010. Plot Versus Character: a Balanced Approach to Writing Great
Fiction. Cincinnati, OH: Writer’s Digest Books.
27
Holmes, M.D., & Smith, B. W. (2003). Community Accountability, Minority Threat, and
Police Brutality: An Examination of Civil Rights Criminal Complaints.
Criminology, 41(4), 1035–1063. doi:10.1111/j.1745-9125.2003.tb01013.x
Jefferies, J. L. (2000). Police Brutality as a Major Everyday Threat: Notes from an Angry
Young Professor. Harvard Journal of African American Public Policy, VI, 129-
144.
Kane, R. J., & White, M. D. (2009). Bad cops. Criminology and Public Policy, 8(4), 737–
769. doi:10.1111/j.174509133.2009.00591.x
Keim, D. (2008). Visual Analytics: Definition, Process, and Challenges.
doi:10.1007/978-3-540-70956-5_7
Kosara, R., & Mackinlay, J. (2013). Storytelling: The Next Step for Visualization.
Computer, 46(5), 44–50. doi:10.1109/MC.2013.36
Lusk, E. J., & Kersnick, M. (1979). The effect of cognitive style and report format on
task performance: The misdesign consequences. Management Science, 25(8),
787–798. Retrieved from http://dx.doi.org/10.1287/mnsc.25.8.787
Marger, M. (2012). Race and ethnic relations: American and global perspectives (9th ed.)
Belmont: Wadworth.
Murphy, W. & Wood, B. (1984). Slavery in Colonial Georgia. Athens: University of
Georgia Press.
Mydral, G. (1994). An American Dilemma: The Negro Problem in America. New York:
Harper.
28
Peffley, M. & Hurtwitz, J. (2013). Persuasion and resistance: race and the death penalty
in America. In H. T.: Greene & S. Gabbidon (Eds.), Race and crime: a text/reader
(1st ed., pp. 355-366). Thousand Oaks: Sage.
Russell, K. K. (2000). What Did I Do to Be So Black and Blue? Police Brutality: an
Anthology (pp. 135–148). New York: W.W. Norton & Company.
Smith, B. W., & Holmes, M. D. (2003). Community accountability, minority threat, and
police brutality: an examination of civil rights criminal complaints. Criminology,
41(4), 1035–1063.
Sturm, B. W. (2012). Caring for Stories: Increasing Reader Engagement. Knowledge
Quest, 40(5), 58–63.
Thomas, J.J., Cook, K.A.: Illuminating the Path. IEEE Computer Society Press, Los
Alamitos (2005)
Tonry, M. (2011). Punishing race: a continuing American dilemma. New York: Oxford
University Press.
Tractinsky, N. (1997). Aesthetics and apparent usability: Empircially assessing cultural
and methodological issues. Proceeding CHI’97: Proceedings of the ACM SIGCHI
Conference on Human Factors in Computing Systems, 115–122. Retrieved from
http://old.sigchi.org/chi97/proceedings/paper/nt.htm
Turque, B; Buckely, L; & Wright, L. (1991). Brutality on the Beat. Newsweek (25 March:
32).
Walker, A. (2011). Racial profiling separate and unequal keeping the minorities in the
29
line-the role of law enforcement in America. St. Thomas Law Review, 23, 576-
619.
Weisburd, D., Greenspan, R., Hamilton, E., Williams, H., & Bryant, K. A. (2000). Police
Attitudes Toward Abuse of Authority: Findings from a National Study. National
Institute of Justice: Research in Brief.