Embed Size (px)
DESCRIPTION
paper
Citation preview
Seediscussions,stats,andauthorprofilesforthispublicationat:https://www.researchgate.net/publication/265412395
PatternsofasymmetryinbodytraitsandgenitaliaintwodistantpopulationsofaNeotropicalscorpion
ARTICLEinJOURNALOFNATURALHISTORY·SEPTEMBER2014
ImpactFactor:0.88·DOI:10.1080/00222933.2014.951086
CITATION
1
READS
60
4AUTHORS,INCLUDING:
AlfredoV.Peretti
NationalUniversityofCordoba,A…
73PUBLICATIONS499CITATIONS
SEEPROFILE
CamiloIMattoni
NationalUniversityofCordoba,A…
44PUBLICATIONS494CITATIONS
SEEPROFILE
Availablefrom:CamiloIMattoni
Retrievedon:07March2016
This article was downloaded by: [200.16.16.13]On: 08 September 2014, At: 10:22Publisher: Taylor & FrancisInforma Ltd Registered in England and Wales Registered Number: 1072954 Registeredoffice: Mortimer House, 37-41 Mortimer Street, London W1T 3JH, UK
Journal of Natural HistoryPublication details, including instructions for authors andsubscription information:http://www.tandfonline.com/loi/tnah20
Patterns of asymmetry in body traitsand genitalia in two distant populationsof a Neotropical scorpionP.A. Oliveroa, D.E. Vrecha, A.V. Perettia & C.I. Mattoniaa Laboratorio de Biología Reproductiva y Evolución, Institutode Diversidad y Ecología Animal (IDEA, CONICET), Facultad deCiencias Exactas, Físicas y Naturales, Universidad Nacional deCórdoba, Córdoba, ArgentinaPublished online: 03 Sep 2014.
To cite this article: P.A. Olivero, D.E. Vrech, A.V. Peretti & C.I. Mattoni (2014): Patterns ofasymmetry in body traits and genitalia in two distant populations of a Neotropical scorpion, Journalof Natural History, DOI: 10.1080/00222933.2014.951086
To link to this article: http://dx.doi.org/10.1080/00222933.2014.951086
PLEASE SCROLL DOWN FOR ARTICLE
Taylor & Francis makes every effort to ensure the accuracy of all the information (the“Content”) contained in the publications on our platform. However, Taylor & Francis,our agents, and our licensors make no representations or warranties whatsoever as tothe accuracy, completeness, or suitability for any purpose of the Content. Any opinionsand views expressed in this publication are the opinions and views of the authors,and are not the views of or endorsed by Taylor & Francis. The accuracy of the Contentshould not be relied upon and should be independently verified with primary sourcesof information. Taylor and Francis shall not be liable for any losses, actions, claims,proceedings, demands, costs, expenses, damages, and other liabilities whatsoever orhowsoever caused arising directly or indirectly in connection with, in relation to or arisingout of the use of the Content.
This article may be used for research, teaching, and private study purposes. Anysubstantial or systematic reproduction, redistribution, reselling, loan, sub-licensing,systematic supply, or distribution in any form to anyone is expressly forbidden. Terms &Conditions of access and use can be found at http://www.tandfonline.com/page/terms-and-conditions

Patterns of asymmetry in body traits and genitalia in two distantpopulations of a Neotropical scorpion
P.A. Olivero*, D.E. Vrech, A.V. Peretti and C.I. Mattoni
Laboratorio de Biología Reproductiva y Evolución, Instituto de Diversidad y Ecología Animal(IDEA, CONICET), Facultad de Ciencias Exactas, Físicas y Naturales, Universidad Nacionalde Córdoba, Córdoba, Argentina
(Received 26 November 2013; accepted 17 June 2014)
The ability of a genotype to control the stable development of a phenotype underdifferent environmental conditions may explain the level of developmentalinstability. An indicator to developmental instability is Fluctuating Asymmetry.Traits under pressures of sexual selection exhibit greater values of asymmetry thatothers. These traits have more physiological requirements during morphogenesisand a more complex development. The aims of this work are to analyze asymme-try patterns of genitalic and somatic traits in the scorpion Bothriurus bonariensis(Bothriuridae) and to compare these values between central and peripheral popu-lations of its distribution. We observed that types of asymmetry in genitalic traitsdiffered in both populations. Also, traits of the hemispermatophores (two halvesthat constitute the spermatophore) showed the highest levels of fluctuating asym-metry, particularly in those characteristics with important role for inseminationsuccess. This work offers fundamental baseline knowledge for further worksfocused on asymmetry of genitalia and mating success in scorpions.
Keywords: arachnids; Bothriurus bonariensis; developmental instability; selectivepressure; South America
Introduction
Stress can be characterized as a force shaping adaptation and evolution in changingenvironments, and it is a property of both the stressor and the stressed (Bijlsma andLoeschcke 2005). Stressful conditions of the environment on the physiology of aspecies may limit the distribution range of the species. In many species, peripheralpopulations suffer stressful environmental conditions, and in this context, high meta-bolic costs are enough to limit expansions of their living range (McNab 1973; Root1988a, 1988b; Alerstam 1990; Dennis 1993). Environmental conditions restrict speciesdistribution range not only physiologically but also genetically (Møller and Swaddle1997; Kark et al. 2004). The ability of a genotype to control the stable development ofa phenotype under a range of environmental conditions may explain the level ofdevelopmental stability of a particular trait (Moller et al. 1995). A wide variety ofenvironmental and genetic factors may result in a reduction of the developmentalstability that makes individuals less efficient in terms of growth, survival and repro-duction (Graham et al. 2000; Santos et al. 2006; Vishalakshi and Singh 2008a,2008b).
*Corresponding author. Email: [email protected]
Journal of Natural History, 2014http://dx.doi.org/10.1080/00222933.2014.951086
© 2014 Taylor & Francis
Dow
nloa
ded
by [
200.
16.1
6.13
] at
10:
22 0
8 Se
ptem
ber
2014

A measure of developmental instability is fluctuating asymmetry, which is definedas small random differences between left and right sides of a bilateral trait. Indeed,this is a result of the inability of individuals to undergo identical development of bothsides of a bilaterally symmetrical trait (Palmer and Strobeck 1992; Møller andPomiankowski 1993; Swaddle et al. 1994; Møller 1997; Peretti et al. 2001; Leunget al. 2003; Helle et al. 2011). When an individual faces a sub-optimal set ofenvironmental conditions, the developmental process becomes unstable and the levelsof fluctuating asymmetry grow (Vishalakshi 2011). Other forms of asymmetry thatcan occur are Directional Asymmetry and Antisymmetry. The former occurs whenthere is a tendency for one side of an organism to develop more than the other (VanValen 1962). In contrast, Antisymmetry shows one side of a character larger than theother but not handed-bias as to which side of the character will be bigger (Timofeeff-Ressovsky 1934; Graham et al. 1993, 2000; Palmer 2004, 2005). Fluctuating asym-metry is widely used to assess developmental instability; great differences appear insome fluctuating asymmetry values of different populations of a species (Picton et al.1990; Moller 1993), as well as in the periphery of a distribution range (Parsons 1993;Kark 2001). In addition, traits influenced by sexual selection may exhibit greatervalues of fluctuating asymmetry in comparison with other traits in which such type ofselection does not occur (Moller and Eriksson 1994; Peretti et al. 2001; Santos 2001;Uetz et al. 2009). An explanation for this trend is that many traits under sexualselection have more physiological requirements during morphogenesis and a morecomplex development (Pomiankowski et al. 1991).
Developmental instability has been explored in a wide variety of taxa (Lens andVan-Dongen 2000; Hendrickx et al. 2003; Vishalakshi and Singh 2008a, 2008b, 2008c;Băncilǎ et al. 2010; Helle et al. 2011). In arthropods, Huber et al. (2007) make aninteresting review on genitalic evolution in spiders and insects, focusing on conspicuousasymmetry of sexual traits rather than minor random changes like fluctuating asym-metry. Among insects, fluctuating asymmetry patterns are not uniform. For example,in crickets and beetles habitat fragmentation is unrelated to fluctuating asymmetry(Berggren 2005; Henríquez et al. 2009). On the other hand, in Drosophila fluctuatingasymmetry increases because of the influence of environmental stressors (Graham et al.2000; Santos et al. 2006; Vishalakshi and Singh 2008a, 2008b).
Among arachnids, scorpions are a good model to study fluctuating asymmetry, inparticular in genitalic traits. They show indirect sperm transfer by a sclerotizedspermatophore. The spermatophore consists of two halves (hemispermatophores)produced by the male’s paraxial organs. These two halves join to exit through thegonopore to form the spermatophore, immediately prior to sperm transfer (Hjelle1990). So, if the two halves are developed differently, the spermatophore will showmore asymmetry. This spermatophore is relatively complex and, from previousstudies, it is know that certain structures may vary in size and shape (Peretti 1993).Peretti et al. (2001) examined some patterns of asymmetry in sexual and non-sexualtraits in a population of Bothriurus bonariensis (Bothriuridae). This species has a widedistribution in South America, ranging from southeast Brazil to central Argentina,with a core population in Uruguay (Mattoni and Acosta 2005; Ojanguren Affilastro2005). In Argentina, B. bonariensis inhabits the provinces of Entre Ríos, Corrientes,Buenos Aires, Santa Fe, La Pampa, Córdoba and San Luis. This area belongs to ‘thePampa’ and ‘the Espinal’ phytogeographic provinces (Ojanguren Affilastro 2005)(Figure 1), both showing different environments depending on vegetation, soil and
2 P.A. Olivero et al.
Dow
nloa
ded
by [
200.
16.1
6.13
] at
10:
22 0
8 Se
ptem
ber
2014

climate (Cabrera and Willink 1973), factors that could affect development in thispopulation on different ways (Kark et al. 2004; Olivero et al. 2012). The habitat ofthe Mendiolaza population (peripheral population in Córdoba Province) belongs tothe phytogeographical province of the Espinal, while the Piedras de Afilar population(core population in Uruguay) corresponds to the phytogeographical province ofPampa. In comparison, the climate is wetter in the latter with a greater level ofrains and lower temperatures (Cabrera and Willink 1973; Argentina’s nationalmeteorological service -online www.smn.gov.ar-; Uruguay’s National direction ofmeteorology -online www.meteorologia.com.uy) (Figure 2).
Along its distribution, populations of this species show differences in colouringpatterns and a wide range of sizes in morphological and sexual traits (OjangurenAffilastro 2005; Olivero et al. 2012). This variation could be related to environmentalcharacteristics that change throughout the species’ range. Scorpion species belongingto wet zones show a greater amount of pigment than species inhabiting drier zones(Lourenço and Cloudsley-Thompson 1996; Mattoni 2002).
The aims of this work are to detect and analyze asymmetry patterns of genitalicand somatic traits in the scorpion Bothriurus bonariensis (Bothriuridae) and tocompare these values between two different populations (central and peripheral) ofits distribution. Our study focuses on two principal lines: (1) Given that the peripheralpopulation may suffer more stressful conditions compared with core populations(Moller 1995; Auffray et al. 1999), we would expect to observe higher levels ofasymmetry in the peripheral population; (2) Since traits under sexual selection tendto show higher levels of fluctuating asymmetry due to a higher sensitivity andphysiological requirements for development (Pomiankowski et al. 1991), we wouldexpect to find higher levels of asymmetry in spermatophore and sexually selectedtraits in comparison with other body traits.
Figure 1. Geographic distribution of Bothriurus bonariensis. Black circles indicate the totaldistribution of the species known to date; grey grid squares show the populations used in this study.
Journal of Natural History 3
Dow
nloa
ded
by [
200.
16.1
6.13
] at
10:
22 0
8 Se
ptem
ber
2014

Materials and methods
Study material
We analyzed specimens of B. bonariensis from two distant populations selected inorder to represent the core and periphery of their distribution (Figure 1). We selectedpopulations from which specimens were abundant (allowing statistical comparisons)and well preserved (poor preservation alters the hemispermatophore form) (Olivero
Figure 2. Mean temperature and annual rainfall in Mendiolaza (Argentina) and Piedras deAfilar (Uruguay) during 2010–2011.
4 P.A. Olivero et al.
Dow
nloa
ded
by [
200.
16.1
6.13
] at
10:
22 0
8 Se
ptem
ber
2014

et al. 2012). Selected populations were the following. Core population: Piedras deAfilar (Canelones province, Uruguay – 34°43'0,44” S, 55°31'59,79” W, 40 m.a.s.l), 16males, 10 females, 16 pair of hemispermatophores; Peripheral population:Mendiolaza (Córdoba Province, Argentina – 31°15' 52,59” S, 64°18'10” W, 540 m.a.s.l), 20 males, 11 females, 20 pairs of hemispermatophores (Figure 1). TheMendiolaza population was considered the peripheral population because of itslocation and also by the climatic conditions of the area, which has an arid climatewith high temperatures and low humidity. By contrast, the Piedras de Afilar popula-tion lives in a wetter and cooler climate with more favourable conditions (Figure 2),therefore was considered the core population, although this is not exactly located inthe centre of the total distribution of the species (Cabrera and Willink 1973;Argentina’s national meteorological service -online www.smn.gov.ar-; Uruguay’sNational direction of meteorology -online www.meteorologia.com.uy).
Measurements of individuals
To compare different populations of B. bonariensis, we followed the biological speciesconcept (Mayr 1942). Although it is known that individuals of these two populationshave significant morphological differences (Mattoni 2003; Ojanguren Affilastro 2005;Olivero et al. 2012) and probably could be considered as different species, thisseparation is not yet confirmed. For this reason, we consider these populations asone species. All study specimens were preserved in 80% ethanol. Both hemisperma-tophores from each male specimen were removed, cleaned by hand and preservedfollowing Sissom et al. (1990). Morphological traits were measured in males andfemales and genitalic traits corresponded to both hemispermatophores (Peretti et al.2001). The female has an ovoid and flexible genital atrium and two spermathecaewhich increase in size with successive inseminations (Peretti 2003). These traits werenot included in this work because their elasticity makes confident measurementsdifficult. Sixteen traits were analyzed in males (four morphological and 12 fromhemispermatophores) and four traits in females (Figure 3). Some measurements
Figure 3. Body and genitalic traits measured in males and females of Bothirurus bonariensis.
Journal of Natural History 5
Dow
nloa
ded
by [
200.
16.1
6.13
] at
10:
22 0
8 Se
ptem
ber
2014

were also used in a systematic study of Bothriuridae and for the description ofspermatophores and hemispermatophores (Acosta 1989; Peretti 1992, 1993, 1995).Moreover, they are characters that have relevance in the context of sexual biology ingeneral (Peretti 1992; Peretti et al. 2001; Peretti 2003). Each trait was measured twiceby only one person, in order to compensate for measuring errors. Fluctuatingasymmetry can be confused by measurement error, therefore repeat measurementshould be undertaken to ensure that fluctuating asymmetry is detectable (Palmer andStrobeck 2003). Specimens were analyzed using a stereoscopic dissecting microscope(Nikon SMZ1500), and pictures were taken using a digital camera (Nikon DigitalSight DS-Fi1). Digital pictures were analyzed with the Image Tool 3.0 measuringsoftware (© UTHSCSA 1996–2002).
Statistical analyses and types of asymmetry
Statistical analyses were performed with the PC program NCSS 2007 (© Hintze2007). To control for measurement errors, a repeated measures ANOVA was used.All measurements of the variables were significantly repeatable (Table 1 inAppendix). For analyses and evaluation of the magnitude of asymmetry of eachtrait, the absolute level of asymmetry was estimated as the unsigned left-minus-right character value. Relative asymmetry was estimated as absolute asymmetrydivided by the mean left and right character value. Results are expressed as percen-tage of relative asymmetry (relative asymmetry value was multiplied by 100). To testif the signed left-minus-right character value fit a normal distribution, Shapiro–Wilksand Kolmogorov–Smirnov one-sample tests were used (Siegel and Castellan 1988).One-sample t-test was employed to establish the presence of directional asymmetry todata with normal distribution. Data with non-normal distribution were consideredantisymmetry. To control the relationship between the absolute asymmetry and themean size of sides (left and right) a linear regression analysis was performed. Threelinear regressions were performed for individuals of each of the populations consider-ing the traits showing higher levels of asymmetry: width of capsular lobe, length oflateral edge and length of crest. In each regression, independent variable was the sizeof the feature, and dependent variable was the absolute value of absolute asymmetryin the trait.
Multivariate analyses
To compare relative asymmetry of selected traits between the core and peripheralpopulations, we performed a multivariate discriminant analysis (Fisher 1936;Fukunaga 1990; Duda et al. 2001). Discriminant analysis results in a set of predictionequations (linear functions) based on independent variables that are used to classifyindividuals into groups. As an estimating method, the discriminant lineal functionwas used without setting a priori probabilities and without selecting variables.Canonical Correlation Coefficient and Wilks’ Lambda Statistical were calculated,which allowed us to choose the most appropriate model for all models that can beconstructed from the variables previously selected. Both ratios measure the differ-ences between the groups due to discriminant functions (El Ouardighi et al. 2007).This technique allowed us to analyze if there was a separation among populations
6 P.A. Olivero et al.
Dow
nloa
ded
by [
200.
16.1
6.13
] at
10:
22 0
8 Se
ptem
ber
2014
considering the studied variables and to determine the influence of each variable onthe population discrimination level (Brown and Wicker 2000; Vignoli et al. 2005).
Results
Types and levels of asymmetry
Core population
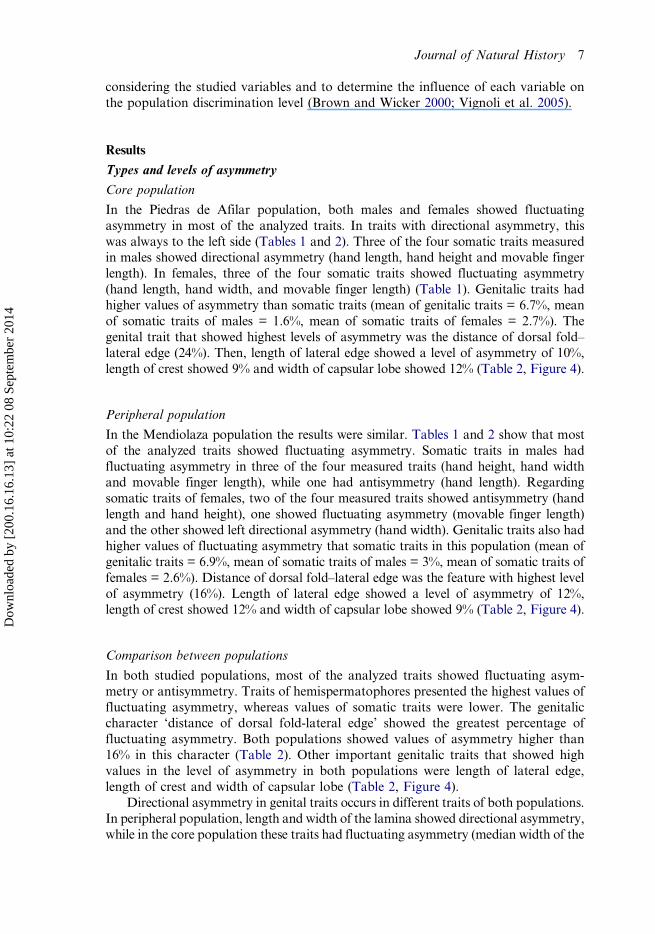
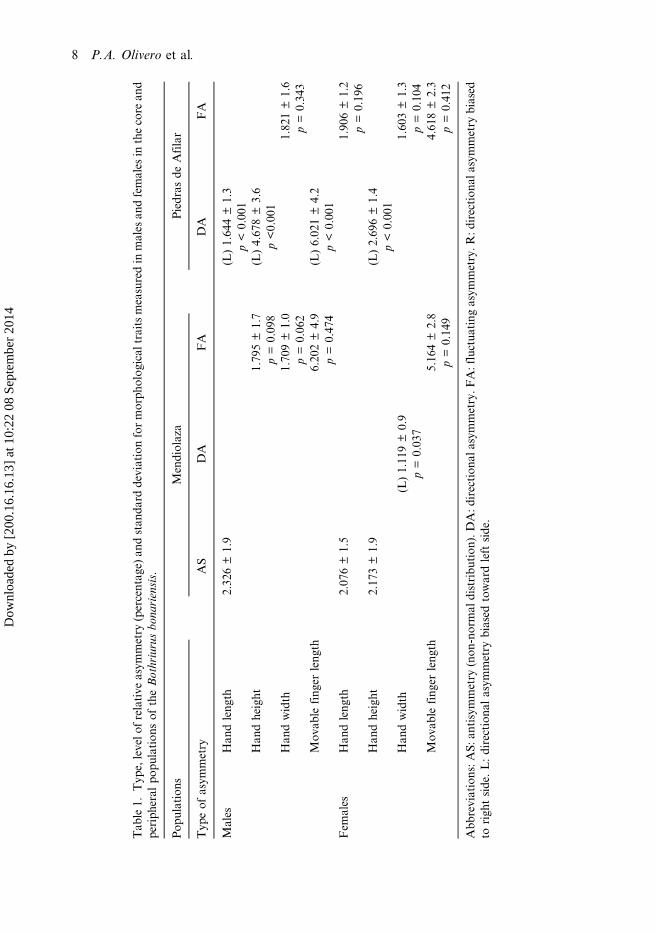
In the Piedras de Afilar population, both males and females showed fluctuatingasymmetry in most of the analyzed traits. In traits with directional asymmetry, thiswas always to the left side (Tables 1 and 2). Three of the four somatic traits measuredin males showed directional asymmetry (hand length, hand height and movable fingerlength). In females, three of the four somatic traits showed fluctuating asymmetry(hand length, hand width, and movable finger length) (Table 1). Genitalic traits hadhigher values of asymmetry than somatic traits (mean of genitalic traits = 6.7%, meanof somatic traits of males = 1.6%, mean of somatic traits of females = 2.7%). Thegenital trait that showed highest levels of asymmetry was the distance of dorsal fold–lateral edge (24%). Then, length of lateral edge showed a level of asymmetry of 10%,length of crest showed 9% and width of capsular lobe showed 12% (Table 2, Figure 4).
Peripheral population
In the Mendiolaza population the results were similar. Tables 1 and 2 show that mostof the analyzed traits showed fluctuating asymmetry. Somatic traits in males hadfluctuating asymmetry in three of the four measured traits (hand height, hand widthand movable finger length), while one had antisymmetry (hand length). Regardingsomatic traits of females, two of the four measured traits showed antisymmetry (handlength and hand height), one showed fluctuating asymmetry (movable finger length)and the other showed left directional asymmetry (hand width). Genitalic traits also hadhigher values of fluctuating asymmetry that somatic traits in this population (mean ofgenitalic traits = 6.9%, mean of somatic traits of males = 3%, mean of somatic traits offemales = 2.6%). Distance of dorsal fold–lateral edge was the feature with highest levelof asymmetry (16%). Length of lateral edge showed a level of asymmetry of 12%,length of crest showed 12% and width of capsular lobe showed 9% (Table 2, Figure 4).
Comparison between populations
In both studied populations, most of the analyzed traits showed fluctuating asym-metry or antisymmetry. Traits of hemispermatophores presented the highest values offluctuating asymmetry, whereas values of somatic traits were lower. The genitaliccharacter ‘distance of dorsal fold-lateral edge’ showed the greatest percentage offluctuating asymmetry. Both populations showed values of asymmetry higher than16% in this character (Table 2). Other important genitalic traits that showed highvalues in the level of asymmetry in both populations were length of lateral edge,length of crest and width of capsular lobe (Table 2, Figure 4).
Directional asymmetry in genital traits occurs in different traits of both populations.In peripheral population, length and width of the lamina showed directional asymmetry,while in the core population these traits had fluctuating asymmetry (median width of the
Journal of Natural History 7
Dow
nloa
ded
by [
200.
16.1
6.13
] at
10:
22 0
8 Se
ptem
ber
2014
Tab
le1.
Typ
e,levelo
frelative
asym
metry
(percentag
e)an
dstan
dard
deviationformorph
olog
ical
traitsmeasuredin
males
andfemales
inthecore
and
periph
eral
popu
lation
sof
theBothriurusbo
nariensis.
Pop
ulations
Mendiolaza
Piedras
deAfilar
Typ
eof
asym
metry
AS
DA
FA
DA
FA
Males
Han
dleng
th2.32
6±1.9
(L)1.64
4±1.3
p<0.00
1Han
dheight
1.79
5±1.7
(L)4.67
8±3.6
p=0.09
8p<0.00
1Han
dwidth
1.70
9±1.0
1.82
1±1.6
p=0.06
2p=0.34
3Mov
able
fing
erleng
th6.20
2±4.9
(L)6.02
1±4.2
p=0.47
4p<0.00
1Fem
ales
Han
dleng
th2.07
6±1.5
1.90
6±1.2
p=0.19
6Han
dheight
2.17
3±1.9
(L)2.69
6±1.4
p<0.00
1Han
dwidth
(L)1.11
9±0.9
1.60
3±1.3
p=0.03
7p=0.10
4Mov
able
fing
erleng
th5.16
4±2.8
4.61
8±2.3
p=0.14
9p=0.41
2
Abb
reviations:A
S:an
tisymmetry
(non
-normal
distribu
tion
).DA:d
irection
alasym
metry.F
A:fluctua
ting
asym
metry.R
:direction
alasym
metry
biased
torigh
tside.L:directiona
lasym
metry
biased
towardleftside.
8 P.A. Olivero et al.
Dow
nloa
ded
by [
200.
16.1
6.13
] at
10:
22 0
8 Se
ptem
ber
2014

Tab
le2.
Typ
e,levelof
relative
asym
metry
(percentag
e)an
dstan
dard
deviation
formale’sgenitalic
traits
measured
inthecore
and
periph
eral
popu
lation
sof
Bothriurusbo
nariensis.
Pop
ulations
Mendiolaza
Piedras
deAfilar
Typ
eof
asym
metry
AS
DA
FA
AS
DA
FA
Lam
inaleng
th(R
)3.51
3±3.3
2.18
4±1.4
p=0.01
9Lam
inawidth
(distal)
(R)3.44
±3.1
2.52
1±2.5
p=0.02
7Lam
inawidth
(L)1.93
8±2.1
1.93
6±1.8
(median)
p=0.01
9p=0.26
8Lam
inawidth
(basal)
6.55
5±4.5
5.13
8±4.0
p=0,05
1p=0.48
8Trunk
leng
th4.57
4±4.5
1.81
1±2.6
p=0.33
8p=0.21
0Cap
sularlobe
leng
th3.56
6±2.7
3.38
5±3.4
p=0.15
8p=0.42
4Cap
sularlobe
width
8.59
7±7.6
11.814
±7.5
p=0.10
6Dorsalfold
leng
th5.49
3±4.8
3.98
8±4.0
p=0.13
0Dorsalfold
width
5.70
9±4.9
(L)4.64
5±3.4
p=0.00
8Distanceof
dorsal
fold–lateraledge
16.412
±13
.7(L)23
.79±22
.1p=0.25
5p=0.04
9Lateral
edge
leng
th12
.011
±10
.110
.248
±8.2
p=0.11
8p=0.47
0Crest
leng
th11
.85±10
.39.03
4±6.6
p=0.34
8
Abb
reviations:A
S:an
tisymmetry
(non
-normal
distribu
tion
).DA:d
irection
alasym
metry.F
A:fluctua
ting
asym
metry.R
:direction
alasym
metry
biased
torigh
tside.L:directiona
lasym
metry
biased
towardleftside.
Journal of Natural History 9
Dow
nloa
ded
by [
200.
16.1
6.13
] at
10:
22 0
8 Se
ptem
ber
2014

lamina) and antisymmetry (length and distal width of the lamina). On the other hand, thecore population showed directional asymmetry in traits such as dorsal fold width anddistance of dorsal fold–lateral edge, whereas that in the Mendiolaza population hadantisymmetry and fluctuating asymmetry, respectively (Table 2).
Relationship between asymmetry and trait size
Of three linear regressions that relate the asymmetry with trait size in peripheralpopulation, no significant results were obtained (Table 3). However, in the corepopulation, the length of crest showed a positive relationship between antisymmetryand trait size: antisymmetry is greater in longer hemispermatophores crests (Table 3).
Figure 4. Level of relative asymmetry in genital traits of males of Bothriurus bonariensis instudied populations. White boxes show the values of the Mendiolaza population (peripheral),while grey boxes show the values of the Piedras de Afilar population (core).
10 P.A. Olivero et al.
Dow
nloa
ded
by [
200.
16.1
6.13
] at
10:
22 0
8 Se
ptem
ber
2014

Multivariate analysis
The discriminant analysis showed significant differences between the core and per-ipheral populations only for relative asymmetry of the somatic traits of males(F = 4.7, p = 0.004, Wilks lambda = 0.623; Figure 5). The most influential trait inthis separation was the length of movable finger (Table 2 in Appendix). Instead, wefound no significant differences between populations in genitalic traits of males(F = 1.1, p = 0.448, Wilks lambda = 0.573) or somatic traits of females (F = 0.5,p = 0.714, Wilks lambda = 0.883). However, genital variables of males that most
Table 3. Linear regressions between size and asymmetry of spermatophore variables ofBothriurus bonariensis.
Traits R2 Slope Est. F p
Mendiolaza Capsular lobe width 0.022 0.209 0.005 0.365 0.554Lateral edge length 0.028 −0.089 0.005 0.494 0.492Crest length 0.630 1.078 0.017 25.501 0.0001
Piedras de Afilar Capsular lobe width 0.089 0.323 0.001 1.369 0.261Lateral edge length <0.001 −0.007 0.015 0.001 0.969Crest length 0.002 0.028 0.006 0.032 0.860
Figure 5. Spatial separation of populations of Bothriurus bonariensis according somatic traitsof males as Canonical Discriminant Analysis (Score 1: F = 4.7, p = 0.004, Wilk’slambda = 0.6228).
Journal of Natural History 11
Dow
nloa
ded
by [
200.
16.1
6.13
] at
10:
22 0
8 Se
ptem
ber
2014
influenced a separation among populations were the dorsal fold length, the distanceof dorsal fold–lateral edge, the length of lateral edge and the width of capsular lobe(Table 3 in Appendix). The last three also had higher values of relative asymmetry(see Table 2).
Discussion
Types and levels of asymmetry
Asymmetry within populations
Peretti et al. (2001) demonstrated that male genitalia of Bothriurus bonariensis couldvary between some populations; in Argentina, males from Córdoba (peripheraldistributions of the species) showed greater values of fluctuating asymmetry com-pared with specimens from southern Buenos Aires. In addition, in the Córdobapopulation, hemispermatophores are shorter as well as capsular lobes and dorsalfolds, compared with population in the core of the geographic distribution (Uruguaypopulation) of the species (Olivero et al. 2012). In this study, although we did not finddifferences in levels of asymmetry, we observed that types of asymmetry in genitalictraits differed in both populations. A strong developmental instability not onlyproduces changes in the levels of fluctuating asymmetry but also translates into atransition from fluctuating asymmetry to other forms of asymmetry (Lens and VanDongen 2000; Schneider et al. 2003; Leamy and Klingenberg 2005). Data concerningother groups of animals (Møller and Swaddle 1997) show that there could be evolu-tionary transitions between different types of asymmetries in response to intensedirectional selection. In this sense, asymmetry in hemispermatophores may reflectdevelopmental instability, possibly due to a higher physiological sensitivity to envir-onmental stress on the paraxial organs that produce the hemispermatophores (Perettiet al. 2001).
On the other hand, according to the discriminant analysis, somatic traits of malesshow a significant separation in the two populations studied, and the most influentialvariable in this separation is the length of movable finger. These differences could becaused by different environmental pressures in the two populations. Somatic traitsanalyzed in this study involved measurements of the pedipalp hands. The pedipalpsare instrumental in prey capture, and they are the platform for one of the primarysensory systems in scorpions (Hjelle 1990). But also, pedipalps are sexually dimorphicand are involved in courtship, where the male leads the female in a classical prome-nade à deux until a suitable location is found for depositing the spermatophore andtransferring sperm (Polis and Sissom 1990). For this reason, pedipalp hands alsocould be under the influence of sexual selection.
Asymmetry of genitalic and somatic traits
Another aspect associated with the possibility of evolutionary transitions betweentypes of asymmetry is the following: the sister species of B. bonariensis, B. chacoensisMaury and Acosta (1993) presents a spermatophore rather similar to that of B.bonariensis, except that it possesses a long distal filament in the right capsular lobe.This is a case of directional asymmetry, as observed in the left lobe and other capsularstructures of Brachistosternus species (Maury 1975; Acosta 1989; Peretti 1993). Some
12 P.A. Olivero et al.
Dow
nloa
ded
by [
200.
16.1
6.13
] at
10:
22 0
8 Se
ptem
ber
2014

B. bonariensis males have rudiments of different lengths of a filament similar to thatin B. chacoensis, perhaps representing different evolutionary stages (Peretti et al.2001). This could indicate that genitalic traits in this species may be particularlysensitive to developmental instability, either by sexual selection or by stressful envir-onmental conditions. In the present study, male genitalia shows highest levels offluctuating asymmetry in both populations, especially in traits with an importantrole for sperm transfer success such as the dorsal fold, lateral edge and crest (Peretti1992; Peretti et al. 2001; Peretti 2003). Although no significant differences weredetected in fluctuating asymmetry of core and peripheral populations, the dorsalfold, lateral edge and capsular lobe are traits that may have greater influence onthe separation of populations, as discriminant analysis showed. Indeed, the inner faceof female operculum fits against the dorsal fold of the lamina. Along with the fit ofthe female operculum with the lamina, the external part of the capsule (which isrepresented in this stage by two capsular lobes) enters the genital atrium. This initialintromission ensures that capsular eversion takes place inside the atrium. The medialregion of lamina always fits in the intercoxal space of the female’s legs, and the cresthelps to fit the distal part of lamina (Peretti 2003). The developmental stability ofthese traits could be altered as a result of sexual selection. Indeed, sexual selection canpromote a greater directional selective pressure, and by this means may increase thelevel of developmental instability (Clarke 1997). Secondary sexual traits will showhigher values of asymmetry than morphological traits under stabilizing selection(Moller 1993; Moller and Eriksson 1994; Hunt and Simmons 1998; Peretti et al.2001; Rasmuson 2002; Vishalakshi and Singh 2006), due to the effects of genomicstress on developmental stability that are imposed by their different mode of selection(Møller and Pomiankowski 1993). Sexual selection can relax the internal mechanismsof control in the morphogenetic development of a character, leading to increasedphenotypic variation and increased susceptibility to environmental stress (Moller andHoglund 1991; Moller 1993).
On the other hand, in scorpions the hemispermatophores are formed in pairedsecretory sacs called ‘paraxial organs’ (Farley 2001). These paraxial organs, as part ofthe reproductive system, are present only in adult males (Hjelle 1990; Farley 2001).For this reason, the development of the hemispermatophores can be indirectlyaffected by environmental stresses experienced by sub-adults. Indeed, environmentalpressures leading to fluctuating asymmetry may be affected by stresses at the time ofsexual maturation, when the paraxial organs develop (sub-adult stage) and/or theshorter time between matings during which the each set of hemispermatophoresdevelop (adult stage). In contrast, the pedipalp hands are present in all the stages ofdevelopment and therefore the environmental pressures affect these structuresthroughout development. However, they are more likely to be reflective of stressesshortly before and during the moulting stages, since these are the actual stages ofdevelopment of the new cuticle. Therefore, although all structures are subjected toenvironmental pressures, each is affected differently according to their developmenttime.
The study of the symmetry of hemispermatophores represents an interesting area,since these structures offer an opportunity to investigate variations in the patterns ofasymmetry on the adult male, where local environmental stresses may show short-termfluctuations. For example, further studies could examine the asymmetry patternsbetween sets of hemispermatophores produced during the male’s reproductive life.
Journal of Natural History 13
Dow
nloa
ded
by [
200.
16.1
6.13
] at
10:
22 0
8 Se
ptem
ber
2014

Relationship between asymmetry and trait size
Fluctuating asymmetry has been found to be a good predictor of mating success andsexual attractiveness in fish, birds and insects (Tomkins and Simmons 2003; Grosset al. 2007). The fluctuating asymmetry may reflect the genome’s ability to resist noisedevelopment, and thus indicates genetic quality. Therefore, individuals with largerand more symmetrical traits would have higher reproductive success (Andersson1994), and females could use those traits to assess male quality (Moller 1993;Møller and Pomiankowski 1993; Andersson and Simmons 2006). Some studieshave demonstrated that the production of larger traits is more expensive comparedwith that for smaller traits, and only bigger specimens with a better genetic valuecould develop symmetrical traits (Moller 1993; Møller and Swaddle 1997). However,the associations between the size and symmetry traits, especially sexual traits, havebeen considerably debated (Evans and Hatchwell 1993; Tomkins and Simmons 1995;Clarke 1998; Bjorksten et al. 2000).
In this study, only one of linear regressions performed had significant results,showing a positive relationship between the length of crest hemispermatophore andantisymmetry, and it has been observed that a morphological trait’s size is constant,with a non-significant relation with body size (Olivero unpub. data). Therefore, it ispossible that smaller specimens could produce large traits but with greater levels ofasymmetry. Other studies have found no relationship between size of traits andfluctuating asymmetry (Tomkins and Simmons 1995; Hosken 2001). Another alter-native could be that these levels of asymmetry may be the result of mechanicalfunction selecting against asymmetry, and the ability of each individual to maintainsymmetry during development (David et al. 1998; Hunt and Simmons 1998). Furtherexperimental studies are needed in Bothriurus bonariensis to analyze the relationshipbetween the asymmetry of the spermatophore with mating success, since it representsan interesting subject that is poorly understood in scorpion biology. The present workoffered fundamental baseline knowledge for that purpose.
Acknowledgements
We are grateful to Carlos Toscano-Gadea and Germán Robert for help in collecting thescorpions at the field in Uruguay and Argentina, respectively. Dr. Teresa Vera and Dr.Cesar Vilardi offered valuable suggestions on early versions of this manuscript. Financialsupport was provided by the Consejo Nacional de Investigaciones Científicas y Técnicas(CONICET), Fondo para la Investigación Científica y Tecnológica (FONCYT) andSecretaría de Ciencia y Tecnología de la Universidad Nacional de Córdoba (SECYT). CIMand AVP are CONICET researchers.
References
Acosta LE. 1989. La fauna de escorpiones y opiliones (Arachnida) de la provincia de Córdoba[unpublished PhD thesis]. Córdoba: Facultad de Ciencias Exactas, Físicas y Naturales,Universidad Nacional de Córdoba.
Alerstam T. 1990. Bird migration. Cambridge (UK): Cambridge University Press.Andersson M. 1994. Sexual selection. Princeton (NJ): Princeton University Press.Andersson M, Simmons LW. 2006. Sexual selection and mate choice. Trends Ecol Evol.
21:296–302. doi:10.1016/j.tree.2006.03.015
14 P.A. Olivero et al.
Dow
nloa
ded
by [
200.
16.1
6.13
] at
10:
22 0
8 Se
ptem
ber
2014

Auffray J-C, Renaud S, Alibert P, Nevo E. 1999. Developmental stability and adaptiveradiation in the Spalax ehrenbergi superspecies in the Near-East. J Evolution Biol.12:207–221. doi:10.1046/j.1420-9101.1999.00054.x
Băncilǎ R, Van Gelder I, Rotteveel E, Loman J, Arntzen JW. 2010. Fluctuating asymmetry is afunction of population isolation in island lizards. J Zool. 282:266–275. doi:10.1111/j.1469-7998.2010.00736.x
Berggren Å. 2005. Effect of propagule size and landscape structure on morphological differ-entiation and asymmetry in experimentally introduced Roesel’s Bush-Crickets. ConservBiol. 19:1095–1102. doi:10.1111/j.1523-1739.2005.00171.x
Bijlsma R, Loeschcke V. 2005. Environmental stress, adaptation and evolution: an overview. JEvol Biol. 18:744–749. doi:10.1111/j.1420-9101.2005.00962.x
Bjorksten TA, Fowler K, Pomiankowski A. 2000. What does sexual trait FA tell us aboutstress? Trends Ecol Evol. 15:163–166. doi:10.1016/S0169-5347(99)01788-7
Brown MT, Wicker LR. 2000. Discriminant analysis. In: Tinsley H, Brown S, editors.Handbook of applied multivariate statistics and mathematical modeling. San Diego(CA): Academic Press; p. 209–234.
Cabrera AL, Willink A. 1973. Biogeografía de América Latina. Monogr O.E.A, S Biol,número 13.
Clarke GM. 1997. The genetic and molecular basis of developmental stability: the Lucilia story.TREE. 12:89–91.
Clarke GM. 1998. The genetic basis of developmental stability. V. Inter- and intra-individualcharacter variation. Heredity. 80:562–567. doi:10.1046/j.1365-2540.1998.00294.x
David P, Hingle A, Greig D, Rutherford A, Pomiankowski A, Fowler K. 1998. Male sexualornament size but not asymmetry reflects condition in stalk-eyed flies. Proc Soc B Biol Sci.265:2211–2216. doi:10.1098/rspb.1998.0561
Dennis R. 1993. Butterflies and climatic changes. Manchester: Manchester University Press.Duda RO, Hart PE, Stor DG. 2001. Pattern classification. New York (NY): Wiley.El Ouardighi A, El Akadi A, Aboutajdine D. 2007. Feature selection on supervised classifica-
tion using Wilks lambda statistic. International symposium on computational intelligenceand intelligent informatics – ISCIII 2007; 28–30 Mar 2007; Agadir: IEEE; p. 51–55.
Evans MR, Hatchwell BJ. 1993. New slants on ornament asymmetry. Proce Soci B Biol Sci.251:171–177. doi:10.1098/rspb.1993.0025
Farley R. 2001. Structure, reproduction and development. In: Brownell P, Polis GA, editors.Scorpion biology and research. Oxford (UK): Oxford University Press; p. 13–78.
Fisher RA. 1936. The use of multiple measurements in taxonomic problems. Ann Eugenics.7:179–188. doi:10.1111/j.1469-1809.1936.tb02137.x
Fukunaga K. 1990. Introduction to statistical pattern recognition. 2nd ed. Boston (MA):Academic Press.
Graham JH, Fletcher D, Tigue J, McDonald M. 2000. Growth and developmental stability ofDrosophila melanogaster in low frequency magnetic fields. Bioelectromagnetics. 21:465–472. doi:10.1002/1521-186X(200009)21:6<465::AID-BEM6>3.0.CO;2-C
Graham JH, Roe KE, West TB. 1993. Effects of lead and benzene on the developmentalstability of Drosophila melanogaster. Ecotoxicology. 2:185–195. doi:10.1007/BF00116423
Gross MR, Suk HY, Robertson CT. 2007. Courtship and genetic quality: asymmetric malesshow their best side. Proce Soc B Biol Sci. 274:2115–2122.
Helle S, Huhta E, Suorsa P, Hakkarainen H. 2011. Fluctuating asymmetry as a biomarker ofhabitat fragmentation in an area-sensitive passerine, the Eurasian treecreeper (Certhiafamiliaris). Ecol Indic. 11:861–867. doi:10.1016/j.ecolind.2010.11.004
Hendrickx F, Maelfait JP, Lens L. 2003. Relationship between fluctuating asymmetry andfitness within and between stressed and unstressed populations of the wolf spider Piratapiraticus. J Evol Biol. 16:1270–1279. doi:10.1046/j.1420-9101.2003.00633.x
Journal of Natural History 15
Dow
nloa
ded
by [
200.
16.1
6.13
] at
10:
22 0
8 Se
ptem
ber
2014
Henríquez P, Donoso DS, Grez AA. 2009. Population density, sex ratio, body size andfluctuating asymmetry of Ceroglossus chilensis (Carabidae) in the fragmented Maulinoforest and surrounding pine plantations. Acta Oecol. 35:811–818. doi:10.1016/j.actao.2009.08.012
Hjelle JT. 1990. Anatomy and morphology. In: Polis GA, editor. The biology of scorpions.Stanford (CA): Stanford University Press; p. 9–63.
Hosken DJ. 2001. Size and fluctuating asymmetry in sexually selected traits. Anim Behav.62:603–605. doi:10.1006/anbe.2001.1809
Huber BA, Sinclair BJ, Schmitt M. 2007. The evolution of asymmetric genitalia in spiders andinsects. Biol Rev. 82:647–698. doi:10.1111/j.1469-185X.2007.00029.x
Hunt J, Simmons LW. 1998. Patterns of fluctuating asymmetry in beetle horns: no evidence forreliable signaling. Behav Ecol. 9:465–470. doi:10.1093/beheco/9.5.465
Kark S. 2001. Shifts in bilateral asymmetry within a distribution range: the case of the chukarpartridge. Evolution. 55:2088–2096. doi:10.1111/j.0014-3820.2001.tb01323.x
Kark S, Lens L, Van Dongen S, Schmidt E. 2004. Asymmetry patterns across the distributionrange: does the species matter? Biol J Linn Soc. 81:313–324. doi:10.1111/j.1095-8312.2004.00296.x
Leamy L, Klingenberg CP. 2005. The genetics and evolution of fluctuating asymmetry. AnnuRev Ecol Syst. 36:1–21. doi:10.1146/annurev.ecolsys.36.102003.152640
Lens L, Van Dongen S. 2000. Fluctuating and directional asymmetry in natural bird popula-tions exposed to different levels of habitat disturbance, as revealed by mixture analysis.Ecol Lett. 3:516–522. doi:10.1046/j.1461-0248.2000.00181.x
Leung B, Knopper L, Mineau P. 2003. A critical assessment of the utility of fluctuatingasymmetry as a biomarker of anthropogenic stress. In: Polak M, editor. Developmentalinstability: causes and consequences. Oxford (UK): Oxford University Press; p. 415–426.
Lourenço WR, Cloudsley-Thompson JL. 1996. The evolutionary significance of colour, colourpatterns and fluorescence in scorpions. Revue Suisse Zool. 2:449–458.
Mattoni CI. 2002. Bothriurus pichicuy, nuevo escorpión chileno del grupo vittatus (Scorpiones,Bothriuridae). Iheringia, Ser Zool. 92:81–87. doi:10.1590/S0073-47212002000400010
Mattoni CI. 2003. Patrones evolutivos en el género Bothriurus (Scorpiones, Bothriuridae):análisis filogenético [doctoral thesis]. Córdoba: Facultad de Ciencias Exactas, Físicas yNaturales, Universidad Nacional de Córdoba.
Mattoni CI, Acosta LE. 2005. A new species of Bothriurus from Brazil (Scorpiones,Bothriuridae). J Arachnol. 33:735–744. doi:10.1636/H04-31.1
Maury EA. 1975. La estructura del espermatóforo en el género Brachistosternus (Scorpiones,Bothriuridae). Phisys Sec C. 34:179–182.
Maury EA, Acosta LE. 1993. Un nuevo Botrhiurus de grupo bonariensis (Scorpiones,Bothriuridae). B Soc Bio Concepción. 64:39–45.
Mayr E. 1942. Systematics and the origin of species, from the viewpoint of a zoologist.Cambridge (MA): Harvard University Press.
McNab BK. 1973. Energetics and the distribution of vampires. J Mammal. 54:131–144.doi:10.2307/1378876
Moller AP. 1993. Morphology and sexual selection in the barn swallow Hirundo rustica inChernobyl, Ukraine. Proc Soc B Biol Sci. 252:51–57. doi:10.1098/rspb.1993.0045
Moller AP. 1995. Patterns of fluctuating asymmetry in sexual ornaments of birds frommarginal and central populations. Am Nat. 145:316–327. doi:10.1086/285742
Møller AP. 1997. Developmental stability and fitness: a review. Am Nat. 149:916–932.doi:10.1086/286030
Moller AP, Eriksson M. 1994. Patterns of fluctuating asymmetry in flowers: implications forsexual selection in plants. J Evol Biol. 7:97–113. doi:10.1046/j.1420-9101.1994.7010097.x
16 P.A. Olivero et al.
Dow
nloa
ded
by [
200.
16.1
6.13
] at
10:
22 0
8 Se
ptem
ber
2014

Moller AP, Hoglund J. 1991. Patterns of fluctuating asymmetry in avian feather ornaments:implications for models of sexual selection. Proc Soc B Biol Sci. 245:1–5. doi:10.1098/rspb.1991.0080
Moller AP, Magnhagen C, Ulfstrand A, Ulfstrand S. 1995. Phenotypic quality and molt in thebarn swallow, Hirundo rustica. Behav Ecol. 6:242–249. doi:10.1093/beheco/6.3.242
Møller AP, Pomiankowski A. 1993. Fluctuating asymmetry and sexual selection. Genetica.89:267–279. doi:10.1007/BF02424520
Møller AP, Swaddle JP. 1997. Asymmetry, developmental stability and evolution. Oxford(UK): Oxford University Press.
Ojanguren Affilastro AA. 2005. Estudio monográfico de los escorpiones de la RepúblicaArgentina. Rev Iber Aracnol. 11:74–246.
Olivero PA, Mattoni CI, Peretti AV. 2012. Morphometry and geographical variation ofBothriurus bonariensis (Scorpiones: Bothriuridae). J Arachnol. 40:113–122. doi:10.1636/B11-27.1
Palmer AR. 2004. Symmetry breaking and the evolution of development. Science. 306:828–833.doi:10.1126/science.1103707
Palmer AR. 2005. Antisymmetry. In: Hallgrimmson B, Hall BK, editors. Variation.Amsterdam: Elsevier; p. 359–397.
Palmer AR, Strobeck C. 1992. Fluctuating asymmetry as a measure of developmental stability:implications of non-normal distributions and power of statistical test. Acta Zool Fenn.191:57–72.
Palmer AR, Strobeck C. 2003. Fluctuating asymmetry analyses revisited. In: Polak M, editor.Developmental instability (DI): causes and consequences. Oxford (UK): OxfordUniversity Press; p. 279–319.
Parsons PA. 1993. The importance and consequences of stress in living and fossil populations:from life-history variation to evolutionary change. Am Nat. 142:5–20. doi:10.1086/285520
Peretti AV. 1992. El espermatóforo de Bothriurus bonariensis (C. L. Koch) (Sc., Bothriuridae).B Soc Biol Concepción. 63:125–138.
Peretti AV. 1993. Estudio de la biología reproductiva en escorpiones argentinos (Arachnida,Scorpiones): un enfoque etológico [unpublished PhD thesis]. Córdoba: Facultad deCiencias Exactas, Físicas y Naturales, Universidad Nacional de Córdoba.
Peretti AV. 1995. Análisis de la etapa inicial del cortejo de Bothirurus bonariensis (Scorpiones,Bothriuridae) y se relación con el reconocimiento sexual. Rev Arachnol. 11:35–45.
Peretti AV. 2003. Functional morphology of spermatophores and female genitalia in bothriuridscorpions: genital courtship, coercion and other possible mechanisms. J Zool. 261:135–153. doi:10.1017/S095283690300400X
Peretti AV, Depiante ML, Battán Horenstein M. 2001. Petterns of allometry and asymmetry ofbody characters and spermatophores in Bothriurus bonariensis (C.L. Koch, 1842)(Scorpiones: Bothriuridae). In: Fet V, Seldem P, editors. Scorpions 2001. In MemoriamGary A. Polis. London: British Arachnological Society; p. 345–355.
Picton HD, Palmisciano D, Nelson G. 1990. Fluctuating asymmetry and testing isolation ofMontana grizzli bear populations. Int C Bear. 8:421–424.
Polis GA, Sissom WD. 1990. Life history. In: Polis GA, editor. The biology of scorpions.Stanford (CA): Stanford University Press; p. 161–223.
Pomiankowski A, Iwasa Y, Nee S. 1991. The evolution of costly mate preferences. I. Fisherand biased mutations. Evolution. 45:1422–1430. doi:10.2307/2409889
Rasmuson M. 2002. Fluctuating asymmetry – indicator of what? Hereditas. 136:177–183.doi:10.1034/j.1601-5223.2002.1360301.x
Root T. 1988a. Environmental factors associated with avian distributional boundaries. JBiogeogr. 15:489–505. doi:10.2307/2845278
Root T. 1988b. Energy constraints on avian distributions and abundances. Ecology. 69:330–339. doi:10.2307/1940431
Journal of Natural History 17
Dow
nloa
ded
by [
200.
16.1
6.13
] at
10:
22 0
8 Se
ptem
ber
2014
Santos M. 2001. Fluctuating asymmetry is nongenetically related to mating success inDrosophila buzzatii. Evolution. 55:2248–2256. doi:10.1111/j.0014-3820.2001.tb00739.x
Santos M, Brites D, Laayouni H. 2006. Thermal evolution of pre-adult life history traits,geometric size and shape, and developmental stability in Drosophila subobscura. J EvolBiol. 19:2006–2021. doi:10.1111/j.1420-9101.2006.01139.x
Schneider SS, Leamy LJ, Lewis LA, De Grandi-Hoffman G. 2003. The influence of hybridiza-tion between African and European honeybees, Apis mellifera, on asymmetries in wingsize and shape. Evolution. 57:2350–2364. doi:10.1111/j.0014-3820.2003.tb00247.x
Siegel S, Catellan NJ. 1988. Nonparametric statistics for the behavioral sciences. 2nd ed. NewYork (NY): McGraw-Hill.
Sissom WD, Polis GA, Watt DD. 1990. Field and laboratory methods. In: Polis GA, editor.The biology of scorpions. Stanford (CA): Stanford University Press; p. 445–461.
Swaddle JP, Witter MS, Cuthill IC. 1994. The analysis of fluctuating asymmetry. Anim Behav.48:986–989. doi:10.1006/anbe.1994.1327
Timofeeff-Ressovsky NV. 1934. Über der Einfluss des genotypischen Milieus und derAussenbendigungen auf die Realisation des Genotypes. Genmutation vti bei Drosophilafunebris. Nachr Acad Wiss Göttingen II. 61:53–106.
Tomkins JL, Simmons LW. 1995. Patterns of fluctuating asymmetry in earwig forceps: noevidence for reliable signalling. Proc Soc B Biol Sci. 259:89–96. doi:10.1098/rspb.1995.0014
Tomkins JL, Simmons LW. 2003. Fluctuating asymmetry and sexual selection: paradigmsshifts, publication bias and observer expectation. In: Polak M, editor. Developmentalinstability: causes and consequences. Oxford (UK): Oxford University Press; p. 231–261.
Uetz GW, Roberts JA, Wrinn KM, Polak M, Cameron GN. 2009. Impact of a catastrophicnatural disturbance on fluctuating asymmetry (FA) in a wolf spider. Ecoscience. 16:379–386. doi:10.2980/16-3-3261
Van Valen L. 1962. A study of fluctuating asymmetry. Evolution. 16:125–142. doi:10.2307/2406192
Vignoli V, Salomone N, Caruso T, Bernini F. 2005. The Euscorpius tergestinus (C.L. Koch,1837) complex in Italy: biometrics of sympatric hidden species (Scorpiones: Euscorpiidae).Zoologischer Anzeiger - J Comp Zool. 244:97–113. doi:10.1016/j.jcz.2005.05.002
Vishalakshi C. 2011. Fluctuating asymmetry in Drosophila. Low Temp Sci. 69:51–60.Vishalakshi C, Singh BN. 2006. Fluctuating asymmetry in certain morphological traits in
laboratory populations of Drosophila ananassae. Genome. 49:777–785. doi:10.1139/G06-031
Vishalakshi C, Singh BN. 2008a. Effect of environmental stress on fluctuating asymmetry incertain morphological traits in Drosophila ananassae: nutrition and larval crowding. Can JZool. 86:427–437. doi:10.1139/Z08-010
Vishalakshi C, Singh BN. 2008b. Effect of developmental temperature stress on fluctuatingasymmetry in certain morphological traits in Drosophila ananassae. J Therm Biol. 33:201–208. doi:10.1016/j.jtherbio.2007.09.004
Vishalakshi C, Singh BN. 2008c. Mating success is not correlated with fluctuating asymmetryin Drosophila ananassae. Cur Sci. 94:377–381.
18 P.A. Olivero et al.
Dow
nloa
ded
by [
200.
16.1
6.13
] at
10:
22 0
8 Se
ptem
ber
2014

Tab
le1.
RepeatedMeasuresANOVA
inmales
andfemales
ofBotrhiurusbo
nariensisin
thecore
andperiph
eral
popu
lation
s.
Pop
ulations
Mendiolaza
Piedras
deAfilar
Right
Side
LeftSide
Right
Side
LeftSide
Traits
Fp
Fp
Fp
Fp
Males
Han
dleng
th1.26
0.27
60.27
60.27
61.22
0.28
70.28
70.28
7Han
dheight
2.57
0.12
50.12
50.12
50.48
0.49
70.49
70.49
7Han
dwidth
0.76
0.39
30.39
30.39
33.29
0.08
90.08
90.08
9Mov
able
fing
erleng
th3.27
0.08
60.08
60.08
61.52
0.23
60.23
60.23
6Lam
inaleng
th0.01
0.92
00.92
00.92
01.75
0.20
70.20
70.20
7Lam
inawidth
(distal)
2.28
0.14
80.14
80.14
82.30
0.14
90.14
90.14
9Lam
inawidth
(median)
0.01
0.91
60.91
60.91
60.10
0.75
00.75
00.75
0Lam
inawidth
(basal)
0.42
0.52
50.52
50.52
50.03
0.86
40.86
40.86
4Trunk
leng
th0.66
0.42
70.42
70.42
70.00
1.00
01.00
01.00
0Cap
sularlobe
leng
th0.85
0.36
90.36
90.36
91.18
0.29
50.29
50.29
5Cap
sularlobe
width
0.05
0.83
20.83
20.83
20.18
0.67
60.67
60.67
6Dorsalfold
leng
th0.01
0.94
20.94
20.94
22.00
0.17
70.17
70.17
7Dorsalfold
width
1.67
0.21
20.21
20.21
20.00
1.00
01.00
01.00
0Distanceof
Dorsalfold-Lateral
edge
4.12
0.05
70.05
70.05
73.00
0.10
30.10
30.10
3Lateral
edge
leng
th0.38
0.54
50.54
50.54
50.01
0.90
70.90
70.90
7Crest
leng
th1.50
0.23
80.23
80.23
81.52
0.23
60.23
60.23
6Fe
males
Han
dleng
th0.88
0.37
00.37
00.37
01.45
0.25
90.25
90.25
9Han
dheight
1.93
0.19
50.19
50.19
50.71
0.42
20.42
20.42
2Han
dwidth
0.00
1.00
01.00
01.00
01.82
0.20
90.20
90.20
9Mov
able
fing
erleng
th0.49
0.50
10.50
10.50
11.22
0.29
80.29
80.29
8
APPENDIX
Journal of Natural History 19
Dow
nloa
ded
by [
200.
16.1
6.13
] at
10:
22 0
8 Se
ptem
ber
2014
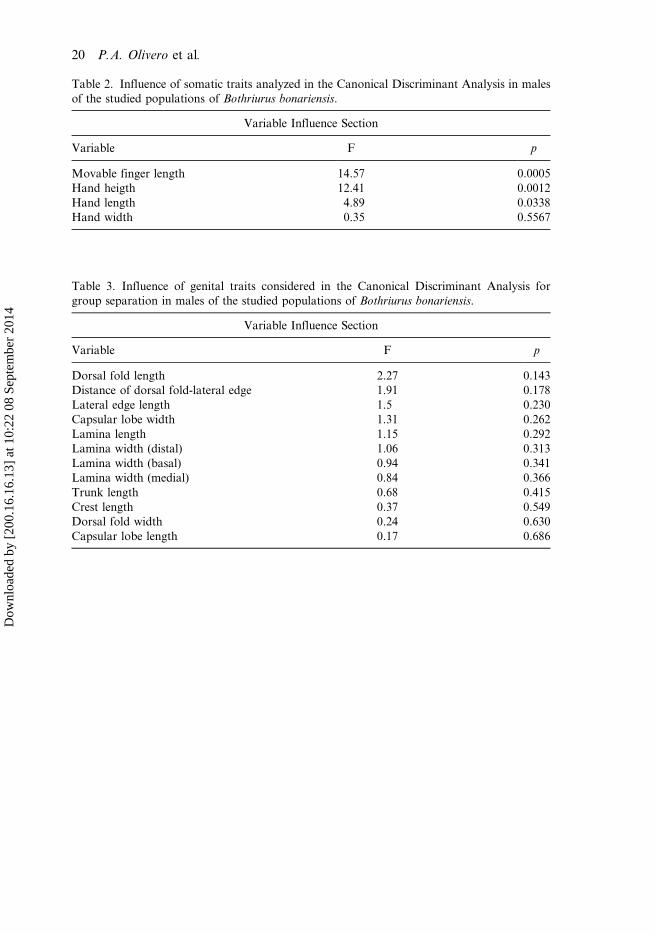
Table 2. Influence of somatic traits analyzed in the Canonical Discriminant Analysis in malesof the studied populations of Bothriurus bonariensis.
Variable Influence Section
Variable F p
Movable finger length 14.57 0.0005Hand heigth 12.41 0.0012Hand length 4.89 0.0338Hand width 0.35 0.5567
Table 3. Influence of genital traits considered in the Canonical Discriminant Analysis forgroup separation in males of the studied populations of Bothriurus bonariensis.
Variable Influence Section
Variable F p
Dorsal fold length 2.27 0.143Distance of dorsal fold-lateral edge 1.91 0.178Lateral edge length 1.5 0.230Capsular lobe width 1.31 0.262Lamina length 1.15 0.292Lamina width (distal) 1.06 0.313Lamina width (basal) 0.94 0.341Lamina width (medial) 0.84 0.366Trunk length 0.68 0.415Crest length 0.37 0.549Dorsal fold width 0.24 0.630Capsular lobe length 0.17 0.686
20 P.A. Olivero et al.
Dow
nloa
ded
by [
200.
16.1
6.13
] at
10:
22 0
8 Se
ptem
ber
2014