Embed Size (px)
Citation preview
ANNUAL REVIEW OF INDUSTRY EXPERIENCE - FINAL REPORT
AS OF DECEMBER 31, 2016
COMMERCIAL VEHICLES ALBERTA AUTO INSURANCE RATE BOARD29 SEPTEMBER 2017
ANNUAL REVIEW OF INDUSTRY EXPERIENCE AS OF DECEMBER 31, 2016
ALBERTA AUTO INSURANCE RATE BOARD
OLIVER WYMAN
CONTENTS
1. Introduction ................................................................................................................. 1
2. Summary of Findings .................................................................................................. 3
3. Analysis – General Discussion .................................................................................... 5
4. Selection of Claim Count and Claim Amount Development Factors ........................... 9
5. Selection of Loss Trend Rates .................................................................................. 12
6. Loss Adjustment Expenses ....................................................................................... 31
7. Catastrophe Provision ............................................................................................... 32
8. Investment Income on Cash Flow ............................................................................. 35
9. Health Cost Recovery ............................................................................................... 36
10. Operating Expenses .................................................................................................. 37
11. Profit .......................................................................................................................... 38
12. Definition of Key Terms ............................................................................................. 39
13. Closing ...................................................................................................................... 48
14. Appendix A ................................................................................................................ 49
15. Appendix B .............................................................................................................. 114
16. Appendix C.............................................................................................................. 151

ANNUAL REVIEW OF INDUSTRY EXPERIENCE AS OF DECEMBER 31, 2016
ALBERTA AUTO INSURANCE RATE BOARD
OLIVER WYMAN
1
1 Introduction
This report was prepared by Oliver, Wyman Limited (Oliver Wyman), actuarial consultants to the
Alberta Automobile Insurance Rate Board (the Board), as part of the Board’s “2017 Annual
Review” of Industry experience to determine Benchmarks for commercial vehicle rate filings
submitted between October 1, 2017 and September 30, 2018.
This report presents the results of our analysis of Alberta’s Industry loss and expense
experience for commercial vehicles reported as of December 31, 2016. The scope of our
analysis includes all coverages:
Basic Coverage: Third Party Liability (TPL) and Accident Benefits (AB)
Additional Coverage: Collision, Comprehensive, All Perils, Specified Perils, and
Underinsured Motorist
Data and Reliances
The data utilized in this study and presented in this report is based on information published by
the General Insurance Statistical Agency (GISA) that has been compiled by the Insurance
Bureau of Canada (IBC). Consistent with the reports published by GISA (and to increase the
volume of data), fleet vehicles are included. We have not audited, verified, or reviewed this data
for reasonableness, accuracy, or consistency, as it is outside the scope of our study. In the
event material errors are found in this data, our findings may need to be revised.
ANNUAL REVIEW OF INDUSTRY EXPERIENCE AS OF DECEMBER 31, 2016
ALBERTA AUTO INSURANCE RATE BOARD
OLIVER WYMAN
2
Limitations
The assumptions and judgments we have made in selecting the factors, provisions, and
methodologies that we present in this report for the Board’s consideration in determining
Benchmarks that apply to commercial vehicle rate filings submitted between October 1, 2017
and September 30, 2018 are based on data and information made available to us at the time of
this analysis. Our assumptions, judgments, and findings are subject to uncertainty as is inherent
in any loss forecast.
Our analysis reflects the experience of the insurance industry as a whole, including the Facility
Association (FA) and may not be appropriate for an individual insurance company whose
portfolio of risks, rates, expenses, and operating characteristics may differ from the insurance
industry averages that underlie our findings.
ANNUAL REVIEW OF INDUSTRY EXPERIENCE AS OF DECEMBER 31, 2016
ALBERTA AUTO INSURANCE RATE BOARD
OLIVER WYMAN
3
2 Summary of Findings In this report we present:
• assumptions, factors, and provisions we recommend1 serve as Benchmarks for rate filings
submitted between October 1, 2017 and September 30, 2018
• other assumptions, factors, and provisions for the Board’s consideration as it reviews rate
filings submitted between October 1, 2017 and September 30, 2018
We note that our recommended assumptions, factors, and provisions that we present in this
report are preliminary, subject to our consideration of feedback provided by interested parties.
Analysis of Industry Claim Cost and Expense Experience
The analysis that we present in this report is of Industry claim cost and expense experience in
Alberta over recent past years. We consider the Industry claim experience through December
31, 2016 as reported to GISA.
Other Comments
In this report we present assumptions, factors, and provisions for the Board’s consideration in its
review of individual rate filings. The projection of future rate needs is subject to considerable
uncertainty. For this reason, we provide rationale for the assumptions, factors, and provisions
we present, as well as information to help the Board evaluate their reasonableness.
1 We refer to these as selections in this report.

ANNUAL REVIEW OF INDUSTRY EXPERIENCE AS OF DECEMBER 31, 2016
ALBERTA AUTO INSURANCE RATE BOARD
OLIVER WYMAN
4
We suggest that the Board also consider the reasonableness of additional information provided
by interested parties that may be more current or that may provide more insight into the Industry
commercial vehicle claim experience (particularly as respects the Bodily Injury coverage and
theft losses) that has emerged or is expected to emerge. However, in doing so the Board
should also consider that the experience of one insurer may not be representative of the
experience of the Industry.
We also suggest the Board recognize that while it may be that, alone, an alternative assumption,
factor, or provision may be reasonable, it may not be reasonable to combine alternative
assumptions, factors, or provisions.

ANNUAL REVIEW OF INDUSTRY EXPERIENCE AS OF DECEMBER 31, 2016
ALBERTA AUTO INSURANCE RATE BOARD
OLIVER WYMAN
5
3 Analysis – General Discussion
Introduction In the sections that follow we present:
• an analysis and discussion of Industry loss development factors and trend rates
• the Industry loss development factors and trend rates we recommend2 the Board consider in
reviewing Industry’s overall performance, and to serve as Benchmarks to apply to rate filings
submitted between October 1, 2017 and September 30, 2018
• other assumptions, factors, and provisions for the Board to consider in reviewing Industry’s
overall performance, and to consider in reviewing rate filings submitted between October 1,
2017 and September 30, 2018
The projection of future rate needs is subject to uncertainty. Therefore, we provide rationale for
the assumptions, factors, provisions, and calculations that we present, as well as information to
help the Board evaluate their reasonableness and the reasonableness of the views that may be
presented by other interested parties.
Claim Cost – Data
The source for the claim data that we analyze is the 2016-2 AUTO7002 Automobile Industry
Exhibit (as of December 31, 2016) provided by GISA. We refer to this as the AIX report.
The claim data that is available through the Industry AIX report is in two categories:
2 See previous comments on recommendations.
ANNUAL REVIEW OF INDUSTRY EXPERIENCE AS OF DECEMBER 31, 2016
ALBERTA AUTO INSURANCE RATE BOARD
OLIVER WYMAN
6
Paid Claim Amounts – claim cost payments made by an insurance company; includes
payments that were made on claims that are now closed, as well as payments made on
claims that are still open (referred to as partial payments).
Case Reserves – the insurance company’s estimate of the amount of future claim cost
payments to be made on individual claims; a case reserve is assigned to each individual
open claim.
The total of the paid claim amounts made on each closed or open claim and the case reserve
carried on each open claim is what is referred to as reported incurred claim amounts.
The case reserves (and hence the reported incurred claim amounts) reflect the views and
opinions of the respective insurance company claim adjusters that handle the individual claims,
and are based on the information available to the claim adjusters as of a particular point in time.
Over time, the case reserves are revised by the claim adjusters to more accurately reflect the
payments that are made or that are expected to be made based on additional information that
becomes available to the claim adjusters.
It is important to note two points about case reserves:
1. How insurance companies determine case reserves varies from company to company.
For example, it is typical for insurance companies to instruct their claim adjusters to post
a pre-set amount (e.g., $10,000 for Bodily Injury claims) as the case reserve when a
claim is first reported and before any investigation is performed. This is referred to as
the “initial claim reserve.” In a sense, the initial claim reserve serves as a placeholder
until investigation is conducted and a more accurate estimate can be established by the
claim adjusters. For those companies that follow this approach, the amount of the initial
case reserve and the length of time the initial claim reserve remains posted varies by
company and, for a particular company, could change over time.
2. The case reserves do not reflect the “actuarial reserve” (also referred to as the bulk
reserve or the IBNR reserve) that insurance companies record in their financial
statements. This actuarial reserve, which is estimated by the insurance company
actuaries, is an aggregate amount that is intended to provide for (1) any overall
ANNUAL REVIEW OF INDUSTRY EXPERIENCE AS OF DECEMBER 31, 2016
ALBERTA AUTO INSURANCE RATE BOARD
OLIVER WYMAN
7
inadequacies or redundancies in the case reserves that are established on individual
claims, and (2) claims (accidents) that occurred but have not yet been reported to the
insurance company as of the time of the financial statement. How insurance companies
(their actuaries) determine the “actuarial reserve” varies from company to company.
Estimating Ultimate Claim Counts and Ultimate Claim Amounts by Accident Half-Year – General Approach We estimate the final (ultimate) number of all claims and cost3 of all claims that arise from
events that occur in the first and second half of the year, separately, through to December 2016
(referred to as “accident half-years”) and then use those estimates to measure and select loss
trend rates.
We estimate the final/ultimate claim cost by accident half-year by performing our own estimate
of the needed actuarial reserve for all insurance companies in aggregate (i.e., the Industry), and
adding that amount to the reported incurred claim amounts that insurance companies report to
GISA and which are published by GISA. In doing so we consider the Industry’s reported claim
amounts (the aggregate paid claim amounts and individual claim case reserves), but we do not
consider the actuarial reserves established by each insurance company as they are not reported
to GISA.
We estimate the Industry actuarial reserve by applying what are referred to as “loss
development factors” to the reported incurred claim amounts. The selection of loss development
factors that we apply is based on an analysis that we perform to determine how accurate the
individual claim case reserves established by insurance companies (in aggregate) have been
historically. We refer to the historical accuracy of the individual claim case reserves as loss
development patterns.
3 By “final” or “ultimate” cost we mean the amount paid by insurance companies at the time that all claims that occur in a
particular year have been reported and settled.
ANNUAL REVIEW OF INDUSTRY EXPERIENCE AS OF DECEMBER 31, 2016
ALBERTA AUTO INSURANCE RATE BOARD
OLIVER WYMAN
8
We select loss4 development factors to estimate the actuarial reserve need, hence the final
claim cost, for each accident half-year through December 2016 (we group claims by the accident
half-year that the events that give rise to the claims occur), separately for each of the
coverages.5 We follow a similar approach (using what are referred to as claim count
development factors) to estimate the final number of claims that will arise from events that have
occurred by accident half-year through December 2016, separately for each of the coverages.
Our selection of loss development factors and claim count development factors for each of the
Basic coverages and Additional coverages is discussed in the next section.
4 We use the terms “loss,” “claim amount,” and “claim cost” interchangeably in this report. In this report, all these terms include
a provision for allocated loss adjustment expenses (ALAE).
5 This actuarial technique is often referred to as the “Incurred Loss Development Method” or the “Reported Incurred Loss
Development Method.”
ANNUAL REVIEW OF INDUSTRY EXPERIENCE AS OF DECEMBER 31, 2016
ALBERTA AUTO INSURANCE RATE BOARD
OLIVER WYMAN
9
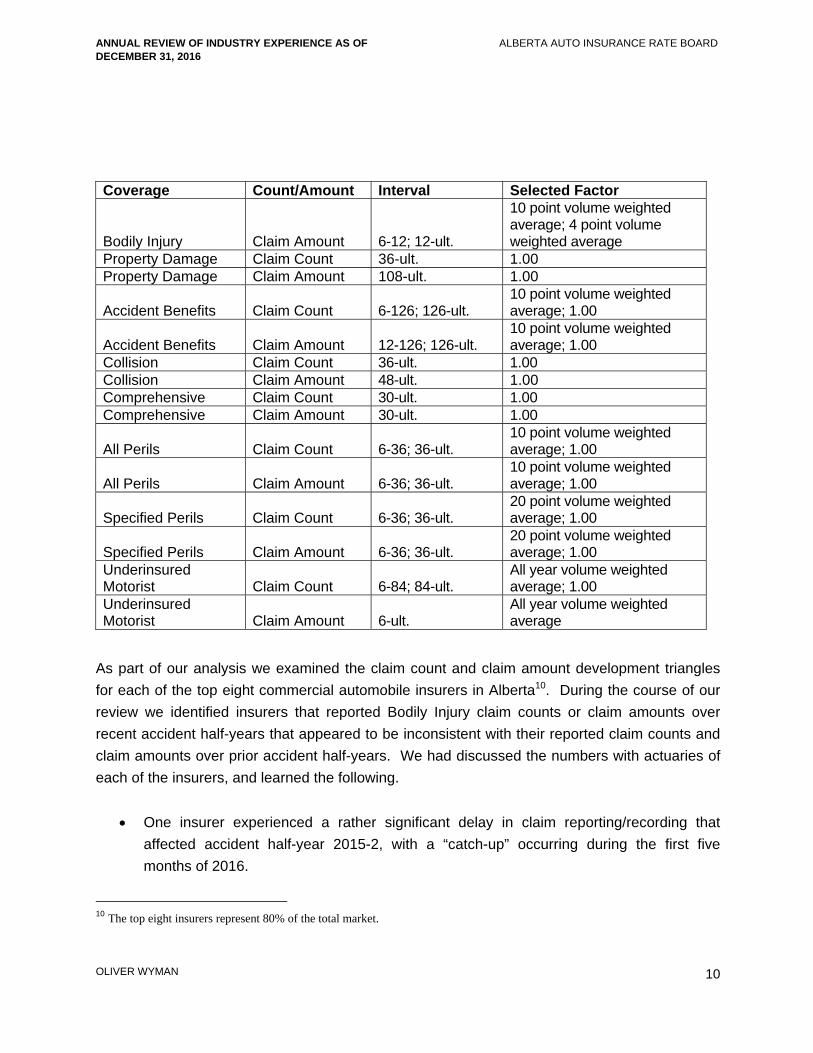
4 Selection of Claim Count and Claim Amount Development Factors The data we use to select loss development factors and claim count development factors is the
2016-2 AUTO7002 Industry Alberta accident half-year6 reported incurred loss and allocated loss
adjustment expense (ALAE) and claim count data.
Estimation of Industry Ultimate Claim Counts and Loss Amounts The Industry Alberta experience upon which the loss trend rates are based must be adjusted to
an ultimate claim count and loss amount level. We do so through the application of what are
referred to as development factors to the reported claim counts and claim amounts as of
December 31, 2016. We select development factors based on a review of the Industry Alberta
loss development patterns; we do this by coverage7. Our selected development factors are
generally based on: (a) the volume weighted average of the last four observed development
factors for the half-years ending December for development period 6 months to 12 months8 if
there is evidence of seasonality9; and (b) the volume weighted average of the last six observed
development factors for the development periods beyond 12 months or beyond 6 months if no
evidence of 6 to 12 month seasonality. The exceptions are as follows.
6 Accident half-year refers to either the period January 1 through June 30, or July 1 through December 31 of the indicated year.
We use the terms “accident half-year” and “semester” (i.e., first semester or second semester; or the June semester or December
semester) interchangeably in this report. We also refer to accident half-years or semesters as XXXX-1 or XXXX-2, or XXXX.1
or XXXX.2 where “XXXX” refers to the indicated year.
7 Our review of Third Party Liability is split between Bodily Injury and Property Damage.
8 The 6-12 month development period refers to the six months following the end of the particular accident half-year. For
example, the 6-12 month development period for the 2015-2 accident half-year is the period spanning January 1, 2016 through
June 30, 2016. Other development periods referenced in this report (e.g., 12-18) are similarly defined.
9 Evidence of seasonality was found to be present for Bodily Injury claim counts, Property Damage claim counts and amounts,
Collision claim amounts, and Comprehensive claim counts.
ANNUAL REVIEW OF INDUSTRY EXPERIENCE AS OF DECEMBER 31, 2016
ALBERTA AUTO INSURANCE RATE BOARD
OLIVER WYMAN
10
Coverage Count/Amount Interval Selected Factor
Bodily Injury Claim Amount 6-12; 12-ult.
10 point volume weighted average; 4 point volume weighted average
Property Damage Claim Count 36-ult. 1.00 Property Damage Claim Amount 108-ult. 1.00
Accident Benefits Claim Count 6-126; 126-ult. 10 point volume weighted average; 1.00
Accident Benefits Claim Amount 12-126; 126-ult. 10 point volume weighted average; 1.00
Collision Claim Count 36-ult. 1.00 Collision Claim Amount 48-ult. 1.00 Comprehensive Claim Count 30-ult. 1.00 Comprehensive Claim Amount 30-ult. 1.00
All Perils Claim Count 6-36; 36-ult. 10 point volume weighted average; 1.00
All Perils Claim Amount 6-36; 36-ult. 10 point volume weighted average; 1.00
Specified Perils Claim Count 6-36; 36-ult. 20 point volume weighted average; 1.00
Specified Perils Claim Amount 6-36; 36-ult. 20 point volume weighted average; 1.00
Underinsured Motorist Claim Count 6-84; 84-ult.
All year volume weighted average; 1.00
Underinsured Motorist Claim Amount 6-ult.
All year volume weighted average
As part of our analysis we examined the claim count and claim amount development triangles
for each of the top eight commercial automobile insurers in Alberta10. During the course of our
review we identified insurers that reported Bodily Injury claim counts or claim amounts over
recent accident half-years that appeared to be inconsistent with their reported claim counts and
claim amounts over prior accident half-years. We had discussed the numbers with actuaries of
each of the insurers, and learned the following.
One insurer experienced a rather significant delay in claim reporting/recording that
affected accident half-year 2015-2, with a “catch-up” occurring during the first five
months of 2016.
10 The top eight insurers represent 80% of the total market.
ANNUAL REVIEW OF INDUSTRY EXPERIENCE AS OF DECEMBER 31, 2016
ALBERTA AUTO INSURANCE RATE BOARD
OLIVER WYMAN
11
One insurer changed the way it recorded (and reported to GISA) its Bodily Injury claims –
essentially not reporting claims for which it was believed that no loss (indemnity or ALAE)
amounts would be paid. This change began during the first half of 2015.
As respects Bodily Injury claim counts, we now find that the above changes in claim reporting do
not materially affect the development patterns or selection of ultimate claim counts. However,
as respect Bodily Injury claim amount, we find that the above changes in claim reporting cause
the 6-12 development factor that we would have otherwise selected (the four point volume
weighted average as noted in the above chart) to be too high by about 5%. We, therefore,
select the ten point weighted average factor, which is about 5% lower than the four point volume
weighted average factor.
ANNUAL REVIEW OF INDUSTRY EXPERIENCE AS OF DECEMBER 31, 2016
ALBERTA AUTO INSURANCE RATE BOARD
OLIVER WYMAN
12
5 Selection of Loss Trend Rates
Introduction
Loss trend rates are factors that are used to determine rate level indications. They are applied
to the experience period incurred losses to adjust for the cost levels that are anticipated during
the policy period covered under the proposed rate program.
The application of trend rates is, essentially, a two-step process. The data in the experience
period under consideration is adjusted to reflect changes in cost conditions that have taken
place (i.e., “past trend”), and then the data is further adjusted to reflect future changes in cost
conditions that are expected to occur during the period the new premiums will be in effect (i.e.,
“future trend”).
Therefore, past trend rates should reflect the underlying trend patterns that occurred during the
experience period. Future trend rates should reflect those same patterns that occurred during
the experience period, as well as the likelihood that those patterns may change.
To derive estimates of appropriate loss trend rates, we performed a regression analysis using a
model we developed, on our estimates of the Industry Alberta ultimate claim frequency, claim
severity and loss cost11 by accident half-year that we derived through the application of loss
development factors and claim count development factors that we select (as we discuss in
Section 4).
We performed our regression analysis by coverage. In doing so, we reflect parameters that
could have an impact on the trends, such as time and seasonality. We also consider the results
of statistical tests that we apply. As respects the Adjusted R-square, we generally refer to
values of 80% or greater as ”high,” values between 40% and 80% as “moderate,” and values
11 Our severity and loss cost estimates include allocated loss adjustment expenses and a provision for the unallocated loss
adjustment expenses.
ANNUAL REVIEW OF INDUSTRY EXPERIENCE AS OF DECEMBER 31, 2016
ALBERTA AUTO INSURANCE RATE BOARD
OLIVER WYMAN
13
below 40% as “low.” We consider p-values under 5% to be significant. The confidence intervals
that are presented represent a 95% probability range.
The identification of the underlying trend patterns over the experience period is challenging
because factors such as statistical fluctuation in the data points, changes in the underlying
exposure, or abnormal weather conditions, etc., can make the underlying trend patterns difficult
to discern. For this reason, we modeled the data several different ways in an attempt to identify
the underlying trends during the experience period: with and without certain data points to
improve our understanding of the sensitivity of the calculated loss trend rates to the inclusion or
exclusion of those points, and over time periods that are longer than the experience period as a
means of increasing the stability/reliability of the data being analyzed and to assess changes in
trend patterns that may have occurred. In selecting future trend rates, if appropriate, we
adjusted our selected past trend rates after giving consideration to the changes that have
occurred over the recent past if there is evidence of new patterns emerging.
Selection of Loss Trend Rates12
Time Period
We present the experience by accident half-year, spanning the period 2002-1 to 2016-2.
Seasonality
Some coverages exhibit what is referred to as “seasonality” – where claim costs (number
of claims or claim amounts) incurred during the first half of a year are generally
higher/lower than claim costs incurred during the second half of a year. In the coverage-
by-coverage discussion that follows, we state whether or not seasonality is applied.
12 The past frequency rates, severities, and loss costs discussed in this section, including those presented in the graphs, represent
our estimates of what the frequency rates, severities, and loss costs have been. Our estimates are based on our ultimate claim
count and claim amount estimates discussed in the previous section; and include the allocated loss adjustment expenses and a
provision for the unallocated loss adjustment expenses. Other actuaries may very well have different ultimate claim count and
claim amount estimates, and hence different estimates of past frequency rates, severities, and loss costs.
ANNUAL REVIEW OF INDUSTRY EXPERIENCE AS OF DECEMBER 31, 2016
ALBERTA AUTO INSURANCE RATE BOARD
OLIVER WYMAN
14
Weather
We noted in our 2016 AR report that Alberta experienced relatively mild weather (low snow
precipitation) during the second half of 2015, and that this may have contributed to a general
decline in frequency.13 The recorded snow precipitation level at the Edmonton and Calgary
airports during the first half of 2016 was also relatively low14, while the snow precipitation level in
the second half of 2016 was more normal - about 45% higher than the second half of 2015, but
just 5% below the average level of snow precipitation for the second half of a year in these
areas. The estimated Bodily Injury and Property Damage claim frequencies for the second half
of 2016 are each close to 15% lower than the second half of 2015, while the estimated Collision
frequency is about 3% higher than the second half of 2015. Despite the decline in Bodily Injury
and Property Damage frequency in 2016-2 when the snow precipitation level was more normal
(and which may be due to the rise in the unemployment rate discussed next), we continue to
believe that weather conditions – particularly snow precipitation - (among other factors) affect
claim frequency. However, recognizing the limitations of the available weather data and of its
use15, and that based on our analysis snow precipitation doesn’t materially improve the
regression fits over those in which we include the unemployment rate as a parameter (see
below), we have not considered, nor present, snow precipitation level as a parameter in our
trend analysis.
13 The snow precipitation level for the Edmonton and Calgary airports during the second half of 2015 was the lowest recorded
level for the second half of a year since 2007, and about 35% below the average of all prior years (second half) since 1995.
14 The snow precipitation level for the Edmonton and Calgary airports during the first half of 2016 was the lowest recorded level
for the first half of a year (over the period 1995-2016) and about 70% below the average of all prior years (first half) since 1995. 15 The Edmonton and Calgary airport areas are not fully representative of the driving conditions throughout Alberta, the available
data for these two areas may not be complete (and there are gaps of various degrees in the recorded snowfall throughout the
province), and there is some overlap with seasonality. Also, other factors, such as mileage driven, road congestion, and
distracted driving are likely also affecting frequency.
ANNUAL REVIEW OF INDUSTRY EXPERIENCE AS OF DECEMBER 31, 2016
ALBERTA AUTO INSURANCE RATE BOARD
OLIVER WYMAN
15
Unemployment
Alberta’s unemployment rate reached 8.1% in 2016, the highest level in twenty years.16 The
sharp rise in the unemployment rate, which is coincident with the low level of snowfall, may be
contributing to the recent decline in claim frequency. We have not explicitly included
unemployment as a parameter in our regression analysis that underlies our selected trend rates.
However, we present exhibits with unemployment as a parameter for informational purposes in
Appendix B, and present graphs of fitted frequency regressions with unemployment for Bodily
Injury, Property Damage, and Collision as a parameter in Appendix C.
Reforms and Level Changes
The purpose of the reform or level change parameter is to isolate and, in a sense, remove the
impact that reforms or other events had on the level of claim costs so that the underlying claim
cost trend can be identified. Our selected Bodily Injury trend rate is based on claim experience
after the 2004 reforms, so we do not include a reform parameter in our regression analysis.
Other Considerations
In selecting loss trend rates, we also consider:
variance in results based on different historical time periods selected (i.e., changes in
trend patterns)
relationship between frequency and severity trend patterns
uncertainty in the estimated values
16 Source: Statistics Canada
ANNUAL REVIEW OF INDUSTRY EXPERIENCE AS OF DECEMBER 31, 2016
ALBERTA AUTO INSURANCE RATE BOARD
OLIVER WYMAN
16
Our Selected Trend Rates
Bodily Injury
Based on data as of December 31, 2015, we selected a past loss cost trend rate of +5.0%.
We estimate that during 2016, as compared to 2015, claim frequency decreased by 19.2%,
severity increased by 14.8%, and loss cost decreased by 7.2%.
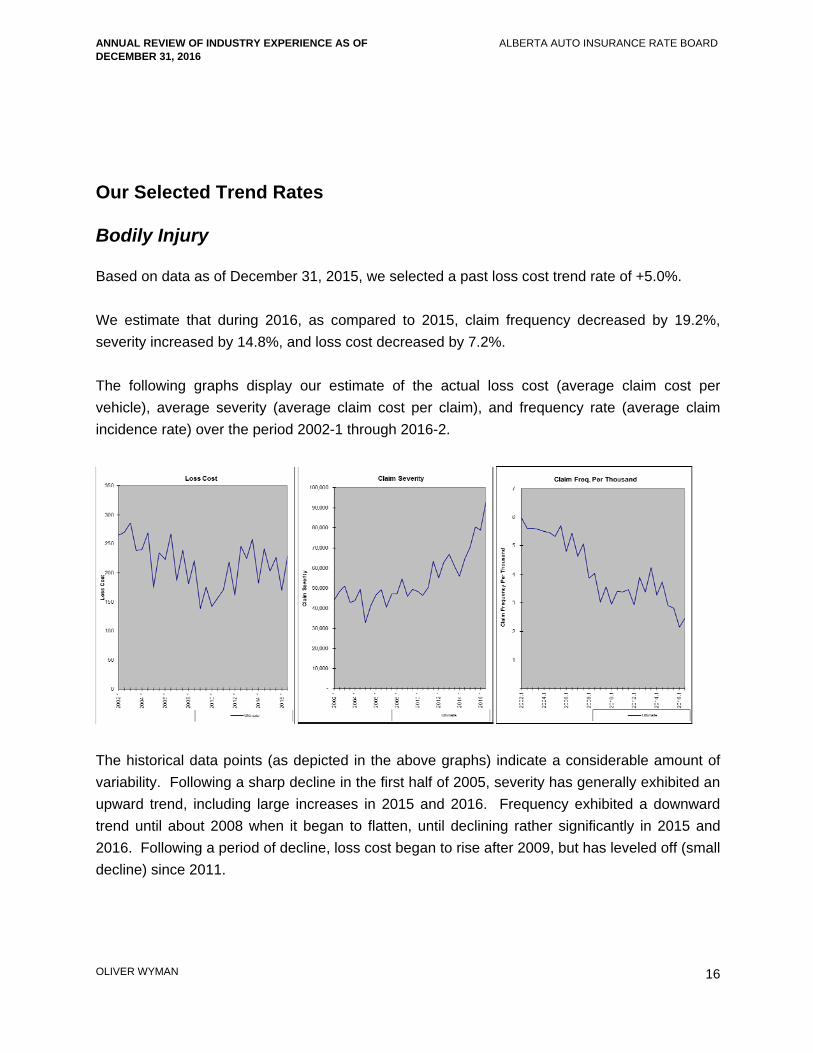
The following graphs display our estimate of the actual loss cost (average claim cost per
vehicle), average severity (average claim cost per claim), and frequency rate (average claim
incidence rate) over the period 2002-1 through 2016-2.
The historical data points (as depicted in the above graphs) indicate a considerable amount of
variability. Following a sharp decline in the first half of 2005, severity has generally exhibited an
upward trend, including large increases in 2015 and 2016. Frequency exhibited a downward
trend until about 2008 when it began to flatten, until declining rather significantly in 2015 and
2016. Following a period of decline, loss cost began to rise after 2009, but has leveled off (small
decline) since 2011.
ANNUAL REVIEW OF INDUSTRY EXPERIENCE AS OF DECEMBER 31, 2016
ALBERTA AUTO INSURANCE RATE BOARD
OLIVER WYMAN
17
The modeled severity, frequency, and loss cost trends, associated Adjusted R-square values, p-
values, and confidence intervals, over various time periods, with and without a seasonality
parameter, with and without an unemployment rate parameter, with no level changes, and with
no data exclusions, are presented in Appendix B. We show modeled trends ending 2014-2,
2016-1, and 2016-2 given the variability in the data points, and the uncertainty surrounding the
estimated Bodily Injury claim costs.
The modeled severity trends, without seasonality or unemployment (which we do not find to be
significant), over the periods beginning 2005 through 2011 and ending either 2016-1 or 2016-2
generally fall within the range of +6.0% to +9.0%17 with moderate Adjusted R-square values and
significant p-values for time. However, to be consistent with our selected frequency trend model
(see below), we consider the modeled severity trends ending 2014-2 (prior to the sharp rise in
severity and sharp decline in frequency). We select a severity trend of +5.0% based on the
modeled trends over the longer time periods ending 2014-2.
The selection of a frequency trend is challenging.
The modeled frequency trends over the periods beginning 2005 through 2010 and ending 2016-
2, with seasonality (which we find to be significant), range from about -5.5% to -3.5%, but with
moderate to low Adjusted R-squares. However, this time period spans a period of declining
frequency (through 2010), flat to increasing frequency (through 2014), and sharply decreasing
frequency (in 2015 and 2016). We note that the modeled trends beginning after 2008 and
ending 2016 gradually decline and have higher Adjusted R-squares, and this is due to the
greater impact of the noted sharp decline in frequency in 2015 and 2016.
The sharp decline in frequency in 2015 and 2016 (from 3.51 claims per 1,000 vehicles in 2014
to 2.31 claims per 1,000 vehicles in 2016) – a much sharper decline that occurred for private
passenger vehicles - is coincident with the noted change in economic conditions (sharp rise in
the unemployment rate). This suggests that that the high unemployment levels may have had
some impact on claim frequency.18
17 The higher trends are over the more recent periods where the impact of the relatively high severities in 2015 and 2016 is
greatest.
18 Perhaps fewer miles driven and less traffic congestion.
ANNUAL REVIEW OF INDUSTRY EXPERIENCE AS OF DECEMBER 31, 2016
ALBERTA AUTO INSURANCE RATE BOARD
OLIVER WYMAN
18
In Appendix C we discuss the use of unemployment as a parameter.
We assume that those that commented on the consideration of the snow precipitation and
unemployment levels in our Preliminary Report on private passenger vehicles would have the
same views as to their consideration for commercial vehicles – which is that there are limitations
to consider and that further research is necessary. We agree, although we find it difficult to
dismiss the strong regression fits when unemployment is included as a parameter.
We, therefore, consider the modeled frequency trends and associated regression statistics
beginning 2008 ending 2014-2 - the period beginning when the frequency rate began to flatten
and ending just prior to the sharp decline (which for this study we treat as variability that is not a
measure of the true underlying trend), including seasonality, and select a past/future frequency
trend of +0.0%.
As a result we select a past loss cost trend rate of +5.0% – the same as our 2016 AR selected
trend.
Property Damage
Based on data as of December 31, 2015, we selected a past loss cost trend rate of +5.5%.
We estimate that during 2016, as compared to 2015, claim frequency decreased by 17.3%,
severity increased by 3.1%, and loss cost decreased by 14.7%. As discussed earlier, this large
decline in frequency may be, in part, attributed to economic conditions.
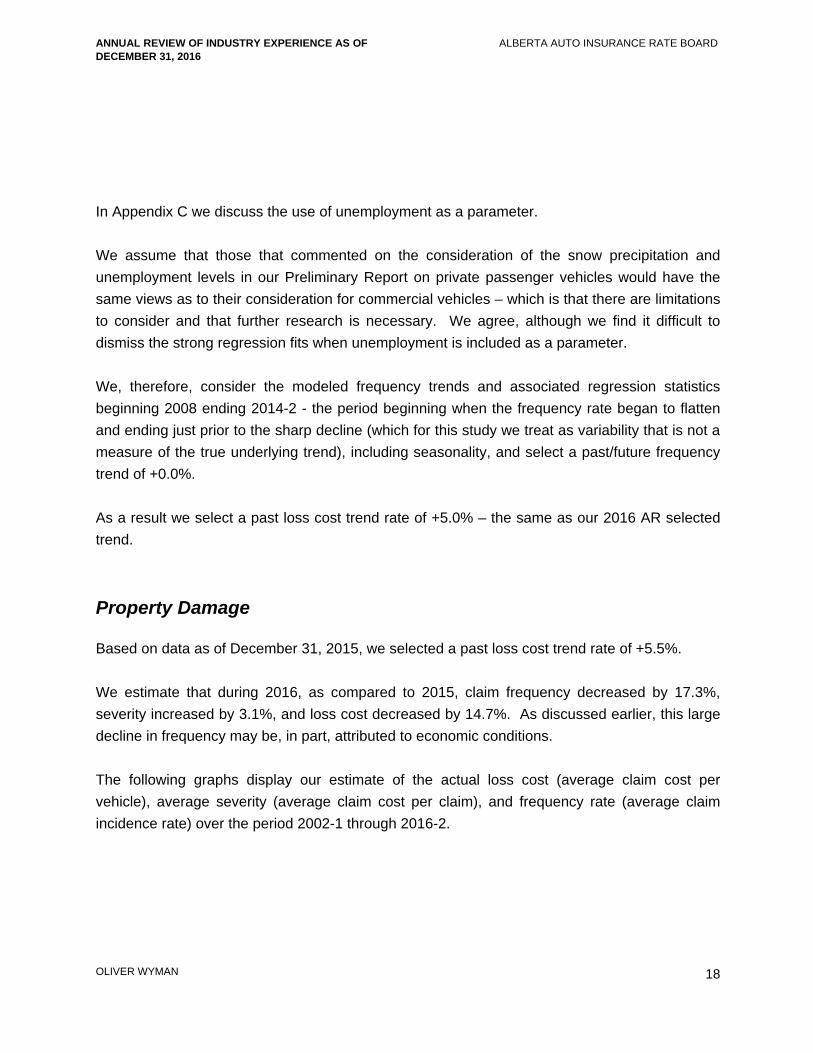
The following graphs display our estimate of the actual loss cost (average claim cost per
vehicle), average severity (average claim cost per claim), and frequency rate (average claim
incidence rate) over the period 2002-1 through 2016-2.
ANNUAL REVIEW OF INDUSTRY EXPERIENCE AS OF DECEMBER 31, 2016
ALBERTA AUTO INSURANCE RATE BOARD
OLIVER WYMAN
19
The historical data points indicate a considerable amount of variability – particularly for
frequency. Severity has generally trended upward, including a decline from 2007 to 2009, and a
subsequent continuation of the upward trend; frequency has exhibited great variability, with a
sharp decline in 2015 and 2016; loss cost has also exhibited considerable variability, also with a
sharp decline in 2015 and 2016.
The modeled severity, frequency, and loss cost trends, associated Adjusted R-square values, p-
values, and confidence intervals over various time periods ending 2014-2 and 2016-2, with and
without a seasonality parameter, with and without an unemployment rate parameter, with no
level changes, and with no data exclusions, are presented in Appendix B.
The modeled severity trends, without seasonality or unemployment, over the periods beginning
2005 through 2012 and ending 2016-2 generally fall within the range of +2.5% to +4.5% with
moderate Adjusted R-square values and significant p-values for time. We select a severity trend
of +4.5% based on the modeled trends over the time periods with the higher Adjusted R-
squares.
Our discussion regarding frequency is similar to that for Bodily Injury.
The modeled frequency trends over the periods beginning 2005 through 2009 and ending 2016-
2, without seasonality (which we do not find to be significant), generally cluster around -1.5%,
ANNUAL REVIEW OF INDUSTRY EXPERIENCE AS OF DECEMBER 31, 2016
ALBERTA AUTO INSURANCE RATE BOARD
OLIVER WYMAN
20
but with low Adjusted R-squares and p-values for time that are not significant. However, this
time period spans a period of declining frequency (through 2010), flat to increasing frequency
(through 2014), and sharply decreasing frequency (in 2015 and 2016). We note that the
modeled trends beginning after 2008 and ending 2016 gradually decline, have higher Adjusted
R-squares, and p-values for time that are significant – and this is due to the greater impact of the
noted sharp decline in frequency in 2015 and 2016.
The sharp decline in frequency in 2015 and 2016 (from 20.24 claims per 1,000 vehicles in 2014
to 14.39 claims per 1,000 vehicles in 2016) is coincident with the noted change in economic
conditions (sharp rise in the unemployment rate). This suggests that that the high
unemployment levels may have had some impact on claim frequency.
In Appendix C we discuss the use of unemployment as a parameter.
We assume that those that commented on the consideration of the snow precipitation and
unemployment levels in our Preliminary Report on private passenger vehicles would have the
same views as to their consideration for commercial vehicles – which is that there are limitations
to consider and that further research is necessary. We agree, although we find it difficult to
dismiss the strong regression fits when unemployment is included as a parameter.
We select a past/future frequency trend of +0.0% based on the modeled trends and associated
regression statistics ending 2014-2 - prior to the decline in 2015 and 2016 (which for this study
we treat as variability that is not a measure of the true underlying trend), without seasonality or
unemployment.
As a result we select a past and future loss cost trend rate of +4.5% – one point lower than our
2016 AR selected trend.
ANNUAL REVIEW OF INDUSTRY EXPERIENCE AS OF DECEMBER 31, 2016
ALBERTA AUTO INSURANCE RATE BOARD
OLIVER WYMAN
21
Accident Benefits
Based on data as of December 31, 2015, we selected a past loss cost trend rate of +0.0%.
We estimate that during 2016, as compared to 2015, claim frequency decreased by 3.9%,
severity decreased by 2.1%, and loss cost decreased by 6.9%.
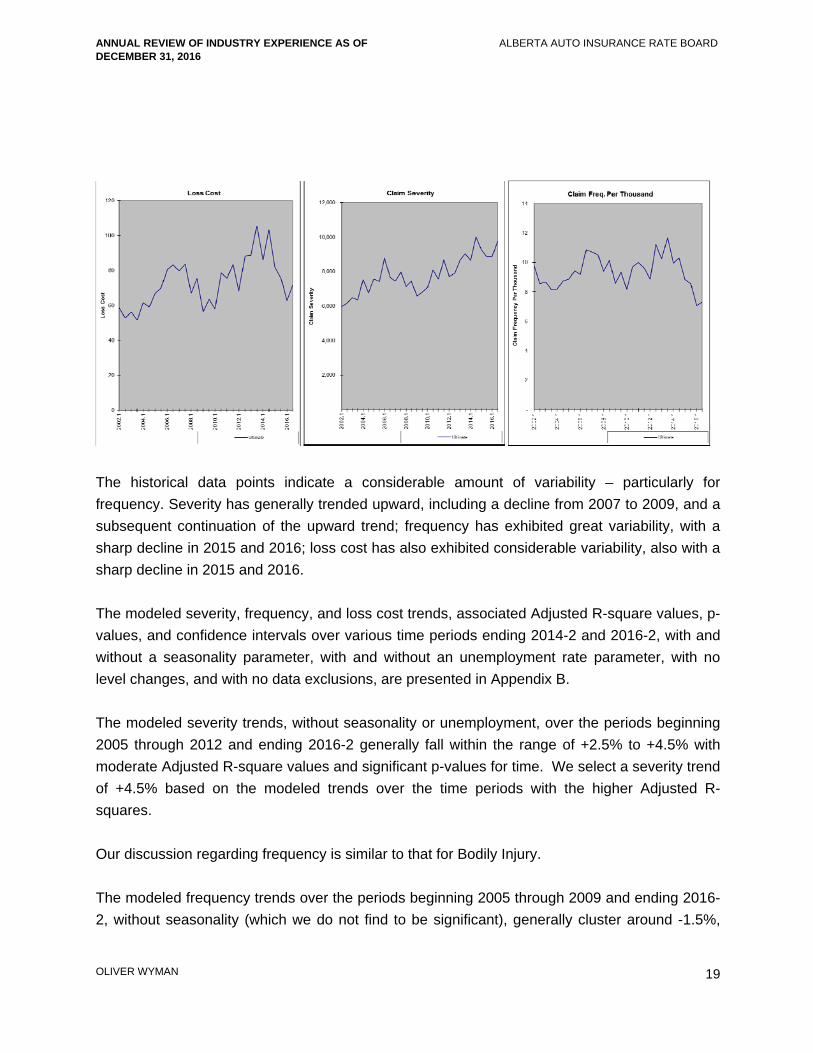
The following graphs display our estimate of the actual loss cost (average claim cost per
vehicle), average severity (average claim cost per claim), and frequency rate (average claim
incidence rate) over the period 2002-1 through 2016-2.
The historical data points reveal a considerable amount of variability with severity generally
exhibiting an upward trend with relatively high data points in 2007-2 and 2013-1; frequency
exhibiting a downward trend, including a relatively flat trend from about 2009 to 2014, followed
by declines in 2015 and 2016; and loss cost exhibiting a somewhat flat trend, also with relatively
high 2007-2 and 2013-1 data points.
The modeled severity, frequency, and loss cost trends, associated Adjusted R-square values, p-
values, and confidence intervals over various time periods ending 2016-2, with and without a
ANNUAL REVIEW OF INDUSTRY EXPERIENCE AS OF DECEMBER 31, 2016
ALBERTA AUTO INSURANCE RATE BOARD
OLIVER WYMAN
22
seasonality parameter, with and without an unemployment rate parameter, with no level
changes, with and without 2007-2 and 2013-1, are presented in Appendix B.
We note that the frequency rate did not decline as sharply in 2015 and 2016 as it did for the
other major coverages. We, therefore, do not discuss results including the unemployment rate
as a parameter, although we present modeled trends including unemployment in Appendix B.
All of the modeled severity trends ending 2016-2, without seasonality (which we do not find to be
significant), have low Adjusted R-square values and p-values for time that are not significant.
The modeled frequency trends over the time periods beginning 2005 through 2011 and ending
2016-2 generally fall within the range of approximately -3.5% to -5.0%, with moderate Adjusted
R-square values and significant p-values for time. The modeled frequency trends are more
negative over the more recent time periods and this is due to the greater impact of the frequency
decline in 2015 and 2016.
All of the modeled loss cost trends ending 2016-2, without seasonality (which we do not find to
be significant), have low Adjusted R-square values and p-values for time that are not significant.
Given the loss cost results, we select a past loss cost trend rate of +0.0%, the same as our prior
selected trend.
Collision
Based on data as of December 31, 2015, we selected a past loss cost trend rate of +5.0%.
We estimate that during 2016, as compared to 2015, claim frequency decreased by 4.7%,
severity decreased by 3.8%, and loss cost decreased by 8.4%.
The following graphs display our estimate of the actual loss cost (average claim cost per
vehicle), average severity (average claim cost per claim), and frequency rate (average claim
incidence rate) over the period 2002-1 through 2016-2.

ANNUAL REVIEW OF INDUSTRY EXPERIENCE AS OF DECEMBER 31, 2016
ALBERTA AUTO INSURANCE RATE BOARD
OLIVER WYMAN
23
The historical data points indicate a considerable amount of variability – particularly for
frequency. Severity has exhibited a generally upward trend, including a decline beginning in
2008 and a continuation of the upward trend beginning in 2010. Frequency has exhibited
changing trend patterns - a downward trend since 2006 that has been relatively flat from 2008
and 2009 through 2014, with a sharp decline in 2015 and more modest decline in 2016. Loss
cost has also exhibited changing patterns, including an upward trend through 2007, followed by
a downward trend through 2010, an upward trend through 2014, and declines in 2015 and 2016.
The modeled severity, frequency, and loss cost trends, associated Adjusted R-square values, p-
values, and confidence intervals over various time periods ending 2014-2 and 2016-2, with and
without a seasonality parameter, with and without an unemployment rate parameter, with no
level changes, are presented in Appendix B.
The modeled severity trends, including seasonality (which we find to be significant), over all time
periods ending 2016-2 generally fall within the range of +2.5% to +4.0%, with moderate
Adjusted R-square values and significant p-values. The higher modeled trends generally begin
around 2009, which generally coincides with the change in pattern observed in the graph – a
trend that is tempered by the decline in severity in 2016. We select a severity trend of +4.0%
based on the modeled trends over the periods beginning 2009 and 2010, which have the
highest Adjusted R-squares.
ANNUAL REVIEW OF INDUSTRY EXPERIENCE AS OF DECEMBER 31, 2016
ALBERTA AUTO INSURANCE RATE BOARD
OLIVER WYMAN
24
Our discussion regarding frequency is similar to that for Bodily Injury and Property Damage.
The modeled frequency trends over the periods beginning 2005 through 2010-1 and ending
2016-2, without seasonality (which we do not find to be significant), generally fall within the
range of -3.5% to -3.0%, but with moderate to low Adjusted R-squares. However, this time
period spans a period of declining frequency (through 2010), flat to increasing frequency
(through 2014) and sharply decreasing frequency in 2015 and a slight decline in 2016. We note
that the modeled trends beginning after 2010 and ending 2016 gradually decrease, have
modestly higher Adjusted R-squares, with p-values for time that are significant – and this is due
to the greater impact of the noted sharp decline in frequency in 2015 and 2016.
The sharp decline in frequency in 2015 (primarily) and 2016 (from 24.54 claims per 1,000
vehicles in 2014 to 19.76 claims per 1,000 vehicles in 2016) is coincident with the noted change
in economic conditions. This suggests that that the high unemployment levels may have had
some impact on claim frequency.
In Appendix C we discuss the use of unemployment as a parameter.
We assume that those that commented on the consideration of the snow precipitation and
unemployment levels in our Preliminary Report on private passenger vehicles would have the
same views as to their consideration for commercial vehicles – which is that there are limitations
to consider and that further research is necessary. We agree, although we find it difficult to
dismiss the strong regression fits when unemployment is included as a parameter.
We select a past/future frequency trend of +0.0%, based on the modeled trends and associated
statistics over the periods beginning 2008 and 2009, ending 2014-2, - prior to the decline in
2015 and 2016 (which for this study we treat as variability that is not a measure of the true
underlying trend), without seasonality or unemployment.
As a result we select a past/future loss cost trend rate of +4.0% –one point lower than our 2016
AR selected trend.
ANNUAL REVIEW OF INDUSTRY EXPERIENCE AS OF DECEMBER 31, 2016
ALBERTA AUTO INSURANCE RATE BOARD
OLIVER WYMAN
25
Comprehensive
Based on data as of December 31, 2015, we selected a past loss cost trend rate of +1.0%
through December 31, 2014, a level change at 2015 of +12%, and a future trend rate beginning
January 1, 2015 of +5%.
We estimate that during 2016, as compared to 2015, including catastrophe related claims, claim
frequency increased by 10.8%, severity decreased by 2.9%, and loss cost increased by 7.6%.
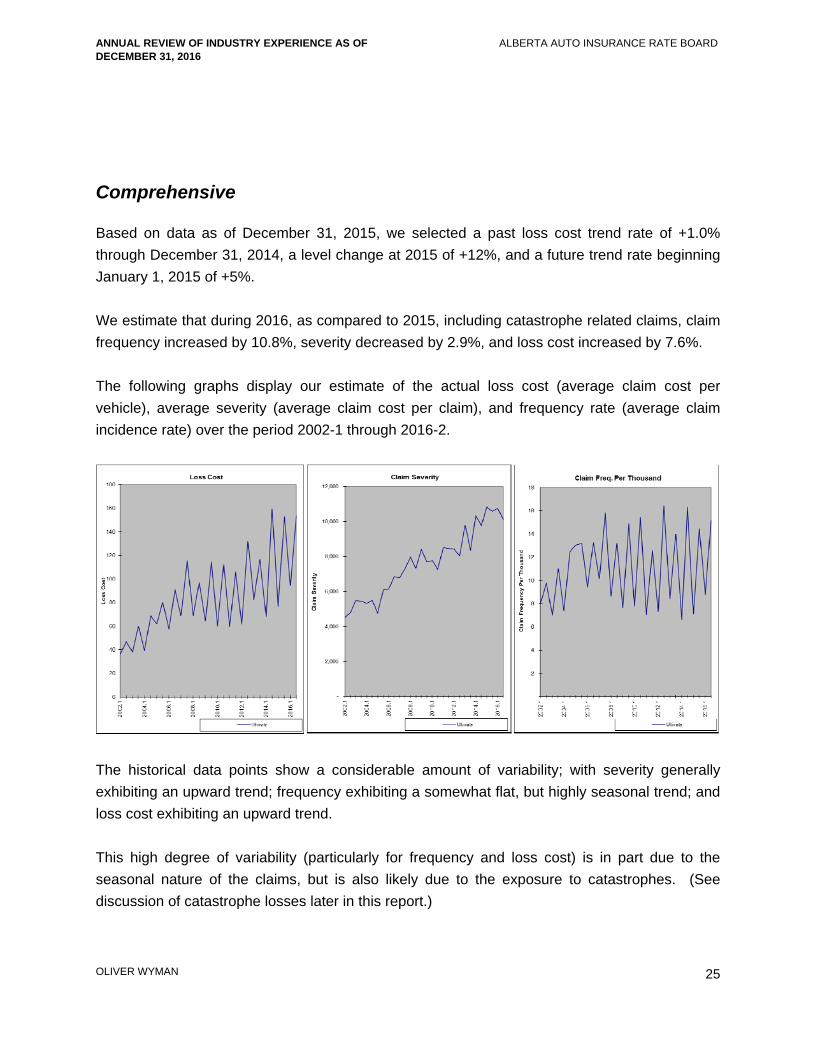
The following graphs display our estimate of the actual loss cost (average claim cost per
vehicle), average severity (average claim cost per claim), and frequency rate (average claim
incidence rate) over the period 2002-1 through 2016-2.
The historical data points show a considerable amount of variability; with severity generally
exhibiting an upward trend; frequency exhibiting a somewhat flat, but highly seasonal trend; and
loss cost exhibiting an upward trend.
This high degree of variability (particularly for frequency and loss cost) is in part due to the
seasonal nature of the claims, but is also likely due to the exposure to catastrophes. (See
discussion of catastrophe losses later in this report.)
ANNUAL REVIEW OF INDUSTRY EXPERIENCE AS OF DECEMBER 31, 2016
ALBERTA AUTO INSURANCE RATE BOARD
OLIVER WYMAN
26
GISA does not publish updated catastrophe claim experience coincident with its mid-year data
release, so we repeat the discussion of catastrophe losses that we presented in our 2016 AR
report.
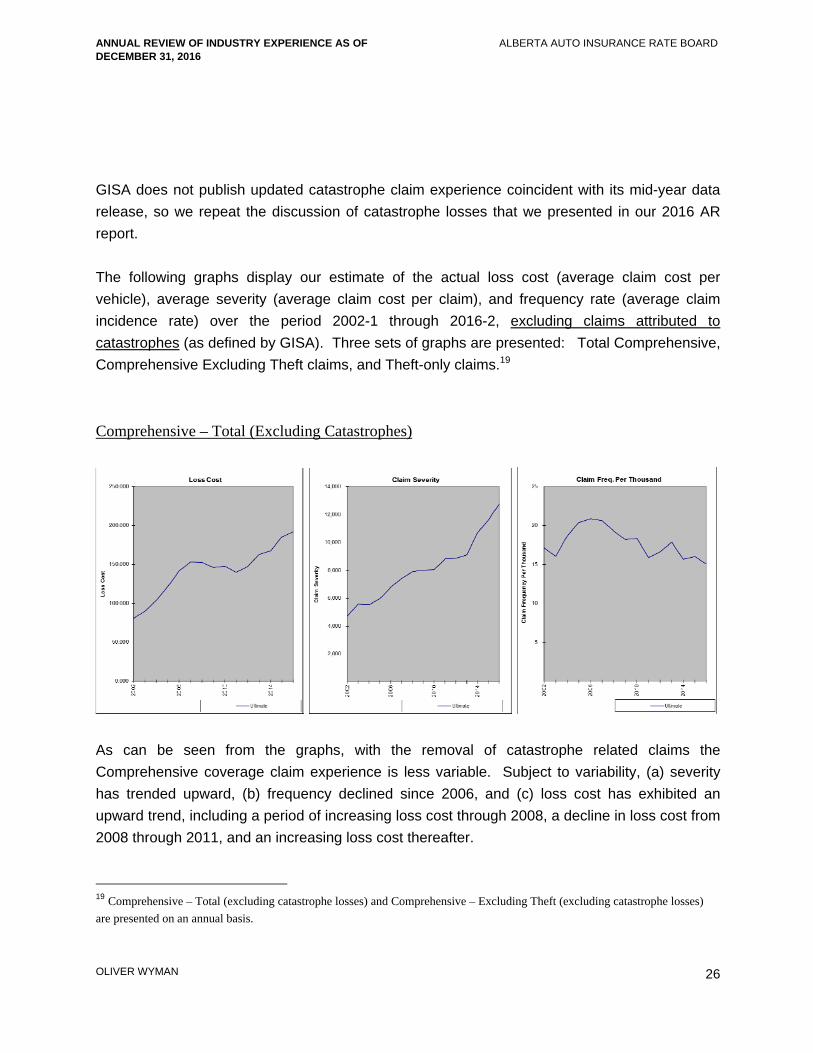
The following graphs display our estimate of the actual loss cost (average claim cost per
vehicle), average severity (average claim cost per claim), and frequency rate (average claim
incidence rate) over the period 2002-1 through 2016-2, excluding claims attributed to
catastrophes (as defined by GISA). Three sets of graphs are presented: Total Comprehensive,
Comprehensive Excluding Theft claims, and Theft-only claims.19
Comprehensive – Total (Excluding Catastrophes)
As can be seen from the graphs, with the removal of catastrophe related claims the
Comprehensive coverage claim experience is less variable. Subject to variability, (a) severity
has trended upward, (b) frequency declined since 2006, and (c) loss cost has exhibited an
upward trend, including a period of increasing loss cost through 2008, a decline in loss cost from
2008 through 2011, and an increasing loss cost thereafter.
19 Comprehensive – Total (excluding catastrophe losses) and Comprehensive – Excluding Theft (excluding catastrophe losses)
are presented on an annual basis.
ANNUAL REVIEW OF INDUSTRY EXPERIENCE AS OF DECEMBER 31, 2016
ALBERTA AUTO INSURANCE RATE BOARD
OLIVER WYMAN
27
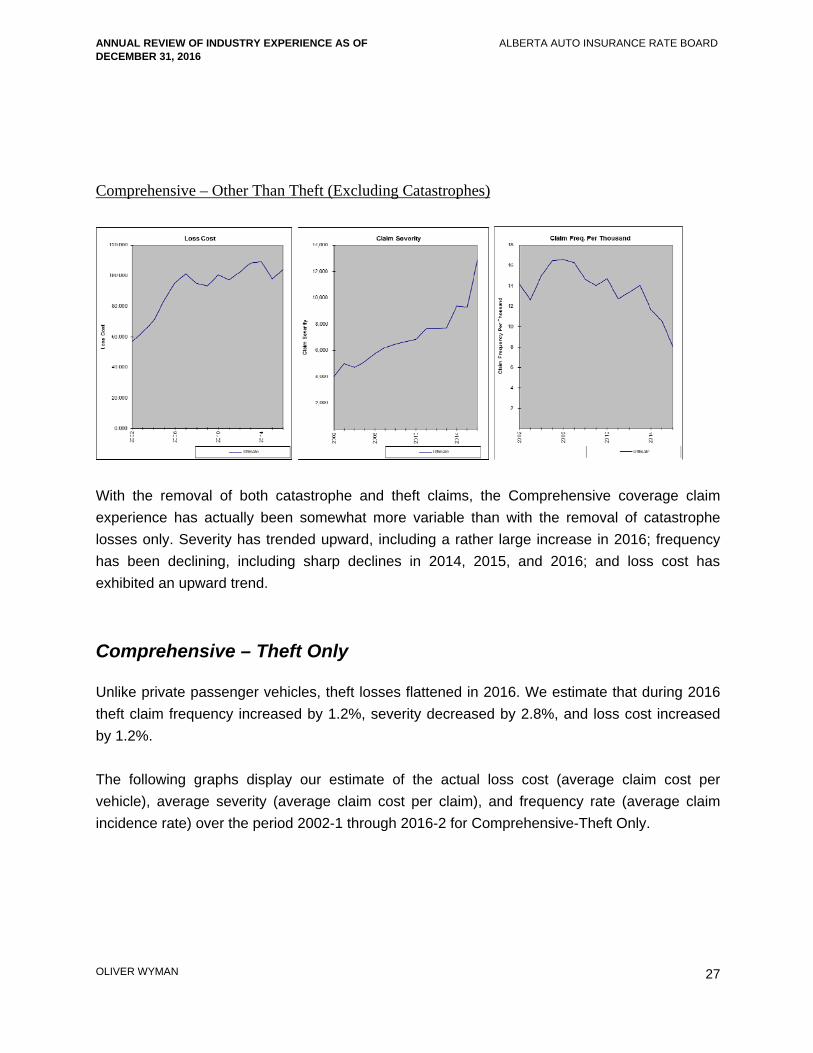
Comprehensive – Other Than Theft (Excluding Catastrophes)
With the removal of both catastrophe and theft claims, the Comprehensive coverage claim
experience has actually been somewhat more variable than with the removal of catastrophe
losses only. Severity has trended upward, including a rather large increase in 2016; frequency
has been declining, including sharp declines in 2014, 2015, and 2016; and loss cost has
exhibited an upward trend.
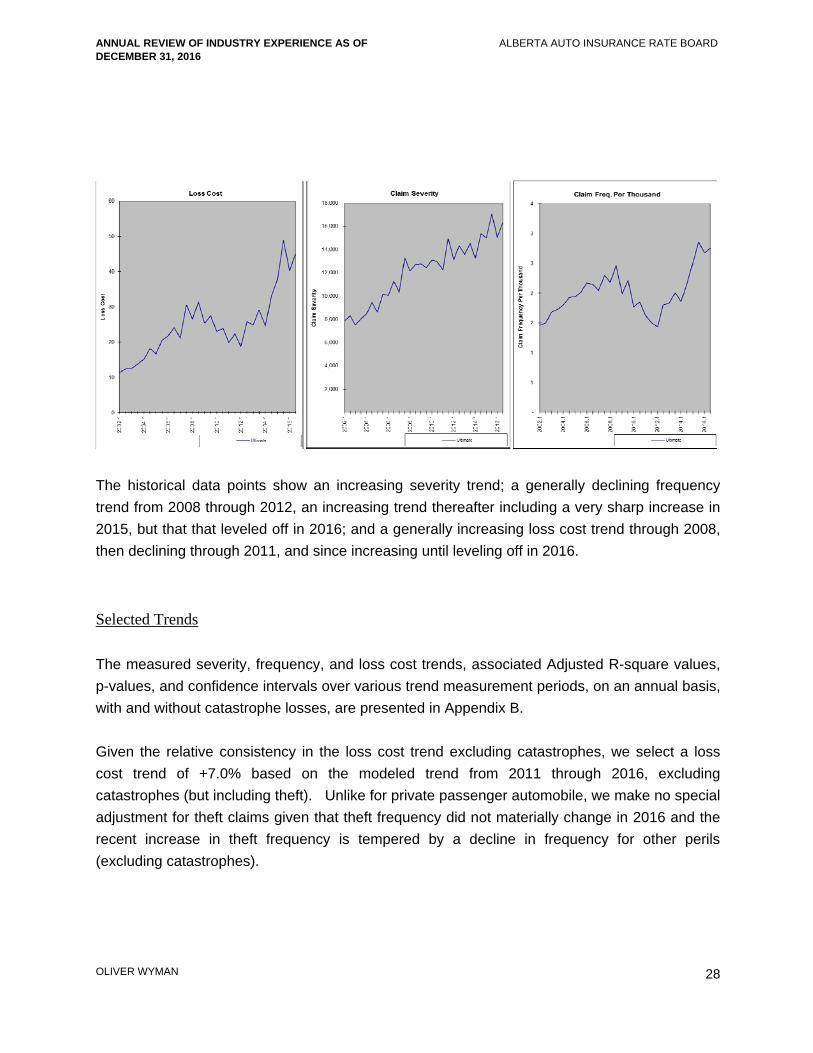
Comprehensive – Theft Only
Unlike private passenger vehicles, theft losses flattened in 2016. We estimate that during 2016
theft claim frequency increased by 1.2%, severity decreased by 2.8%, and loss cost increased
by 1.2%.
The following graphs display our estimate of the actual loss cost (average claim cost per
vehicle), average severity (average claim cost per claim), and frequency rate (average claim
incidence rate) over the period 2002-1 through 2016-2 for Comprehensive-Theft Only.
ANNUAL REVIEW OF INDUSTRY EXPERIENCE AS OF DECEMBER 31, 2016
ALBERTA AUTO INSURANCE RATE BOARD
OLIVER WYMAN
28
The historical data points show an increasing severity trend; a generally declining frequency
trend from 2008 through 2012, an increasing trend thereafter including a very sharp increase in
2015, but that that leveled off in 2016; and a generally increasing loss cost trend through 2008,
then declining through 2011, and since increasing until leveling off in 2016.
Selected Trends
The measured severity, frequency, and loss cost trends, associated Adjusted R-square values,
p-values, and confidence intervals over various trend measurement periods, on an annual basis,
with and without catastrophe losses, are presented in Appendix B.
Given the relative consistency in the loss cost trend excluding catastrophes, we select a loss
cost trend of +7.0% based on the modeled trend from 2011 through 2016, excluding
catastrophes (but including theft). Unlike for private passenger automobile, we make no special
adjustment for theft claims given that theft frequency did not materially change in 2016 and the
recent increase in theft frequency is tempered by a decline in frequency for other perils
(excluding catastrophes).
ANNUAL REVIEW OF INDUSTRY EXPERIENCE AS OF DECEMBER 31, 2016
ALBERTA AUTO INSURANCE RATE BOARD
OLIVER WYMAN
29
Specified Perils
Due to insufficient data, we will select the same past and future loss cost trend rate we select for
Comprehensive.
All Perils
Due to insufficient data, we will select a past and future loss cost trend rate that is in line with our
selected rates for Collision and Comprehensive.
Underinsured Motorist
Due to insufficient data, we select the same loss cost trend rate we select for Bodily Injury-
severity, +5.0%
ANNUAL REVIEW OF INDUSTRY EXPERIENCE AS OF DECEMBER 31, 2016
ALBERTA AUTO INSURANCE RATE BOARD
OLIVER WYMAN
30
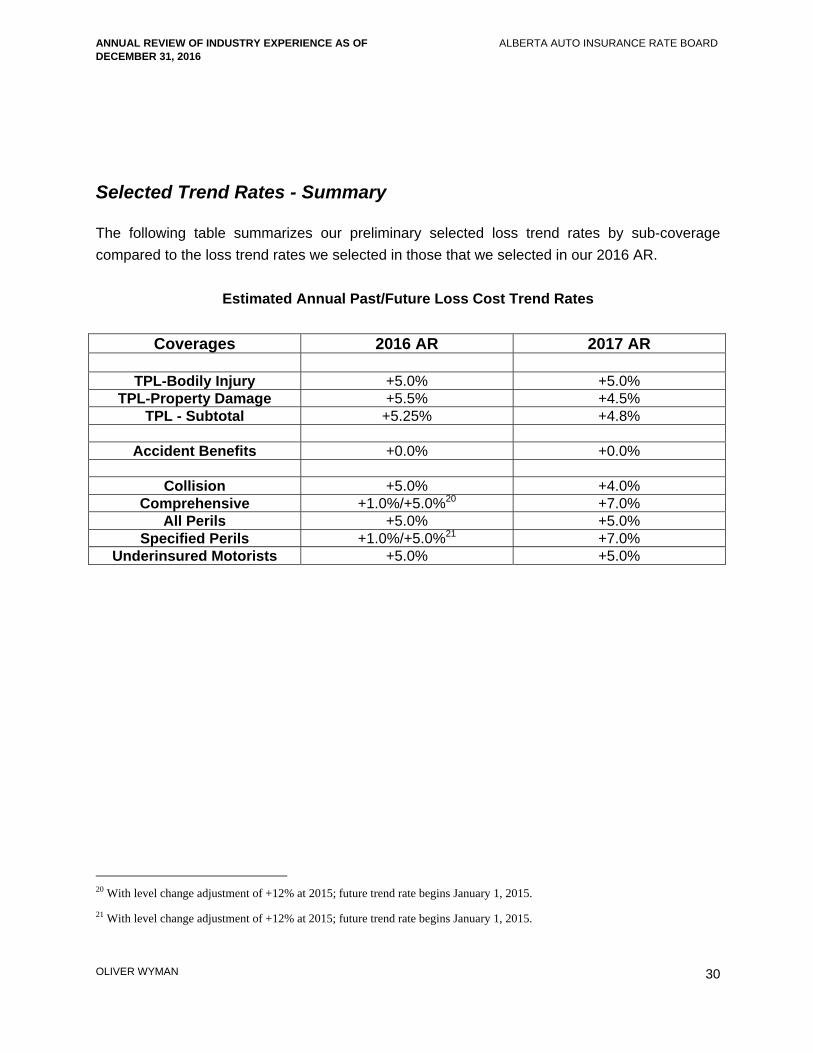
Selected Trend Rates - Summary
The following table summarizes our preliminary selected loss trend rates by sub-coverage
compared to the loss trend rates we selected in those that we selected in our 2016 AR.
Estimated Annual Past/Future Loss Cost Trend Rates
Coverages 2016 AR 2017 AR
TPL-Bodily Injury +5.0% +5.0% TPL-Property Damage +5.5% +4.5%
TPL - Subtotal +5.25% +4.8%
Accident Benefits +0.0% +0.0%
Collision +5.0% +4.0% Comprehensive +1.0%/+5.0%20 +7.0%
All Perils +5.0% +5.0% Specified Perils +1.0%/+5.0%21 +7.0%
Underinsured Motorists +5.0% +5.0%
20 With level change adjustment of +12% at 2015; future trend rate begins January 1, 2015.
21 With level change adjustment of +12% at 2015; future trend rate begins January 1, 2015.
ANNUAL REVIEW OF INDUSTRY EXPERIENCE AS OF DECEMBER 31, 2016
ALBERTA AUTO INSURANCE RATE BOARD
OLIVER WYMAN
31
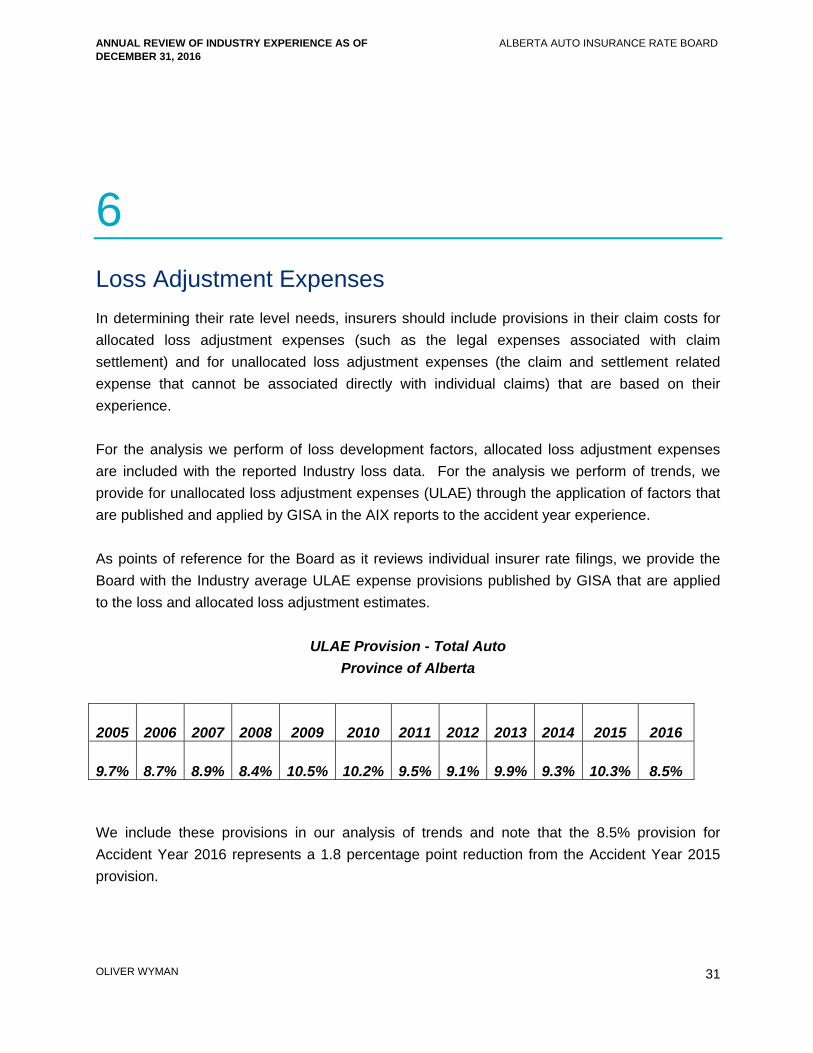
6 Loss Adjustment Expenses In determining their rate level needs, insurers should include provisions in their claim costs for
allocated loss adjustment expenses (such as the legal expenses associated with claim
settlement) and for unallocated loss adjustment expenses (the claim and settlement related
expense that cannot be associated directly with individual claims) that are based on their
experience.
For the analysis we perform of loss development factors, allocated loss adjustment expenses
are included with the reported Industry loss data. For the analysis we perform of trends, we
provide for unallocated loss adjustment expenses (ULAE) through the application of factors that
are published and applied by GISA in the AIX reports to the accident year experience.
As points of reference for the Board as it reviews individual insurer rate filings, we provide the
Board with the Industry average ULAE expense provisions published by GISA that are applied
to the loss and allocated loss adjustment estimates.
ULAE Provision - Total Auto
Province of Alberta
2005 2006 2007 2008 2009 2010 2011 2012 2013 2014 2015 2016
9.7% 8.7% 8.9% 8.4% 10.5% 10.2% 9.5% 9.1% 9.9% 9.3% 10.3% 8.5%
We include these provisions in our analysis of trends and note that the 8.5% provision for
Accident Year 2016 represents a 1.8 percentage point reduction from the Accident Year 2015
provision.
ANNUAL REVIEW OF INDUSTRY EXPERIENCE AS OF DECEMBER 31, 2016
ALBERTA AUTO INSURANCE RATE BOARD
OLIVER WYMAN
32
7 Catastrophe Provision
Subsequent to the release our preliminary report and just prior to the Board’s Open Meeting,
GISA released its 2016 Catastrophe report.
We note that it is our understanding that the losses arising from the Fort McMurray wildfires are
not considered catastrophe losses by GISA. Nevertheless, we believe that the fortuitous nature
of these losses should be considered by insurers in calculating their rate level needs. Treating
these losses as catastrophe related losses is one approach.
Comprehensive coverage (in particular) claim costs are affected by the occurrence (or non-
occurrence) of catastrophes. GISA defines catastrophes as “weather-related events such as
windstorms, hail, and flooding that caused multiple losses to the insurance industry.” Since
catastrophic losses cannot be predicted, in determining rate level indications insurers should
remove actual Comprehensive coverage claim costs attributed to catastrophes that occurred in
the experience period and include a provision for the amount of catastrophe losses that would
be expected on average in any given year.
In the 2016 Annual Review, we had recommended a Benchmark catastrophe provision of 20%
(a factor of 1.20) and that the Board consider each insurer’s distribution of business writings and
catastrophe loss experience in reviewing rate level indications for the Comprehensive coverage.
The 20% provision represented the approximate average of the relationship of catastrophic
losses to non-catastrophic losses over (1) the past ten years and (2) over the past five years,
adjusted to reflect an expected increase in theft claims.
IBC and other stakeholders that commented on the Benchmark catastrophe provision for private
passenger vehicles (prior to receiving the 2016 Catastrophe Report) expressed the view that the
provision should be higher and that it should reflect the Industry’s average relationship of
catastrophic losses to non-catastrophic losses over the past five years only. We believe that
these same views extend to commercial vehicles.
ANNUAL REVIEW OF INDUSTRY EXPERIENCE AS OF DECEMBER 31, 2016
ALBERTA AUTO INSURANCE RATE BOARD
OLIVER WYMAN
33
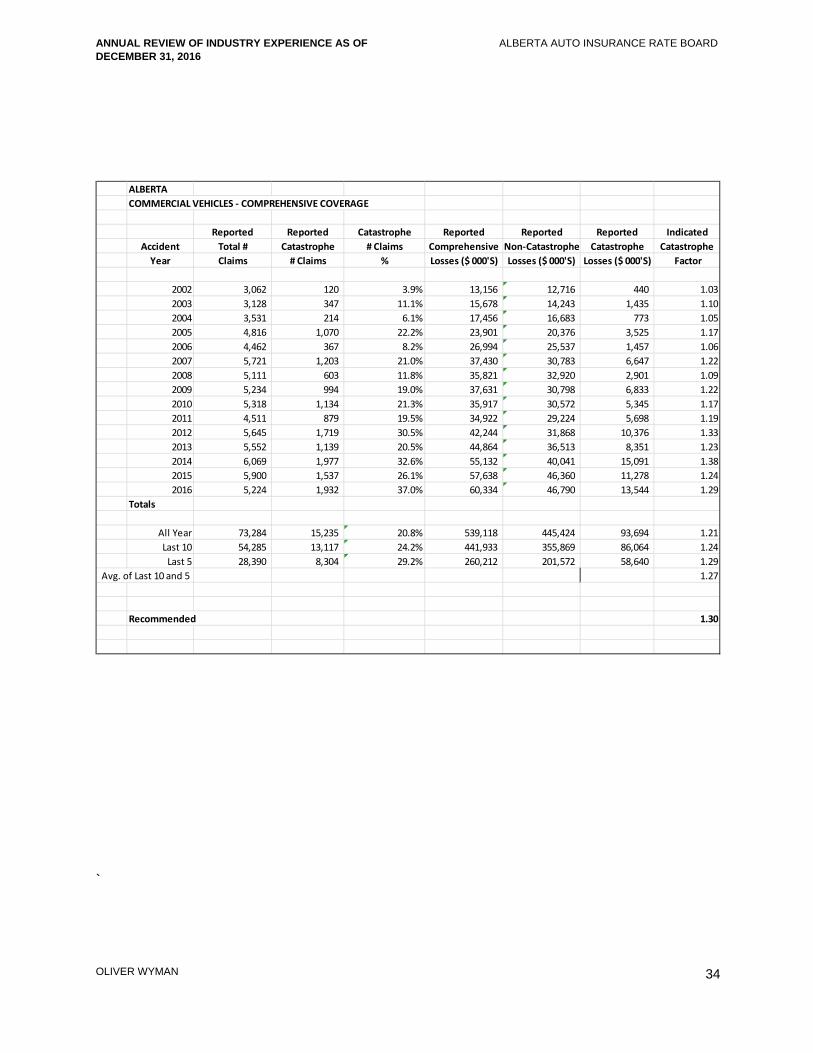
The table below provides information on the catastrophe losses that have occurred in Alberta
over the years 2002 – 2016 for commercial vehicle Comprehensive coverage as reported in
GISA’s 2016 Catastrophe Report for Alberta. The table shows, among other things, the
relationship (presented as factors) between the dollars of catastrophic losses to non-
catastrophic losses. For example, over the last ten years approximately $86 million of
catastrophic losses have been reported as compared to approximately $356 million of non-
catastrophic losses - a ratio of 24%. Over the last five years approximately $59 million of
catastrophic losses have been reported as compared to approximately $202 million of non-
catastrophic losses - a ratio of 29%.
We acknowledge that the province has experienced a higher level of catastrophe related
Comprehensive claims over the past five years as compared to the prior five years, and that this
more recent experience should be given greater weight. Given the continued pattern of high
proportion of catastrophe losses, we now find the five year weighted average to be appropriate.
The five year weighted average catastrophe provision is 29%.
As we are not separately considering theft and non-theft losses in selecting the Comprehensive
trend rate, we make no adjustment to the five year weighted average to reflect an increase in
theft claims.
We recommend a Benchmark catastrophe provision (rounded) of 30% (1.30).
We note that it is our understanding that the Board considers an insurer’s own catastrophe loss
experience in its review of rate applications.
ANNUAL REVIEW OF INDUSTRY EXPERIENCE AS OF DECEMBER 31, 2016
ALBERTA AUTO INSURANCE RATE BOARD
OLIVER WYMAN
34
ALBERTA
COMMERCIAL VEHICLES ‐ COMPREHENSIVE COVERAGE
Reported Reported Catastrophe Reported Reported Reported Indicated
Accident Total # Catastrophe # Claims Comprehensive Non‐Catastrophe Catastrophe Catastrophe
Year Claims # Claims % Losses ($ 000'S) Losses ($ 000'S) Losses ($ 000'S) Factor
2002 3,062 120 3.9% 13,156 12,716 440 1.03
2003 3,128 347 11.1% 15,678 14,243 1,435 1.10
2004 3,531 214 6.1% 17,456 16,683 773 1.05
2005 4,816 1,070 22.2% 23,901 20,376 3,525 1.17
2006 4,462 367 8.2% 26,994 25,537 1,457 1.06
2007 5,721 1,203 21.0% 37,430 30,783 6,647 1.22
2008 5,111 603 11.8% 35,821 32,920 2,901 1.09
2009 5,234 994 19.0% 37,631 30,798 6,833 1.22
2010 5,318 1,134 21.3% 35,917 30,572 5,345 1.17
2011 4,511 879 19.5% 34,922 29,224 5,698 1.19
2012 5,645 1,719 30.5% 42,244 31,868 10,376 1.33
2013 5,552 1,139 20.5% 44,864 36,513 8,351 1.23
2014 6,069 1,977 32.6% 55,132 40,041 15,091 1.38
2015 5,900 1,537 26.1% 57,638 46,360 11,278 1.24
2016 5,224 1,932 37.0% 60,334 46,790 13,544 1.29
Totals
All Year 73,284 15,235 20.8% 539,118 445,424 93,694 1.21
Last 10 54,285 13,117 24.2% 441,933 355,869 86,064 1.24
Last 5 28,390 8,304 29.2% 260,212 201,572 58,640 1.29
Avg. of Last 10 and 5 1.27
Recommended 1.30
`
ANNUAL REVIEW OF INDUSTRY EXPERIENCE AS OF DECEMBER 31, 2016
ALBERTA AUTO INSURANCE RATE BOARD
OLIVER WYMAN
35
8 Investment Income on Cash Flow The selected provision for claim cost should be adjusted (reduced) to reflect the investment
income earned on the cash flows arising from the insurance operations (i.e., the premium
collected before it is used to pay claim costs and other expenses). It has been the Board’s
position that the selected investment rate can be a risk-free rate based on Government of
Canada bond yields.
We recommend the same 1.95% investment rate that we recommend for private passenger
vehicles serve as the benchmark for commercial vehicles.22
22 While the payout pattern is somewhat different for commercial vehicles, due to the narrow spread in investment rates the
impact is not material.
ANNUAL REVIEW OF INDUSTRY EXPERIENCE AS OF DECEMBER 31, 2016
ALBERTA AUTO INSURANCE RATE BOARD
OLIVER WYMAN
36
9 Health Cost Recovery The Alberta Treasury Board and Finance announced the 2017 Health Cost Recovery
assessment factor (percentage) to be 5.67%.23 The Government has not yet announced the
2018 assessment.
Citing the Ministry’s pattern of increasing the annual assessment amount and noting that many
policies affected by rate changes filed between October 1, 2017 and March 31, 2018 will be
written in 2018 and 2019, IBC recommends the Board allow insurers to reflect a higher
assessment in their filings – essentially recommending the Board forecast what the assessment
factor will be in 2018 and 2019.
We agree with IBC that there is currently a timing lag between the assessment and the policies
to which it applies, but we also recognize the “challenges” presented by IBC’s recommendation.
We also note that the Board has considered this recommendation from IBC in the past and
decided not to change its position on how the Benchmark should be set.
Consistent with the position the Board has taken with respect to the Health Cost Recovery
assessment, we recommend the Benchmark remain at 5.67% until the 2018 assessment is
announced.
23 This is lower than what we had expected because it includes a downward adjustment that was made to reflect that collections
for 2015 exceeded the aggregate assessment for that year.
ANNUAL REVIEW OF INDUSTRY EXPERIENCE AS OF DECEMBER 31, 2016
ALBERTA AUTO INSURANCE RATE BOARD
OLIVER WYMAN
37
10 Operating Expenses In determining their rate level needs, insurers should include a provision for operating expenses
that is based on their experience and expected future expense costs. To put the expense
provisions of individual insurers in some perspective, we provide the Board with the Industry
average expense provisions.
We recommend the same 27.1% operating expense provision that we recommend for private
passenger vehicles to serve as the Benchmark for commercial vehicles, until GISA releases its
2016 Expense Report.
ANNUAL REVIEW OF INDUSTRY EXPERIENCE AS OF DECEMBER 31, 2016
ALBERTA AUTO INSURANCE RATE BOARD
OLIVER WYMAN
38
11 Profit The Board’s current position is to allow a profit provision of 7% of premium.
ANNUAL REVIEW OF INDUSTRY EXPERIENCE AS OF DECEMBER 31, 2016
ALBERTA AUTO INSURANCE RATE BOARD
OLIVER WYMAN
39
12 Definition of Key Terms To assist the reader in his or her understanding of our report, in this section we define and
explain several insurance terms.
Insurance Coverages
We begin with a general description of the insurance coverages. We note that throughout this
discussion of the insurance coverages, the term “insured” is generally used to mean the family
of the owner of the policy, as well as any passengers or other drivers using the car with the
owner’s permission.
Third Party Liability (TPL)
There are two parts to this Basic Coverage:
Bodily Injury (BI) coverage protects the insured against liability arising from an accident that
causes bodily injury to another person. Coverage amounts available in Alberta range from the
legal minimum of $200,000 per claim to well over $2,000,000 per claim.
Property Damage (PD) coverage protects the insured against liability arising from an accident
that causes damage to the property of another person.
All drivers must purchase at least the legally required minimum amount of TPL coverage
available in Alberta.
Accident Benefits (AB)
This Basic Coverage provides for such items as reimbursement of lost income, medical care
costs, and funeral costs; it also provides benefits to the dependents of a deceased insured.
ANNUAL REVIEW OF INDUSTRY EXPERIENCE AS OF DECEMBER 31, 2016
ALBERTA AUTO INSURANCE RATE BOARD
OLIVER WYMAN
40
Underinsured Motorist (UIM)
This Additional Coverage protects the insured if he or she is caused bodily injury by an at-fault
driver who is insured, but who does not have sufficient insurance to cover the liability; in this
case the insured collects, from his or her own insurer, the amount of the damage that is in
excess of the at-fault driver’s liability coverage and up to the limit of UIM coverage purchased.
Collision
This Additional Coverage generally provides coverage (subject to a deductible) for damage to
the insured’s vehicle arising out of a collision.
Comprehensive
This Additional Coverage generally provides coverage (subject to a deductible) for damage to
the insured’s vehicle arising out of a peril other than collision (e.g., theft, vandalism, flood, hail,
fire, etc.).
All Perils
This Additional Coverage combines the coverages for both collision and comprehensive into one
coverage, subject to a common deductible level.
Specified Perils
This Additional Coverage, like collision and comprehensive, provides coverage (subject to a
deductible) for specific perils to the insured’s vehicle.
Other Terms
Accident Year
Accident year is the year in which an incident that gives rise to a claim occurred, regardless of
when the claim is actually reported to an insurance company. For example, a claim reported on
January 15, 2015 for injuries suffered in an automobile accident that occurred on December 15,
2014, is considered to be an accident year 2014 claim.
ANNUAL REVIEW OF INDUSTRY EXPERIENCE AS OF DECEMBER 31, 2016
ALBERTA AUTO INSURANCE RATE BOARD
OLIVER WYMAN
41
Allocated Loss Adjustment Expense (ALAE)
ALAE is the claim and settlement expense that can be associated directly with individual claims
(e.g., legal expenses). (See ULAE)
Base Rate and Rate Differentials
Insurers generally determine the premium for a particular insured by multiplying a base rate by a
series of rate differentials (or rate factors, or rate relativities) that reflect the particular
characteristics of the insured. The terms rate differentials, rate factors and rate relativities are
used interchangeably. Typically, there is one base rate for each combination of coverage and
rating territory. For example, assume a base rate for the TPL coverage of $200 in Territory #1
and a base rate for the TPL coverage of $300 in Territory #2. Also assume the rate differential
for a married male driver, age 40, is 1.25. The TPL premium for this driver would be $250 in
Territory #1 ($200 times 1.25) and $375 in Territory #2 ($300 times 1.25).
Case Reserve
The Case Reserve is the provision established by insurance companies for the payment of
future losses and claim related expenses associated with a particular claim.
Claim Frequency
Claim Frequency is the average number of claims that occur in a year, per insured vehicle.
Claim frequency is a measure of the incidence of automobile claims. For example, if an
insurance company provided insurance on 100 vehicles in year 2015 and 5 TPL claims occurred
during 2015, the company’s TPL claim frequency for 2015 would be 5 percent.
Claim Severity
Claim Severity is the average reported incurred loss and ALAE per claim. Claim severity is a
measure of the average cost of automobile claims. For example, if the 5 claims in the previous
example resulted in a total incurred loss and ALAE of $100,000, the claim severity would be
$20,000.
Claim Count Development
Claim Count Development refers to the change in the number of reported claims for a particular
accident year over time. (See Loss Development)
ANNUAL REVIEW OF INDUSTRY EXPERIENCE AS OF DECEMBER 31, 2016
ALBERTA AUTO INSURANCE RATE BOARD
OLIVER WYMAN
42
CLEAR
CLEAR refers to Canadian Loss Experience Automobile Rating, a system of categorizing Private
Passenger vehicles, by make and model-year, for physical damage coverage rating purposes.
CLEAR was developed by the Vehicle Information Centre of Canada (VICC), a part of the
Insurance Bureau of Canada. CLEAR considers such elements as the reparability and
damageability of the make and model-year. (See MSRP)
Combined Ratio
Combined Ratio is a common measure of premium adequacy. This is the sum of the loss ratio
plus the expense ratio (operating expenses divided by written premium). A combined ratio in
excess of 100 percent is an indication of premium inadequacy, before consideration of profit and
investment income.
Earned Premium
Earned Premium is the amount of written premium that is associated with the portion of the
policy term that has expired. For example, assume an automobile policy with a 12-month term
is sold on January 1 for $1,000. The amount of earned premium would be $500 on June 30.
Exposure Unit
Exposure unit is a measure of loss potential. In commercial vehicle insurance, the exposure unit
that is commonly used is the number of insured vehicles. For example, all else being equal, it
would be expected that the cost to an insurance company to insure 50 cars would be twice the
cost to insure 25 cars.
Health Cost Recovery Assessment
As per Provincial legislation, each insurer is assessed to achieve a target amount set by
Government. The Minister of Finance publishes the assessment percentage applied to Third
Party Liability written premiums every year. GISA calculates and provides the assessment as a
percentage of earned third party liability premiums. Under the legislation, the Government has
no subrogation rights against the at-fault parties who are insured by policies of TPL insurance;
but instead, collects the assessment.
ANNUAL REVIEW OF INDUSTRY EXPERIENCE AS OF DECEMBER 31, 2016
ALBERTA AUTO INSURANCE RATE BOARD
OLIVER WYMAN
43
Loss Cost (Pure Premium)
Loss Cost is the average incurred loss and ALAE per insured vehicle. The loss cost is the
product of claim frequency and claim severity. Using the above example, a claim frequency of 5
percent, multiplied by a claim severity of $20,000, produces a TPL loss cost of $1,000.
Loss Development
Loss Development is the amount by which reported incurred losses and ALAE for a particular
accident year change over time. The two main reasons why reported incurred losses and ALAE
amounts change (or develop) over time are:
(a) Reported incurred losses and ALAE only include case reserve estimates on claims for which
the claim adjuster has knowledge, i.e., case reserves are only established on the claims that
have been reported to the insurance company. Since typically some period of time elapses
between the time of the incident and when it is reported as a claim, the number of reported
claims for an accident year would be expected to increase over time. Claims that are
reported after the close of an accident year are referred to as “late-reported” claims; and
(b) Reported incurred losses and ALAE also develop because, for a number of reasons, the
initial case reserves established by claims adjusters, can not fully and accurately reflect the
amount the claim will ultimately settle at. This pattern of under-reserving and over-reserving
is common within the insurance Industry (although the degree to which reported incurred
losses and ALAE are under-reserved or over-reserved varies by company, jurisdiction, line
of business, etc.). We further note that, over time, the percentage by which reported
incurred losses and ALAE develop for a given accident year should decline. This is because
as accident years become more mature (i.e., become older), fewer and fewer reserve
estimates are adjusted to reflect newly reported late claims, actual payments, and additional
information that becomes available to the claims adjuster.
Loss Ratio
Loss ratio is the common measure of premium adequacy. Loss ratio is usually defined as
estimated ultimate incurred losses and ALAE, divided by earned premium. But the ultimate
incurred losses and ALAE may also include provisions for ULAE and the Health Cost Recovery
assessment. A loss ratio that exceeds a company’s break-even loss ratio (100 percent less
budgeted expenses) would suggest premium inadequacy.
ANNUAL REVIEW OF INDUSTRY EXPERIENCE AS OF DECEMBER 31, 2016
ALBERTA AUTO INSURANCE RATE BOARD
OLIVER WYMAN
44
Loss Reserving Methods: Incurred Loss Development Method and Paid Loss Development
Method
Loss reserving methods are often based on historical data grouped into a triangle format. A
common approach is to have the rows represent the accident years, and the columns
representing the value of the loss at specific dates, such as 12 months, 24 months, 36 months
etc., from the beginning of the accident year. The historical changes in the loss data from
period to period is reviewed to estimate a pattern to predict how current accident years losses
will change over time as claims are settled and closed. The Incurred Loss Development Method
refers to the triangle method of analysis, based on reported incurred losses. The Paid Loss
Development Method refers to the triangle method of analysis, based on paid losses.
MSRP
MSRP refers to the Manufacturer’s Suggested Retail Price, and is a system of categorizing
Private Passenger vehicles, by make and model-year, for rating purposes for physical damage
coverages, according to the original price of the vehicle. (See CLEAR)
Operating Expenses
Insurance company expenses, other than ALAE and ULAE, are typically categorized as
Commissions, Other Acquisition, General, Taxes, Licenses, and Fees.
Paid Losses
The total aggregate dollar amount of losses paid on all reported claims as of a certain date.
Premium Drift
Premium Drift is a more general term, and refers to the changes in the amount of premium
collected by insurance companies that are attributed to the purchase of newer and more
expensive cars (i.e., rate group drift) as well as to changes in the amount of insurance coverage
that is purchased (e.g., the purchase of higher limits of liability coverage would increase the
amount of premium collected by insurance companies, while the purchase of higher physical
damage deductibles would reduce the amount of premium collected by insurance companies).
(See Rate Group Drift)
ANNUAL REVIEW OF INDUSTRY EXPERIENCE AS OF DECEMBER 31, 2016
ALBERTA AUTO INSURANCE RATE BOARD
OLIVER WYMAN
45
Rate Group Drift
Rate Group Drift refers to the amount of additional premium collected by insurance companies
that is attributed to the purchase of newer and more expensive cars by insureds. The premiums
charged by insurance companies are higher for newer and more expensive cars. Therefore, as
insureds purchase newer and more expensive cars, the amount of premium collected by
insurance companies increases. (See Premium Drift)
Ratemaking Methods: Pure Premium Method and Loss Ratio Method
The Pure Premium Method of ratemaking develops indicated rates that are expected to provide
for the expected losses and expenses, and provide for the expected profit. The Loss Ratio
Method of ratemaking develops indicated rate changes rather than indicated rates.
Rating Territory
Automobile premiums vary by the principal garaging location of the vehicle. Based on Insurance
Bureau of Canada’s automobile statistical plan, Alberta is currently divided into three areas, or
rating territories, of principal garaging location; and, therefore, has three separate sets of rates
depending upon which of the three territories the vehicle is principally garaged. (see Statistical
Territory)
Reported Incurred Loss
The sum of:
(a) the total aggregate dollar amount of losses paid on all reported claims as of a certain date
(referred to as the valuation date), and
(b) the total aggregate dollar amount of losses set in reserve by the claim adjusters on each
open claim (referred to as “case reserves”) as of a certain date (the same evaluation date as
for the paid loss amounts).
For example, if two claims were filed against an insurance company, one that settled for $50,000
and the other that was open with a paid amount of $25,000 and a “case reserve” (i.e., the claim
adjuster’s estimate of the dollars still to be paid on the claim) of $30,000, then the total reported
incurred loss on the two claims would be $105,000 (the sum of $50,000, plus $25,000, plus
$30,000).

ANNUAL REVIEW OF INDUSTRY EXPERIENCE AS OF DECEMBER 31, 2016
ALBERTA AUTO INSURANCE RATE BOARD
OLIVER WYMAN
46
Reserve
A Reserve is the aggregate provision identified by an insurance company for the payment of
future losses and claim related expenses associated with claims that have been incurred.
Surplus
Surplus is the excess of the assets of an insurance company over its liabilities.
Statistical Territory
Automobile premiums vary by the principal garaging location of the vehicle. Alberta is divided
into four statistical territories, of principal garaging location. Specific statistical territories are
grouped together to represent a specific rating territory. In some cases there is one statistical
territory in a rating territory, in other cases the rating territory is comprised of two or more
statistical territories. (See Rating Territory.)
Total Return on Equity
Total Return on Equity (ROE) refers to an insurer’s profit as a percentage of its surplus, where
profit is the sum of (a) underwriting profit, and (b) investment income earned on both the
underwriting operations of the company and on the surplus carried by the company.
Unallocated Loss Adjustment Expense (ULAE)
ULAE is the claim and settlement related expense that cannot be associated directly with
individual claims (e.g., claim adjuster salaries). (See ALAE)
Underwriting Profit
Underwriting Profit is defined as earned premium, less reported incurred losses and ALAE, less
ULAE, less operational expenses.
Underwriting Profit Margin
Underwriting Profit Margin is the provision that is included in the insurance premium for
underwriting profit to be earned by the company.

ANNUAL REVIEW OF INDUSTRY EXPERIENCE AS OF DECEMBER 31, 2016
ALBERTA AUTO INSURANCE RATE BOARD
OLIVER WYMAN
47
Ultimate Incurred Loss
An estimate of the total amount of loss dollars that will ultimately be paid to settle all claims that
occur during a particular accident year.
Written Premium
Written Premium represents the total amount of premium charged by an insurance company for
the insurance policies it has sold. It is generally measured over a one-year period.
ANNUAL REVIEW OF INDUSTRY EXPERIENCE AS OF DECEMBER 31, 2016
ALBERTA AUTO INSURANCE RATE BOARD
OLIVER WYMAN
48
13 Closing This report was prepared by Paula Elliott, FCAS, FCIA and Ted Zubulake, FCAS, FCIA, MAAA
of Oliver Wyman.
We are available to answer any questions the Board may have on our report.
Sincerely,
Paula Elliott, FCIA, FCAS Ted J. Zubulake, FCIA, FCAS [email protected] [email protected]
ANNUAL REVIEW OF INDUSTRY EXPERIENCE AS OF DECEMBER 31, 2016
ALBERTA AUTO INSURANCE RATE BOARD
OLIVER WYMAN
14 Appendix A
Exhibit 1: Selected reported claim count and reported incurred claim amount development
factors.
Exhibit 2: Historical reported claim count and reported incurred claim amount triangles.
Exhibit 3: Calculation of loss cost discount factors.
49
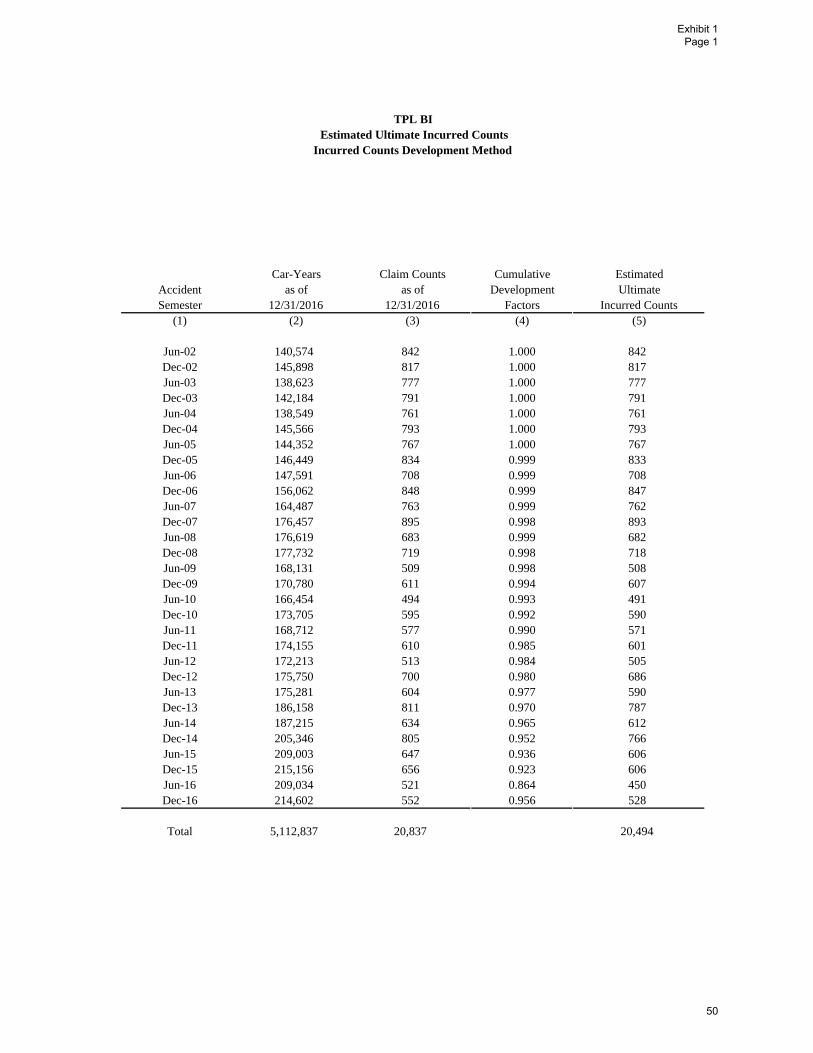
TPL BIEstimated Ultimate Incurred Counts
Incurred Counts Development Method
Car-Years Claim Counts Cumulative EstimatedAccident as of as of Development UltimateSemester 12/31/2016 12/31/2016 Factors Incurred Counts
(1) (2) (3) (4) (5)
Jun-02 140,574 842 1.000 842Dec-02 145,898 817 1.000 817Jun-03 138,623 777 1.000 777Dec-03 142,184 791 1.000 791Jun-04 138,549 761 1.000 761Dec-04 145,566 793 1.000 793Jun-05 144,352 767 1.000 767Dec-05 146,449 834 0.999 833Jun-06 147,591 708 0.999 708Dec-06 156,062 848 0.999 847Jun-07 164,487 763 0.999 762Dec-07 176,457 895 0.998 893Jun-08 176,619 683 0.999 682Dec-08 177,732 719 0.998 718Jun-09 168,131 509 0.998 508Dec-09 170,780 611 0.994 607Jun-10 166,454 494 0.993 491Dec-10 173,705 595 0.992 590Jun-11 168,712 577 0.990 571Dec-11 174,155 610 0.985 601Jun-12 172,213 513 0.984 505Dec-12 175,750 700 0.980 686Jun-13 175,281 604 0.977 590Dec-13 186,158 811 0.970 787Jun-14 187,215 634 0.965 612Dec-14 205,346 805 0.952 766Jun-15 209,003 647 0.936 606Dec-15 215,156 656 0.923 606Jun-16 209,034 521 0.864 450Dec-16 214,602 552 0.956 528
Total 5,112,837 20,837 20,494
Exhibit 1 Page 1
50

TPL BIEstimated Ultimate Incurred Losses
Incurred Losses Development Method Losses in $ 000s
Car-Years Losses Cumulative EstimatedAccident as of as of Development UltimateSemester 12/31/2016 12/31/2016 Factors Incurred Losses
(1) (2) (3) (4) (5)
Jun-02 140,574 34,208 1.000 34,208Dec-02 145,898 36,160 1.000 36,160Jun-03 138,623 36,305 1.000 36,305Dec-03 142,184 31,038 1.000 31,038Jun-04 138,549 30,190 1.000 30,190Dec-04 145,566 35,456 1.000 35,456Jun-05 144,352 22,758 1.006 22,889Dec-05 146,449 31,123 1.008 31,369Jun-06 147,591 30,061 1.009 30,331Dec-06 156,062 37,975 1.010 38,350Jun-07 164,487 28,039 1.011 28,338Dec-07 176,457 38,108 1.015 38,681Jun-08 176,619 28,965 1.022 29,606Dec-08 177,732 35,715 1.015 36,234Jun-09 168,131 20,707 1.018 21,088Dec-09 170,780 26,464 1.024 27,104Jun-10 166,454 20,749 1.035 21,471Dec-10 173,705 24,172 1.027 24,815Jun-11 168,712 25,098 1.045 26,237Dec-11 174,155 33,808 1.030 34,837Jun-12 172,213 24,710 1.032 25,501Dec-12 175,750 37,171 1.065 39,585Jun-13 175,281 31,707 1.131 35,855Dec-13 186,158 36,662 1.194 43,757Jun-14 187,215 24,089 1.302 31,365Dec-14 205,346 31,768 1.427 45,340Jun-15 209,003 23,365 1.648 38,514Dec-15 215,156 23,296 1.896 44,168Jun-16 209,034 15,970 2.050 32,737Dec-16 214,602 17,619 2.564 45,174
Total 5,112,837 873,455 996,703
Exhibit 1 Page 2
51
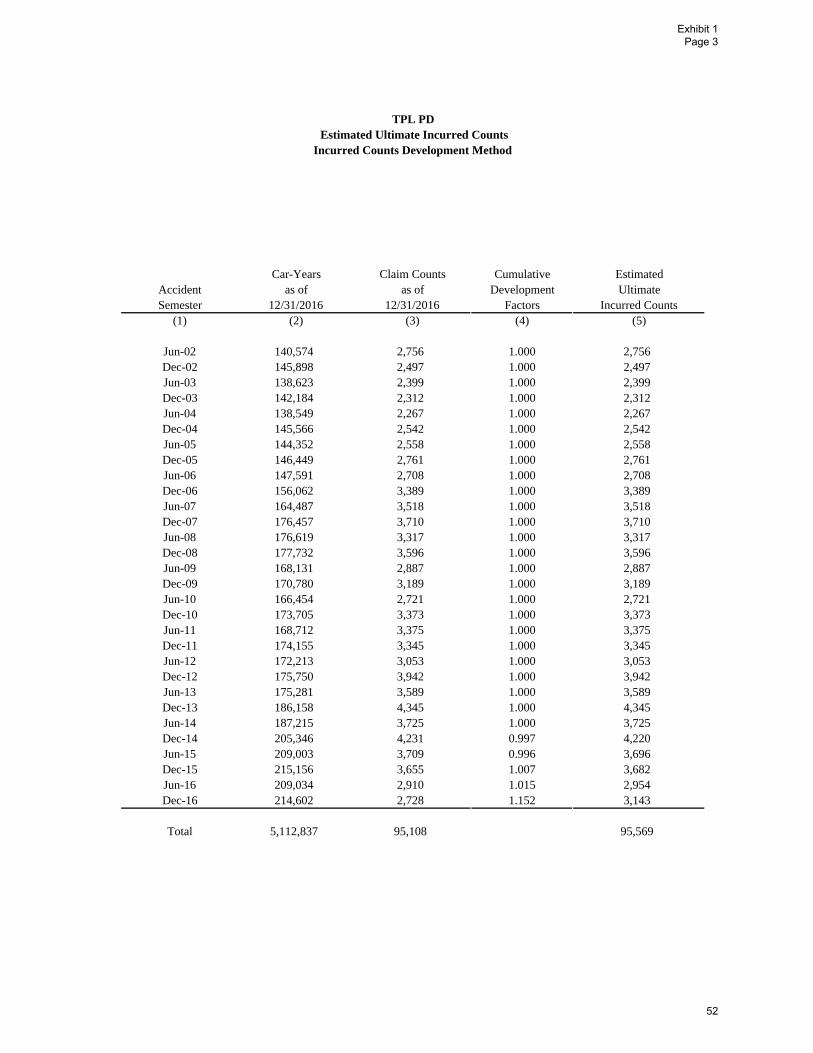
TPL PDEstimated Ultimate Incurred Counts
Incurred Counts Development Method
Car-Years Claim Counts Cumulative EstimatedAccident as of as of Development UltimateSemester 12/31/2016 12/31/2016 Factors Incurred Counts
(1) (2) (3) (4) (5)
Jun-02 140,574 2,756 1.000 2,756Dec-02 145,898 2,497 1.000 2,497Jun-03 138,623 2,399 1.000 2,399Dec-03 142,184 2,312 1.000 2,312Jun-04 138,549 2,267 1.000 2,267Dec-04 145,566 2,542 1.000 2,542Jun-05 144,352 2,558 1.000 2,558Dec-05 146,449 2,761 1.000 2,761Jun-06 147,591 2,708 1.000 2,708Dec-06 156,062 3,389 1.000 3,389Jun-07 164,487 3,518 1.000 3,518Dec-07 176,457 3,710 1.000 3,710Jun-08 176,619 3,317 1.000 3,317Dec-08 177,732 3,596 1.000 3,596Jun-09 168,131 2,887 1.000 2,887Dec-09 170,780 3,189 1.000 3,189Jun-10 166,454 2,721 1.000 2,721Dec-10 173,705 3,373 1.000 3,373Jun-11 168,712 3,375 1.000 3,375Dec-11 174,155 3,345 1.000 3,345Jun-12 172,213 3,053 1.000 3,053Dec-12 175,750 3,942 1.000 3,942Jun-13 175,281 3,589 1.000 3,589Dec-13 186,158 4,345 1.000 4,345Jun-14 187,215 3,725 1.000 3,725Dec-14 205,346 4,231 0.997 4,220Jun-15 209,003 3,709 0.996 3,696Dec-15 215,156 3,655 1.007 3,682Jun-16 209,034 2,910 1.015 2,954Dec-16 214,602 2,728 1.152 3,143
Total 5,112,837 95,108 95,569
Exhibit 1 Page 3
52
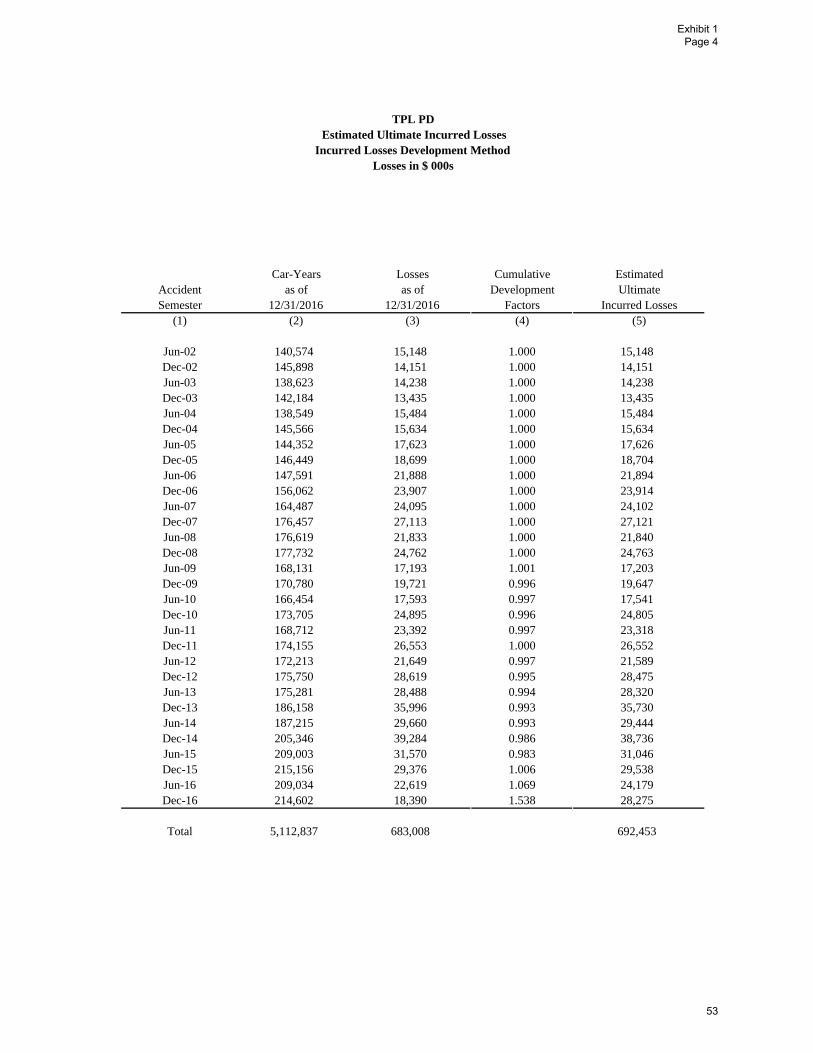
TPL PDEstimated Ultimate Incurred Losses
Incurred Losses Development Method Losses in $ 000s
Car-Years Losses Cumulative EstimatedAccident as of as of Development UltimateSemester 12/31/2016 12/31/2016 Factors Incurred Losses
(1) (2) (3) (4) (5)
Jun-02 140,574 15,148 1.000 15,148Dec-02 145,898 14,151 1.000 14,151Jun-03 138,623 14,238 1.000 14,238Dec-03 142,184 13,435 1.000 13,435Jun-04 138,549 15,484 1.000 15,484Dec-04 145,566 15,634 1.000 15,634Jun-05 144,352 17,623 1.000 17,626Dec-05 146,449 18,699 1.000 18,704Jun-06 147,591 21,888 1.000 21,894Dec-06 156,062 23,907 1.000 23,914Jun-07 164,487 24,095 1.000 24,102Dec-07 176,457 27,113 1.000 27,121Jun-08 176,619 21,833 1.000 21,840Dec-08 177,732 24,762 1.000 24,763Jun-09 168,131 17,193 1.001 17,203Dec-09 170,780 19,721 0.996 19,647Jun-10 166,454 17,593 0.997 17,541Dec-10 173,705 24,895 0.996 24,805Jun-11 168,712 23,392 0.997 23,318Dec-11 174,155 26,553 1.000 26,552Jun-12 172,213 21,649 0.997 21,589Dec-12 175,750 28,619 0.995 28,475Jun-13 175,281 28,488 0.994 28,320Dec-13 186,158 35,996 0.993 35,730Jun-14 187,215 29,660 0.993 29,444Dec-14 205,346 39,284 0.986 38,736Jun-15 209,003 31,570 0.983 31,046Dec-15 215,156 29,376 1.006 29,538Jun-16 209,034 22,619 1.069 24,179Dec-16 214,602 18,390 1.538 28,275
Total 5,112,837 683,008 692,453
Exhibit 1 Page 4
53
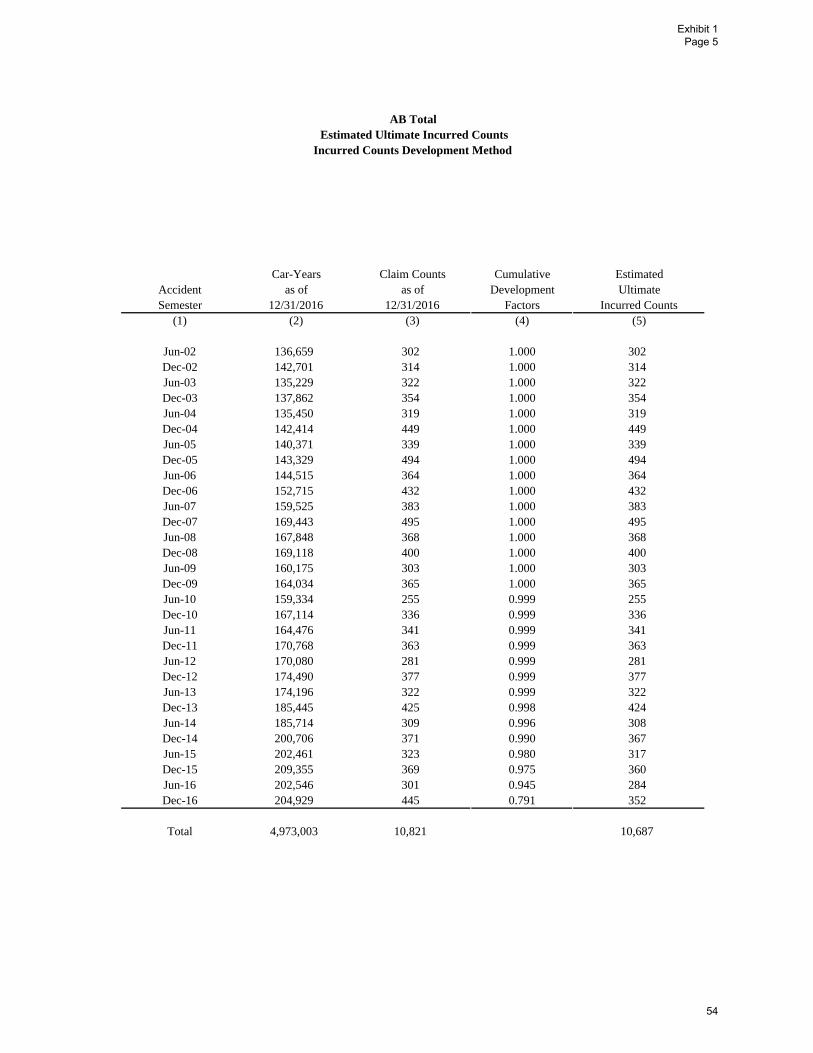
AB TotalEstimated Ultimate Incurred Counts
Incurred Counts Development Method
Car-Years Claim Counts Cumulative EstimatedAccident as of as of Development UltimateSemester 12/31/2016 12/31/2016 Factors Incurred Counts
(1) (2) (3) (4) (5)
Jun-02 136,659 302 1.000 302Dec-02 142,701 314 1.000 314Jun-03 135,229 322 1.000 322Dec-03 137,862 354 1.000 354Jun-04 135,450 319 1.000 319Dec-04 142,414 449 1.000 449Jun-05 140,371 339 1.000 339Dec-05 143,329 494 1.000 494Jun-06 144,515 364 1.000 364Dec-06 152,715 432 1.000 432Jun-07 159,525 383 1.000 383Dec-07 169,443 495 1.000 495Jun-08 167,848 368 1.000 368Dec-08 169,118 400 1.000 400Jun-09 160,175 303 1.000 303Dec-09 164,034 365 1.000 365Jun-10 159,334 255 0.999 255Dec-10 167,114 336 0.999 336Jun-11 164,476 341 0.999 341Dec-11 170,768 363 0.999 363Jun-12 170,080 281 0.999 281Dec-12 174,490 377 0.999 377Jun-13 174,196 322 0.999 322Dec-13 185,445 425 0.998 424Jun-14 185,714 309 0.996 308Dec-14 200,706 371 0.990 367Jun-15 202,461 323 0.980 317Dec-15 209,355 369 0.975 360Jun-16 202,546 301 0.945 284Dec-16 204,929 445 0.791 352
Total 4,973,003 10,821 10,687
Exhibit 1 Page 5
54
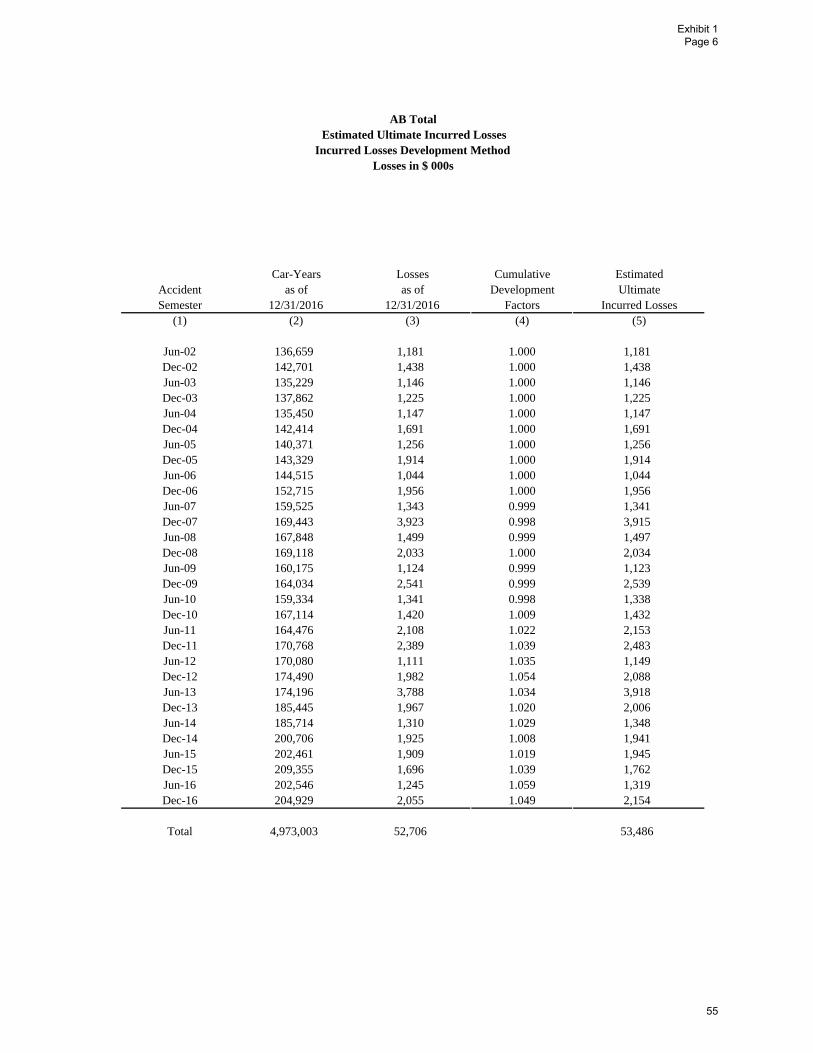
AB TotalEstimated Ultimate Incurred Losses
Incurred Losses Development Method Losses in $ 000s
Car-Years Losses Cumulative EstimatedAccident as of as of Development UltimateSemester 12/31/2016 12/31/2016 Factors Incurred Losses
(1) (2) (3) (4) (5)
Jun-02 136,659 1,181 1.000 1,181Dec-02 142,701 1,438 1.000 1,438Jun-03 135,229 1,146 1.000 1,146Dec-03 137,862 1,225 1.000 1,225Jun-04 135,450 1,147 1.000 1,147Dec-04 142,414 1,691 1.000 1,691Jun-05 140,371 1,256 1.000 1,256Dec-05 143,329 1,914 1.000 1,914Jun-06 144,515 1,044 1.000 1,044Dec-06 152,715 1,956 1.000 1,956Jun-07 159,525 1,343 0.999 1,341Dec-07 169,443 3,923 0.998 3,915Jun-08 167,848 1,499 0.999 1,497Dec-08 169,118 2,033 1.000 2,034Jun-09 160,175 1,124 0.999 1,123Dec-09 164,034 2,541 0.999 2,539Jun-10 159,334 1,341 0.998 1,338Dec-10 167,114 1,420 1.009 1,432Jun-11 164,476 2,108 1.022 2,153Dec-11 170,768 2,389 1.039 2,483Jun-12 170,080 1,111 1.035 1,149Dec-12 174,490 1,982 1.054 2,088Jun-13 174,196 3,788 1.034 3,918Dec-13 185,445 1,967 1.020 2,006Jun-14 185,714 1,310 1.029 1,348Dec-14 200,706 1,925 1.008 1,941Jun-15 202,461 1,909 1.019 1,945Dec-15 209,355 1,696 1.039 1,762Jun-16 202,546 1,245 1.059 1,319Dec-16 204,929 2,055 1.049 2,154
Total 4,973,003 52,706 53,486
Exhibit 1 Page 6
55
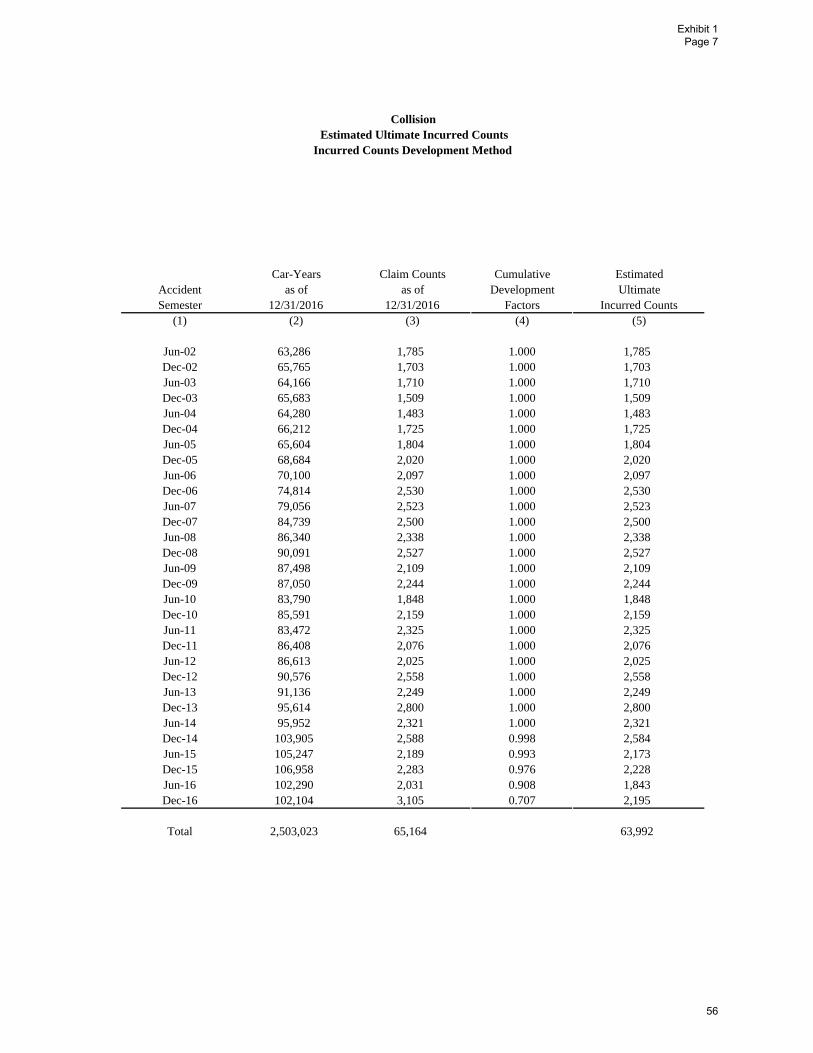
CollisionEstimated Ultimate Incurred Counts
Incurred Counts Development Method
Car-Years Claim Counts Cumulative EstimatedAccident as of as of Development UltimateSemester 12/31/2016 12/31/2016 Factors Incurred Counts
(1) (2) (3) (4) (5)
Jun-02 63,286 1,785 1.000 1,785Dec-02 65,765 1,703 1.000 1,703Jun-03 64,166 1,710 1.000 1,710Dec-03 65,683 1,509 1.000 1,509Jun-04 64,280 1,483 1.000 1,483Dec-04 66,212 1,725 1.000 1,725Jun-05 65,604 1,804 1.000 1,804Dec-05 68,684 2,020 1.000 2,020Jun-06 70,100 2,097 1.000 2,097Dec-06 74,814 2,530 1.000 2,530Jun-07 79,056 2,523 1.000 2,523Dec-07 84,739 2,500 1.000 2,500Jun-08 86,340 2,338 1.000 2,338Dec-08 90,091 2,527 1.000 2,527Jun-09 87,498 2,109 1.000 2,109Dec-09 87,050 2,244 1.000 2,244Jun-10 83,790 1,848 1.000 1,848Dec-10 85,591 2,159 1.000 2,159Jun-11 83,472 2,325 1.000 2,325Dec-11 86,408 2,076 1.000 2,076Jun-12 86,613 2,025 1.000 2,025Dec-12 90,576 2,558 1.000 2,558Jun-13 91,136 2,249 1.000 2,249Dec-13 95,614 2,800 1.000 2,800Jun-14 95,952 2,321 1.000 2,321Dec-14 103,905 2,588 0.998 2,584Jun-15 105,247 2,189 0.993 2,173Dec-15 106,958 2,283 0.976 2,228Jun-16 102,290 2,031 0.908 1,843Dec-16 102,104 3,105 0.707 2,195
Total 2,503,023 65,164 63,992
Exhibit 1 Page 7
56

CollisionEstimated Ultimate Incurred Losses
Incurred Losses Development Method Losses in $ 000s
Car-Years Losses Cumulative EstimatedAccident as of as of Development UltimateSemester 12/31/2016 12/31/2016 Factors Incurred Losses
(1) (2) (3) (4) (5)
Jun-02 63,286 10,083 1.000 10,083Dec-02 65,765 11,165 1.000 11,165Jun-03 64,166 11,746 1.000 11,746Dec-03 65,683 11,338 1.000 11,338Jun-04 64,280 9,491 1.000 9,491Dec-04 66,212 12,595 1.000 12,595Jun-05 65,604 13,467 1.000 13,467Dec-05 68,684 17,203 1.000 17,203Jun-06 70,100 17,489 1.000 17,489Dec-06 74,814 20,930 1.000 20,930Jun-07 79,056 20,174 1.000 20,174Dec-07 84,739 23,851 1.000 23,851Jun-08 86,340 19,360 1.000 19,360Dec-08 90,091 23,114 1.000 23,114Jun-09 87,498 16,695 1.000 16,695Dec-09 87,050 18,176 1.000 18,176Jun-10 83,790 14,526 1.000 14,526Dec-10 85,591 17,539 1.000 17,539Jun-11 83,472 17,710 1.000 17,710Dec-11 86,408 21,039 1.000 21,039Jun-12 86,613 17,750 1.000 17,750Dec-12 90,576 22,896 1.000 22,896Jun-13 91,136 19,739 1.000 19,739Dec-13 95,614 27,648 0.997 27,574Jun-14 95,952 21,841 0.997 21,766Dec-14 103,905 27,480 0.994 27,311Jun-15 105,247 20,598 0.981 20,209Dec-15 106,958 26,802 0.949 25,435Jun-16 102,290 20,257 0.863 17,485Dec-16 102,104 30,298 0.774 23,466
Total 2,503,023 563,001 551,321
Exhibit 1 Page 8
57
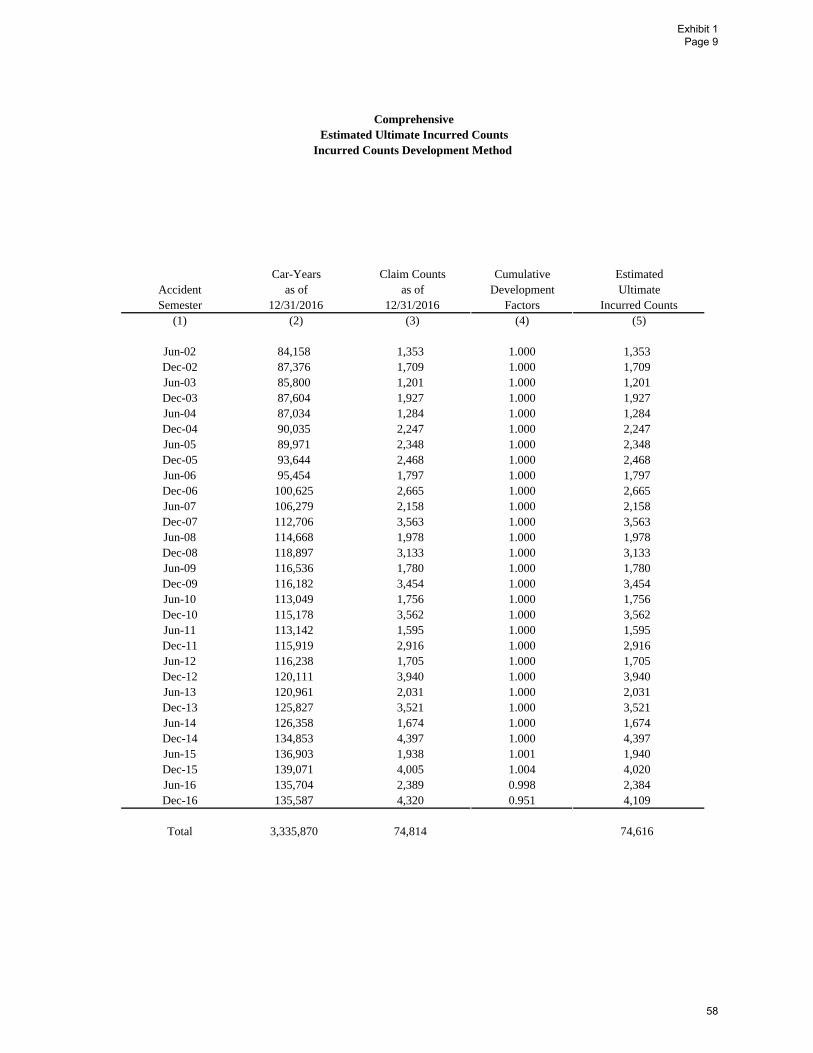
ComprehensiveEstimated Ultimate Incurred Counts
Incurred Counts Development Method
Car-Years Claim Counts Cumulative EstimatedAccident as of as of Development UltimateSemester 12/31/2016 12/31/2016 Factors Incurred Counts
(1) (2) (3) (4) (5)
Jun-02 84,158 1,353 1.000 1,353Dec-02 87,376 1,709 1.000 1,709Jun-03 85,800 1,201 1.000 1,201Dec-03 87,604 1,927 1.000 1,927Jun-04 87,034 1,284 1.000 1,284Dec-04 90,035 2,247 1.000 2,247Jun-05 89,971 2,348 1.000 2,348Dec-05 93,644 2,468 1.000 2,468Jun-06 95,454 1,797 1.000 1,797Dec-06 100,625 2,665 1.000 2,665Jun-07 106,279 2,158 1.000 2,158Dec-07 112,706 3,563 1.000 3,563Jun-08 114,668 1,978 1.000 1,978Dec-08 118,897 3,133 1.000 3,133Jun-09 116,536 1,780 1.000 1,780Dec-09 116,182 3,454 1.000 3,454Jun-10 113,049 1,756 1.000 1,756Dec-10 115,178 3,562 1.000 3,562Jun-11 113,142 1,595 1.000 1,595Dec-11 115,919 2,916 1.000 2,916Jun-12 116,238 1,705 1.000 1,705Dec-12 120,111 3,940 1.000 3,940Jun-13 120,961 2,031 1.000 2,031Dec-13 125,827 3,521 1.000 3,521Jun-14 126,358 1,674 1.000 1,674Dec-14 134,853 4,397 1.000 4,397Jun-15 136,903 1,938 1.001 1,940Dec-15 139,071 4,005 1.004 4,020Jun-16 135,704 2,389 0.998 2,384Dec-16 135,587 4,320 0.951 4,109
Total 3,335,870 74,814 74,616
Exhibit 1 Page 9
58

ComprehensiveEstimated Ultimate Incurred Losses
Incurred Losses Development Method Losses in $ 000s
Car-Years Losses Cumulative EstimatedAccident as of as of Development UltimateSemester 12/31/2016 12/31/2016 Factors Incurred Losses
(1) (2) (3) (4) (5)
Jun-02 84,158 5,612 1.000 5,612Dec-02 87,376 7,544 1.000 7,544Jun-03 85,800 6,028 1.000 6,028Dec-03 87,604 9,650 1.000 9,650Jun-04 87,034 6,221 1.000 6,221Dec-04 90,035 11,235 1.000 11,235Jun-05 89,971 10,198 1.000 10,198Dec-05 93,644 13,703 1.000 13,703Jun-06 95,454 10,141 1.000 10,141Dec-06 100,625 16,853 1.000 16,853Jun-07 106,279 13,471 1.000 13,471Dec-07 112,706 23,960 1.000 23,960Jun-08 114,668 14,565 1.000 14,565Dec-08 118,897 21,256 1.000 21,256Jun-09 116,536 13,560 1.000 13,560Dec-09 116,182 24,070 1.000 24,070Jun-10 113,049 12,399 1.000 12,399Dec-10 115,178 23,518 1.000 23,518Jun-11 113,142 12,405 1.000 12,405Dec-11 115,919 22,517 1.000 22,517Jun-12 116,238 13,177 1.000 13,177Dec-12 120,111 29,067 1.000 29,067Jun-13 120,961 18,097 1.000 18,097Dec-13 125,827 26,768 1.000 26,768Jun-14 126,358 15,815 1.000 15,815Dec-14 134,853 39,317 1.000 39,317Jun-15 136,903 19,053 1.001 19,076Dec-15 139,071 38,585 1.001 38,616Jun-16 135,704 23,817 0.994 23,665Dec-16 135,587 36,517 1.051 38,370
Total 3,335,870 539,118 540,874
Exhibit 1 Page 10
59
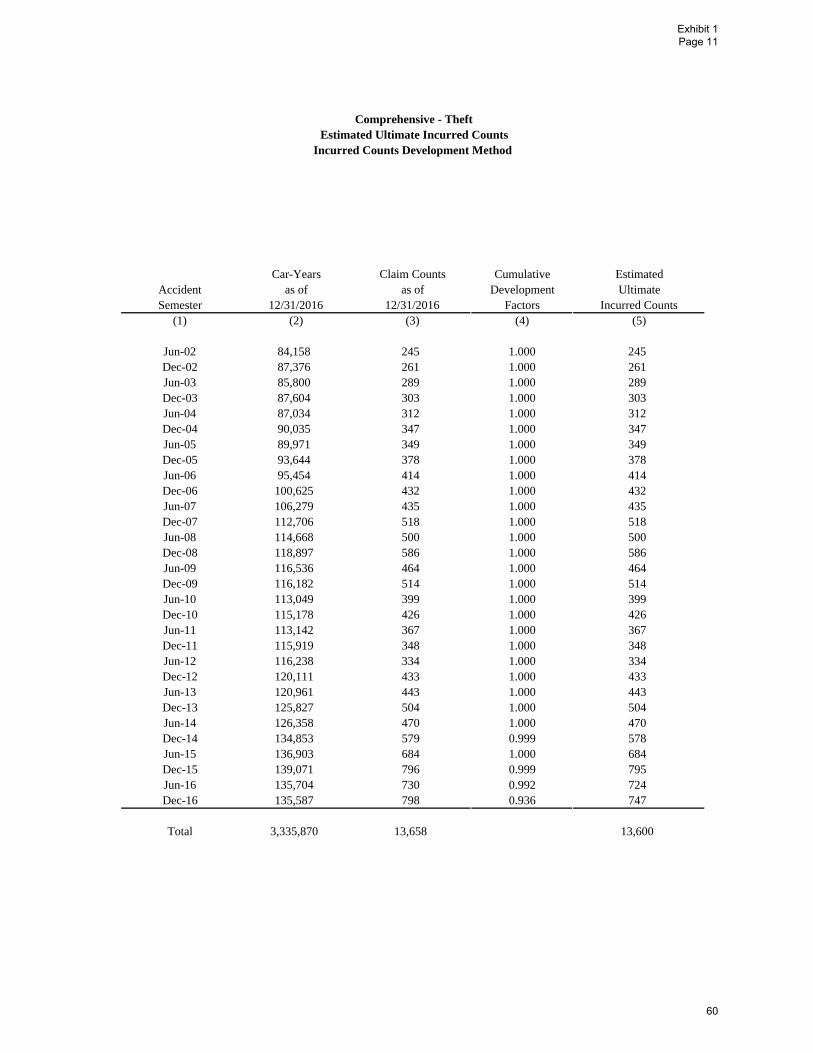
Comprehensive - TheftEstimated Ultimate Incurred Counts
Incurred Counts Development Method
Car-Years Claim Counts Cumulative EstimatedAccident as of as of Development UltimateSemester 12/31/2016 12/31/2016 Factors Incurred Counts
(1) (2) (3) (4) (5)
Jun-02 84,158 245 1.000 245Dec-02 87,376 261 1.000 261Jun-03 85,800 289 1.000 289Dec-03 87,604 303 1.000 303Jun-04 87,034 312 1.000 312Dec-04 90,035 347 1.000 347Jun-05 89,971 349 1.000 349Dec-05 93,644 378 1.000 378Jun-06 95,454 414 1.000 414Dec-06 100,625 432 1.000 432Jun-07 106,279 435 1.000 435Dec-07 112,706 518 1.000 518Jun-08 114,668 500 1.000 500Dec-08 118,897 586 1.000 586Jun-09 116,536 464 1.000 464Dec-09 116,182 514 1.000 514Jun-10 113,049 399 1.000 399Dec-10 115,178 426 1.000 426Jun-11 113,142 367 1.000 367Dec-11 115,919 348 1.000 348Jun-12 116,238 334 1.000 334Dec-12 120,111 433 1.000 433Jun-13 120,961 443 1.000 443Dec-13 125,827 504 1.000 504Jun-14 126,358 470 1.000 470Dec-14 134,853 579 0.999 578Jun-15 136,903 684 1.000 684Dec-15 139,071 796 0.999 795Jun-16 135,704 730 0.992 724Dec-16 135,587 798 0.936 747
Total 3,335,870 13,658 13,600
Exhibit 1 Page 11
60
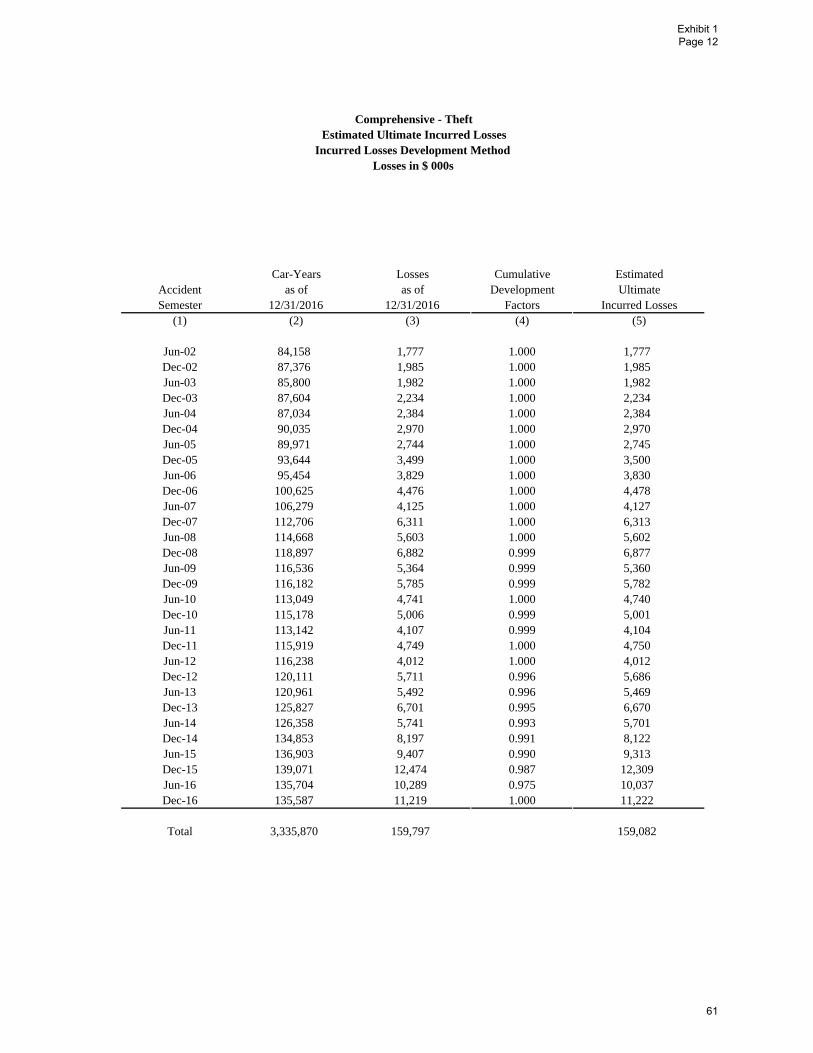
Comprehensive - TheftEstimated Ultimate Incurred Losses
Incurred Losses Development Method Losses in $ 000s
Car-Years Losses Cumulative EstimatedAccident as of as of Development UltimateSemester 12/31/2016 12/31/2016 Factors Incurred Losses
(1) (2) (3) (4) (5)
Jun-02 84,158 1,777 1.000 1,777Dec-02 87,376 1,985 1.000 1,985Jun-03 85,800 1,982 1.000 1,982Dec-03 87,604 2,234 1.000 2,234Jun-04 87,034 2,384 1.000 2,384Dec-04 90,035 2,970 1.000 2,970Jun-05 89,971 2,744 1.000 2,745Dec-05 93,644 3,499 1.000 3,500Jun-06 95,454 3,829 1.000 3,830Dec-06 100,625 4,476 1.000 4,478Jun-07 106,279 4,125 1.000 4,127Dec-07 112,706 6,311 1.000 6,313Jun-08 114,668 5,603 1.000 5,602Dec-08 118,897 6,882 0.999 6,877Jun-09 116,536 5,364 0.999 5,360Dec-09 116,182 5,785 0.999 5,782Jun-10 113,049 4,741 1.000 4,740Dec-10 115,178 5,006 0.999 5,001Jun-11 113,142 4,107 0.999 4,104Dec-11 115,919 4,749 1.000 4,750Jun-12 116,238 4,012 1.000 4,012Dec-12 120,111 5,711 0.996 5,686Jun-13 120,961 5,492 0.996 5,469Dec-13 125,827 6,701 0.995 6,670Jun-14 126,358 5,741 0.993 5,701Dec-14 134,853 8,197 0.991 8,122Jun-15 136,903 9,407 0.990 9,313Dec-15 139,071 12,474 0.987 12,309Jun-16 135,704 10,289 0.975 10,037Dec-16 135,587 11,219 1.000 11,222
Total 3,335,870 159,797 159,082
Exhibit 1 Page 12
61
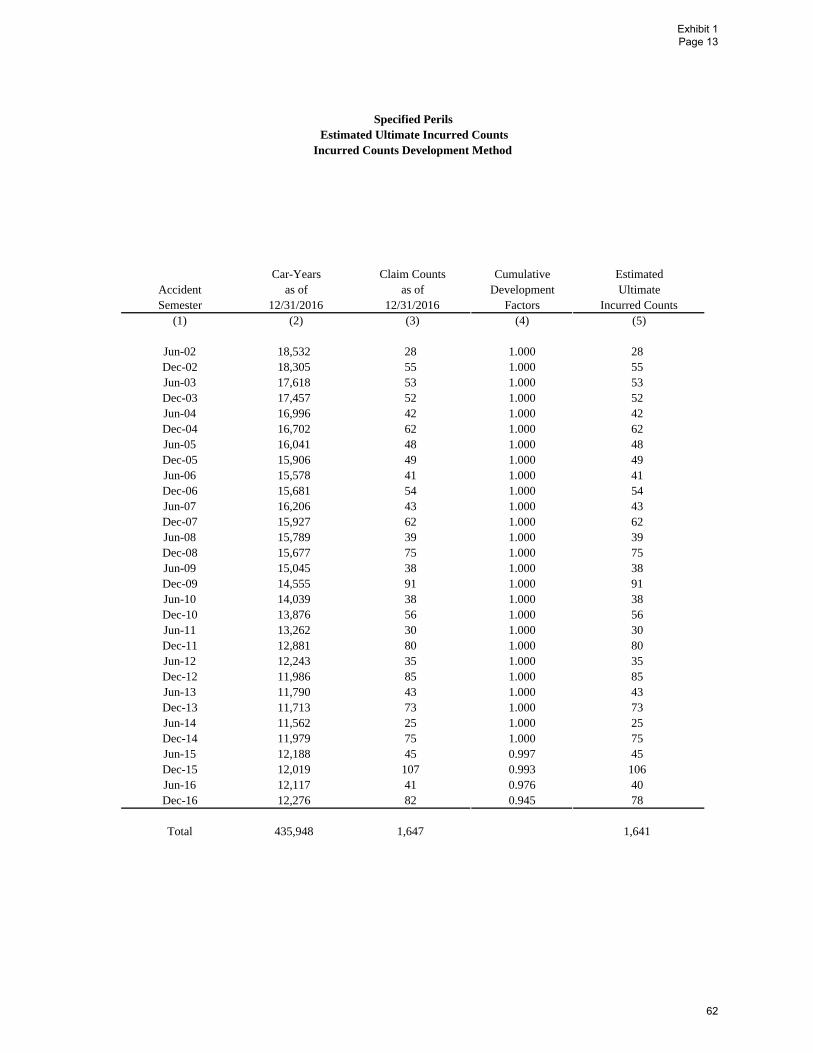
Specified PerilsEstimated Ultimate Incurred Counts
Incurred Counts Development Method
Car-Years Claim Counts Cumulative EstimatedAccident as of as of Development UltimateSemester 12/31/2016 12/31/2016 Factors Incurred Counts
(1) (2) (3) (4) (5)
Jun-02 18,532 28 1.000 28Dec-02 18,305 55 1.000 55Jun-03 17,618 53 1.000 53Dec-03 17,457 52 1.000 52Jun-04 16,996 42 1.000 42Dec-04 16,702 62 1.000 62Jun-05 16,041 48 1.000 48Dec-05 15,906 49 1.000 49Jun-06 15,578 41 1.000 41Dec-06 15,681 54 1.000 54Jun-07 16,206 43 1.000 43Dec-07 15,927 62 1.000 62Jun-08 15,789 39 1.000 39Dec-08 15,677 75 1.000 75Jun-09 15,045 38 1.000 38Dec-09 14,555 91 1.000 91Jun-10 14,039 38 1.000 38Dec-10 13,876 56 1.000 56Jun-11 13,262 30 1.000 30Dec-11 12,881 80 1.000 80Jun-12 12,243 35 1.000 35Dec-12 11,986 85 1.000 85Jun-13 11,790 43 1.000 43Dec-13 11,713 73 1.000 73Jun-14 11,562 25 1.000 25Dec-14 11,979 75 1.000 75Jun-15 12,188 45 0.997 45Dec-15 12,019 107 0.993 106Jun-16 12,117 41 0.976 40Dec-16 12,276 82 0.945 78
Total 435,948 1,647 1,641
Exhibit 1 Page 13
62
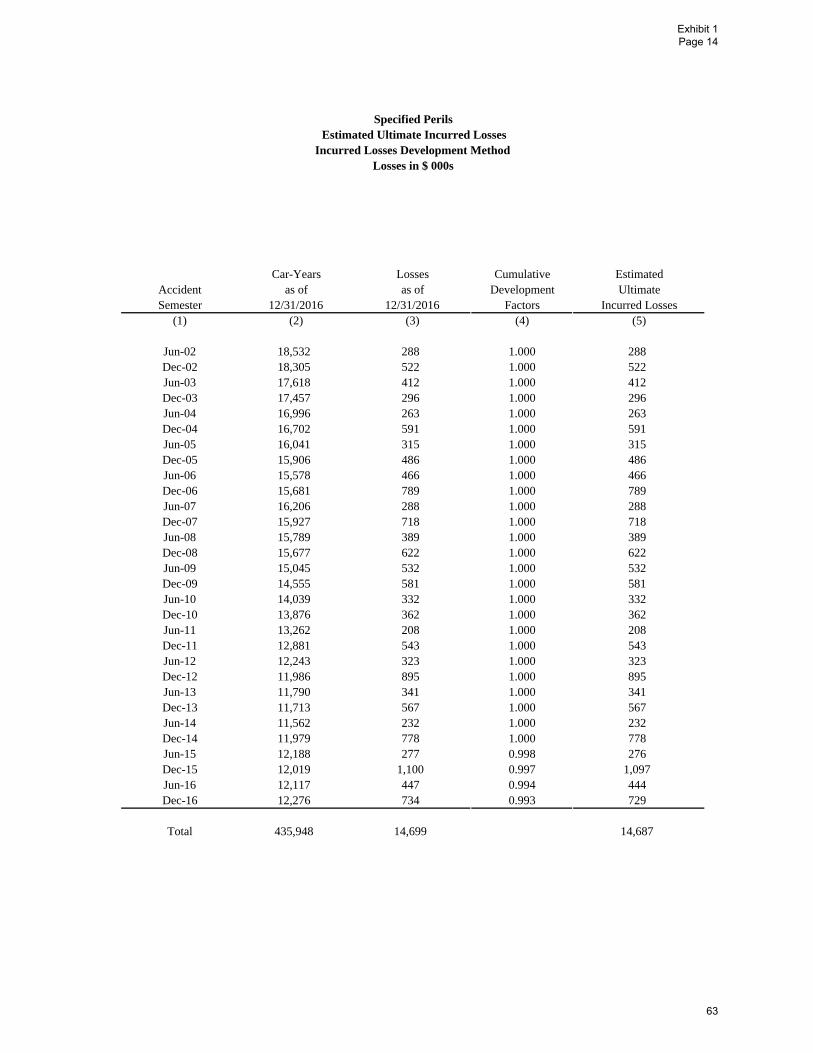
Specified PerilsEstimated Ultimate Incurred Losses
Incurred Losses Development Method Losses in $ 000s
Car-Years Losses Cumulative EstimatedAccident as of as of Development UltimateSemester 12/31/2016 12/31/2016 Factors Incurred Losses
(1) (2) (3) (4) (5)
Jun-02 18,532 288 1.000 288Dec-02 18,305 522 1.000 522Jun-03 17,618 412 1.000 412Dec-03 17,457 296 1.000 296Jun-04 16,996 263 1.000 263Dec-04 16,702 591 1.000 591Jun-05 16,041 315 1.000 315Dec-05 15,906 486 1.000 486Jun-06 15,578 466 1.000 466Dec-06 15,681 789 1.000 789Jun-07 16,206 288 1.000 288Dec-07 15,927 718 1.000 718Jun-08 15,789 389 1.000 389Dec-08 15,677 622 1.000 622Jun-09 15,045 532 1.000 532Dec-09 14,555 581 1.000 581Jun-10 14,039 332 1.000 332Dec-10 13,876 362 1.000 362Jun-11 13,262 208 1.000 208Dec-11 12,881 543 1.000 543Jun-12 12,243 323 1.000 323Dec-12 11,986 895 1.000 895Jun-13 11,790 341 1.000 341Dec-13 11,713 567 1.000 567Jun-14 11,562 232 1.000 232Dec-14 11,979 778 1.000 778Jun-15 12,188 277 0.998 276Dec-15 12,019 1,100 0.997 1,097Jun-16 12,117 447 0.994 444Dec-16 12,276 734 0.993 729
Total 435,948 14,699 14,687
Exhibit 1 Page 14
63
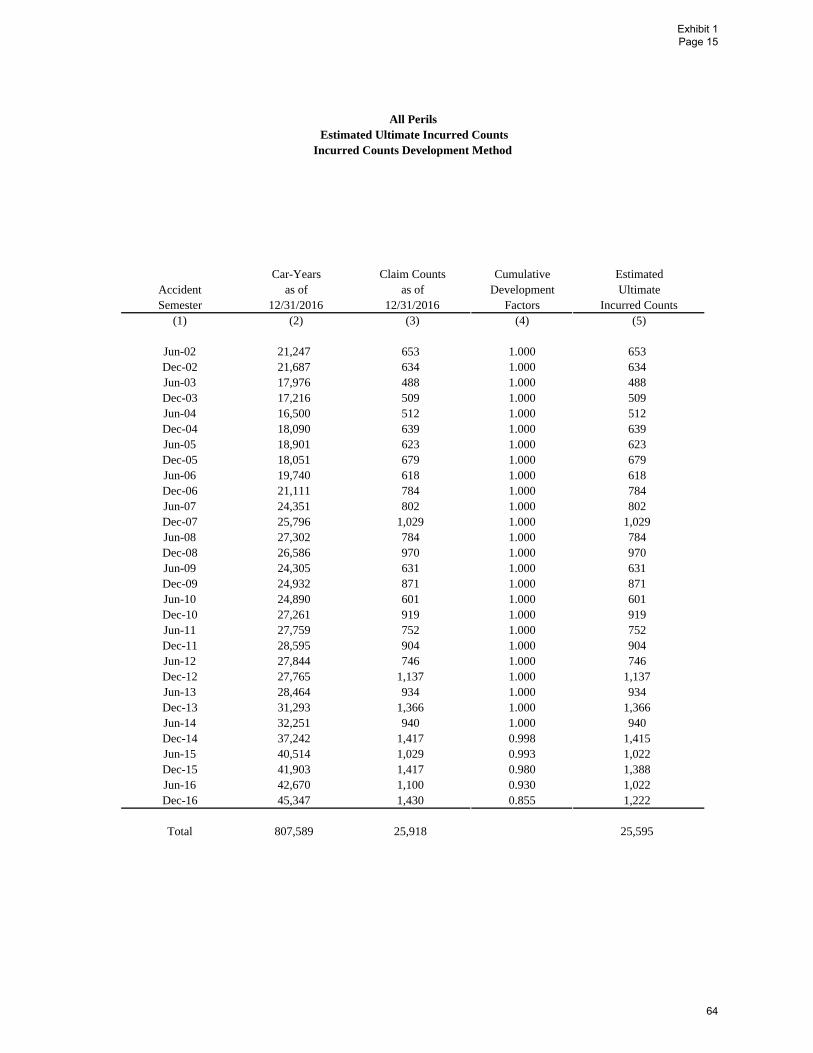
All PerilsEstimated Ultimate Incurred Counts
Incurred Counts Development Method
Car-Years Claim Counts Cumulative EstimatedAccident as of as of Development UltimateSemester 12/31/2016 12/31/2016 Factors Incurred Counts
(1) (2) (3) (4) (5)
Jun-02 21,247 653 1.000 653Dec-02 21,687 634 1.000 634Jun-03 17,976 488 1.000 488Dec-03 17,216 509 1.000 509Jun-04 16,500 512 1.000 512Dec-04 18,090 639 1.000 639Jun-05 18,901 623 1.000 623Dec-05 18,051 679 1.000 679Jun-06 19,740 618 1.000 618Dec-06 21,111 784 1.000 784Jun-07 24,351 802 1.000 802Dec-07 25,796 1,029 1.000 1,029Jun-08 27,302 784 1.000 784Dec-08 26,586 970 1.000 970Jun-09 24,305 631 1.000 631Dec-09 24,932 871 1.000 871Jun-10 24,890 601 1.000 601Dec-10 27,261 919 1.000 919Jun-11 27,759 752 1.000 752Dec-11 28,595 904 1.000 904Jun-12 27,844 746 1.000 746Dec-12 27,765 1,137 1.000 1,137Jun-13 28,464 934 1.000 934Dec-13 31,293 1,366 1.000 1,366Jun-14 32,251 940 1.000 940Dec-14 37,242 1,417 0.998 1,415Jun-15 40,514 1,029 0.993 1,022Dec-15 41,903 1,417 0.980 1,388Jun-16 42,670 1,100 0.930 1,022Dec-16 45,347 1,430 0.855 1,222
Total 807,589 25,918 25,595
Exhibit 1 Page 15
64
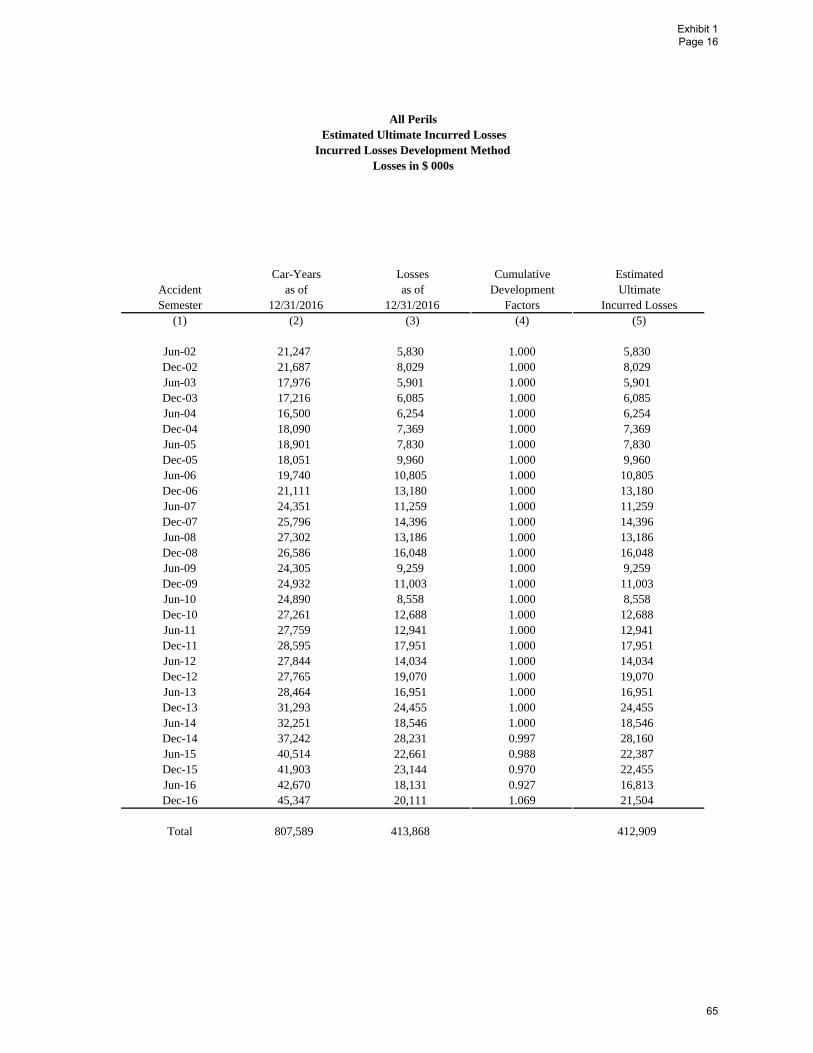
All PerilsEstimated Ultimate Incurred Losses
Incurred Losses Development Method Losses in $ 000s
Car-Years Losses Cumulative EstimatedAccident as of as of Development UltimateSemester 12/31/2016 12/31/2016 Factors Incurred Losses
(1) (2) (3) (4) (5)
Jun-02 21,247 5,830 1.000 5,830Dec-02 21,687 8,029 1.000 8,029Jun-03 17,976 5,901 1.000 5,901Dec-03 17,216 6,085 1.000 6,085Jun-04 16,500 6,254 1.000 6,254Dec-04 18,090 7,369 1.000 7,369Jun-05 18,901 7,830 1.000 7,830Dec-05 18,051 9,960 1.000 9,960Jun-06 19,740 10,805 1.000 10,805Dec-06 21,111 13,180 1.000 13,180Jun-07 24,351 11,259 1.000 11,259Dec-07 25,796 14,396 1.000 14,396Jun-08 27,302 13,186 1.000 13,186Dec-08 26,586 16,048 1.000 16,048Jun-09 24,305 9,259 1.000 9,259Dec-09 24,932 11,003 1.000 11,003Jun-10 24,890 8,558 1.000 8,558Dec-10 27,261 12,688 1.000 12,688Jun-11 27,759 12,941 1.000 12,941Dec-11 28,595 17,951 1.000 17,951Jun-12 27,844 14,034 1.000 14,034Dec-12 27,765 19,070 1.000 19,070Jun-13 28,464 16,951 1.000 16,951Dec-13 31,293 24,455 1.000 24,455Jun-14 32,251 18,546 1.000 18,546Dec-14 37,242 28,231 0.997 28,160Jun-15 40,514 22,661 0.988 22,387Dec-15 41,903 23,144 0.970 22,455Jun-16 42,670 18,131 0.927 16,813Dec-16 45,347 20,111 1.069 21,504
Total 807,589 413,868 412,909
Exhibit 1 Page 16
65

Province of AlbertaAlberta Automobile Insurance Board - Commercial Automobile
TPL BIReported Counts
Data as of 12/31/16
AccidentSemester Car-Years 6 12 18 24 30 36 42 48 54 60 66 72 78 84 90 96 102 108 114 120 126 132 138 144 150 156 162 168 174 180
(1)Jun-02 140,574 977 1,012 935 898 881 874 874 861 861 854 849 846 843 842 842 842 843 844 844 843 843 842 842 842 842 842 842 842 842 842Dec-02 145,898 982 956 890 866 859 853 852 852 847 842 835 823 826 821 822 822 822 821 817 817 817 817 817 817 817 817 817 817 817Jun-03 138,623 889 902 851 837 836 829 826 818 816 813 796 788 786 783 786 786 785 784 781 780 780 777 778 777 777 777 777 777Dec-03 142,184 810 886 857 862 840 838 827 821 813 803 801 797 797 796 794 794 793 792 792 792 791 791 791 791 791 791 791Jun-04 138,549 837 900 840 822 804 792 788 785 778 775 773 769 770 770 767 765 765 765 765 762 761 761 761 761 761 761Dec-04 145,566 871 907 850 845 847 840 838 822 815 815 808 802 799 797 796 796 796 795 795 794 795 794 794 794 793Jun-05 144,352 817 843 821 785 808 808 786 772 773 773 775 768 769 769 771 770 771 770 771 771 771 769 769 767Dec-05 146,449 953 1,017 966 938 916 873 865 855 844 841 842 841 838 838 838 835 833 832 833 834 834 834 834Jun-06 147,591 837 883 821 799 754 733 729 727 720 718 714 712 713 711 711 710 710 710 710 709 708 708Dec-06 156,062 953 1,034 987 907 893 894 894 896 886 882 865 866 861 862 856 851 850 850 848 848 848Jun-07 164,487 882 948 810 786 802 803 810 804 800 783 781 774 775 768 768 765 765 763 763 763Dec-07 176,457 974 996 922 913 908 902 901 900 882 881 910 907 899 898 894 893 893 894 895Jun-08 176,619 692 759 743 732 738 713 716 708 708 702 702 693 690 688 688 683 683 683Dec-08 177,732 663 780 761 778 769 763 754 752 741 734 727 725 722 722 722 720 719Jun-09 168,131 558 576 548 550 566 526 528 522 524 515 514 511 510 509 509 509Dec-09 170,780 635 734 681 679 642 629 625 628 612 613 611 611 610 610 611Jun-10 166,454 555 570 560 521 531 518 516 507 505 500 500 498 497 494Dec-10 173,705 671 716 672 667 631 621 611 606 602 600 598 593 595Jun-11 168,712 755 702 663 643 621 596 594 585 587 583 580 577Dec-11 174,155 761 732 694 664 635 622 617 612 608 608 610Jun-12 172,213 604 617 574 543 543 525 524 518 516 513Dec-12 175,750 708 809 753 743 714 708 703 700 700Jun-13 175,281 676 703 641 633 608 599 602 604Dec-13 186,158 836 917 854 841 824 823 811Jun-14 187,215 708 686 645 635 640 634Dec-14 205,346 854 898 813 808 805Jun-15 209,003 663 679 661 647Dec-15 215,156 589 680 656Jun-16 209,034 510 521Dec-16 214,602 552
Exhibit 2 Page 1
66

Reported Count Development Factors
AccidentSemester 6-12 12-18 18-24 24-30 30-36 36-42 42-48 48-54 54-60 60-66 66-72 72-78 78-84 84-90 90-96 96-102 102-108 108-114 114-120 120-126 126-132 132-138 138-144 144-150 150-156 156-162 162-168 168-174 174-180 80-Ultimat
Jun-02 1.036 0.924 0.960 0.981 0.992 1.000 0.985 1.000 0.992 0.994 0.996 0.996 0.999 1.000 1.000 1.001 1.001 1.000 0.999 1.000 0.999 1.000 1.000 1.000 1.000 1.000 1.000 1.000 1.000Dec-02 0.974 0.931 0.973 0.992 0.993 0.999 1.000 0.994 0.994 0.992 0.986 1.004 0.994 1.001 1.000 1.000 0.999 0.995 1.000 1.000 1.000 1.000 1.000 1.000 1.000 1.000 1.000 1.000Jun-03 1.015 0.943 0.984 0.999 0.992 0.996 0.990 0.998 0.996 0.979 0.990 0.997 0.996 1.004 1.000 0.999 0.999 0.996 0.999 1.000 0.996 1.001 0.999 1.000 1.000 1.000 1.000Dec-03 1.094 0.967 1.006 0.974 0.998 0.987 0.993 0.990 0.988 0.998 0.995 1.000 0.999 0.997 1.000 0.999 0.999 1.000 1.000 0.999 1.000 1.000 1.000 1.000 1.000 1.000Jun-04 1.075 0.933 0.979 0.978 0.985 0.995 0.996 0.991 0.996 0.997 0.995 1.001 1.000 0.996 0.997 1.000 1.000 1.000 0.996 0.999 1.000 1.000 1.000 1.000 1.000Dec-04 1.041 0.937 0.994 1.002 0.992 0.998 0.981 0.991 1.000 0.991 0.993 0.996 0.997 0.999 1.000 1.000 0.999 1.000 0.999 1.001 0.999 1.000 1.000 0.999Jun-05 1.032 0.974 0.956 1.029 1.000 0.973 0.982 1.001 1.000 1.003 0.991 1.001 1.000 1.003 0.999 1.001 0.999 1.001 1.000 1.000 0.997 1.000 0.997Dec-05 1.067 0.950 0.971 0.977 0.953 0.992 0.988 0.987 0.996 1.001 0.999 0.996 1.000 1.000 0.996 0.998 0.999 1.001 1.001 1.000 1.000 1.000Jun-06 1.055 0.930 0.973 0.943 0.973 0.995 0.997 0.990 0.997 0.994 0.997 1.001 0.997 1.000 0.999 1.000 1.000 1.000 0.999 0.999 1.000Dec-06 1.085 0.955 0.919 0.985 1.001 1.000 1.002 0.989 0.995 0.981 1.001 0.994 1.001 0.993 0.994 0.999 1.000 0.998 1.000 1.000Jun-07 1.075 0.855 0.970 1.020 1.001 1.009 0.993 0.995 0.979 0.997 0.991 1.001 0.991 1.000 0.996 1.000 0.997 1.000 1.000Dec-07 1.023 0.925 0.990 0.995 0.993 0.999 0.999 0.980 0.999 1.033 0.997 0.991 0.999 0.996 0.999 1.000 1.001 1.001Jun-08 1.097 0.979 0.985 1.008 0.966 1.004 0.989 1.000 0.992 1.000 0.987 0.996 0.997 1.000 0.993 1.000 1.000Dec-08 1.176 0.976 1.022 0.988 0.992 0.988 0.997 0.985 0.991 0.990 0.997 0.996 1.000 1.000 0.997 0.999Jun-09 1.032 0.951 1.004 1.029 0.929 1.004 0.989 1.004 0.983 0.998 0.994 0.998 0.998 1.000 1.000Dec-09 1.156 0.928 0.997 0.946 0.980 0.994 1.005 0.975 1.002 0.997 1.000 0.998 1.000 1.002Jun-10 1.027 0.982 0.930 1.019 0.976 0.996 0.983 0.996 0.990 1.000 0.996 0.998 0.994Dec-10 1.067 0.939 0.993 0.946 0.984 0.984 0.992 0.993 0.997 0.997 0.992 1.003Jun-11 0.930 0.944 0.970 0.966 0.960 0.997 0.985 1.003 0.993 0.995 0.995Dec-11 0.962 0.948 0.957 0.956 0.980 0.992 0.992 0.993 1.000 1.003Jun-12 1.022 0.930 0.946 1.000 0.967 0.998 0.989 0.996 0.994Dec-12 1.143 0.931 0.987 0.961 0.992 0.993 0.996 1.000Jun-13 1.040 0.912 0.988 0.961 0.985 1.005 1.003Dec-13 1.097 0.931 0.985 0.980 0.999 0.985Jun-14 0.969 0.940 0.984 1.008 0.991Dec-14 1.052 0.905 0.994 0.996Jun-15 1.024 0.973 0.979Dec-15 1.154 0.965Jun-16 1.022
Average Incurred Count Development Factors
6-12 12-18 18-24 24-30 30-36 36-42 42-48 48-54 54-60 60-66 66-72 72-78 78-84 84-90 90-96 96-102 102-108 108-114 114-120 120-126 126-132 132-138 138-144 144-150 150-156 156-162 162-168 168-174 174-180 80-Ultimat
Arithmetic AveragesAll Semesters 1.053 0.941 0.978 0.986 0.983 0.995 0.992 0.993 0.994 0.997 0.994 0.998 0.998 0.999 0.998 1.000 0.999 0.999 0.999 1.000 0.999 1.000 0.999 1.000 1.000 1.000 1.000 1.000 1.00020 Semesters 1.058 0.940 0.977 0.986 0.981 0.995 0.992 0.993 0.994 0.99710 Semesters 1.048 0.938 0.978 0.979 0.981 0.995 0.993 0.995 0.994 1.001 0.995 0.998 0.998 0.999 0.997 1.000 0.999 1.000 0.999 1.0006 Semesters 1.053 0.938 0.986 0.984 0.985 0.995 0.993 0.997 0.996 0.998 0.996 0.998 0.998 1.000 0.997 1.000 1.000 1.000 1.000 1.000 0.999 1.000 0.999 1.0004 Semesters 1.063 0.946 0.985 0.986 0.992 0.995 0.995 0.998 0.996 0.999 0.996 0.999 0.998 1.000 0.997 1.000 1.000 1.000 1.000 1.000 0.999 1.000 0.999 1.000 1.000 1.0002 Semesters 1.088 0.969 0.986 1.002 0.995 0.995 1.000 0.998 0.997 0.999 0.993 1.001 0.997 1.001 0.999 0.999 1.001 1.001 1.000 0.999 1.000 1.000 0.999 0.999 1.000 1.000 1.000 1.000All Semester ex hi/lo 1.053 0.943 0.978 0.986 0.984 0.995 0.992 0.994 0.994 0.996 0.994 0.998 0.998 1.000 0.998 1.000 0.999 1.000 0.999 1.000 0.999 1.000 1.000 1.000 1.000 1.000 1.0006 Semesters ex hi/lo 1.049 0.937 0.986 0.984 0.987 0.995 0.992 0.996 0.996 0.998 0.996 0.998 0.999 1.000 0.997 1.000 1.000 1.001 1.000 1.000 1.000 1.000 1.000 1.000$ Weighted AveragesAll Semesters 1.051 0.940 0.977 0.986 0.984 0.995 0.993 0.993 0.994 0.997 0.994 0.998 0.998 0.999 0.998 1.000 0.999 0.999 0.999 1.000 0.999 1.000 0.999 1.000 1.000 1.000 1.000 1.000 1.00020 Semesters 1.057 0.938 0.977 0.985 0.982 0.995 0.993 0.992 0.994 0.99710 Semesters 1.048 0.937 0.979 0.978 0.982 0.994 0.993 0.994 0.994 1.002 0.995 0.997 0.998 0.999 0.997 1.000 0.999 1.000 0.999 1.0006 Semester 1.053 0.936 0.986 0.984 0.987 0.994 0.993 0.997 0.996 0.998 0.996 0.998 0.998 0.999 0.996 1.000 1.000 1.000 1.000 1.000 0.999 1.000 0.999 1.0004 Semester 1.062 0.943 0.986 0.986 0.992 0.994 0.995 0.998 0.996 0.999 0.996 1.000 0.998 1.000 0.997 1.000 1.000 1.000 1.000 1.000 0.999 1.000 0.999 1.000 1.000 1.0002 Semester 1.093 0.969 0.987 1.001 0.995 0.994 0.999 0.998 0.997 0.999 0.993 1.001 0.997 1.001 0.998 0.999 1.001 1.001 1.000 0.999 1.000 1.000 0.999 0.999 1.000 1.000 1.000 1.000Last 4 Semesters ending in 12 1.106 0.931 0.981Last 4 Semesters ending in 6 1.013 0.939 0.975
SelectedAge To Age 1.106 0.936 0.986 0.984 0.987 0.994 0.993 0.997 0.996 0.998 0.996 0.998 0.998 0.999 0.996 1.000 1.000 1.000 1.000 1.000 0.999 1.000 0.999 1.000 1.000 1.000 1.000 1.000 1.000 1.000Age to Ultimate 0.956 0.864 0.923 0.936 0.952 0.965 0.970 0.977 0.980 0.984 0.985 0.990 0.992 0.993 0.994 0.998 0.998 0.999 0.998 0.999 0.999 0.999 0.999 1.000 1.000 1.000 1.000 1.000 1.000 1.000
Exhibit 2 Page 2
67
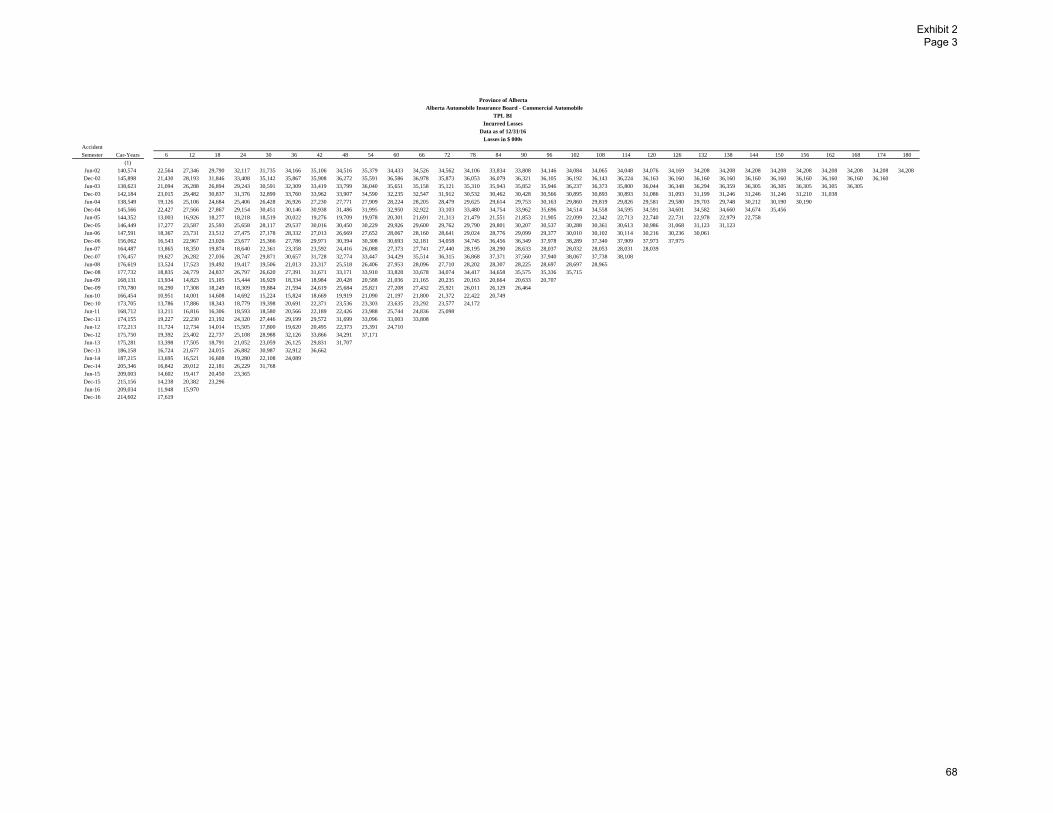
Province of AlbertaAlberta Automobile Insurance Board - Commercial Automobile
TPL BIIncurred Losses
Data as of 12/31/16Losses in $ 000s
AccidentSemester Car-Years 6 12 18 24 30 36 42 48 54 60 66 72 78 84 90 96 102 108 114 120 126 132 138 144 150 156 162 168 174 180
(1)Jun-02 140,574 22,564 27,346 29,790 32,117 31,735 34,166 35,106 34,516 35,379 34,433 34,526 34,562 34,106 33,834 33,808 34,146 34,084 34,065 34,048 34,076 34,169 34,208 34,208 34,208 34,208 34,208 34,208 34,208 34,208 34,208Dec-02 145,898 21,430 28,193 31,846 33,408 35,142 35,867 35,908 36,272 35,591 36,586 36,978 35,873 36,053 36,079 36,321 36,105 36,192 36,143 36,224 36,163 36,160 36,160 36,160 36,160 36,160 36,160 36,160 36,160 36,160Jun-03 138,623 21,094 26,288 26,894 29,243 30,591 32,309 33,419 33,799 36,040 35,651 35,158 35,121 35,310 35,943 35,852 35,946 36,237 36,373 35,800 36,044 36,348 36,294 36,359 36,305 36,305 36,305 36,305 36,305Dec-03 142,184 23,015 29,482 30,837 31,376 32,899 33,760 33,962 33,907 34,590 32,235 32,547 31,912 30,532 30,462 30,428 30,566 30,895 30,893 30,893 31,086 31,093 31,199 31,246 31,246 31,246 31,210 31,038Jun-04 138,549 19,126 25,106 24,684 25,406 26,428 26,926 27,230 27,771 27,909 28,224 28,205 28,479 29,625 29,614 29,753 30,163 29,860 29,819 29,826 29,581 29,580 29,703 29,748 30,212 30,190 30,190Dec-04 145,566 22,427 27,566 27,867 29,154 30,451 30,146 30,938 31,486 31,995 32,950 32,922 33,103 33,480 34,754 33,962 35,696 34,514 34,558 34,595 34,591 34,601 34,582 34,660 34,674 35,456Jun-05 144,352 13,003 16,926 18,277 18,218 18,519 20,022 19,276 19,709 19,978 20,301 21,691 21,313 21,479 21,551 21,853 21,905 22,099 22,342 22,713 22,740 22,731 22,978 22,979 22,758Dec-05 146,449 17,277 23,587 25,593 25,658 28,117 29,537 30,016 30,450 30,229 29,926 29,600 29,762 29,790 29,801 30,207 30,537 30,288 30,361 30,613 30,986 31,068 31,123 31,123Jun-06 147,591 18,367 23,731 23,512 27,475 27,178 28,332 27,013 26,669 27,652 28,067 28,160 28,641 29,024 28,776 29,099 29,377 30,010 30,102 30,114 30,216 30,236 30,061Dec-06 156,062 16,543 22,967 23,026 23,677 25,366 27,786 29,971 30,394 30,308 30,693 32,181 34,058 34,745 36,456 36,349 37,978 38,289 37,340 37,909 37,973 37,975Jun-07 164,487 13,865 18,350 19,874 18,640 22,361 23,358 23,592 24,416 26,088 27,373 27,741 27,440 28,195 28,290 28,633 28,037 28,032 28,053 28,031 28,039Dec-07 176,457 19,627 26,282 27,036 28,747 29,871 30,657 31,728 32,774 33,447 34,429 35,514 36,315 36,868 37,371 37,560 37,940 38,067 37,738 38,108Jun-08 176,619 13,524 17,523 19,492 19,417 19,506 21,013 23,317 25,518 26,406 27,953 28,096 27,710 28,202 28,307 28,225 28,697 28,697 28,965Dec-08 177,732 18,835 24,779 24,837 26,797 26,620 27,391 31,671 33,171 33,910 33,828 33,678 34,074 34,417 34,658 35,575 35,336 35,715Jun-09 168,131 13,934 14,823 15,105 15,444 16,929 18,334 18,984 20,428 20,588 21,036 21,165 20,235 20,163 20,664 20,633 20,707Dec-09 170,780 16,290 17,308 18,249 18,309 19,884 21,594 24,619 25,684 25,821 27,208 27,432 25,921 26,011 26,129 26,464Jun-10 166,454 10,951 14,001 14,608 14,692 15,224 15,824 18,669 19,919 21,090 21,197 21,800 21,372 22,422 20,749Dec-10 173,705 13,786 17,886 18,343 18,779 19,398 20,691 22,371 23,536 23,303 23,635 23,292 23,577 24,172Jun-11 168,712 13,211 16,816 16,306 18,593 18,580 20,566 22,189 22,426 23,988 25,744 24,836 25,098Dec-11 174,155 19,227 22,230 23,192 24,320 27,446 29,199 29,572 31,699 33,096 33,003 33,808Jun-12 172,213 11,724 12,734 14,014 15,505 17,800 19,620 20,495 22,373 23,391 24,710Dec-12 175,750 19,392 23,402 22,737 25,108 28,988 32,126 33,866 34,291 37,171Jun-13 175,281 13,398 17,505 18,791 21,052 23,059 26,125 29,831 31,707Dec-13 186,158 16,724 21,677 24,015 26,882 30,987 32,912 36,662Jun-14 187,215 13,695 16,521 16,608 19,280 22,108 24,089Dec-14 205,346 16,842 20,012 22,181 26,229 31,768Jun-15 209,003 14,602 19,417 20,450 23,365Dec-15 215,156 14,238 20,382 23,296Jun-16 209,034 11,948 15,970Dec-16 214,602 17,619
Exhibit 2 Page 3
68
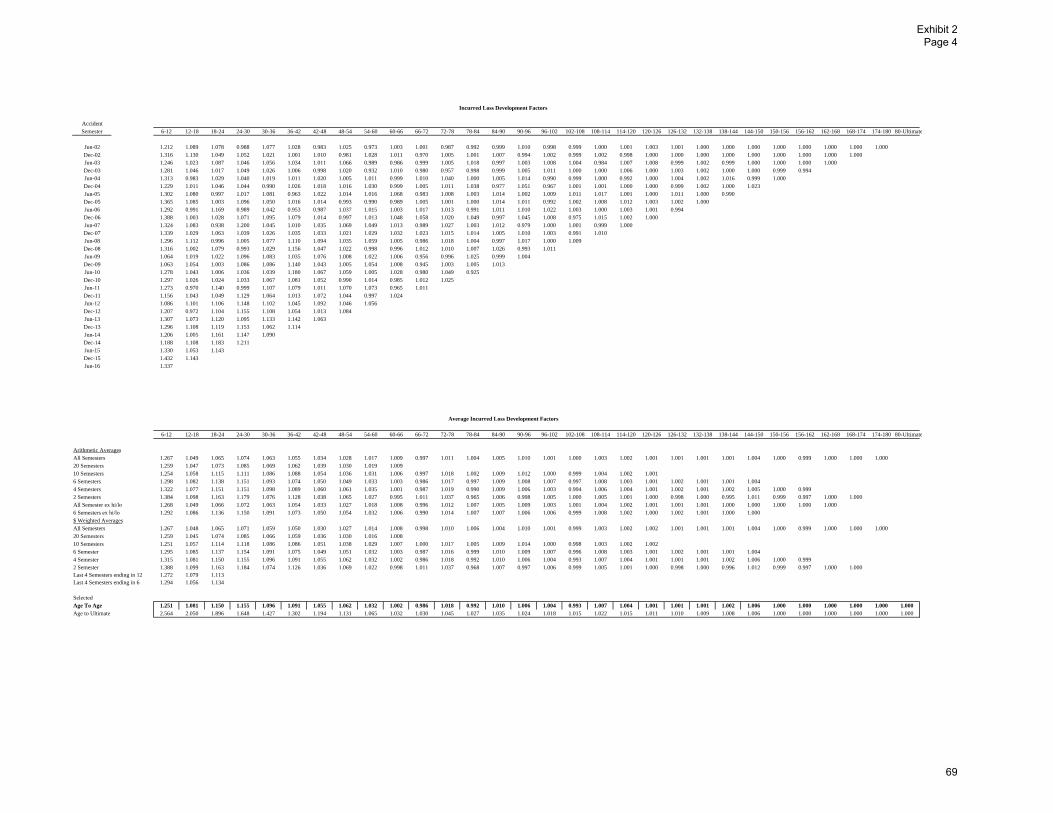
Incurred Loss Development Factors
AccidentSemester 6-12 12-18 18-24 24-30 30-36 36-42 42-48 48-54 54-60 60-66 66-72 72-78 78-84 84-90 90-96 96-102 102-108 108-114 114-120 120-126 126-132 132-138 138-144 144-150 150-156 156-162 162-168 168-174 174-180 80-Ultimate
Jun-02 1.212 1.089 1.078 0.988 1.077 1.028 0.983 1.025 0.973 1.003 1.001 0.987 0.992 0.999 1.010 0.998 0.999 1.000 1.001 1.003 1.001 1.000 1.000 1.000 1.000 1.000 1.000 1.000 1.000Dec-02 1.316 1.130 1.049 1.052 1.021 1.001 1.010 0.981 1.028 1.011 0.970 1.005 1.001 1.007 0.994 1.002 0.999 1.002 0.998 1.000 1.000 1.000 1.000 1.000 1.000 1.000 1.000 1.000Jun-03 1.246 1.023 1.087 1.046 1.056 1.034 1.011 1.066 0.989 0.986 0.999 1.005 1.018 0.997 1.003 1.008 1.004 0.984 1.007 1.008 0.999 1.002 0.999 1.000 1.000 1.000 1.000Dec-03 1.281 1.046 1.017 1.049 1.026 1.006 0.998 1.020 0.932 1.010 0.980 0.957 0.998 0.999 1.005 1.011 1.000 1.000 1.006 1.000 1.003 1.002 1.000 1.000 0.999 0.994Jun-04 1.313 0.983 1.029 1.040 1.019 1.011 1.020 1.005 1.011 0.999 1.010 1.040 1.000 1.005 1.014 0.990 0.999 1.000 0.992 1.000 1.004 1.002 1.016 0.999 1.000Dec-04 1.229 1.011 1.046 1.044 0.990 1.026 1.018 1.016 1.030 0.999 1.005 1.011 1.038 0.977 1.051 0.967 1.001 1.001 1.000 1.000 0.999 1.002 1.000 1.023Jun-05 1.302 1.080 0.997 1.017 1.081 0.963 1.022 1.014 1.016 1.068 0.983 1.008 1.003 1.014 1.002 1.009 1.011 1.017 1.001 1.000 1.011 1.000 0.990Dec-05 1.365 1.085 1.003 1.096 1.050 1.016 1.014 0.993 0.990 0.989 1.005 1.001 1.000 1.014 1.011 0.992 1.002 1.008 1.012 1.003 1.002 1.000Jun-06 1.292 0.991 1.169 0.989 1.042 0.953 0.987 1.037 1.015 1.003 1.017 1.013 0.991 1.011 1.010 1.022 1.003 1.000 1.003 1.001 0.994Dec-06 1.388 1.003 1.028 1.071 1.095 1.079 1.014 0.997 1.013 1.048 1.058 1.020 1.049 0.997 1.045 1.008 0.975 1.015 1.002 1.000Jun-07 1.324 1.083 0.938 1.200 1.045 1.010 1.035 1.069 1.049 1.013 0.989 1.027 1.003 1.012 0.979 1.000 1.001 0.999 1.000Dec-07 1.339 1.029 1.063 1.039 1.026 1.035 1.033 1.021 1.029 1.032 1.023 1.015 1.014 1.005 1.010 1.003 0.991 1.010Jun-08 1.296 1.112 0.996 1.005 1.077 1.110 1.094 1.035 1.059 1.005 0.986 1.018 1.004 0.997 1.017 1.000 1.009Dec-08 1.316 1.002 1.079 0.993 1.029 1.156 1.047 1.022 0.998 0.996 1.012 1.010 1.007 1.026 0.993 1.011Jun-09 1.064 1.019 1.022 1.096 1.083 1.035 1.076 1.008 1.022 1.006 0.956 0.996 1.025 0.999 1.004Dec-09 1.063 1.054 1.003 1.086 1.086 1.140 1.043 1.005 1.054 1.008 0.945 1.003 1.005 1.013Jun-10 1.278 1.043 1.006 1.036 1.039 1.180 1.067 1.059 1.005 1.028 0.980 1.049 0.925Dec-10 1.297 1.026 1.024 1.033 1.067 1.081 1.052 0.990 1.014 0.985 1.012 1.025Jun-11 1.273 0.970 1.140 0.999 1.107 1.079 1.011 1.070 1.073 0.965 1.011Dec-11 1.156 1.043 1.049 1.129 1.064 1.013 1.072 1.044 0.997 1.024Jun-12 1.086 1.101 1.106 1.148 1.102 1.045 1.092 1.046 1.056Dec-12 1.207 0.972 1.104 1.155 1.108 1.054 1.013 1.084Jun-13 1.307 1.073 1.120 1.095 1.133 1.142 1.063Dec-13 1.296 1.108 1.119 1.153 1.062 1.114Jun-14 1.206 1.005 1.161 1.147 1.090Dec-14 1.188 1.108 1.183 1.211Jun-15 1.330 1.053 1.143Dec-15 1.432 1.143Jun-16 1.337
Average Incurred Loss Development Factors
6-12 12-18 18-24 24-30 30-36 36-42 42-48 48-54 54-60 60-66 66-72 72-78 78-84 84-90 90-96 96-102 102-108 108-114 114-120 120-126 126-132 132-138 138-144 144-150 150-156 156-162 162-168 168-174 174-180 80-Ultimate
Arithmetic AveragesAll Semesters 1.267 1.049 1.065 1.074 1.063 1.055 1.034 1.028 1.017 1.009 0.997 1.011 1.004 1.005 1.010 1.001 1.000 1.003 1.002 1.001 1.001 1.001 1.001 1.004 1.000 0.999 1.000 1.000 1.00020 Semesters 1.259 1.047 1.073 1.085 1.069 1.062 1.039 1.030 1.019 1.00910 Semesters 1.254 1.058 1.115 1.111 1.086 1.088 1.054 1.036 1.031 1.006 0.997 1.018 1.002 1.009 1.012 1.000 0.999 1.004 1.002 1.0016 Semesters 1.298 1.082 1.138 1.151 1.093 1.074 1.050 1.049 1.033 1.003 0.986 1.017 0.997 1.009 1.008 1.007 0.997 1.008 1.003 1.001 1.002 1.001 1.001 1.0044 Semesters 1.322 1.077 1.151 1.151 1.098 1.089 1.060 1.061 1.035 1.001 0.987 1.019 0.990 1.009 1.006 1.003 0.994 1.006 1.004 1.001 1.002 1.001 1.002 1.005 1.000 0.9992 Semesters 1.384 1.098 1.163 1.179 1.076 1.128 1.038 1.065 1.027 0.995 1.011 1.037 0.965 1.006 0.998 1.005 1.000 1.005 1.001 1.000 0.998 1.000 0.995 1.011 0.999 0.997 1.000 1.000All Semester ex hi/lo 1.268 1.049 1.066 1.072 1.063 1.054 1.033 1.027 1.018 1.008 0.996 1.012 1.007 1.005 1.009 1.003 1.001 1.004 1.002 1.001 1.001 1.001 1.000 1.000 1.000 1.000 1.0006 Semesters ex hi/lo 1.292 1.086 1.136 1.150 1.091 1.073 1.050 1.054 1.032 1.006 0.990 1.014 1.007 1.007 1.006 1.006 0.999 1.008 1.002 1.000 1.002 1.001 1.000 1.000$ Weighted AveragesAll Semesters 1.267 1.048 1.065 1.071 1.059 1.050 1.030 1.027 1.014 1.008 0.998 1.010 1.006 1.004 1.010 1.001 0.999 1.003 1.002 1.002 1.001 1.001 1.001 1.004 1.000 0.999 1.000 1.000 1.00020 Semesters 1.259 1.045 1.074 1.085 1.066 1.059 1.036 1.030 1.016 1.00810 Semesters 1.251 1.057 1.114 1.118 1.086 1.086 1.051 1.038 1.029 1.007 1.000 1.017 1.005 1.009 1.014 1.000 0.998 1.003 1.002 1.0026 Semester 1.295 1.085 1.137 1.154 1.091 1.075 1.049 1.051 1.032 1.003 0.987 1.016 0.999 1.010 1.009 1.007 0.996 1.008 1.003 1.001 1.002 1.001 1.001 1.0044 Semester 1.315 1.081 1.150 1.155 1.096 1.091 1.055 1.062 1.032 1.002 0.986 1.018 0.992 1.010 1.006 1.004 0.993 1.007 1.004 1.001 1.001 1.001 1.002 1.006 1.000 0.9992 Semester 1.388 1.099 1.163 1.184 1.074 1.126 1.036 1.069 1.022 0.998 1.011 1.037 0.968 1.007 0.997 1.006 0.999 1.005 1.001 1.000 0.998 1.000 0.996 1.012 0.999 0.997 1.000 1.000Last 4 Semesters ending in 12 1.272 1.079 1.113Last 4 Semesters ending in 6 1.294 1.056 1.134
SelectedAge To Age 1.251 1.081 1.150 1.155 1.096 1.091 1.055 1.062 1.032 1.002 0.986 1.018 0.992 1.010 1.006 1.004 0.993 1.007 1.004 1.001 1.001 1.001 1.002 1.006 1.000 1.000 1.000 1.000 1.000 1.000Age to Ultimate 2.564 2.050 1.896 1.648 1.427 1.302 1.194 1.131 1.065 1.032 1.030 1.045 1.027 1.035 1.024 1.018 1.015 1.022 1.015 1.011 1.010 1.009 1.008 1.006 1.000 1.000 1.000 1.000 1.000 1.000
Exhibit 2 Page 4
69
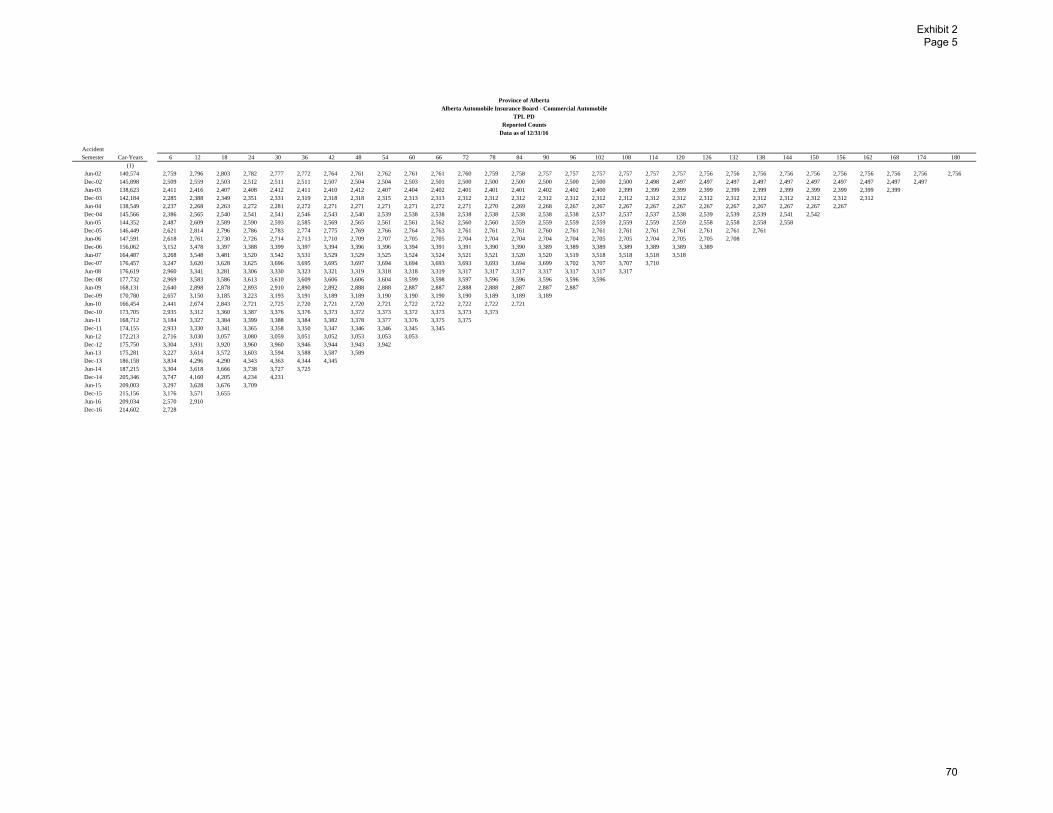
Province of AlbertaAlberta Automobile Insurance Board - Commercial Automobile
TPL PDReported Counts
Data as of 12/31/16
AccidentSemester Car-Years 6 12 18 24 30 36 42 48 54 60 66 72 78 84 90 96 102 108 114 120 126 132 138 144 150 156 162 168 174 180
(1)Jun-02 140,574 2,759 2,796 2,803 2,782 2,777 2,772 2,764 2,761 2,762 2,761 2,761 2,760 2,759 2,758 2,757 2,757 2,757 2,757 2,757 2,757 2,756 2,756 2,756 2,756 2,756 2,756 2,756 2,756 2,756 2,756Dec-02 145,898 2,509 2,559 2,503 2,512 2,511 2,511 2,507 2,504 2,504 2,503 2,501 2,500 2,500 2,500 2,500 2,500 2,500 2,500 2,498 2,497 2,497 2,497 2,497 2,497 2,497 2,497 2,497 2,497 2,497Jun-03 138,623 2,411 2,416 2,407 2,408 2,412 2,411 2,410 2,412 2,407 2,404 2,402 2,401 2,401 2,401 2,402 2,402 2,400 2,399 2,399 2,399 2,399 2,399 2,399 2,399 2,399 2,399 2,399 2,399Dec-03 142,184 2,285 2,388 2,349 2,351 2,331 2,319 2,318 2,318 2,315 2,313 2,313 2,312 2,312 2,312 2,312 2,312 2,312 2,312 2,312 2,312 2,312 2,312 2,312 2,312 2,312 2,312 2,312Jun-04 138,549 2,237 2,268 2,263 2,272 2,281 2,272 2,271 2,271 2,271 2,271 2,272 2,271 2,270 2,269 2,268 2,267 2,267 2,267 2,267 2,267 2,267 2,267 2,267 2,267 2,267 2,267Dec-04 145,566 2,386 2,565 2,540 2,541 2,541 2,546 2,543 2,540 2,539 2,538 2,538 2,538 2,538 2,538 2,538 2,538 2,537 2,537 2,537 2,538 2,539 2,539 2,539 2,541 2,542Jun-05 144,352 2,487 2,609 2,589 2,590 2,593 2,585 2,569 2,565 2,561 2,561 2,562 2,560 2,560 2,559 2,559 2,559 2,559 2,559 2,559 2,559 2,558 2,558 2,558 2,558Dec-05 146,449 2,621 2,814 2,796 2,786 2,783 2,774 2,775 2,769 2,766 2,764 2,763 2,761 2,761 2,761 2,760 2,761 2,761 2,761 2,761 2,761 2,761 2,761 2,761Jun-06 147,591 2,618 2,761 2,730 2,726 2,714 2,713 2,710 2,709 2,707 2,705 2,705 2,704 2,704 2,704 2,704 2,704 2,705 2,705 2,704 2,705 2,705 2,708Dec-06 156,062 3,152 3,478 3,397 3,388 3,399 3,397 3,394 3,396 3,396 3,394 3,391 3,391 3,390 3,390 3,389 3,389 3,389 3,389 3,389 3,389 3,389Jun-07 164,487 3,268 3,548 3,481 3,520 3,542 3,531 3,529 3,529 3,525 3,524 3,524 3,521 3,521 3,520 3,520 3,519 3,518 3,518 3,518 3,518Dec-07 176,457 3,247 3,620 3,628 3,625 3,696 3,695 3,695 3,697 3,694 3,694 3,693 3,693 3,693 3,694 3,699 3,702 3,707 3,707 3,710Jun-08 176,619 2,960 3,341 3,281 3,306 3,330 3,323 3,321 3,319 3,318 3,318 3,319 3,317 3,317 3,317 3,317 3,317 3,317 3,317Dec-08 177,732 2,969 3,583 3,586 3,613 3,610 3,609 3,606 3,606 3,604 3,599 3,598 3,597 3,596 3,596 3,596 3,596 3,596Jun-09 168,131 2,640 2,898 2,878 2,893 2,910 2,890 2,892 2,888 2,888 2,887 2,887 2,888 2,888 2,887 2,887 2,887Dec-09 170,780 2,657 3,150 3,185 3,223 3,193 3,191 3,189 3,189 3,190 3,190 3,190 3,190 3,189 3,189 3,189Jun-10 166,454 2,441 2,674 2,843 2,721 2,725 2,720 2,721 2,720 2,721 2,722 2,722 2,722 2,722 2,721Dec-10 173,705 2,935 3,312 3,360 3,387 3,376 3,376 3,373 3,372 3,373 3,372 3,373 3,373 3,373Jun-11 168,712 3,184 3,327 3,384 3,399 3,388 3,384 3,382 3,378 3,377 3,376 3,375 3,375Dec-11 174,155 2,933 3,330 3,341 3,365 3,358 3,350 3,347 3,346 3,346 3,345 3,345Jun-12 172,213 2,716 3,030 3,057 3,080 3,059 3,051 3,052 3,053 3,053 3,053Dec-12 175,750 3,304 3,931 3,920 3,960 3,960 3,946 3,944 3,943 3,942Jun-13 175,281 3,227 3,614 3,572 3,603 3,594 3,588 3,587 3,589Dec-13 186,158 3,834 4,296 4,290 4,343 4,363 4,344 4,345Jun-14 187,215 3,304 3,618 3,666 3,738 3,727 3,725Dec-14 205,346 3,747 4,160 4,205 4,234 4,231Jun-15 209,003 3,297 3,628 3,676 3,709Dec-15 215,156 3,176 3,571 3,655Jun-16 209,034 2,570 2,910Dec-16 214,602 2,728
Exhibit 2 Page 5
70
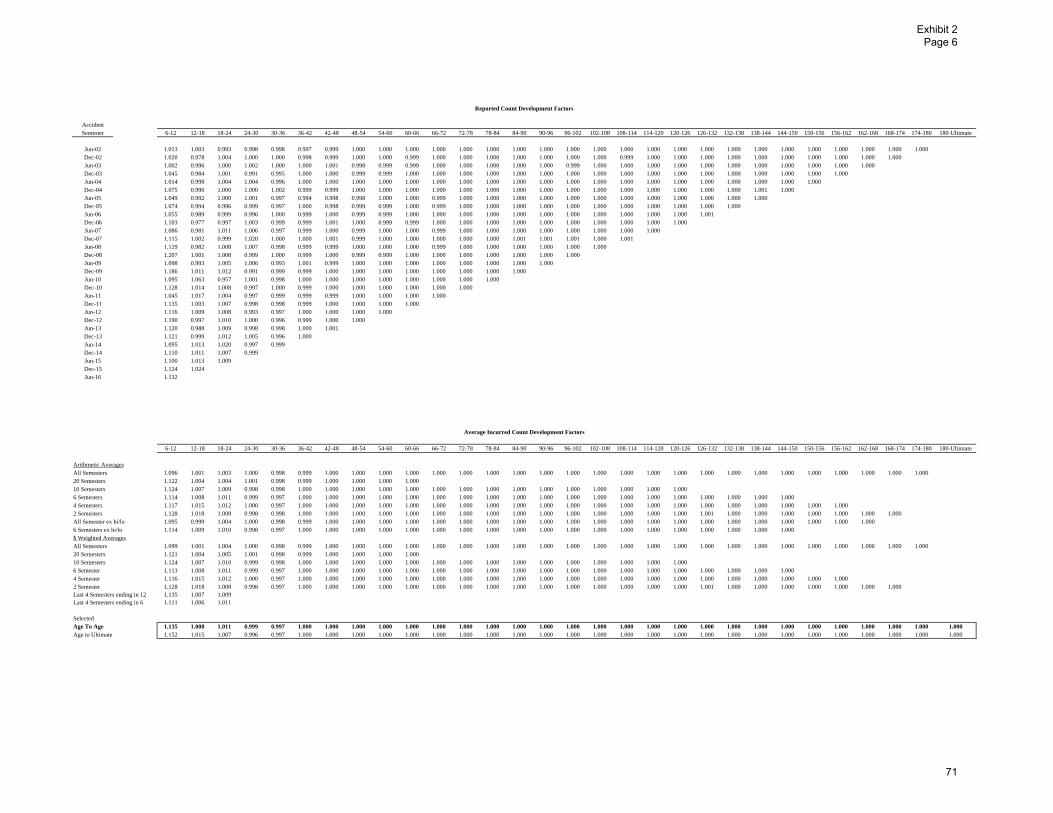
Reported Count Development Factors
AccidentSemester 6-12 12-18 18-24 24-30 30-36 36-42 42-48 48-54 54-60 60-66 66-72 72-78 78-84 84-90 90-96 96-102 102-108 108-114 114-120 120-126 126-132 132-138 138-144 144-150 150-156 156-162 162-168 168-174 174-180 180-Ultimate
Jun-02 1.013 1.003 0.993 0.998 0.998 0.997 0.999 1.000 1.000 1.000 1.000 1.000 1.000 1.000 1.000 1.000 1.000 1.000 1.000 1.000 1.000 1.000 1.000 1.000 1.000 1.000 1.000 1.000 1.000Dec-02 1.020 0.978 1.004 1.000 1.000 0.998 0.999 1.000 1.000 0.999 1.000 1.000 1.000 1.000 1.000 1.000 1.000 0.999 1.000 1.000 1.000 1.000 1.000 1.000 1.000 1.000 1.000 1.000Jun-03 1.002 0.996 1.000 1.002 1.000 1.000 1.001 0.998 0.999 0.999 1.000 1.000 1.000 1.000 1.000 0.999 1.000 1.000 1.000 1.000 1.000 1.000 1.000 1.000 1.000 1.000 1.000Dec-03 1.045 0.984 1.001 0.991 0.995 1.000 1.000 0.999 0.999 1.000 1.000 1.000 1.000 1.000 1.000 1.000 1.000 1.000 1.000 1.000 1.000 1.000 1.000 1.000 1.000 1.000Jun-04 1.014 0.998 1.004 1.004 0.996 1.000 1.000 1.000 1.000 1.000 1.000 1.000 1.000 1.000 1.000 1.000 1.000 1.000 1.000 1.000 1.000 1.000 1.000 1.000 1.000Dec-04 1.075 0.990 1.000 1.000 1.002 0.999 0.999 1.000 1.000 1.000 1.000 1.000 1.000 1.000 1.000 1.000 1.000 1.000 1.000 1.000 1.000 1.000 1.001 1.000Jun-05 1.049 0.992 1.000 1.001 0.997 0.994 0.998 0.998 1.000 1.000 0.999 1.000 1.000 1.000 1.000 1.000 1.000 1.000 1.000 1.000 1.000 1.000 1.000Dec-05 1.074 0.994 0.996 0.999 0.997 1.000 0.998 0.999 0.999 1.000 0.999 1.000 1.000 1.000 1.000 1.000 1.000 1.000 1.000 1.000 1.000 1.000Jun-06 1.055 0.989 0.999 0.996 1.000 0.999 1.000 0.999 0.999 1.000 1.000 1.000 1.000 1.000 1.000 1.000 1.000 1.000 1.000 1.000 1.001Dec-06 1.103 0.977 0.997 1.003 0.999 0.999 1.001 1.000 0.999 0.999 1.000 1.000 1.000 1.000 1.000 1.000 1.000 1.000 1.000 1.000Jun-07 1.086 0.981 1.011 1.006 0.997 0.999 1.000 0.999 1.000 1.000 0.999 1.000 1.000 1.000 1.000 1.000 1.000 1.000 1.000Dec-07 1.115 1.002 0.999 1.020 1.000 1.000 1.001 0.999 1.000 1.000 1.000 1.000 1.000 1.001 1.001 1.001 1.000 1.001Jun-08 1.129 0.982 1.008 1.007 0.998 0.999 0.999 1.000 1.000 1.000 0.999 1.000 1.000 1.000 1.000 1.000 1.000Dec-08 1.207 1.001 1.008 0.999 1.000 0.999 1.000 0.999 0.999 1.000 1.000 1.000 1.000 1.000 1.000 1.000Jun-09 1.098 0.993 1.005 1.006 0.993 1.001 0.999 1.000 1.000 1.000 1.000 1.000 1.000 1.000 1.000Dec-09 1.186 1.011 1.012 0.991 0.999 0.999 1.000 1.000 1.000 1.000 1.000 1.000 1.000 1.000Jun-10 1.095 1.063 0.957 1.001 0.998 1.000 1.000 1.000 1.000 1.000 1.000 1.000 1.000Dec-10 1.128 1.014 1.008 0.997 1.000 0.999 1.000 1.000 1.000 1.000 1.000 1.000Jun-11 1.045 1.017 1.004 0.997 0.999 0.999 0.999 1.000 1.000 1.000 1.000Dec-11 1.135 1.003 1.007 0.998 0.998 0.999 1.000 1.000 1.000 1.000Jun-12 1.116 1.009 1.008 0.993 0.997 1.000 1.000 1.000 1.000Dec-12 1.190 0.997 1.010 1.000 0.996 0.999 1.000 1.000Jun-13 1.120 0.988 1.009 0.998 0.998 1.000 1.001Dec-13 1.121 0.999 1.012 1.005 0.996 1.000Jun-14 1.095 1.013 1.020 0.997 0.999Dec-14 1.110 1.011 1.007 0.999Jun-15 1.100 1.013 1.009Dec-15 1.124 1.024Jun-16 1.132
Average Incurred Count Development Factors
6-12 12-18 18-24 24-30 30-36 36-42 42-48 48-54 54-60 60-66 66-72 72-78 78-84 84-90 90-96 96-102 102-108 108-114 114-120 120-126 126-132 132-138 138-144 144-150 150-156 156-162 162-168 168-174 174-180 180-Ultimate
Arithmetic AveragesAll Semesters 1.096 1.001 1.003 1.000 0.998 0.999 1.000 1.000 1.000 1.000 1.000 1.000 1.000 1.000 1.000 1.000 1.000 1.000 1.000 1.000 1.000 1.000 1.000 1.000 1.000 1.000 1.000 1.000 1.00020 Semesters 1.122 1.004 1.004 1.001 0.998 0.999 1.000 1.000 1.000 1.00010 Semesters 1.124 1.007 1.009 0.998 0.998 1.000 1.000 1.000 1.000 1.000 1.000 1.000 1.000 1.000 1.000 1.000 1.000 1.000 1.000 1.0006 Semesters 1.114 1.008 1.011 0.999 0.997 1.000 1.000 1.000 1.000 1.000 1.000 1.000 1.000 1.000 1.000 1.000 1.000 1.000 1.000 1.000 1.000 1.000 1.000 1.0004 Semesters 1.117 1.015 1.012 1.000 0.997 1.000 1.000 1.000 1.000 1.000 1.000 1.000 1.000 1.000 1.000 1.000 1.000 1.000 1.000 1.000 1.000 1.000 1.000 1.000 1.000 1.0002 Semesters 1.128 1.018 1.008 0.998 0.998 1.000 1.000 1.000 1.000 1.000 1.000 1.000 1.000 1.000 1.000 1.000 1.000 1.000 1.000 1.000 1.001 1.000 1.000 1.000 1.000 1.000 1.000 1.000All Semester ex hi/lo 1.095 0.999 1.004 1.000 0.998 0.999 1.000 1.000 1.000 1.000 1.000 1.000 1.000 1.000 1.000 1.000 1.000 1.000 1.000 1.000 1.000 1.000 1.000 1.000 1.000 1.000 1.0006 Semesters ex hi/lo 1.114 1.009 1.010 0.998 0.997 1.000 1.000 1.000 1.000 1.000 1.000 1.000 1.000 1.000 1.000 1.000 1.000 1.000 1.000 1.000 1.000 1.000 1.000 1.000$ Weighted AveragesAll Semesters 1.099 1.001 1.004 1.000 0.998 0.999 1.000 1.000 1.000 1.000 1.000 1.000 1.000 1.000 1.000 1.000 1.000 1.000 1.000 1.000 1.000 1.000 1.000 1.000 1.000 1.000 1.000 1.000 1.00020 Semesters 1.121 1.004 1.005 1.001 0.998 0.999 1.000 1.000 1.000 1.00010 Semesters 1.124 1.007 1.010 0.999 0.998 1.000 1.000 1.000 1.000 1.000 1.000 1.000 1.000 1.000 1.000 1.000 1.000 1.000 1.000 1.0006 Semester 1.113 1.008 1.011 0.999 0.997 1.000 1.000 1.000 1.000 1.000 1.000 1.000 1.000 1.000 1.000 1.000 1.000 1.000 1.000 1.000 1.000 1.000 1.000 1.0004 Semester 1.116 1.015 1.012 1.000 0.997 1.000 1.000 1.000 1.000 1.000 1.000 1.000 1.000 1.000 1.000 1.000 1.000 1.000 1.000 1.000 1.000 1.000 1.000 1.000 1.000 1.0002 Semester 1.128 1.018 1.008 0.998 0.997 1.000 1.000 1.000 1.000 1.000 1.000 1.000 1.000 1.000 1.000 1.000 1.000 1.000 1.000 1.000 1.001 1.000 1.000 1.000 1.000 1.000 1.000 1.000Last 4 Semesters ending in 12 1.135 1.007 1.009Last 4 Semesters ending in 6 1.111 1.006 1.011
SelectedAge To Age 1.135 1.008 1.011 0.999 0.997 1.000 1.000 1.000 1.000 1.000 1.000 1.000 1.000 1.000 1.000 1.000 1.000 1.000 1.000 1.000 1.000 1.000 1.000 1.000 1.000 1.000 1.000 1.000 1.000 1.000Age to Ultimate 1.152 1.015 1.007 0.996 0.997 1.000 1.000 1.000 1.000 1.000 1.000 1.000 1.000 1.000 1.000 1.000 1.000 1.000 1.000 1.000 1.000 1.000 1.000 1.000 1.000 1.000 1.000 1.000 1.000 1.000
Exhibit 2 Page 6
71

Province of AlbertaAlberta Automobile Insurance Board - Commercial Automobile
TPL PDIncurred Losses
Data as of 12/31/16Losses in $ 000s
AccidentSemester Car-Years 6 12 18 24 30 36 42 48 54 60 66 72 78 84 90 96 102 108 114 120 126 132 138 144 150 156 162 168 174 180
(1)Jun-02 140,574 11,338 13,641 13,823 13,743 13,794 13,736 13,748 13,692 14,918 13,800 13,789 13,792 15,151 15,151 15,153 15,153 15,153 15,153 15,153 15,153 15,148 15,148 15,148 15,148 15,148 15,148 15,148 15,148 15,148 15,148Dec-02 145,898 11,414 13,982 14,114 14,813 14,327 14,998 14,927 14,219 14,210 14,211 14,199 14,188 14,184 14,182 14,171 14,171 14,171 14,171 14,163 14,151 14,151 14,151 14,151 14,151 14,151 14,151 14,151 14,151 14,151Jun-03 138,623 10,375 14,164 13,986 14,108 14,397 14,273 14,252 14,317 14,277 14,220 14,269 14,197 14,176 14,176 14,260 14,253 14,245 14,240 14,240 14,238 14,238 14,238 14,238 14,238 14,238 14,238 14,238 14,238Dec-03 142,184 10,119 12,962 13,065 13,381 13,262 13,276 13,455 13,485 13,445 13,431 13,431 13,425 13,425 13,441 13,436 13,436 13,435 13,435 13,435 13,435 13,435 13,435 13,435 13,435 13,435 13,435 13,435Jun-04 138,549 12,520 15,333 15,314 15,366 15,471 15,640 15,609 15,507 15,552 15,516 15,536 15,530 15,480 15,491 15,491 15,489 15,489 15,489 15,489 15,484 15,484 15,484 15,484 15,484 15,484 15,484Dec-04 145,566 11,919 15,103 15,326 15,288 15,127 15,161 15,178 15,280 15,251 15,385 15,425 15,452 15,457 15,583 15,593 15,610 15,606 15,606 15,606 15,606 15,606 15,606 15,609 15,619 15,634Jun-05 144,352 13,672 17,468 18,115 18,706 18,868 18,592 17,947 17,932 17,897 17,825 17,766 17,620 17,634 17,609 17,627 17,627 17,627 17,627 17,628 17,628 17,623 17,623 17,623 17,623Dec-05 146,449 14,535 18,253 18,650 18,947 19,137 19,000 19,382 19,395 19,035 19,060 18,996 18,984 18,673 18,680 18,676 18,686 18,699 18,698 18,710 18,709 18,699 18,699 18,699Jun-06 147,591 15,583 20,319 21,596 21,800 21,699 21,557 21,573 21,539 21,685 21,685 21,687 21,664 21,669 21,641 21,668 21,596 21,826 21,826 21,820 21,820 21,888 21,888Dec-06 156,062 16,847 22,778 23,658 24,509 24,539 24,120 23,999 24,039 24,080 24,089 24,168 24,481 24,457 24,469 24,451 23,851 23,875 23,877 23,908 23,908 23,907Jun-07 164,487 16,483 21,823 22,586 24,532 23,917 23,990 24,033 24,511 24,295 24,150 24,136 24,116 24,113 24,097 24,211 24,204 24,088 24,095 24,095 24,095Dec-07 176,457 17,374 23,851 25,463 26,075 26,603 26,559 26,776 27,194 27,111 27,186 27,175 27,159 27,152 27,162 27,162 27,162 27,160 27,113 27,113Jun-08 176,619 15,839 20,623 20,576 21,175 21,875 21,617 21,696 21,629 21,642 21,957 21,961 21,956 21,924 21,885 21,885 21,885 21,834 21,833Dec-08 177,732 16,794 23,142 24,094 24,701 24,680 24,757 24,853 24,920 24,837 24,768 24,749 24,749 24,765 24,765 24,765 24,765 24,762Jun-09 168,131 13,188 16,613 16,933 17,076 17,272 17,080 17,076 17,061 17,075 17,048 17,046 17,246 17,246 17,193 17,193 17,193Dec-09 170,780 14,215 19,479 19,742 19,840 19,881 19,936 19,582 19,579 20,023 19,753 19,742 19,746 19,726 19,726 19,721Jun-10 166,454 14,288 17,659 18,311 18,008 18,018 17,762 17,684 17,639 17,550 17,552 17,551 17,551 17,594 17,593Dec-10 173,705 17,274 24,161 24,733 25,542 25,346 24,841 24,993 24,873 24,873 24,847 24,848 24,848 24,895Jun-11 168,712 18,851 23,633 24,316 24,233 24,239 24,198 23,814 23,365 23,357 23,224 23,200 23,392Dec-11 174,155 18,789 25,246 26,094 25,961 26,435 26,409 26,877 26,835 26,805 26,863 26,553Jun-12 172,213 16,150 20,973 21,374 21,718 21,458 21,597 21,635 21,627 21,588 21,649Dec-12 175,750 17,749 25,676 27,078 28,537 28,481 28,371 28,554 28,577 28,619Jun-13 175,281 22,726 28,532 29,402 29,026 28,686 28,491 28,125 28,488Dec-13 186,158 21,374 32,086 36,014 36,832 35,887 35,916 35,996Jun-14 187,215 21,499 27,064 28,178 29,992 30,648 29,660Dec-14 205,346 24,510 35,292 37,960 38,833 39,284Jun-15 209,003 22,269 30,412 31,879 31,570Dec-15 215,156 20,515 27,978 29,376Jun-16 209,034 16,606 22,619Dec-16 214,602 18,390
Exhibit 2 Page 7
72

Incurred Loss Development Factors
AccidentSemester 6-12 12-18 18-24 24-30 30-36 36-42 42-48 48-54 54-60 60-66 66-72 72-78 78-84 84-90 90-96 96-102 102-108 108-114 114-120 120-126 126-132 132-138 138-144 144-150 150-156 156-162 162-168 168-174 174-180 180-Ultimate
Jun-02 1.203 1.013 0.994 1.004 0.996 1.001 0.996 1.090 0.925 0.999 1.000 1.099 1.000 1.000 1.000 1.000 1.000 1.000 1.000 1.000 1.000 1.000 1.000 1.000 1.000 1.000 1.000 1.000 1.000Dec-02 1.225 1.009 1.049 0.967 1.047 0.995 0.953 0.999 1.000 0.999 0.999 1.000 1.000 0.999 1.000 1.000 1.000 0.999 0.999 1.000 1.000 1.000 1.000 1.000 1.000 1.000 1.000 1.000Jun-03 1.365 0.987 1.009 1.021 0.991 0.999 1.005 0.997 0.996 1.003 0.995 0.999 1.000 1.006 0.999 0.999 1.000 1.000 1.000 1.000 1.000 1.000 1.000 1.000 1.000 1.000 1.000Dec-03 1.281 1.008 1.024 0.991 1.001 1.014 1.002 0.997 0.999 1.000 1.000 1.000 1.001 1.000 1.000 1.000 1.000 1.000 1.000 1.000 1.000 1.000 1.000 1.000 1.000 1.000Jun-04 1.225 0.999 1.003 1.007 1.011 0.998 0.993 1.003 0.998 1.001 1.000 0.997 1.001 1.000 1.000 1.000 1.000 1.000 1.000 1.000 1.000 1.000 1.000 1.000 1.000Dec-04 1.267 1.015 0.998 0.989 1.002 1.001 1.007 0.998 1.009 1.003 1.002 1.000 1.008 1.001 1.001 1.000 1.000 1.000 1.000 1.000 1.000 1.000 1.001 1.001Jun-05 1.278 1.037 1.033 1.009 0.985 0.965 0.999 0.998 0.996 0.997 0.992 1.001 0.999 1.001 1.000 1.000 1.000 1.000 1.000 1.000 1.000 1.000 1.000Dec-05 1.256 1.022 1.016 1.010 0.993 1.020 1.001 0.981 1.001 0.997 0.999 0.984 1.000 1.000 1.001 1.001 1.000 1.001 1.000 0.999 1.000 1.000Jun-06 1.304 1.063 1.009 0.995 0.993 1.001 0.998 1.007 1.000 1.000 0.999 1.000 0.999 1.001 0.997 1.011 1.000 1.000 1.000 1.003 1.000Dec-06 1.352 1.039 1.036 1.001 0.983 0.995 1.002 1.002 1.000 1.003 1.013 0.999 1.001 0.999 0.975 1.001 1.000 1.001 1.000 1.000Jun-07 1.324 1.035 1.086 0.975 1.003 1.002 1.020 0.991 0.994 0.999 0.999 1.000 0.999 1.005 1.000 0.995 1.000 1.000 1.000Dec-07 1.373 1.068 1.024 1.020 0.998 1.008 1.016 0.997 1.003 1.000 0.999 1.000 1.000 1.000 1.000 1.000 0.998 1.000Jun-08 1.302 0.998 1.029 1.033 0.988 1.004 0.997 1.001 1.015 1.000 1.000 0.999 0.998 1.000 1.000 0.998 1.000Dec-08 1.378 1.041 1.025 0.999 1.003 1.004 1.003 0.997 0.997 0.999 1.000 1.001 1.000 1.000 1.000 1.000Jun-09 1.260 1.019 1.008 1.012 0.989 1.000 0.999 1.001 0.998 1.000 1.012 1.000 0.997 1.000 1.000Dec-09 1.370 1.013 1.005 1.002 1.003 0.982 1.000 1.023 0.986 0.999 1.000 0.999 1.000 1.000Jun-10 1.236 1.037 0.983 1.001 0.986 0.996 0.997 0.995 1.000 1.000 1.000 1.002 1.000Dec-10 1.399 1.024 1.033 0.992 0.980 1.006 0.995 1.000 0.999 1.000 1.000 1.002Jun-11 1.254 1.029 0.997 1.000 0.998 0.984 0.981 1.000 0.994 0.999 1.008Dec-11 1.344 1.034 0.995 1.018 0.999 1.018 0.998 0.999 1.002 0.988Jun-12 1.299 1.019 1.016 0.988 1.006 1.002 1.000 0.998 1.003Dec-12 1.447 1.055 1.054 0.998 0.996 1.006 1.001 1.001Jun-13 1.255 1.030 0.987 0.988 0.993 0.987 1.013Dec-13 1.501 1.122 1.023 0.974 1.001 1.002Jun-14 1.259 1.041 1.064 1.022 0.968Dec-14 1.440 1.076 1.023 1.012Jun-15 1.366 1.048 0.990Dec-15 1.364 1.050Jun-16 1.362
Average Incurred Loss Development Factors
6-12 12-18 18-24 24-30 30-36 36-42 42-48 48-54 54-60 60-66 66-72 72-78 78-84 84-90 90-96 96-102 102-108 108-114 114-120 120-126 126-132 132-138 138-144 144-150 150-156 156-162 162-168 168-174 174-180 180-Ultimate
Arithmetic AveragesAll Semesters 1.320 1.033 1.019 1.001 0.997 1.000 0.999 1.003 0.996 0.999 1.001 1.004 1.000 1.001 0.998 1.000 1.000 1.000 1.000 1.000 1.000 1.000 1.000 1.000 1.000 1.000 1.000 1.000 1.00020 Semesters 1.344 1.042 1.020 1.002 0.993 0.999 1.001 0.999 1.000 0.99910 Semesters 1.364 1.050 1.018 0.999 0.993 0.998 0.999 1.001 1.000 0.999 1.003 1.000 0.999 1.001 0.997 1.000 1.000 1.000 1.000 1.0006 Semesters 1.382 1.061 1.024 0.997 0.994 1.000 0.998 0.999 0.997 0.998 1.003 1.000 0.999 1.001 0.996 1.001 1.000 1.000 1.000 1.000 1.000 1.000 1.000 1.0004 Semesters 1.383 1.054 1.025 0.999 0.989 0.999 1.003 1.000 1.000 0.997 1.002 1.001 0.999 1.000 1.000 0.998 1.000 1.000 1.000 1.001 1.000 1.000 1.000 1.000 1.000 1.0002 Semesters 1.363 1.049 1.007 1.017 0.984 0.995 1.007 1.000 1.002 0.994 1.004 1.002 1.000 1.000 1.000 0.999 0.999 1.000 1.000 1.002 1.000 1.000 1.000 1.000 1.000 1.000 1.000 1.000All Semester ex hi/lo 1.318 1.032 1.018 1.001 0.996 1.000 1.000 1.000 0.999 1.000 1.001 1.000 1.000 1.000 1.000 1.000 1.000 1.000 1.000 1.000 1.000 1.000 1.000 1.000 1.000 1.000 1.0006 Semesters ex hi/lo 1.383 1.054 1.022 0.996 0.997 0.999 0.999 0.999 0.999 1.000 1.002 1.000 1.000 1.000 1.000 1.000 1.000 1.000 1.000 1.000 1.000 1.000 1.000 1.000$ Weighted AveragesAll Semesters 1.329 1.039 1.020 1.001 0.995 1.000 1.000 1.002 0.997 0.999 1.001 1.003 1.000 1.001 0.998 1.000 1.000 1.000 1.000 1.000 1.000 1.000 1.000 1.000 1.000 1.000 1.000 1.000 1.00020 Semesters 1.348 1.045 1.021 1.002 0.993 1.000 1.001 0.999 1.000 0.99910 Semesters 1.364 1.053 1.018 0.999 0.993 0.999 0.999 1.001 1.000 0.998 1.003 1.000 1.000 1.001 0.997 1.000 1.000 1.000 1.000 1.0006 Semester 1.384 1.063 1.022 0.997 0.993 1.000 0.998 0.999 0.998 0.997 1.003 1.000 0.999 1.001 0.996 1.001 1.000 1.000 1.000 1.000 1.000 1.000 1.000 1.0004 Semester 1.386 1.055 1.024 0.999 0.990 0.999 1.003 1.000 1.000 0.996 1.002 1.001 0.999 1.000 1.000 0.998 1.000 1.000 1.000 1.001 1.000 1.000 1.000 1.000 1.000 1.0002 Semester 1.363 1.049 1.008 1.016 0.986 0.996 1.007 1.000 1.002 0.993 1.004 1.002 1.000 1.000 1.000 0.999 0.999 1.000 1.000 1.001 1.000 1.000 1.000 1.000 1.000 1.000 1.000 1.000Last 4 Semesters ending in 12 1.438 1.078 1.024Last 4 Semesters ending in 6 1.307 1.036 1.013
SelectedAge To Age 1.438 1.063 1.022 0.997 0.993 1.000 0.998 0.999 0.998 0.997 1.003 1.000 0.999 1.001 0.996 1.001 1.000 1.000 1.000 1.000 1.000 1.000 1.000 1.000 1.000 1.000 1.000 1.000 1.000 1.000Age to Ultimate 1.538 1.069 1.006 0.983 0.986 0.993 0.993 0.994 0.995 0.997 1.000 0.997 0.996 0.997 0.996 1.001 1.000 1.000 1.000 1.000 1.000 1.000 1.000 1.000 1.000 1.000 1.000 1.000 1.000 1.000
Exhibit 2 Page 8
73
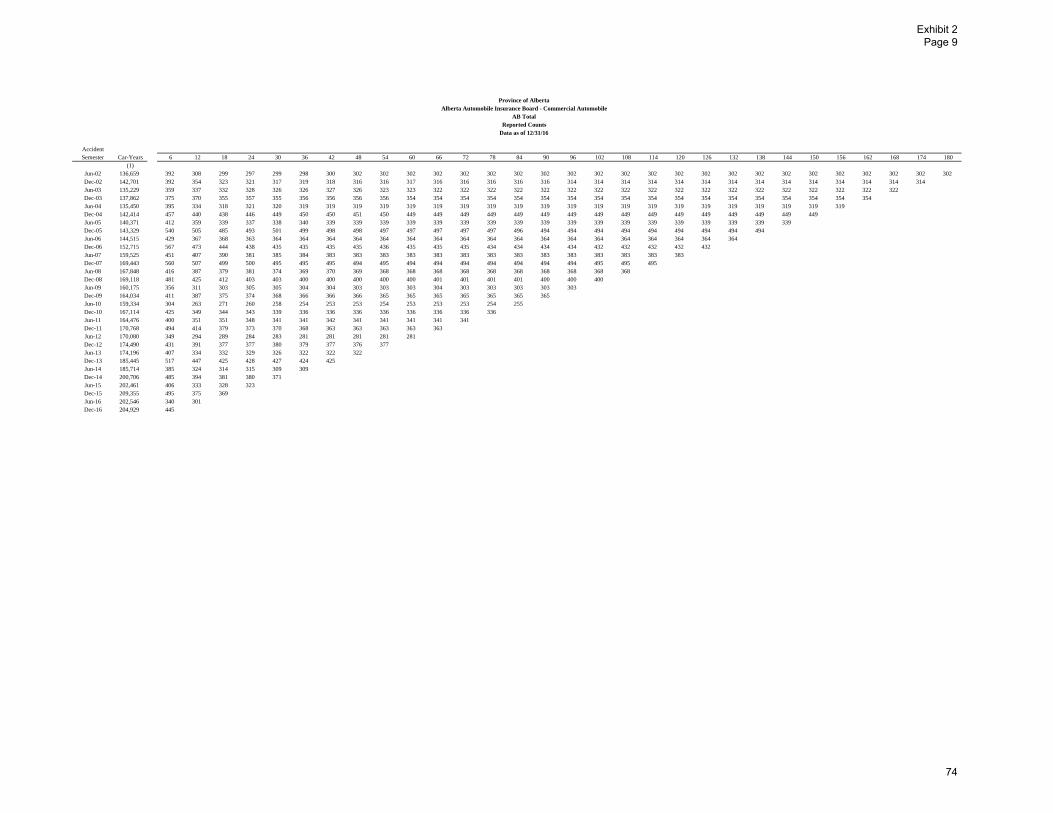
Province of AlbertaAlberta Automobile Insurance Board - Commercial Automobile
AB TotalReported Counts
Data as of 12/31/16
AccidentSemester Car-Years 6 12 18 24 30 36 42 48 54 60 66 72 78 84 90 96 102 108 114 120 126 132 138 144 150 156 162 168 174 180
(1)Jun-02 136,659 392 308 299 297 299 298 300 302 302 302 302 302 302 302 302 302 302 302 302 302 302 302 302 302 302 302 302 302 302 302Dec-02 142,701 392 354 323 321 317 319 318 316 316 317 316 316 316 316 316 314 314 314 314 314 314 314 314 314 314 314 314 314 314Jun-03 135,229 359 337 332 328 326 326 327 326 323 323 322 322 322 322 322 322 322 322 322 322 322 322 322 322 322 322 322 322Dec-03 137,862 375 370 355 357 355 356 356 356 356 354 354 354 354 354 354 354 354 354 354 354 354 354 354 354 354 354 354Jun-04 135,450 395 334 318 321 320 319 319 319 319 319 319 319 319 319 319 319 319 319 319 319 319 319 319 319 319 319Dec-04 142,414 457 440 438 446 449 450 450 451 450 449 449 449 449 449 449 449 449 449 449 449 449 449 449 449 449Jun-05 140,371 412 359 339 337 338 340 339 339 339 339 339 339 339 339 339 339 339 339 339 339 339 339 339 339Dec-05 143,329 540 505 485 493 501 499 498 498 497 497 497 497 497 496 494 494 494 494 494 494 494 494 494Jun-06 144,515 429 367 368 363 364 364 364 364 364 364 364 364 364 364 364 364 364 364 364 364 364 364Dec-06 152,715 567 473 444 438 435 435 435 435 436 435 435 435 434 434 434 434 432 432 432 432 432Jun-07 159,525 451 407 390 381 385 384 383 383 383 383 383 383 383 383 383 383 383 383 383 383Dec-07 169,443 560 507 499 500 495 495 495 494 495 494 494 494 494 494 494 494 495 495 495Jun-08 167,848 416 387 379 381 374 369 370 369 368 368 368 368 368 368 368 368 368 368Dec-08 169,118 481 425 412 403 403 400 400 400 400 400 401 401 401 401 400 400 400Jun-09 160,175 356 311 303 305 305 304 304 303 303 303 304 303 303 303 303 303Dec-09 164,034 411 387 375 374 368 366 366 366 365 365 365 365 365 365 365Jun-10 159,334 304 263 271 260 258 254 253 253 254 253 253 253 254 255Dec-10 167,114 425 349 344 343 339 336 336 336 336 336 336 336 336Jun-11 164,476 400 351 351 348 341 341 342 341 341 341 341 341Dec-11 170,768 494 414 379 373 370 368 363 363 363 363 363Jun-12 170,080 349 294 289 284 283 281 281 281 281 281Dec-12 174,490 431 391 377 377 380 379 377 376 377Jun-13 174,196 407 334 332 329 326 322 322 322Dec-13 185,445 517 447 425 428 427 424 425Jun-14 185,714 385 324 314 315 309 309Dec-14 200,706 485 394 381 380 371Jun-15 202,461 406 333 328 323Dec-15 209,355 495 375 369Jun-16 202,546 340 301Dec-16 204,929 445
Exhibit 2 Page 9
74

Reported Count Development Factors
AccidentSemester 6-12 12-18 18-24 24-30 30-36 36-42 42-48 48-54 54-60 60-66 66-72 72-78 78-84 84-90 90-96 96-102 102-108 108-114 114-120 120-126 126-132 132-138 138-144 144-150 150-156 156-162 162-168 168-174 174-180 80-Ultimat
Jun-02 0.786 0.971 0.993 1.007 0.997 1.007 1.007 1.000 1.000 1.000 1.000 1.000 1.000 1.000 1.000 1.000 1.000 1.000 1.000 1.000 1.000 1.000 1.000 1.000 1.000 1.000 1.000 1.000 1.000Dec-02 0.903 0.912 0.994 0.988 1.006 0.997 0.994 1.000 1.003 0.997 1.000 1.000 1.000 1.000 0.994 1.000 1.000 1.000 1.000 1.000 1.000 1.000 1.000 1.000 1.000 1.000 1.000 1.000Jun-03 0.939 0.985 0.988 0.994 1.000 1.003 0.997 0.991 1.000 0.997 1.000 1.000 1.000 1.000 1.000 1.000 1.000 1.000 1.000 1.000 1.000 1.000 1.000 1.000 1.000 1.000 1.000Dec-03 0.987 0.959 1.006 0.994 1.003 1.000 1.000 1.000 0.994 1.000 1.000 1.000 1.000 1.000 1.000 1.000 1.000 1.000 1.000 1.000 1.000 1.000 1.000 1.000 1.000 1.000Jun-04 0.846 0.952 1.009 0.997 0.997 1.000 1.000 1.000 1.000 1.000 1.000 1.000 1.000 1.000 1.000 1.000 1.000 1.000 1.000 1.000 1.000 1.000 1.000 1.000 1.000Dec-04 0.963 0.995 1.018 1.007 1.002 1.000 1.002 0.998 0.998 1.000 1.000 1.000 1.000 1.000 1.000 1.000 1.000 1.000 1.000 1.000 1.000 1.000 1.000 1.000Jun-05 0.871 0.944 0.994 1.003 1.006 0.997 1.000 1.000 1.000 1.000 1.000 1.000 1.000 1.000 1.000 1.000 1.000 1.000 1.000 1.000 1.000 1.000 1.000Dec-05 0.935 0.960 1.016 1.016 0.996 0.998 1.000 0.998 1.000 1.000 1.000 1.000 0.998 0.996 1.000 1.000 1.000 1.000 1.000 1.000 1.000 1.000Jun-06 0.855 1.003 0.986 1.003 1.000 1.000 1.000 1.000 1.000 1.000 1.000 1.000 1.000 1.000 1.000 1.000 1.000 1.000 1.000 1.000 1.000Dec-06 0.834 0.939 0.986 0.993 1.000 1.000 1.000 1.002 0.998 1.000 1.000 0.998 1.000 1.000 1.000 0.995 1.000 1.000 1.000 1.000Jun-07 0.902 0.958 0.977 1.010 0.997 0.997 1.000 1.000 1.000 1.000 1.000 1.000 1.000 1.000 1.000 1.000 1.000 1.000 1.000Dec-07 0.905 0.984 1.002 0.990 1.000 1.000 0.998 1.002 0.998 1.000 1.000 1.000 1.000 1.000 1.000 1.002 1.000 1.000Jun-08 0.930 0.979 1.005 0.982 0.987 1.003 0.997 0.997 1.000 1.000 1.000 1.000 1.000 1.000 1.000 1.000 1.000Dec-08 0.884 0.969 0.978 1.000 0.993 1.000 1.000 1.000 1.000 1.003 1.000 1.000 1.000 0.998 1.000 1.000Jun-09 0.874 0.974 1.007 1.000 0.997 1.000 0.997 1.000 1.000 1.003 0.997 1.000 1.000 1.000 1.000Dec-09 0.942 0.969 0.997 0.984 0.995 1.000 1.000 0.997 1.000 1.000 1.000 1.000 1.000 1.000Jun-10 0.865 1.030 0.959 0.992 0.984 0.996 1.000 1.004 0.996 1.000 1.000 1.004 1.004Dec-10 0.821 0.986 0.997 0.988 0.991 1.000 1.000 1.000 1.000 1.000 1.000 1.000Jun-11 0.878 1.000 0.991 0.980 1.000 1.003 0.997 1.000 1.000 1.000 1.000Dec-11 0.838 0.915 0.984 0.992 0.995 0.986 1.000 1.000 1.000 1.000Jun-12 0.842 0.983 0.983 0.996 0.993 1.000 1.000 1.000 1.000Dec-12 0.907 0.964 1.000 1.008 0.997 0.995 0.997 1.003Jun-13 0.821 0.994 0.991 0.991 0.988 1.000 1.000Dec-13 0.865 0.951 1.007 0.998 0.993 1.002Jun-14 0.842 0.969 1.003 0.981 1.000Dec-14 0.812 0.967 0.997 0.976Jun-15 0.820 0.985 0.985Dec-15 0.758 0.984Jun-16 0.885
Average Incurred Count Development Factors
6-12 12-18 18-24 24-30 30-36 36-42 42-48 48-54 54-60 60-66 66-72 72-78 78-84 84-90 90-96 96-102 102-108 108-114 114-120 120-126 126-132 132-138 138-144 144-150 150-156 156-162 162-168 168-174 174-180 80-Ultimat
Arithmetic AveragesAll Semesters 0.873 0.971 0.995 0.995 0.997 0.999 0.999 1.000 0.999 1.000 1.000 1.000 1.000 1.000 1.000 1.000 1.000 1.000 1.000 1.000 1.000 1.000 1.000 1.000 1.000 1.000 1.000 1.000 1.00020 Semesters 0.861 0.975 0.993 0.994 0.996 0.999 0.999 1.000 0.999 1.00010 Semesters 0.839 0.971 0.994 0.990 0.994 0.998 0.999 1.000 0.999 1.001 1.000 1.000 1.000 0.999 1.000 1.000 1.000 1.000 1.000 1.0006 Semesters 0.830 0.975 0.997 0.992 0.994 0.998 0.999 1.001 0.999 1.001 0.999 1.001 1.001 1.000 1.000 1.000 1.000 1.000 1.000 1.000 1.000 1.000 1.000 1.0004 Semesters 0.819 0.976 0.998 0.986 0.995 0.999 0.999 1.001 1.000 1.000 1.000 1.001 1.001 0.999 1.000 1.001 1.000 1.000 1.000 1.000 1.000 1.000 1.000 1.000 1.000 1.0002 Semesters 0.821 0.984 0.991 0.979 0.996 1.001 0.999 1.001 1.000 1.000 1.000 1.002 1.002 1.000 1.000 1.000 1.000 1.000 1.000 1.000 1.000 1.000 1.000 1.000 1.000 1.000 1.000 1.000All Semester ex hi/lo 0.873 0.971 0.995 0.995 0.997 1.000 0.999 1.000 0.999 1.000 1.000 1.000 1.000 1.000 1.000 1.000 1.000 1.000 1.000 1.000 1.000 1.000 1.000 1.000 1.000 1.000 1.0006 Semesters ex hi/lo 0.835 0.976 0.998 0.991 0.994 0.999 0.999 1.001 1.000 1.000 1.000 1.000 1.000 1.000 1.000 1.000 1.000 1.000 1.000 1.000 1.000 1.000 1.000 1.000$ Weighted AveragesAll Semesters 0.872 0.970 0.995 0.995 0.997 0.999 0.999 1.000 0.999 1.000 1.000 1.000 1.000 1.000 1.000 1.000 1.000 1.000 1.000 1.000 1.000 1.000 1.000 1.000 1.000 1.000 1.000 1.000 1.00020 Semesters 0.860 0.973 0.994 0.995 0.996 0.999 0.999 1.000 0.999 1.00010 Semesters 0.837 0.969 0.994 0.990 0.994 0.998 0.999 1.000 0.999 1.001 1.000 1.000 1.000 0.999 1.000 1.000 1.000 1.000 1.000 1.0006 Semester 0.827 0.974 0.998 0.992 0.994 0.998 0.999 1.001 0.999 1.001 1.000 1.000 1.000 1.000 1.000 1.000 1.000 1.000 1.000 1.000 1.000 1.000 1.000 1.0004 Semester 0.813 0.976 0.999 0.987 0.994 0.999 0.999 1.001 1.000 1.000 1.000 1.001 1.001 0.999 1.000 1.001 1.000 1.000 1.000 1.000 1.000 1.000 1.000 1.000 1.000 1.0002 Semester 0.810 0.984 0.992 0.978 0.996 1.001 0.999 1.002 1.000 1.000 1.000 1.002 1.002 1.000 1.000 1.000 1.000 1.000 1.000 1.000 1.000 1.000 1.000 1.000 1.000 1.000 1.000 1.000Last 4 Semesters ending in 12 0.834 0.966 0.997Last 4 Semesters ending in 6 0.840 0.983 0.990
SelectedAge To Age 0.837 0.969 0.994 0.990 0.994 0.998 0.999 1.000 0.999 1.001 1.000 1.000 1.000 0.999 1.000 1.000 1.000 1.000 1.000 1.000 1.000 1.000 1.000 1.000 1.000 1.000 1.000 1.000 1.000 1.000Age to Ultimate 0.791 0.945 0.975 0.980 0.990 0.996 0.998 0.999 0.999 0.999 0.999 0.999 0.999 0.999 1.000 1.000 1.000 1.000 1.000 1.000 1.000 1.000 1.000 1.000 1.000 1.000 1.000 1.000 1.000 1.000
Exhibit 2 Page 10
75
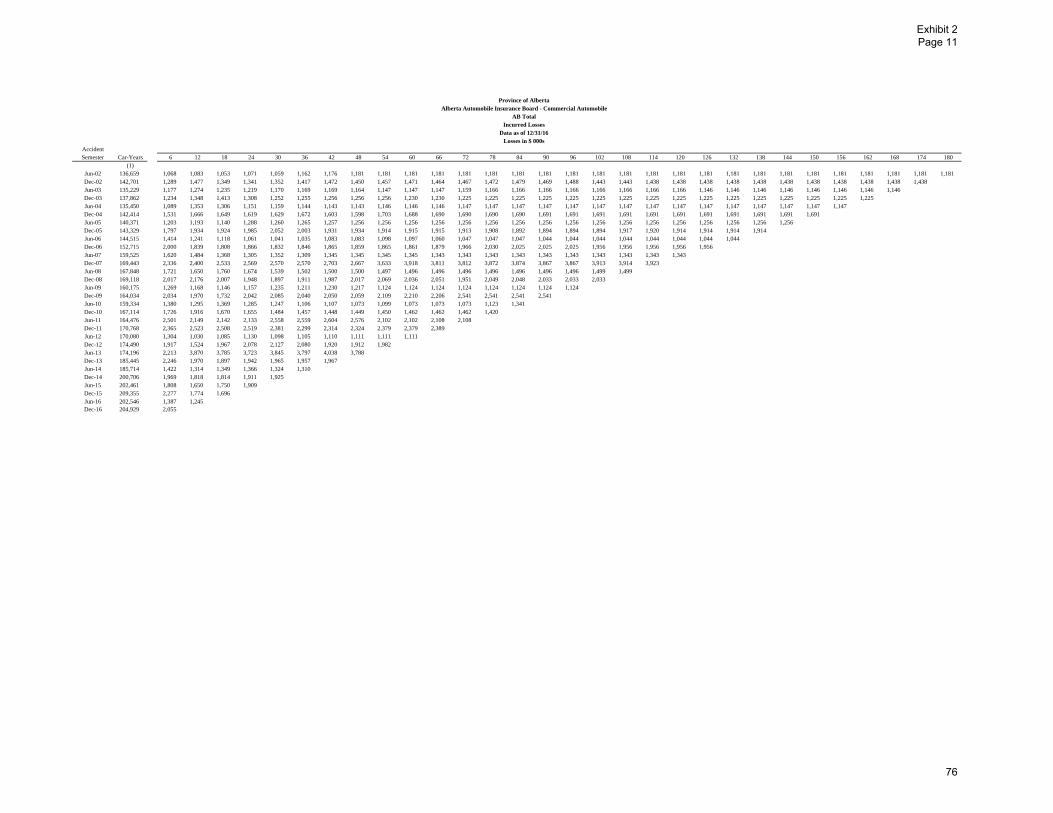
Province of AlbertaAlberta Automobile Insurance Board - Commercial Automobile
AB TotalIncurred Losses
Data as of 12/31/16Losses in $ 000s
AccidentSemester Car-Years 6 12 18 24 30 36 42 48 54 60 66 72 78 84 90 96 102 108 114 120 126 132 138 144 150 156 162 168 174 180
(1)Jun-02 136,659 1,068 1,083 1,053 1,071 1,059 1,162 1,176 1,181 1,181 1,181 1,181 1,181 1,181 1,181 1,181 1,181 1,181 1,181 1,181 1,181 1,181 1,181 1,181 1,181 1,181 1,181 1,181 1,181 1,181 1,181Dec-02 142,701 1,289 1,477 1,349 1,341 1,352 1,417 1,472 1,450 1,457 1,471 1,464 1,467 1,472 1,479 1,469 1,488 1,443 1,443 1,438 1,438 1,438 1,438 1,438 1,438 1,438 1,438 1,438 1,438 1,438Jun-03 135,229 1,177 1,274 1,235 1,219 1,170 1,169 1,169 1,164 1,147 1,147 1,147 1,159 1,166 1,166 1,166 1,166 1,166 1,166 1,166 1,166 1,146 1,146 1,146 1,146 1,146 1,146 1,146 1,146Dec-03 137,862 1,234 1,348 1,413 1,308 1,252 1,255 1,256 1,256 1,256 1,230 1,230 1,225 1,225 1,225 1,225 1,225 1,225 1,225 1,225 1,225 1,225 1,225 1,225 1,225 1,225 1,225 1,225Jun-04 135,450 1,089 1,353 1,306 1,151 1,159 1,144 1,143 1,143 1,146 1,146 1,146 1,147 1,147 1,147 1,147 1,147 1,147 1,147 1,147 1,147 1,147 1,147 1,147 1,147 1,147 1,147Dec-04 142,414 1,531 1,666 1,649 1,619 1,629 1,672 1,603 1,598 1,703 1,688 1,690 1,690 1,690 1,690 1,691 1,691 1,691 1,691 1,691 1,691 1,691 1,691 1,691 1,691 1,691Jun-05 140,371 1,203 1,193 1,140 1,288 1,260 1,265 1,257 1,256 1,256 1,256 1,256 1,256 1,256 1,256 1,256 1,256 1,256 1,256 1,256 1,256 1,256 1,256 1,256 1,256Dec-05 143,329 1,797 1,934 1,924 1,985 2,052 2,003 1,931 1,934 1,914 1,915 1,915 1,913 1,908 1,892 1,894 1,894 1,894 1,917 1,920 1,914 1,914 1,914 1,914Jun-06 144,515 1,414 1,241 1,118 1,061 1,041 1,035 1,083 1,083 1,098 1,097 1,060 1,047 1,047 1,047 1,044 1,044 1,044 1,044 1,044 1,044 1,044 1,044Dec-06 152,715 2,000 1,839 1,808 1,866 1,832 1,846 1,865 1,859 1,865 1,861 1,879 1,966 2,030 2,025 2,025 2,025 1,956 1,956 1,956 1,956 1,956Jun-07 159,525 1,620 1,484 1,368 1,305 1,352 1,309 1,345 1,345 1,345 1,345 1,343 1,343 1,343 1,343 1,343 1,343 1,343 1,343 1,343 1,343Dec-07 169,443 2,336 2,400 2,533 2,569 2,570 2,570 2,703 2,667 3,633 3,918 3,811 3,812 3,872 3,874 3,867 3,867 3,913 3,914 3,923Jun-08 167,848 1,721 1,650 1,760 1,674 1,539 1,502 1,500 1,500 1,497 1,496 1,496 1,496 1,496 1,496 1,496 1,496 1,499 1,499Dec-08 169,118 2,017 2,176 2,007 1,948 1,897 1,911 1,987 2,017 2,069 2,036 2,051 1,951 2,049 2,048 2,033 2,033 2,033Jun-09 160,175 1,269 1,168 1,146 1,157 1,235 1,211 1,230 1,217 1,124 1,124 1,124 1,124 1,124 1,124 1,124 1,124Dec-09 164,034 2,034 1,970 1,732 2,042 2,085 2,040 2,050 2,059 2,109 2,210 2,206 2,541 2,541 2,541 2,541Jun-10 159,334 1,380 1,295 1,369 1,285 1,247 1,106 1,107 1,073 1,099 1,073 1,073 1,073 1,123 1,341Dec-10 167,114 1,726 1,916 1,670 1,655 1,484 1,457 1,448 1,449 1,450 1,462 1,462 1,462 1,420Jun-11 164,476 2,501 2,149 2,142 2,133 2,558 2,559 2,604 2,576 2,102 2,102 2,108 2,108Dec-11 170,768 2,365 2,523 2,508 2,519 2,381 2,299 2,314 2,324 2,379 2,379 2,389Jun-12 170,080 1,304 1,030 1,085 1,130 1,098 1,105 1,110 1,111 1,111 1,111Dec-12 174,490 1,917 1,524 1,967 2,078 2,127 2,080 1,920 1,912 1,982Jun-13 174,196 2,213 3,870 3,785 3,723 3,845 3,797 4,038 3,788Dec-13 185,445 2,246 1,970 1,897 1,942 1,965 1,957 1,967Jun-14 185,714 1,422 1,314 1,349 1,366 1,324 1,310Dec-14 200,706 1,969 1,818 1,814 1,911 1,925Jun-15 202,461 1,808 1,650 1,750 1,909Dec-15 209,355 2,277 1,774 1,696Jun-16 202,546 1,387 1,245Dec-16 204,929 2,055
Exhibit 2 Page 11
76

Incurred Loss Development Factors
AccidentSemester 6-12 12-18 18-24 24-30 30-36 36-42 42-48 48-54 54-60 60-66 66-72 72-78 78-84 84-90 90-96 96-102 102-108 108-114 114-120 120-126 126-132 132-138 138-144 144-150 150-156 156-162 162-168 168-174 174-180 80-Ultimat
Jun-02 1.015 0.972 1.017 0.989 1.097 1.012 1.004 1.000 1.000 1.000 1.000 1.000 1.000 1.000 1.000 1.000 1.000 1.000 1.000 1.000 1.000 1.000 1.000 1.000 1.000 1.000 1.000 1.000 1.000Dec-02 1.146 0.914 0.993 1.008 1.048 1.039 0.985 1.005 1.010 0.995 1.002 1.003 1.005 0.993 1.013 0.970 1.000 0.997 1.000 1.000 1.000 1.000 1.000 1.000 1.000 1.000 1.000 1.000Jun-03 1.082 0.970 0.986 0.960 0.999 1.000 0.996 0.986 1.000 1.000 1.010 1.006 1.000 1.000 1.000 1.000 1.000 1.000 1.000 0.983 1.000 1.000 1.000 1.000 1.000 1.000 1.000Dec-03 1.092 1.049 0.926 0.957 1.002 1.001 1.000 1.000 0.980 1.000 0.996 1.000 1.000 1.000 1.000 1.000 1.000 1.000 1.000 1.000 1.000 1.000 1.000 1.000 1.000 1.000Jun-04 1.243 0.965 0.881 1.007 0.987 0.999 1.000 1.003 1.000 1.000 1.000 1.000 1.000 1.000 1.000 1.000 1.000 1.000 1.000 1.000 1.000 1.000 1.000 1.000 1.000Dec-04 1.089 0.990 0.982 1.006 1.027 0.959 0.997 1.066 0.991 1.001 1.000 1.000 1.000 1.001 1.000 1.000 1.000 1.000 1.000 1.000 1.000 1.000 1.000 1.000Jun-05 0.992 0.955 1.130 0.979 1.003 0.994 0.999 1.000 1.000 1.000 1.000 1.000 1.000 1.000 1.000 1.000 1.000 1.000 1.000 1.000 1.000 1.000 1.000Dec-05 1.076 0.995 1.032 1.033 0.976 0.964 1.002 0.990 1.001 1.000 0.999 0.998 0.992 1.001 1.000 1.000 1.012 1.002 0.997 1.000 1.000 1.000Jun-06 0.878 0.901 0.949 0.981 0.994 1.047 1.000 1.014 0.999 0.967 0.988 1.000 1.000 0.997 1.000 1.000 1.000 1.000 1.000 1.000 1.000Dec-06 0.919 0.983 1.032 0.982 1.008 1.010 0.997 1.003 0.998 1.009 1.046 1.033 0.997 1.000 1.000 0.966 1.000 1.000 1.000 1.000Jun-07 0.916 0.922 0.953 1.036 0.968 1.027 1.000 1.000 1.000 0.999 1.000 1.000 1.000 1.000 1.000 1.000 1.000 1.000 1.000Dec-07 1.027 1.055 1.014 1.000 1.000 1.052 0.987 1.362 1.079 0.973 1.000 1.016 1.000 0.998 1.000 1.012 1.000 1.002Jun-08 0.959 1.067 0.951 0.919 0.976 0.999 1.000 0.998 0.999 1.000 1.000 1.000 1.000 1.000 1.000 1.002 1.000Dec-08 1.079 0.922 0.971 0.974 1.008 1.040 1.015 1.026 0.984 1.007 0.952 1.050 1.000 0.993 1.000 1.000Jun-09 0.921 0.981 1.010 1.067 0.980 1.016 0.990 0.924 1.000 1.000 1.000 1.000 1.000 1.000 1.000Dec-09 0.968 0.879 1.179 1.021 0.979 1.005 1.005 1.024 1.048 0.998 1.152 1.000 1.000 1.000Jun-10 0.938 1.057 0.939 0.970 0.887 1.001 0.969 1.024 0.976 1.000 1.000 1.047 1.194Dec-10 1.110 0.871 0.991 0.897 0.982 0.994 1.001 1.001 1.008 1.000 1.000 0.971Jun-11 0.859 0.997 0.996 1.200 1.000 1.018 0.989 0.816 1.000 1.003 1.000Dec-11 1.067 0.994 1.004 0.945 0.965 1.007 1.004 1.024 1.000 1.004Jun-12 0.790 1.054 1.041 0.972 1.006 1.004 1.001 1.000 1.000Dec-12 0.795 1.291 1.057 1.023 0.978 0.923 0.995 1.037Jun-13 1.748 0.978 0.984 1.033 0.988 1.063 0.938Dec-13 0.877 0.963 1.024 1.011 0.996 1.005Jun-14 0.924 1.026 1.013 0.969 0.990Dec-14 0.923 0.998 1.053 1.008Jun-15 0.913 1.061 1.091Dec-15 0.779 0.956Jun-16 0.898
Average Incurred Loss Development Factors
6-12 12-18 18-24 24-30 30-36 36-42 42-48 48-54 54-60 60-66 66-72 72-78 78-84 84-90 90-96 96-102 102-108 108-114 114-120 120-126 126-132 132-138 138-144 144-150 150-156 156-162 162-168 168-174 174-180 80-Ultimat
Arithmetic AveragesAll Semesters 1.001 0.992 1.007 0.998 0.994 1.007 0.995 1.014 1.003 0.998 1.008 1.007 1.011 0.999 1.001 0.996 1.001 1.000 1.000 0.998 1.000 1.000 1.000 1.000 1.000 1.000 1.000 1.000 1.00020 Semesters 0.971 0.998 1.014 1.001 0.986 1.006 0.994 1.015 1.004 0.99810 Semesters 0.971 1.032 1.025 1.003 0.977 1.004 0.991 0.987 1.009 0.998 1.015 1.012 1.018 0.999 1.000 0.998 1.001 1.000 1.000 0.9986 Semesters 0.886 0.997 1.037 1.003 0.987 1.003 0.988 0.984 1.005 1.001 1.017 1.011 1.032 0.998 1.000 0.997 1.002 1.001 0.999 1.000 1.000 1.000 1.000 1.0004 Semesters 0.878 1.010 1.045 1.005 0.988 0.999 0.985 0.969 1.002 1.002 1.038 1.004 1.048 0.998 1.000 1.004 1.000 1.001 0.999 1.000 1.000 1.000 1.000 1.000 1.000 1.0002 Semesters 0.838 1.008 1.072 0.988 0.993 1.034 0.967 1.018 1.000 1.004 1.000 1.009 1.097 1.000 1.000 1.001 1.000 1.001 1.000 1.000 1.000 1.000 1.000 1.000 1.000 1.000 1.000 1.000All Semester ex hi/lo 0.981 0.985 1.006 0.994 0.994 1.009 0.996 1.006 1.001 0.999 1.002 1.006 1.000 0.999 1.000 0.998 1.000 1.000 1.000 1.000 1.000 1.000 1.000 1.000 1.000 1.000 1.0006 Semesters ex hi/lo 0.903 0.991 1.037 1.004 0.988 1.009 0.997 1.012 1.002 1.001 1.000 1.012 1.000 1.000 1.000 1.001 1.000 1.000 1.000 1.000 1.000 1.000 1.000 1.000$ Weighted AveragesAll Semesters 1.000 0.989 1.008 1.002 0.992 1.010 0.991 1.021 1.009 0.997 1.010 1.008 1.007 0.999 1.001 0.997 1.001 1.000 1.000 0.999 1.000 1.000 1.000 1.000 1.000 1.000 1.000 1.000 1.00020 Semesters 0.980 0.993 1.014 1.005 0.987 1.009 0.991 1.023 1.009 0.99710 Semesters 0.990 1.019 1.020 1.011 0.980 1.009 0.986 0.982 1.018 0.996 1.017 1.013 1.011 0.999 1.000 0.999 1.001 1.001 1.000 0.9996 Semester 0.880 0.992 1.029 1.011 0.985 1.011 0.980 0.969 1.008 1.001 1.023 1.011 1.018 0.998 1.000 0.998 1.002 1.001 0.999 1.000 1.000 1.000 1.000 1.0004 Semester 0.872 1.008 1.047 1.013 0.987 1.011 0.974 0.956 1.002 1.002 1.049 1.001 1.032 0.998 1.000 1.006 1.000 1.001 0.999 1.000 1.000 1.000 1.000 1.000 1.000 1.0002 Semester 0.824 1.006 1.072 0.992 0.994 1.044 0.957 1.023 1.000 1.004 1.000 1.003 1.059 1.000 1.000 1.001 1.000 1.002 1.000 1.000 1.000 1.000 1.000 1.000 1.000 1.000 1.000 1.000Last 4 Semesters ending in 12 0.843 1.041 1.032Last 4 Semesters ending in 6 1.183 1.014 1.020
SelectedAge To Age 0.990 1.019 1.020 1.011 0.980 1.009 0.986 0.982 1.018 0.996 1.017 1.013 1.011 0.999 1.000 0.999 1.001 1.001 1.000 0.999 1.000 1.000 1.000 1.000 1.000 1.000 1.000 1.000 1.000 1.000Age to Ultimate 1.049 1.059 1.039 1.019 1.008 1.029 1.020 1.034 1.054 1.035 1.039 1.022 1.009 0.998 0.999 0.999 1.000 0.999 0.998 0.999 1.000 1.000 1.000 1.000 1.000 1.000 1.000 1.000 1.000 1.000
Exhibit 2 Page 12
77

Province of AlbertaAlberta Automobile Insurance Board - Commercial Automobile
CollisionReported Counts
Data as of 12/31/16
AccidentSemester Car-Years 6 12 18 24 30 36 42 48 54 60 66 72 78 84 90 96 102 108 114 120 126 132 138 144 150 156 162 168 174 180
(1)Jun-02 63,286 2,045 1,849 1,796 1,797 1,793 1,789 1,787 1,787 1,787 1,786 1,786 1,786 1,785 1,785 1,785 1,785 1,785 1,785 1,785 1,785 1,785 1,785 1,785 1,785 1,785 1,785 1,785 1,785 1,785 1,785Dec-02 65,765 1,941 1,755 1,715 1,710 1,712 1,712 1,709 1,708 1,708 1,708 1,708 1,707 1,708 1,708 1,708 1,707 1,707 1,706 1,704 1,703 1,703 1,703 1,703 1,703 1,703 1,703 1,703 1,703 1,703Jun-03 64,166 2,019 1,788 1,733 1,728 1,724 1,719 1,716 1,713 1,713 1,712 1,712 1,712 1,712 1,712 1,712 1,712 1,712 1,710 1,710 1,710 1,710 1,710 1,710 1,710 1,710 1,710 1,710 1,710Dec-03 65,683 1,795 1,572 1,524 1,513 1,512 1,511 1,512 1,511 1,511 1,511 1,511 1,511 1,511 1,511 1,511 1,511 1,510 1,510 1,510 1,510 1,509 1,509 1,509 1,509 1,509 1,509 1,509Jun-04 64,280 1,710 1,531 1,502 1,495 1,494 1,492 1,492 1,491 1,491 1,491 1,491 1,491 1,491 1,491 1,491 1,491 1,491 1,491 1,491 1,491 1,491 1,491 1,491 1,491 1,489 1,483Dec-04 66,212 2,004 1,845 1,767 1,755 1,748 1,747 1,745 1,744 1,743 1,743 1,742 1,738 1,733 1,731 1,728 1,726 1,725 1,726 1,725 1,725 1,725 1,725 1,725 1,725 1,725Jun-05 65,604 2,095 1,884 1,816 1,811 1,805 1,804 1,804 1,802 1,803 1,804 1,804 1,804 1,804 1,804 1,804 1,804 1,804 1,804 1,804 1,804 1,804 1,804 1,804 1,804Dec-05 68,684 2,431 2,150 2,069 2,037 2,028 2,020 2,020 2,020 2,020 2,019 2,019 2,019 2,019 2,019 2,019 2,021 2,021 2,021 2,020 2,020 2,020 2,020 2,020Jun-06 70,100 2,527 2,281 2,148 2,122 2,111 2,100 2,098 2,098 2,098 2,097 2,098 2,098 2,098 2,098 2,098 2,098 2,098 2,098 2,098 2,097 2,097 2,097Dec-06 74,814 3,212 2,936 2,702 2,600 2,547 2,538 2,537 2,536 2,534 2,531 2,531 2,531 2,531 2,531 2,531 2,531 2,530 2,530 2,530 2,530 2,530Jun-07 79,056 3,347 2,913 2,666 2,594 2,553 2,534 2,532 2,531 2,531 2,531 2,531 2,529 2,527 2,523 2,523 2,523 2,523 2,523 2,523 2,523Dec-07 84,739 3,327 2,973 2,698 2,587 2,511 2,506 2,501 2,501 2,501 2,502 2,501 2,501 2,501 2,501 2,500 2,500 2,500 2,500 2,500Jun-08 86,340 3,066 2,732 2,453 2,393 2,344 2,339 2,337 2,340 2,340 2,339 2,339 2,338 2,338 2,338 2,338 2,338 2,338 2,338Dec-08 90,091 3,420 2,902 2,596 2,546 2,531 2,533 2,530 2,528 2,529 2,528 2,527 2,527 2,527 2,527 2,527 2,527 2,527Jun-09 87,498 2,787 2,275 2,137 2,117 2,112 2,109 2,109 2,109 2,110 2,109 2,109 2,109 2,109 2,109 2,109 2,109Dec-09 87,050 2,839 2,413 2,290 2,273 2,255 2,250 2,247 2,248 2,247 2,247 2,245 2,244 2,244 2,244 2,244Jun-10 83,790 2,368 2,006 1,950 1,871 1,855 1,850 1,850 1,848 1,847 1,848 1,848 1,848 1,848 1,848Dec-10 85,591 2,949 2,388 2,217 2,180 2,162 2,160 2,160 2,160 2,161 2,160 2,160 2,159 2,159Jun-11 83,472 3,067 2,467 2,374 2,347 2,335 2,332 2,331 2,330 2,327 2,326 2,326 2,325Dec-11 86,408 2,790 2,264 2,138 2,107 2,091 2,087 2,084 2,081 2,076 2,076 2,076Jun-12 86,613 2,512 2,226 2,088 2,044 2,029 2,023 2,025 2,025 2,025 2,025Dec-12 90,576 3,519 2,912 2,665 2,593 2,565 2,554 2,556 2,556 2,558Jun-13 91,136 3,118 2,476 2,283 2,255 2,247 2,248 2,249 2,249Dec-13 95,614 3,922 3,079 2,848 2,809 2,800 2,799 2,800Jun-14 95,952 3,127 2,545 2,377 2,338 2,322 2,321Dec-14 103,905 3,742 2,856 2,647 2,594 2,588Jun-15 105,247 3,111 2,373 2,213 2,189Dec-15 106,958 3,243 2,426 2,283Jun-16 102,290 2,513 2,031Dec-16 102,104 3,105
Exhibit 2 Page 13
78
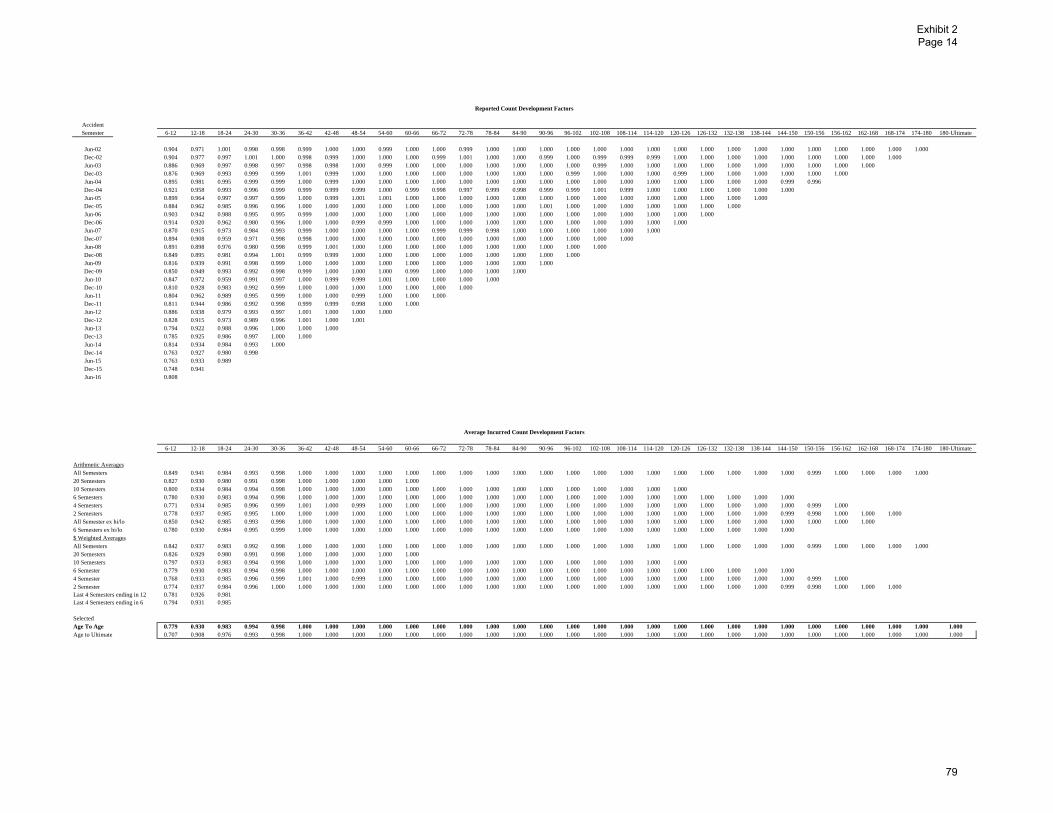
Reported Count Development Factors
AccidentSemester 6-12 12-18 18-24 24-30 30-36 36-42 42-48 48-54 54-60 60-66 66-72 72-78 78-84 84-90 90-96 96-102 102-108 108-114 114-120 120-126 126-132 132-138 138-144 144-150 150-156 156-162 162-168 168-174 174-180 180-Ultimate
Jun-02 0.904 0.971 1.001 0.998 0.998 0.999 1.000 1.000 0.999 1.000 1.000 0.999 1.000 1.000 1.000 1.000 1.000 1.000 1.000 1.000 1.000 1.000 1.000 1.000 1.000 1.000 1.000 1.000 1.000Dec-02 0.904 0.977 0.997 1.001 1.000 0.998 0.999 1.000 1.000 1.000 0.999 1.001 1.000 1.000 0.999 1.000 0.999 0.999 0.999 1.000 1.000 1.000 1.000 1.000 1.000 1.000 1.000 1.000Jun-03 0.886 0.969 0.997 0.998 0.997 0.998 0.998 1.000 0.999 1.000 1.000 1.000 1.000 1.000 1.000 1.000 0.999 1.000 1.000 1.000 1.000 1.000 1.000 1.000 1.000 1.000 1.000Dec-03 0.876 0.969 0.993 0.999 0.999 1.001 0.999 1.000 1.000 1.000 1.000 1.000 1.000 1.000 1.000 0.999 1.000 1.000 1.000 0.999 1.000 1.000 1.000 1.000 1.000 1.000Jun-04 0.895 0.981 0.995 0.999 0.999 1.000 0.999 1.000 1.000 1.000 1.000 1.000 1.000 1.000 1.000 1.000 1.000 1.000 1.000 1.000 1.000 1.000 1.000 0.999 0.996Dec-04 0.921 0.958 0.993 0.996 0.999 0.999 0.999 0.999 1.000 0.999 0.998 0.997 0.999 0.998 0.999 0.999 1.001 0.999 1.000 1.000 1.000 1.000 1.000 1.000Jun-05 0.899 0.964 0.997 0.997 0.999 1.000 0.999 1.001 1.001 1.000 1.000 1.000 1.000 1.000 1.000 1.000 1.000 1.000 1.000 1.000 1.000 1.000 1.000Dec-05 0.884 0.962 0.985 0.996 0.996 1.000 1.000 1.000 1.000 1.000 1.000 1.000 1.000 1.000 1.001 1.000 1.000 1.000 1.000 1.000 1.000 1.000Jun-06 0.903 0.942 0.988 0.995 0.995 0.999 1.000 1.000 1.000 1.000 1.000 1.000 1.000 1.000 1.000 1.000 1.000 1.000 1.000 1.000 1.000Dec-06 0.914 0.920 0.962 0.980 0.996 1.000 1.000 0.999 0.999 1.000 1.000 1.000 1.000 1.000 1.000 1.000 1.000 1.000 1.000 1.000Jun-07 0.870 0.915 0.973 0.984 0.993 0.999 1.000 1.000 1.000 1.000 0.999 0.999 0.998 1.000 1.000 1.000 1.000 1.000 1.000Dec-07 0.894 0.908 0.959 0.971 0.998 0.998 1.000 1.000 1.000 1.000 1.000 1.000 1.000 1.000 1.000 1.000 1.000 1.000Jun-08 0.891 0.898 0.976 0.980 0.998 0.999 1.001 1.000 1.000 1.000 1.000 1.000 1.000 1.000 1.000 1.000 1.000Dec-08 0.849 0.895 0.981 0.994 1.001 0.999 0.999 1.000 1.000 1.000 1.000 1.000 1.000 1.000 1.000 1.000Jun-09 0.816 0.939 0.991 0.998 0.999 1.000 1.000 1.000 1.000 1.000 1.000 1.000 1.000 1.000 1.000Dec-09 0.850 0.949 0.993 0.992 0.998 0.999 1.000 1.000 1.000 0.999 1.000 1.000 1.000 1.000Jun-10 0.847 0.972 0.959 0.991 0.997 1.000 0.999 0.999 1.001 1.000 1.000 1.000 1.000Dec-10 0.810 0.928 0.983 0.992 0.999 1.000 1.000 1.000 1.000 1.000 1.000 1.000Jun-11 0.804 0.962 0.989 0.995 0.999 1.000 1.000 0.999 1.000 1.000 1.000Dec-11 0.811 0.944 0.986 0.992 0.998 0.999 0.999 0.998 1.000 1.000Jun-12 0.886 0.938 0.979 0.993 0.997 1.001 1.000 1.000 1.000Dec-12 0.828 0.915 0.973 0.989 0.996 1.001 1.000 1.001Jun-13 0.794 0.922 0.988 0.996 1.000 1.000 1.000Dec-13 0.785 0.925 0.986 0.997 1.000 1.000Jun-14 0.814 0.934 0.984 0.993 1.000Dec-14 0.763 0.927 0.980 0.998Jun-15 0.763 0.933 0.989Dec-15 0.748 0.941Jun-16 0.808
Average Incurred Count Development Factors
6-12 12-18 18-24 24-30 30-36 36-42 42-48 48-54 54-60 60-66 66-72 72-78 78-84 84-90 90-96 96-102 102-108 108-114 114-120 120-126 126-132 132-138 138-144 144-150 150-156 156-162 162-168 168-174 174-180 180-Ultimate
Arithmetic AveragesAll Semesters 0.849 0.941 0.984 0.993 0.998 1.000 1.000 1.000 1.000 1.000 1.000 1.000 1.000 1.000 1.000 1.000 1.000 1.000 1.000 1.000 1.000 1.000 1.000 1.000 0.999 1.000 1.000 1.000 1.00020 Semesters 0.827 0.930 0.980 0.991 0.998 1.000 1.000 1.000 1.000 1.00010 Semesters 0.800 0.934 0.984 0.994 0.998 1.000 1.000 1.000 1.000 1.000 1.000 1.000 1.000 1.000 1.000 1.000 1.000 1.000 1.000 1.0006 Semesters 0.780 0.930 0.983 0.994 0.998 1.000 1.000 1.000 1.000 1.000 1.000 1.000 1.000 1.000 1.000 1.000 1.000 1.000 1.000 1.000 1.000 1.000 1.000 1.0004 Semesters 0.771 0.934 0.985 0.996 0.999 1.001 1.000 0.999 1.000 1.000 1.000 1.000 1.000 1.000 1.000 1.000 1.000 1.000 1.000 1.000 1.000 1.000 1.000 1.000 0.999 1.0002 Semesters 0.778 0.937 0.985 0.995 1.000 1.000 1.000 1.000 1.000 1.000 1.000 1.000 1.000 1.000 1.000 1.000 1.000 1.000 1.000 1.000 1.000 1.000 1.000 0.999 0.998 1.000 1.000 1.000All Semester ex hi/lo 0.850 0.942 0.985 0.993 0.998 1.000 1.000 1.000 1.000 1.000 1.000 1.000 1.000 1.000 1.000 1.000 1.000 1.000 1.000 1.000 1.000 1.000 1.000 1.000 1.000 1.000 1.0006 Semesters ex hi/lo 0.780 0.930 0.984 0.995 0.999 1.000 1.000 1.000 1.000 1.000 1.000 1.000 1.000 1.000 1.000 1.000 1.000 1.000 1.000 1.000 1.000 1.000 1.000 1.000$ Weighted AveragesAll Semesters 0.842 0.937 0.983 0.992 0.998 1.000 1.000 1.000 1.000 1.000 1.000 1.000 1.000 1.000 1.000 1.000 1.000 1.000 1.000 1.000 1.000 1.000 1.000 1.000 0.999 1.000 1.000 1.000 1.00020 Semesters 0.826 0.929 0.980 0.991 0.998 1.000 1.000 1.000 1.000 1.00010 Semesters 0.797 0.933 0.983 0.994 0.998 1.000 1.000 1.000 1.000 1.000 1.000 1.000 1.000 1.000 1.000 1.000 1.000 1.000 1.000 1.0006 Semester 0.779 0.930 0.983 0.994 0.998 1.000 1.000 1.000 1.000 1.000 1.000 1.000 1.000 1.000 1.000 1.000 1.000 1.000 1.000 1.000 1.000 1.000 1.000 1.0004 Semester 0.768 0.933 0.985 0.996 0.999 1.001 1.000 0.999 1.000 1.000 1.000 1.000 1.000 1.000 1.000 1.000 1.000 1.000 1.000 1.000 1.000 1.000 1.000 1.000 0.999 1.0002 Semester 0.774 0.937 0.984 0.996 1.000 1.000 1.000 1.000 1.000 1.000 1.000 1.000 1.000 1.000 1.000 1.000 1.000 1.000 1.000 1.000 1.000 1.000 1.000 0.999 0.998 1.000 1.000 1.000Last 4 Semesters ending in 12 0.781 0.926 0.981Last 4 Semesters ending in 6 0.794 0.931 0.985
SelectedAge To Age 0.779 0.930 0.983 0.994 0.998 1.000 1.000 1.000 1.000 1.000 1.000 1.000 1.000 1.000 1.000 1.000 1.000 1.000 1.000 1.000 1.000 1.000 1.000 1.000 1.000 1.000 1.000 1.000 1.000 1.000Age to Ultimate 0.707 0.908 0.976 0.993 0.998 1.000 1.000 1.000 1.000 1.000 1.000 1.000 1.000 1.000 1.000 1.000 1.000 1.000 1.000 1.000 1.000 1.000 1.000 1.000 1.000 1.000 1.000 1.000 1.000 1.000
Exhibit 2 Page 14
79

Province of AlbertaAlberta Automobile Insurance Board - Commercial Automobile
CollisionIncurred Losses
Data as of 12/31/16Losses in $ 000s
AccidentSemester Car-Years 6 12 18 24 30 36 42 48 54 60 66 72 78 84 90 96 102 108 114 120 126 132 138 144 150 156 162 168 174 180
(1)Jun-02 63,286 12,229 10,803 10,307 10,235 10,139 10,159 10,130 10,130 10,100 10,089 10,084 10,083 10,080 10,080 10,080 10,080 10,080 10,080 10,080 10,080 10,081 10,081 10,081 10,084 10,083 10,083 10,083 10,083 10,083 10,083Dec-02 65,765 12,293 11,895 11,466 11,382 11,294 11,232 11,227 11,218 11,212 11,210 11,207 11,211 11,210 11,210 11,199 11,193 11,193 11,182 11,174 11,172 11,172 11,171 11,165 11,165 11,165 11,165 11,165 11,165 11,165Jun-03 64,166 13,377 12,464 11,955 11,866 11,836 11,805 11,789 11,790 11,780 11,781 11,731 11,736 11,739 11,748 11,759 11,759 11,759 11,746 11,746 11,747 11,747 11,746 11,746 11,746 11,746 11,746 11,746 11,746Dec-03 65,683 12,618 11,909 11,681 11,383 11,335 11,373 11,364 11,357 11,357 11,350 11,350 11,347 11,347 11,347 11,345 11,345 11,342 11,342 11,342 11,342 11,338 11,338 11,338 11,338 11,338 11,338 11,338Jun-04 64,280 11,057 10,341 9,927 9,740 9,523 9,515 9,513 9,514 9,513 9,513 9,512 9,510 9,509 9,509 9,510 9,502 9,500 9,497 9,497 9,496 9,496 9,496 9,495 9,492 9,492 9,491Dec-04 66,212 13,880 13,725 12,850 12,725 12,724 12,659 12,612 12,607 12,625 12,628 12,634 12,635 12,633 12,636 12,634 12,634 12,630 12,596 12,596 12,595 12,595 12,595 12,595 12,595 12,595Jun-05 65,604 14,997 14,565 13,812 13,675 13,532 13,512 13,524 13,528 13,535 13,524 13,512 13,511 13,498 13,497 13,479 13,476 13,477 13,475 13,471 13,469 13,468 13,467 13,467 13,467Dec-05 68,684 17,518 18,510 17,791 17,500 17,402 17,359 17,351 17,353 17,328 17,322 17,313 17,337 17,214 17,210 17,207 17,225 17,222 17,220 17,213 17,210 17,208 17,207 17,203Jun-06 70,100 19,717 19,728 18,404 17,837 17,699 17,630 17,554 17,521 17,518 17,510 17,520 17,519 17,519 17,510 17,506 17,505 17,503 17,501 17,501 17,489 17,489 17,489Dec-06 74,814 22,981 24,265 22,651 21,620 21,232 21,145 21,103 21,078 21,077 20,940 20,938 20,942 20,942 20,936 20,936 20,936 20,931 20,930 20,930 20,930 20,930Jun-07 79,056 23,760 23,805 22,232 21,412 20,733 20,630 20,559 20,557 20,555 20,305 20,287 20,268 20,191 20,188 20,174 20,174 20,174 20,174 20,174 20,174Dec-07 84,739 25,084 27,858 26,039 25,186 24,086 24,016 24,046 24,002 23,943 23,938 23,901 23,901 23,881 23,875 23,858 23,857 23,854 23,852 23,851Jun-08 86,340 23,169 22,840 20,879 20,046 19,592 19,524 19,532 19,473 19,459 19,386 19,379 19,372 19,377 19,366 19,365 19,366 19,364 19,360Dec-08 90,091 27,306 26,894 24,373 23,736 23,258 23,238 23,145 23,150 23,148 23,140 23,136 23,143 23,128 23,128 23,127 23,114 23,114Jun-09 87,498 21,203 18,668 17,199 17,010 16,813 16,780 16,791 16,775 16,776 16,756 16,697 16,698 16,696 16,696 16,696 16,695Dec-09 87,050 22,576 19,837 18,719 18,349 18,314 18,250 18,264 18,239 18,185 18,175 18,163 18,163 18,185 18,182 18,176Jun-10 83,790 18,630 16,128 15,033 14,784 14,573 14,540 14,547 14,518 14,527 14,541 14,538 14,533 14,529 14,526Dec-10 85,591 23,081 20,657 18,612 17,999 17,713 17,661 17,641 17,565 17,552 17,550 17,541 17,539 17,539Jun-11 83,472 24,818 19,971 18,365 18,015 17,807 17,774 17,747 17,722 17,716 17,716 17,714 17,710Dec-11 86,408 25,785 23,052 21,796 21,391 21,173 21,108 21,093 20,997 21,027 21,031 21,039Jun-12 86,613 22,460 20,385 18,666 18,199 17,833 17,779 17,777 17,770 17,759 17,750Dec-12 90,576 29,027 27,364 24,399 23,569 23,172 23,042 22,993 22,902 22,896Jun-13 91,136 27,717 22,949 20,626 20,042 19,768 19,748 19,761 19,739Dec-13 95,614 34,966 31,529 28,483 27,751 27,666 27,664 27,648Jun-14 95,952 29,217 24,986 23,022 22,205 21,926 21,841Dec-14 103,905 35,721 32,729 29,104 27,872 27,480Jun-15 105,247 28,888 23,354 21,209 20,598Dec-15 106,958 34,204 28,538 26,802Jun-16 102,290 24,389 20,257Dec-16 102,104 30,298
Exhibit 2 Page 15
80

Incurred Loss Development Factors
AccidentSemester 6-12 12-18 18-24 24-30 30-36 36-42 42-48 48-54 54-60 60-66 66-72 72-78 78-84 84-90 90-96 96-102 102-108 108-114 114-120 120-126 126-132 132-138 138-144 144-150 150-156 156-162 162-168 168-174 174-180 180-Ultimate
Jun-02 0.883 0.954 0.993 0.991 1.002 0.997 1.000 0.997 0.999 0.999 1.000 1.000 1.000 1.000 1.000 1.000 1.000 1.000 1.000 1.000 1.000 1.000 1.000 1.000 1.000 1.000 1.000 1.000 1.000Dec-02 0.968 0.964 0.993 0.992 0.994 1.000 0.999 1.000 1.000 1.000 1.000 1.000 1.000 0.999 0.999 1.000 0.999 0.999 1.000 1.000 1.000 0.999 1.000 1.000 1.000 1.000 1.000 1.000Jun-03 0.932 0.959 0.993 0.998 0.997 0.999 1.000 0.999 1.000 0.996 1.001 1.000 1.001 1.001 1.000 1.000 0.999 1.000 1.000 1.000 1.000 1.000 1.000 1.000 1.000 1.000 1.000Dec-03 0.944 0.981 0.974 0.996 1.003 0.999 0.999 1.000 0.999 1.000 1.000 1.000 1.000 1.000 1.000 1.000 1.000 1.000 1.000 1.000 1.000 1.000 1.000 1.000 1.000 1.000Jun-04 0.935 0.960 0.981 0.978 0.999 1.000 1.000 1.000 1.000 1.000 1.000 1.000 1.000 1.000 0.999 1.000 1.000 1.000 1.000 1.000 1.000 1.000 1.000 1.000 1.000Dec-04 0.989 0.936 0.990 1.000 0.995 0.996 1.000 1.001 1.000 1.000 1.000 1.000 1.000 1.000 1.000 1.000 0.997 1.000 1.000 1.000 1.000 1.000 1.000 1.000Jun-05 0.971 0.948 0.990 0.990 0.999 1.001 1.000 1.000 0.999 0.999 1.000 0.999 1.000 0.999 1.000 1.000 1.000 1.000 1.000 1.000 1.000 1.000 1.000Dec-05 1.057 0.961 0.984 0.994 0.998 1.000 1.000 0.999 1.000 0.999 1.001 0.993 1.000 1.000 1.001 1.000 1.000 1.000 1.000 1.000 1.000 1.000Jun-06 1.001 0.933 0.969 0.992 0.996 0.996 0.998 1.000 1.000 1.001 1.000 1.000 0.999 1.000 1.000 1.000 1.000 1.000 0.999 1.000 1.000Dec-06 1.056 0.934 0.954 0.982 0.996 0.998 0.999 1.000 0.993 1.000 1.000 1.000 1.000 1.000 1.000 1.000 1.000 1.000 1.000 1.000Jun-07 1.002 0.934 0.963 0.968 0.995 0.997 1.000 1.000 0.988 0.999 0.999 0.996 1.000 0.999 1.000 1.000 1.000 1.000 1.000Dec-07 1.111 0.935 0.967 0.956 0.997 1.001 0.998 0.998 1.000 0.998 1.000 0.999 1.000 0.999 1.000 1.000 1.000 1.000Jun-08 0.986 0.914 0.960 0.977 0.996 1.000 0.997 0.999 0.996 1.000 1.000 1.000 0.999 1.000 1.000 1.000 1.000Dec-08 0.985 0.906 0.974 0.980 0.999 0.996 1.000 1.000 1.000 1.000 1.000 0.999 1.000 1.000 0.999 1.000Jun-09 0.880 0.921 0.989 0.988 0.998 1.001 0.999 1.000 0.999 0.997 1.000 1.000 1.000 1.000 1.000Dec-09 0.879 0.944 0.980 0.998 0.997 1.001 0.999 0.997 0.999 0.999 1.000 1.001 1.000 1.000Jun-10 0.866 0.932 0.983 0.986 0.998 1.000 0.998 1.001 1.001 1.000 1.000 1.000 1.000Dec-10 0.895 0.901 0.967 0.984 0.997 0.999 0.996 0.999 1.000 1.000 1.000 1.000Jun-11 0.805 0.920 0.981 0.988 0.998 0.998 0.999 1.000 1.000 1.000 1.000Dec-11 0.894 0.945 0.981 0.990 0.997 0.999 0.995 1.001 1.000 1.000Jun-12 0.908 0.916 0.975 0.980 0.997 1.000 1.000 0.999 0.999Dec-12 0.943 0.892 0.966 0.983 0.994 0.998 0.996 1.000Jun-13 0.828 0.899 0.972 0.986 0.999 1.001 0.999Dec-13 0.902 0.903 0.974 0.997 1.000 0.999Jun-14 0.855 0.921 0.965 0.987 0.996Dec-14 0.916 0.889 0.958 0.986Jun-15 0.808 0.908 0.971Dec-15 0.834 0.939Jun-16 0.831
Average Incurred Loss Development Factors
6-12 12-18 18-24 24-30 30-36 36-42 42-48 48-54 54-60 60-66 66-72 72-78 78-84 84-90 90-96 96-102 102-108 108-114 114-120 120-126 126-132 132-138 138-144 144-150 150-156 156-162 162-168 168-174 174-180 180-Ultimate
Arithmetic AveragesAll Semesters 0.926 0.930 0.976 0.986 0.998 0.999 0.999 1.000 0.999 0.999 1.000 0.999 1.000 1.000 1.000 1.000 1.000 1.000 1.000 1.000 1.000 1.000 1.000 1.000 1.000 1.000 1.000 1.000 1.00020 Semesters 0.909 0.919 0.972 0.985 0.997 0.999 0.999 1.000 0.999 0.99910 Semesters 0.872 0.913 0.971 0.987 0.997 1.000 0.998 1.000 0.999 0.999 1.000 1.000 1.000 1.000 1.000 1.000 1.000 1.000 1.000 1.0006 Semesters 0.858 0.910 0.968 0.987 0.997 0.999 0.997 1.000 1.000 0.999 1.000 1.000 1.000 1.000 1.000 1.000 1.000 1.000 1.000 1.000 1.000 1.000 1.000 1.0004 Semesters 0.847 0.914 0.967 0.989 0.997 0.999 0.998 1.000 1.000 1.000 1.000 1.000 1.000 1.000 1.000 1.000 1.000 1.000 1.000 1.000 1.000 1.000 1.000 1.000 1.000 1.0002 Semesters 0.832 0.924 0.964 0.987 0.998 1.000 0.997 1.000 1.000 1.000 1.000 1.000 1.000 1.000 1.000 1.000 1.000 1.000 1.000 1.000 1.000 1.000 1.000 1.000 1.000 1.000 1.000 1.000All Semester ex hi/lo 0.924 0.930 0.976 0.987 0.997 0.999 0.999 1.000 0.999 0.999 1.000 1.000 1.000 1.000 1.000 1.000 1.000 1.000 1.000 1.000 1.000 1.000 1.000 1.000 1.000 1.000 1.0006 Semesters ex hi/lo 0.855 0.908 0.968 0.986 0.997 0.999 0.997 1.000 1.000 1.000 1.000 1.000 1.000 1.000 1.000 1.000 1.000 1.000 1.000 1.000 1.000 1.000 1.000 1.000$ Weighted AveragesAll Semesters 0.919 0.925 0.974 0.985 0.997 0.999 0.999 1.000 0.998 0.999 1.000 0.999 1.000 1.000 1.000 1.000 1.000 1.000 1.000 1.000 1.000 1.000 1.000 1.000 1.000 1.000 1.000 1.000 1.00020 Semesters 0.907 0.918 0.971 0.984 0.997 0.999 0.998 1.000 0.998 0.99910 Semesters 0.873 0.912 0.970 0.987 0.997 1.000 0.998 1.000 0.999 0.999 1.000 1.000 1.000 1.000 1.000 1.000 1.000 1.000 1.000 1.0006 Semester 0.861 0.910 0.967 0.987 0.997 0.999 0.997 1.000 1.000 0.999 1.000 1.000 1.000 1.000 1.000 1.000 1.000 1.000 1.000 1.000 1.000 1.000 1.000 1.0004 Semester 0.851 0.914 0.967 0.989 0.997 0.999 0.997 1.000 1.000 1.000 1.000 1.000 1.000 1.000 1.000 1.000 1.000 1.000 1.000 1.000 1.000 1.000 1.000 1.000 1.000 1.0002 Semester 0.833 0.925 0.963 0.987 0.998 1.000 0.997 1.000 1.000 1.000 1.000 1.000 1.000 1.000 1.000 1.000 1.000 1.000 1.000 1.000 1.000 1.000 1.000 1.000 1.000 1.000 1.000 1.000Last 4 Semesters ending in 12 0.897 0.905 0.969Last 4 Semesters ending in 6 0.831 0.911 0.970
SelectedAge To Age 0.897 0.910 0.967 0.987 0.997 0.999 0.997 1.000 1.000 1.000 1.000 1.000 1.000 1.000 1.000 1.000 1.000 1.000 1.000 1.000 1.000 1.000 1.000 1.000 1.000 1.000 1.000 1.000 1.000 1.000Age to Ultimate 0.774 0.863 0.949 0.981 0.994 0.997 0.997 1.000 1.000 1.000 1.000 1.000 1.000 1.000 1.000 1.000 1.000 1.000 1.000 1.000 1.000 1.000 1.000 1.000 1.000 1.000 1.000 1.000 1.000 1.000
Exhibit 2 Page 16
81

Province of AlbertaAlberta Automobile Insurance Board - Commercial Automobile
ComprehensiveReported Counts
Data as of 12/31/16
AccidentSemester Car-Years 6 12 18 24 30 36 42 48 54 60 66 72 78 84 90 96 102 108 114 120 126 132 138 144 150 156 162 168 174 180
(1)Jun-02 84,158 1,249 1,336 1,356 1,351 1,352 1,354 1,354 1,353 1,353 1,353 1,353 1,353 1,353 1,353 1,353 1,353 1,353 1,353 1,353 1,353 1,353 1,353 1,353 1,353 1,353 1,353 1,353 1,353 1,353 1,353Dec-02 87,376 1,673 1,712 1,708 1,709 1,709 1,709 1,709 1,709 1,709 1,709 1,709 1,709 1,709 1,709 1,709 1,709 1,709 1,709 1,709 1,709 1,709 1,709 1,709 1,709 1,709 1,709 1,709 1,709 1,709Jun-03 85,800 1,183 1,198 1,204 1,204 1,204 1,203 1,203 1,203 1,203 1,202 1,202 1,202 1,202 1,202 1,202 1,202 1,202 1,201 1,201 1,201 1,201 1,201 1,201 1,201 1,201 1,201 1,201 1,201Dec-03 87,604 1,941 1,941 1,932 1,929 1,928 1,927 1,927 1,927 1,927 1,927 1,927 1,927 1,927 1,927 1,927 1,927 1,927 1,927 1,927 1,927 1,927 1,927 1,927 1,927 1,927 1,927 1,927Jun-04 87,034 1,267 1,268 1,283 1,285 1,284 1,284 1,284 1,284 1,284 1,284 1,284 1,284 1,284 1,284 1,284 1,284 1,284 1,284 1,284 1,284 1,284 1,284 1,284 1,284 1,284 1,284Dec-04 90,035 2,226 2,254 2,243 2,247 2,246 2,248 2,249 2,248 2,249 2,249 2,247 2,247 2,247 2,247 2,247 2,247 2,247 2,247 2,247 2,247 2,247 2,247 2,247 2,247 2,247Jun-05 89,971 2,040 2,392 2,354 2,349 2,346 2,351 2,351 2,350 2,348 2,348 2,348 2,348 2,348 2,348 2,348 2,348 2,348 2,348 2,348 2,348 2,348 2,348 2,348 2,348Dec-05 93,644 2,503 2,467 2,474 2,470 2,471 2,471 2,470 2,470 2,468 2,468 2,468 2,468 2,468 2,468 2,468 2,468 2,468 2,468 2,468 2,468 2,468 2,468 2,468Jun-06 95,454 1,754 1,812 1,801 1,795 1,798 1,799 1,798 1,798 1,798 1,797 1,797 1,797 1,797 1,797 1,797 1,797 1,797 1,797 1,797 1,797 1,797 1,797Dec-06 100,625 2,757 2,728 2,675 2,666 2,664 2,665 2,666 2,666 2,666 2,666 2,666 2,666 2,665 2,665 2,665 2,665 2,665 2,665 2,665 2,665 2,665Jun-07 106,279 2,114 2,208 2,163 2,160 2,157 2,157 2,158 2,158 2,158 2,158 2,158 2,158 2,158 2,158 2,158 2,158 2,158 2,158 2,158 2,158Dec-07 112,706 3,664 3,642 3,565 3,562 3,562 3,565 3,564 3,564 3,565 3,565 3,565 3,565 3,563 3,563 3,563 3,563 3,563 3,563 3,563Jun-08 114,668 2,067 2,040 1,983 1,979 1,979 1,980 1,980 1,981 1,981 1,980 1,979 1,978 1,978 1,978 1,978 1,978 1,978 1,978Dec-08 118,897 3,327 3,159 3,139 3,135 3,134 3,134 3,134 3,133 3,133 3,133 3,133 3,133 3,133 3,133 3,133 3,133 3,133Jun-09 116,536 1,851 1,825 1,785 1,781 1,783 1,781 1,781 1,781 1,781 1,779 1,779 1,779 1,780 1,780 1,780 1,780Dec-09 116,182 3,623 3,470 3,455 3,455 3,452 3,453 3,453 3,454 3,453 3,453 3,453 3,453 3,453 3,454 3,454Jun-10 113,049 1,788 1,779 1,804 1,760 1,757 1,757 1,756 1,756 1,756 1,756 1,756 1,756 1,756 1,756Dec-10 115,178 3,757 3,597 3,571 3,566 3,565 3,562 3,562 3,562 3,563 3,562 3,562 3,562 3,562Jun-11 113,142 1,747 1,610 1,605 1,596 1,597 1,595 1,594 1,595 1,595 1,595 1,595 1,595Dec-11 115,919 3,151 2,965 2,926 2,923 2,916 2,916 2,915 2,915 2,916 2,916 2,916Jun-12 116,238 1,713 1,762 1,713 1,703 1,705 1,705 1,705 1,705 1,705 1,705Dec-12 120,111 4,108 3,971 3,934 3,942 3,941 3,940 3,941 3,941 3,940Jun-13 120,961 1,978 2,051 2,039 2,031 2,031 2,030 2,031 2,031Dec-13 125,827 3,700 3,514 3,504 3,514 3,512 3,520 3,521Jun-14 126,358 1,739 1,677 1,672 1,671 1,675 1,674Dec-14 134,853 4,752 4,403 4,341 4,378 4,397Jun-15 136,903 2,033 1,972 1,940 1,938Dec-15 139,071 4,095 3,986 4,005Jun-16 135,704 2,346 2,389Dec-16 135,587 4,320
Exhibit 2 Page 17
82

Reported Count Development Factors
AccidentSemester 6-12 12-18 18-24 24-30 30-36 36-42 42-48 48-54 54-60 60-66 66-72 72-78 78-84 84-90 90-96 96-102 102-108 108-114 114-120 120-126 126-132 132-138 138-144 144-150 150-156 156-162 162-168 168-174 174-180 80-Ultimat
Jun-02 1.070 1.015 0.996 1.001 1.001 1.000 0.999 1.000 1.000 1.000 1.000 1.000 1.000 1.000 1.000 1.000 1.000 1.000 1.000 1.000 1.000 1.000 1.000 1.000 1.000 1.000 1.000 1.000 1.000Dec-02 1.023 0.998 1.001 1.000 1.000 1.000 1.000 1.000 1.000 1.000 1.000 1.000 1.000 1.000 1.000 1.000 1.000 1.000 1.000 1.000 1.000 1.000 1.000 1.000 1.000 1.000 1.000 1.000Jun-03 1.013 1.005 1.000 1.000 0.999 1.000 1.000 1.000 0.999 1.000 1.000 1.000 1.000 1.000 1.000 1.000 0.999 1.000 1.000 1.000 1.000 1.000 1.000 1.000 1.000 1.000 1.000Dec-03 1.000 0.995 0.998 0.999 0.999 1.000 1.000 1.000 1.000 1.000 1.000 1.000 1.000 1.000 1.000 1.000 1.000 1.000 1.000 1.000 1.000 1.000 1.000 1.000 1.000 1.000Jun-04 1.001 1.012 1.002 0.999 1.000 1.000 1.000 1.000 1.000 1.000 1.000 1.000 1.000 1.000 1.000 1.000 1.000 1.000 1.000 1.000 1.000 1.000 1.000 1.000 1.000Dec-04 1.013 0.995 1.002 1.000 1.001 1.000 1.000 1.000 1.000 0.999 1.000 1.000 1.000 1.000 1.000 1.000 1.000 1.000 1.000 1.000 1.000 1.000 1.000 1.000Jun-05 1.173 0.984 0.998 0.999 1.002 1.000 1.000 0.999 1.000 1.000 1.000 1.000 1.000 1.000 1.000 1.000 1.000 1.000 1.000 1.000 1.000 1.000 1.000Dec-05 0.986 1.003 0.998 1.000 1.000 1.000 1.000 0.999 1.000 1.000 1.000 1.000 1.000 1.000 1.000 1.000 1.000 1.000 1.000 1.000 1.000 1.000Jun-06 1.033 0.994 0.997 1.002 1.001 0.999 1.000 1.000 0.999 1.000 1.000 1.000 1.000 1.000 1.000 1.000 1.000 1.000 1.000 1.000 1.000Dec-06 0.989 0.981 0.997 0.999 1.000 1.000 1.000 1.000 1.000 1.000 1.000 1.000 1.000 1.000 1.000 1.000 1.000 1.000 1.000 1.000Jun-07 1.044 0.980 0.999 0.999 1.000 1.000 1.000 1.000 1.000 1.000 1.000 1.000 1.000 1.000 1.000 1.000 1.000 1.000 1.000Dec-07 0.994 0.979 0.999 1.000 1.001 1.000 1.000 1.000 1.000 1.000 1.000 0.999 1.000 1.000 1.000 1.000 1.000 1.000Jun-08 0.987 0.972 0.998 1.000 1.001 1.000 1.001 1.000 0.999 0.999 0.999 1.000 1.000 1.000 1.000 1.000 1.000Dec-08 0.950 0.994 0.999 1.000 1.000 1.000 1.000 1.000 1.000 1.000 1.000 1.000 1.000 1.000 1.000 1.000Jun-09 0.986 0.978 0.998 1.001 0.999 1.000 1.000 1.000 0.999 1.000 1.000 1.001 1.000 1.000 1.000Dec-09 0.958 0.996 1.000 0.999 1.000 1.000 1.000 1.000 1.000 1.000 1.000 1.000 1.000 1.000Jun-10 0.995 1.014 0.976 0.998 1.000 0.999 1.000 1.000 1.000 1.000 1.000 1.000 1.000Dec-10 0.957 0.993 0.999 1.000 0.999 1.000 1.000 1.000 1.000 1.000 1.000 1.000Jun-11 0.922 0.997 0.994 1.001 0.999 0.999 1.001 1.000 1.000 1.000 1.000Dec-11 0.941 0.987 0.999 0.998 1.000 1.000 1.000 1.000 1.000 1.000Jun-12 1.029 0.972 0.994 1.001 1.000 1.000 1.000 1.000 1.000Dec-12 0.967 0.991 1.002 1.000 1.000 1.000 1.000 1.000Jun-13 1.037 0.994 0.996 1.000 1.000 1.000 1.000Dec-13 0.950 0.997 1.003 0.999 1.002 1.000Jun-14 0.964 0.997 0.999 1.002 0.999Dec-14 0.927 0.986 1.009 1.004Jun-15 0.970 0.984 0.999Dec-15 0.973 1.005Jun-16 1.018
Average Incurred Count Development Factors
6-12 12-18 18-24 24-30 30-36 36-42 42-48 48-54 54-60 60-66 66-72 72-78 78-84 84-90 90-96 96-102 102-108 108-114 114-120 120-126 126-132 132-138 138-144 144-150 150-156 156-162 162-168 168-174 174-180 80-Ultimat
Arithmetic AveragesAll Semesters 0.995 0.993 0.998 1.000 1.000 1.000 1.000 1.000 1.000 1.000 1.000 1.000 1.000 1.000 1.000 1.000 1.000 1.000 1.000 1.000 1.000 1.000 1.000 1.000 1.000 1.000 1.000 1.000 1.00020 Semesters 0.978 0.989 0.998 1.000 1.000 1.000 1.000 1.000 1.000 1.00010 Semesters 0.978 0.991 0.999 1.000 1.000 1.000 1.000 1.000 1.000 1.000 1.000 1.000 1.000 1.000 1.000 1.000 1.000 1.000 1.000 1.0006 Semesters 0.967 0.994 1.001 1.001 1.000 1.000 1.000 1.000 1.000 1.000 1.000 1.000 1.000 1.000 1.000 1.000 1.000 1.000 1.000 1.000 1.000 1.000 1.000 1.0004 Semesters 0.972 0.993 1.002 1.002 1.000 1.000 1.000 1.000 1.000 1.000 1.000 1.000 1.000 1.000 1.000 1.000 1.000 1.000 1.000 1.000 1.000 1.000 1.000 1.000 1.000 1.0002 Semesters 0.996 0.994 1.004 1.003 1.001 1.000 1.000 1.000 1.000 1.000 1.000 1.000 1.000 1.000 1.000 1.000 1.000 1.000 1.000 1.000 1.000 1.000 1.000 1.000 1.000 1.000 1.000 1.000All Semester ex hi/lo 0.992 0.993 0.999 1.000 1.000 1.000 1.000 1.000 1.000 1.000 1.000 1.000 1.000 1.000 1.000 1.000 1.000 1.000 1.000 1.000 1.000 1.000 1.000 1.000 1.000 1.000 1.0006 Semesters ex hi/lo 0.964 0.994 1.001 1.001 1.000 1.000 1.000 1.000 1.000 1.000 1.000 1.000 1.000 1.000 1.000 1.000 1.000 1.000 1.000 1.000 1.000 1.000 1.000 1.000$ Weighted AveragesAll Semesters 0.986 0.992 0.999 1.000 1.000 1.000 1.000 1.000 1.000 1.000 1.000 1.000 1.000 1.000 1.000 1.000 1.000 1.000 1.000 1.000 1.000 1.000 1.000 1.000 1.000 1.000 1.000 1.000 1.00020 Semesters 0.972 0.990 0.999 1.000 1.000 1.000 1.000 1.000 1.000 1.00010 Semesters 0.969 0.992 1.001 1.000 1.000 1.000 1.000 1.000 1.000 1.000 1.000 1.000 1.000 1.000 1.000 1.000 1.000 1.000 1.000 1.0006 Semester 0.961 0.994 1.003 1.001 1.000 1.000 1.000 1.000 1.000 1.000 1.000 1.000 1.000 1.000 1.000 1.000 1.000 1.000 1.000 1.000 1.000 1.000 1.000 1.0004 Semester 0.964 0.993 1.004 1.002 1.000 1.000 1.000 1.000 1.000 1.000 1.000 1.000 1.000 1.000 1.000 1.000 1.000 1.000 1.000 1.000 1.000 1.000 1.000 1.000 1.000 1.0002 Semester 0.990 0.998 1.006 1.004 1.001 1.000 1.000 1.000 1.000 1.000 1.000 1.000 1.000 1.000 1.000 1.000 1.000 1.000 1.000 1.000 1.000 1.000 1.000 1.000 1.000 1.000 1.000 1.000Last 4 Semesters ending in 12 0.953 0.994 1.004Last 4 Semesters ending in 6 0.999 0.987 0.997
SelectedAge To Age 0.953 0.994 1.003 1.001 1.000 1.000 1.000 1.000 1.000 1.000 1.000 1.000 1.000 1.000 1.000 1.000 1.000 1.000 1.000 1.000 1.000 1.000 1.000 1.000 1.000 1.000 1.000 1.000 1.000 1.000Age to Ultimate 0.951 0.998 1.004 1.001 1.000 1.000 1.000 1.000 1.000 1.000 1.000 1.000 1.000 1.000 1.000 1.000 1.000 1.000 1.000 1.000 1.000 1.000 1.000 1.000 1.000 1.000 1.000 1.000 1.000 1.000
Exhibit 2 Page 18
83
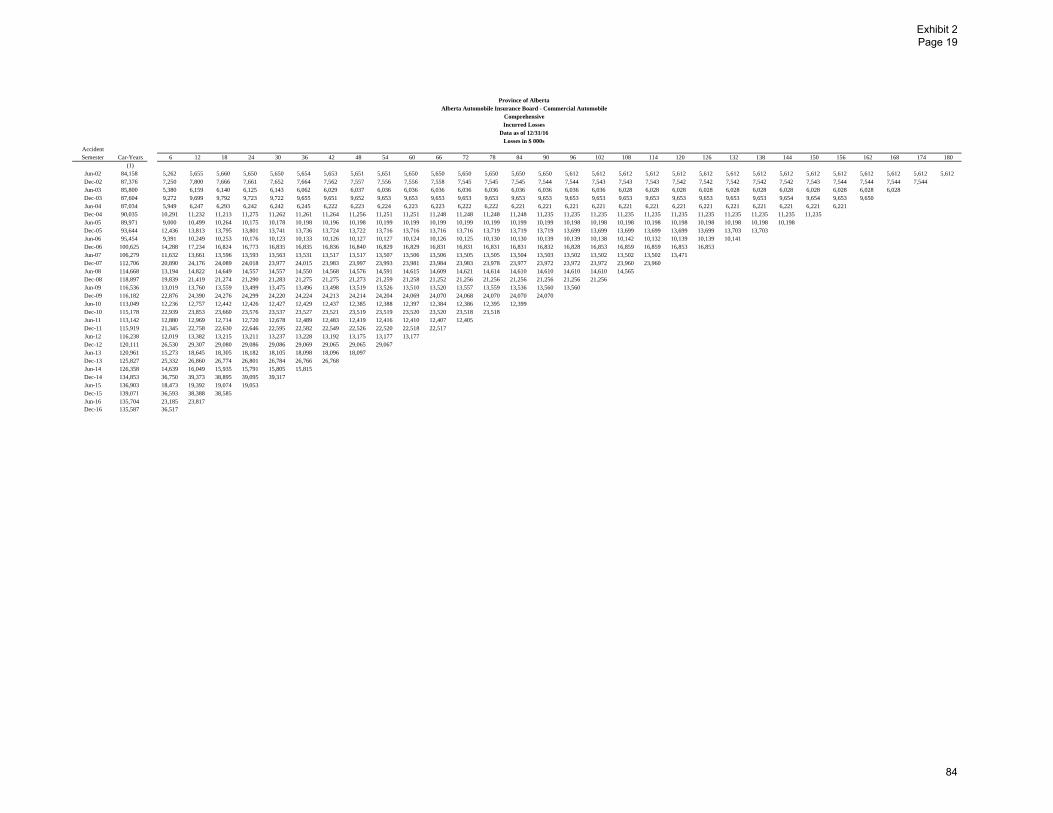
Province of AlbertaAlberta Automobile Insurance Board - Commercial Automobile
ComprehensiveIncurred Losses
Data as of 12/31/16Losses in $ 000s
AccidentSemester Car-Years 6 12 18 24 30 36 42 48 54 60 66 72 78 84 90 96 102 108 114 120 126 132 138 144 150 156 162 168 174 180
(1)Jun-02 84,158 5,262 5,655 5,660 5,650 5,650 5,654 5,653 5,651 5,651 5,650 5,650 5,650 5,650 5,650 5,650 5,612 5,612 5,612 5,612 5,612 5,612 5,612 5,612 5,612 5,612 5,612 5,612 5,612 5,612 5,612Dec-02 87,376 7,250 7,800 7,666 7,661 7,652 7,664 7,562 7,557 7,556 7,556 7,558 7,545 7,545 7,545 7,544 7,544 7,543 7,543 7,543 7,542 7,542 7,542 7,542 7,542 7,543 7,544 7,544 7,544 7,544Jun-03 85,800 5,380 6,159 6,140 6,125 6,143 6,062 6,029 6,037 6,036 6,036 6,036 6,036 6,036 6,036 6,036 6,036 6,036 6,028 6,028 6,028 6,028 6,028 6,028 6,028 6,028 6,028 6,028 6,028Dec-03 87,604 9,272 9,699 9,792 9,723 9,722 9,655 9,651 9,652 9,653 9,653 9,653 9,653 9,653 9,653 9,653 9,653 9,653 9,653 9,653 9,653 9,653 9,653 9,653 9,654 9,654 9,653 9,650Jun-04 87,034 5,949 6,247 6,293 6,242 6,242 6,245 6,222 6,223 6,224 6,223 6,223 6,222 6,222 6,221 6,221 6,221 6,221 6,221 6,221 6,221 6,221 6,221 6,221 6,221 6,221 6,221Dec-04 90,035 10,291 11,232 11,213 11,275 11,262 11,261 11,264 11,256 11,251 11,251 11,248 11,248 11,248 11,248 11,235 11,235 11,235 11,235 11,235 11,235 11,235 11,235 11,235 11,235 11,235Jun-05 89,971 9,000 10,499 10,264 10,175 10,178 10,198 10,196 10,198 10,199 10,199 10,199 10,199 10,199 10,199 10,199 10,198 10,198 10,198 10,198 10,198 10,198 10,198 10,198 10,198Dec-05 93,644 12,436 13,813 13,795 13,801 13,741 13,736 13,724 13,722 13,716 13,716 13,716 13,716 13,719 13,719 13,719 13,699 13,699 13,699 13,699 13,699 13,699 13,703 13,703Jun-06 95,454 9,391 10,249 10,253 10,176 10,123 10,133 10,126 10,127 10,127 10,124 10,126 10,125 10,130 10,130 10,139 10,139 10,138 10,142 10,132 10,139 10,139 10,141Dec-06 100,625 14,288 17,234 16,824 16,773 16,835 16,835 16,836 16,840 16,829 16,829 16,831 16,831 16,831 16,831 16,832 16,828 16,853 16,859 16,859 16,853 16,853Jun-07 106,279 11,632 13,661 13,596 13,593 13,563 13,531 13,517 13,517 13,507 13,506 13,506 13,505 13,505 13,504 13,503 13,502 13,502 13,502 13,502 13,471Dec-07 112,706 20,890 24,176 24,089 24,018 23,977 24,015 23,983 23,997 23,993 23,981 23,984 23,983 23,978 23,977 23,972 23,972 23,972 23,960 23,960Jun-08 114,668 13,194 14,822 14,649 14,557 14,557 14,550 14,568 14,576 14,591 14,615 14,609 14,621 14,614 14,610 14,610 14,610 14,610 14,565Dec-08 118,897 19,839 21,419 21,274 21,290 21,283 21,275 21,275 21,273 21,259 21,258 21,252 21,256 21,256 21,256 21,256 21,256 21,256Jun-09 116,536 13,019 13,760 13,559 13,499 13,475 13,496 13,498 13,519 13,526 13,510 13,520 13,557 13,559 13,536 13,560 13,560Dec-09 116,182 22,876 24,390 24,276 24,299 24,220 24,224 24,213 24,214 24,204 24,069 24,070 24,068 24,070 24,070 24,070Jun-10 113,049 12,236 12,757 12,442 12,426 12,427 12,429 12,437 12,385 12,388 12,397 12,384 12,386 12,395 12,399Dec-10 115,178 22,939 23,853 23,660 23,576 23,537 23,527 23,521 23,519 23,519 23,520 23,520 23,518 23,518Jun-11 113,142 12,880 12,969 12,714 12,720 12,678 12,489 12,483 12,419 12,416 12,410 12,407 12,405Dec-11 115,919 21,345 22,758 22,630 22,646 22,595 22,582 22,549 22,526 22,520 22,518 22,517Jun-12 116,238 12,019 13,382 13,215 13,211 13,237 13,228 13,192 13,175 13,177 13,177Dec-12 120,111 26,530 29,307 29,080 29,086 29,086 29,069 29,065 29,065 29,067Jun-13 120,961 15,273 18,645 18,305 18,182 18,105 18,098 18,096 18,097Dec-13 125,827 25,332 26,860 26,774 26,801 26,784 26,766 26,768Jun-14 126,358 14,639 16,049 15,935 15,791 15,805 15,815Dec-14 134,853 36,750 39,373 38,895 39,095 39,317Jun-15 136,903 18,473 19,392 19,074 19,053Dec-15 139,071 36,593 38,388 38,585Jun-16 135,704 23,185 23,817Dec-16 135,587 36,517
Exhibit 2 Page 19
84

Incurred Loss Development Factors
AccidentSemester 6-12 12-18 18-24 24-30 30-36 36-42 42-48 48-54 54-60 60-66 66-72 72-78 78-84 84-90 90-96 96-102 102-108 108-114 114-120 120-126 126-132 132-138 138-144 144-150 150-156 156-162 162-168 168-174 174-180 80-Ultimat
Jun-02 1.075 1.001 0.998 1.000 1.001 1.000 1.000 1.000 1.000 1.000 1.000 1.000 1.000 1.000 0.993 1.000 1.000 1.000 1.000 1.000 1.000 1.000 1.000 1.000 1.000 1.000 1.000 1.000 1.000Dec-02 1.076 0.983 0.999 0.999 1.001 0.987 0.999 1.000 1.000 1.000 0.998 1.000 1.000 1.000 1.000 1.000 1.000 1.000 1.000 1.000 1.000 1.000 1.000 1.000 1.000 1.000 1.000 1.000Jun-03 1.145 0.997 0.997 1.003 0.987 0.994 1.001 1.000 1.000 1.000 1.000 1.000 1.000 1.000 1.000 1.000 0.999 1.000 1.000 1.000 1.000 1.000 1.000 1.000 1.000 1.000 1.000Dec-03 1.046 1.010 0.993 1.000 0.993 1.000 1.000 1.000 1.000 1.000 1.000 1.000 1.000 1.000 1.000 1.000 1.000 1.000 1.000 1.000 1.000 1.000 1.000 1.000 1.000 1.000Jun-04 1.050 1.007 0.992 1.000 1.001 0.996 1.000 1.000 1.000 1.000 1.000 1.000 1.000 1.000 1.000 1.000 1.000 1.000 1.000 1.000 1.000 1.000 1.000 1.000 1.000Dec-04 1.091 0.998 1.006 0.999 1.000 1.000 0.999 1.000 1.000 1.000 1.000 1.000 1.000 0.999 1.000 1.000 1.000 1.000 1.000 1.000 1.000 1.000 1.000 1.000Jun-05 1.167 0.978 0.991 1.000 1.002 1.000 1.000 1.000 1.000 1.000 1.000 1.000 1.000 1.000 1.000 1.000 1.000 1.000 1.000 1.000 1.000 1.000 1.000Dec-05 1.111 0.999 1.000 0.996 1.000 0.999 1.000 1.000 1.000 1.000 1.000 1.000 1.000 1.000 0.999 1.000 1.000 1.000 1.000 1.000 1.000 1.000Jun-06 1.091 1.000 0.993 0.995 1.001 0.999 1.000 1.000 1.000 1.000 1.000 1.000 1.000 1.001 1.000 1.000 1.000 0.999 1.001 1.000 1.000Dec-06 1.206 0.976 0.997 1.004 1.000 1.000 1.000 0.999 1.000 1.000 1.000 1.000 1.000 1.000 1.000 1.001 1.000 1.000 1.000 1.000Jun-07 1.174 0.995 1.000 0.998 0.998 0.999 1.000 0.999 1.000 1.000 1.000 1.000 1.000 1.000 1.000 1.000 1.000 1.000 0.998Dec-07 1.157 0.996 0.997 0.998 1.002 0.999 1.001 1.000 1.000 1.000 1.000 1.000 1.000 1.000 1.000 1.000 0.999 1.000Jun-08 1.123 0.988 0.994 1.000 0.999 1.001 1.001 1.001 1.002 1.000 1.001 1.000 1.000 1.000 1.000 1.000 0.997Dec-08 1.080 0.993 1.001 1.000 1.000 1.000 1.000 0.999 1.000 1.000 1.000 1.000 1.000 1.000 1.000 1.000Jun-09 1.057 0.985 0.996 0.998 1.002 1.000 1.002 1.001 0.999 1.001 1.003 1.000 0.998 1.002 1.000Dec-09 1.066 0.995 1.001 0.997 1.000 1.000 1.000 1.000 0.994 1.000 1.000 1.000 1.000 1.000Jun-10 1.043 0.975 0.999 1.000 1.000 1.001 0.996 1.000 1.001 0.999 1.000 1.001 1.000Dec-10 1.040 0.992 0.996 0.998 1.000 1.000 1.000 1.000 1.000 1.000 1.000 1.000Jun-11 1.007 0.980 1.000 0.997 0.985 1.000 0.995 1.000 0.999 1.000 1.000Dec-11 1.066 0.994 1.001 0.998 0.999 0.999 0.999 1.000 1.000 1.000Jun-12 1.113 0.988 1.000 1.002 0.999 0.997 0.999 1.000 1.000Dec-12 1.105 0.992 1.000 1.000 0.999 1.000 1.000 1.000Jun-13 1.221 0.982 0.993 0.996 1.000 1.000 1.000Dec-13 1.060 0.997 1.001 0.999 0.999 1.000Jun-14 1.096 0.993 0.991 1.001 1.001Dec-14 1.071 0.988 1.005 1.006Jun-15 1.050 0.984 0.999Dec-15 1.049 1.005Jun-16 1.027
Average Incurred Loss Development Factors
6-12 12-18 18-24 24-30 30-36 36-42 42-48 48-54 54-60 60-66 66-72 72-78 78-84 84-90 90-96 96-102 102-108 108-114 114-120 120-126 126-132 132-138 138-144 144-150 150-156 156-162 162-168 168-174 174-180 80-Ultimat
Arithmetic AveragesAll Semesters 1.092 0.992 0.998 0.999 0.999 0.999 1.000 1.000 1.000 1.000 1.000 1.000 1.000 1.000 0.999 1.000 1.000 1.000 1.000 1.000 1.000 1.000 1.000 1.000 1.000 1.000 1.000 1.000 1.00020 Semesters 1.091 0.990 0.998 0.999 0.999 0.999 1.000 1.000 1.000 1.00010 Semesters 1.086 0.990 0.999 1.000 0.998 1.000 0.999 1.000 0.999 1.000 1.000 1.000 1.000 1.000 1.000 1.000 1.000 1.000 1.000 1.0006 Semesters 1.059 0.991 0.998 1.001 1.000 0.999 0.999 1.000 0.999 1.000 1.000 1.000 1.000 1.000 1.000 1.000 1.000 1.000 1.000 1.000 1.000 1.000 1.000 1.0004 Semesters 1.049 0.992 0.999 1.000 1.000 0.999 0.999 1.000 1.000 1.000 1.000 1.000 1.000 1.000 1.000 1.000 0.999 1.000 1.000 1.000 1.000 1.000 1.000 1.000 1.000 1.0002 Semesters 1.038 0.994 1.002 1.003 1.000 1.000 1.000 1.000 1.000 1.000 1.000 1.000 1.000 1.001 1.000 1.000 0.998 1.000 0.999 1.000 1.000 1.000 1.000 1.000 1.000 1.000 1.000 1.000All Semester ex hi/lo 1.090 0.992 0.998 0.999 0.999 0.999 1.000 1.000 1.000 1.000 1.000 1.000 1.000 1.000 1.000 1.000 1.000 1.000 1.000 1.000 1.000 1.000 1.000 1.000 1.000 1.000 1.0006 Semesters ex hi/lo 1.058 0.990 0.998 1.001 0.999 0.999 0.999 1.000 1.000 1.000 1.000 1.000 1.000 1.000 1.000 1.000 1.000 1.000 1.000 1.000 1.000 1.000 1.000 1.000$ Weighted AveragesAll Semesters 1.086 0.992 0.999 1.000 0.999 0.999 1.000 1.000 1.000 1.000 1.000 1.000 1.000 1.000 1.000 1.000 1.000 1.000 1.000 1.000 1.000 1.000 1.000 1.000 1.000 1.000 1.000 1.000 1.00020 Semesters 1.084 0.991 0.999 0.999 0.999 1.000 1.000 1.000 1.000 1.00010 Semesters 1.077 0.992 0.999 1.000 0.999 1.000 0.999 1.000 0.999 1.000 1.000 1.000 1.000 1.000 1.000 1.000 1.000 1.000 1.000 1.0006 Semester 1.057 0.993 1.000 1.001 1.000 0.999 0.999 1.000 0.999 1.000 1.000 1.000 1.000 1.000 1.000 1.000 0.999 1.000 1.000 1.000 1.000 1.000 1.000 1.0004 Semester 1.052 0.994 1.001 1.001 1.000 1.000 1.000 1.000 1.000 1.000 1.000 1.000 1.000 1.000 1.000 1.000 0.999 1.000 0.999 1.000 1.000 1.000 1.000 1.000 1.000 1.0002 Semester 1.041 0.998 1.003 1.004 1.000 1.000 1.000 1.000 1.000 1.000 1.000 1.000 1.000 1.001 1.000 1.000 0.998 1.000 0.999 1.000 1.000 1.000 1.000 1.000 1.000 1.000 1.000 1.000Last 4 Semesters ending in 12 1.070 0.996 1.002Last 4 Semesters ending in 6 1.088 0.986 0.996
SelectedAge To Age 1.057 0.993 1.000 1.001 1.000 1.000 1.000 1.000 1.000 1.000 1.000 1.000 1.000 1.000 1.000 1.000 1.000 1.000 1.000 1.000 1.000 1.000 1.000 1.000 1.000 1.000 1.000 1.000 1.000 1.000Age to Ultimate 1.051 0.994 1.001 1.001 1.000 1.000 1.000 1.000 1.000 1.000 1.000 1.000 1.000 1.000 1.000 1.000 1.000 1.000 1.000 1.000 1.000 1.000 1.000 1.000 1.000 1.000 1.000 1.000 1.000 1.000
Exhibit 2 Page 20
85
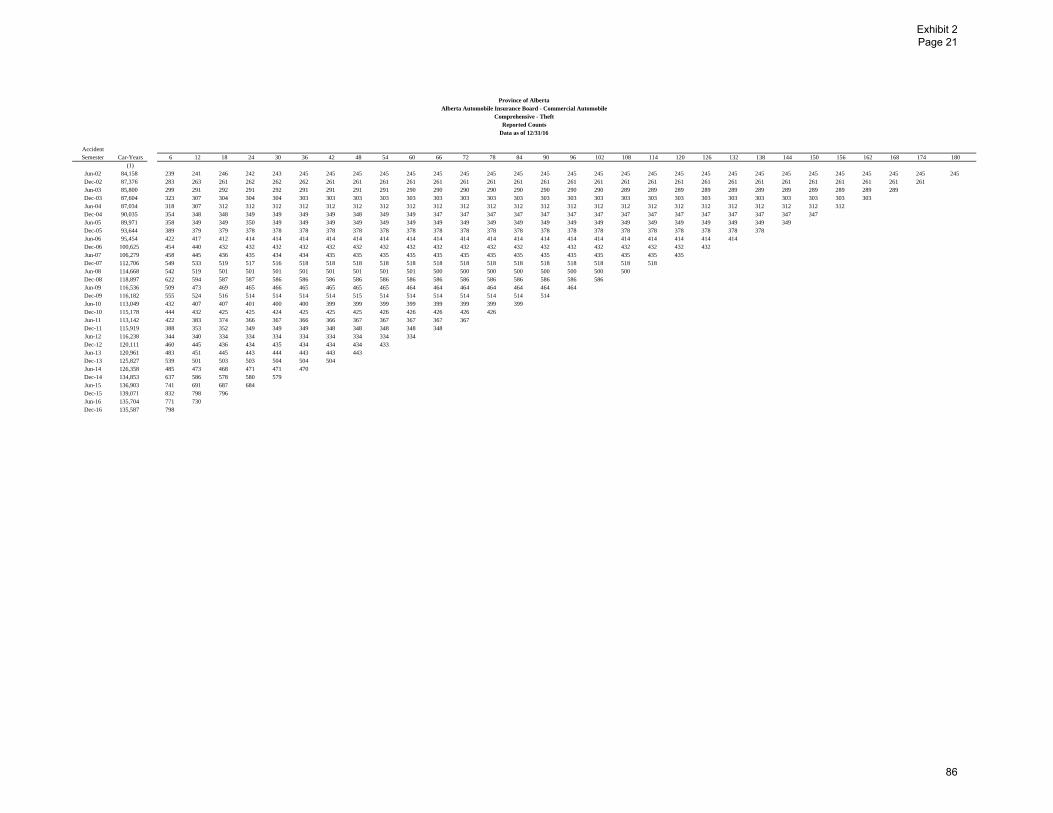
Province of AlbertaAlberta Automobile Insurance Board - Commercial Automobile
Comprehensive - TheftReported Counts
Data as of 12/31/16
AccidentSemester Car-Years 6 12 18 24 30 36 42 48 54 60 66 72 78 84 90 96 102 108 114 120 126 132 138 144 150 156 162 168 174 180
(1)Jun-02 84,158 239 241 246 242 243 245 245 245 245 245 245 245 245 245 245 245 245 245 245 245 245 245 245 245 245 245 245 245 245 245Dec-02 87,376 283 263 261 262 262 262 261 261 261 261 261 261 261 261 261 261 261 261 261 261 261 261 261 261 261 261 261 261 261Jun-03 85,800 299 291 292 291 292 291 291 291 291 290 290 290 290 290 290 290 290 289 289 289 289 289 289 289 289 289 289 289Dec-03 87,604 323 307 304 304 304 303 303 303 303 303 303 303 303 303 303 303 303 303 303 303 303 303 303 303 303 303 303Jun-04 87,034 318 307 312 312 312 312 312 312 312 312 312 312 312 312 312 312 312 312 312 312 312 312 312 312 312 312Dec-04 90,035 354 348 348 349 349 349 349 348 349 349 347 347 347 347 347 347 347 347 347 347 347 347 347 347 347Jun-05 89,971 358 349 349 350 349 349 349 349 349 349 349 349 349 349 349 349 349 349 349 349 349 349 349 349Dec-05 93,644 389 379 379 378 378 378 378 378 378 378 378 378 378 378 378 378 378 378 378 378 378 378 378Jun-06 95,454 422 417 412 414 414 414 414 414 414 414 414 414 414 414 414 414 414 414 414 414 414 414Dec-06 100,625 454 440 432 432 432 432 432 432 432 432 432 432 432 432 432 432 432 432 432 432 432Jun-07 106,279 458 445 436 435 434 434 435 435 435 435 435 435 435 435 435 435 435 435 435 435Dec-07 112,706 549 533 519 517 516 518 518 518 518 518 518 518 518 518 518 518 518 518 518Jun-08 114,668 542 519 501 501 501 501 501 501 501 501 500 500 500 500 500 500 500 500Dec-08 118,897 622 594 587 587 586 586 586 586 586 586 586 586 586 586 586 586 586Jun-09 116,536 509 473 469 465 466 465 465 465 465 464 464 464 464 464 464 464Dec-09 116,182 555 524 516 514 514 514 514 515 514 514 514 514 514 514 514Jun-10 113,049 432 407 407 401 400 400 399 399 399 399 399 399 399 399Dec-10 115,178 444 432 425 425 424 425 425 425 426 426 426 426 426Jun-11 113,142 422 383 374 366 367 366 366 367 367 367 367 367Dec-11 115,919 388 353 352 349 349 349 348 348 348 348 348Jun-12 116,238 344 340 334 334 334 334 334 334 334 334Dec-12 120,111 460 445 436 434 435 434 434 434 433Jun-13 120,961 483 451 445 443 444 443 443 443Dec-13 125,827 539 501 503 503 504 504 504Jun-14 126,358 485 473 468 471 471 470Dec-14 134,853 637 586 578 580 579Jun-15 136,903 741 691 687 684Dec-15 139,071 832 798 796Jun-16 135,704 771 730Dec-16 135,587 798
Exhibit 2 Page 21
86
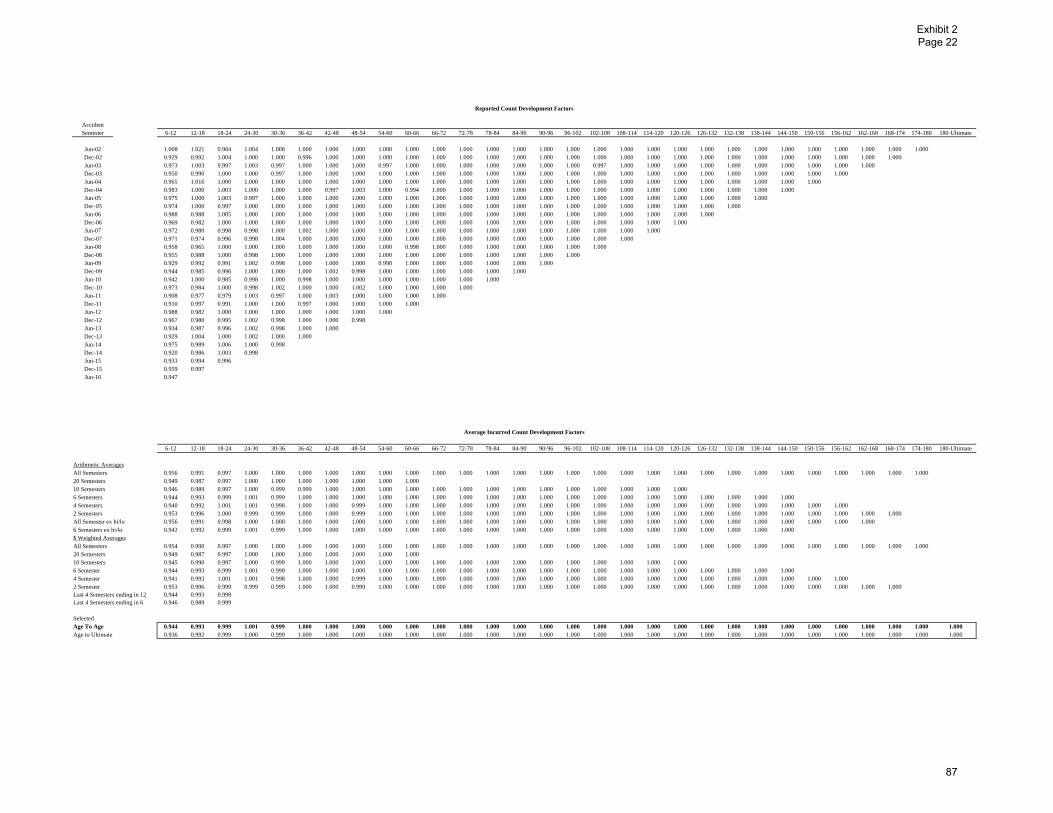
Reported Count Development Factors
AccidentSemester 6-12 12-18 18-24 24-30 30-36 36-42 42-48 48-54 54-60 60-66 66-72 72-78 78-84 84-90 90-96 96-102 102-108 108-114 114-120 120-126 126-132 132-138 138-144 144-150 150-156 156-162 162-168 168-174 174-180 180-Ultimate
Jun-02 1.008 1.021 0.984 1.004 1.008 1.000 1.000 1.000 1.000 1.000 1.000 1.000 1.000 1.000 1.000 1.000 1.000 1.000 1.000 1.000 1.000 1.000 1.000 1.000 1.000 1.000 1.000 1.000 1.000Dec-02 0.929 0.992 1.004 1.000 1.000 0.996 1.000 1.000 1.000 1.000 1.000 1.000 1.000 1.000 1.000 1.000 1.000 1.000 1.000 1.000 1.000 1.000 1.000 1.000 1.000 1.000 1.000 1.000Jun-03 0.973 1.003 0.997 1.003 0.997 1.000 1.000 1.000 0.997 1.000 1.000 1.000 1.000 1.000 1.000 1.000 0.997 1.000 1.000 1.000 1.000 1.000 1.000 1.000 1.000 1.000 1.000Dec-03 0.950 0.990 1.000 1.000 0.997 1.000 1.000 1.000 1.000 1.000 1.000 1.000 1.000 1.000 1.000 1.000 1.000 1.000 1.000 1.000 1.000 1.000 1.000 1.000 1.000 1.000Jun-04 0.965 1.016 1.000 1.000 1.000 1.000 1.000 1.000 1.000 1.000 1.000 1.000 1.000 1.000 1.000 1.000 1.000 1.000 1.000 1.000 1.000 1.000 1.000 1.000 1.000Dec-04 0.983 1.000 1.003 1.000 1.000 1.000 0.997 1.003 1.000 0.994 1.000 1.000 1.000 1.000 1.000 1.000 1.000 1.000 1.000 1.000 1.000 1.000 1.000 1.000Jun-05 0.975 1.000 1.003 0.997 1.000 1.000 1.000 1.000 1.000 1.000 1.000 1.000 1.000 1.000 1.000 1.000 1.000 1.000 1.000 1.000 1.000 1.000 1.000Dec-05 0.974 1.000 0.997 1.000 1.000 1.000 1.000 1.000 1.000 1.000 1.000 1.000 1.000 1.000 1.000 1.000 1.000 1.000 1.000 1.000 1.000 1.000Jun-06 0.988 0.988 1.005 1.000 1.000 1.000 1.000 1.000 1.000 1.000 1.000 1.000 1.000 1.000 1.000 1.000 1.000 1.000 1.000 1.000 1.000Dec-06 0.969 0.982 1.000 1.000 1.000 1.000 1.000 1.000 1.000 1.000 1.000 1.000 1.000 1.000 1.000 1.000 1.000 1.000 1.000 1.000Jun-07 0.972 0.980 0.998 0.998 1.000 1.002 1.000 1.000 1.000 1.000 1.000 1.000 1.000 1.000 1.000 1.000 1.000 1.000 1.000Dec-07 0.971 0.974 0.996 0.998 1.004 1.000 1.000 1.000 1.000 1.000 1.000 1.000 1.000 1.000 1.000 1.000 1.000 1.000Jun-08 0.958 0.965 1.000 1.000 1.000 1.000 1.000 1.000 1.000 0.998 1.000 1.000 1.000 1.000 1.000 1.000 1.000Dec-08 0.955 0.988 1.000 0.998 1.000 1.000 1.000 1.000 1.000 1.000 1.000 1.000 1.000 1.000 1.000 1.000Jun-09 0.929 0.992 0.991 1.002 0.998 1.000 1.000 1.000 0.998 1.000 1.000 1.000 1.000 1.000 1.000Dec-09 0.944 0.985 0.996 1.000 1.000 1.000 1.002 0.998 1.000 1.000 1.000 1.000 1.000 1.000Jun-10 0.942 1.000 0.985 0.998 1.000 0.998 1.000 1.000 1.000 1.000 1.000 1.000 1.000Dec-10 0.973 0.984 1.000 0.998 1.002 1.000 1.000 1.002 1.000 1.000 1.000 1.000Jun-11 0.908 0.977 0.979 1.003 0.997 1.000 1.003 1.000 1.000 1.000 1.000Dec-11 0.910 0.997 0.991 1.000 1.000 0.997 1.000 1.000 1.000 1.000Jun-12 0.988 0.982 1.000 1.000 1.000 1.000 1.000 1.000 1.000Dec-12 0.967 0.980 0.995 1.002 0.998 1.000 1.000 0.998Jun-13 0.934 0.987 0.996 1.002 0.998 1.000 1.000Dec-13 0.929 1.004 1.000 1.002 1.000 1.000Jun-14 0.975 0.989 1.006 1.000 0.998Dec-14 0.920 0.986 1.003 0.998Jun-15 0.933 0.994 0.996Dec-15 0.959 0.997Jun-16 0.947
Average Incurred Count Development Factors
6-12 12-18 18-24 24-30 30-36 36-42 42-48 48-54 54-60 60-66 66-72 72-78 78-84 84-90 90-96 96-102 102-108 108-114 114-120 120-126 126-132 132-138 138-144 144-150 150-156 156-162 162-168 168-174 174-180 180-Ultimate
Arithmetic AveragesAll Semesters 0.956 0.991 0.997 1.000 1.000 1.000 1.000 1.000 1.000 1.000 1.000 1.000 1.000 1.000 1.000 1.000 1.000 1.000 1.000 1.000 1.000 1.000 1.000 1.000 1.000 1.000 1.000 1.000 1.00020 Semesters 0.949 0.987 0.997 1.000 1.000 1.000 1.000 1.000 1.000 1.00010 Semesters 0.946 0.989 0.997 1.000 0.999 0.999 1.000 1.000 1.000 1.000 1.000 1.000 1.000 1.000 1.000 1.000 1.000 1.000 1.000 1.0006 Semesters 0.944 0.993 0.999 1.001 0.999 1.000 1.000 1.000 1.000 1.000 1.000 1.000 1.000 1.000 1.000 1.000 1.000 1.000 1.000 1.000 1.000 1.000 1.000 1.0004 Semesters 0.940 0.992 1.001 1.001 0.998 1.000 1.000 0.999 1.000 1.000 1.000 1.000 1.000 1.000 1.000 1.000 1.000 1.000 1.000 1.000 1.000 1.000 1.000 1.000 1.000 1.0002 Semesters 0.953 0.996 1.000 0.999 0.999 1.000 1.000 0.999 1.000 1.000 1.000 1.000 1.000 1.000 1.000 1.000 1.000 1.000 1.000 1.000 1.000 1.000 1.000 1.000 1.000 1.000 1.000 1.000All Semester ex hi/lo 0.956 0.991 0.998 1.000 1.000 1.000 1.000 1.000 1.000 1.000 1.000 1.000 1.000 1.000 1.000 1.000 1.000 1.000 1.000 1.000 1.000 1.000 1.000 1.000 1.000 1.000 1.0006 Semesters ex hi/lo 0.942 0.992 0.999 1.001 0.999 1.000 1.000 1.000 1.000 1.000 1.000 1.000 1.000 1.000 1.000 1.000 1.000 1.000 1.000 1.000 1.000 1.000 1.000 1.000$ Weighted AveragesAll Semesters 0.954 0.990 0.997 1.000 1.000 1.000 1.000 1.000 1.000 1.000 1.000 1.000 1.000 1.000 1.000 1.000 1.000 1.000 1.000 1.000 1.000 1.000 1.000 1.000 1.000 1.000 1.000 1.000 1.00020 Semesters 0.949 0.987 0.997 1.000 1.000 1.000 1.000 1.000 1.000 1.00010 Semesters 0.945 0.990 0.997 1.000 0.999 1.000 1.000 1.000 1.000 1.000 1.000 1.000 1.000 1.000 1.000 1.000 1.000 1.000 1.000 1.0006 Semester 0.944 0.993 0.999 1.001 0.999 1.000 1.000 1.000 1.000 1.000 1.000 1.000 1.000 1.000 1.000 1.000 1.000 1.000 1.000 1.000 1.000 1.000 1.000 1.0004 Semester 0.941 0.993 1.001 1.001 0.998 1.000 1.000 0.999 1.000 1.000 1.000 1.000 1.000 1.000 1.000 1.000 1.000 1.000 1.000 1.000 1.000 1.000 1.000 1.000 1.000 1.0002 Semester 0.953 0.996 0.999 0.999 0.999 1.000 1.000 0.999 1.000 1.000 1.000 1.000 1.000 1.000 1.000 1.000 1.000 1.000 1.000 1.000 1.000 1.000 1.000 1.000 1.000 1.000 1.000 1.000Last 4 Semesters ending in 12 0.944 0.993 0.998Last 4 Semesters ending in 6 0.946 0.989 0.999
SelectedAge To Age 0.944 0.993 0.999 1.001 0.999 1.000 1.000 1.000 1.000 1.000 1.000 1.000 1.000 1.000 1.000 1.000 1.000 1.000 1.000 1.000 1.000 1.000 1.000 1.000 1.000 1.000 1.000 1.000 1.000 1.000Age to Ultimate 0.936 0.992 0.999 1.000 0.999 1.000 1.000 1.000 1.000 1.000 1.000 1.000 1.000 1.000 1.000 1.000 1.000 1.000 1.000 1.000 1.000 1.000 1.000 1.000 1.000 1.000 1.000 1.000 1.000 1.000
Exhibit 2 Page 22
87
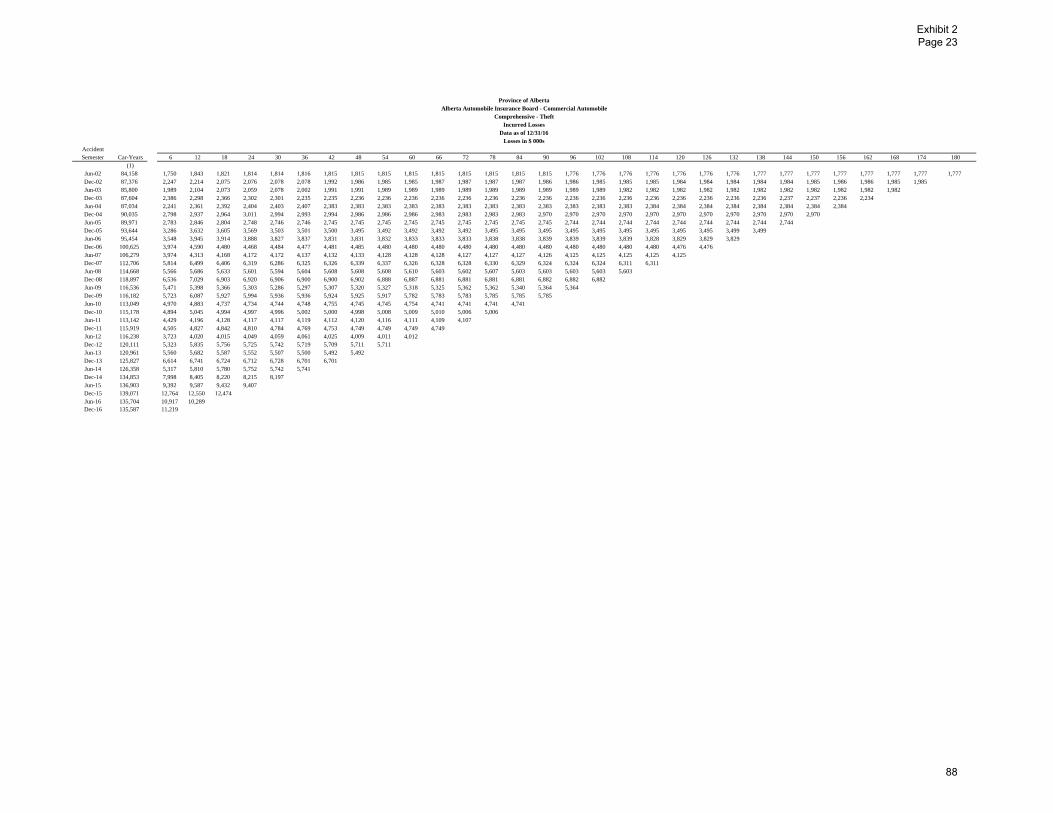
Province of AlbertaAlberta Automobile Insurance Board - Commercial Automobile
Comprehensive - TheftIncurred Losses
Data as of 12/31/16Losses in $ 000s
AccidentSemester Car-Years 6 12 18 24 30 36 42 48 54 60 66 72 78 84 90 96 102 108 114 120 126 132 138 144 150 156 162 168 174 180
(1)Jun-02 84,158 1,750 1,843 1,821 1,814 1,814 1,816 1,815 1,815 1,815 1,815 1,815 1,815 1,815 1,815 1,815 1,776 1,776 1,776 1,776 1,776 1,776 1,776 1,777 1,777 1,777 1,777 1,777 1,777 1,777 1,777Dec-02 87,376 2,247 2,214 2,075 2,076 2,078 2,078 1,992 1,986 1,985 1,985 1,987 1,987 1,987 1,987 1,986 1,986 1,985 1,985 1,985 1,984 1,984 1,984 1,984 1,984 1,985 1,986 1,986 1,985 1,985Jun-03 85,800 1,989 2,104 2,073 2,059 2,078 2,002 1,991 1,991 1,989 1,989 1,989 1,989 1,989 1,989 1,989 1,989 1,989 1,982 1,982 1,982 1,982 1,982 1,982 1,982 1,982 1,982 1,982 1,982Dec-03 87,604 2,386 2,298 2,366 2,302 2,301 2,235 2,235 2,236 2,236 2,236 2,236 2,236 2,236 2,236 2,236 2,236 2,236 2,236 2,236 2,236 2,236 2,236 2,236 2,237 2,237 2,236 2,234Jun-04 87,034 2,241 2,361 2,392 2,404 2,403 2,407 2,383 2,383 2,383 2,383 2,383 2,383 2,383 2,383 2,383 2,383 2,383 2,383 2,384 2,384 2,384 2,384 2,384 2,384 2,384 2,384Dec-04 90,035 2,798 2,937 2,964 3,011 2,994 2,993 2,994 2,986 2,986 2,986 2,983 2,983 2,983 2,983 2,970 2,970 2,970 2,970 2,970 2,970 2,970 2,970 2,970 2,970 2,970Jun-05 89,971 2,783 2,846 2,804 2,748 2,746 2,746 2,745 2,745 2,745 2,745 2,745 2,745 2,745 2,745 2,745 2,744 2,744 2,744 2,744 2,744 2,744 2,744 2,744 2,744Dec-05 93,644 3,286 3,632 3,605 3,569 3,503 3,501 3,500 3,495 3,492 3,492 3,492 3,492 3,495 3,495 3,495 3,495 3,495 3,495 3,495 3,495 3,495 3,499 3,499Jun-06 95,454 3,548 3,945 3,914 3,888 3,827 3,837 3,831 3,831 3,832 3,833 3,833 3,833 3,838 3,838 3,839 3,839 3,839 3,839 3,828 3,829 3,829 3,829Dec-06 100,625 3,974 4,590 4,480 4,468 4,484 4,477 4,481 4,485 4,480 4,480 4,480 4,480 4,480 4,480 4,480 4,480 4,480 4,480 4,480 4,476 4,476Jun-07 106,279 3,974 4,313 4,168 4,172 4,172 4,137 4,132 4,133 4,128 4,128 4,128 4,127 4,127 4,127 4,126 4,125 4,125 4,125 4,125 4,125Dec-07 112,706 5,814 6,499 6,406 6,319 6,286 6,325 6,326 6,339 6,337 6,326 6,328 6,328 6,330 6,329 6,324 6,324 6,324 6,311 6,311Jun-08 114,668 5,566 5,686 5,633 5,601 5,594 5,604 5,608 5,608 5,608 5,610 5,603 5,602 5,607 5,603 5,603 5,603 5,603 5,603Dec-08 118,897 6,536 7,029 6,903 6,920 6,906 6,900 6,900 6,902 6,888 6,887 6,881 6,881 6,881 6,881 6,882 6,882 6,882Jun-09 116,536 5,471 5,398 5,366 5,303 5,286 5,297 5,307 5,320 5,327 5,318 5,325 5,362 5,362 5,340 5,364 5,364Dec-09 116,182 5,723 6,087 5,927 5,994 5,936 5,936 5,924 5,925 5,917 5,782 5,783 5,783 5,785 5,785 5,785Jun-10 113,049 4,970 4,883 4,737 4,734 4,744 4,748 4,755 4,745 4,745 4,754 4,741 4,741 4,741 4,741Dec-10 115,178 4,894 5,045 4,994 4,997 4,996 5,002 5,000 4,998 5,008 5,009 5,010 5,006 5,006Jun-11 113,142 4,429 4,196 4,128 4,117 4,117 4,119 4,112 4,120 4,116 4,111 4,109 4,107Dec-11 115,919 4,505 4,827 4,842 4,810 4,784 4,769 4,753 4,749 4,749 4,749 4,749Jun-12 116,238 3,723 4,020 4,015 4,049 4,059 4,061 4,025 4,009 4,011 4,012Dec-12 120,111 5,323 5,835 5,756 5,725 5,742 5,719 5,709 5,711 5,711Jun-13 120,961 5,560 5,682 5,587 5,552 5,507 5,500 5,492 5,492Dec-13 125,827 6,614 6,741 6,724 6,712 6,728 6,701 6,701Jun-14 126,358 5,317 5,810 5,780 5,752 5,742 5,741Dec-14 134,853 7,998 8,405 8,220 8,215 8,197Jun-15 136,903 9,392 9,587 9,432 9,407Dec-15 139,071 12,764 12,550 12,474Jun-16 135,704 10,917 10,289Dec-16 135,587 11,219
Exhibit 2 Page 23
88

Incurred Loss Development Factors
AccidentSemester 6-12 12-18 18-24 24-30 30-36 36-42 42-48 48-54 54-60 60-66 66-72 72-78 78-84 84-90 90-96 96-102 102-108 108-114 114-120 120-126 126-132 132-138 138-144 144-150 150-156 156-162 162-168 168-174 174-180 180-Ultimate
Jun-02 1.053 0.988 0.996 1.000 1.001 1.000 1.000 1.000 0.999 1.000 1.000 1.000 1.000 1.000 0.979 1.000 1.000 1.000 1.000 1.000 1.000 1.000 1.000 1.000 1.000 1.000 1.000 1.000 1.000Dec-02 0.985 0.938 1.000 1.001 1.000 0.959 0.997 1.000 1.000 1.001 1.000 1.000 1.000 1.000 1.000 1.000 1.000 1.000 0.999 1.000 1.000 1.000 1.000 1.001 1.000 1.000 1.000 1.000Jun-03 1.058 0.985 0.993 1.009 0.964 0.994 1.000 0.999 1.000 1.000 1.000 1.000 1.000 1.000 1.000 1.000 0.996 1.000 1.000 1.000 1.000 1.000 1.000 1.000 1.000 1.000 1.000Dec-03 0.963 1.030 0.973 0.999 0.971 1.000 1.000 1.000 1.000 1.000 1.000 1.000 1.000 1.000 1.000 1.000 1.000 1.000 1.000 1.000 1.000 1.000 1.000 1.000 0.999 0.999Jun-04 1.054 1.013 1.005 1.000 1.002 0.990 1.000 1.000 1.000 1.000 1.000 1.000 1.000 1.000 1.000 1.000 1.000 1.000 1.000 1.000 1.000 1.000 1.000 1.000 1.000Dec-04 1.050 1.009 1.016 0.994 1.000 1.000 0.997 1.000 1.000 0.999 1.000 1.000 1.000 0.996 1.000 1.000 1.000 1.000 1.000 1.000 1.000 1.000 1.000 1.000Jun-05 1.023 0.985 0.980 0.999 1.000 1.000 1.000 1.000 1.000 1.000 1.000 1.000 1.000 1.000 1.000 1.000 1.000 1.000 1.000 1.000 1.000 1.000 1.000Dec-05 1.105 0.993 0.990 0.981 0.999 1.000 0.999 0.999 1.000 1.000 1.000 1.001 1.000 1.000 1.000 1.000 1.000 1.000 1.000 1.000 1.001 1.000Jun-06 1.112 0.992 0.994 0.984 1.002 0.999 1.000 1.000 1.000 1.000 1.000 1.001 1.000 1.000 1.000 1.000 1.000 0.997 1.000 1.000 1.000Dec-06 1.155 0.976 0.997 1.004 0.998 1.001 1.001 0.999 1.000 1.000 1.000 1.000 1.000 1.000 1.000 1.000 1.000 1.000 0.999 1.000Jun-07 1.085 0.966 1.001 1.000 0.991 0.999 1.000 0.999 1.000 1.000 1.000 1.000 1.000 1.000 1.000 1.000 1.000 1.000 1.000Dec-07 1.118 0.986 0.986 0.995 1.006 1.000 1.002 1.000 0.998 1.000 1.000 1.000 1.000 0.999 1.000 1.000 0.998 1.000Jun-08 1.022 0.991 0.994 0.999 1.002 1.001 1.000 1.000 1.000 0.999 1.000 1.001 0.999 1.000 1.000 1.000 1.000Dec-08 1.075 0.982 1.003 0.998 0.999 1.000 1.000 0.998 1.000 0.999 1.000 1.000 1.000 1.000 1.000 1.000Jun-09 0.987 0.994 0.988 0.997 1.002 1.002 1.003 1.001 0.998 1.001 1.007 1.000 0.996 1.004 1.000Dec-09 1.064 0.974 1.011 0.990 1.000 0.998 1.000 0.999 0.977 1.000 1.000 1.000 1.000 1.000Jun-10 0.982 0.970 0.999 1.002 1.001 1.001 0.998 1.000 1.002 0.997 1.000 1.000 1.000Dec-10 1.031 0.990 1.001 1.000 1.001 1.000 1.000 1.002 1.000 1.000 0.999 1.000Jun-11 0.947 0.984 0.997 1.000 1.000 0.998 1.002 0.999 0.999 0.999 1.000Dec-11 1.072 1.003 0.993 0.995 0.997 0.997 0.999 1.000 1.000 1.000Jun-12 1.080 0.999 1.008 1.002 1.000 0.991 0.996 1.000 1.000Dec-12 1.096 0.986 0.995 1.003 0.996 0.998 1.000 1.000Jun-13 1.022 0.983 0.994 0.992 0.999 0.999 1.000Dec-13 1.019 0.997 0.998 1.002 0.996 1.000Jun-14 1.093 0.995 0.995 0.998 1.000Dec-14 1.051 0.978 0.999 0.998Jun-15 1.021 0.984 0.997Dec-15 0.983 0.994Jun-16 0.942
Average Incurred Loss Development Factors
6-12 12-18 18-24 24-30 30-36 36-42 42-48 48-54 54-60 60-66 66-72 72-78 78-84 84-90 90-96 96-102 102-108 108-114 114-120 120-126 126-132 132-138 138-144 144-150 150-156 156-162 162-168 168-174 174-180 180-Ultimate
Arithmetic AveragesAll Semesters 1.043 0.988 0.997 0.998 0.997 0.997 1.000 1.000 0.999 1.000 1.000 1.000 1.000 1.000 0.999 1.000 1.000 1.000 1.000 1.000 1.000 1.000 1.000 1.000 1.000 1.000 1.000 1.000 1.00020 Semesters 1.042 0.986 0.997 0.997 1.000 0.999 1.000 1.000 0.999 1.00010 Semesters 1.038 0.990 0.998 0.999 0.999 0.998 1.000 1.000 0.998 1.000 1.001 1.000 0.999 1.000 1.000 1.000 1.000 1.000 1.000 1.0006 Semesters 1.018 0.989 0.996 0.999 0.998 0.997 0.999 1.000 0.996 1.000 1.001 1.000 0.999 1.001 1.000 1.000 1.000 1.000 1.000 1.000 1.000 1.000 1.000 1.0004 Semesters 0.999 0.988 0.998 0.998 0.998 0.997 0.999 1.000 1.000 0.999 1.000 1.000 0.999 1.001 1.000 1.000 1.000 0.999 1.000 1.000 1.000 1.000 1.000 1.000 1.000 1.0002 Semesters 0.963 0.989 0.998 0.998 0.998 0.999 1.000 1.000 1.000 1.000 0.999 1.000 1.000 1.002 1.000 1.000 0.999 1.000 1.000 1.000 1.001 1.000 1.000 1.000 1.000 1.000 1.000 1.000All Semester ex hi/lo 1.043 0.988 0.997 0.998 0.998 0.998 1.000 1.000 1.000 1.000 1.000 1.000 1.000 1.000 1.000 1.000 1.000 1.000 1.000 1.000 1.000 1.000 1.000 1.000 1.000 1.000 1.0006 Semesters ex hi/lo 1.018 0.989 0.996 1.000 0.998 0.998 1.000 1.000 1.000 1.000 1.000 1.000 1.000 1.000 1.000 1.000 1.000 1.000 1.000 1.000 1.000 1.000 1.000 1.000$ Weighted AveragesAll Semesters 1.035 0.987 0.997 0.998 0.998 0.998 1.000 1.000 0.998 1.000 1.000 1.000 1.000 1.000 0.999 1.000 1.000 1.000 1.000 1.000 1.000 1.000 1.000 1.000 1.000 1.000 1.000 1.000 1.00020 Semesters 1.032 0.986 0.997 0.997 1.000 0.999 1.000 1.000 0.998 1.00010 Semesters 1.023 0.990 0.998 0.999 0.999 0.999 1.000 1.000 0.997 1.000 1.001 1.000 0.999 1.000 1.000 1.000 1.000 1.000 1.000 1.0006 Semester 1.007 0.989 0.997 0.999 0.998 0.998 1.000 1.000 0.996 1.000 1.001 1.000 0.999 1.001 1.000 1.000 1.000 1.000 1.000 1.000 1.000 1.000 1.000 1.0004 Semester 0.994 0.988 0.998 0.998 0.998 0.998 0.999 1.000 1.000 0.999 1.000 1.000 0.999 1.001 1.000 1.000 0.999 0.999 1.000 1.000 1.000 1.000 1.000 1.000 1.000 1.0002 Semester 0.964 0.990 0.998 0.998 0.998 0.999 1.000 1.000 1.000 1.000 0.999 1.000 1.000 1.002 1.000 1.000 0.999 1.000 1.000 1.000 1.001 1.000 1.000 1.000 1.000 0.999 1.000 1.000Last 4 Semesters ending in 12 1.025 0.989 0.997Last 4 Semesters ending in 6 1.006 0.989 0.998
SelectedAge To Age 1.025 0.989 0.997 0.999 0.998 0.998 1.000 1.000 0.996 1.000 1.001 1.000 0.999 1.001 1.000 1.000 1.000 1.000 1.000 1.000 1.000 1.000 1.000 1.000 1.000 1.000 1.000 1.000 1.000 1.000Age to Ultimate 1.000 0.975 0.987 0.990 0.991 0.993 0.995 0.996 0.996 1.000 1.000 0.999 0.999 1.000 0.999 0.999 0.999 1.000 1.000 1.000 1.000 1.000 1.000 1.000 1.000 1.000 1.000 1.000 1.000 1.000
Exhibit 2 Page 24
89
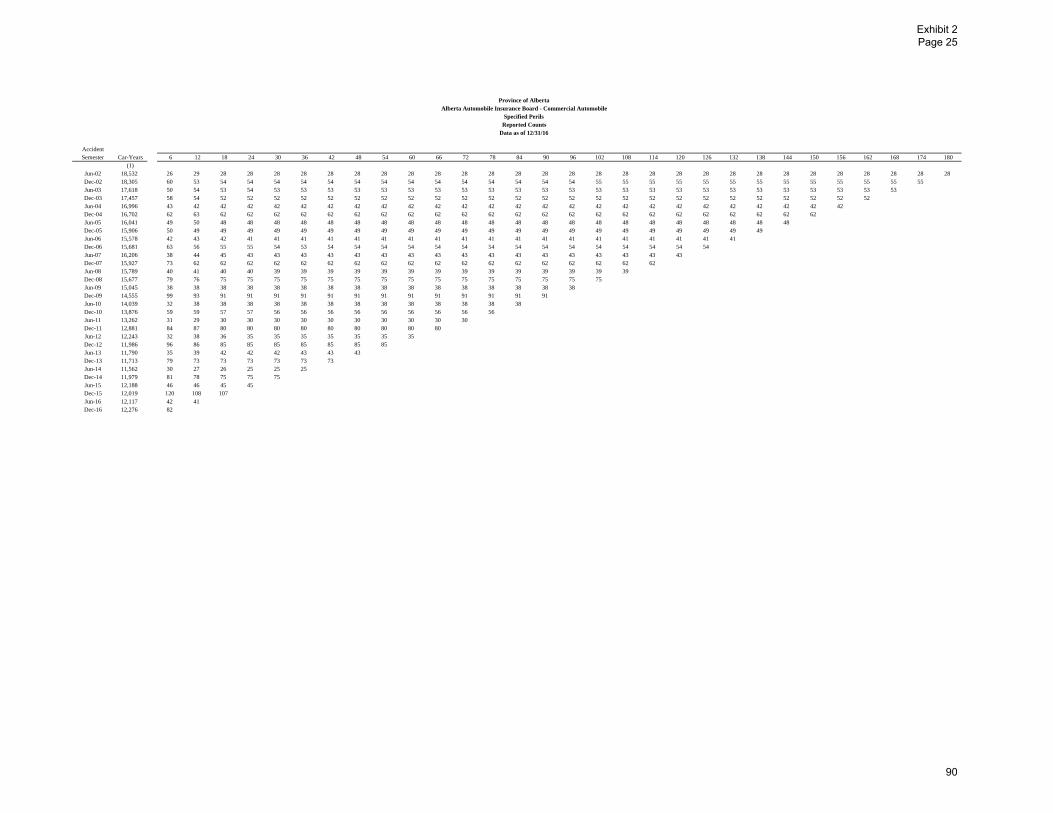
Province of AlbertaAlberta Automobile Insurance Board - Commercial Automobile
Specified PerilsReported Counts
Data as of 12/31/16
AccidentSemester Car-Years 6 12 18 24 30 36 42 48 54 60 66 72 78 84 90 96 102 108 114 120 126 132 138 144 150 156 162 168 174 180
(1)Jun-02 18,532 26 29 28 28 28 28 28 28 28 28 28 28 28 28 28 28 28 28 28 28 28 28 28 28 28 28 28 28 28 28Dec-02 18,305 60 53 54 54 54 54 54 54 54 54 54 54 54 54 54 54 55 55 55 55 55 55 55 55 55 55 55 55 55Jun-03 17,618 50 54 53 54 53 53 53 53 53 53 53 53 53 53 53 53 53 53 53 53 53 53 53 53 53 53 53 53Dec-03 17,457 58 54 52 52 52 52 52 52 52 52 52 52 52 52 52 52 52 52 52 52 52 52 52 52 52 52 52Jun-04 16,996 43 42 42 42 42 42 42 42 42 42 42 42 42 42 42 42 42 42 42 42 42 42 42 42 42 42Dec-04 16,702 62 63 62 62 62 62 62 62 62 62 62 62 62 62 62 62 62 62 62 62 62 62 62 62 62Jun-05 16,041 49 50 48 48 48 48 48 48 48 48 48 48 48 48 48 48 48 48 48 48 48 48 48 48Dec-05 15,906 50 49 49 49 49 49 49 49 49 49 49 49 49 49 49 49 49 49 49 49 49 49 49Jun-06 15,578 42 43 42 41 41 41 41 41 41 41 41 41 41 41 41 41 41 41 41 41 41 41Dec-06 15,681 63 56 55 55 54 53 54 54 54 54 54 54 54 54 54 54 54 54 54 54 54Jun-07 16,206 38 44 45 43 43 43 43 43 43 43 43 43 43 43 43 43 43 43 43 43Dec-07 15,927 73 62 62 62 62 62 62 62 62 62 62 62 62 62 62 62 62 62 62Jun-08 15,789 40 41 40 40 39 39 39 39 39 39 39 39 39 39 39 39 39 39Dec-08 15,677 79 76 75 75 75 75 75 75 75 75 75 75 75 75 75 75 75Jun-09 15,045 38 38 38 38 38 38 38 38 38 38 38 38 38 38 38 38Dec-09 14,555 99 93 91 91 91 91 91 91 91 91 91 91 91 91 91Jun-10 14,039 32 38 38 38 38 38 38 38 38 38 38 38 38 38Dec-10 13,876 59 59 57 57 56 56 56 56 56 56 56 56 56Jun-11 13,262 31 29 30 30 30 30 30 30 30 30 30 30Dec-11 12,881 84 87 80 80 80 80 80 80 80 80 80Jun-12 12,243 32 38 36 35 35 35 35 35 35 35Dec-12 11,986 96 86 85 85 85 85 85 85 85Jun-13 11,790 35 39 42 42 42 43 43 43Dec-13 11,713 79 73 73 73 73 73 73Jun-14 11,562 30 27 26 25 25 25Dec-14 11,979 81 78 75 75 75Jun-15 12,188 46 46 45 45Dec-15 12,019 120 108 107Jun-16 12,117 42 41Dec-16 12,276 82
Exhibit 2 Page 25
90
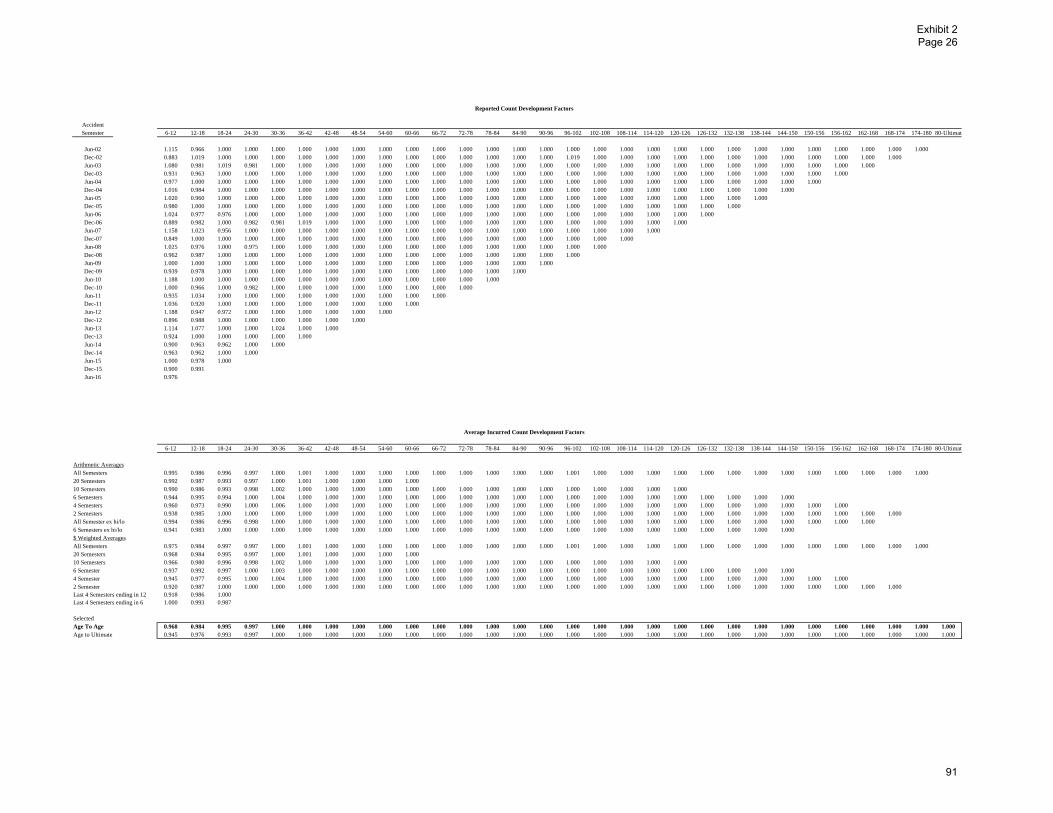
Reported Count Development Factors
AccidentSemester 6-12 12-18 18-24 24-30 30-36 36-42 42-48 48-54 54-60 60-66 66-72 72-78 78-84 84-90 90-96 96-102 102-108 108-114 114-120 120-126 126-132 132-138 138-144 144-150 150-156 156-162 162-168 168-174 174-180 80-Ultimat
Jun-02 1.115 0.966 1.000 1.000 1.000 1.000 1.000 1.000 1.000 1.000 1.000 1.000 1.000 1.000 1.000 1.000 1.000 1.000 1.000 1.000 1.000 1.000 1.000 1.000 1.000 1.000 1.000 1.000 1.000Dec-02 0.883 1.019 1.000 1.000 1.000 1.000 1.000 1.000 1.000 1.000 1.000 1.000 1.000 1.000 1.000 1.019 1.000 1.000 1.000 1.000 1.000 1.000 1.000 1.000 1.000 1.000 1.000 1.000Jun-03 1.080 0.981 1.019 0.981 1.000 1.000 1.000 1.000 1.000 1.000 1.000 1.000 1.000 1.000 1.000 1.000 1.000 1.000 1.000 1.000 1.000 1.000 1.000 1.000 1.000 1.000 1.000Dec-03 0.931 0.963 1.000 1.000 1.000 1.000 1.000 1.000 1.000 1.000 1.000 1.000 1.000 1.000 1.000 1.000 1.000 1.000 1.000 1.000 1.000 1.000 1.000 1.000 1.000 1.000Jun-04 0.977 1.000 1.000 1.000 1.000 1.000 1.000 1.000 1.000 1.000 1.000 1.000 1.000 1.000 1.000 1.000 1.000 1.000 1.000 1.000 1.000 1.000 1.000 1.000 1.000Dec-04 1.016 0.984 1.000 1.000 1.000 1.000 1.000 1.000 1.000 1.000 1.000 1.000 1.000 1.000 1.000 1.000 1.000 1.000 1.000 1.000 1.000 1.000 1.000 1.000Jun-05 1.020 0.960 1.000 1.000 1.000 1.000 1.000 1.000 1.000 1.000 1.000 1.000 1.000 1.000 1.000 1.000 1.000 1.000 1.000 1.000 1.000 1.000 1.000Dec-05 0.980 1.000 1.000 1.000 1.000 1.000 1.000 1.000 1.000 1.000 1.000 1.000 1.000 1.000 1.000 1.000 1.000 1.000 1.000 1.000 1.000 1.000Jun-06 1.024 0.977 0.976 1.000 1.000 1.000 1.000 1.000 1.000 1.000 1.000 1.000 1.000 1.000 1.000 1.000 1.000 1.000 1.000 1.000 1.000Dec-06 0.889 0.982 1.000 0.982 0.981 1.019 1.000 1.000 1.000 1.000 1.000 1.000 1.000 1.000 1.000 1.000 1.000 1.000 1.000 1.000Jun-07 1.158 1.023 0.956 1.000 1.000 1.000 1.000 1.000 1.000 1.000 1.000 1.000 1.000 1.000 1.000 1.000 1.000 1.000 1.000Dec-07 0.849 1.000 1.000 1.000 1.000 1.000 1.000 1.000 1.000 1.000 1.000 1.000 1.000 1.000 1.000 1.000 1.000 1.000Jun-08 1.025 0.976 1.000 0.975 1.000 1.000 1.000 1.000 1.000 1.000 1.000 1.000 1.000 1.000 1.000 1.000 1.000Dec-08 0.962 0.987 1.000 1.000 1.000 1.000 1.000 1.000 1.000 1.000 1.000 1.000 1.000 1.000 1.000 1.000Jun-09 1.000 1.000 1.000 1.000 1.000 1.000 1.000 1.000 1.000 1.000 1.000 1.000 1.000 1.000 1.000Dec-09 0.939 0.978 1.000 1.000 1.000 1.000 1.000 1.000 1.000 1.000 1.000 1.000 1.000 1.000Jun-10 1.188 1.000 1.000 1.000 1.000 1.000 1.000 1.000 1.000 1.000 1.000 1.000 1.000Dec-10 1.000 0.966 1.000 0.982 1.000 1.000 1.000 1.000 1.000 1.000 1.000 1.000Jun-11 0.935 1.034 1.000 1.000 1.000 1.000 1.000 1.000 1.000 1.000 1.000Dec-11 1.036 0.920 1.000 1.000 1.000 1.000 1.000 1.000 1.000 1.000Jun-12 1.188 0.947 0.972 1.000 1.000 1.000 1.000 1.000 1.000Dec-12 0.896 0.988 1.000 1.000 1.000 1.000 1.000 1.000Jun-13 1.114 1.077 1.000 1.000 1.024 1.000 1.000Dec-13 0.924 1.000 1.000 1.000 1.000 1.000Jun-14 0.900 0.963 0.962 1.000 1.000Dec-14 0.963 0.962 1.000 1.000Jun-15 1.000 0.978 1.000Dec-15 0.900 0.991Jun-16 0.976
Average Incurred Count Development Factors
6-12 12-18 18-24 24-30 30-36 36-42 42-48 48-54 54-60 60-66 66-72 72-78 78-84 84-90 90-96 96-102 102-108 108-114 114-120 120-126 126-132 132-138 138-144 144-150 150-156 156-162 162-168 168-174 174-180 80-Ultimat
Arithmetic AveragesAll Semesters 0.995 0.986 0.996 0.997 1.000 1.001 1.000 1.000 1.000 1.000 1.000 1.000 1.000 1.000 1.000 1.001 1.000 1.000 1.000 1.000 1.000 1.000 1.000 1.000 1.000 1.000 1.000 1.000 1.00020 Semesters 0.992 0.987 0.993 0.997 1.000 1.001 1.000 1.000 1.000 1.00010 Semesters 0.990 0.986 0.993 0.998 1.002 1.000 1.000 1.000 1.000 1.000 1.000 1.000 1.000 1.000 1.000 1.000 1.000 1.000 1.000 1.0006 Semesters 0.944 0.995 0.994 1.000 1.004 1.000 1.000 1.000 1.000 1.000 1.000 1.000 1.000 1.000 1.000 1.000 1.000 1.000 1.000 1.000 1.000 1.000 1.000 1.0004 Semesters 0.960 0.973 0.990 1.000 1.006 1.000 1.000 1.000 1.000 1.000 1.000 1.000 1.000 1.000 1.000 1.000 1.000 1.000 1.000 1.000 1.000 1.000 1.000 1.000 1.000 1.0002 Semesters 0.938 0.985 1.000 1.000 1.000 1.000 1.000 1.000 1.000 1.000 1.000 1.000 1.000 1.000 1.000 1.000 1.000 1.000 1.000 1.000 1.000 1.000 1.000 1.000 1.000 1.000 1.000 1.000All Semester ex hi/lo 0.994 0.986 0.996 0.998 1.000 1.000 1.000 1.000 1.000 1.000 1.000 1.000 1.000 1.000 1.000 1.000 1.000 1.000 1.000 1.000 1.000 1.000 1.000 1.000 1.000 1.000 1.0006 Semesters ex hi/lo 0.941 0.983 1.000 1.000 1.000 1.000 1.000 1.000 1.000 1.000 1.000 1.000 1.000 1.000 1.000 1.000 1.000 1.000 1.000 1.000 1.000 1.000 1.000 1.000$ Weighted AveragesAll Semesters 0.975 0.984 0.997 0.997 1.000 1.001 1.000 1.000 1.000 1.000 1.000 1.000 1.000 1.000 1.000 1.001 1.000 1.000 1.000 1.000 1.000 1.000 1.000 1.000 1.000 1.000 1.000 1.000 1.00020 Semesters 0.968 0.984 0.995 0.997 1.000 1.001 1.000 1.000 1.000 1.00010 Semesters 0.966 0.980 0.996 0.998 1.002 1.000 1.000 1.000 1.000 1.000 1.000 1.000 1.000 1.000 1.000 1.000 1.000 1.000 1.000 1.0006 Semester 0.937 0.992 0.997 1.000 1.003 1.000 1.000 1.000 1.000 1.000 1.000 1.000 1.000 1.000 1.000 1.000 1.000 1.000 1.000 1.000 1.000 1.000 1.000 1.0004 Semester 0.945 0.977 0.995 1.000 1.004 1.000 1.000 1.000 1.000 1.000 1.000 1.000 1.000 1.000 1.000 1.000 1.000 1.000 1.000 1.000 1.000 1.000 1.000 1.000 1.000 1.0002 Semester 0.920 0.987 1.000 1.000 1.000 1.000 1.000 1.000 1.000 1.000 1.000 1.000 1.000 1.000 1.000 1.000 1.000 1.000 1.000 1.000 1.000 1.000 1.000 1.000 1.000 1.000 1.000 1.000Last 4 Semesters ending in 12 0.918 0.986 1.000Last 4 Semesters ending in 6 1.000 0.993 0.987
SelectedAge To Age 0.968 0.984 0.995 0.997 1.000 1.000 1.000 1.000 1.000 1.000 1.000 1.000 1.000 1.000 1.000 1.000 1.000 1.000 1.000 1.000 1.000 1.000 1.000 1.000 1.000 1.000 1.000 1.000 1.000 1.000Age to Ultimate 0.945 0.976 0.993 0.997 1.000 1.000 1.000 1.000 1.000 1.000 1.000 1.000 1.000 1.000 1.000 1.000 1.000 1.000 1.000 1.000 1.000 1.000 1.000 1.000 1.000 1.000 1.000 1.000 1.000 1.000
Exhibit 2 Page 26
91
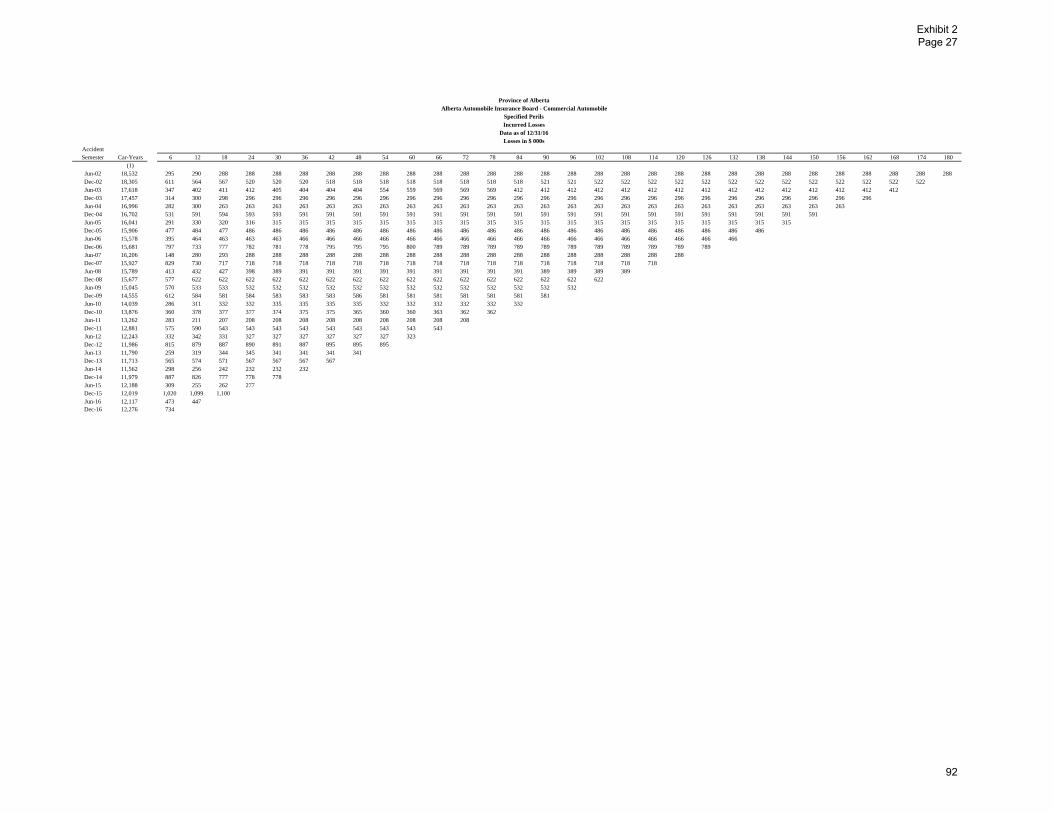
Province of AlbertaAlberta Automobile Insurance Board - Commercial Automobile
Specified PerilsIncurred Losses
Data as of 12/31/16Losses in $ 000s
AccidentSemester Car-Years 6 12 18 24 30 36 42 48 54 60 66 72 78 84 90 96 102 108 114 120 126 132 138 144 150 156 162 168 174 180
(1)Jun-02 18,532 295 290 288 288 288 288 288 288 288 288 288 288 288 288 288 288 288 288 288 288 288 288 288 288 288 288 288 288 288 288Dec-02 18,305 611 564 567 520 520 520 518 518 518 518 518 518 518 518 521 521 522 522 522 522 522 522 522 522 522 522 522 522 522Jun-03 17,618 347 402 411 412 405 404 404 404 554 559 569 569 569 412 412 412 412 412 412 412 412 412 412 412 412 412 412 412Dec-03 17,457 314 300 298 296 296 296 296 296 296 296 296 296 296 296 296 296 296 296 296 296 296 296 296 296 296 296 296Jun-04 16,996 282 300 263 263 263 263 263 263 263 263 263 263 263 263 263 263 263 263 263 263 263 263 263 263 263 263Dec-04 16,702 531 591 594 593 593 591 591 591 591 591 591 591 591 591 591 591 591 591 591 591 591 591 591 591 591Jun-05 16,041 291 330 320 316 315 315 315 315 315 315 315 315 315 315 315 315 315 315 315 315 315 315 315 315Dec-05 15,906 477 484 477 486 486 486 486 486 486 486 486 486 486 486 486 486 486 486 486 486 486 486 486Jun-06 15,578 395 464 463 463 463 466 466 466 466 466 466 466 466 466 466 466 466 466 466 466 466 466Dec-06 15,681 797 733 777 782 781 778 795 795 795 800 789 789 789 789 789 789 789 789 789 789 789Jun-07 16,206 148 280 293 288 288 288 288 288 288 288 288 288 288 288 288 288 288 288 288 288Dec-07 15,927 829 730 717 718 718 718 718 718 718 718 718 718 718 718 718 718 718 718 718Jun-08 15,789 413 432 427 398 389 391 391 391 391 391 391 391 391 391 389 389 389 389Dec-08 15,677 577 622 622 622 622 622 622 622 622 622 622 622 622 622 622 622 622Jun-09 15,045 570 533 533 532 532 532 532 532 532 532 532 532 532 532 532 532Dec-09 14,555 612 584 581 584 583 583 583 586 581 581 581 581 581 581 581Jun-10 14,039 286 311 332 332 335 335 335 335 332 332 332 332 332 332Dec-10 13,876 360 378 377 377 374 375 375 365 360 360 363 362 362Jun-11 13,262 283 211 207 208 208 208 208 208 208 208 208 208Dec-11 12,881 575 590 543 543 543 543 543 543 543 543 543Jun-12 12,243 332 342 331 327 327 327 327 327 327 323Dec-12 11,986 815 879 887 890 891 887 895 895 895Jun-13 11,790 259 319 344 345 341 341 341 341Dec-13 11,713 565 574 571 567 567 567 567Jun-14 11,562 298 256 242 232 232 232Dec-14 11,979 887 826 777 778 778Jun-15 12,188 309 255 262 277Dec-15 12,019 1,020 1,099 1,100Jun-16 12,117 473 447Dec-16 12,276 734
Exhibit 2 Page 27
92

Incurred Loss Development Factors
AccidentSemester 6-12 12-18 18-24 24-30 30-36 36-42 42-48 48-54 54-60 60-66 66-72 72-78 78-84 84-90 90-96 96-102 102-108 108-114 114-120 120-126 126-132 132-138 138-144 144-150 150-156 156-162 162-168 168-174 174-180 80-Ultimat
Jun-02 0.985 0.991 1.001 1.000 1.000 1.001 0.999 1.000 1.001 0.999 1.000 1.000 1.000 1.000 1.000 1.000 1.000 1.000 1.000 1.000 1.000 1.000 1.000 1.000 1.000 1.000 1.000 1.000 1.000Dec-02 0.922 1.005 0.917 1.000 1.000 0.997 1.000 1.000 1.000 1.000 1.000 1.000 1.000 1.006 1.000 1.000 1.000 1.000 1.000 1.000 1.000 1.000 1.000 1.000 1.000 1.000 1.000 1.000Jun-03 1.160 1.022 1.001 0.984 0.999 1.000 1.000 1.371 1.007 1.018 1.000 1.000 0.725 1.000 1.000 1.000 1.000 1.000 1.000 1.000 1.000 1.000 1.000 1.000 1.000 1.000 1.000Dec-03 0.955 0.994 0.995 1.000 1.000 1.000 1.000 1.000 1.000 1.000 1.000 1.000 1.000 1.000 1.000 1.000 1.000 1.000 1.000 1.000 1.000 1.000 1.000 1.000 1.000 1.000Jun-04 1.064 0.876 1.000 1.000 1.000 1.000 1.000 1.000 1.000 1.000 1.000 1.000 1.000 1.000 1.000 1.000 1.000 1.000 1.000 1.000 1.000 1.000 1.000 1.000 1.000Dec-04 1.114 1.005 0.999 1.000 0.997 1.000 1.000 1.000 1.000 1.000 1.000 1.000 1.000 1.000 1.000 1.000 1.000 1.000 1.000 1.000 1.000 1.000 1.000 1.000Jun-05 1.133 0.970 0.989 0.997 1.000 1.000 1.000 1.000 1.000 1.000 1.000 1.000 1.000 1.000 1.000 1.000 1.000 1.000 1.000 1.000 1.000 1.000 1.000Dec-05 1.014 0.985 1.020 1.000 1.000 1.000 1.000 1.000 1.000 1.000 1.000 1.000 1.000 1.000 1.000 1.000 1.000 1.000 1.000 1.000 1.000 1.000Jun-06 1.173 0.999 0.998 1.000 1.008 1.000 1.000 1.000 1.000 1.000 1.000 1.000 1.000 1.000 1.000 1.000 1.000 1.000 1.000 1.000 1.000Dec-06 0.920 1.060 1.007 0.998 0.996 1.022 1.000 1.000 1.006 0.987 1.000 1.000 1.000 1.000 1.000 1.000 1.000 1.000 1.000 1.000Jun-07 1.885 1.047 0.984 1.000 1.000 1.001 1.000 1.000 1.000 1.000 1.000 1.000 1.000 1.000 1.000 1.000 1.000 1.000 1.000Dec-07 0.880 0.983 1.001 1.000 1.000 1.000 1.000 1.000 1.000 1.000 1.000 1.000 1.000 1.000 1.000 1.000 1.000 1.000Jun-08 1.046 0.990 0.932 0.978 1.005 1.000 1.000 1.000 1.000 1.000 1.000 1.000 1.000 0.996 1.000 1.000 1.000Dec-08 1.079 0.999 1.001 1.000 1.000 1.000 1.000 1.000 1.000 1.000 1.000 1.000 1.000 1.000 1.000 1.000Jun-09 0.936 0.999 0.999 1.000 1.000 1.000 1.000 1.000 1.000 1.000 1.000 1.000 1.000 1.000 1.000Dec-09 0.953 0.996 1.004 0.998 1.000 1.000 1.005 0.991 1.000 1.000 1.000 1.000 1.000 1.000Jun-10 1.089 1.068 1.000 1.008 1.000 1.001 1.000 0.991 1.000 1.000 1.000 1.000 1.000Dec-10 1.051 0.996 1.001 0.993 1.001 1.000 0.976 0.986 1.000 1.008 0.996 1.000Jun-11 0.746 0.982 1.002 1.000 1.000 1.000 1.000 1.000 1.000 1.000 1.000Dec-11 1.025 0.921 1.000 1.000 1.000 1.000 1.000 1.000 1.000 1.000Jun-12 1.028 0.968 0.989 1.000 1.000 1.000 1.000 1.000 0.988Dec-12 1.080 1.008 1.004 1.000 0.996 1.009 1.000 1.000Jun-13 1.229 1.078 1.003 0.990 0.999 1.000 1.000Dec-13 1.016 0.994 0.992 1.000 1.000 1.000Jun-14 0.859 0.946 0.959 1.000 1.000Dec-14 0.931 0.941 1.001 1.000Jun-15 0.826 1.026 1.059Dec-15 1.077 1.001Jun-16 0.944
Average Incurred Loss Development Factors
6-12 12-18 18-24 24-30 30-36 36-42 42-48 48-54 54-60 60-66 66-72 72-78 78-84 84-90 90-96 96-102 102-108 108-114 114-120 120-126 126-132 132-138 138-144 144-150 150-156 156-162 162-168 168-174 174-180 80-Ultimat
Arithmetic AveragesAll Semesters 1.039 0.995 0.995 0.998 1.000 1.001 0.999 1.015 1.000 1.001 1.000 1.000 0.984 1.000 1.000 1.000 1.000 1.000 1.000 1.000 1.000 1.000 1.000 1.000 1.000 1.000 1.000 1.000 1.00020 Semesters 1.030 1.000 0.998 0.998 1.000 1.002 0.999 1.017 1.000 1.00110 Semesters 1.001 0.987 1.001 0.999 1.000 1.001 0.998 0.997 0.999 1.001 1.000 1.000 1.000 1.000 1.000 1.000 1.000 1.000 1.000 1.0006 Semesters 0.942 0.998 1.003 0.998 0.999 1.001 0.996 0.996 0.998 1.001 0.999 1.000 1.000 0.999 1.000 1.000 1.000 1.000 1.000 1.000 1.000 1.000 1.000 1.0004 Semesters 0.944 0.979 1.003 0.997 0.999 1.002 1.000 1.000 0.997 1.002 0.999 1.000 1.000 0.999 1.000 1.000 1.000 1.000 1.000 1.000 1.000 1.000 1.000 1.000 1.000 1.0002 Semesters 1.011 1.013 1.030 1.000 1.000 1.000 1.000 1.000 0.994 1.000 0.998 1.000 1.000 1.000 1.000 1.000 1.000 1.000 1.000 1.000 1.000 1.000 1.000 1.000 1.000 1.000 1.000 1.000All Semester ex hi/lo 1.018 0.996 0.995 0.998 1.000 1.001 1.000 0.999 1.000 1.000 1.000 1.000 1.000 1.000 1.000 1.000 1.000 1.000 1.000 1.000 1.000 1.000 1.000 1.000 1.000 1.000 1.0006 Semesters ex hi/lo 0.937 0.992 1.000 1.000 1.000 1.000 1.000 0.998 1.000 1.000 1.000 1.000 1.000 1.000 1.000 1.000 1.000 1.000 1.000 1.000 1.000 1.000 1.000 1.000$ Weighted AveragesAll Semesters 1.012 0.995 0.995 0.998 1.000 1.002 0.999 1.013 1.001 1.000 1.000 1.000 0.981 1.000 1.000 1.000 1.000 1.000 1.000 1.000 1.000 1.000 1.000 1.000 1.000 1.000 1.000 1.000 1.00020 Semesters 0.999 0.997 0.999 0.998 1.000 1.003 0.999 1.015 1.001 1.00010 Semesters 1.009 0.984 1.001 0.999 0.999 1.002 0.999 0.997 0.999 1.001 1.000 1.000 1.000 1.000 1.000 1.000 1.000 1.000 1.000 1.0006 Semester 0.973 0.990 1.002 0.999 0.999 1.003 0.997 0.997 0.998 1.001 0.999 1.000 1.000 1.000 1.000 1.000 1.000 1.000 1.000 1.000 1.000 1.000 1.000 1.0004 Semester 0.977 0.978 1.001 0.998 0.998 1.004 1.000 1.000 0.997 1.002 0.999 1.000 1.000 0.999 1.000 1.000 1.000 1.000 1.000 1.000 1.000 1.000 1.000 1.000 1.000 1.0002 Semester 1.035 1.006 1.015 1.000 1.000 1.000 1.000 1.000 0.995 1.000 0.998 1.000 1.000 1.000 1.000 1.000 1.000 1.000 1.000 1.000 1.000 1.000 1.000 1.000 1.000 1.000 1.000 1.000Last 4 Semesters ending in 12 1.028 0.987 1.000Last 4 Semesters ending in 6 0.953 1.006 1.002
SelectedAge To Age 0.999 0.997 0.999 0.998 1.000 1.000 1.000 1.000 1.000 1.000 1.000 1.000 1.000 1.000 1.000 1.000 1.000 1.000 1.000 1.000 1.000 1.000 1.000 1.000 1.000 1.000 1.000 1.000 1.000 1.000Age to Ultimate 0.993 0.994 0.997 0.998 1.000 1.000 1.000 1.000 1.000 1.000 1.000 1.000 1.000 1.000 1.000 1.000 1.000 1.000 1.000 1.000 1.000 1.000 1.000 1.000 1.000 1.000 1.000 1.000 1.000 1.000
Exhibit 2 Page 28
93
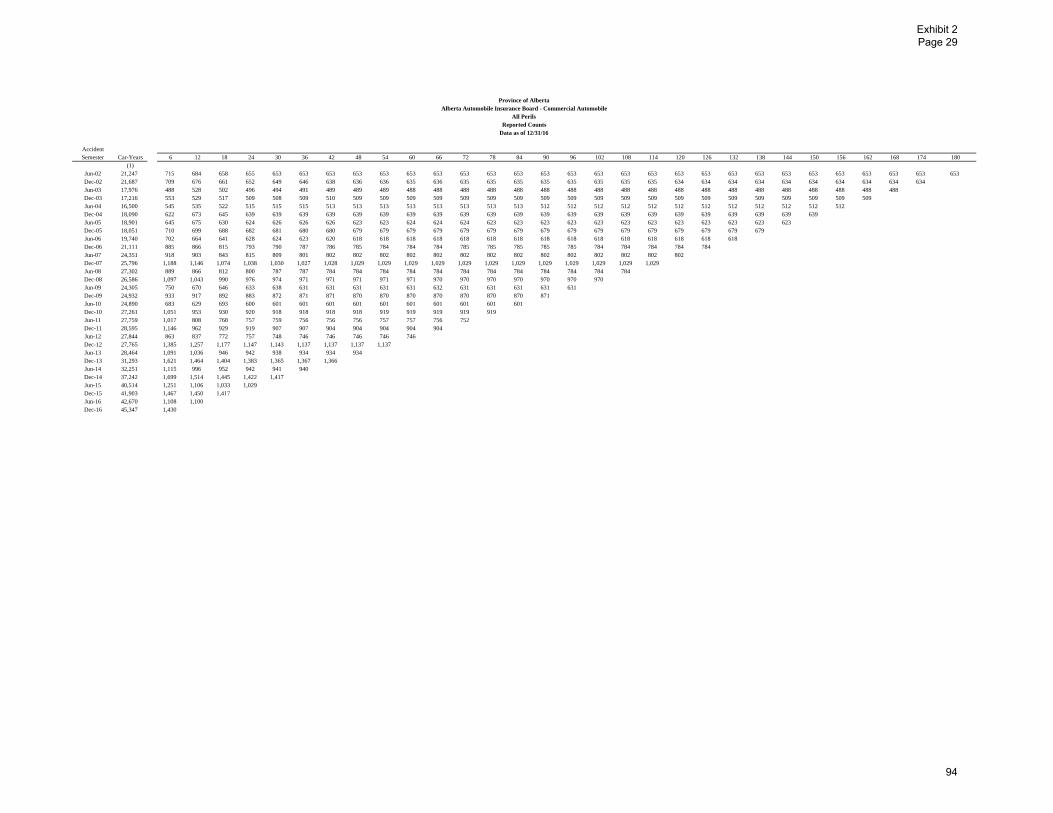
Province of AlbertaAlberta Automobile Insurance Board - Commercial Automobile
All PerilsReported Counts
Data as of 12/31/16
AccidentSemester Car-Years 6 12 18 24 30 36 42 48 54 60 66 72 78 84 90 96 102 108 114 120 126 132 138 144 150 156 162 168 174 180
(1)Jun-02 21,247 715 684 658 655 653 653 653 653 653 653 653 653 653 653 653 653 653 653 653 653 653 653 653 653 653 653 653 653 653 653Dec-02 21,687 709 676 661 652 649 646 638 636 636 635 636 635 635 635 635 635 635 635 635 634 634 634 634 634 634 634 634 634 634Jun-03 17,976 488 528 502 496 494 491 489 489 489 488 488 488 488 488 488 488 488 488 488 488 488 488 488 488 488 488 488 488Dec-03 17,216 553 529 517 509 508 509 510 509 509 509 509 509 509 509 509 509 509 509 509 509 509 509 509 509 509 509 509Jun-04 16,500 545 535 522 515 515 515 513 513 513 513 513 513 513 513 512 512 512 512 512 512 512 512 512 512 512 512Dec-04 18,090 622 673 645 639 639 639 639 639 639 639 639 639 639 639 639 639 639 639 639 639 639 639 639 639 639Jun-05 18,901 645 675 630 624 626 626 626 623 623 624 624 624 623 623 623 623 623 623 623 623 623 623 623 623Dec-05 18,051 710 699 688 682 681 680 680 679 679 679 679 679 679 679 679 679 679 679 679 679 679 679 679Jun-06 19,740 702 664 641 628 624 623 620 618 618 618 618 618 618 618 618 618 618 618 618 618 618 618Dec-06 21,111 885 866 815 793 790 787 786 785 784 784 784 785 785 785 785 785 784 784 784 784 784Jun-07 24,351 918 903 843 815 809 801 802 802 802 802 802 802 802 802 802 802 802 802 802 802Dec-07 25,796 1,188 1,146 1,074 1,038 1,030 1,027 1,028 1,029 1,029 1,029 1,029 1,029 1,029 1,029 1,029 1,029 1,029 1,029 1,029Jun-08 27,302 889 866 812 800 787 787 784 784 784 784 784 784 784 784 784 784 784 784Dec-08 26,586 1,097 1,043 990 976 974 971 971 971 971 971 970 970 970 970 970 970 970Jun-09 24,305 750 670 646 633 638 631 631 631 631 631 632 631 631 631 631 631Dec-09 24,932 933 917 892 883 872 871 871 870 870 870 870 870 870 870 871Jun-10 24,890 683 629 693 600 601 601 601 601 601 601 601 601 601 601Dec-10 27,261 1,051 953 930 920 918 918 918 918 919 919 919 919 919Jun-11 27,759 1,017 808 768 757 759 756 756 756 757 757 756 752Dec-11 28,595 1,146 962 929 919 907 907 904 904 904 904 904Jun-12 27,844 863 837 772 757 748 746 746 746 746 746Dec-12 27,765 1,385 1,257 1,177 1,147 1,143 1,137 1,137 1,137 1,137Jun-13 28,464 1,091 1,036 946 942 938 934 934 934Dec-13 31,293 1,621 1,464 1,404 1,383 1,365 1,367 1,366Jun-14 32,251 1,115 996 952 942 941 940Dec-14 37,242 1,699 1,514 1,445 1,422 1,417Jun-15 40,514 1,251 1,106 1,033 1,029Dec-15 41,903 1,467 1,450 1,417Jun-16 42,670 1,108 1,100Dec-16 45,347 1,430
Exhibit 2 Page 29
94
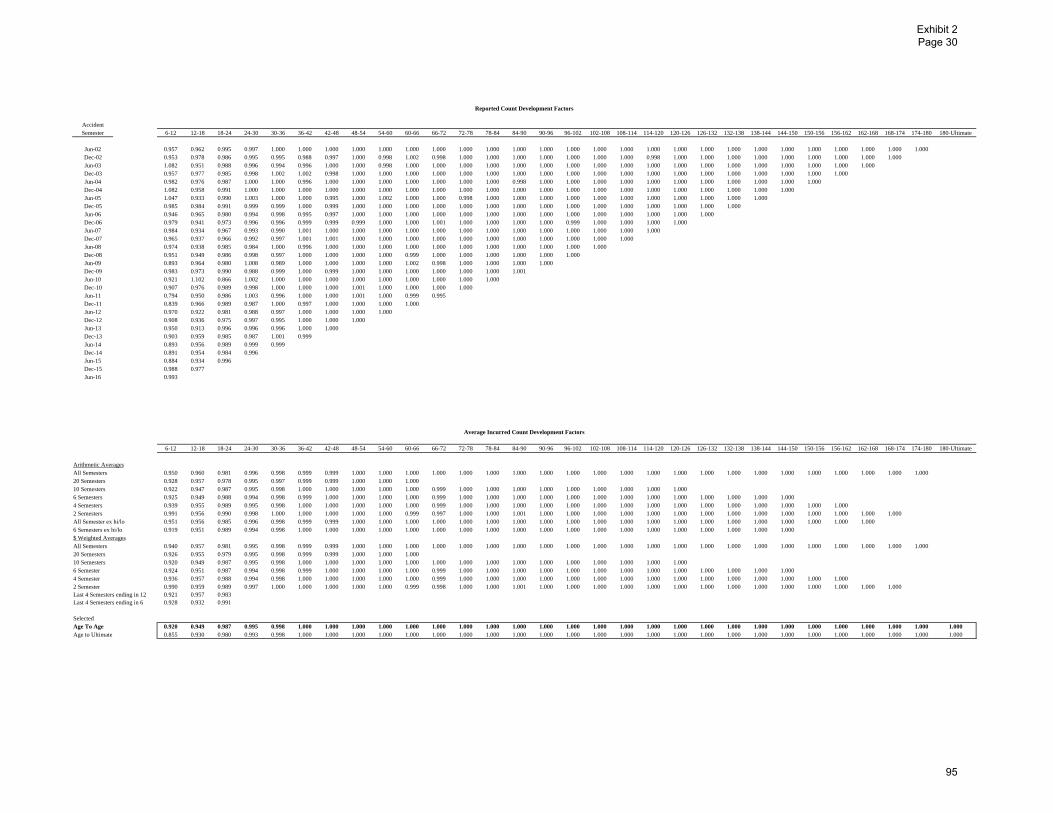
Reported Count Development Factors
AccidentSemester 6-12 12-18 18-24 24-30 30-36 36-42 42-48 48-54 54-60 60-66 66-72 72-78 78-84 84-90 90-96 96-102 102-108 108-114 114-120 120-126 126-132 132-138 138-144 144-150 150-156 156-162 162-168 168-174 174-180 180-Ultimate
Jun-02 0.957 0.962 0.995 0.997 1.000 1.000 1.000 1.000 1.000 1.000 1.000 1.000 1.000 1.000 1.000 1.000 1.000 1.000 1.000 1.000 1.000 1.000 1.000 1.000 1.000 1.000 1.000 1.000 1.000Dec-02 0.953 0.978 0.986 0.995 0.995 0.988 0.997 1.000 0.998 1.002 0.998 1.000 1.000 1.000 1.000 1.000 1.000 1.000 0.998 1.000 1.000 1.000 1.000 1.000 1.000 1.000 1.000 1.000Jun-03 1.082 0.951 0.988 0.996 0.994 0.996 1.000 1.000 0.998 1.000 1.000 1.000 1.000 1.000 1.000 1.000 1.000 1.000 1.000 1.000 1.000 1.000 1.000 1.000 1.000 1.000 1.000Dec-03 0.957 0.977 0.985 0.998 1.002 1.002 0.998 1.000 1.000 1.000 1.000 1.000 1.000 1.000 1.000 1.000 1.000 1.000 1.000 1.000 1.000 1.000 1.000 1.000 1.000 1.000Jun-04 0.982 0.976 0.987 1.000 1.000 0.996 1.000 1.000 1.000 1.000 1.000 1.000 1.000 0.998 1.000 1.000 1.000 1.000 1.000 1.000 1.000 1.000 1.000 1.000 1.000Dec-04 1.082 0.958 0.991 1.000 1.000 1.000 1.000 1.000 1.000 1.000 1.000 1.000 1.000 1.000 1.000 1.000 1.000 1.000 1.000 1.000 1.000 1.000 1.000 1.000Jun-05 1.047 0.933 0.990 1.003 1.000 1.000 0.995 1.000 1.002 1.000 1.000 0.998 1.000 1.000 1.000 1.000 1.000 1.000 1.000 1.000 1.000 1.000 1.000Dec-05 0.985 0.984 0.991 0.999 0.999 1.000 0.999 1.000 1.000 1.000 1.000 1.000 1.000 1.000 1.000 1.000 1.000 1.000 1.000 1.000 1.000 1.000Jun-06 0.946 0.965 0.980 0.994 0.998 0.995 0.997 1.000 1.000 1.000 1.000 1.000 1.000 1.000 1.000 1.000 1.000 1.000 1.000 1.000 1.000Dec-06 0.979 0.941 0.973 0.996 0.996 0.999 0.999 0.999 1.000 1.000 1.001 1.000 1.000 1.000 1.000 0.999 1.000 1.000 1.000 1.000Jun-07 0.984 0.934 0.967 0.993 0.990 1.001 1.000 1.000 1.000 1.000 1.000 1.000 1.000 1.000 1.000 1.000 1.000 1.000 1.000Dec-07 0.965 0.937 0.966 0.992 0.997 1.001 1.001 1.000 1.000 1.000 1.000 1.000 1.000 1.000 1.000 1.000 1.000 1.000Jun-08 0.974 0.938 0.985 0.984 1.000 0.996 1.000 1.000 1.000 1.000 1.000 1.000 1.000 1.000 1.000 1.000 1.000Dec-08 0.951 0.949 0.986 0.998 0.997 1.000 1.000 1.000 1.000 0.999 1.000 1.000 1.000 1.000 1.000 1.000Jun-09 0.893 0.964 0.980 1.008 0.989 1.000 1.000 1.000 1.000 1.002 0.998 1.000 1.000 1.000 1.000Dec-09 0.983 0.973 0.990 0.988 0.999 1.000 0.999 1.000 1.000 1.000 1.000 1.000 1.000 1.001Jun-10 0.921 1.102 0.866 1.002 1.000 1.000 1.000 1.000 1.000 1.000 1.000 1.000 1.000Dec-10 0.907 0.976 0.989 0.998 1.000 1.000 1.000 1.001 1.000 1.000 1.000 1.000Jun-11 0.794 0.950 0.986 1.003 0.996 1.000 1.000 1.001 1.000 0.999 0.995Dec-11 0.839 0.966 0.989 0.987 1.000 0.997 1.000 1.000 1.000 1.000Jun-12 0.970 0.922 0.981 0.988 0.997 1.000 1.000 1.000 1.000Dec-12 0.908 0.936 0.975 0.997 0.995 1.000 1.000 1.000Jun-13 0.950 0.913 0.996 0.996 0.996 1.000 1.000Dec-13 0.903 0.959 0.985 0.987 1.001 0.999Jun-14 0.893 0.956 0.989 0.999 0.999Dec-14 0.891 0.954 0.984 0.996Jun-15 0.884 0.934 0.996Dec-15 0.988 0.977Jun-16 0.993
Average Incurred Count Development Factors
6-12 12-18 18-24 24-30 30-36 36-42 42-48 48-54 54-60 60-66 66-72 72-78 78-84 84-90 90-96 96-102 102-108 108-114 114-120 120-126 126-132 132-138 138-144 144-150 150-156 156-162 162-168 168-174 174-180 180-Ultimate
Arithmetic AveragesAll Semesters 0.950 0.960 0.981 0.996 0.998 0.999 0.999 1.000 1.000 1.000 1.000 1.000 1.000 1.000 1.000 1.000 1.000 1.000 1.000 1.000 1.000 1.000 1.000 1.000 1.000 1.000 1.000 1.000 1.00020 Semesters 0.928 0.957 0.978 0.995 0.997 0.999 0.999 1.000 1.000 1.00010 Semesters 0.922 0.947 0.987 0.995 0.998 1.000 1.000 1.000 1.000 1.000 0.999 1.000 1.000 1.000 1.000 1.000 1.000 1.000 1.000 1.0006 Semesters 0.925 0.949 0.988 0.994 0.998 0.999 1.000 1.000 1.000 1.000 0.999 1.000 1.000 1.000 1.000 1.000 1.000 1.000 1.000 1.000 1.000 1.000 1.000 1.0004 Semesters 0.939 0.955 0.989 0.995 0.998 1.000 1.000 1.000 1.000 1.000 0.999 1.000 1.000 1.000 1.000 1.000 1.000 1.000 1.000 1.000 1.000 1.000 1.000 1.000 1.000 1.0002 Semesters 0.991 0.956 0.990 0.998 1.000 1.000 1.000 1.000 1.000 0.999 0.997 1.000 1.000 1.001 1.000 1.000 1.000 1.000 1.000 1.000 1.000 1.000 1.000 1.000 1.000 1.000 1.000 1.000All Semester ex hi/lo 0.951 0.956 0.985 0.996 0.998 0.999 0.999 1.000 1.000 1.000 1.000 1.000 1.000 1.000 1.000 1.000 1.000 1.000 1.000 1.000 1.000 1.000 1.000 1.000 1.000 1.000 1.0006 Semesters ex hi/lo 0.919 0.951 0.989 0.994 0.998 1.000 1.000 1.000 1.000 1.000 1.000 1.000 1.000 1.000 1.000 1.000 1.000 1.000 1.000 1.000 1.000 1.000 1.000 1.000$ Weighted AveragesAll Semesters 0.940 0.957 0.981 0.995 0.998 0.999 0.999 1.000 1.000 1.000 1.000 1.000 1.000 1.000 1.000 1.000 1.000 1.000 1.000 1.000 1.000 1.000 1.000 1.000 1.000 1.000 1.000 1.000 1.00020 Semesters 0.926 0.955 0.979 0.995 0.998 0.999 0.999 1.000 1.000 1.00010 Semesters 0.920 0.949 0.987 0.995 0.998 1.000 1.000 1.000 1.000 1.000 1.000 1.000 1.000 1.000 1.000 1.000 1.000 1.000 1.000 1.0006 Semester 0.924 0.951 0.987 0.994 0.998 0.999 1.000 1.000 1.000 1.000 0.999 1.000 1.000 1.000 1.000 1.000 1.000 1.000 1.000 1.000 1.000 1.000 1.000 1.0004 Semester 0.936 0.957 0.988 0.994 0.998 1.000 1.000 1.000 1.000 1.000 0.999 1.000 1.000 1.000 1.000 1.000 1.000 1.000 1.000 1.000 1.000 1.000 1.000 1.000 1.000 1.0002 Semester 0.990 0.959 0.989 0.997 1.000 1.000 1.000 1.000 1.000 0.999 0.998 1.000 1.000 1.001 1.000 1.000 1.000 1.000 1.000 1.000 1.000 1.000 1.000 1.000 1.000 1.000 1.000 1.000Last 4 Semesters ending in 12 0.921 0.957 0.983Last 4 Semesters ending in 6 0.928 0.932 0.991
SelectedAge To Age 0.920 0.949 0.987 0.995 0.998 1.000 1.000 1.000 1.000 1.000 1.000 1.000 1.000 1.000 1.000 1.000 1.000 1.000 1.000 1.000 1.000 1.000 1.000 1.000 1.000 1.000 1.000 1.000 1.000 1.000Age to Ultimate 0.855 0.930 0.980 0.993 0.998 1.000 1.000 1.000 1.000 1.000 1.000 1.000 1.000 1.000 1.000 1.000 1.000 1.000 1.000 1.000 1.000 1.000 1.000 1.000 1.000 1.000 1.000 1.000 1.000 1.000
Exhibit 2 Page 30
95

Province of AlbertaAlberta Automobile Insurance Board - Commercial Automobile
All PerilsIncurred Losses
Data as of 12/31/16Losses in $ 000s
AccidentSemester Car-Years 6 12 18 24 30 36 42 48 54 60 66 72 78 84 90 96 102 108 114 120 126 132 138 144 150 156 162 168 174 180
(1)Jun-02 21,247 6,252 6,255 5,970 5,902 5,915 5,920 5,852 5,851 5,850 5,850 5,852 5,829 5,830 5,830 5,830 5,830 5,830 5,830 5,830 5,830 5,830 5,830 5,830 5,830 5,830 5,830 5,830 5,830 5,830 5,830Dec-02 21,687 8,207 8,660 8,576 8,436 8,416 8,275 8,152 8,093 8,093 8,073 8,074 8,074 8,074 8,074 8,074 8,074 8,074 8,074 8,074 8,029 8,029 8,029 8,029 8,029 8,029 8,029 8,029 8,029 8,029Jun-03 17,976 5,914 6,166 6,039 5,984 5,923 5,909 5,911 5,915 5,915 5,901 5,901 5,901 5,901 5,901 5,901 5,901 5,901 5,901 5,901 5,901 5,901 5,901 5,901 5,901 5,901 5,901 5,901 5,901Dec-03 17,216 6,884 7,072 6,827 6,762 6,369 5,969 6,106 6,095 6,130 6,091 6,101 6,100 6,100 6,086 6,086 6,086 6,085 6,085 6,085 6,085 6,085 6,085 6,085 6,085 6,085 6,085 6,085Jun-04 16,500 6,724 6,903 6,576 6,461 6,459 6,320 6,311 6,315 6,316 6,316 6,316 6,315 6,315 6,318 6,296 6,254 6,254 6,254 6,254 6,254 6,254 6,254 6,254 6,254 6,254 6,254Dec-04 18,090 7,077 7,738 7,419 7,419 7,396 7,396 7,396 7,394 7,394 7,394 7,394 7,394 7,394 7,394 7,394 7,394 7,394 7,394 7,369 7,369 7,369 7,369 7,369 7,369 7,369Jun-05 18,901 7,845 8,330 8,131 7,973 7,947 7,954 7,960 7,968 7,969 7,996 8,013 7,882 7,877 7,877 7,877 7,877 7,877 7,877 7,877 7,877 7,877 7,830 7,830 7,830Dec-05 18,051 9,502 10,830 10,661 10,387 10,316 10,269 10,267 10,274 10,246 10,243 10,243 10,230 9,950 9,950 9,950 9,960 9,960 9,960 9,960 9,960 9,960 9,960 9,960Jun-06 19,740 10,883 11,607 11,238 11,101 10,928 10,911 10,855 10,861 10,819 10,813 10,813 10,813 10,812 10,810 10,810 10,810 10,809 10,808 10,807 10,806 10,806 10,805Dec-06 21,111 12,476 14,539 13,731 13,394 13,305 13,260 13,252 13,246 13,222 13,222 13,181 13,183 13,183 13,183 13,183 13,183 13,180 13,180 13,180 13,180 13,180Jun-07 24,351 11,799 12,705 12,187 11,678 11,442 11,406 11,259 11,282 11,279 11,257 11,261 11,260 11,260 11,259 11,259 11,259 11,259 11,259 11,259 11,259Dec-07 25,796 15,073 16,128 15,578 14,750 14,447 14,443 14,428 14,431 14,417 14,419 14,420 14,405 14,405 14,405 14,405 14,396 14,396 14,396 14,396Jun-08 27,302 12,760 14,416 13,592 13,371 13,273 13,300 13,328 13,300 13,299 13,302 13,156 13,127 13,136 13,136 13,140 13,146 13,148 13,186Dec-08 26,586 16,924 17,431 16,889 16,742 16,574 16,138 16,061 16,068 16,074 16,074 16,052 16,048 16,048 16,048 16,048 16,048 16,048Jun-09 24,305 10,259 10,133 9,470 9,447 9,404 9,417 9,410 9,405 9,268 9,268 9,270 9,262 9,262 9,259 9,259 9,259Dec-09 24,932 11,434 12,089 11,383 11,111 11,044 11,028 11,035 10,961 10,936 10,962 11,011 11,010 11,008 11,008 11,003Jun-10 24,890 9,589 9,003 8,702 8,508 8,502 8,462 8,475 8,506 8,506 8,506 8,506 8,506 8,510 8,558Dec-10 27,261 13,677 14,141 13,122 12,963 12,764 12,697 12,682 12,723 12,729 12,713 12,720 12,689 12,688Jun-11 27,759 14,170 13,901 13,042 12,979 12,883 12,914 12,933 12,956 12,957 12,956 12,943 12,941Dec-11 28,595 17,123 19,333 18,748 18,433 18,174 18,105 18,070 18,070 17,949 17,951 17,951Jun-12 27,844 12,667 14,933 14,300 14,118 13,976 14,050 14,050 14,071 14,072 14,034Dec-12 27,765 17,807 20,832 19,794 19,214 19,153 19,093 19,068 19,070 19,070Jun-13 28,464 15,226 18,423 17,533 17,317 17,238 17,097 17,081 16,951Dec-13 31,293 22,024 27,084 25,541 24,957 24,412 24,445 24,455Jun-14 32,251 18,325 20,537 19,468 18,849 18,688 18,546Dec-14 37,242 24,881 30,354 29,037 28,369 28,231Jun-15 40,514 22,466 23,649 22,730 22,661Dec-15 41,903 21,747 23,708 23,144Jun-16 42,670 15,904 18,131Dec-16 45,347 20,111
Exhibit 2 Page 31
96

Incurred Loss Development Factors
AccidentSemester 6-12 12-18 18-24 24-30 30-36 36-42 42-48 48-54 54-60 60-66 66-72 72-78 78-84 84-90 90-96 96-102 102-108 108-114 114-120 120-126 126-132 132-138 138-144 144-150 150-156 156-162 162-168 168-174 174-180 180-Ultimate
Jun-02 1.000 0.955 0.989 1.002 1.001 0.988 1.000 1.000 1.000 1.000 0.996 1.000 1.000 1.000 1.000 1.000 1.000 1.000 1.000 1.000 1.000 1.000 1.000 1.000 1.000 1.000 1.000 1.000 1.000Dec-02 1.055 0.990 0.984 0.998 0.983 0.985 0.993 1.000 0.997 1.000 1.000 1.000 1.000 1.000 1.000 1.000 1.000 1.000 0.994 1.000 1.000 1.000 1.000 1.000 1.000 1.000 1.000 1.000Jun-03 1.043 0.979 0.991 0.990 0.998 1.000 1.001 1.000 0.998 1.000 1.000 1.000 1.000 1.000 1.000 1.000 1.000 1.000 1.000 1.000 1.000 1.000 1.000 1.000 1.000 1.000 1.000Dec-03 1.027 0.965 0.991 0.942 0.937 1.023 0.998 1.006 0.994 1.002 1.000 1.000 0.998 1.000 1.000 1.000 1.000 1.000 1.000 1.000 1.000 1.000 1.000 1.000 1.000 1.000Jun-04 1.027 0.953 0.982 1.000 0.979 0.999 1.001 1.000 1.000 1.000 1.000 1.000 1.000 0.997 0.993 1.000 1.000 1.000 1.000 1.000 1.000 1.000 1.000 1.000 1.000Dec-04 1.094 0.959 1.000 0.997 1.000 1.000 1.000 1.000 1.000 1.000 1.000 1.000 1.000 1.000 1.000 1.000 1.000 0.997 1.000 1.000 1.000 1.000 1.000 1.000Jun-05 1.062 0.976 0.981 0.997 1.001 1.001 1.001 1.000 1.003 1.002 0.984 0.999 1.000 1.000 1.000 1.000 1.000 1.000 1.000 1.000 0.994 1.000 1.000Dec-05 1.140 0.984 0.974 0.993 0.996 1.000 1.001 0.997 1.000 1.000 0.999 0.973 1.000 1.000 1.001 1.000 1.000 1.000 1.000 1.000 1.000 1.000Jun-06 1.067 0.968 0.988 0.984 0.998 0.995 1.001 0.996 0.999 1.000 1.000 1.000 1.000 1.000 1.000 1.000 1.000 1.000 1.000 1.000 1.000Dec-06 1.165 0.944 0.976 0.993 0.997 0.999 1.000 0.998 1.000 0.997 1.000 1.000 1.000 1.000 1.000 1.000 1.000 1.000 1.000 1.000Jun-07 1.077 0.959 0.958 0.980 0.997 0.987 1.002 1.000 0.998 1.000 1.000 1.000 1.000 1.000 1.000 1.000 1.000 1.000 1.000Dec-07 1.070 0.966 0.947 0.979 1.000 0.999 1.000 0.999 1.000 1.000 0.999 1.000 1.000 1.000 0.999 1.000 1.000 1.000Jun-08 1.130 0.943 0.984 0.993 1.002 1.002 0.998 1.000 1.000 0.989 0.998 1.001 1.000 1.000 1.000 1.000 1.003Dec-08 1.030 0.969 0.991 0.990 0.974 0.995 1.000 1.000 1.000 0.999 1.000 1.000 1.000 1.000 1.000 1.000Jun-09 0.988 0.935 0.998 0.996 1.001 0.999 0.999 0.985 1.000 1.000 0.999 1.000 1.000 1.000 1.000Dec-09 1.057 0.942 0.976 0.994 0.999 1.001 0.993 0.998 1.002 1.004 1.000 1.000 1.000 1.000Jun-10 0.939 0.967 0.978 0.999 0.995 1.002 1.004 1.000 1.000 1.000 1.000 1.000 1.006Dec-10 1.034 0.928 0.988 0.985 0.995 0.999 1.003 1.001 0.999 1.001 0.998 1.000Jun-11 0.981 0.938 0.995 0.993 1.002 1.001 1.002 1.000 1.000 0.999 1.000Dec-11 1.129 0.970 0.983 0.986 0.996 0.998 1.000 0.993 1.000 1.000Jun-12 1.179 0.958 0.987 0.990 1.005 1.000 1.001 1.000 0.997Dec-12 1.170 0.950 0.971 0.997 0.997 0.999 1.000 1.000Jun-13 1.210 0.952 0.988 0.995 0.992 0.999 0.992Dec-13 1.230 0.943 0.977 0.978 1.001 1.000Jun-14 1.121 0.948 0.968 0.991 0.992Dec-14 1.220 0.957 0.977 0.995Jun-15 1.053 0.961 0.997Dec-15 1.090 0.976Jun-16 1.140
Average Incurred Loss Development Factors
6-12 12-18 18-24 24-30 30-36 36-42 42-48 48-54 54-60 60-66 66-72 72-78 78-84 84-90 90-96 96-102 102-108 108-114 114-120 120-126 126-132 132-138 138-144 144-150 150-156 156-162 162-168 168-174 174-180 180-Ultimate
Arithmetic AveragesAll Semesters 1.087 0.958 0.982 0.990 0.993 0.999 1.000 0.999 0.999 1.000 0.999 0.999 1.000 1.000 1.000 1.000 1.000 1.000 0.999 1.000 0.999 1.000 1.000 1.000 1.000 1.000 1.000 1.000 1.00020 Semesters 1.101 0.954 0.980 0.990 0.997 0.999 1.000 0.999 0.999 1.00010 Semesters 1.154 0.955 0.983 0.991 0.998 1.000 1.000 0.998 1.000 0.999 0.999 1.000 1.001 1.000 1.000 1.000 1.000 1.000 0.999 1.0006 Semesters 1.142 0.956 0.980 0.991 0.997 1.000 1.000 0.999 1.000 1.001 0.999 1.000 1.001 1.000 1.000 1.000 1.000 1.000 1.000 1.000 0.999 1.000 1.000 1.0004 Semesters 1.126 0.960 0.980 0.990 0.996 1.000 0.998 0.998 0.999 1.000 0.999 1.000 1.001 1.000 1.000 1.000 1.001 1.000 1.000 1.000 0.998 1.000 1.000 1.000 1.000 1.0002 Semesters 1.115 0.969 0.987 0.993 0.997 1.000 0.996 1.000 0.999 1.000 0.999 1.000 1.003 1.000 1.000 1.000 1.001 1.000 1.000 1.000 1.000 1.000 1.000 1.000 1.000 1.000 1.000 1.000All Semester ex hi/lo 1.087 0.958 0.983 0.991 0.995 0.998 1.000 0.999 1.000 1.000 0.999 1.000 1.000 1.000 1.000 1.000 1.000 1.000 1.000 1.000 1.000 1.000 1.000 1.000 1.000 1.000 1.0006 Semesters ex hi/lo 1.143 0.954 0.978 0.993 0.997 1.000 1.001 1.000 1.000 1.000 1.000 1.000 1.000 1.000 1.000 1.000 1.000 1.000 1.000 1.000 1.000 1.000 1.000 1.000$ Weighted AveragesAll Semesters 1.102 0.957 0.981 0.990 0.995 0.999 0.999 0.999 1.000 0.999 0.999 0.998 1.000 1.000 1.000 1.000 1.000 1.000 0.999 1.000 0.999 1.000 1.000 1.000 1.000 1.000 1.000 1.000 1.00020 Semesters 1.111 0.954 0.980 0.990 0.997 0.999 1.000 0.999 1.000 0.99910 Semesters 1.153 0.956 0.982 0.990 0.997 1.000 0.999 0.998 1.000 0.999 0.999 1.000 1.000 1.000 1.000 1.000 1.000 1.000 0.999 1.0006 Semester 1.145 0.956 0.980 0.991 0.997 1.000 1.000 0.999 1.000 1.001 0.999 1.000 1.001 1.000 1.000 1.000 1.001 1.000 1.000 1.000 0.999 1.000 1.000 1.0004 Semester 1.128 0.961 0.980 0.990 0.996 1.000 0.998 0.998 0.999 1.000 0.999 1.000 1.001 1.000 1.000 1.000 1.001 1.000 1.000 1.000 0.999 1.000 1.000 1.000 1.000 1.0002 Semester 1.111 0.969 0.986 0.994 0.997 1.000 0.996 1.000 0.999 1.000 0.999 1.000 1.002 1.000 1.000 1.000 1.001 1.000 1.000 1.000 1.000 1.000 1.000 1.000 1.000 1.000 1.000 1.000Last 4 Semesters ending in 12 1.179 0.956 0.977Last 4 Semesters ending in 6 1.123 0.955 0.985
SelectedAge To Age 1.153 0.956 0.982 0.990 0.997 1.000 1.000 1.000 1.000 1.000 1.000 1.000 1.000 1.000 1.000 1.000 1.000 1.000 1.000 1.000 1.000 1.000 1.000 1.000 1.000 1.000 1.000 1.000 1.000 1.000Age to Ultimate 1.069 0.927 0.970 0.988 0.997 1.000 1.000 1.000 1.000 1.000 1.000 1.000 1.000 1.000 1.000 1.000 1.000 1.000 1.000 1.000 1.000 1.000 1.000 1.000 1.000 1.000 1.000 1.000 1.000 1.000
Exhibit 2 Page 32
97
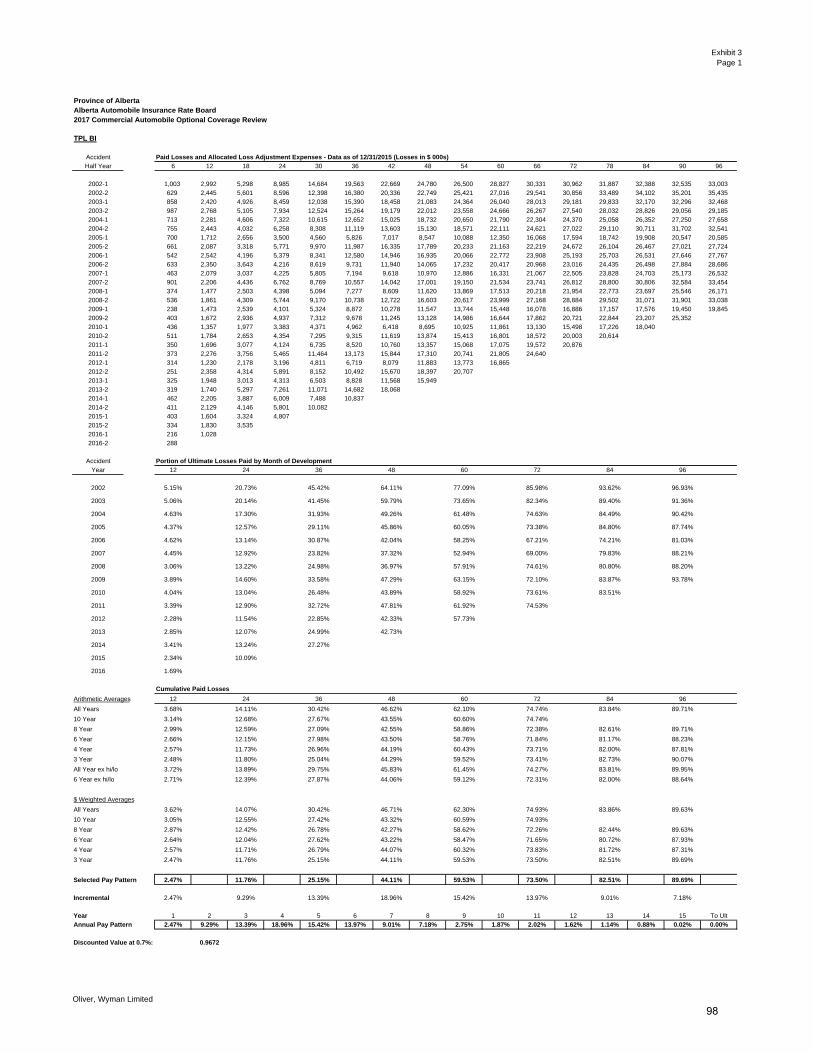
Exhibit 3Page 1
Province of AlbertaAlberta Automobile Insurance Rate Board2017 Commercial Automobile Optional Coverage Review
TPL BI
Accident Paid Losses and Allocated Loss Adjustment Expenses - Data as of 12/31/2015 (Losses in $ 000s)
Half Year 6 12 18 24 30 36 42 48 54 60 66 72 78 84 90 96
2002-1 1,003 2,992 5,298 8,985 14,684 19,563 22,669 24,780 26,500 28,827 30,331 30,962 31,887 32,388 32,535 33,003
2002-2 629 2,445 5,601 8,596 12,398 16,380 20,336 22,749 25,421 27,016 29,541 30,856 33,489 34,102 35,201 35,435
2003-1 858 2,420 4,926 8,459 12,038 15,390 18,458 21,083 24,364 26,040 28,013 29,181 29,833 32,170 32,296 32,468
2003-2 987 2,768 5,105 7,934 12,524 15,264 19,179 22,012 23,558 24,666 26,267 27,540 28,032 28,826 29,056 29,185
2004-1 713 2,281 4,606 7,322 10,615 12,652 15,025 18,732 20,650 21,790 22,304 24,370 25,058 26,352 27,250 27,658
2004-2 755 2,443 4,032 6,258 8,308 11,119 13,603 15,130 18,571 22,111 24,621 27,022 29,110 30,711 31,702 32,541
2005-1 700 1,712 2,656 3,500 4,560 5,826 7,017 8,547 10,088 12,350 16,068 17,594 18,742 19,908 20,547 20,585
2005-2 661 2,087 3,318 5,771 9,970 11,987 16,335 17,789 20,233 21,163 22,219 24,672 26,104 26,467 27,021 27,724
2006-1 542 2,542 4,196 5,379 8,341 12,580 14,946 16,935 20,066 22,772 23,908 25,193 25,703 26,531 27,646 27,767
2006-2 633 2,350 3,643 4,216 8,619 9,731 11,940 14,065 17,232 20,417 20,968 23,016 24,435 26,498 27,884 28,686
2007-1 463 2,079 3,037 4,225 5,805 7,194 9,618 10,970 12,886 16,331 21,067 22,505 23,828 24,703 25,173 26,532
2007-2 901 2,206 4,436 6,762 8,769 10,557 14,042 17,001 19,150 21,534 23,741 26,812 28,800 30,806 32,584 33,454
2008-1 374 1,477 2,503 4,398 5,094 7,277 8,609 11,620 13,869 17,513 20,218 21,954 22,773 23,697 25,546 26,171
2008-2 536 1,861 4,309 5,744 9,170 10,738 12,722 16,603 20,617 23,999 27,168 28,884 29,502 31,071 31,901 33,038
2009-1 238 1,473 2,539 4,101 5,324 8,872 10,278 11,547 13,744 15,448 16,078 16,886 17,157 17,576 19,450 19,845
2009-2 403 1,672 2,936 4,937 7,312 9,678 11,245 13,128 14,986 16,644 17,862 20,721 22,844 23,207 25,352
2010-1 436 1,357 1,977 3,383 4,371 4,962 6,418 8,695 10,925 11,861 13,130 15,498 17,226 18,040
2010-2 511 1,784 2,653 4,354 7,295 9,315 11,619 13,874 15,413 16,801 18,572 20,003 20,614
2011-1 350 1,696 3,077 4,124 6,735 8,520 10,760 13,357 15,068 17,075 19,572 20,876
2011-2 373 2,276 3,756 5,465 11,464 13,173 15,844 17,310 20,741 21,805 24,640
2012-1 314 1,230 2,178 3,196 4,811 6,719 8,079 11,883 13,773 16,865
2012-2 251 2,358 4,314 5,891 8,152 10,492 15,670 18,397 20,707
2013-1 325 1,948 3,013 4,313 6,503 8,828 11,568 15,949
2013-2 319 1,740 5,297 7,261 11,071 14,682 18,068
2014-1 462 2,205 3,887 6,009 7,488 10,837
2014-2 411 2,129 4,146 5,801 10,082
2015-1 403 1,604 3,324 4,807
2015-2 334 1,830 3,535
2016-1 216 1,028
2016-2 288
Accident Portion of Ultimate Losses Paid by Month of Development
Year 12 24 36 48 60 72 84 96
FALSE
2002 TRUE 5.15% 20.73% 45.42% 64.11% 77.09% 85.98% 93.62% 96.93%FALSE
2003 TRUE 5.06% 20.14% 41.45% 59.79% 73.65% 82.34% 89.40% 91.36%FALSE
2004 TRUE 4.63% 17.30% 31.93% 49.26% 61.48% 74.63% 84.49% 90.42%FALSE
2005 TRUE 4.37% 12.57% 29.11% 45.86% 60.05% 73.38% 84.80% 87.74%FALSE
2006 TRUE 4.62% 13.14% 30.87% 42.04% 58.25% 67.21% 74.21% 81.03%FALSE
2007 TRUE 4.45% 12.92% 23.82% 37.32% 52.94% 69.00% 79.83% 88.21%FALSE
2008 TRUE 3.06% 13.22% 24.98% 36.97% 57.91% 74.61% 80.80% 88.20%FALSE
2009 TRUE 3.89% 14.60% 33.58% 47.29% 63.15% 72.10% 83.87% 93.78%FALSE
2010 TRUE 4.04% 13.04% 26.48% 43.89% 58.92% 73.61% 83.51%FALSE
2011 TRUE 3.39% 12.90% 32.72% 47.81% 61.92% 74.53%FALSE
2012 TRUE 2.28% 11.54% 22.85% 42.33% 57.73%FALSE
2013 TRUE 2.85% 12.07% 24.99% 42.73%FALSE
2014 TRUE 3.41% 13.24% 27.27%FALSE
2015 TRUE 2.34% 10.09%FALSE
2016 TRUE 1.69%
TRUE FALSE TRUE FALSE TRUE FALSE TRUE FALSE TRUE FALSE TRUE FALSE TRUE FALSE TRUE FALSE
Cumulative Paid Losses
Arithmetic Averages 12 24 36 48 60 72 84 96
All Years 3.68% 14.11% 30.42% 46.62% 62.10% 74.74% 83.84% 89.71%
10 Year 3.14% 12.68% 27.67% 43.55% 60.60% 74.74%
8 Year 2.99% 12.59% 27.09% 42.55% 58.86% 72.38% 82.61% 89.71%
6 Year 2.66% 12.15% 27.98% 43.50% 58.76% 71.84% 81.17% 88.23%
4 Year 2.57% 11.73% 26.96% 44.19% 60.43% 73.71% 82.00% 87.81%
3 Year 2.48% 11.80% 25.04% 44.29% 59.52% 73.41% 82.73% 90.07%
All Year ex hi/lo 3.72% 13.89% 29.75% 45.83% 61.45% 74.27% 83.81% 89.95%
6 Year ex hi/lo 2.71% 12.39% 27.87% 44.06% 59.12% 72.31% 82.00% 88.64%
$ Weighted Averages
All Years 3.62% 14.07% 30.42% 46.71% 62.30% 74.93% 83.86% 89.63%
10 Year 3.05% 12.55% 27.42% 43.32% 60.59% 74.93%
8 Year 2.87% 12.42% 26.78% 42.27% 58.62% 72.26% 82.44% 89.63%
6 Year 2.64% 12.04% 27.62% 43.22% 58.47% 71.65% 80.72% 87.93%
4 Year 2.57% 11.71% 26.79% 44.07% 60.32% 73.83% 81.72% 87.31%
3 Year 2.47% 11.76% 25.15% 44.11% 59.53% 73.50% 82.51% 89.69%
Selected Pay Pattern 2.47% 11.76% 25.15% 44.11% 59.53% 73.50% 82.51% 89.69%
Incremental 2.47% 9.29% 13.39% 18.96% 15.42% 13.97% 9.01% 7.18%
Year 1 2 3 4 5 6 7 8 9 10 11 12 13 14 15 To Ult
Annual Pay Pattern 2.47% 9.29% 13.39% 18.96% 15.42% 13.97% 9.01% 7.18% 2.75% 1.87% 2.02% 1.62% 1.14% 0.88% 0.02% 0.00%
Discounted Value at 0.7%: 0.9672
Oliver, Wyman Limited
98
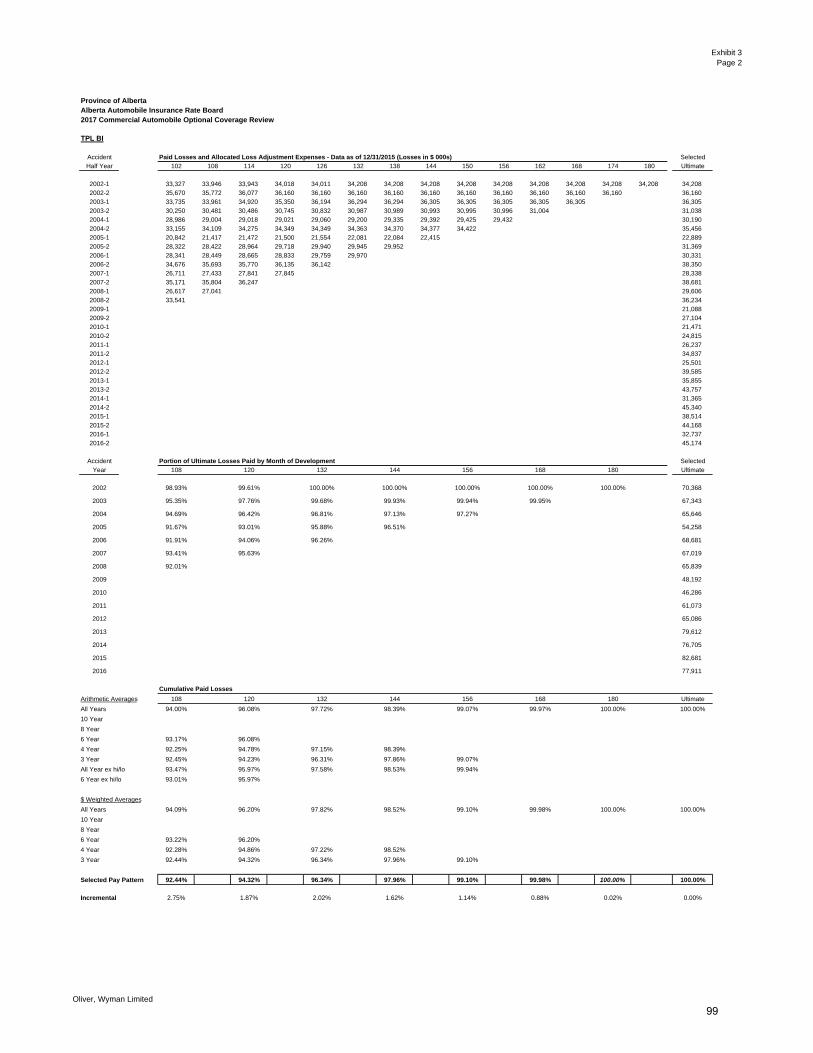
Exhibit 3Page 2
Province of AlbertaAlberta Automobile Insurance Rate Board2017 Commercial Automobile Optional Coverage Review
TPL BI
Accident Paid Losses and Allocated Loss Adjustment Expenses - Data as of 12/31/2015 (Losses in $ 000s) Selected
Half Year 102 108 114 120 126 132 138 144 150 156 162 168 174 180 Ultimate
2002-1 33,327 33,946 33,943 34,018 34,011 34,208 34,208 34,208 34,208 34,208 34,208 34,208 34,208 34,208 34,208
2002-2 35,670 35,772 36,077 36,160 36,160 36,160 36,160 36,160 36,160 36,160 36,160 36,160 36,160 36,160
2003-1 33,735 33,961 34,920 35,350 36,194 36,294 36,294 36,305 36,305 36,305 36,305 36,305 36,305
2003-2 30,250 30,481 30,486 30,745 30,832 30,987 30,989 30,993 30,995 30,996 31,004 31,038
2004-1 28,986 29,004 29,018 29,021 29,060 29,200 29,335 29,392 29,425 29,432 30,190
2004-2 33,155 34,109 34,275 34,349 34,349 34,363 34,370 34,377 34,422 35,456
2005-1 20,842 21,417 21,472 21,500 21,554 22,081 22,084 22,415 22,889
2005-2 28,322 28,422 28,964 29,718 29,940 29,945 29,952 31,369
2006-1 28,341 28,449 28,665 28,833 29,759 29,970 30,331
2006-2 34,676 35,693 35,770 36,135 36,142 38,350
2007-1 26,711 27,433 27,841 27,845 28,338
2007-2 35,171 35,804 36,247 38,681
2008-1 26,617 27,041 29,606
2008-2 33,541 36,234
2009-1 21,088
2009-2 27,104
2010-1 21,471
2010-2 24,815
2011-1 26,237
2011-2 34,837
2012-1 25,501
2012-2 39,585
2013-1 35,855
2013-2 43,757
2014-1 31,365
2014-2 45,340
2015-1 38,514
2015-2 44,168
2016-1 32,737
2016-2 45,174
Accident Portion of Ultimate Losses Paid by Month of Development Selected
Year 108 120 132 144 156 168 180 Ultimate
2002 98.93% 99.61% 100.00% 100.00% 100.00% 100.00% 100.00% 70,368
2003 95.35% 97.76% 99.68% 99.93% 99.94% 99.95% 67,343
2004 94.69% 96.42% 96.81% 97.13% 97.27% 65,646
2005 91.67% 93.01% 95.88% 96.51% 54,258
2006 91.91% 94.06% 96.26% 68,681
2007 93.41% 95.63% 67,019
2008 92.01% 65,839
2009 48,192
2010 46,286
2011 61,073
2012 65,086
2013 79,612
2014 76,705
2015 82,681
2016 77,911
TRUE FALSE TRUE FALSE TRUE FALSE TRUE FALSE TRUE FALSE TRUE FALSE TRUE
Cumulative Paid Losses
Arithmetic Averages 108 120 132 144 156 168 180 Ultimate
All Years 94.00% 96.08% 97.72% 98.39% 99.07% 99.97% 100.00% 100.00%
10 Year
8 Year
6 Year 93.17% 96.08%
4 Year 92.25% 94.78% 97.15% 98.39%
3 Year 92.45% 94.23% 96.31% 97.86% 99.07%
All Year ex hi/lo 93.47% 95.97% 97.58% 98.53% 99.94%
6 Year ex hi/lo 93.01% 95.97%
$ Weighted Averages
All Years 94.09% 96.20% 97.82% 98.52% 99.10% 99.98% 100.00% 100.00%
10 Year
8 Year
6 Year 93.22% 96.20%
4 Year 92.28% 94.86% 97.22% 98.52%
3 Year 92.44% 94.32% 96.34% 97.96% 99.10%
Selected Pay Pattern 92.44% 94.32% 96.34% 97.96% 99.10% 99.98% 100.00% 100.00%
Incremental 2.75% 1.87% 2.02% 1.62% 1.14% 0.88% 0.02% 0.00%
Oliver, Wyman Limited
99

Exhibit 3Page 3
Province of AlbertaAlberta Automobile Insurance Rate Board2017 Commercial Automobile Optional Coverage Review
TPL PD
Accident Paid Losses and Allocated Loss Adjustment Expenses - Data as of 12/31/2015 (Losses in $ 000s)
Half Year 6 12 18 24 30 36 42 48 54 60 66 72 78 84 90 96
2002-1 6,138 11,621 12,874 13,292 13,417 13,471 13,546 13,655 13,638 13,788 13,780 13,782 15,146 15,146 15,148 15,148
2002-2 5,937 12,003 13,188 13,605 13,910 14,055 14,078 14,092 14,105 14,126 14,130 14,152 14,151 14,151 14,151 14,151
2003-1 5,822 11,093 13,250 13,602 13,907 13,918 13,924 13,963 14,009 14,118 14,162 14,161 14,161 14,161 14,163 14,238
2003-2 4,663 10,790 11,829 12,514 12,909 12,947 13,209 13,235 13,402 13,403 13,404 13,403 13,406 13,434 13,435 13,435
2004-1 6,146 11,582 12,927 14,693 14,889 15,268 15,312 15,350 15,365 15,376 15,383 15,382 15,383 15,472 15,474 15,478
2004-2 5,749 12,000 13,427 13,921 14,259 14,476 14,721 14,802 14,809 14,855 14,925 14,992 15,000 15,357 15,519 15,527
2005-1 5,919 11,931 13,600 16,553 17,140 17,456 17,358 17,369 17,380 17,555 17,569 17,593 17,606 17,606 17,624 17,624
2005-2 6,105 15,152 17,148 17,891 18,516 18,661 18,685 18,811 18,918 18,934 18,950 18,957 18,649 18,651 18,651 18,662
2006-1 6,663 15,663 18,473 19,331 20,523 20,579 20,616 20,668 20,962 21,035 21,073 21,472 21,478 21,481 21,593 21,593
2006-2 5,192 15,909 19,832 21,490 22,122 22,207 22,779 22,826 22,864 22,911 23,018 23,369 23,363 23,375 23,365 23,823
2007-1 5,958 16,042 20,125 22,319 23,363 23,472 23,616 23,673 23,619 24,080 24,108 24,093 24,093 24,097 24,095 24,088
2007-2 5,495 17,970 22,251 24,411 25,720 26,134 26,365 26,470 26,650 26,677 26,736 26,747 26,776 26,777 26,827 26,843
2008-1 6,110 15,539 18,815 19,837 21,005 21,062 21,095 21,237 21,253 21,472 21,527 21,541 21,541 21,555 21,555 21,555
2008-2 6,306 19,159 22,457 23,563 24,314 24,458 24,516 24,529 24,570 24,724 24,721 24,730 24,741 24,742 24,750 24,752
2009-1 6,278 14,332 16,022 16,495 16,637 16,699 16,999 17,017 17,034 17,045 17,043 17,044 17,044 17,193 17,193 17,193
2009-2 5,957 16,228 17,919 18,574 18,845 18,933 19,230 19,361 19,577 19,584 19,602 19,615 19,617 19,617 19,617
2010-1 6,975 13,815 15,508 16,537 16,827 17,194 17,311 17,429 17,440 17,449 17,460 17,460 17,517 17,531
2010-2 6,924 18,174 21,705 23,293 24,449 24,547 24,563 24,624 24,628 24,659 24,661 24,661 24,661
2011-1 8,527 18,314 20,952 21,801 22,557 22,733 22,989 23,000 23,001 23,027 23,058 23,227
2011-2 7,377 19,615 22,422 24,011 24,936 25,126 25,228 25,381 25,565 25,685 26,290
2012-1 7,327 16,133 18,776 19,935 20,624 20,959 20,973 20,975 20,995 21,044
2012-2 5,998 19,871 24,176 26,416 27,170 27,875 28,288 28,362 28,424
2013-1 8,633 19,571 23,883 25,094 26,150 26,315 26,553 27,579
2013-2 7,296 24,314 30,088 33,710 35,251 35,448 35,510
2014-1 9,694 20,812 25,422 27,241 28,529 28,615
2014-2 7,833 28,059 34,410 37,726 38,606
2015-1 10,997 23,969 28,839 30,177
2015-2 9,005 23,391 27,121
2016-1 8,484 17,611
2016-2 8,169
Accident Portion of Ultimate Losses Paid by Month of Development
Year 12 24 36 48 60 72 84 96
FALSE
2002 TRUE 59.93% 90.38% 93.45% 94.65% 95.20% 95.26% 99.99% 100.00%FALSE
2003 TRUE 56.94% 91.90% 96.94% 98.19% 99.45% 99.61% 99.62% 100.00%FALSE
2004 TRUE 55.70% 90.36% 94.89% 96.64% 97.00% 97.39% 97.93% 99.61%FALSE
2005 TRUE 49.64% 92.76% 99.01% 99.24% 100.39% 100.58% 99.79% 99.85%FALSE
2006 TRUE 45.53% 85.49% 93.22% 94.85% 95.83% 97.12% 97.90% 98.14%FALSE
2007 TRUE 42.05% 87.01% 96.04% 97.69% 99.04% 99.23% 99.32% 99.40%FALSE
2008 TRUE 46.87% 90.76% 97.37% 98.18% 98.80% 99.27% 99.34% 99.36%FALSE
2009 TRUE 55.06% 93.39% 96.45% 98.36% 99.38% 99.45% 99.89% 99.89%FALSE
2010 TRUE 48.97% 90.31% 98.34% 99.16% 99.36% 99.47% 99.63%FALSE
2011 TRUE 51.52% 88.68% 95.59% 96.71% 97.44% 99.29%FALSE
2012 TRUE 44.20% 88.11% 96.13% 98.40% 98.81%FALSE
2013 TRUE 41.95% 86.15% 96.12% 98.50%FALSE
2014 TRUE 42.01% 90.42% 98.59%FALSE
2015 TRUE 54.43% 94.58%FALSE
2016 TRUE 49.15%
TRUE FALSE TRUE FALSE TRUE FALSE TRUE FALSE TRUE FALSE TRUE FALSE TRUE FALSE TRUE FALSE
Cumulative Paid Losses
Arithmetic Averages 12 24 36 48 60 72 84 96
All Years 49.60% 90.02% 96.32% 97.55% 98.25% 98.67% 99.27% 99.53%
10 Year 47.62% 89.49% 96.69% 97.77% 98.55% 98.67%
8 Year 48.41% 90.30% 96.83% 97.73% 98.63% 98.98% 99.18% 99.53%
6 Year 47.21% 89.71% 96.87% 98.22% 98.80% 98.97% 99.31% 99.38%
4 Year 46.88% 89.82% 96.61% 98.19% 98.75% 99.37% 99.55% 99.20%
3 Year 48.53% 90.38% 96.95% 97.87% 98.54% 99.40% 99.62% 99.55%
All Year ex hi/lo 49.39% 90.02% 96.36% 97.67% 98.35% 98.85% 99.36% 99.68%
6 Year ex hi/lo 46.72% 89.38% 96.76% 98.36% 99.00% 99.31% 99.52% 99.55%
$ Weighted Averages
All Years 48.53% 89.83% 96.43% 97.62% 98.28% 98.76% 99.24% 99.45%
10 Year 47.20% 89.44% 96.68% 97.78% 98.50% 98.76%
8 Year 47.86% 90.17% 96.86% 97.74% 98.55% 98.99% 99.17% 99.45%
6 Year 46.95% 89.74% 96.92% 98.20% 98.76% 98.96% 99.27% 99.33%
4 Year 46.59% 89.86% 96.74% 98.18% 98.68% 99.36% 99.52% 99.17%
3 Year 48.23% 90.31% 97.05% 97.92% 98.49% 99.39% 99.60% 99.52%
Selected Pay Pattern 48.23% 90.31% 97.05% 97.92% 98.49% 99.39% 99.60% 99.52%
Incremental 48.23% 42.08% 6.74% 0.87% 0.57% 0.90% 0.21% -0.08%
Year 1 2 3 4 5 6 7 8 9 10 11 12 13 14 15 To Ult
Annual Pay Pattern 48.23% 42.08% 6.74% 0.87% 0.57% 0.90% 0.21% -0.08% 0.02% 0.02% 0.14% 0.23% 0.06% 0.00% 0.00% 0.00%
Discounted Value at 0.7%: 0.9916
Oliver, Wyman Limited
100
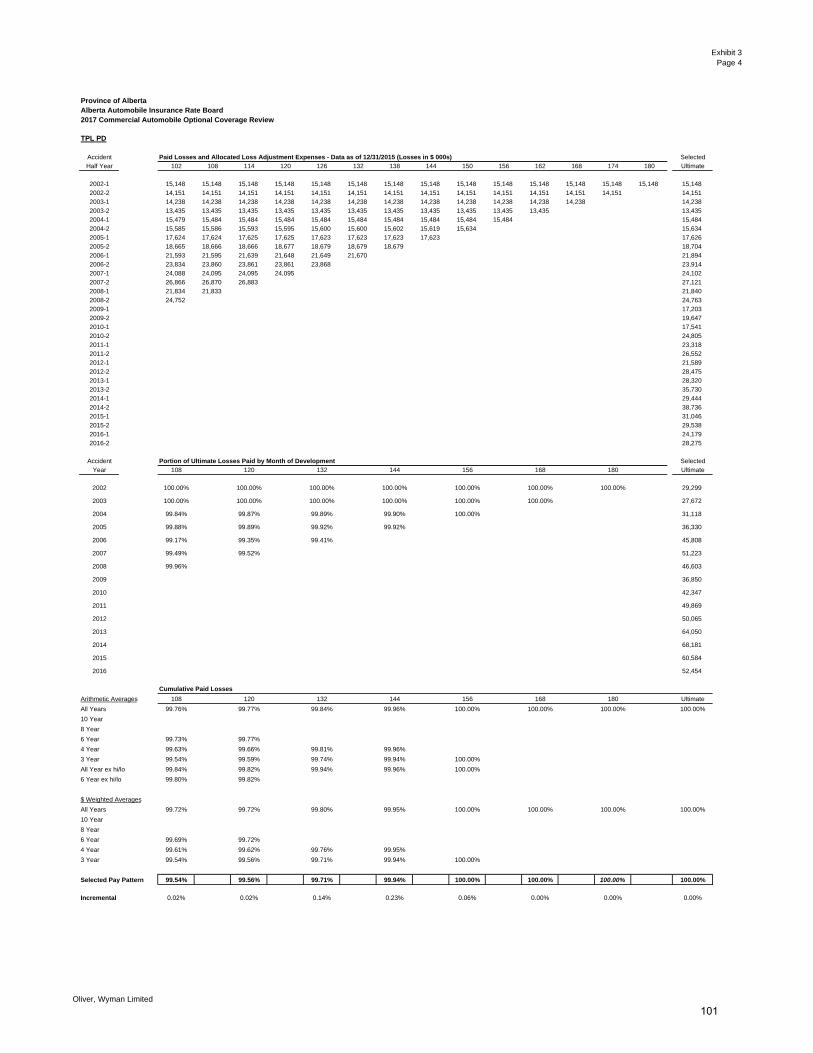
Exhibit 3Page 4
Province of AlbertaAlberta Automobile Insurance Rate Board2017 Commercial Automobile Optional Coverage Review
TPL PD
Accident Paid Losses and Allocated Loss Adjustment Expenses - Data as of 12/31/2015 (Losses in $ 000s) Selected
Half Year 102 108 114 120 126 132 138 144 150 156 162 168 174 180 Ultimate
2002-1 15,148 15,148 15,148 15,148 15,148 15,148 15,148 15,148 15,148 15,148 15,148 15,148 15,148 15,148 15,148
2002-2 14,151 14,151 14,151 14,151 14,151 14,151 14,151 14,151 14,151 14,151 14,151 14,151 14,151 14,151
2003-1 14,238 14,238 14,238 14,238 14,238 14,238 14,238 14,238 14,238 14,238 14,238 14,238 14,238
2003-2 13,435 13,435 13,435 13,435 13,435 13,435 13,435 13,435 13,435 13,435 13,435 13,435
2004-1 15,479 15,484 15,484 15,484 15,484 15,484 15,484 15,484 15,484 15,484 15,484
2004-2 15,585 15,586 15,593 15,595 15,600 15,600 15,602 15,619 15,634 15,634
2005-1 17,624 17,624 17,625 17,625 17,623 17,623 17,623 17,623 17,626
2005-2 18,665 18,666 18,666 18,677 18,679 18,679 18,679 18,704
2006-1 21,593 21,595 21,639 21,648 21,649 21,670 21,894
2006-2 23,834 23,860 23,861 23,861 23,868 23,914
2007-1 24,088 24,095 24,095 24,095 24,102
2007-2 26,866 26,870 26,883 27,121
2008-1 21,834 21,833 21,840
2008-2 24,752 24,763
2009-1 17,203
2009-2 19,647
2010-1 17,541
2010-2 24,805
2011-1 23,318
2011-2 26,552
2012-1 21,589
2012-2 28,475
2013-1 28,320
2013-2 35,730
2014-1 29,444
2014-2 38,736
2015-1 31,046
2015-2 29,538
2016-1 24,179
2016-2 28,275
Accident Portion of Ultimate Losses Paid by Month of Development Selected
Year 108 120 132 144 156 168 180 Ultimate
2002 100.00% 100.00% 100.00% 100.00% 100.00% 100.00% 100.00% 29,299
2003 100.00% 100.00% 100.00% 100.00% 100.00% 100.00% 27,672
2004 99.84% 99.87% 99.89% 99.90% 100.00% 31,118
2005 99.88% 99.89% 99.92% 99.92% 36,330
2006 99.17% 99.35% 99.41% 45,808
2007 99.49% 99.52% 51,223
2008 99.96% 46,603
2009 36,850
2010 42,347
2011 49,869
2012 50,065
2013 64,050
2014 68,181
2015 60,584
2016 52,454
TRUE FALSE TRUE FALSE TRUE FALSE TRUE FALSE TRUE FALSE TRUE FALSE TRUE
Cumulative Paid Losses
Arithmetic Averages 108 120 132 144 156 168 180 Ultimate
All Years 99.76% 99.77% 99.84% 99.96% 100.00% 100.00% 100.00% 100.00%
10 Year
8 Year
6 Year 99.73% 99.77%
4 Year 99.63% 99.66% 99.81% 99.96%
3 Year 99.54% 99.59% 99.74% 99.94% 100.00%
All Year ex hi/lo 99.84% 99.82% 99.94% 99.96% 100.00%
6 Year ex hi/lo 99.80% 99.82%
$ Weighted Averages
All Years 99.72% 99.72% 99.80% 99.95% 100.00% 100.00% 100.00% 100.00%
10 Year
8 Year
6 Year 99.69% 99.72%
4 Year 99.61% 99.62% 99.76% 99.95%
3 Year 99.54% 99.56% 99.71% 99.94% 100.00%
Selected Pay Pattern 99.54% 99.56% 99.71% 99.94% 100.00% 100.00% 100.00% 100.00%
Incremental 0.02% 0.02% 0.14% 0.23% 0.06% 0.00% 0.00% 0.00%
Oliver, Wyman Limited
101
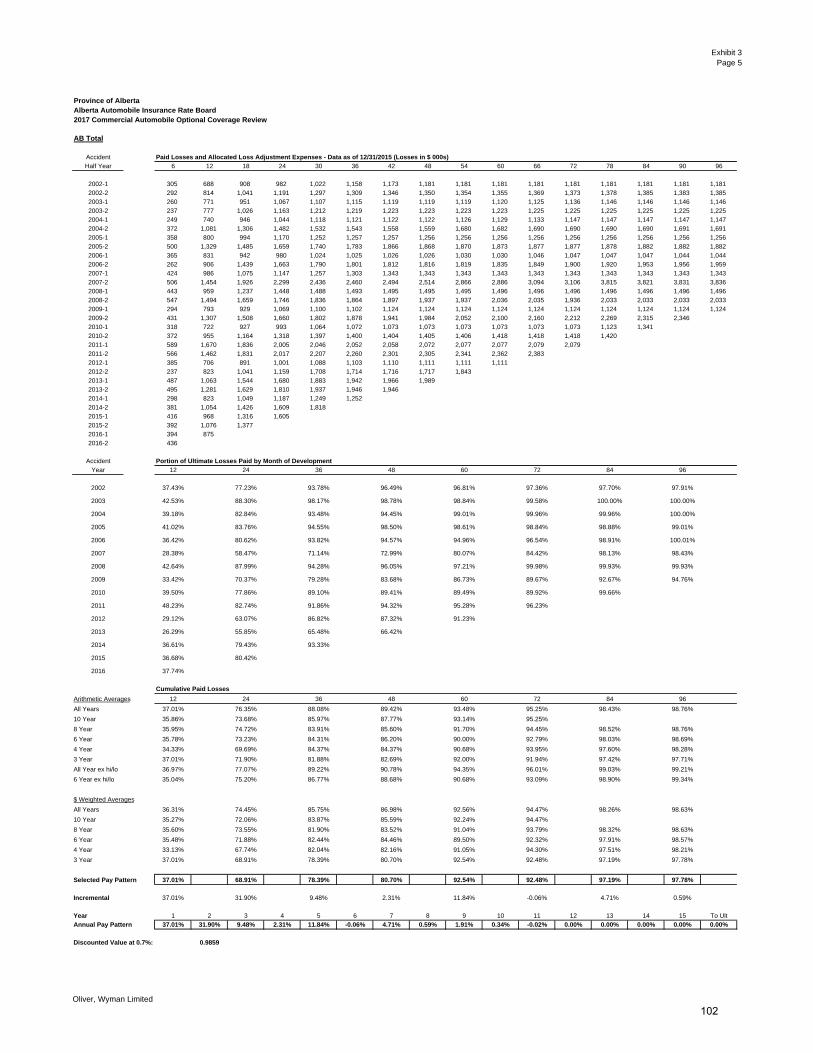
Exhibit 3Page 5
Province of AlbertaAlberta Automobile Insurance Rate Board2017 Commercial Automobile Optional Coverage Review
AB Total
Accident Paid Losses and Allocated Loss Adjustment Expenses - Data as of 12/31/2015 (Losses in $ 000s)
Half Year 6 12 18 24 30 36 42 48 54 60 66 72 78 84 90 96
2002-1 305 688 908 982 1,022 1,158 1,173 1,181 1,181 1,181 1,181 1,181 1,181 1,181 1,181 1,181
2002-2 292 814 1,041 1,191 1,297 1,309 1,346 1,350 1,354 1,355 1,369 1,373 1,378 1,385 1,383 1,385
2003-1 260 771 951 1,067 1,107 1,115 1,119 1,119 1,119 1,120 1,125 1,136 1,146 1,146 1,146 1,146
2003-2 237 777 1,026 1,163 1,212 1,219 1,223 1,223 1,223 1,223 1,225 1,225 1,225 1,225 1,225 1,225
2004-1 249 740 946 1,044 1,118 1,121 1,122 1,122 1,126 1,129 1,133 1,147 1,147 1,147 1,147 1,147
2004-2 372 1,081 1,306 1,482 1,532 1,543 1,558 1,559 1,680 1,682 1,690 1,690 1,690 1,690 1,691 1,691
2005-1 358 800 994 1,170 1,252 1,257 1,257 1,256 1,256 1,256 1,256 1,256 1,256 1,256 1,256 1,256
2005-2 500 1,329 1,485 1,659 1,740 1,783 1,866 1,868 1,870 1,873 1,877 1,877 1,878 1,882 1,882 1,882
2006-1 365 831 942 980 1,024 1,025 1,026 1,026 1,030 1,030 1,046 1,047 1,047 1,047 1,044 1,044
2006-2 262 906 1,439 1,663 1,790 1,801 1,812 1,816 1,819 1,835 1,849 1,900 1,920 1,953 1,956 1,959
2007-1 424 986 1,075 1,147 1,257 1,303 1,343 1,343 1,343 1,343 1,343 1,343 1,343 1,343 1,343 1,343
2007-2 506 1,454 1,926 2,299 2,436 2,460 2,494 2,514 2,866 2,886 3,094 3,106 3,815 3,821 3,831 3,836
2008-1 443 959 1,237 1,448 1,488 1,493 1,495 1,495 1,495 1,496 1,496 1,496 1,496 1,496 1,496 1,496
2008-2 547 1,494 1,659 1,746 1,836 1,864 1,897 1,937 1,937 2,036 2,035 1,936 2,033 2,033 2,033 2,033
2009-1 294 793 929 1,069 1,100 1,102 1,124 1,124 1,124 1,124 1,124 1,124 1,124 1,124 1,124 1,124
2009-2 431 1,307 1,508 1,660 1,802 1,878 1,941 1,984 2,052 2,100 2,160 2,212 2,269 2,315 2,346
2010-1 318 722 927 993 1,064 1,072 1,073 1,073 1,073 1,073 1,073 1,073 1,123 1,341
2010-2 372 955 1,164 1,318 1,397 1,400 1,404 1,405 1,406 1,418 1,418 1,418 1,420
2011-1 589 1,670 1,836 2,005 2,046 2,052 2,058 2,072 2,077 2,077 2,079 2,079
2011-2 566 1,462 1,831 2,017 2,207 2,260 2,301 2,305 2,341 2,362 2,383
2012-1 385 706 891 1,001 1,088 1,103 1,110 1,111 1,111 1,111
2012-2 237 823 1,041 1,159 1,708 1,714 1,716 1,717 1,843
2013-1 487 1,063 1,544 1,680 1,883 1,942 1,966 1,989
2013-2 495 1,281 1,629 1,810 1,937 1,946 1,946
2014-1 298 823 1,049 1,187 1,249 1,252
2014-2 381 1,054 1,426 1,609 1,818
2015-1 416 968 1,316 1,605
2015-2 392 1,076 1,377
2016-1 394 875
2016-2 436
Accident Portion of Ultimate Losses Paid by Month of Development
Year 12 24 36 48 60 72 84 96
FALSE
2002 TRUE 37.43% 77.23% 93.78% 96.49% 96.81% 97.36% 97.70% 97.91%FALSE
2003 TRUE 42.53% 88.30% 98.17% 98.78% 98.84% 99.58% 100.00% 100.00%FALSE
2004 TRUE 39.18% 82.84% 93.48% 94.45% 99.01% 99.96% 99.96% 100.00%FALSE
2005 TRUE 41.02% 83.76% 94.55% 98.50% 98.61% 98.84% 98.88% 99.01%FALSE
2006 TRUE 36.42% 80.62% 93.82% 94.57% 94.96% 96.54% 98.91% 100.01%FALSE
2007 TRUE 28.38% 58.47% 71.14% 72.99% 80.07% 84.42% 98.13% 98.43%FALSE
2008 TRUE 42.64% 87.99% 94.28% 96.05% 97.21% 99.98% 99.93% 99.93%FALSE
2009 TRUE 33.42% 70.37% 79.28% 83.68% 86.73% 89.67% 92.67% 94.76%FALSE
2010 TRUE 39.50% 77.86% 89.10% 89.41% 89.49% 89.92% 99.66%FALSE
2011 TRUE 48.23% 82.74% 91.86% 94.32% 95.28% 96.23%FALSE
2012 TRUE 29.12% 63.07% 86.82% 87.32% 91.23%FALSE
2013 TRUE 26.29% 55.85% 65.48% 66.42%FALSE
2014 TRUE 36.61% 79.43% 93.33%FALSE
2015 TRUE 36.68% 80.42%FALSE
2016 TRUE 37.74%
TRUE FALSE TRUE FALSE TRUE FALSE TRUE FALSE TRUE FALSE TRUE FALSE TRUE FALSE TRUE FALSE
Cumulative Paid Losses
Arithmetic Averages 12 24 36 48 60 72 84 96
All Years 37.01% 76.35% 88.08% 89.42% 93.48% 95.25% 98.43% 98.76%
10 Year 35.86% 73.68% 85.97% 87.77% 93.14% 95.25%
8 Year 35.95% 74.72% 83.91% 85.60% 91.70% 94.45% 98.52% 98.76%
6 Year 35.78% 73.23% 84.31% 86.20% 90.00% 92.79% 98.03% 98.69%
4 Year 34.33% 69.69% 84.37% 84.37% 90.68% 93.95% 97.60% 98.28%
3 Year 37.01% 71.90% 81.88% 82.69% 92.00% 91.94% 97.42% 97.71%
All Year ex hi/lo 36.97% 77.07% 89.22% 90.78% 94.35% 96.01% 99.03% 99.21%
6 Year ex hi/lo 35.04% 75.20% 86.77% 88.68% 90.68% 93.09% 98.90% 99.34%
$ Weighted Averages
All Years 36.31% 74.45% 85.75% 86.98% 92.56% 94.47% 98.26% 98.63%
10 Year 35.27% 72.06% 83.87% 85.59% 92.24% 94.47%
8 Year 35.60% 73.55% 81.90% 83.52% 91.04% 93.79% 98.32% 98.63%
6 Year 35.48% 71.88% 82.44% 84.46% 89.50% 92.32% 97.91% 98.57%
4 Year 33.13% 67.74% 82.04% 82.16% 91.05% 94.30% 97.51% 98.21%
3 Year 37.01% 68.91% 78.39% 80.70% 92.54% 92.48% 97.19% 97.78%
Selected Pay Pattern 37.01% 68.91% 78.39% 80.70% 92.54% 92.48% 97.19% 97.78%
Incremental 37.01% 31.90% 9.48% 2.31% 11.84% -0.06% 4.71% 0.59%
Year 1 2 3 4 5 6 7 8 9 10 11 12 13 14 15 To Ult
Annual Pay Pattern 37.01% 31.90% 9.48% 2.31% 11.84% -0.06% 4.71% 0.59% 1.91% 0.34% -0.02% 0.00% 0.00% 0.00% 0.00% 0.00%
Discounted Value at 0.7%: 0.9859
Oliver, Wyman Limited
102

Exhibit 3Page 6
Province of AlbertaAlberta Automobile Insurance Rate Board2017 Commercial Automobile Optional Coverage Review
AB Total
Accident Paid Losses and Allocated Loss Adjustment Expenses - Data as of 12/31/2015 (Losses in $ 000s) Selected
Half Year 102 108 114 120 126 132 138 144 150 156 162 168 174 180 Ultimate
2002-1 1,181 1,181 1,181 1,181 1,181 1,181 1,181 1,181 1,181 1,181 1,181 1,181 1,181 1,181 1,181
2002-2 1,438 1,438 1,438 1,438 1,438 1,438 1,438 1,438 1,438 1,438 1,438 1,438 1,438 1,438
2003-1 1,146 1,146 1,146 1,146 1,146 1,146 1,146 1,146 1,146 1,146 1,146 1,146 1,146
2003-2 1,225 1,225 1,225 1,225 1,225 1,225 1,225 1,225 1,225 1,225 1,225 1,225
2004-1 1,147 1,147 1,147 1,147 1,147 1,147 1,147 1,147 1,147 1,147 1,147
2004-2 1,691 1,691 1,691 1,691 1,691 1,691 1,691 1,691 1,691 1,691
2005-1 1,256 1,256 1,256 1,256 1,256 1,256 1,256 1,256 1,256
2005-2 1,883 1,906 1,906 1,914 1,914 1,914 1,914 1,914
2006-1 1,044 1,044 1,044 1,044 1,044 1,044 1,044
2006-2 1,956 1,956 1,956 1,956 1,956 1,956
2007-1 1,343 1,343 1,343 1,343 1,341
2007-2 3,874 3,907 3,923 3,915
2008-1 1,499 1,499 1,497
2008-2 2,033 2,034
2009-1 1,123
2009-2 2,539
2010-1 1,338
2010-2 1,432
2011-1 2,153
2011-2 2,483
2012-1 1,149
2012-2 2,088
2013-1 3,918
2013-2 2,006
2014-1 1,348
2014-2 1,941
2015-1 1,945
2015-2 1,762
2016-1 1,319
2016-2 2,154
Accident Portion of Ultimate Losses Paid by Month of Development Selected
Year 108 120 132 144 156 168 180 Ultimate
2002 100.00% 100.00% 100.00% 100.00% 100.00% 100.00% 100.00% 2,618
2003 100.00% 100.00% 100.00% 100.00% 100.00% 100.00% 2,371
2004 100.00% 100.00% 100.00% 100.00% 100.00% 2,837
2005 99.04% 99.77% 100.00% 100.00% 3,170
2006 100.00% 100.00% 100.00% 3,000
2007 99.26% 100.18% 5,257
2008 100.04% 3,531
2009 3,662
2010 2,770
2011 4,637
2012 3,237
2013 5,924
2014 3,289
2015 3,707
2016 3,474
TRUE FALSE TRUE FALSE TRUE FALSE TRUE FALSE TRUE FALSE TRUE FALSE TRUE
Cumulative Paid Losses
Arithmetic Averages 108 120 132 144 156 168 180 Ultimate
All Years 99.76% 99.99% 100.00% 100.00% 100.00% 100.00% 100.00% 100.00%
10 Year
8 Year
6 Year 99.72% 99.99%
4 Year 99.59% 99.99% 100.00% 100.00%
3 Year 99.77% 99.98% 100.00% 100.00% 100.00%
All Year ex hi/lo 99.85% 100.00% 100.00% 100.00% 100.00%
6 Year ex hi/lo 99.82% 100.00%
$ Weighted Averages
All Years 99.70% 100.01% 100.00% 100.00% 100.00% 100.00% 100.00% 100.00%
10 Year
8 Year
6 Year 99.66% 100.01%
4 Year 99.55% 100.01% 100.00% 100.00%
3 Year 99.68% 100.02% 100.00% 100.00% 100.00%
Selected Pay Pattern 99.68% 100.02% 100.00% 100.00% 100.00% 100.00% 100.00% 100.00%
Incremental 1.91% 0.34% -0.02% 0.00% 0.00% 0.00% 0.00% 0.00%
Oliver, Wyman Limited
103
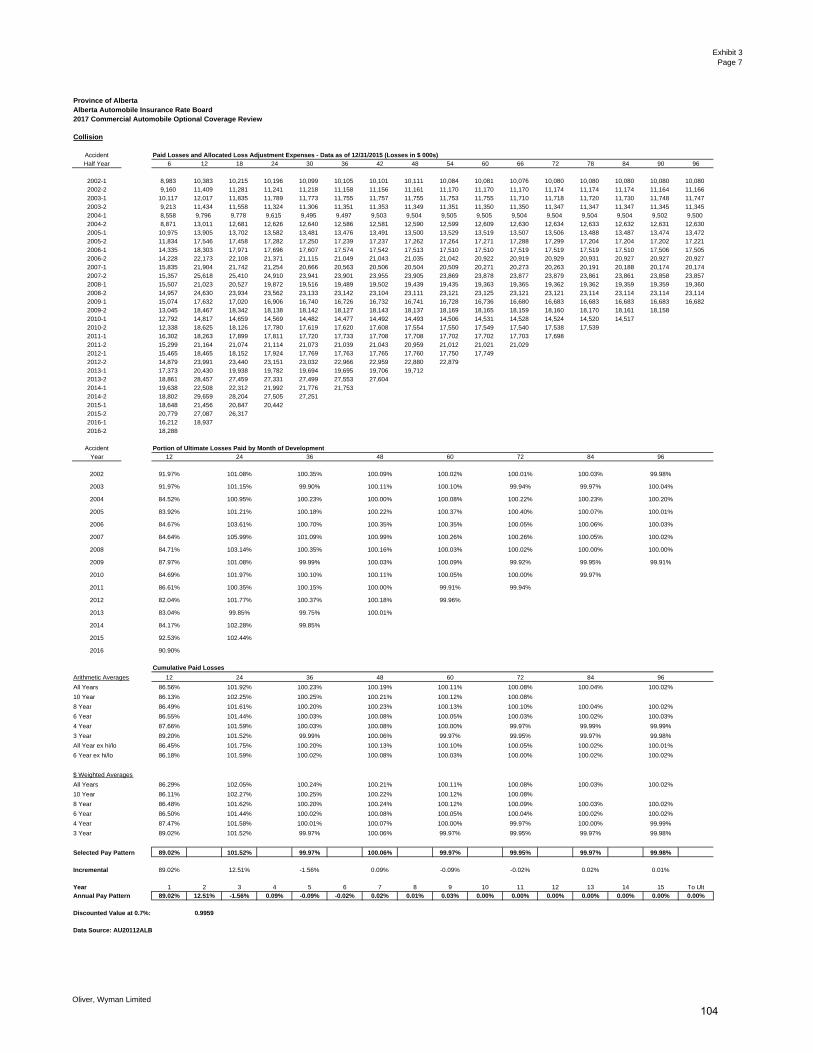
Exhibit 3Page 7
Province of AlbertaAlberta Automobile Insurance Rate Board2017 Commercial Automobile Optional Coverage Review
Collision
Accident Paid Losses and Allocated Loss Adjustment Expenses - Data as of 12/31/2015 (Losses in $ 000s)Half Year 6 12 18 24 30 36 42 48 54 60 66 72 78 84 90 96
2002-1 8,983 10,383 10,215 10,196 10,099 10,105 10,101 10,111 10,084 10,081 10,076 10,080 10,080 10,080 10,080 10,0802002-2 9,160 11,409 11,281 11,241 11,218 11,158 11,156 11,161 11,170 11,170 11,170 11,174 11,174 11,174 11,164 11,1662003-1 10,117 12,017 11,835 11,789 11,773 11,755 11,757 11,755 11,753 11,755 11,710 11,718 11,720 11,730 11,748 11,7472003-2 9,213 11,434 11,558 11,324 11,306 11,351 11,353 11,349 11,351 11,350 11,350 11,347 11,347 11,347 11,345 11,3452004-1 8,558 9,796 9,778 9,615 9,495 9,497 9,503 9,504 9,505 9,505 9,504 9,504 9,504 9,504 9,502 9,5002004-2 8,871 13,011 12,681 12,626 12,640 12,586 12,581 12,590 12,599 12,609 12,630 12,634 12,633 12,632 12,631 12,6302005-1 10,975 13,905 13,702 13,582 13,481 13,476 13,491 13,500 13,529 13,519 13,507 13,506 13,488 13,487 13,474 13,4722005-2 11,834 17,546 17,458 17,282 17,250 17,239 17,237 17,262 17,264 17,271 17,288 17,299 17,204 17,204 17,202 17,2212006-1 14,335 18,303 17,971 17,696 17,607 17,574 17,542 17,513 17,510 17,510 17,519 17,519 17,519 17,510 17,506 17,5052006-2 14,228 22,173 22,108 21,371 21,115 21,049 21,043 21,035 21,042 20,922 20,919 20,929 20,931 20,927 20,927 20,9272007-1 15,835 21,904 21,742 21,254 20,666 20,563 20,506 20,504 20,509 20,271 20,273 20,263 20,191 20,188 20,174 20,1742007-2 15,357 25,618 25,410 24,910 23,941 23,901 23,955 23,905 23,869 23,878 23,877 23,879 23,861 23,861 23,858 23,8572008-1 15,507 21,023 20,527 19,872 19,516 19,489 19,502 19,439 19,435 19,363 19,365 19,362 19,362 19,359 19,359 19,3602008-2 14,957 24,630 23,934 23,562 23,133 23,142 23,104 23,111 23,121 23,125 23,121 23,121 23,114 23,114 23,114 23,1142009-1 15,074 17,632 17,020 16,906 16,740 16,726 16,732 16,741 16,728 16,736 16,680 16,683 16,683 16,683 16,683 16,6822009-2 13,045 18,467 18,342 18,138 18,142 18,127 18,143 18,137 18,169 18,165 18,159 18,160 18,170 18,161 18,1582010-1 12,792 14,817 14,659 14,569 14,482 14,477 14,492 14,493 14,506 14,531 14,528 14,524 14,520 14,5172010-2 12,338 18,625 18,126 17,780 17,619 17,620 17,608 17,554 17,550 17,549 17,540 17,538 17,5392011-1 16,302 18,263 17,899 17,811 17,720 17,733 17,708 17,708 17,702 17,702 17,703 17,6982011-2 15,299 21,164 21,074 21,114 21,073 21,039 21,043 20,959 21,012 21,021 21,0292012-1 15,465 18,465 18,152 17,924 17,769 17,763 17,765 17,760 17,750 17,7492012-2 14,879 23,991 23,440 23,151 23,032 22,966 22,959 22,880 22,8792013-1 17,373 20,430 19,938 19,782 19,694 19,695 19,706 19,7122013-2 18,861 28,457 27,459 27,331 27,499 27,553 27,6042014-1 19,638 22,508 22,312 21,992 21,776 21,7532014-2 18,802 29,659 28,204 27,505 27,2512015-1 18,648 21,456 20,847 20,4422015-2 20,779 27,087 26,3172016-1 16,212 18,9372016-2 18,288
Accident Portion of Ultimate Losses Paid by Month of DevelopmentYear 12 24 36 48 60 72 84 96
FALSE2002 TRUE 91.97% 101.08% 100.35% 100.09% 100.02% 100.01% 100.03% 99.98%
FALSE2003 TRUE 91.97% 101.15% 99.90% 100.11% 100.10% 99.94% 99.97% 100.04%
FALSE2004 TRUE 84.52% 100.95% 100.23% 100.00% 100.08% 100.22% 100.23% 100.20%
FALSE2005 TRUE 83.92% 101.21% 100.18% 100.22% 100.37% 100.40% 100.07% 100.01%
FALSE2006 TRUE 84.67% 103.61% 100.70% 100.35% 100.35% 100.05% 100.06% 100.03%
FALSE2007 TRUE 84.64% 105.99% 101.09% 100.99% 100.26% 100.26% 100.05% 100.02%
FALSE2008 TRUE 84.71% 103.14% 100.35% 100.16% 100.03% 100.02% 100.00% 100.00%
FALSE2009 TRUE 87.97% 101.08% 99.99% 100.03% 100.09% 99.92% 99.95% 99.91%
FALSE2010 TRUE 84.69% 101.97% 100.10% 100.11% 100.05% 100.00% 99.97%
FALSE2011 TRUE 86.61% 100.35% 100.15% 100.00% 99.91% 99.94%
FALSE2012 TRUE 82.04% 101.77% 100.37% 100.18% 99.96%
FALSE2013 TRUE 83.04% 99.85% 99.75% 100.01%
FALSE2014 TRUE 84.17% 102.28% 99.85%
FALSE2015 TRUE 92.53% 102.44%
FALSE2016 TRUE 90.90%
TRUE FALSE TRUE FALSE TRUE FALSE TRUE FALSE TRUE FALSE TRUE FALSE TRUE FALSE TRUE FALSECumulative Paid Losses
Arithmetic Averages 12 24 36 48 60 72 84 96
All Years 86.56% 101.92% 100.23% 100.19% 100.11% 100.08% 100.04% 100.02%
10 Year 86.13% 102.25% 100.25% 100.21% 100.12% 100.08%
8 Year 86.49% 101.61% 100.20% 100.23% 100.13% 100.10% 100.04% 100.02%
6 Year 86.55% 101.44% 100.03% 100.08% 100.05% 100.03% 100.02% 100.03%
4 Year 87.66% 101.59% 100.03% 100.08% 100.00% 99.97% 99.99% 99.99%
3 Year 89.20% 101.52% 99.99% 100.06% 99.97% 99.95% 99.97% 99.98%
All Year ex hi/lo 86.45% 101.75% 100.20% 100.13% 100.10% 100.05% 100.02% 100.01%
6 Year ex hi/lo 86.18% 101.59% 100.02% 100.08% 100.03% 100.00% 100.02% 100.02%
$ Weighted Averages
All Years 86.29% 102.05% 100.24% 100.21% 100.11% 100.08% 100.03% 100.02%
10 Year 86.11% 102.27% 100.25% 100.22% 100.12% 100.08%
8 Year 86.48% 101.62% 100.20% 100.24% 100.12% 100.09% 100.03% 100.02%
6 Year 86.50% 101.44% 100.02% 100.08% 100.05% 100.04% 100.02% 100.02%
4 Year 87.47% 101.58% 100.01% 100.07% 100.00% 99.97% 100.00% 99.99%
3 Year 89.02% 101.52% 99.97% 100.06% 99.97% 99.95% 99.97% 99.98%
Selected Pay Pattern 89.02% 101.52% 99.97% 100.06% 99.97% 99.95% 99.97% 99.98%
Incremental 89.02% 12.51% -1.56% 0.09% -0.09% -0.02% 0.02% 0.01%
Year 1 2 3 4 5 6 7 8 9 10 11 12 13 14 15 To UltAnnual Pay Pattern 89.02% 12.51% -1.56% 0.09% -0.09% -0.02% 0.02% 0.01% 0.03% 0.00% 0.00% 0.00% 0.00% 0.00% 0.00% 0.00%
Discounted Value at 0.7%: 0.9959
Data Source: AU20112ALB
Oliver, Wyman Limited
104
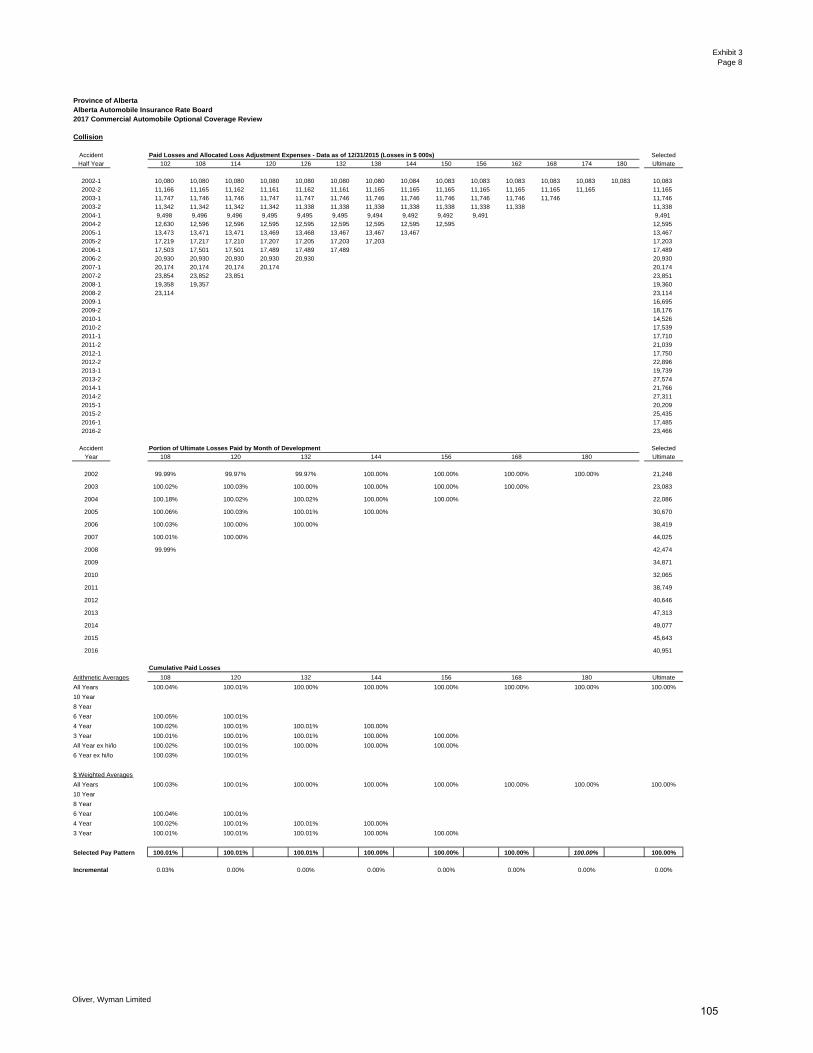
Exhibit 3Page 8
Province of AlbertaAlberta Automobile Insurance Rate Board2017 Commercial Automobile Optional Coverage Review
Collision
Accident Paid Losses and Allocated Loss Adjustment Expenses - Data as of 12/31/2015 (Losses in $ 000s) SelectedHalf Year 102 108 114 120 126 132 138 144 150 156 162 168 174 180 Ultimate
2002-1 10,080 10,080 10,080 10,080 10,080 10,080 10,080 10,084 10,083 10,083 10,083 10,083 10,083 10,083 10,0832002-2 11,166 11,165 11,162 11,161 11,162 11,161 11,165 11,165 11,165 11,165 11,165 11,165 11,165 11,1652003-1 11,747 11,746 11,746 11,747 11,747 11,746 11,746 11,746 11,746 11,746 11,746 11,746 11,7462003-2 11,342 11,342 11,342 11,342 11,338 11,338 11,338 11,338 11,338 11,338 11,338 11,3382004-1 9,498 9,496 9,496 9,495 9,495 9,495 9,494 9,492 9,492 9,491 9,4912004-2 12,630 12,596 12,596 12,595 12,595 12,595 12,595 12,595 12,595 12,5952005-1 13,473 13,471 13,471 13,469 13,468 13,467 13,467 13,467 13,4672005-2 17,219 17,217 17,210 17,207 17,205 17,203 17,203 17,2032006-1 17,503 17,501 17,501 17,489 17,489 17,489 17,4892006-2 20,930 20,930 20,930 20,930 20,930 20,9302007-1 20,174 20,174 20,174 20,174 20,1742007-2 23,854 23,852 23,851 23,8512008-1 19,358 19,357 19,3602008-2 23,114 23,1142009-1 16,6952009-2 18,1762010-1 14,5262010-2 17,5392011-1 17,7102011-2 21,0392012-1 17,7502012-2 22,8962013-1 19,7392013-2 27,5742014-1 21,7662014-2 27,3112015-1 20,2092015-2 25,4352016-1 17,4852016-2 23,466
Accident Portion of Ultimate Losses Paid by Month of Development SelectedYear 108 120 132 144 156 168 180 Ultimate
2002 99.99% 99.97% 99.97% 100.00% 100.00% 100.00% 100.00% 21,248
2003 100.02% 100.03% 100.00% 100.00% 100.00% 100.00% 23,083
2004 100.18% 100.02% 100.02% 100.00% 100.00% 22,086
2005 100.06% 100.03% 100.01% 100.00% 30,670
2006 100.03% 100.00% 100.00% 38,419
2007 100.01% 100.00% 44,025
2008 99.99% 42,474
2009 34,871
2010 32,065
2011 38,749
2012 40,646
2013 47,313
2014 49,077
2015 45,643
2016 40,951TRUE FALSE TRUE FALSE TRUE FALSE TRUE FALSE TRUE FALSE TRUE FALSE TRUE
Cumulative Paid Losses
Arithmetic Averages 108 120 132 144 156 168 180 Ultimate
All Years 100.04% 100.01% 100.00% 100.00% 100.00% 100.00% 100.00% 100.00%
10 Year
8 Year
6 Year 100.05% 100.01%
4 Year 100.02% 100.01% 100.01% 100.00%
3 Year 100.01% 100.01% 100.01% 100.00% 100.00%
All Year ex hi/lo 100.02% 100.01% 100.00% 100.00% 100.00%
6 Year ex hi/lo 100.03% 100.01%
$ Weighted Averages
All Years 100.03% 100.01% 100.00% 100.00% 100.00% 100.00% 100.00% 100.00%
10 Year
8 Year
6 Year 100.04% 100.01%
4 Year 100.02% 100.01% 100.01% 100.00%
3 Year 100.01% 100.01% 100.01% 100.00% 100.00%
Selected Pay Pattern 100.01% 100.01% 100.01% 100.00% 100.00% 100.00% 100.00% 100.00%
Incremental 0.03% 0.00% 0.00% 0.00% 0.00% 0.00% 0.00% 0.00%
Oliver, Wyman Limited
105
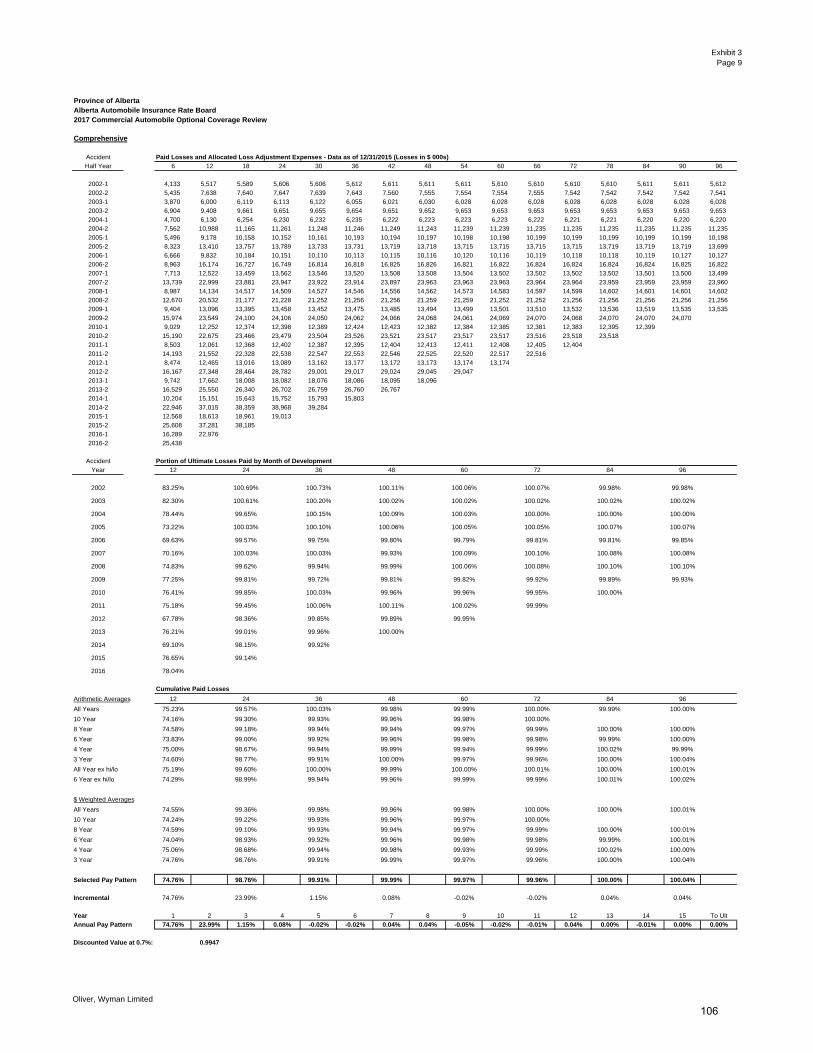
Exhibit 3Page 9
Province of AlbertaAlberta Automobile Insurance Rate Board2017 Commercial Automobile Optional Coverage Review
Comprehensive
Accident Paid Losses and Allocated Loss Adjustment Expenses - Data as of 12/31/2015 (Losses in $ 000s)
Half Year 6 12 18 24 30 36 42 48 54 60 66 72 78 84 90 96
2002-1 4,133 5,517 5,589 5,606 5,606 5,612 5,611 5,611 5,611 5,610 5,610 5,610 5,610 5,611 5,611 5,612
2002-2 5,435 7,638 7,640 7,647 7,639 7,643 7,560 7,555 7,554 7,554 7,555 7,542 7,542 7,542 7,542 7,541
2003-1 3,870 6,000 6,119 6,113 6,122 6,055 6,021 6,030 6,028 6,028 6,028 6,028 6,028 6,028 6,028 6,028
2003-2 6,904 9,408 9,661 9,651 9,655 9,654 9,651 9,652 9,653 9,653 9,653 9,653 9,653 9,653 9,653 9,653
2004-1 4,700 6,130 6,254 6,230 6,232 6,235 6,222 6,223 6,223 6,223 6,222 6,221 6,221 6,220 6,220 6,220
2004-2 7,562 10,988 11,165 11,261 11,248 11,246 11,249 11,243 11,239 11,239 11,235 11,235 11,235 11,235 11,235 11,235
2005-1 5,496 9,178 10,158 10,152 10,161 10,193 10,194 10,197 10,198 10,198 10,199 10,199 10,199 10,199 10,199 10,198
2005-2 8,323 13,410 13,757 13,789 13,733 13,731 13,719 13,718 13,715 13,715 13,715 13,715 13,719 13,719 13,719 13,699
2006-1 6,666 9,832 10,184 10,151 10,110 10,113 10,115 10,116 10,120 10,116 10,119 10,118 10,118 10,119 10,127 10,127
2006-2 8,963 16,174 16,727 16,749 16,814 16,818 16,825 16,826 16,821 16,822 16,824 16,824 16,824 16,824 16,825 16,822
2007-1 7,713 12,522 13,459 13,562 13,546 13,520 13,508 13,508 13,504 13,502 13,502 13,502 13,502 13,501 13,500 13,499
2007-2 13,739 22,999 23,881 23,947 23,922 23,914 23,897 23,963 23,963 23,963 23,964 23,964 23,959 23,959 23,959 23,960
2008-1 8,987 14,134 14,517 14,509 14,527 14,546 14,556 14,562 14,573 14,583 14,597 14,599 14,602 14,601 14,601 14,602
2008-2 12,670 20,532 21,177 21,228 21,252 21,256 21,256 21,259 21,259 21,252 21,252 21,256 21,256 21,256 21,256 21,256
2009-1 9,404 13,096 13,395 13,458 13,452 13,475 13,485 13,494 13,499 13,501 13,510 13,532 13,536 13,519 13,535 13,535
2009-2 15,974 23,549 24,100 24,106 24,050 24,062 24,066 24,068 24,061 24,069 24,070 24,068 24,070 24,070 24,070
2010-1 9,029 12,252 12,374 12,398 12,389 12,424 12,423 12,382 12,384 12,385 12,381 12,383 12,395 12,399
2010-2 15,190 22,675 23,466 23,479 23,504 23,526 23,521 23,517 23,517 23,517 23,516 23,518 23,518
2011-1 8,503 12,061 12,368 12,402 12,387 12,395 12,404 12,413 12,411 12,408 12,405 12,404
2011-2 14,193 21,552 22,328 22,538 22,547 22,553 22,546 22,525 22,520 22,517 22,516
2012-1 8,474 12,465 13,016 13,089 13,162 13,177 13,172 13,173 13,174 13,174
2012-2 16,167 27,348 28,464 28,782 29,001 29,017 29,024 29,045 29,047
2013-1 9,742 17,662 18,008 18,082 18,076 18,086 18,095 18,096
2013-2 16,529 25,550 26,340 26,702 26,759 26,760 26,767
2014-1 10,204 15,151 15,643 15,752 15,793 15,803
2014-2 22,946 37,015 38,359 38,968 39,284
2015-1 12,568 18,613 18,961 19,013
2015-2 25,608 37,281 38,185
2016-1 16,289 22,976
2016-2 25,438
Accident Portion of Ultimate Losses Paid by Month of Development
Year 12 24 36 48 60 72 84 96
FALSE
2002 TRUE 83.25% 100.69% 100.73% 100.11% 100.06% 100.07% 99.98% 99.98%FALSE
2003 TRUE 82.30% 100.61% 100.20% 100.02% 100.02% 100.02% 100.02% 100.02%FALSE
2004 TRUE 78.44% 99.65% 100.15% 100.09% 100.03% 100.00% 100.00% 100.00%FALSE
2005 TRUE 73.22% 100.03% 100.10% 100.06% 100.05% 100.05% 100.07% 100.07%FALSE
2006 TRUE 69.63% 99.57% 99.75% 99.80% 99.79% 99.81% 99.81% 99.85%FALSE
2007 TRUE 70.16% 100.03% 100.03% 99.93% 100.09% 100.10% 100.08% 100.08%FALSE
2008 TRUE 74.83% 99.62% 99.94% 99.99% 100.06% 100.08% 100.10% 100.10%FALSE
2009 TRUE 77.25% 99.81% 99.72% 99.81% 99.82% 99.92% 99.89% 99.93%FALSE
2010 TRUE 76.41% 99.85% 100.03% 99.96% 99.96% 99.95% 100.00%FALSE
2011 TRUE 75.18% 99.45% 100.06% 100.11% 100.02% 99.99%FALSE
2012 TRUE 67.78% 98.36% 99.85% 99.89% 99.95%FALSE
2013 TRUE 76.21% 99.01% 99.96% 100.00%FALSE
2014 TRUE 69.10% 98.15% 99.92%FALSE
2015 TRUE 76.65% 99.14%FALSE
2016 TRUE 78.04%
TRUE FALSE TRUE FALSE TRUE FALSE TRUE FALSE TRUE FALSE TRUE FALSE TRUE FALSE TRUE FALSE
Cumulative Paid Losses
Arithmetic Averages 12 24 36 48 60 72 84 96
All Years 75.23% 99.57% 100.03% 99.98% 99.99% 100.00% 99.99% 100.00%
10 Year 74.16% 99.30% 99.93% 99.96% 99.98% 100.00%
8 Year 74.58% 99.18% 99.94% 99.94% 99.97% 99.99% 100.00% 100.00%
6 Year 73.83% 99.00% 99.92% 99.96% 99.98% 99.98% 99.99% 100.00%
4 Year 75.00% 98.67% 99.94% 99.99% 99.94% 99.99% 100.02% 99.99%
3 Year 74.60% 98.77% 99.91% 100.00% 99.97% 99.96% 100.00% 100.04%
All Year ex hi/lo 75.19% 99.60% 100.00% 99.99% 100.00% 100.01% 100.00% 100.01%
6 Year ex hi/lo 74.29% 98.99% 99.94% 99.96% 99.99% 99.99% 100.01% 100.02%
$ Weighted Averages
All Years 74.55% 99.36% 99.98% 99.96% 99.98% 100.00% 100.00% 100.01%
10 Year 74.24% 99.22% 99.93% 99.96% 99.97% 100.00%
8 Year 74.59% 99.10% 99.93% 99.94% 99.97% 99.99% 100.00% 100.01%
6 Year 74.04% 98.93% 99.92% 99.96% 99.98% 99.98% 99.99% 100.01%
4 Year 75.06% 98.68% 99.94% 99.98% 99.93% 99.99% 100.02% 100.00%
3 Year 74.76% 98.76% 99.91% 99.99% 99.97% 99.96% 100.00% 100.04%
Selected Pay Pattern 74.76% 98.76% 99.91% 99.99% 99.97% 99.96% 100.00% 100.04%
Incremental 74.76% 23.99% 1.15% 0.08% -0.02% -0.02% 0.04% 0.04%
Year 1 2 3 4 5 6 7 8 9 10 11 12 13 14 15 To Ult
Annual Pay Pattern 74.76% 23.99% 1.15% 0.08% -0.02% -0.02% 0.04% 0.04% -0.05% -0.02% -0.01% 0.04% 0.00% -0.01% 0.00% 0.00%
Discounted Value at 0.7%: 0.9947
Oliver, Wyman Limited
106
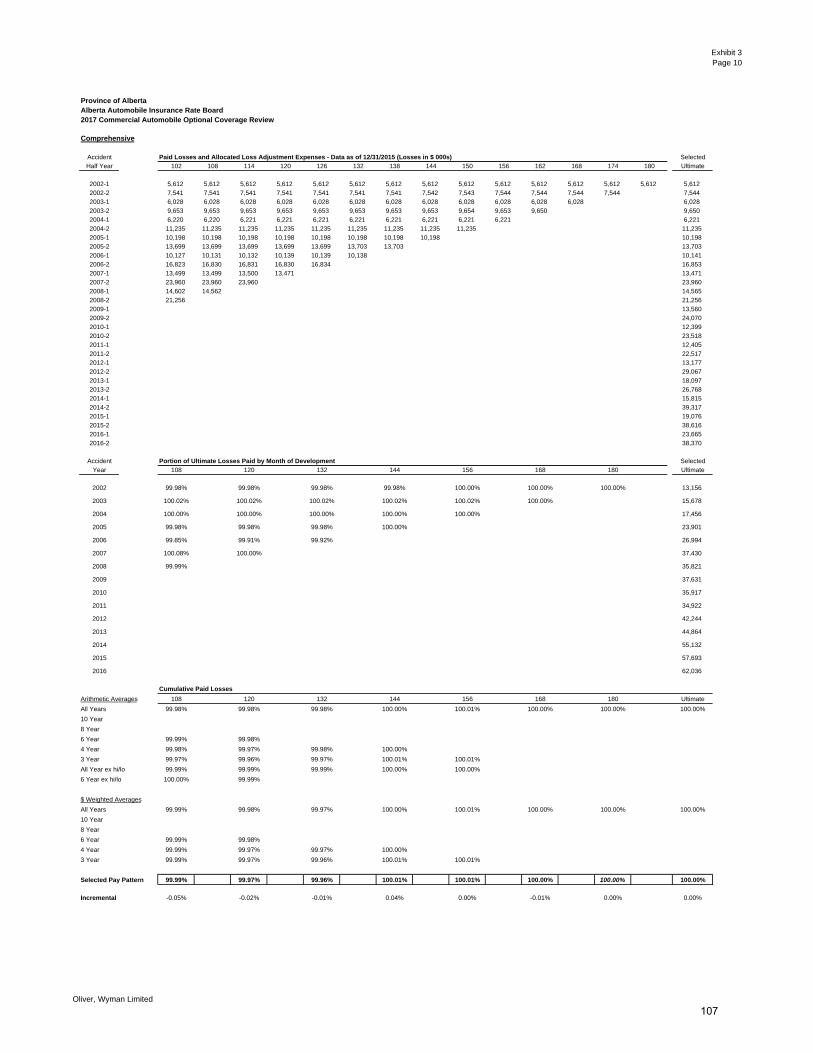
Exhibit 3Page 10
Province of AlbertaAlberta Automobile Insurance Rate Board2017 Commercial Automobile Optional Coverage Review
Comprehensive
Accident Paid Losses and Allocated Loss Adjustment Expenses - Data as of 12/31/2015 (Losses in $ 000s) Selected
Half Year 102 108 114 120 126 132 138 144 150 156 162 168 174 180 Ultimate
2002-1 5,612 5,612 5,612 5,612 5,612 5,612 5,612 5,612 5,612 5,612 5,612 5,612 5,612 5,612 5,612
2002-2 7,541 7,541 7,541 7,541 7,541 7,541 7,541 7,542 7,543 7,544 7,544 7,544 7,544 7,544
2003-1 6,028 6,028 6,028 6,028 6,028 6,028 6,028 6,028 6,028 6,028 6,028 6,028 6,028
2003-2 9,653 9,653 9,653 9,653 9,653 9,653 9,653 9,653 9,654 9,653 9,650 9,650
2004-1 6,220 6,220 6,221 6,221 6,221 6,221 6,221 6,221 6,221 6,221 6,221
2004-2 11,235 11,235 11,235 11,235 11,235 11,235 11,235 11,235 11,235 11,235
2005-1 10,198 10,198 10,198 10,198 10,198 10,198 10,198 10,198 10,198
2005-2 13,699 13,699 13,699 13,699 13,699 13,703 13,703 13,703
2006-1 10,127 10,131 10,132 10,139 10,139 10,138 10,141
2006-2 16,823 16,830 16,831 16,830 16,834 16,853
2007-1 13,499 13,499 13,500 13,471 13,471
2007-2 23,960 23,960 23,960 23,960
2008-1 14,602 14,562 14,565
2008-2 21,256 21,256
2009-1 13,560
2009-2 24,070
2010-1 12,399
2010-2 23,518
2011-1 12,405
2011-2 22,517
2012-1 13,177
2012-2 29,067
2013-1 18,097
2013-2 26,768
2014-1 15,815
2014-2 39,317
2015-1 19,076
2015-2 38,616
2016-1 23,665
2016-2 38,370
Accident Portion of Ultimate Losses Paid by Month of Development Selected
Year 108 120 132 144 156 168 180 Ultimate
2002 99.98% 99.98% 99.98% 99.98% 100.00% 100.00% 100.00% 13,156
2003 100.02% 100.02% 100.02% 100.02% 100.02% 100.00% 15,678
2004 100.00% 100.00% 100.00% 100.00% 100.00% 17,456
2005 99.98% 99.98% 99.98% 100.00% 23,901
2006 99.85% 99.91% 99.92% 26,994
2007 100.08% 100.00% 37,430
2008 99.99% 35,821
2009 37,631
2010 35,917
2011 34,922
2012 42,244
2013 44,864
2014 55,132
2015 57,693
2016 62,036
TRUE FALSE TRUE FALSE TRUE FALSE TRUE FALSE TRUE FALSE TRUE FALSE TRUE
Cumulative Paid Losses
Arithmetic Averages 108 120 132 144 156 168 180 Ultimate
All Years 99.98% 99.98% 99.98% 100.00% 100.01% 100.00% 100.00% 100.00%
10 Year
8 Year
6 Year 99.99% 99.98%
4 Year 99.98% 99.97% 99.98% 100.00%
3 Year 99.97% 99.96% 99.97% 100.01% 100.01%
All Year ex hi/lo 99.99% 99.99% 99.99% 100.00% 100.00%
6 Year ex hi/lo 100.00% 99.99%
$ Weighted Averages
All Years 99.99% 99.98% 99.97% 100.00% 100.01% 100.00% 100.00% 100.00%
10 Year
8 Year
6 Year 99.99% 99.98%
4 Year 99.99% 99.97% 99.97% 100.00%
3 Year 99.99% 99.97% 99.96% 100.01% 100.01%
Selected Pay Pattern 99.99% 99.97% 99.96% 100.01% 100.01% 100.00% 100.00% 100.00%
Incremental -0.05% -0.02% -0.01% 0.04% 0.00% -0.01% 0.00% 0.00%
Oliver, Wyman Limited
107
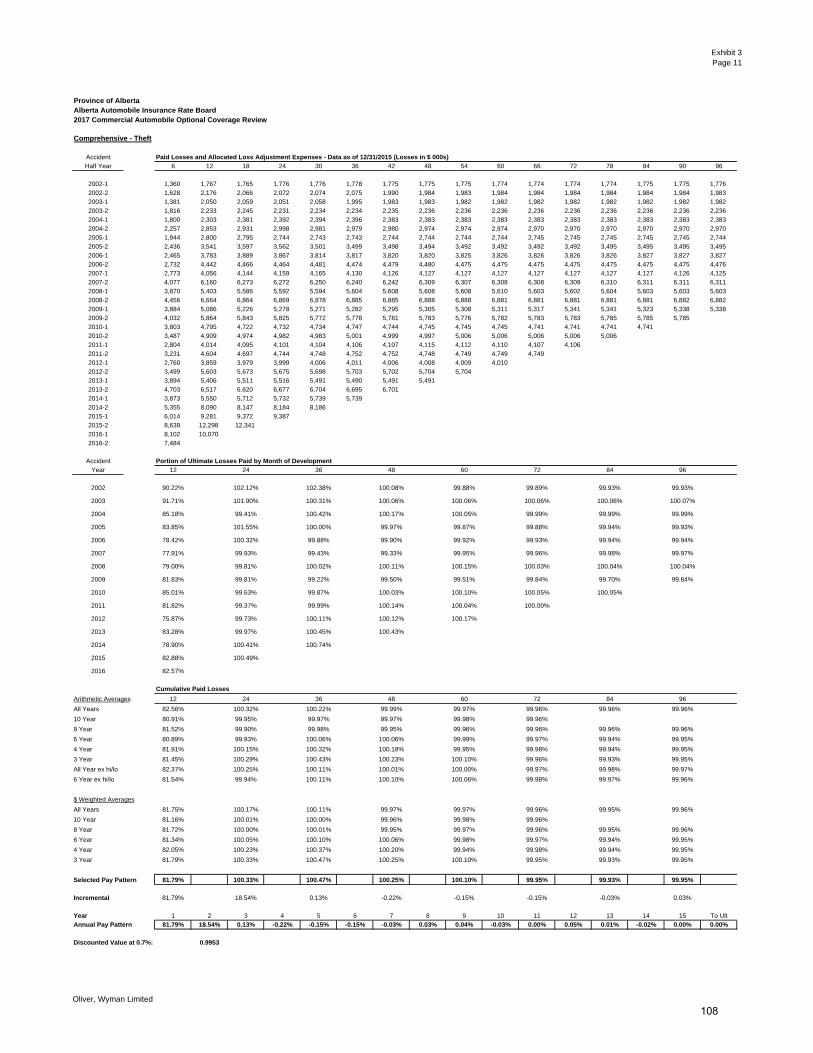
Exhibit 3Page 11
Province of AlbertaAlberta Automobile Insurance Rate Board2017 Commercial Automobile Optional Coverage Review
Comprehensive - Theft
Accident Paid Losses and Allocated Loss Adjustment Expenses - Data as of 12/31/2015 (Losses in $ 000s)
Half Year 6 12 18 24 30 36 42 48 54 60 66 72 78 84 90 96
2002-1 1,360 1,767 1,765 1,776 1,776 1,778 1,775 1,775 1,775 1,774 1,774 1,774 1,774 1,775 1,775 1,776
2002-2 1,628 2,176 2,066 2,072 2,074 2,075 1,990 1,984 1,983 1,984 1,984 1,984 1,984 1,984 1,984 1,983
2003-1 1,381 2,050 2,059 2,051 2,058 1,995 1,983 1,983 1,982 1,982 1,982 1,982 1,982 1,982 1,982 1,982
2003-2 1,816 2,233 2,245 2,231 2,234 2,234 2,235 2,236 2,236 2,236 2,236 2,236 2,236 2,236 2,236 2,236
2004-1 1,800 2,303 2,381 2,392 2,394 2,396 2,383 2,383 2,383 2,383 2,383 2,383 2,383 2,383 2,383 2,383
2004-2 2,257 2,853 2,931 2,998 2,981 2,979 2,980 2,974 2,974 2,974 2,970 2,970 2,970 2,970 2,970 2,970
2005-1 1,944 2,800 2,795 2,744 2,743 2,743 2,744 2,744 2,744 2,744 2,745 2,745 2,745 2,745 2,745 2,744
2005-2 2,436 3,541 3,597 3,562 3,501 3,499 3,498 3,494 3,492 3,492 3,492 3,492 3,495 3,495 3,495 3,495
2006-1 2,465 3,783 3,889 3,867 3,814 3,817 3,820 3,820 3,825 3,826 3,826 3,826 3,826 3,827 3,827 3,827
2006-2 2,732 4,442 4,466 4,464 4,481 4,474 4,479 4,480 4,475 4,475 4,475 4,475 4,475 4,475 4,475 4,476
2007-1 2,773 4,056 4,144 4,159 4,165 4,130 4,126 4,127 4,127 4,127 4,127 4,127 4,127 4,127 4,126 4,125
2007-2 4,077 6,160 6,273 6,272 6,250 6,240 6,242 6,309 6,307 6,308 6,308 6,309 6,310 6,311 6,311 6,311
2008-1 3,870 5,403 5,586 5,592 5,594 5,604 5,608 5,608 5,608 5,610 5,603 5,602 5,604 5,603 5,603 5,603
2008-2 4,456 6,664 6,864 6,869 6,878 6,885 6,885 6,888 6,888 6,881 6,881 6,881 6,881 6,881 6,882 6,882
2009-1 3,884 5,086 5,226 5,278 5,271 5,282 5,295 5,305 5,308 5,311 5,317 5,341 5,341 5,323 5,338 5,338
2009-2 4,032 5,864 5,843 5,825 5,772 5,778 5,781 5,783 5,776 5,782 5,783 5,783 5,785 5,785 5,785
2010-1 3,803 4,795 4,722 4,732 4,734 4,747 4,744 4,745 4,745 4,745 4,741 4,741 4,741 4,741
2010-2 3,487 4,909 4,974 4,982 4,983 5,001 4,999 4,997 5,006 5,006 5,006 5,006 5,006
2011-1 2,804 4,014 4,095 4,101 4,104 4,106 4,107 4,115 4,112 4,110 4,107 4,106
2011-2 3,231 4,604 4,697 4,744 4,748 4,752 4,752 4,748 4,749 4,749 4,749
2012-1 2,760 3,859 3,979 3,999 4,006 4,011 4,006 4,008 4,009 4,010
2012-2 3,499 5,603 5,673 5,675 5,698 5,703 5,702 5,704 5,704
2013-1 3,894 5,406 5,511 5,516 5,491 5,490 5,491 5,491
2013-2 4,703 6,517 6,620 6,677 6,704 6,695 6,701
2014-1 3,873 5,550 5,712 5,732 5,739 5,739
2014-2 5,355 8,090 8,147 8,184 8,186
2015-1 6,014 9,281 9,372 9,387
2015-2 8,639 12,298 12,341
2016-1 8,102 10,070
2016-2 7,484
Accident Portion of Ultimate Losses Paid by Month of Development
Year 12 24 36 48 60 72 84 96
FALSE
2002 TRUE 90.22% 102.12% 102.38% 100.08% 99.88% 99.89% 99.93% 99.93%FALSE
2003 TRUE 91.71% 101.90% 100.31% 100.06% 100.06% 100.06% 100.06% 100.07%FALSE
2004 TRUE 85.18% 99.41% 100.42% 100.17% 100.05% 99.99% 99.99% 99.99%FALSE
2005 TRUE 83.85% 101.55% 100.00% 99.97% 99.87% 99.88% 99.94% 99.93%FALSE
2006 TRUE 78.42% 100.32% 99.88% 99.90% 99.92% 99.93% 99.94% 99.94%FALSE
2007 TRUE 77.91% 99.93% 99.43% 99.33% 99.95% 99.96% 99.98% 99.97%FALSE
2008 TRUE 79.00% 99.81% 100.02% 100.11% 100.15% 100.03% 100.04% 100.04%FALSE
2009 TRUE 81.83% 99.81% 99.22% 99.50% 99.51% 99.84% 99.70% 99.84%FALSE
2010 TRUE 85.01% 99.63% 99.87% 100.03% 100.10% 100.05% 100.05%FALSE
2011 TRUE 81.82% 99.37% 99.99% 100.14% 100.04% 100.00%FALSE
2012 TRUE 75.87% 99.73% 100.11% 100.12% 100.17%FALSE
2013 TRUE 83.28% 99.97% 100.45% 100.43%FALSE
2014 TRUE 78.90% 100.41% 100.74%FALSE
2015 TRUE 82.88% 100.49%FALSE
2016 TRUE 82.57%
TRUE FALSE TRUE FALSE TRUE FALSE TRUE FALSE TRUE FALSE TRUE FALSE TRUE FALSE TRUE FALSE
Cumulative Paid Losses
Arithmetic Averages 12 24 36 48 60 72 84 96
All Years 82.56% 100.32% 100.22% 99.99% 99.97% 99.96% 99.96% 99.96%
10 Year 80.91% 99.95% 99.97% 99.97% 99.98% 99.96%
8 Year 81.52% 99.90% 99.98% 99.95% 99.96% 99.96% 99.96% 99.96%
6 Year 80.89% 99.93% 100.06% 100.06% 99.99% 99.97% 99.94% 99.95%
4 Year 81.91% 100.15% 100.32% 100.18% 99.95% 99.98% 99.94% 99.95%
3 Year 81.45% 100.29% 100.43% 100.23% 100.10% 99.96% 99.93% 99.95%
All Year ex hi/lo 82.37% 100.25% 100.11% 100.01% 100.00% 99.97% 99.98% 99.97%
6 Year ex hi/lo 81.54% 99.94% 100.11% 100.10% 100.06% 99.98% 99.97% 99.96%
$ Weighted Averages
All Years 81.75% 100.17% 100.11% 99.97% 99.97% 99.96% 99.95% 99.96%
10 Year 81.16% 100.01% 100.00% 99.96% 99.98% 99.96%
8 Year 81.72% 100.00% 100.01% 99.95% 99.97% 99.96% 99.95% 99.96%
6 Year 81.34% 100.05% 100.10% 100.06% 99.98% 99.97% 99.94% 99.95%
4 Year 82.05% 100.23% 100.37% 100.20% 99.94% 99.98% 99.94% 99.95%
3 Year 81.79% 100.33% 100.47% 100.25% 100.10% 99.95% 99.93% 99.95%
Selected Pay Pattern 81.79% 100.33% 100.47% 100.25% 100.10% 99.95% 99.93% 99.95%
Incremental 81.79% 18.54% 0.13% -0.22% -0.15% -0.15% -0.03% 0.03%
Year 1 2 3 4 5 6 7 8 9 10 11 12 13 14 15 To Ult
Annual Pay Pattern 81.79% 18.54% 0.13% -0.22% -0.15% -0.15% -0.03% 0.03% 0.04% -0.03% 0.00% 0.05% 0.01% -0.02% 0.00% 0.00%
Discounted Value at 0.7%: 0.9953
Oliver, Wyman Limited
108
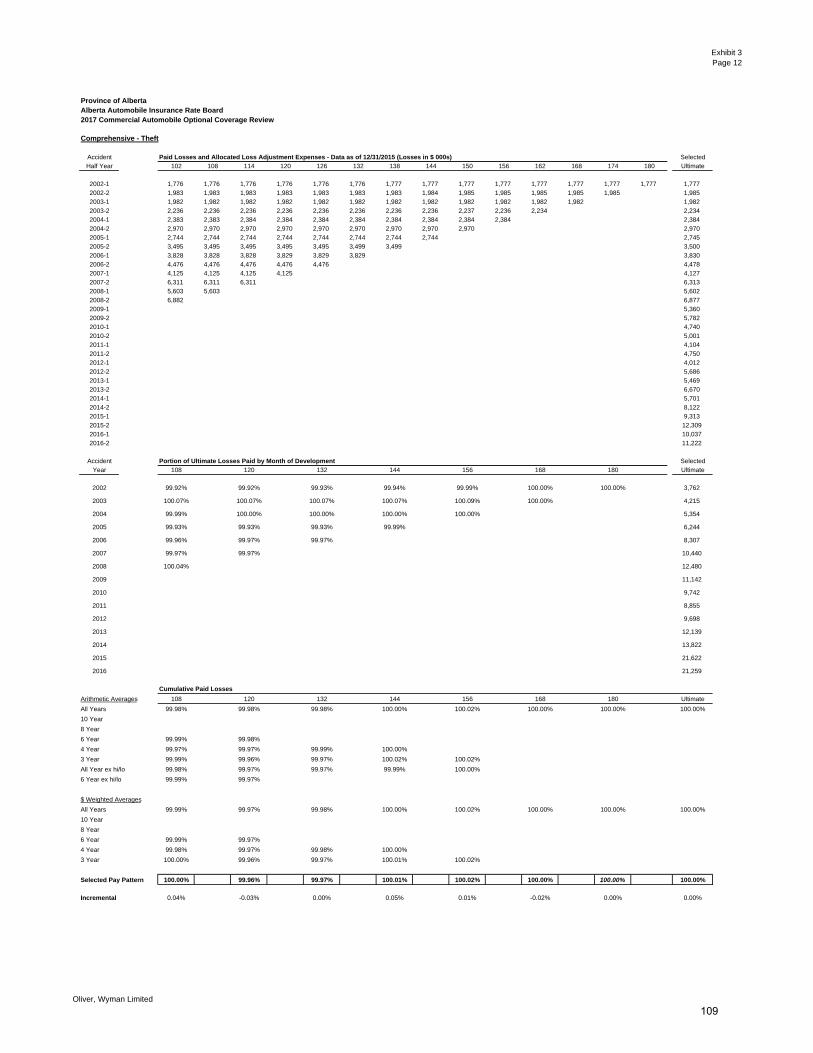
Exhibit 3Page 12
Province of AlbertaAlberta Automobile Insurance Rate Board2017 Commercial Automobile Optional Coverage Review
Comprehensive - Theft
Accident Paid Losses and Allocated Loss Adjustment Expenses - Data as of 12/31/2015 (Losses in $ 000s) Selected
Half Year 102 108 114 120 126 132 138 144 150 156 162 168 174 180 Ultimate
2002-1 1,776 1,776 1,776 1,776 1,776 1,776 1,777 1,777 1,777 1,777 1,777 1,777 1,777 1,777 1,777
2002-2 1,983 1,983 1,983 1,983 1,983 1,983 1,983 1,984 1,985 1,985 1,985 1,985 1,985 1,985
2003-1 1,982 1,982 1,982 1,982 1,982 1,982 1,982 1,982 1,982 1,982 1,982 1,982 1,982
2003-2 2,236 2,236 2,236 2,236 2,236 2,236 2,236 2,236 2,237 2,236 2,234 2,234
2004-1 2,383 2,383 2,384 2,384 2,384 2,384 2,384 2,384 2,384 2,384 2,384
2004-2 2,970 2,970 2,970 2,970 2,970 2,970 2,970 2,970 2,970 2,970
2005-1 2,744 2,744 2,744 2,744 2,744 2,744 2,744 2,744 2,745
2005-2 3,495 3,495 3,495 3,495 3,495 3,499 3,499 3,500
2006-1 3,828 3,828 3,828 3,829 3,829 3,829 3,830
2006-2 4,476 4,476 4,476 4,476 4,476 4,478
2007-1 4,125 4,125 4,125 4,125 4,127
2007-2 6,311 6,311 6,311 6,313
2008-1 5,603 5,603 5,602
2008-2 6,882 6,877
2009-1 5,360
2009-2 5,782
2010-1 4,740
2010-2 5,001
2011-1 4,104
2011-2 4,750
2012-1 4,012
2012-2 5,686
2013-1 5,469
2013-2 6,670
2014-1 5,701
2014-2 8,122
2015-1 9,313
2015-2 12,309
2016-1 10,037
2016-2 11,222
Accident Portion of Ultimate Losses Paid by Month of Development Selected
Year 108 120 132 144 156 168 180 Ultimate
2002 99.92% 99.92% 99.93% 99.94% 99.99% 100.00% 100.00% 3,762
2003 100.07% 100.07% 100.07% 100.07% 100.09% 100.00% 4,215
2004 99.99% 100.00% 100.00% 100.00% 100.00% 5,354
2005 99.93% 99.93% 99.93% 99.99% 6,244
2006 99.96% 99.97% 99.97% 8,307
2007 99.97% 99.97% 10,440
2008 100.04% 12,480
2009 11,142
2010 9,742
2011 8,855
2012 9,698
2013 12,139
2014 13,822
2015 21,622
2016 21,259
TRUE FALSE TRUE FALSE TRUE FALSE TRUE FALSE TRUE FALSE TRUE FALSE TRUE
Cumulative Paid Losses
Arithmetic Averages 108 120 132 144 156 168 180 Ultimate
All Years 99.98% 99.98% 99.98% 100.00% 100.02% 100.00% 100.00% 100.00%
10 Year
8 Year
6 Year 99.99% 99.98%
4 Year 99.97% 99.97% 99.99% 100.00%
3 Year 99.99% 99.96% 99.97% 100.02% 100.02%
All Year ex hi/lo 99.98% 99.97% 99.97% 99.99% 100.00%
6 Year ex hi/lo 99.99% 99.97%
$ Weighted Averages
All Years 99.99% 99.97% 99.98% 100.00% 100.02% 100.00% 100.00% 100.00%
10 Year
8 Year
6 Year 99.99% 99.97%
4 Year 99.98% 99.97% 99.98% 100.00%
3 Year 100.00% 99.96% 99.97% 100.01% 100.02%
Selected Pay Pattern 100.00% 99.96% 99.97% 100.01% 100.02% 100.00% 100.00% 100.00%
Incremental 0.04% -0.03% 0.00% 0.05% 0.01% -0.02% 0.00% 0.00%
Oliver, Wyman Limited
109
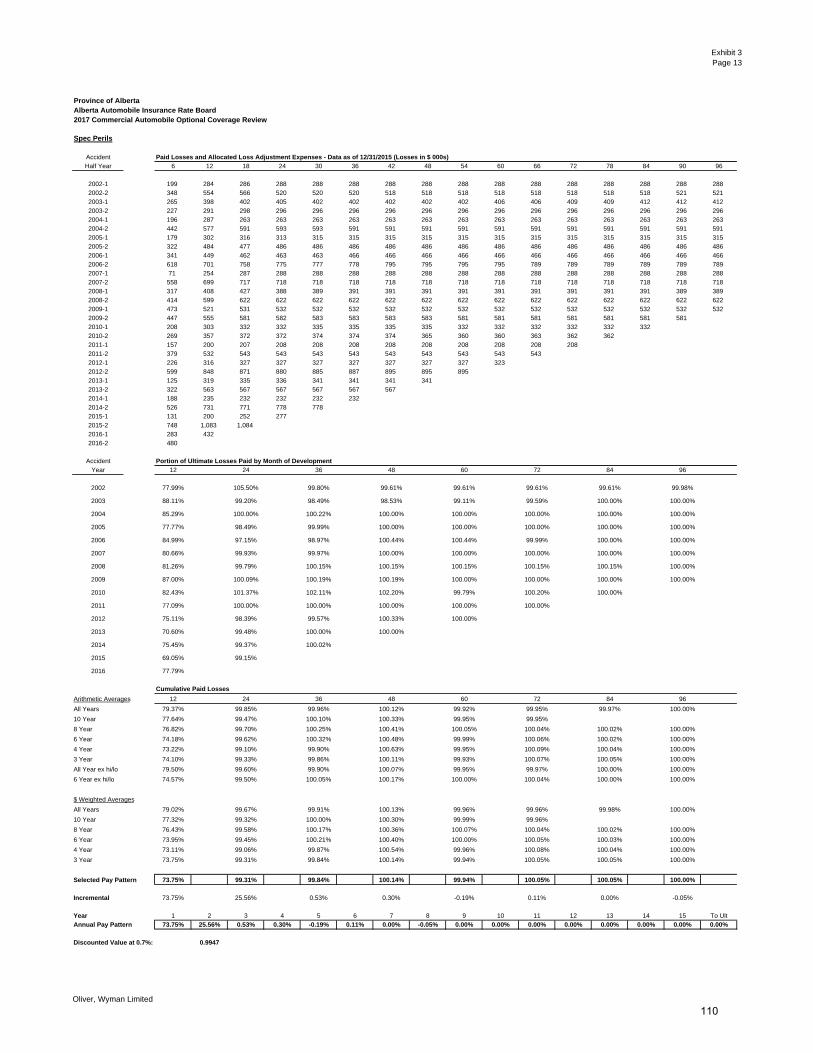
Exhibit 3Page 13
Province of AlbertaAlberta Automobile Insurance Rate Board2017 Commercial Automobile Optional Coverage Review
Spec Perils
Accident Paid Losses and Allocated Loss Adjustment Expenses - Data as of 12/31/2015 (Losses in $ 000s)
Half Year 6 12 18 24 30 36 42 48 54 60 66 72 78 84 90 96
2002-1 199 284 286 288 288 288 288 288 288 288 288 288 288 288 288 288
2002-2 348 554 566 520 520 520 518 518 518 518 518 518 518 518 521 521
2003-1 265 398 402 405 402 402 402 402 402 406 406 409 409 412 412 412
2003-2 227 291 298 296 296 296 296 296 296 296 296 296 296 296 296 296
2004-1 196 287 263 263 263 263 263 263 263 263 263 263 263 263 263 263
2004-2 442 577 591 593 593 591 591 591 591 591 591 591 591 591 591 591
2005-1 179 302 316 313 315 315 315 315 315 315 315 315 315 315 315 315
2005-2 322 484 477 486 486 486 486 486 486 486 486 486 486 486 486 486
2006-1 341 449 462 463 463 466 466 466 466 466 466 466 466 466 466 466
2006-2 618 701 758 775 777 778 795 795 795 795 789 789 789 789 789 789
2007-1 71 254 287 288 288 288 288 288 288 288 288 288 288 288 288 288
2007-2 558 699 717 718 718 718 718 718 718 718 718 718 718 718 718 718
2008-1 317 408 427 388 389 391 391 391 391 391 391 391 391 391 389 389
2008-2 414 599 622 622 622 622 622 622 622 622 622 622 622 622 622 622
2009-1 473 521 531 532 532 532 532 532 532 532 532 532 532 532 532 532
2009-2 447 555 581 582 583 583 583 583 581 581 581 581 581 581 581
2010-1 208 303 332 332 335 335 335 335 332 332 332 332 332 332
2010-2 269 357 372 372 374 374 374 365 360 360 363 362 362
2011-1 157 200 207 208 208 208 208 208 208 208 208 208
2011-2 379 532 543 543 543 543 543 543 543 543 543
2012-1 226 316 327 327 327 327 327 327 327 323
2012-2 599 848 871 880 885 887 895 895 895
2013-1 125 319 335 336 341 341 341 341
2013-2 322 563 567 567 567 567 567
2014-1 188 235 232 232 232 232
2014-2 526 731 771 778 778
2015-1 131 200 252 277
2015-2 748 1,083 1,084
2016-1 283 432
2016-2 480
Accident Portion of Ultimate Losses Paid by Month of Development
Year 12 24 36 48 60 72 84 96
FALSE
2002 TRUE 77.99% 105.50% 99.80% 99.61% 99.61% 99.61% 99.61% 99.98%FALSE
2003 TRUE 88.11% 99.20% 98.49% 98.53% 99.11% 99.59% 100.00% 100.00%FALSE
2004 TRUE 85.29% 100.00% 100.22% 100.00% 100.00% 100.00% 100.00% 100.00%FALSE
2005 TRUE 77.77% 98.49% 99.99% 100.00% 100.00% 100.00% 100.00% 100.00%FALSE
2006 TRUE 84.99% 97.15% 98.97% 100.44% 100.44% 99.99% 100.00% 100.00%FALSE
2007 TRUE 80.66% 99.93% 99.97% 100.00% 100.00% 100.00% 100.00% 100.00%FALSE
2008 TRUE 81.26% 99.79% 100.15% 100.15% 100.15% 100.15% 100.15% 100.00%FALSE
2009 TRUE 87.00% 100.09% 100.19% 100.19% 100.00% 100.00% 100.00% 100.00%FALSE
2010 TRUE 82.43% 101.37% 102.11% 102.20% 99.79% 100.20% 100.00%FALSE
2011 TRUE 77.09% 100.00% 100.00% 100.00% 100.00% 100.00%FALSE
2012 TRUE 75.11% 98.39% 99.57% 100.33% 100.00%FALSE
2013 TRUE 70.60% 99.48% 100.00% 100.00%FALSE
2014 TRUE 75.45% 99.37% 100.02%FALSE
2015 TRUE 69.05% 99.15%FALSE
2016 TRUE 77.79%
TRUE FALSE TRUE FALSE TRUE FALSE TRUE FALSE TRUE FALSE TRUE FALSE TRUE FALSE TRUE FALSE
Cumulative Paid Losses
Arithmetic Averages 12 24 36 48 60 72 84 96
All Years 79.37% 99.85% 99.96% 100.12% 99.92% 99.95% 99.97% 100.00%
10 Year 77.64% 99.47% 100.10% 100.33% 99.95% 99.95%
8 Year 76.82% 99.70% 100.25% 100.41% 100.05% 100.04% 100.02% 100.00%
6 Year 74.18% 99.62% 100.32% 100.48% 99.99% 100.06% 100.02% 100.00%
4 Year 73.22% 99.10% 99.90% 100.63% 99.95% 100.09% 100.04% 100.00%
3 Year 74.10% 99.33% 99.86% 100.11% 99.93% 100.07% 100.05% 100.00%
All Year ex hi/lo 79.50% 99.60% 99.90% 100.07% 99.95% 99.97% 100.00% 100.00%
6 Year ex hi/lo 74.57% 99.50% 100.05% 100.17% 100.00% 100.04% 100.00% 100.00%
$ Weighted Averages
All Years 79.02% 99.67% 99.91% 100.13% 99.96% 99.96% 99.98% 100.00%
10 Year 77.32% 99.32% 100.00% 100.30% 99.99% 99.96%
8 Year 76.43% 99.58% 100.17% 100.36% 100.07% 100.04% 100.02% 100.00%
6 Year 73.95% 99.45% 100.21% 100.40% 100.00% 100.05% 100.03% 100.00%
4 Year 73.11% 99.06% 99.87% 100.54% 99.96% 100.08% 100.04% 100.00%
3 Year 73.75% 99.31% 99.84% 100.14% 99.94% 100.05% 100.05% 100.00%
Selected Pay Pattern 73.75% 99.31% 99.84% 100.14% 99.94% 100.05% 100.05% 100.00%
Incremental 73.75% 25.56% 0.53% 0.30% -0.19% 0.11% 0.00% -0.05%
Year 1 2 3 4 5 6 7 8 9 10 11 12 13 14 15 To Ult
Annual Pay Pattern 73.75% 25.56% 0.53% 0.30% -0.19% 0.11% 0.00% -0.05% 0.00% 0.00% 0.00% 0.00% 0.00% 0.00% 0.00% 0.00%
Discounted Value at 0.7%: 0.9947
Oliver, Wyman Limited
110

Exhibit 3Page 14
Province of AlbertaAlberta Automobile Insurance Rate Board2017 Commercial Automobile Optional Coverage Review
Spec Perils
Accident Paid Losses and Allocated Loss Adjustment Expenses - Data as of 12/31/2015 (Losses in $ 000s) Selected
Half Year 102 108 114 120 126 132 138 144 150 156 162 168 174 180 Ultimate
2002-1 288 288 288 288 288 288 288 288 288 288 288 288 288 288 288
2002-2 522 522 522 522 522 522 522 522 522 522 522 522 522 522
2003-1 412 412 412 412 412 412 412 412 412 412 412 412 412
2003-2 296 296 296 296 296 296 296 296 296 296 296 296
2004-1 263 263 263 263 263 263 263 263 263 263 263
2004-2 591 591 591 591 591 591 591 591 591 591
2005-1 315 315 315 315 315 315 315 315 315
2005-2 486 486 486 486 486 486 486 486
2006-1 466 466 466 466 466 466 466
2006-2 789 789 789 789 789 789
2007-1 288 288 288 288 288
2007-2 718 718 718 718
2008-1 389 389 389
2008-2 622 622
2009-1 532
2009-2 581
2010-1 332
2010-2 362
2011-1 208
2011-2 543
2012-1 323
2012-2 895
2013-1 341
2013-2 567
2014-1 232
2014-2 778
2015-1 276
2015-2 1,097
2016-1 444
2016-2 729
Accident Portion of Ultimate Losses Paid by Month of Development Selected
Year 108 120 132 144 156 168 180 Ultimate
2002 100.00% 100.00% 100.00% 100.00% 100.00% 100.00% 100.00% 810
2003 100.00% 100.00% 100.00% 100.00% 100.00% 100.00% 709
2004 100.00% 100.00% 100.00% 100.00% 100.00% 855
2005 100.00% 100.00% 100.00% 100.00% 802
2006 100.00% 100.00% 100.00% 1,256
2007 100.00% 100.00% 1,006
2008 100.00% 1,012
2009 1,113
2010 694
2011 750
2012 1,218
2013 908
2014 1,010
2015 1,373
2016 1,173
TRUE FALSE TRUE FALSE TRUE FALSE TRUE FALSE TRUE FALSE TRUE FALSE TRUE
Cumulative Paid Losses
Arithmetic Averages 108 120 132 144 156 168 180 Ultimate
All Years 100.00% 100.00% 100.00% 100.00% 100.00% 100.00% 100.00% 100.00%
10 Year
8 Year
6 Year 100.00% 100.00%
4 Year 100.00% 100.00% 100.00% 100.00%
3 Year 100.00% 100.00% 100.00% 100.00% 100.00%
All Year ex hi/lo 100.00% 100.00% 100.00% 100.00% 100.00%
6 Year ex hi/lo 100.00% 100.00%
$ Weighted Averages
All Years 100.00% 100.00% 100.00% 100.00% 100.00% 100.00% 100.00% 100.00%
10 Year
8 Year
6 Year 100.00% 100.00%
4 Year 100.00% 100.00% 100.00% 100.00%
3 Year 100.00% 100.00% 100.00% 100.00% 100.00%
Selected Pay Pattern 100.00% 100.00% 100.00% 100.00% 100.00% 100.00% 100.00% 100.00%
Incremental 0.00% 0.00% 0.00% 0.00% 0.00% 0.00% 0.00% 0.00%
Oliver, Wyman Limited
111
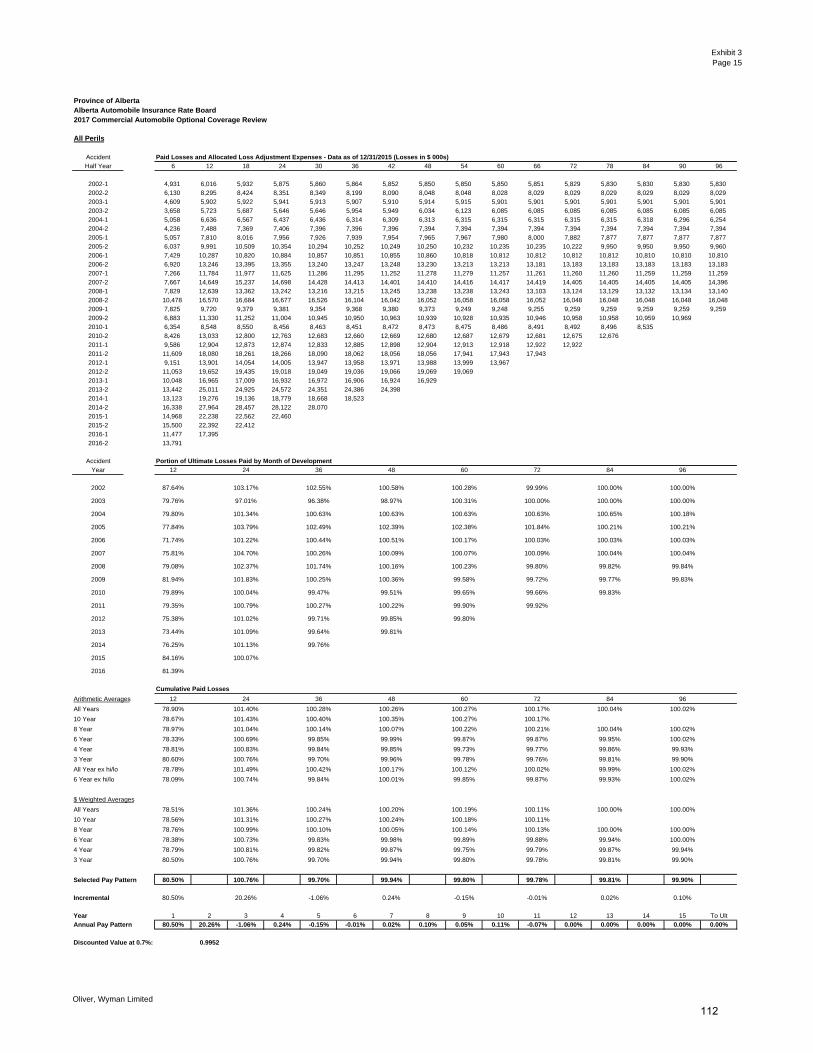
Exhibit 3Page 15
Province of AlbertaAlberta Automobile Insurance Rate Board2017 Commercial Automobile Optional Coverage Review
All Perils
Accident Paid Losses and Allocated Loss Adjustment Expenses - Data as of 12/31/2015 (Losses in $ 000s)
Half Year 6 12 18 24 30 36 42 48 54 60 66 72 78 84 90 96
2002-1 4,931 6,016 5,932 5,875 5,860 5,864 5,852 5,850 5,850 5,850 5,851 5,829 5,830 5,830 5,830 5,830
2002-2 6,130 8,295 8,424 8,351 8,349 8,199 8,090 8,048 8,048 8,028 8,029 8,029 8,029 8,029 8,029 8,029
2003-1 4,609 5,902 5,922 5,941 5,913 5,907 5,910 5,914 5,915 5,901 5,901 5,901 5,901 5,901 5,901 5,901
2003-2 3,658 5,723 5,687 5,646 5,646 5,954 5,949 6,034 6,123 6,085 6,085 6,085 6,085 6,085 6,085 6,085
2004-1 5,058 6,636 6,567 6,437 6,436 6,314 6,309 6,313 6,315 6,315 6,315 6,315 6,315 6,318 6,296 6,254
2004-2 4,236 7,488 7,369 7,406 7,396 7,396 7,396 7,394 7,394 7,394 7,394 7,394 7,394 7,394 7,394 7,394
2005-1 5,057 7,810 8,016 7,956 7,926 7,939 7,954 7,965 7,967 7,980 8,000 7,882 7,877 7,877 7,877 7,877
2005-2 6,037 9,991 10,509 10,354 10,294 10,252 10,249 10,250 10,232 10,235 10,235 10,222 9,950 9,950 9,950 9,960
2006-1 7,429 10,287 10,820 10,884 10,857 10,851 10,855 10,860 10,818 10,812 10,812 10,812 10,812 10,810 10,810 10,810
2006-2 6,920 13,246 13,395 13,355 13,240 13,247 13,248 13,230 13,213 13,213 13,181 13,183 13,183 13,183 13,183 13,183
2007-1 7,266 11,784 11,977 11,625 11,286 11,295 11,252 11,278 11,279 11,257 11,261 11,260 11,260 11,259 11,259 11,259
2007-2 7,667 14,649 15,237 14,698 14,428 14,413 14,401 14,410 14,416 14,417 14,419 14,405 14,405 14,405 14,405 14,396
2008-1 7,829 12,639 13,362 13,242 13,216 13,215 13,245 13,238 13,238 13,243 13,103 13,124 13,129 13,132 13,134 13,140
2008-2 10,478 16,570 16,684 16,677 16,526 16,104 16,042 16,052 16,058 16,058 16,052 16,048 16,048 16,048 16,048 16,048
2009-1 7,825 9,720 9,379 9,381 9,354 9,368 9,380 9,373 9,249 9,248 9,255 9,259 9,259 9,259 9,259 9,259
2009-2 6,883 11,330 11,252 11,004 10,945 10,950 10,963 10,939 10,928 10,935 10,946 10,958 10,958 10,959 10,969
2010-1 6,354 8,548 8,550 8,456 8,463 8,451 8,472 8,473 8,475 8,486 8,491 8,492 8,496 8,535
2010-2 8,426 13,033 12,800 12,763 12,683 12,660 12,669 12,680 12,687 12,679 12,681 12,675 12,676
2011-1 9,586 12,904 12,873 12,874 12,833 12,885 12,898 12,904 12,913 12,918 12,922 12,922
2011-2 11,609 18,080 18,261 18,266 18,090 18,062 18,056 18,056 17,941 17,943 17,943
2012-1 9,151 13,901 14,054 14,005 13,947 13,958 13,971 13,988 13,999 13,967
2012-2 11,053 19,652 19,435 19,018 19,049 19,036 19,066 19,069 19,069
2013-1 10,048 16,965 17,009 16,932 16,972 16,906 16,924 16,929
2013-2 13,442 25,011 24,925 24,572 24,351 24,386 24,398
2014-1 13,123 19,276 19,136 18,779 18,668 18,523
2014-2 16,338 27,964 28,457 28,122 28,070
2015-1 14,968 22,238 22,562 22,460
2015-2 15,500 22,392 22,412
2016-1 11,477 17,395
2016-2 13,791
Accident Portion of Ultimate Losses Paid by Month of Development
Year 12 24 36 48 60 72 84 96
FALSE
2002 TRUE 87.64% 103.17% 102.55% 100.58% 100.28% 99.99% 100.00% 100.00%FALSE
2003 TRUE 79.76% 97.01% 96.38% 98.97% 100.31% 100.00% 100.00% 100.00%FALSE
2004 TRUE 79.80% 101.34% 100.63% 100.63% 100.63% 100.63% 100.65% 100.18%FALSE
2005 TRUE 77.84% 103.79% 102.49% 102.39% 102.38% 101.84% 100.21% 100.21%FALSE
2006 TRUE 71.74% 101.22% 100.44% 100.51% 100.17% 100.03% 100.03% 100.03%FALSE
2007 TRUE 75.81% 104.70% 100.26% 100.09% 100.07% 100.09% 100.04% 100.04%FALSE
2008 TRUE 79.08% 102.37% 101.74% 100.16% 100.23% 99.80% 99.82% 99.84%FALSE
2009 TRUE 81.94% 101.83% 100.25% 100.36% 99.58% 99.72% 99.77% 99.83%FALSE
2010 TRUE 79.89% 100.04% 99.47% 99.51% 99.65% 99.66% 99.83%FALSE
2011 TRUE 79.35% 100.79% 100.27% 100.22% 99.90% 99.92%FALSE
2012 TRUE 75.38% 101.02% 99.71% 99.85% 99.80%FALSE
2013 TRUE 73.44% 101.09% 99.64% 99.81%FALSE
2014 TRUE 76.25% 101.13% 99.76%FALSE
2015 TRUE 84.16% 100.07%FALSE
2016 TRUE 81.39%
TRUE FALSE TRUE FALSE TRUE FALSE TRUE FALSE TRUE FALSE TRUE FALSE TRUE FALSE TRUE FALSE
Cumulative Paid Losses
Arithmetic Averages 12 24 36 48 60 72 84 96
All Years 78.90% 101.40% 100.28% 100.26% 100.27% 100.17% 100.04% 100.02%
10 Year 78.67% 101.43% 100.40% 100.35% 100.27% 100.17%
8 Year 78.97% 101.04% 100.14% 100.07% 100.22% 100.21% 100.04% 100.02%
6 Year 78.33% 100.69% 99.85% 99.99% 99.87% 99.87% 99.95% 100.02%
4 Year 78.81% 100.83% 99.84% 99.85% 99.73% 99.77% 99.86% 99.93%
3 Year 80.60% 100.76% 99.70% 99.96% 99.78% 99.76% 99.81% 99.90%
All Year ex hi/lo 78.78% 101.49% 100.42% 100.17% 100.12% 100.02% 99.99% 100.02%
6 Year ex hi/lo 78.09% 100.74% 99.84% 100.01% 99.85% 99.87% 99.93% 100.02%
$ Weighted Averages
All Years 78.51% 101.36% 100.24% 100.20% 100.19% 100.11% 100.00% 100.00%
10 Year 78.56% 101.31% 100.27% 100.24% 100.18% 100.11%
8 Year 78.76% 100.99% 100.10% 100.05% 100.14% 100.13% 100.00% 100.00%
6 Year 78.38% 100.73% 99.83% 99.98% 99.89% 99.88% 99.94% 100.00%
4 Year 78.79% 100.81% 99.82% 99.87% 99.75% 99.79% 99.87% 99.94%
3 Year 80.50% 100.76% 99.70% 99.94% 99.80% 99.78% 99.81% 99.90%
Selected Pay Pattern 80.50% 100.76% 99.70% 99.94% 99.80% 99.78% 99.81% 99.90%
Incremental 80.50% 20.26% -1.06% 0.24% -0.15% -0.01% 0.02% 0.10%
Year 1 2 3 4 5 6 7 8 9 10 11 12 13 14 15 To Ult
Annual Pay Pattern 80.50% 20.26% -1.06% 0.24% -0.15% -0.01% 0.02% 0.10% 0.05% 0.11% -0.07% 0.00% 0.00% 0.00% 0.00% 0.00%
Discounted Value at 0.7%: 0.9952
Oliver, Wyman Limited
112

Exhibit 3Page 16
Province of AlbertaAlberta Automobile Insurance Rate Board2017 Commercial Automobile Optional Coverage Review
All Perils
Accident Paid Losses and Allocated Loss Adjustment Expenses - Data as of 12/31/2015 (Losses in $ 000s) Selected
Half Year 102 108 114 120 126 132 138 144 150 156 162 168 174 180 Ultimate
2002-1 5,830 5,830 5,830 5,830 5,830 5,830 5,830 5,830 5,830 5,830 5,830 5,830 5,830 5,830 5,830
2002-2 8,029 8,029 8,029 8,029 8,029 8,029 8,029 8,029 8,029 8,029 8,029 8,029 8,029 8,029
2003-1 5,901 5,901 5,901 5,901 5,901 5,901 5,901 5,901 5,901 5,901 5,901 5,901 5,901
2003-2 6,085 6,085 6,085 6,085 6,085 6,085 6,085 6,085 6,085 6,085 6,085 6,085
2004-1 6,254 6,254 6,254 6,254 6,254 6,254 6,254 6,254 6,254 6,254 6,254
2004-2 7,394 7,394 7,369 7,369 7,369 7,369 7,369 7,369 7,369 7,369
2005-1 7,877 7,877 7,877 7,877 7,877 7,830 7,830 7,830 7,830
2005-2 9,960 9,960 9,960 9,960 9,960 9,960 9,960 9,960
2006-1 10,809 10,808 10,807 10,806 10,806 10,805 10,805
2006-2 13,180 13,180 13,180 13,180 13,180 13,180
2007-1 11,259 11,259 11,259 11,259 11,259
2007-2 14,396 14,396 14,396 14,396
2008-1 13,144 13,150 13,186
2008-2 16,048 16,048
2009-1 9,259
2009-2 11,003
2010-1 8,558
2010-2 12,688
2011-1 12,941
2011-2 17,951
2012-1 14,034
2012-2 19,070
2013-1 16,951
2013-2 24,455
2014-1 18,546
2014-2 28,160
2015-1 22,387
2015-2 22,455
2016-1 16,813
2016-2 21,504
Accident Portion of Ultimate Losses Paid by Month of Development Selected
Year 108 120 132 144 156 168 180 Ultimate
2002 100.00% 100.00% 100.00% 100.00% 100.00% 100.00% 100.00% 13,859
2003 100.00% 100.00% 100.00% 100.00% 100.00% 100.00% 11,987
2004 100.18% 100.00% 100.00% 100.00% 100.00% 13,624
2005 100.27% 100.27% 100.00% 100.00% 17,789
2006 100.01% 100.00% 100.00% 23,985
2007 100.00% 100.00% 25,655
2008 99.88% 29,234
2009 20,262
2010 21,246
2011 30,892
2012 33,104
2013 41,407
2014 46,706
2015 44,842
2016 38,317
TRUE FALSE TRUE FALSE TRUE FALSE TRUE FALSE TRUE FALSE TRUE FALSE TRUE
Cumulative Paid Losses
Arithmetic Averages 108 120 132 144 156 168 180 Ultimate
All Years 100.05% 100.04% 100.00% 100.00% 100.00% 100.00% 100.00% 100.00%
10 Year
8 Year
6 Year 100.06% 100.04%
4 Year 100.04% 100.07% 100.00% 100.00%
3 Year 99.96% 100.09% 100.00% 100.00% 100.00%
All Year ex hi/lo 100.04% 100.00% 100.00% 100.00% 100.00%
6 Year ex hi/lo 100.05% 100.00%
$ Weighted Averages
All Years 100.03% 100.04% 100.00% 100.00% 100.00% 100.00% 100.00% 100.00%
10 Year
8 Year
6 Year 100.03% 100.04%
4 Year 100.01% 100.06% 100.00% 100.00%
3 Year 99.96% 100.07% 100.00% 100.00% 100.00%
Selected Pay Pattern 99.96% 100.07% 100.00% 100.00% 100.00% 100.00% 100.00% 100.00%
Incremental 0.05% 0.11% -0.07% 0.00% 0.00% 0.00% 0.00% 0.00%
Oliver, Wyman Limited
113
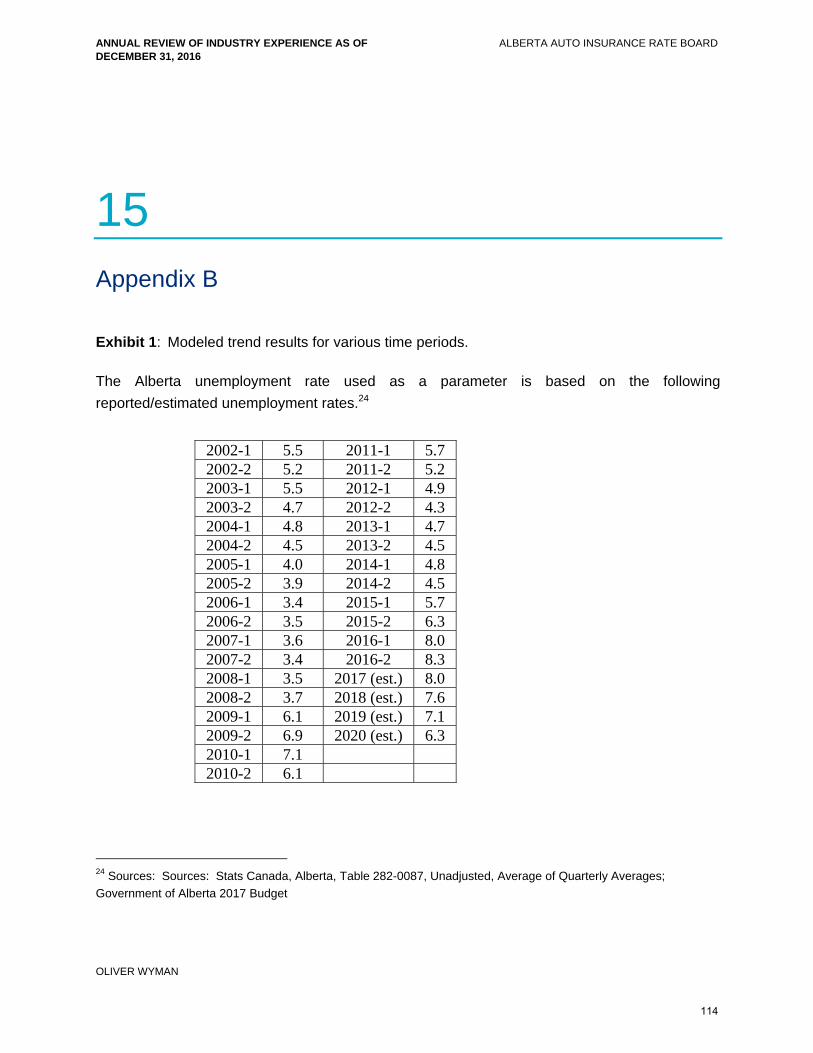
ANNUAL REVIEW OF INDUSTRY EXPERIENCE AS OF DECEMBER 31, 2016
ALBERTA AUTO INSURANCE RATE BOARD
OLIVER WYMAN
15 Appendix B
Exhibit 1: Modeled trend results for various time periods.
The Alberta unemployment rate used as a parameter is based on the following
reported/estimated unemployment rates.24
2002-1 5.5 2011-1 5.7 2002-2 5.2 2011-2 5.2 2003-1 5.5 2012-1 4.9 2003-2 4.7 2012-2 4.3 2004-1 4.8 2013-1 4.7 2004-2 4.5 2013-2 4.5 2005-1 4.0 2014-1 4.8 2005-2 3.9 2014-2 4.5 2006-1 3.4 2015-1 5.7 2006-2 3.5 2015-2 6.3 2007-1 3.6 2016-1 8.0 2007-2 3.4 2016-2 8.3 2008-1 3.5 2017 (est.) 8.0 2008-2 3.7 2018 (est.) 7.6 2009-1 6.1 2019 (est.) 7.1 2009-2 6.9 2020 (est.) 6.3 2010-1 7.1 2010-2 6.1
24 Sources: Sources: Stats Canada, Alberta, Table 282-0087, Unadjusted, Average of Quarterly Averages;
Government of Alberta 2017 Budget
114

Exhibit BPage 1 (a)
Province of AlbertaCommercial Automobile (excl. Farmers)
Third Party Liability - Bodily InjuryWith Seasonality and Unemployment; No Exclusions
Loss Cost Severity Frequency
Date Trend Conf. Int. Adj. R2 T Pval Time
T Pval
Seasonality
T Pval
Unemploym
ent Trend Conf. Int. Adj. R2 T Pval Time
T Pval
Seasonality
T Pval
Unemploym
ent Trend Conf. Int. Adj. R2 T Pval Time
T Pval
Seasonality
T Pval
Unemploym
ent
2005.1‐2016.2 2.7 +‐1.8 0.66 0.5% 0.0% 0.0% 6.4 +‐1.7 0.83 0.0% 6.4% 84.9% ‐3.5 +‐1.3 0.89 0.0% 0.1% 0.0%
2005.2‐2016.2 2.7 +‐2 0.65 0.8% 0.0% 0.0% 6.1 +‐1.7 0.8 0.0% 10.5% 91.6% ‐3.2 +‐1.3 0.9 0.0% 0.0% 0.0%
2006.1‐2016.2 3 +‐2.1 0.65 0.7% 0.1% 0.0% 6 +‐1.9 0.78 0.0% 11.5% 92.7% ‐2.9 +‐1.3 0.89 0.0% 0.1% 0.0%
2006.2‐2016.2 3.5 +‐2 0.71 0.2% 0.0% 0.0% 6.4 +‐1.9 0.8 0.0% 5.6% 96.0% ‐2.7 +‐1.4 0.89 0.1% 0.1% 0.0%
2007.1‐2016.2 4.1 +‐1.9 0.76 0.0% 0.0% 0.0% 6.8 +‐1.9 0.82 0.0% 10.0% 88.4% ‐2.5 +‐1.4 0.87 0.2% 0.2% 0.0%
2007.2‐2016.2 4.4 +‐1.9 0.77 0.0% 0.0% 0.0% 6.8 +‐2.1 0.79 0.0% 12.2% 89.1% ‐2.3 +‐1.4 0.87 0.4% 0.1% 0.0%
2008.1‐2016.2 4.7 +‐2 0.79 0.0% 0.0% 0.0% 6.9 +‐2.2 0.78 0.0% 17.2% 82.0% ‐2 +‐1.5 0.83 1.1% 0.2% 0.0%
2008.2‐2016.2 5 +‐2.1 0.79 0.0% 0.0% 0.1% 7.3 +‐2.3 0.78 0.0% 11.4% 59.2% ‐2.2 +‐1.6 0.82 1.3% 0.5% 0.0%
2009.1‐2016.2 5.3 +‐2.3 0.8 0.0% 0.1% 0.2% 8.1 +‐2.1 0.85 0.0% 19.2% 20.5% ‐2.6 +‐1.6 0.84 0.4% 0.2% 0.0%
2009.2‐2016.2 5.2 +‐2.6 0.75 0.1% 0.2% 0.4% 8.3 +‐2.5 0.82 0.0% 18.6% 24.4% ‐2.9 +‐1.8 0.85 0.5% 0.4% 0.0%
2010.1‐2016.2 5.7 +‐3.2 0.75 0.2% 0.6% 0.5% 8.3 +‐3.1 0.8 0.0% 23.0% 30.2% ‐2.5 +‐2.1 0.85 2.9% 1.1% 0.0%
2010.2‐2016.2 6.3 +‐4.2 0.66 0.7% 0.8% 1.0% 8.3 +‐4.1 0.76 0.1% 27.1% 38.0% ‐1.8 +‐2.7 0.86 16.6% 1.0% 0.0%
2011.1‐2016.2 3.6 +‐4.7 0.71 11.3% 0.2% 5.6% 5.4 +‐4.3 0.8 1.8% 6.2% 6.3% ‐1.7 +‐3.9 0.85 33.7% 2.3% 0.1%
2011.2‐2016.2 4 +‐6.8 0.64 20.2% 0.5% 9.7% 3 +‐5.1 0.81 19.4% 8.3% 2.2% 0.9 +‐4.3 0.91 63.5% 0.6% 0.0%
2012.1‐2016.2 4 +‐11.1 0.62 39.8% 1.5% 20.1% 2.9 +‐8.2 0.8 40.9% 14.0% 7.0% 1.1 +‐7 0.9 72.3% 1.9% 0.3%
2012.2‐2016.2 ‐3.2 +‐11.2 0.71 50.7% 1.0% 79.8% ‐0.3 +‐11.4 0.78 94.5% 18.1% 5.8% ‐2.9 +‐8.4 0.93 43.0% 2.0% 1.6%
2013.1‐2016.2 ‐7.8 +‐15.3 0.74 24.1% 1.3% 69.6% ‐1.2 +‐18.7 0.75 86.9% 26.4% 12.4% ‐6.7 +‐11.1 0.94 17.9% 1.8% 6.7%
2013.2‐2016.2 ‐1.4 +‐26.1 0.79 87.2% 2.0% 74.9% 11.8 +‐18.8 0.94 12.3% 7.7% 45.7% ‐11.8 +‐15.4 0.96 10.4% 2.4% 27.0%2014.1‐2016.2 24.4 +‐82.9 0.85 27.1% 17.7% 22.1% 31.8 +‐43.2 0.98 6.6% 62.1% 30.8% ‐5.6 +‐62.9 0.93 73.1% 22.2% 40.1%
Loss Cost Severity Frequency
Date Trend Conf. Int. Adj. R2 T Pval Time
T Pval
Seasonality
T Pval
Unemploym
ent Trend Conf. Int. Adj. R2 T Pval Time
T Pval
Seasonality
T Pval
Unemploym
ent Trend Conf. Int. Adj. R2 T Pval Time
T Pval
Seasonality
T Pval
Unemploym
ent
2004.2‐2016.1 1.8 +‐1.8 0.65 4.6% 0.0% 0.0% 5.7 +‐1.6 0.76 0.0% 6.8% 71.0% ‐3.7 +‐1.2 0.89 0.0% 0.1% 0.0%
2005.1‐2016.1 2.6 +‐1.7 0.71 0.4% 0.0% 0.0% 6.4 +‐1.6 0.81 0.0% 13.4% 40.9% ‐3.5 +‐1.3 0.88 0.0% 0.3% 0.0%
2005.2‐2016.1 2.6 +‐1.8 0.71 0.8% 0.1% 0.0% 6 +‐1.6 0.79 0.0% 22.9% 40.6% ‐3.2 +‐1.3 0.89 0.0% 0.1% 0.0%
2006.1‐2016.1 2.8 +‐2 0.71 0.6% 0.2% 0.0% 5.9 +‐1.8 0.76 0.0% 23.5% 42.7% ‐2.9 +‐1.3 0.88 0.0% 0.2% 0.0%
2006.2‐2016.1 3.3 +‐1.9 0.75 0.2% 0.0% 0.0% 6.2 +‐1.8 0.78 0.0% 13.3% 54.8% ‐2.8 +‐1.4 0.87 0.1% 0.2% 0.0%
2007.1‐2016.1 3.9 +‐1.8 0.79 0.0% 0.0% 0.0% 6.6 +‐1.8 0.79 0.0% 20.2% 62.4% ‐2.5 +‐1.5 0.85 0.3% 0.4% 0.0%
2007.2‐2016.1 4.1 +‐1.9 0.8 0.0% 0.1% 0.0% 6.4 +‐2 0.75 0.0% 27.8% 58.2% ‐2.2 +‐1.5 0.84 0.7% 0.2% 0.0%
2008.1‐2016.1 4.4 +‐2 0.81 0.0% 0.1% 0.0% 6.5 +‐2.2 0.73 0.0% 32.6% 65.4% ‐2 +‐1.6 0.8 2.0% 0.3% 0.0%
2008.2‐2016.1 4.6 +‐2.2 0.8 0.1% 0.2% 0.1% 6.8 +‐2.4 0.71 0.0% 26.7% 89.2% ‐2.1 +‐1.8 0.79 2.6% 0.9% 0.0%
2009.1‐2016.1 4.9 +‐2.5 0.8 0.1% 0.3% 0.3% 7.8 +‐2.4 0.79 0.0% 31.9% 52.0% ‐2.7 +‐1.8 0.81 0.9% 0.5% 0.0%
2009.2‐2016.1 4.6 +‐3 0.75 0.5% 0.7% 0.5% 8 +‐2.8 0.75 0.0% 31.4% 53.9% ‐3.1 +‐2.1 0.81 0.9% 1.1% 0.0%
2010.1‐2016.1 5.2 +‐3.4 0.76 0.6% 2.1% 0.6% 8.1 +‐3.4 0.72 0.0% 38.9% 62.5% ‐2.7 +‐2.4 0.82 3.3% 3.0% 0.0%
2010.2‐2016.1 5.9 +‐4.3 0.68 1.2% 2.4% 1.0% 8 +‐4.4 0.65 0.2% 42.6% 68.0% ‐2 +‐2.9 0.83 15.7% 2.8% 0.1%
2011.1‐2016.1 3.6 +‐5 0.71 12.8% 1.0% 6.4% 5.4 +‐4.7 0.67 2.7% 11.9% 16.2% ‐1.7 +‐4.1 0.83 35.8% 6.6% 0.4%
2011.2‐2016.1 4 +‐7.3 0.64 22.2% 1.7% 10.3% 3 +‐5.7 0.65 23.0% 15.0% 6.6% 0.9 +‐4.5 0.9 63.4% 2.1% 0.1%
2012.1‐2016.1 4.8 +‐12.7 0.62 36.3% 5.8% 19.5% 3.1 +‐9.8 0.62 45.0% 25.5% 17.9% 1.7 +‐7.8 0.89 59.6% 7.2% 0.8%
2012.2‐2016.1 ‐2.5 +‐12.6 0.73 62.0% 3.9% 52.1% ‐0.2 +‐13.9 0.55 97.0% 31.7% 14.3% ‐2.3 +‐9.2 0.93 53.6% 7.0% 2.2%
2013.1‐2016.1 ‐6.7 +‐19.6 0.74 36.9% 5.5% 97.2% ‐1 +‐25.8 0.47 91.0% 42.8% 25.9% ‐5.8 +‐13.8 0.94 28.7% 7.1% 8.8%2013.2‐2016.1 ‐1.1 +‐41.3 0.76 92.1% 9.3% 67.8% 11.7 +‐30.8 0.86 22.3% 18.1% 52.6% ‐11.4 +‐17.9 0.97 12.3% 7.5% 18.3%
115
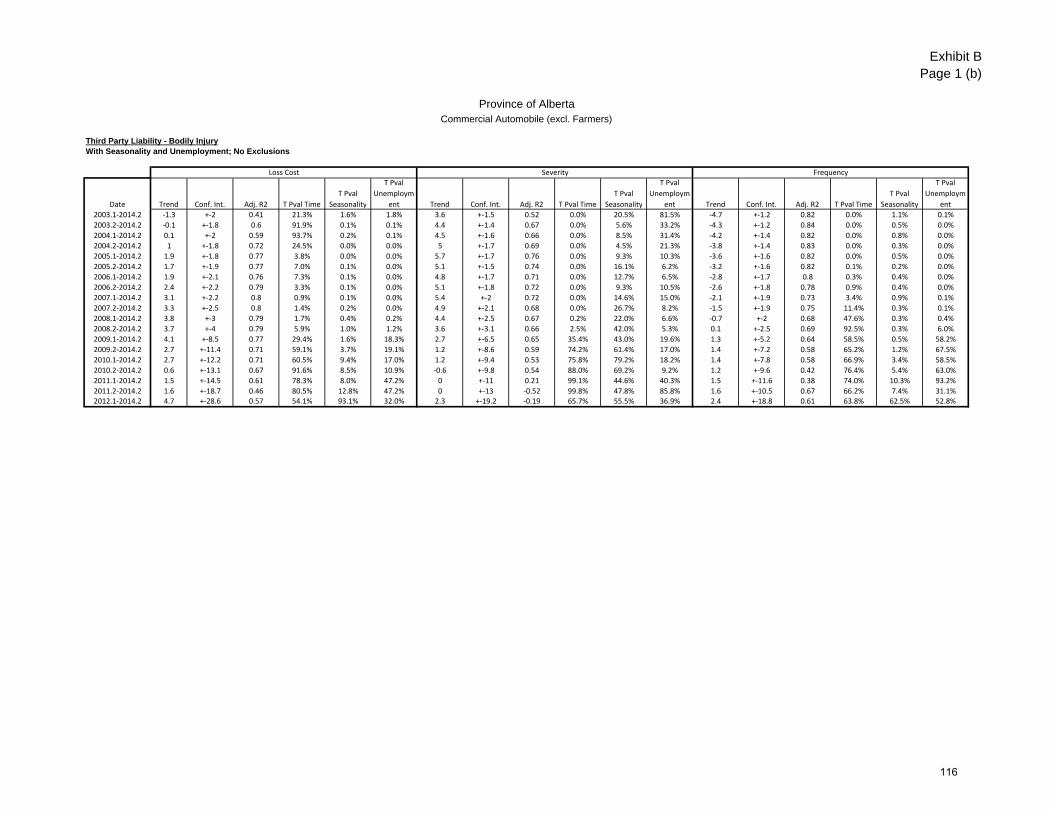
Exhibit BPage 1 (b)
Province of AlbertaCommercial Automobile (excl. Farmers)
Third Party Liability - Bodily InjuryWith Seasonality and Unemployment; No Exclusions
Loss Cost Severity Frequency
Date Trend Conf. Int. Adj. R2 T Pval Time
T Pval
Seasonality
T Pval
Unemploym
ent Trend Conf. Int. Adj. R2 T Pval Time
T Pval
Seasonality
T Pval
Unemploym
ent Trend Conf. Int. Adj. R2 T Pval Time
T Pval
Seasonality
T Pval
Unemploym
ent
2003.1‐2014.2 ‐1.3 +‐2 0.41 21.3% 1.6% 1.8% 3.6 +‐1.5 0.52 0.0% 20.5% 81.5% ‐4.7 +‐1.2 0.82 0.0% 1.1% 0.1%
2003.2‐2014.2 ‐0.1 +‐1.8 0.6 91.9% 0.1% 0.1% 4.4 +‐1.4 0.67 0.0% 5.6% 33.2% ‐4.3 +‐1.2 0.84 0.0% 0.5% 0.0%
2004.1‐2014.2 0.1 +‐2 0.59 93.7% 0.2% 0.1% 4.5 +‐1.6 0.66 0.0% 8.5% 31.4% ‐4.2 +‐1.4 0.82 0.0% 0.8% 0.0%
2004.2‐2014.2 1 +‐1.8 0.72 24.5% 0.0% 0.0% 5 +‐1.7 0.69 0.0% 4.5% 21.3% ‐3.8 +‐1.4 0.83 0.0% 0.3% 0.0%
2005.1‐2014.2 1.9 +‐1.8 0.77 3.8% 0.0% 0.0% 5.7 +‐1.7 0.76 0.0% 9.3% 10.3% ‐3.6 +‐1.6 0.82 0.0% 0.5% 0.0%
2005.2‐2014.2 1.7 +‐1.9 0.77 7.0% 0.1% 0.0% 5.1 +‐1.5 0.74 0.0% 16.1% 6.2% ‐3.2 +‐1.6 0.82 0.1% 0.2% 0.0%
2006.1‐2014.2 1.9 +‐2.1 0.76 7.3% 0.1% 0.0% 4.8 +‐1.7 0.71 0.0% 12.7% 6.5% ‐2.8 +‐1.7 0.8 0.3% 0.4% 0.0%
2006.2‐2014.2 2.4 +‐2.2 0.79 3.3% 0.1% 0.0% 5.1 +‐1.8 0.72 0.0% 9.3% 10.5% ‐2.6 +‐1.8 0.78 0.9% 0.4% 0.0%
2007.1‐2014.2 3.1 +‐2.2 0.8 0.9% 0.1% 0.0% 5.4 +‐2 0.72 0.0% 14.6% 15.0% ‐2.1 +‐1.9 0.73 3.4% 0.9% 0.1%
2007.2‐2014.2 3.3 +‐2.5 0.8 1.4% 0.2% 0.0% 4.9 +‐2.1 0.68 0.0% 26.7% 8.2% ‐1.5 +‐1.9 0.75 11.4% 0.3% 0.1%
2008.1‐2014.2 3.8 +‐3 0.79 1.7% 0.4% 0.2% 4.4 +‐2.5 0.67 0.2% 22.0% 6.6% ‐0.7 +‐2 0.68 47.6% 0.3% 0.4%
2008.2‐2014.2 3.7 +‐4 0.79 5.9% 1.0% 1.2% 3.6 +‐3.1 0.66 2.5% 42.0% 5.3% 0.1 +‐2.5 0.69 92.5% 0.3% 6.0%
2009.1‐2014.2 4.1 +‐8.5 0.77 29.4% 1.6% 18.3% 2.7 +‐6.5 0.65 35.4% 43.0% 19.6% 1.3 +‐5.2 0.64 58.5% 0.5% 58.2%
2009.2‐2014.2 2.7 +‐11.4 0.71 59.1% 3.7% 19.1% 1.2 +‐8.6 0.59 74.2% 61.4% 17.0% 1.4 +‐7.2 0.58 65.2% 1.2% 67.5%
2010.1‐2014.2 2.7 +‐12.2 0.71 60.5% 9.4% 17.0% 1.2 +‐9.4 0.53 75.8% 79.2% 18.2% 1.4 +‐7.8 0.58 66.9% 3.4% 58.5%
2010.2‐2014.2 0.6 +‐13.1 0.67 91.6% 8.5% 10.9% ‐0.6 +‐9.8 0.54 88.0% 69.2% 9.2% 1.2 +‐9.6 0.42 76.4% 5.4% 63.0%
2011.1‐2014.2 1.5 +‐14.5 0.61 78.3% 8.0% 47.2% 0 +‐11 0.21 99.1% 44.6% 40.3% 1.5 +‐11.6 0.38 74.0% 10.3% 93.2%
2011.2‐2014.2 1.6 +‐18.7 0.46 80.5% 12.8% 47.2% 0 +‐13 ‐0.52 99.8% 47.8% 85.8% 1.6 +‐10.5 0.67 66.2% 7.4% 31.1%2012.1‐2014.2 4.7 +‐28.6 0.57 54.1% 93.1% 32.0% 2.3 +‐19.2 ‐0.19 65.7% 55.5% 36.9% 2.4 +‐18.8 0.61 63.8% 62.5% 52.8%
116
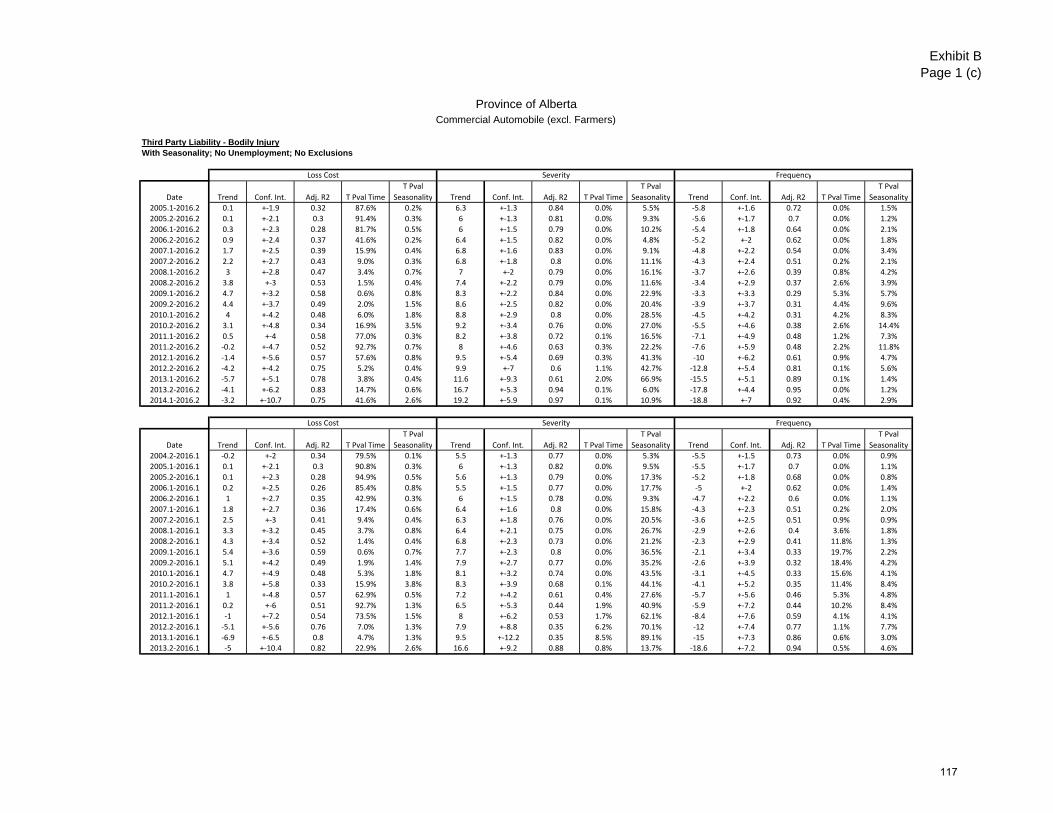
Exhibit BPage 1 (c)
Province of AlbertaCommercial Automobile (excl. Farmers)
Third Party Liability - Bodily InjuryWith Seasonality; No Unemployment; No Exclusions
Loss Cost Severity Frequency
Date Trend Conf. Int. Adj. R2 T Pval Time
T Pval
Seasonality Trend Conf. Int. Adj. R2 T Pval Time
T Pval
Seasonality Trend Conf. Int. Adj. R2 T Pval Time
T Pval
Seasonality
2005.1‐2016.2 0.1 +‐1.9 0.32 87.6% 0.2% 6.3 +‐1.3 0.84 0.0% 5.5% ‐5.8 +‐1.6 0.72 0.0% 1.5%
2005.2‐2016.2 0.1 +‐2.1 0.3 91.4% 0.3% 6 +‐1.3 0.81 0.0% 9.3% ‐5.6 +‐1.7 0.7 0.0% 1.2%
2006.1‐2016.2 0.3 +‐2.3 0.28 81.7% 0.5% 6 +‐1.5 0.79 0.0% 10.2% ‐5.4 +‐1.8 0.64 0.0% 2.1%
2006.2‐2016.2 0.9 +‐2.4 0.37 41.6% 0.2% 6.4 +‐1.5 0.82 0.0% 4.8% ‐5.2 +‐2 0.62 0.0% 1.8%
2007.1‐2016.2 1.7 +‐2.5 0.39 15.9% 0.4% 6.8 +‐1.6 0.83 0.0% 9.1% ‐4.8 +‐2.2 0.54 0.0% 3.4%
2007.2‐2016.2 2.2 +‐2.7 0.43 9.0% 0.3% 6.8 +‐1.8 0.8 0.0% 11.1% ‐4.3 +‐2.4 0.51 0.2% 2.1%
2008.1‐2016.2 3 +‐2.8 0.47 3.4% 0.7% 7 +‐2 0.79 0.0% 16.1% ‐3.7 +‐2.6 0.39 0.8% 4.2%
2008.2‐2016.2 3.8 +‐3 0.53 1.5% 0.4% 7.4 +‐2.2 0.79 0.0% 11.6% ‐3.4 +‐2.9 0.37 2.6% 3.9%
2009.1‐2016.2 4.7 +‐3.2 0.58 0.6% 0.8% 8.3 +‐2.2 0.84 0.0% 22.9% ‐3.3 +‐3.3 0.29 5.3% 5.7%
2009.2‐2016.2 4.4 +‐3.7 0.49 2.0% 1.5% 8.6 +‐2.5 0.82 0.0% 20.4% ‐3.9 +‐3.7 0.31 4.4% 9.6%
2010.1‐2016.2 4 +‐4.2 0.48 6.0% 1.8% 8.8 +‐2.9 0.8 0.0% 28.5% ‐4.5 +‐4.2 0.31 4.2% 8.3%
2010.2‐2016.2 3.1 +‐4.8 0.34 16.9% 3.5% 9.2 +‐3.4 0.76 0.0% 27.0% ‐5.5 +‐4.6 0.38 2.6% 14.4%
2011.1‐2016.2 0.5 +‐4 0.58 77.0% 0.3% 8.2 +‐3.8 0.72 0.1% 16.5% ‐7.1 +‐4.9 0.48 1.2% 7.3%
2011.2‐2016.2 ‐0.2 +‐4.7 0.52 92.7% 0.7% 8 +‐4.6 0.63 0.3% 22.2% ‐7.6 +‐5.9 0.48 2.2% 11.8%
2012.1‐2016.2 ‐1.4 +‐5.6 0.57 57.6% 0.8% 9.5 +‐5.4 0.69 0.3% 41.3% ‐10 +‐6.2 0.61 0.9% 4.7%
2012.2‐2016.2 ‐4.2 +‐4.2 0.75 5.2% 0.4% 9.9 +‐7 0.6 1.1% 42.7% ‐12.8 +‐5.4 0.81 0.1% 5.6%
2013.1‐2016.2 ‐5.7 +‐5.1 0.78 3.8% 0.4% 11.6 +‐9.3 0.61 2.0% 66.9% ‐15.5 +‐5.1 0.89 0.1% 1.4%
2013.2‐2016.2 ‐4.1 +‐6.2 0.83 14.7% 0.6% 16.7 +‐5.3 0.94 0.1% 6.0% ‐17.8 +‐4.4 0.95 0.0% 1.2%2014.1‐2016.2 ‐3.2 +‐10.7 0.75 41.6% 2.6% 19.2 +‐5.9 0.97 0.1% 10.9% ‐18.8 +‐7 0.92 0.4% 2.9%
Loss Cost Severity Frequency
Date Trend Conf. Int. Adj. R2 T Pval Time
T Pval
Seasonality Trend Conf. Int. Adj. R2 T Pval Time
T Pval
Seasonality Trend Conf. Int. Adj. R2 T Pval Time
T Pval
Seasonality
2004.2‐2016.1 ‐0.2 +‐2 0.34 79.5% 0.1% 5.5 +‐1.3 0.77 0.0% 5.3% ‐5.5 +‐1.5 0.73 0.0% 0.9%
2005.1‐2016.1 0.1 +‐2.1 0.3 90.8% 0.3% 6 +‐1.3 0.82 0.0% 9.5% ‐5.5 +‐1.7 0.7 0.0% 1.1%
2005.2‐2016.1 0.1 +‐2.3 0.28 94.9% 0.5% 5.6 +‐1.3 0.79 0.0% 17.3% ‐5.2 +‐1.8 0.68 0.0% 0.8%
2006.1‐2016.1 0.2 +‐2.5 0.26 85.4% 0.8% 5.5 +‐1.5 0.77 0.0% 17.7% ‐5 +‐2 0.62 0.0% 1.4%
2006.2‐2016.1 1 +‐2.7 0.35 42.9% 0.3% 6 +‐1.5 0.78 0.0% 9.3% ‐4.7 +‐2.2 0.6 0.0% 1.1%
2007.1‐2016.1 1.8 +‐2.7 0.36 17.4% 0.6% 6.4 +‐1.6 0.8 0.0% 15.8% ‐4.3 +‐2.3 0.51 0.2% 2.0%
2007.2‐2016.1 2.5 +‐3 0.41 9.4% 0.4% 6.3 +‐1.8 0.76 0.0% 20.5% ‐3.6 +‐2.5 0.51 0.9% 0.9%
2008.1‐2016.1 3.3 +‐3.2 0.45 3.7% 0.8% 6.4 +‐2.1 0.75 0.0% 26.7% ‐2.9 +‐2.6 0.4 3.6% 1.8%
2008.2‐2016.1 4.3 +‐3.4 0.52 1.4% 0.4% 6.8 +‐2.3 0.73 0.0% 21.2% ‐2.3 +‐2.9 0.41 11.8% 1.3%
2009.1‐2016.1 5.4 +‐3.6 0.59 0.6% 0.7% 7.7 +‐2.3 0.8 0.0% 36.5% ‐2.1 +‐3.4 0.33 19.7% 2.2%
2009.2‐2016.1 5.1 +‐4.2 0.49 1.9% 1.4% 7.9 +‐2.7 0.77 0.0% 35.2% ‐2.6 +‐3.9 0.32 18.4% 4.2%
2010.1‐2016.1 4.7 +‐4.9 0.48 5.3% 1.8% 8.1 +‐3.2 0.74 0.0% 43.5% ‐3.1 +‐4.5 0.33 15.6% 4.1%
2010.2‐2016.1 3.8 +‐5.8 0.33 15.9% 3.8% 8.3 +‐3.9 0.68 0.1% 44.1% ‐4.1 +‐5.2 0.35 11.4% 8.4%
2011.1‐2016.1 1 +‐4.8 0.57 62.9% 0.5% 7.2 +‐4.2 0.61 0.4% 27.6% ‐5.7 +‐5.6 0.46 5.3% 4.8%
2011.2‐2016.1 0.2 +‐6 0.51 92.7% 1.3% 6.5 +‐5.3 0.44 1.9% 40.9% ‐5.9 +‐7.2 0.44 10.2% 8.4%
2012.1‐2016.1 ‐1 +‐7.2 0.54 73.5% 1.5% 8 +‐6.2 0.53 1.7% 62.1% ‐8.4 +‐7.6 0.59 4.1% 4.1%
2012.2‐2016.1 ‐5.1 +‐5.6 0.76 7.0% 1.3% 7.9 +‐8.8 0.35 6.2% 70.1% ‐12 +‐7.4 0.77 1.1% 7.7%
2013.1‐2016.1 ‐6.9 +‐6.5 0.8 4.7% 1.3% 9.5 +‐12.2 0.35 8.5% 89.1% ‐15 +‐7.3 0.86 0.6% 3.0%2013.2‐2016.1 ‐5 +‐10.4 0.82 22.9% 2.6% 16.6 +‐9.2 0.88 0.8% 13.7% ‐18.6 +‐7.2 0.94 0.5% 4.6%
117

Exhibit BPage 1 (d)
Province of AlbertaCommercial Automobile (excl. Farmers)
Third Party Liability - Bodily InjuryWith Seasonality; No Unemployment; No Exclusions
Loss Cost Severity Frequency
Date Trend Conf. Int. Adj. R2 T Pval Time
T Pval
Seasonality Trend Conf. Int. Adj. R2 T Pval Time
T Pval
Seasonality Trend Conf. Int. Adj. R2 T Pval Time
T Pval
Seasonality2003.1‐2014.2 ‐1.9 +‐2.2 0.25 9.2% 1.5% 3.5 +‐1.5 0.55 0.0% 18.0% ‐5.2 +‐1.5 0.7 0.0% 1.8%2003.2‐2014.2 ‐1.2 +‐2.2 0.3 29.0% 0.4% 4.2 +‐1.3 0.67 0.0% 4.5% ‐5.1 +‐1.6 0.68 0.0% 1.8%2004.1‐2014.2 ‐1.2 +‐2.4 0.28 31.6% 0.6% 4.2 +‐1.5 0.66 0.0% 6.4% ‐5.2 +‐1.8 0.65 0.0% 2.0%2004.2‐2014.2 ‐0.6 +‐2.5 0.33 63.9% 0.3% 4.6 +‐1.6 0.68 0.0% 3.7% ‐5 +‐1.9 0.62 0.0% 1.7%2005.1‐2014.2 ‐0.1 +‐2.8 0.28 93.1% 0.7% 5.1 +‐1.6 0.74 0.0% 7.4% ‐5 +‐2.1 0.57 0.0% 2.2%2005.2‐2014.2 ‐0.2 +‐3.1 0.26 90.0% 1.1% 4.6 +‐1.6 0.69 0.0% 13.1% ‐4.5 +‐2.3 0.55 0.1% 1.4%2006.1‐2014.2 0 +‐3.5 0.23 99.7% 1.8% 4.3 +‐1.7 0.66 0.0% 10.8% ‐4.1 +‐2.6 0.45 0.4% 2.8%2006.2‐2014.2 1 +‐3.7 0.32 56.0% 0.9% 4.7 +‐1.9 0.68 0.0% 6.6% ‐3.5 +‐2.8 0.44 1.8% 1.8%2007.1‐2014.2 2.3 +‐3.9 0.34 23.3% 1.8% 5.2 +‐2.1 0.69 0.0% 12.1% ‐2.8 +‐3 0.29 7.3% 3.9%2007.2‐2014.2 3.2 +‐4.3 0.4 12.4% 1.2% 4.9 +‐2.3 0.61 0.0% 18.1% ‐1.6 +‐3 0.38 28.0% 1.0%2008.1‐2014.2 4.8 +‐4.6 0.47 4.0% 2.6% 4.8 +‐2.7 0.57 0.2% 21.6% ‐0.1 +‐2.8 0.32 95.3% 1.6%2008.2‐2014.2 6.5 +‐4.8 0.6 1.1% 0.9% 5.1 +‐3.2 0.52 0.4% 21.2% 1.3 +‐2.5 0.58 28.4% 0.2%2009.1‐2014.2 8.8 +‐4.7 0.74 0.2% 1.5% 6.3 +‐3.5 0.62 0.2% 39.5% 2.4 +‐2.5 0.67 5.5% 0.3%2009.2‐2014.2 9.1 +‐5.7 0.67 0.5% 2.4% 6.3 +‐4.3 0.52 0.8% 43.7% 2.6 +‐3 0.62 7.9% 0.5%2010.1‐2014.2 9.5 +‐7.3 0.66 1.5% 4.9% 6.3 +‐5.5 0.45 2.7% 49.1% 3 +‐3.9 0.62 10.5% 1.5%2010.2‐2014.2 9 +‐9.3 0.51 4.8% 8.6% 6.1 +‐7.1 0.28 7.3% 56.3% 2.8 +‐5 0.49 21.8% 3.1%2011.1‐2014.2 4.6 +‐9.1 0.64 24.6% 2.4% 2.8 +‐7.1 0.23 35.7% 19.9% 1.7 +‐6.6 0.5 52.4% 4.2%2011.2‐2014.2 4.3 +‐13.2 0.5 40.3% 5.5% 0.4 +‐8.2 ‐0.15 88.7% 33.7% 3.9 +‐8.1 0.63 24.9% 3.3%2012.1‐2014.2 2.7 +‐22.4 0.47 72.0% 10.7% 1.1 +‐14.3 ‐0.32 82.3% 50.6% 1.6 +‐12.4 0.67 70.6% 5.0%
118
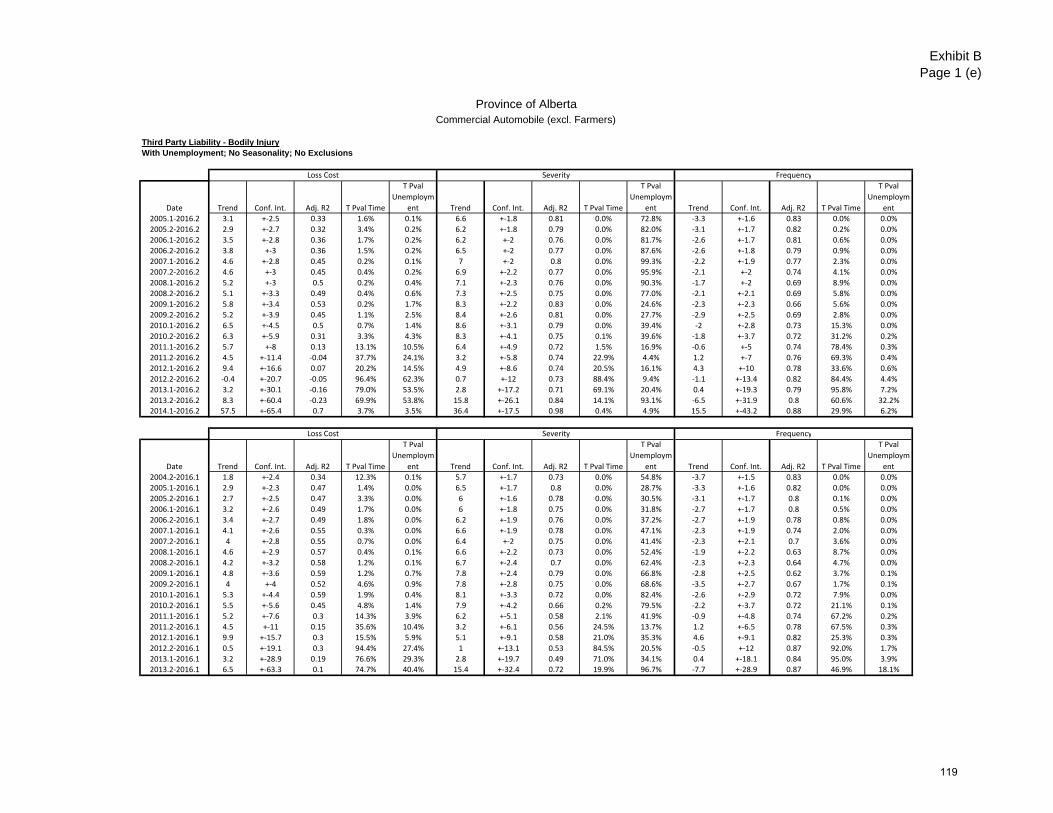
Exhibit BPage 1 (e)
Province of AlbertaCommercial Automobile (excl. Farmers)
Third Party Liability - Bodily InjuryWith Unemployment; No Seasonality; No Exclusions
Loss Cost Severity Frequency
Date Trend Conf. Int. Adj. R2 T Pval Time
T Pval
Unemploym
ent Trend Conf. Int. Adj. R2 T Pval Time
T Pval
Unemploym
ent Trend Conf. Int. Adj. R2 T Pval Time
T Pval
Unemploym
ent
2005.1‐2016.2 3.1 +‐2.5 0.33 1.6% 0.1% 6.6 +‐1.8 0.81 0.0% 72.8% ‐3.3 +‐1.6 0.83 0.0% 0.0%
2005.2‐2016.2 2.9 +‐2.7 0.32 3.4% 0.2% 6.2 +‐1.8 0.79 0.0% 82.0% ‐3.1 +‐1.7 0.82 0.2% 0.0%
2006.1‐2016.2 3.5 +‐2.8 0.36 1.7% 0.2% 6.2 +‐2 0.76 0.0% 81.7% ‐2.6 +‐1.7 0.81 0.6% 0.0%
2006.2‐2016.2 3.8 +‐3 0.36 1.5% 0.2% 6.5 +‐2 0.77 0.0% 87.6% ‐2.6 +‐1.8 0.79 0.9% 0.0%
2007.1‐2016.2 4.6 +‐2.8 0.45 0.2% 0.1% 7 +‐2 0.8 0.0% 99.3% ‐2.2 +‐1.9 0.77 2.3% 0.0%
2007.2‐2016.2 4.6 +‐3 0.45 0.4% 0.2% 6.9 +‐2.2 0.77 0.0% 95.9% ‐2.1 +‐2 0.74 4.1% 0.0%
2008.1‐2016.2 5.2 +‐3 0.5 0.2% 0.4% 7.1 +‐2.3 0.76 0.0% 90.3% ‐1.7 +‐2 0.69 8.9% 0.0%
2008.2‐2016.2 5.1 +‐3.3 0.49 0.4% 0.6% 7.3 +‐2.5 0.75 0.0% 77.0% ‐2.1 +‐2.1 0.69 5.8% 0.0%
2009.1‐2016.2 5.8 +‐3.4 0.53 0.2% 1.7% 8.3 +‐2.2 0.83 0.0% 24.6% ‐2.3 +‐2.3 0.66 5.6% 0.0%
2009.2‐2016.2 5.2 +‐3.9 0.45 1.1% 2.5% 8.4 +‐2.6 0.81 0.0% 27.7% ‐2.9 +‐2.5 0.69 2.8% 0.0%
2010.1‐2016.2 6.5 +‐4.5 0.5 0.7% 1.4% 8.6 +‐3.1 0.79 0.0% 39.4% ‐2 +‐2.8 0.73 15.3% 0.0%
2010.2‐2016.2 6.3 +‐5.9 0.31 3.3% 4.3% 8.3 +‐4.1 0.75 0.1% 39.6% ‐1.8 +‐3.7 0.72 31.2% 0.2%
2011.1‐2016.2 5.7 +‐8 0.13 13.1% 10.5% 6.4 +‐4.9 0.72 1.5% 16.9% ‐0.6 +‐5 0.74 78.4% 0.3%
2011.2‐2016.2 4.5 +‐11.4 ‐0.04 37.7% 24.1% 3.2 +‐5.8 0.74 22.9% 4.4% 1.2 +‐7 0.76 69.3% 0.4%
2012.1‐2016.2 9.4 +‐16.6 0.07 20.2% 14.5% 4.9 +‐8.6 0.74 20.5% 16.1% 4.3 +‐10 0.78 33.6% 0.6%
2012.2‐2016.2 ‐0.4 +‐20.7 ‐0.05 96.4% 62.3% 0.7 +‐12 0.73 88.4% 9.4% ‐1.1 +‐13.4 0.82 84.4% 4.4%
2013.1‐2016.2 3.2 +‐30.1 ‐0.16 79.0% 53.5% 2.8 +‐17.2 0.71 69.1% 20.4% 0.4 +‐19.3 0.79 95.8% 7.2%
2013.2‐2016.2 8.3 +‐60.4 ‐0.23 69.9% 53.8% 15.8 +‐26.1 0.84 14.1% 93.1% ‐6.5 +‐31.9 0.8 60.6% 32.2%2014.1‐2016.2 57.5 +‐65.4 0.7 3.7% 3.5% 36.4 +‐17.5 0.98 0.4% 4.9% 15.5 +‐43.2 0.88 29.9% 6.2%
Loss Cost Severity Frequency
Date Trend Conf. Int. Adj. R2 T Pval Time
T Pval
Unemploym
ent Trend Conf. Int. Adj. R2 T Pval Time
T Pval
Unemploym
ent Trend Conf. Int. Adj. R2 T Pval Time
T Pval
Unemploym
ent
2004.2‐2016.1 1.8 +‐2.4 0.34 12.3% 0.1% 5.7 +‐1.7 0.73 0.0% 54.8% ‐3.7 +‐1.5 0.83 0.0% 0.0%
2005.1‐2016.1 2.9 +‐2.3 0.47 1.4% 0.0% 6.5 +‐1.7 0.8 0.0% 28.7% ‐3.3 +‐1.6 0.82 0.0% 0.0%
2005.2‐2016.1 2.7 +‐2.5 0.47 3.3% 0.0% 6 +‐1.6 0.78 0.0% 30.5% ‐3.1 +‐1.7 0.8 0.1% 0.0%
2006.1‐2016.1 3.2 +‐2.6 0.49 1.7% 0.0% 6 +‐1.8 0.75 0.0% 31.8% ‐2.7 +‐1.7 0.8 0.5% 0.0%
2006.2‐2016.1 3.4 +‐2.7 0.49 1.8% 0.0% 6.2 +‐1.9 0.76 0.0% 37.2% ‐2.7 +‐1.9 0.78 0.8% 0.0%
2007.1‐2016.1 4.1 +‐2.6 0.55 0.3% 0.0% 6.6 +‐1.9 0.78 0.0% 47.1% ‐2.3 +‐1.9 0.74 2.0% 0.0%
2007.2‐2016.1 4 +‐2.8 0.55 0.7% 0.0% 6.4 +‐2 0.75 0.0% 41.4% ‐2.3 +‐2.1 0.7 3.6% 0.0%
2008.1‐2016.1 4.6 +‐2.9 0.57 0.4% 0.1% 6.6 +‐2.2 0.73 0.0% 52.4% ‐1.9 +‐2.2 0.63 8.7% 0.0%
2008.2‐2016.1 4.2 +‐3.2 0.58 1.2% 0.1% 6.7 +‐2.4 0.7 0.0% 62.4% ‐2.3 +‐2.3 0.64 4.7% 0.0%
2009.1‐2016.1 4.8 +‐3.6 0.59 1.2% 0.7% 7.8 +‐2.4 0.79 0.0% 66.8% ‐2.8 +‐2.5 0.62 3.7% 0.1%
2009.2‐2016.1 4 +‐4 0.52 4.6% 0.9% 7.8 +‐2.8 0.75 0.0% 68.6% ‐3.5 +‐2.7 0.67 1.7% 0.1%
2010.1‐2016.1 5.3 +‐4.4 0.59 1.9% 0.4% 8.1 +‐3.3 0.72 0.0% 82.4% ‐2.6 +‐2.9 0.72 7.9% 0.0%
2010.2‐2016.1 5.5 +‐5.6 0.45 4.8% 1.4% 7.9 +‐4.2 0.66 0.2% 79.5% ‐2.2 +‐3.7 0.72 21.1% 0.1%
2011.1‐2016.1 5.2 +‐7.6 0.3 14.3% 3.9% 6.2 +‐5.1 0.58 2.1% 41.9% ‐0.9 +‐4.8 0.74 67.2% 0.2%
2011.2‐2016.1 4.5 +‐11 0.15 35.6% 10.4% 3.2 +‐6.1 0.56 24.5% 13.7% 1.2 +‐6.5 0.78 67.5% 0.3%
2012.1‐2016.1 9.9 +‐15.7 0.3 15.5% 5.9% 5.1 +‐9.1 0.58 21.0% 35.3% 4.6 +‐9.1 0.82 25.3% 0.3%
2012.2‐2016.1 0.5 +‐19.1 0.3 94.4% 27.4% 1 +‐13.1 0.53 84.5% 20.5% ‐0.5 +‐12 0.87 92.0% 1.7%
2013.1‐2016.1 3.2 +‐28.9 0.19 76.6% 29.3% 2.8 +‐19.7 0.49 71.0% 34.1% 0.4 +‐18.1 0.84 95.0% 3.9%2013.2‐2016.1 6.5 +‐63.3 0.1 74.7% 40.4% 15.4 +‐32.4 0.72 19.9% 96.7% ‐7.7 +‐28.9 0.87 46.9% 18.1%
119
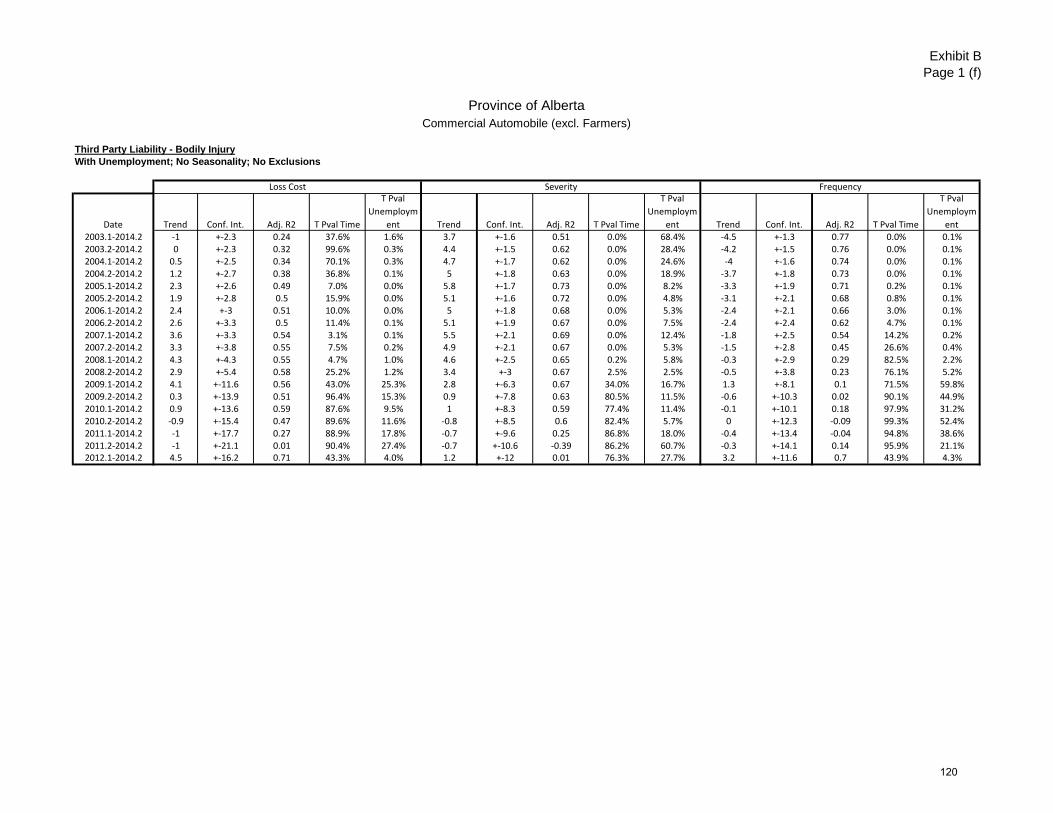
Exhibit BPage 1 (f)
Province of AlbertaCommercial Automobile (excl. Farmers)
Third Party Liability - Bodily InjuryWith Unemployment; No Seasonality; No Exclusions
Loss Cost Severity Frequency
Date Trend Conf. Int. Adj. R2 T Pval Time
T Pval
Unemploym
ent Trend Conf. Int. Adj. R2 T Pval Time
T Pval
Unemploym
ent Trend Conf. Int. Adj. R2 T Pval Time
T Pval
Unemploym
ent2003.1‐2014.2 ‐1 +‐2.3 0.24 37.6% 1.6% 3.7 +‐1.6 0.51 0.0% 68.4% ‐4.5 +‐1.3 0.77 0.0% 0.1%2003.2‐2014.2 0 +‐2.3 0.32 99.6% 0.3% 4.4 +‐1.5 0.62 0.0% 28.4% ‐4.2 +‐1.5 0.76 0.0% 0.1%2004.1‐2014.2 0.5 +‐2.5 0.34 70.1% 0.3% 4.7 +‐1.7 0.62 0.0% 24.6% ‐4 +‐1.6 0.74 0.0% 0.1%2004.2‐2014.2 1.2 +‐2.7 0.38 36.8% 0.1% 5 +‐1.8 0.63 0.0% 18.9% ‐3.7 +‐1.8 0.73 0.0% 0.1%2005.1‐2014.2 2.3 +‐2.6 0.49 7.0% 0.0% 5.8 +‐1.7 0.73 0.0% 8.2% ‐3.3 +‐1.9 0.71 0.2% 0.1%2005.2‐2014.2 1.9 +‐2.8 0.5 15.9% 0.0% 5.1 +‐1.6 0.72 0.0% 4.8% ‐3.1 +‐2.1 0.68 0.8% 0.1%2006.1‐2014.2 2.4 +‐3 0.51 10.0% 0.0% 5 +‐1.8 0.68 0.0% 5.3% ‐2.4 +‐2.1 0.66 3.0% 0.1%2006.2‐2014.2 2.6 +‐3.3 0.5 11.4% 0.1% 5.1 +‐1.9 0.67 0.0% 7.5% ‐2.4 +‐2.4 0.62 4.7% 0.1%2007.1‐2014.2 3.6 +‐3.3 0.54 3.1% 0.1% 5.5 +‐2.1 0.69 0.0% 12.4% ‐1.8 +‐2.5 0.54 14.2% 0.2%2007.2‐2014.2 3.3 +‐3.8 0.55 7.5% 0.2% 4.9 +‐2.1 0.67 0.0% 5.3% ‐1.5 +‐2.8 0.45 26.6% 0.4%2008.1‐2014.2 4.3 +‐4.3 0.55 4.7% 1.0% 4.6 +‐2.5 0.65 0.2% 5.8% ‐0.3 +‐2.9 0.29 82.5% 2.2%2008.2‐2014.2 2.9 +‐5.4 0.58 25.2% 1.2% 3.4 +‐3 0.67 2.5% 2.5% ‐0.5 +‐3.8 0.23 76.1% 5.2%2009.1‐2014.2 4.1 +‐11.6 0.56 43.0% 25.3% 2.8 +‐6.3 0.67 34.0% 16.7% 1.3 +‐8.1 0.1 71.5% 59.8%2009.2‐2014.2 0.3 +‐13.9 0.51 96.4% 15.3% 0.9 +‐7.8 0.63 80.5% 11.5% ‐0.6 +‐10.3 0.02 90.1% 44.9%2010.1‐2014.2 0.9 +‐13.6 0.59 87.6% 9.5% 1 +‐8.3 0.59 77.4% 11.4% ‐0.1 +‐10.1 0.18 97.9% 31.2%2010.2‐2014.2 ‐0.9 +‐15.4 0.47 89.6% 11.6% ‐0.8 +‐8.5 0.6 82.4% 5.7% 0 +‐12.3 ‐0.09 99.3% 52.4%2011.1‐2014.2 ‐1 +‐17.7 0.27 88.9% 17.8% ‐0.7 +‐9.6 0.25 86.8% 18.0% ‐0.4 +‐13.4 ‐0.04 94.8% 38.6%2011.2‐2014.2 ‐1 +‐21.1 0.01 90.4% 27.4% ‐0.7 +‐10.6 ‐0.39 86.2% 60.7% ‐0.3 +‐14.1 0.14 95.9% 21.1%2012.1‐2014.2 4.5 +‐16.2 0.71 43.3% 4.0% 1.2 +‐12 0.01 76.3% 27.7% 3.2 +‐11.6 0.7 43.9% 4.3%
120
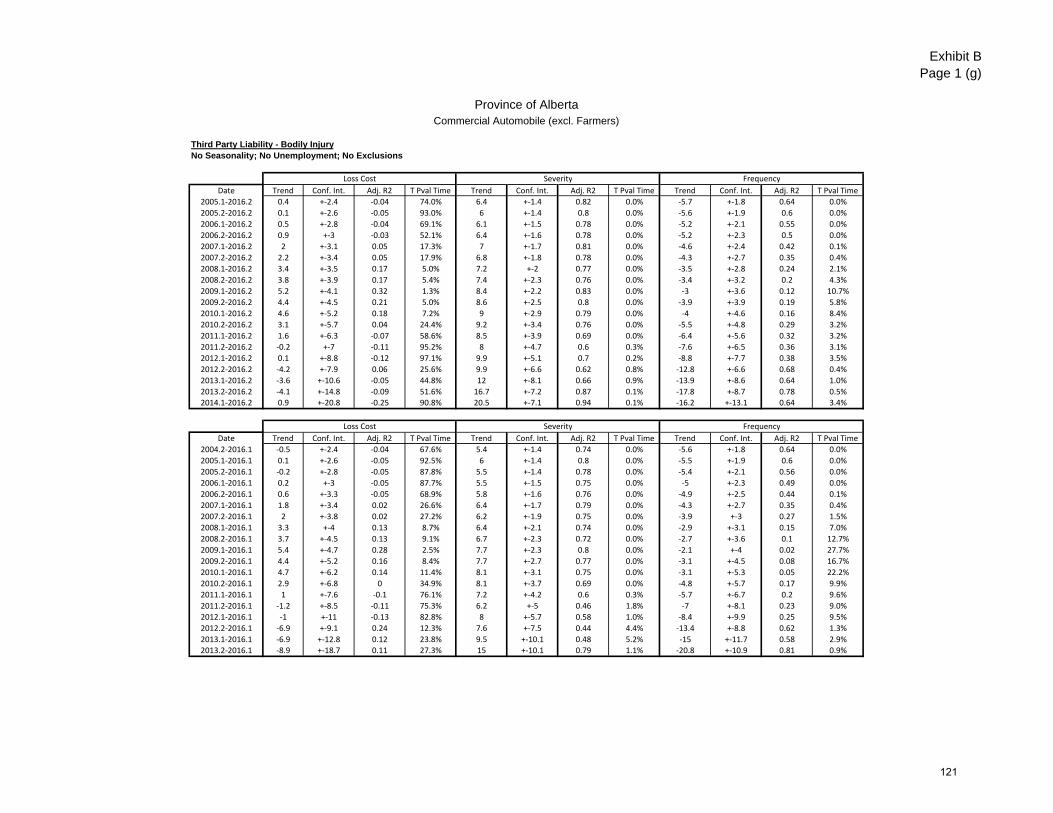
Exhibit BPage 1 (g)
Province of AlbertaCommercial Automobile (excl. Farmers)
Third Party Liability - Bodily InjuryNo Seasonality; No Unemployment; No Exclusions
Loss Cost Severity Frequency
Date Trend Conf. Int. Adj. R2 T Pval Time Trend Conf. Int. Adj. R2 T Pval Time Trend Conf. Int. Adj. R2 T Pval Time
2005.1‐2016.2 0.4 +‐2.4 ‐0.04 74.0% 6.4 +‐1.4 0.82 0.0% ‐5.7 +‐1.8 0.64 0.0%
2005.2‐2016.2 0.1 +‐2.6 ‐0.05 93.0% 6 +‐1.4 0.8 0.0% ‐5.6 +‐1.9 0.6 0.0%
2006.1‐2016.2 0.5 +‐2.8 ‐0.04 69.1% 6.1 +‐1.5 0.78 0.0% ‐5.2 +‐2.1 0.55 0.0%
2006.2‐2016.2 0.9 +‐3 ‐0.03 52.1% 6.4 +‐1.6 0.78 0.0% ‐5.2 +‐2.3 0.5 0.0%
2007.1‐2016.2 2 +‐3.1 0.05 17.3% 7 +‐1.7 0.81 0.0% ‐4.6 +‐2.4 0.42 0.1%
2007.2‐2016.2 2.2 +‐3.4 0.05 17.9% 6.8 +‐1.8 0.78 0.0% ‐4.3 +‐2.7 0.35 0.4%
2008.1‐2016.2 3.4 +‐3.5 0.17 5.0% 7.2 +‐2 0.77 0.0% ‐3.5 +‐2.8 0.24 2.1%
2008.2‐2016.2 3.8 +‐3.9 0.17 5.4% 7.4 +‐2.3 0.76 0.0% ‐3.4 +‐3.2 0.2 4.3%
2009.1‐2016.2 5.2 +‐4.1 0.32 1.3% 8.4 +‐2.2 0.83 0.0% ‐3 +‐3.6 0.12 10.7%
2009.2‐2016.2 4.4 +‐4.5 0.21 5.0% 8.6 +‐2.5 0.8 0.0% ‐3.9 +‐3.9 0.19 5.8%
2010.1‐2016.2 4.6 +‐5.2 0.18 7.2% 9 +‐2.9 0.79 0.0% ‐4 +‐4.6 0.16 8.4%
2010.2‐2016.2 3.1 +‐5.7 0.04 24.4% 9.2 +‐3.4 0.76 0.0% ‐5.5 +‐4.8 0.29 3.2%
2011.1‐2016.2 1.6 +‐6.3 ‐0.07 58.6% 8.5 +‐3.9 0.69 0.0% ‐6.4 +‐5.6 0.32 3.2%
2011.2‐2016.2 ‐0.2 +‐7 ‐0.11 95.2% 8 +‐4.7 0.6 0.3% ‐7.6 +‐6.5 0.36 3.1%
2012.1‐2016.2 0.1 +‐8.8 ‐0.12 97.1% 9.9 +‐5.1 0.7 0.2% ‐8.8 +‐7.7 0.38 3.5%
2012.2‐2016.2 ‐4.2 +‐7.9 0.06 25.6% 9.9 +‐6.6 0.62 0.8% ‐12.8 +‐6.6 0.68 0.4%
2013.1‐2016.2 ‐3.6 +‐10.6 ‐0.05 44.8% 12 +‐8.1 0.66 0.9% ‐13.9 +‐8.6 0.64 1.0%
2013.2‐2016.2 ‐4.1 +‐14.8 ‐0.09 51.6% 16.7 +‐7.2 0.87 0.1% ‐17.8 +‐8.7 0.78 0.5%
2014.1‐2016.2 0.9 +‐20.8 ‐0.25 90.8% 20.5 +‐7.1 0.94 0.1% ‐16.2 +‐13.1 0.64 3.4%
Loss Cost Severity Frequency
Date Trend Conf. Int. Adj. R2 T Pval Time Trend Conf. Int. Adj. R2 T Pval Time Trend Conf. Int. Adj. R2 T Pval Time
2004.2‐2016.1 ‐0.5 +‐2.4 ‐0.04 67.6% 5.4 +‐1.4 0.74 0.0% ‐5.6 +‐1.8 0.64 0.0%
2005.1‐2016.1 0.1 +‐2.6 ‐0.05 92.5% 6 +‐1.4 0.8 0.0% ‐5.5 +‐1.9 0.6 0.0%
2005.2‐2016.1 ‐0.2 +‐2.8 ‐0.05 87.8% 5.5 +‐1.4 0.78 0.0% ‐5.4 +‐2.1 0.56 0.0%
2006.1‐2016.1 0.2 +‐3 ‐0.05 87.7% 5.5 +‐1.5 0.75 0.0% ‐5 +‐2.3 0.49 0.0%
2006.2‐2016.1 0.6 +‐3.3 ‐0.05 68.9% 5.8 +‐1.6 0.76 0.0% ‐4.9 +‐2.5 0.44 0.1%
2007.1‐2016.1 1.8 +‐3.4 0.02 26.6% 6.4 +‐1.7 0.79 0.0% ‐4.3 +‐2.7 0.35 0.4%
2007.2‐2016.1 2 +‐3.8 0.02 27.2% 6.2 +‐1.9 0.75 0.0% ‐3.9 +‐3 0.27 1.5%
2008.1‐2016.1 3.3 +‐4 0.13 8.7% 6.4 +‐2.1 0.74 0.0% ‐2.9 +‐3.1 0.15 7.0%
2008.2‐2016.1 3.7 +‐4.5 0.13 9.1% 6.7 +‐2.3 0.72 0.0% ‐2.7 +‐3.6 0.1 12.7%
2009.1‐2016.1 5.4 +‐4.7 0.28 2.5% 7.7 +‐2.3 0.8 0.0% ‐2.1 +‐4 0.02 27.7%
2009.2‐2016.1 4.4 +‐5.2 0.16 8.4% 7.7 +‐2.7 0.77 0.0% ‐3.1 +‐4.5 0.08 16.7%
2010.1‐2016.1 4.7 +‐6.2 0.14 11.4% 8.1 +‐3.1 0.75 0.0% ‐3.1 +‐5.3 0.05 22.2%
2010.2‐2016.1 2.9 +‐6.8 0 34.9% 8.1 +‐3.7 0.69 0.0% ‐4.8 +‐5.7 0.17 9.9%
2011.1‐2016.1 1 +‐7.6 ‐0.1 76.1% 7.2 +‐4.2 0.6 0.3% ‐5.7 +‐6.7 0.2 9.6%
2011.2‐2016.1 ‐1.2 +‐8.5 ‐0.11 75.3% 6.2 +‐5 0.46 1.8% ‐7 +‐8.1 0.23 9.0%
2012.1‐2016.1 ‐1 +‐11 ‐0.13 82.8% 8 +‐5.7 0.58 1.0% ‐8.4 +‐9.9 0.25 9.5%
2012.2‐2016.1 ‐6.9 +‐9.1 0.24 12.3% 7.6 +‐7.5 0.44 4.4% ‐13.4 +‐8.8 0.62 1.3%
2013.1‐2016.1 ‐6.9 +‐12.8 0.12 23.8% 9.5 +‐10.1 0.48 5.2% ‐15 +‐11.7 0.58 2.9%
2013.2‐2016.1 ‐8.9 +‐18.7 0.11 27.3% 15 +‐10.1 0.79 1.1% ‐20.8 +‐10.9 0.81 0.9%
121
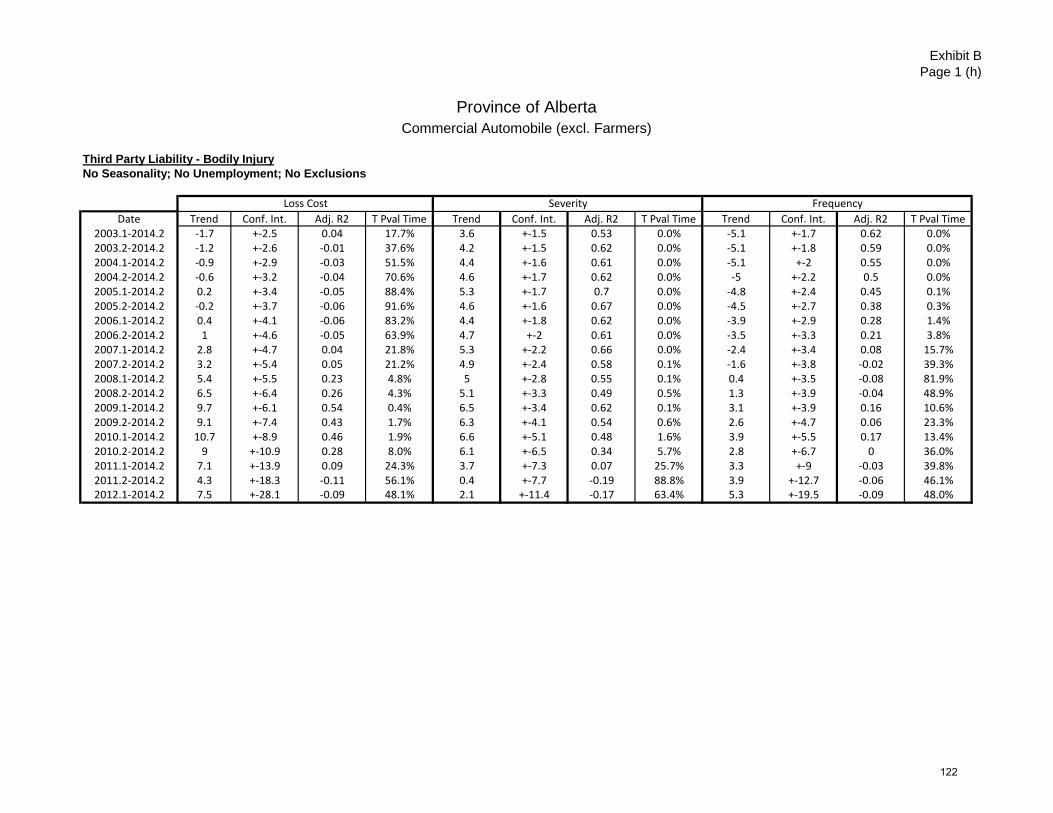
Exhibit BPage 1 (h)
Province of AlbertaCommercial Automobile (excl. Farmers)
Third Party Liability - Bodily InjuryNo Seasonality; No Unemployment; No Exclusions
Loss Cost Severity Frequency
Date Trend Conf. Int. Adj. R2 T Pval Time Trend Conf. Int. Adj. R2 T Pval Time Trend Conf. Int. Adj. R2 T Pval Time2003.1‐2014.2 ‐1.7 +‐2.5 0.04 17.7% 3.6 +‐1.5 0.53 0.0% ‐5.1 +‐1.7 0.62 0.0%2003.2‐2014.2 ‐1.2 +‐2.6 ‐0.01 37.6% 4.2 +‐1.5 0.62 0.0% ‐5.1 +‐1.8 0.59 0.0%2004.1‐2014.2 ‐0.9 +‐2.9 ‐0.03 51.5% 4.4 +‐1.6 0.61 0.0% ‐5.1 +‐2 0.55 0.0%2004.2‐2014.2 ‐0.6 +‐3.2 ‐0.04 70.6% 4.6 +‐1.7 0.62 0.0% ‐5 +‐2.2 0.5 0.0%2005.1‐2014.2 0.2 +‐3.4 ‐0.05 88.4% 5.3 +‐1.7 0.7 0.0% ‐4.8 +‐2.4 0.45 0.1%2005.2‐2014.2 ‐0.2 +‐3.7 ‐0.06 91.6% 4.6 +‐1.6 0.67 0.0% ‐4.5 +‐2.7 0.38 0.3%2006.1‐2014.2 0.4 +‐4.1 ‐0.06 83.2% 4.4 +‐1.8 0.62 0.0% ‐3.9 +‐2.9 0.28 1.4%2006.2‐2014.2 1 +‐4.6 ‐0.05 63.9% 4.7 +‐2 0.61 0.0% ‐3.5 +‐3.3 0.21 3.8%2007.1‐2014.2 2.8 +‐4.7 0.04 21.8% 5.3 +‐2.2 0.66 0.0% ‐2.4 +‐3.4 0.08 15.7%2007.2‐2014.2 3.2 +‐5.4 0.05 21.2% 4.9 +‐2.4 0.58 0.1% ‐1.6 +‐3.8 ‐0.02 39.3%2008.1‐2014.2 5.4 +‐5.5 0.23 4.8% 5 +‐2.8 0.55 0.1% 0.4 +‐3.5 ‐0.08 81.9%2008.2‐2014.2 6.5 +‐6.4 0.26 4.3% 5.1 +‐3.3 0.49 0.5% 1.3 +‐3.9 ‐0.04 48.9%2009.1‐2014.2 9.7 +‐6.1 0.54 0.4% 6.5 +‐3.4 0.62 0.1% 3.1 +‐3.9 0.16 10.6%2009.2‐2014.2 9.1 +‐7.4 0.43 1.7% 6.3 +‐4.1 0.54 0.6% 2.6 +‐4.7 0.06 23.3%2010.1‐2014.2 10.7 +‐8.9 0.46 1.9% 6.6 +‐5.1 0.48 1.6% 3.9 +‐5.5 0.17 13.4%2010.2‐2014.2 9 +‐10.9 0.28 8.0% 6.1 +‐6.5 0.34 5.7% 2.8 +‐6.7 0 36.0%2011.1‐2014.2 7.1 +‐13.9 0.09 24.3% 3.7 +‐7.3 0.07 25.7% 3.3 +‐9 ‐0.03 39.8%2011.2‐2014.2 4.3 +‐18.3 ‐0.11 56.1% 0.4 +‐7.7 ‐0.19 88.8% 3.9 +‐12.7 ‐0.06 46.1%2012.1‐2014.2 7.5 +‐28.1 ‐0.09 48.1% 2.1 +‐11.4 ‐0.17 63.4% 5.3 +‐19.5 ‐0.09 48.0%
122
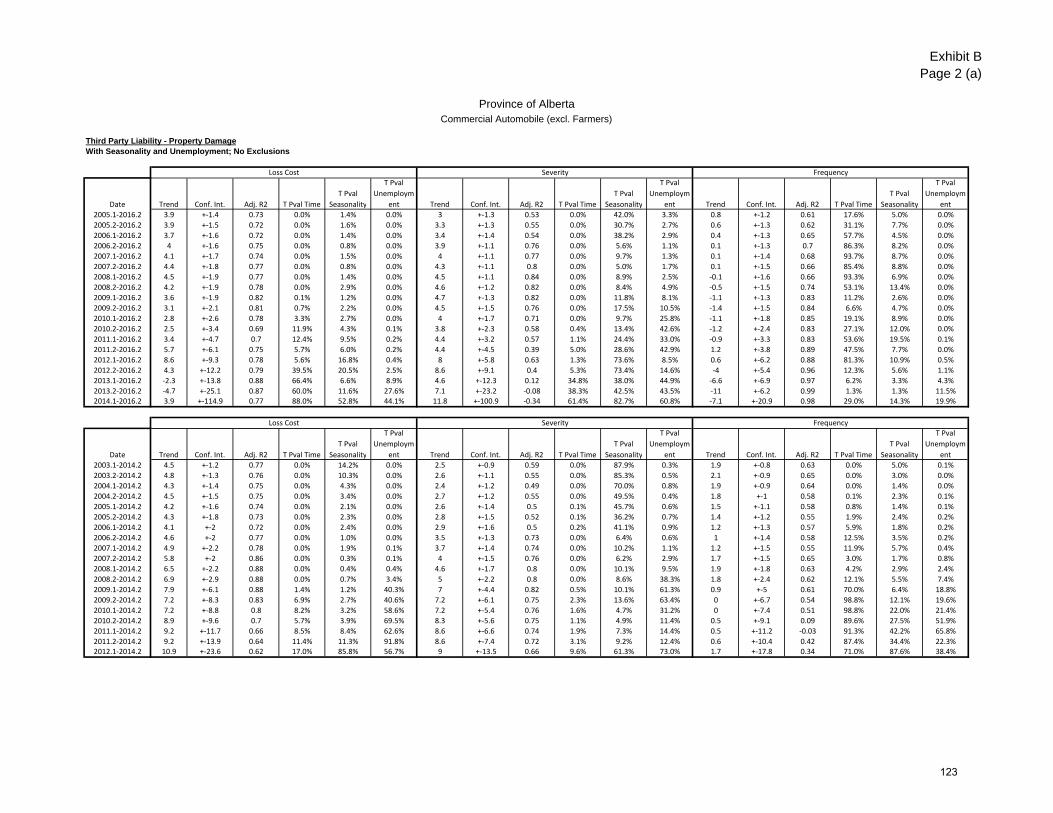
Exhibit BPage 2 (a)
Province of AlbertaCommercial Automobile (excl. Farmers)
Third Party Liability - Property DamageWith Seasonality and Unemployment; No Exclusions
Loss Cost Severity Frequency
Date Trend Conf. Int. Adj. R2 T Pval Time
T Pval
Seasonality
T Pval
Unemploym
ent Trend Conf. Int. Adj. R2 T Pval Time
T Pval
Seasonality
T Pval
Unemploym
ent Trend Conf. Int. Adj. R2 T Pval Time
T Pval
Seasonality
T Pval
Unemploym
ent
2005.1‐2016.2 3.9 +‐1.4 0.73 0.0% 1.4% 0.0% 3 +‐1.3 0.53 0.0% 42.0% 3.3% 0.8 +‐1.2 0.61 17.6% 5.0% 0.0%
2005.2‐2016.2 3.9 +‐1.5 0.72 0.0% 1.6% 0.0% 3.3 +‐1.3 0.55 0.0% 30.7% 2.7% 0.6 +‐1.3 0.62 31.1% 7.7% 0.0%
2006.1‐2016.2 3.7 +‐1.6 0.72 0.0% 1.4% 0.0% 3.4 +‐1.4 0.54 0.0% 38.2% 2.9% 0.4 +‐1.3 0.65 57.7% 4.5% 0.0%
2006.2‐2016.2 4 +‐1.6 0.75 0.0% 0.8% 0.0% 3.9 +‐1.1 0.76 0.0% 5.6% 1.1% 0.1 +‐1.3 0.7 86.3% 8.2% 0.0%
2007.1‐2016.2 4.1 +‐1.7 0.74 0.0% 1.5% 0.0% 4 +‐1.1 0.77 0.0% 9.7% 1.3% 0.1 +‐1.4 0.68 93.7% 8.7% 0.0%
2007.2‐2016.2 4.4 +‐1.8 0.77 0.0% 0.8% 0.0% 4.3 +‐1.1 0.8 0.0% 5.0% 1.7% 0.1 +‐1.5 0.66 85.4% 8.8% 0.0%
2008.1‐2016.2 4.5 +‐1.9 0.77 0.0% 1.4% 0.0% 4.5 +‐1.1 0.84 0.0% 8.9% 2.5% ‐0.1 +‐1.6 0.66 93.3% 6.9% 0.0%
2008.2‐2016.2 4.2 +‐1.9 0.78 0.0% 2.9% 0.0% 4.6 +‐1.2 0.82 0.0% 8.4% 4.9% ‐0.5 +‐1.5 0.74 53.1% 13.4% 0.0%
2009.1‐2016.2 3.6 +‐1.9 0.82 0.1% 1.2% 0.0% 4.7 +‐1.3 0.82 0.0% 11.8% 8.1% ‐1.1 +‐1.3 0.83 11.2% 2.6% 0.0%
2009.2‐2016.2 3.1 +‐2.1 0.81 0.7% 2.2% 0.0% 4.5 +‐1.5 0.76 0.0% 17.5% 10.5% ‐1.4 +‐1.5 0.84 6.6% 4.7% 0.0%
2010.1‐2016.2 2.8 +‐2.6 0.78 3.3% 2.7% 0.0% 4 +‐1.7 0.71 0.0% 9.7% 25.8% ‐1.1 +‐1.8 0.85 19.1% 8.9% 0.0%
2010.2‐2016.2 2.5 +‐3.4 0.69 11.9% 4.3% 0.1% 3.8 +‐2.3 0.58 0.4% 13.4% 42.6% ‐1.2 +‐2.4 0.83 27.1% 12.0% 0.0%
2011.1‐2016.2 3.4 +‐4.7 0.7 12.4% 9.5% 0.2% 4.4 +‐3.2 0.57 1.1% 24.4% 33.0% ‐0.9 +‐3.3 0.83 53.6% 19.5% 0.1%
2011.2‐2016.2 5.7 +‐6.1 0.75 5.7% 6.0% 0.2% 4.4 +‐4.5 0.39 5.0% 28.6% 42.9% 1.2 +‐3.8 0.89 47.5% 7.7% 0.0%
2012.1‐2016.2 8.6 +‐9.3 0.78 5.6% 16.8% 0.4% 8 +‐5.8 0.63 1.3% 73.6% 8.5% 0.6 +‐6.2 0.88 81.3% 10.9% 0.5%
2012.2‐2016.2 4.3 +‐12.2 0.79 39.5% 20.5% 2.5% 8.6 +‐9.1 0.4 5.3% 73.4% 14.6% ‐4 +‐5.4 0.96 12.3% 5.6% 1.1%
2013.1‐2016.2 ‐2.3 +‐13.8 0.88 66.4% 6.6% 8.9% 4.6 +‐12.3 0.12 34.8% 38.0% 44.9% ‐6.6 +‐6.9 0.97 6.2% 3.3% 4.3%
2013.2‐2016.2 ‐4.7 +‐25.1 0.87 60.0% 11.6% 27.6% 7.1 +‐23.2 ‐0.08 38.3% 42.5% 43.5% ‐11 +‐6.2 0.99 1.3% 1.3% 11.5%2014.1‐2016.2 3.9 +‐114.9 0.77 88.0% 52.8% 44.1% 11.8 +‐100.9 ‐0.34 61.4% 82.7% 60.8% ‐7.1 +‐20.9 0.98 29.0% 14.3% 19.9%
Loss Cost Severity Frequency
Date Trend Conf. Int. Adj. R2 T Pval Time
T Pval
Seasonality
T Pval
Unemploym
ent Trend Conf. Int. Adj. R2 T Pval Time
T Pval
Seasonality
T Pval
Unemploym
ent Trend Conf. Int. Adj. R2 T Pval Time
T Pval
Seasonality
T Pval
Unemploym
ent
2003.1‐2014.2 4.5 +‐1.2 0.77 0.0% 14.2% 0.0% 2.5 +‐0.9 0.59 0.0% 87.9% 0.3% 1.9 +‐0.8 0.63 0.0% 5.0% 0.1%
2003.2‐2014.2 4.8 +‐1.3 0.76 0.0% 10.3% 0.0% 2.6 +‐1.1 0.55 0.0% 85.3% 0.5% 2.1 +‐0.9 0.65 0.0% 3.0% 0.0%
2004.1‐2014.2 4.3 +‐1.4 0.75 0.0% 4.3% 0.0% 2.4 +‐1.2 0.49 0.0% 70.0% 0.8% 1.9 +‐0.9 0.64 0.0% 1.4% 0.0%
2004.2‐2014.2 4.5 +‐1.5 0.75 0.0% 3.4% 0.0% 2.7 +‐1.2 0.55 0.0% 49.5% 0.4% 1.8 +‐1 0.58 0.1% 2.3% 0.1%
2005.1‐2014.2 4.2 +‐1.6 0.74 0.0% 2.1% 0.0% 2.6 +‐1.4 0.5 0.1% 45.7% 0.6% 1.5 +‐1.1 0.58 0.8% 1.4% 0.1%
2005.2‐2014.2 4.3 +‐1.8 0.73 0.0% 2.3% 0.0% 2.8 +‐1.5 0.52 0.1% 36.2% 0.7% 1.4 +‐1.2 0.55 1.9% 2.4% 0.2%
2006.1‐2014.2 4.1 +‐2 0.72 0.0% 2.4% 0.0% 2.9 +‐1.6 0.5 0.2% 41.1% 0.9% 1.2 +‐1.3 0.57 5.9% 1.8% 0.2%
2006.2‐2014.2 4.6 +‐2 0.77 0.0% 1.0% 0.0% 3.5 +‐1.3 0.73 0.0% 6.4% 0.6% 1 +‐1.4 0.58 12.5% 3.5% 0.2%
2007.1‐2014.2 4.9 +‐2.2 0.78 0.0% 1.9% 0.1% 3.7 +‐1.4 0.74 0.0% 10.2% 1.1% 1.2 +‐1.5 0.55 11.9% 5.7% 0.4%
2007.2‐2014.2 5.8 +‐2 0.86 0.0% 0.3% 0.1% 4 +‐1.5 0.76 0.0% 6.2% 2.9% 1.7 +‐1.5 0.65 3.0% 1.7% 0.8%
2008.1‐2014.2 6.5 +‐2.2 0.88 0.0% 0.4% 0.4% 4.6 +‐1.7 0.8 0.0% 10.1% 9.5% 1.9 +‐1.8 0.63 4.2% 2.9% 2.4%
2008.2‐2014.2 6.9 +‐2.9 0.88 0.0% 0.7% 3.4% 5 +‐2.2 0.8 0.0% 8.6% 38.3% 1.8 +‐2.4 0.62 12.1% 5.5% 7.4%
2009.1‐2014.2 7.9 +‐6.1 0.88 1.4% 1.2% 40.3% 7 +‐4.4 0.82 0.5% 10.1% 61.3% 0.9 +‐5 0.61 70.0% 6.4% 18.8%
2009.2‐2014.2 7.2 +‐8.3 0.83 6.9% 2.7% 40.6% 7.2 +‐6.1 0.75 2.3% 13.6% 63.4% 0 +‐6.7 0.54 98.8% 12.1% 19.6%
2010.1‐2014.2 7.2 +‐8.8 0.8 8.2% 3.2% 58.6% 7.2 +‐5.4 0.76 1.6% 4.7% 31.2% 0 +‐7.4 0.51 98.8% 22.0% 21.4%
2010.2‐2014.2 8.9 +‐9.6 0.7 5.7% 3.9% 69.5% 8.3 +‐5.6 0.75 1.1% 4.9% 11.4% 0.5 +‐9.1 0.09 89.6% 27.5% 51.9%
2011.1‐2014.2 9.2 +‐11.7 0.66 8.5% 8.4% 62.6% 8.6 +‐6.6 0.74 1.9% 7.3% 14.4% 0.5 +‐11.2 ‐0.03 91.3% 42.2% 65.8%
2011.2‐2014.2 9.2 +‐13.9 0.64 11.4% 11.3% 91.8% 8.6 +‐7.4 0.72 3.1% 9.2% 12.4% 0.6 +‐10.4 0.42 87.4% 34.4% 22.3%2012.1‐2014.2 10.9 +‐23.6 0.62 17.0% 85.8% 56.7% 9 +‐13.5 0.66 9.6% 61.3% 73.0% 1.7 +‐17.8 0.34 71.0% 87.6% 38.4%
123

Exhibit BPage 2 (b)
Province of AlbertaCommercial Automobile (excl. Farmers)
Third Party Liability - Property DamageWith Seasonality; No Unemployment; No Exclusions
Loss Cost Severity Frequency
Date Trend Conf. Int. Adj. R2 T Pval Time
T Pval
Seasonality Trend Conf. Int. Adj. R2 T Pval Time
T Pval
Seasonality Trend Conf. Int. Adj. R2 T Pval Time
T Pval
Seasonality2005.1‐2016.2 1 +‐1.9 0.12 26.9% 7.7% 2.1 +‐1.1 0.44 0.0% 35.4% ‐1.1 +‐1.4 0.13 11.3% 10.0%2005.2‐2016.2 1 +‐2 0.09 32.8% 9.4% 2.3 +‐1.1 0.45 0.0% 27.8% ‐1.3 +‐1.5 0.14 8.2% 14.7%2006.1‐2016.2 0.7 +‐2.2 0.09 50.3% 8.2% 2.4 +‐1.3 0.43 0.1% 32.9% ‐1.6 +‐1.6 0.19 4.8% 10.1%2006.2‐2016.2 1.1 +‐2.4 0.13 32.9% 6.0% 3 +‐1.1 0.66 0.0% 6.0% ‐1.8 +‐1.7 0.21 4.0% 14.7%2007.1‐2016.2 1.4 +‐2.6 0.13 28.7% 9.0% 3.3 +‐1.1 0.68 0.0% 10.6% ‐1.8 +‐1.9 0.16 6.4% 17.3%2007.2‐2016.2 2 +‐2.8 0.2 15.6% 5.8% 3.6 +‐1.2 0.72 0.0% 5.2% ‐1.6 +‐2.1 0.13 14.1% 14.8%2008.1‐2016.2 2.4 +‐3.2 0.21 11.7% 9.7% 4 +‐1.2 0.78 0.0% 10.4% ‐1.6 +‐2.4 0.08 19.2% 17.6%2008.2‐2016.2 2.6 +‐3.6 0.18 13.3% 10.5% 4.3 +‐1.3 0.78 0.0% 7.1% ‐1.6 +‐2.7 0.08 22.5% 21.2%2009.1‐2016.2 2.7 +‐4.1 0.18 16.7% 13.9% 4.5 +‐1.4 0.78 0.0% 12.4% ‐1.7 +‐3.1 0.05 25.7% 22.8%2009.2‐2016.2 1.9 +‐4.5 0.04 36.4% 21.7% 4.3 +‐1.6 0.72 0.0% 19.0% ‐2.3 +‐3.5 0.07 18.3% 32.9%2010.1‐2016.2 0.5 +‐4.8 0.08 81.4% 11.7% 3.7 +‐1.6 0.7 0.0% 7.2% ‐3 +‐3.9 0.13 11.8% 23.9%2010.2‐2016.2 ‐1.2 +‐4.9 0.01 60.1% 20.4% 3.4 +‐1.9 0.6 0.2% 12.2% ‐4.4 +‐4 0.28 3.6% 40.2%2011.1‐2016.2 ‐2.4 +‐5.5 0.09 36.1% 14.4% 3.5 +‐2.3 0.56 0.7% 17.4% ‐5.6 +‐4.4 0.38 1.9% 23.8%2011.2‐2016.2 ‐3.2 +‐6.6 0.09 30.6% 22.1% 3.2 +‐2.7 0.41 2.5% 25.4% ‐6.2 +‐5.2 0.38 3.0% 33.0%2012.1‐2016.2 ‐4.9 +‐7.7 0.18 18.5% 15.4% 3.8 +‐3.3 0.45 2.8% 42.3% ‐8.4 +‐5.3 0.58 0.9% 11.9%2012.2‐2016.2 ‐8.3 +‐6.9 0.49 3.1% 24.6% 3.2 +‐4.1 0.21 10.0% 58.5% ‐11.2 +‐3.8 0.85 0.0% 13.5%2013.1‐2016.2 ‐12.1 +‐5.9 0.78 0.4% 4.0% 1.2 +‐4.1 0.17 47.6% 19.8% ‐13.1 +‐3.6 0.91 0.0% 3.0%2013.2‐2016.2 ‐14 +‐6.8 0.84 0.6% 7.2% 1.1 +‐5.9 ‐0.03 62.0% 28.3% ‐14.9 +‐2.3 0.98 0.0% 1.1%2014.1‐2016.2 ‐15.7 +‐10.7 0.78 2.4% 9.7% 0 +‐9.7 ‐0.05 99.8% 29.5% ‐15.7 +‐3.5 0.97 0.1% 2.2%
Loss Cost Severity Frequency
Date Trend Conf. Int. Adj. R2 T Pval Time
T Pval
Seasonality Trend Conf. Int. Adj. R2 T Pval Time
T Pval
Seasonality Trend Conf. Int. Adj. R2 T Pval Time
T Pval
Seasonality2003.1‐2014.2 3.7 +‐1.8 0.47 0.0% 14.8% 2.2 +‐1.1 0.4 0.0% 61.9% 1.5 +‐1 0.35 0.5% 5.6%2003.2‐2014.2 3.7 +‐2 0.42 0.1% 17.3% 2.1 +‐1.2 0.34 0.2% 69.6% 1.6 +‐1.1 0.33 0.8% 6.0%2004.1‐2014.2 3.1 +‐2 0.38 0.4% 8.7% 1.8 +‐1.3 0.27 0.8% 52.9% 1.2 +‐1.2 0.31 3.5% 2.9%2004.2‐2014.2 3.1 +‐2.2 0.33 0.8% 10.0% 2 +‐1.4 0.29 0.6% 43.0% 1.1 +‐1.2 0.22 8.7% 4.8%2005.1‐2014.2 2.6 +‐2.3 0.31 3.0% 6.3% 1.8 +‐1.5 0.24 2.0% 36.2% 0.8 +‐1.3 0.24 24.0% 2.8%2005.2‐2014.2 2.8 +‐2.6 0.28 3.8% 6.7% 2.1 +‐1.7 0.25 1.8% 29.8% 0.7 +‐1.5 0.18 33.6% 4.1%2006.1‐2014.2 2.6 +‐2.9 0.26 7.8% 7.2% 2.1 +‐1.9 0.24 3.0% 34.2% 0.5 +‐1.6 0.19 55.1% 3.6%2006.2‐2014.2 3.5 +‐3 0.39 2.5% 3.2% 3.1 +‐1.6 0.55 0.1% 6.5% 0.4 +‐1.8 0.15 62.3% 5.0%2007.1‐2014.2 4.2 +‐3.4 0.43 1.6% 6.2% 3.4 +‐1.8 0.58 0.1% 11.7% 0.8 +‐2.1 0.14 42.4% 9.1%2007.2‐2014.2 5.7 +‐3.2 0.62 0.2% 1.2% 4 +‐1.8 0.65 0.0% 5.1% 1.7 +‐2 0.37 9.0% 2.2%2008.1‐2014.2 7.2 +‐3.1 0.74 0.0% 2.1% 4.8 +‐1.8 0.76 0.0% 10.1% 2.2 +‐2.2 0.43 4.3% 4.7%2008.2‐2014.2 8.5 +‐3.1 0.81 0.0% 0.5% 5.5 +‐1.9 0.8 0.0% 4.2% 2.9 +‐2.4 0.5 2.2% 2.8%2009.1‐2014.2 9.9 +‐3 0.88 0.0% 0.8% 6.1 +‐2.1 0.83 0.0% 9.0% 3.6 +‐2.7 0.57 1.3% 6.1%2009.2‐2014.2 10 +‐3.7 0.84 0.0% 1.5% 6 +‐2.5 0.77 0.0% 12.9% 3.7 +‐3.3 0.48 2.8% 8.0%2010.1‐2014.2 9 +‐4.4 0.82 0.1% 1.3% 5.1 +‐2.8 0.75 0.3% 6.1% 3.7 +‐4.2 0.45 7.2% 11.7%2010.2‐2014.2 7.6 +‐4.8 0.74 0.7% 2.6% 5 +‐3.6 0.63 1.3% 10.3% 2.5 +‐4.8 0.17 24.4% 20.6%2011.1‐2014.2 7.6 +‐6.8 0.71 3.1% 5.4% 5.6 +‐4.9 0.63 3.0% 20.3% 1.9 +‐6.6 0.13 49.7% 22.6%2011.2‐2014.2 9.5 +‐8.7 0.73 3.3% 4.8% 5.8 +‐7.1 0.47 7.7% 26.1% 3.4 +‐8.9 0.22 33.4% 19.1%2012.1‐2014.2 10 +‐15.2 0.69 11.4% 12.6% 9.3 +‐8.3 0.75 3.3% 56.1% 0.7 +‐13.1 0.29 87.5% 16.0%
124
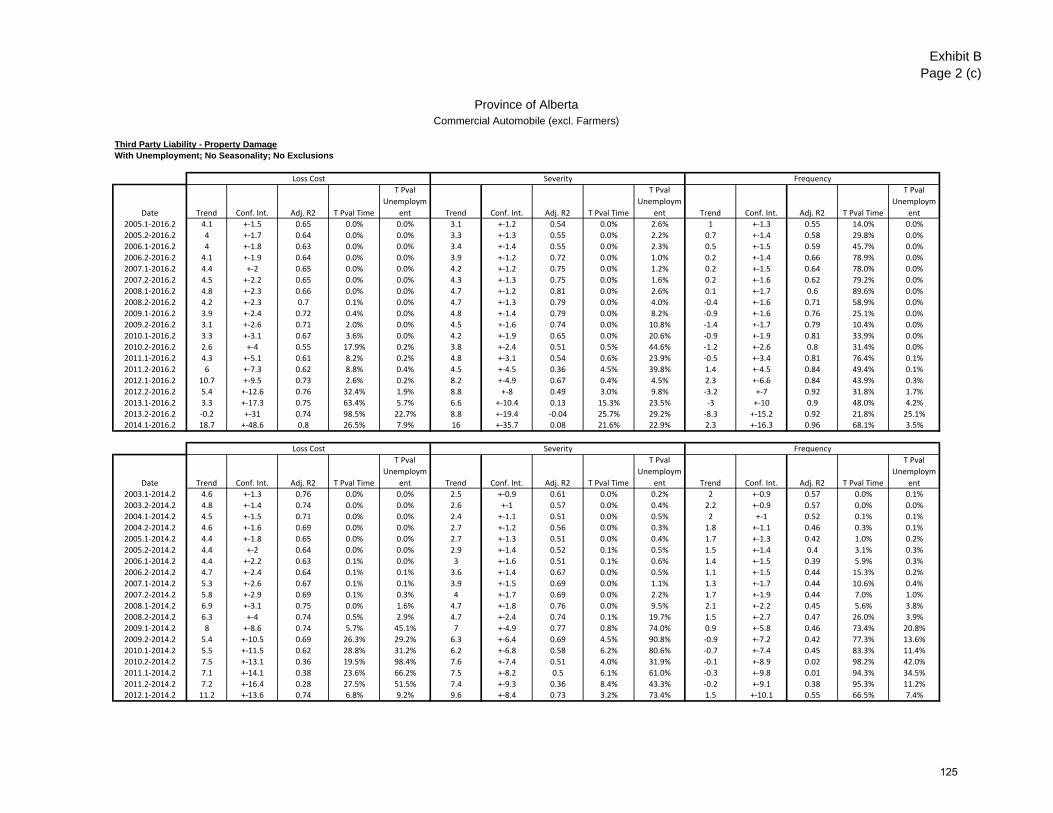
Exhibit BPage 2 (c)
Province of AlbertaCommercial Automobile (excl. Farmers)
Third Party Liability - Property DamageWith Unemployment; No Seasonality; No Exclusions
Loss Cost Severity Frequency
Date Trend Conf. Int. Adj. R2 T Pval Time
T Pval
Unemploym
ent Trend Conf. Int. Adj. R2 T Pval Time
T Pval
Unemploym
ent Trend Conf. Int. Adj. R2 T Pval Time
T Pval
Unemploym
ent
2005.1‐2016.2 4.1 +‐1.5 0.65 0.0% 0.0% 3.1 +‐1.2 0.54 0.0% 2.6% 1 +‐1.3 0.55 14.0% 0.0%
2005.2‐2016.2 4 +‐1.7 0.64 0.0% 0.0% 3.3 +‐1.3 0.55 0.0% 2.2% 0.7 +‐1.4 0.58 29.8% 0.0%
2006.1‐2016.2 4 +‐1.8 0.63 0.0% 0.0% 3.4 +‐1.4 0.55 0.0% 2.3% 0.5 +‐1.5 0.59 45.7% 0.0%
2006.2‐2016.2 4.1 +‐1.9 0.64 0.0% 0.0% 3.9 +‐1.2 0.72 0.0% 1.0% 0.2 +‐1.4 0.66 78.9% 0.0%
2007.1‐2016.2 4.4 +‐2 0.65 0.0% 0.0% 4.2 +‐1.2 0.75 0.0% 1.2% 0.2 +‐1.5 0.64 78.0% 0.0%
2007.2‐2016.2 4.5 +‐2.2 0.65 0.0% 0.0% 4.3 +‐1.3 0.75 0.0% 1.6% 0.2 +‐1.6 0.62 79.2% 0.0%
2008.1‐2016.2 4.8 +‐2.3 0.66 0.0% 0.0% 4.7 +‐1.2 0.81 0.0% 2.6% 0.1 +‐1.7 0.6 89.6% 0.0%
2008.2‐2016.2 4.2 +‐2.3 0.7 0.1% 0.0% 4.7 +‐1.3 0.79 0.0% 4.0% ‐0.4 +‐1.6 0.71 58.9% 0.0%
2009.1‐2016.2 3.9 +‐2.4 0.72 0.4% 0.0% 4.8 +‐1.4 0.79 0.0% 8.2% ‐0.9 +‐1.6 0.76 25.1% 0.0%
2009.2‐2016.2 3.1 +‐2.6 0.71 2.0% 0.0% 4.5 +‐1.6 0.74 0.0% 10.8% ‐1.4 +‐1.7 0.79 10.4% 0.0%
2010.1‐2016.2 3.3 +‐3.1 0.67 3.6% 0.0% 4.2 +‐1.9 0.65 0.0% 20.6% ‐0.9 +‐1.9 0.81 33.9% 0.0%
2010.2‐2016.2 2.6 +‐4 0.55 17.9% 0.2% 3.8 +‐2.4 0.51 0.5% 44.6% ‐1.2 +‐2.6 0.8 31.4% 0.0%
2011.1‐2016.2 4.3 +‐5.1 0.61 8.2% 0.2% 4.8 +‐3.1 0.54 0.6% 23.9% ‐0.5 +‐3.4 0.81 76.4% 0.1%
2011.2‐2016.2 6 +‐7.3 0.62 8.8% 0.4% 4.5 +‐4.5 0.36 4.5% 39.8% 1.4 +‐4.5 0.84 49.4% 0.1%
2012.1‐2016.2 10.7 +‐9.5 0.73 2.6% 0.2% 8.2 +‐4.9 0.67 0.4% 4.5% 2.3 +‐6.6 0.84 43.9% 0.3%
2012.2‐2016.2 5.4 +‐12.6 0.76 32.4% 1.9% 8.8 +‐8 0.49 3.0% 9.8% ‐3.2 +‐7 0.92 31.8% 1.7%
2013.1‐2016.2 3.3 +‐17.3 0.75 63.4% 5.7% 6.6 +‐10.4 0.13 15.3% 23.5% ‐3 +‐10 0.9 48.0% 4.2%
2013.2‐2016.2 ‐0.2 +‐31 0.74 98.5% 22.7% 8.8 +‐19.4 ‐0.04 25.7% 29.2% ‐8.3 +‐15.2 0.92 21.8% 25.1%
2014.1‐2016.2 18.7 +‐48.6 0.8 26.5% 7.9% 16 +‐35.7 0.08 21.6% 22.9% 2.3 +‐16.3 0.96 68.1% 3.5%
Loss Cost Severity Frequency
Date Trend Conf. Int. Adj. R2 T Pval Time
T Pval
Unemploym
ent Trend Conf. Int. Adj. R2 T Pval Time
T Pval
Unemploym
ent Trend Conf. Int. Adj. R2 T Pval Time
T Pval
Unemploym
ent
2003.1‐2014.2 4.6 +‐1.3 0.76 0.0% 0.0% 2.5 +‐0.9 0.61 0.0% 0.2% 2 +‐0.9 0.57 0.0% 0.1%
2003.2‐2014.2 4.8 +‐1.4 0.74 0.0% 0.0% 2.6 +‐1 0.57 0.0% 0.4% 2.2 +‐0.9 0.57 0.0% 0.0%
2004.1‐2014.2 4.5 +‐1.5 0.71 0.0% 0.0% 2.4 +‐1.1 0.51 0.0% 0.5% 2 +‐1 0.52 0.1% 0.1%
2004.2‐2014.2 4.6 +‐1.6 0.69 0.0% 0.0% 2.7 +‐1.2 0.56 0.0% 0.3% 1.8 +‐1.1 0.46 0.3% 0.1%
2005.1‐2014.2 4.4 +‐1.8 0.65 0.0% 0.0% 2.7 +‐1.3 0.51 0.0% 0.4% 1.7 +‐1.3 0.42 1.0% 0.2%
2005.2‐2014.2 4.4 +‐2 0.64 0.0% 0.0% 2.9 +‐1.4 0.52 0.1% 0.5% 1.5 +‐1.4 0.4 3.1% 0.3%
2006.1‐2014.2 4.4 +‐2.2 0.63 0.1% 0.0% 3 +‐1.6 0.51 0.1% 0.6% 1.4 +‐1.5 0.39 5.9% 0.3%
2006.2‐2014.2 4.7 +‐2.4 0.64 0.1% 0.1% 3.6 +‐1.4 0.67 0.0% 0.5% 1.1 +‐1.5 0.44 15.3% 0.2%
2007.1‐2014.2 5.3 +‐2.6 0.67 0.1% 0.1% 3.9 +‐1.5 0.69 0.0% 1.1% 1.3 +‐1.7 0.44 10.6% 0.4%
2007.2‐2014.2 5.8 +‐2.9 0.69 0.1% 0.3% 4 +‐1.7 0.69 0.0% 2.2% 1.7 +‐1.9 0.44 7.0% 1.0%
2008.1‐2014.2 6.9 +‐3.1 0.75 0.0% 1.6% 4.7 +‐1.8 0.76 0.0% 9.5% 2.1 +‐2.2 0.45 5.6% 3.8%
2008.2‐2014.2 6.3 +‐4 0.74 0.5% 2.9% 4.7 +‐2.4 0.74 0.1% 19.7% 1.5 +‐2.7 0.47 26.0% 3.9%
2009.1‐2014.2 8 +‐8.6 0.74 5.7% 45.1% 7 +‐4.9 0.77 0.8% 74.0% 0.9 +‐5.8 0.46 73.4% 20.8%
2009.2‐2014.2 5.4 +‐10.5 0.69 26.3% 29.2% 6.3 +‐6.4 0.69 4.5% 90.8% ‐0.9 +‐7.2 0.42 77.3% 13.6%
2010.1‐2014.2 5.5 +‐11.5 0.62 28.8% 31.2% 6.2 +‐6.8 0.58 6.2% 80.6% ‐0.7 +‐7.4 0.45 83.3% 11.4%
2010.2‐2014.2 7.5 +‐13.1 0.36 19.5% 98.4% 7.6 +‐7.4 0.51 4.0% 31.9% ‐0.1 +‐8.9 0.02 98.2% 42.0%
2011.1‐2014.2 7.1 +‐14.1 0.38 23.6% 66.2% 7.5 +‐8.2 0.5 6.1% 61.0% ‐0.3 +‐9.8 0.01 94.3% 34.5%
2011.2‐2014.2 7.2 +‐16.4 0.28 27.5% 51.5% 7.4 +‐9.3 0.36 8.4% 43.3% ‐0.2 +‐9.1 0.38 95.3% 11.2%
2012.1‐2014.2 11.2 +‐13.6 0.74 6.8% 9.2% 9.6 +‐8.4 0.73 3.2% 73.4% 1.5 +‐10.1 0.55 66.5% 7.4%
125

Exhibit BPage 2 (d)
Province of AlbertaCommercial Automobile (excl. Farmers)
Third Party Liability - Property DamageNo Seasonality; No Unemployment; No Exclusions
Loss Cost Severity Frequency
Date Trend Conf. Int. Adj. R2 T Pval Time Trend Conf. Int. Adj. R2 T Pval Time Trend Conf. Int. Adj. R2 T Pval Time2005.1‐2016.2 1.1 +‐2 0.02 24.0% 2.2 +‐1.1 0.44 0.0% ‐1 +‐1.5 0.05 15.6%2005.2‐2016.2 1 +‐2.1 0 35.0% 2.3 +‐1.1 0.44 0.0% ‐1.3 +‐1.5 0.09 9.0%2006.1‐2016.2 0.9 +‐2.3 ‐0.02 44.2% 2.4 +‐1.2 0.43 0.0% ‐1.5 +‐1.7 0.11 7.2%2006.2‐2016.2 1.1 +‐2.5 ‐0.01 36.3% 3 +‐1.1 0.61 0.0% ‐1.8 +‐1.8 0.15 4.5%2007.1‐2016.2 1.6 +‐2.8 0.02 25.0% 3.3 +‐1.2 0.65 0.0% ‐1.7 +‐2 0.11 8.7%2007.2‐2016.2 2 +‐3.1 0.05 19.0% 3.6 +‐1.3 0.66 0.0% ‐1.6 +‐2.2 0.06 15.3%2008.1‐2016.2 2.7 +‐3.3 0.1 10.3% 4.1 +‐1.2 0.75 0.0% ‐1.4 +‐2.5 0.02 24.9%2008.2‐2016.2 2.6 +‐3.8 0.07 15.5% 4.3 +‐1.4 0.74 0.0% ‐1.6 +‐2.8 0.03 23.4%2009.1‐2016.2 3.1 +‐4.3 0.09 14.0% 4.7 +‐1.5 0.75 0.0% ‐1.5 +‐3.2 0 31.9%2009.2‐2016.2 1.9 +‐4.6 ‐0.01 37.5% 4.3 +‐1.7 0.7 0.0% ‐2.3 +‐3.4 0.07 18.1%2010.1‐2016.2 1 +‐5.1 ‐0.07 68.0% 3.9 +‐1.8 0.62 0.0% ‐2.8 +‐3.9 0.09 15.5%2010.2‐2016.2 ‐1.2 +‐5 ‐0.06 61.3% 3.4 +‐2 0.53 0.3% ‐4.4 +‐3.9 0.29 3.2%2011.1‐2016.2 ‐1.8 +‐5.8 ‐0.05 50.9% 3.7 +‐2.3 0.51 0.5% ‐5.3 +‐4.4 0.35 2.6%2011.2‐2016.2 ‐3.2 +‐6.7 0.01 32.1% 3.2 +‐2.7 0.38 2.6% ‐6.2 +‐5.1 0.37 2.8%2012.1‐2016.2 ‐4 +‐8.2 0.02 30.0% 4 +‐3.2 0.47 1.7% ‐7.7 +‐5.8 0.47 1.8%2012.2‐2016.2 ‐8.3 +‐7 0.44 3.1% 3.2 +‐3.8 0.28 8.0% ‐11.2 +‐4.2 0.81 0.1%2013.1‐2016.2 ‐10.7 +‐8.1 0.54 2.3% 1.7 +‐4.2 0.01 34.5% ‐12.2 +‐5.2 0.8 0.2%2013.2‐2016.2 ‐14 +‐8.9 0.69 1.3% 1.1 +‐5.8 ‐0.14 63.2% ‐14.9 +‐4.6 0.91 0.1%2014.1‐2016.2 ‐13.3 +‐13.6 0.52 6.5% 1.1 +‐8.8 ‐0.21 73.8% ‐14.2 +‐6.9 0.84 0.6%
Loss Cost Severity Frequency
Date Trend Conf. Int. Adj. R2 T Pval Time Trend Conf. Int. Adj. R2 T Pval Time Trend Conf. Int. Adj. R2 T Pval Time2003.1‐2014.2 3.8 +‐1.8 0.44 0.0% 2.2 +‐1.1 0.42 0.0% 1.6 +‐1.1 0.26 0.6%2003.2‐2014.2 3.7 +‐2 0.39 0.1% 2.1 +‐1.2 0.37 0.1% 1.6 +‐1.2 0.23 1.2%2004.1‐2014.2 3.2 +‐2.1 0.31 0.4% 1.8 +‐1.3 0.29 0.6% 1.3 +‐1.3 0.16 3.8%2004.2‐2014.2 3.1 +‐2.3 0.26 1.0% 2 +‐1.4 0.3 0.6% 1.1 +‐1.4 0.08 11.2%2005.1‐2014.2 2.8 +‐2.5 0.19 3.0% 1.9 +‐1.5 0.24 1.6% 0.9 +‐1.5 0.03 22.0%2005.2‐2014.2 2.8 +‐2.8 0.16 5.1% 2.1 +‐1.7 0.25 1.8% 0.7 +‐1.6 ‐0.01 38.4%2006.1‐2014.2 2.8 +‐3.2 0.14 7.2% 2.2 +‐1.9 0.24 2.3% 0.6 +‐1.8 ‐0.03 46.9%2006.2‐2014.2 3.5 +‐3.5 0.19 4.4% 3.1 +‐1.7 0.46 0.2% 0.4 +‐2 ‐0.05 65.8%2007.1‐2014.2 4.6 +‐3.7 0.3 1.7% 3.6 +‐1.9 0.52 0.1% 1 +‐2.2 ‐0.01 35.7%2007.2‐2014.2 5.7 +‐4 0.4 0.7% 4 +‐2.1 0.56 0.1% 1.7 +‐2.4 0.09 15.0%2008.1‐2014.2 7.7 +‐3.8 0.6 0.1% 5 +‐1.9 0.71 0.0% 2.5 +‐2.5 0.24 4.5%2008.2‐2014.2 8.5 +‐4.4 0.61 0.1% 5.5 +‐2.2 0.72 0.0% 2.9 +‐2.9 0.24 4.9%2009.1‐2014.2 10.6 +‐4.2 0.75 0.0% 6.4 +‐2.3 0.79 0.0% 4 +‐3.1 0.41 1.5%2009.2‐2014.2 10 +‐5 0.68 0.1% 6 +‐2.7 0.72 0.1% 3.7 +‐3.7 0.31 4.5%2010.1‐2014.2 10 +‐6.3 0.61 0.5% 5.6 +‐3.3 0.63 0.4% 4.2 +‐4.6 0.29 6.1%2010.2‐2014.2 7.6 +‐6.7 0.45 2.8% 5 +‐4.1 0.49 2.1% 2.5 +‐5 0.05 26.7%2011.1‐2014.2 9 +‐8.8 0.46 3.9% 6.2 +‐5 0.56 2.0% 2.7 +‐6.7 0 36.2%2011.2‐2014.2 9.5 +‐12.4 0.35 9.4% 5.8 +‐7 0.39 7.8% 3.4 +‐9.3 ‐0.01 38.0%2012.1‐2014.2 13 +‐17.8 0.43 9.6% 9.8 +‐6.4 0.79 1.1% 3 +‐14.2 ‐0.15 58.7%
126
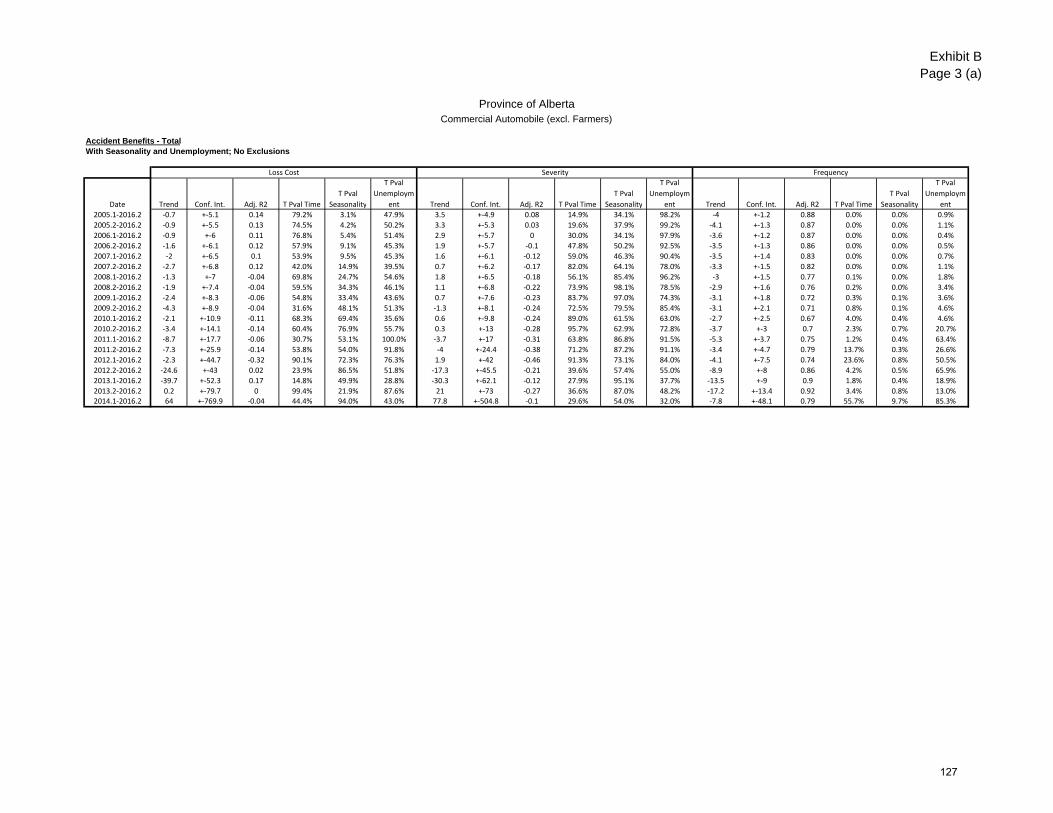
Exhibit BPage 3 (a)
Province of AlbertaCommercial Automobile (excl. Farmers)
Accident Benefits - TotalWith Seasonality and Unemployment; No Exclusions
Loss Cost Severity Frequency
Date Trend Conf. Int. Adj. R2 T Pval Time
T Pval
Seasonality
T Pval
Unemploym
ent Trend Conf. Int. Adj. R2 T Pval Time
T Pval
Seasonality
T Pval
Unemploym
ent Trend Conf. Int. Adj. R2 T Pval Time
T Pval
Seasonality
T Pval
Unemploym
ent
2005.1‐2016.2 ‐0.7 +‐5.1 0.14 79.2% 3.1% 47.9% 3.5 +‐4.9 0.08 14.9% 34.1% 98.2% ‐4 +‐1.2 0.88 0.0% 0.0% 0.9%
2005.2‐2016.2 ‐0.9 +‐5.5 0.13 74.5% 4.2% 50.2% 3.3 +‐5.3 0.03 19.6% 37.9% 99.2% ‐4.1 +‐1.3 0.87 0.0% 0.0% 1.1%
2006.1‐2016.2 ‐0.9 +‐6 0.11 76.8% 5.4% 51.4% 2.9 +‐5.7 0 30.0% 34.1% 97.9% ‐3.6 +‐1.2 0.87 0.0% 0.0% 0.4%
2006.2‐2016.2 ‐1.6 +‐6.1 0.12 57.9% 9.1% 45.3% 1.9 +‐5.7 ‐0.1 47.8% 50.2% 92.5% ‐3.5 +‐1.3 0.86 0.0% 0.0% 0.5%
2007.1‐2016.2 ‐2 +‐6.5 0.1 53.9% 9.5% 45.3% 1.6 +‐6.1 ‐0.12 59.0% 46.3% 90.4% ‐3.5 +‐1.4 0.83 0.0% 0.0% 0.7%
2007.2‐2016.2 ‐2.7 +‐6.8 0.12 42.0% 14.9% 39.5% 0.7 +‐6.2 ‐0.17 82.0% 64.1% 78.0% ‐3.3 +‐1.5 0.82 0.0% 0.0% 1.1%
2008.1‐2016.2 ‐1.3 +‐7 ‐0.04 69.8% 24.7% 54.6% 1.8 +‐6.5 ‐0.18 56.1% 85.4% 96.2% ‐3 +‐1.5 0.77 0.1% 0.0% 1.8%
2008.2‐2016.2 ‐1.9 +‐7.4 ‐0.04 59.5% 34.3% 46.1% 1.1 +‐6.8 ‐0.22 73.9% 98.1% 78.5% ‐2.9 +‐1.6 0.76 0.2% 0.0% 3.4%
2009.1‐2016.2 ‐2.4 +‐8.3 ‐0.06 54.8% 33.4% 43.6% 0.7 +‐7.6 ‐0.23 83.7% 97.0% 74.3% ‐3.1 +‐1.8 0.72 0.3% 0.1% 3.6%
2009.2‐2016.2 ‐4.3 +‐8.9 ‐0.04 31.6% 48.1% 51.3% ‐1.3 +‐8.1 ‐0.24 72.5% 79.5% 85.4% ‐3.1 +‐2.1 0.71 0.8% 0.1% 4.6%
2010.1‐2016.2 ‐2.1 +‐10.9 ‐0.11 68.3% 69.4% 35.6% 0.6 +‐9.8 ‐0.24 89.0% 61.5% 63.0% ‐2.7 +‐2.5 0.67 4.0% 0.4% 4.6%
2010.2‐2016.2 ‐3.4 +‐14.1 ‐0.14 60.4% 76.9% 55.7% 0.3 +‐13 ‐0.28 95.7% 62.9% 72.8% ‐3.7 +‐3 0.7 2.3% 0.7% 20.7%
2011.1‐2016.2 ‐8.7 +‐17.7 ‐0.06 30.7% 53.1% 100.0% ‐3.7 +‐17 ‐0.31 63.8% 86.8% 91.5% ‐5.3 +‐3.7 0.75 1.2% 0.4% 63.4%
2011.2‐2016.2 ‐7.3 +‐25.9 ‐0.14 53.8% 54.0% 91.8% ‐4 +‐24.4 ‐0.38 71.2% 87.2% 91.1% ‐3.4 +‐4.7 0.79 13.7% 0.3% 26.6%
2012.1‐2016.2 ‐2.3 +‐44.7 ‐0.32 90.1% 72.3% 76.3% 1.9 +‐42 ‐0.46 91.3% 73.1% 84.0% ‐4.1 +‐7.5 0.74 23.6% 0.8% 50.5%
2012.2‐2016.2 ‐24.6 +‐43 0.02 23.9% 86.5% 51.8% ‐17.3 +‐45.5 ‐0.21 39.6% 57.4% 55.0% ‐8.9 +‐8 0.86 4.2% 0.5% 65.9%
2013.1‐2016.2 ‐39.7 +‐52.3 0.17 14.8% 49.9% 28.8% ‐30.3 +‐62.1 ‐0.12 27.9% 95.1% 37.7% ‐13.5 +‐9 0.9 1.8% 0.4% 18.9%
2013.2‐2016.2 0.2 +‐79.7 0 99.4% 21.9% 87.6% 21 +‐73 ‐0.27 36.6% 87.0% 48.2% ‐17.2 +‐13.4 0.92 3.4% 0.8% 13.0%2014.1‐2016.2 64 +‐769.9 ‐0.04 44.4% 94.0% 43.0% 77.8 +‐504.8 ‐0.1 29.6% 54.0% 32.0% ‐7.8 +‐48.1 0.79 55.7% 9.7% 85.3%
127

Exhibit BPage 3 (b)
Province of AlbertaCommercial Automobile (excl. Farmers)
Accident Benefits - TotalWith Seasonality and Unemployment; Excluding 2007.2 and 2013.1
Loss Cost Severity Frequency
Date Trend Conf. Int. Adj. R2 T Pval Time
T Pval
Seasonality
T Pval
Unemploym
ent Trend Conf. Int. Adj. R2 T Pval Time
T Pval
Seasonality
T Pval
Unemploym
ent Trend Conf. Int. Adj. R2 T Pval Time
T Pval
Seasonality
T Pval
Unemploym
ent
2005.1‐2016.2 ‐2.3 +‐3.2 0.42 16.5% 0.1% 74.1% 1.9 +‐3.1 0.39 21.1% 4.8% 16.4% ‐4.1 +‐1.3 0.86 0.0% 0.0% 2.3%
2005.2‐2016.2 ‐2.3 +‐3.5 0.41 18.9% 0.1% 74.5% 1.9 +‐3.3 0.35 23.8% 5.7% 17.8% ‐4.1 +‐1.4 0.86 0.0% 0.0% 2.8%
2006.1‐2016.2 ‐2.2 +‐3.9 0.36 25.9% 0.2% 76.2% 1.5 +‐3.6 0.33 39.3% 5.0% 17.4% ‐3.6 +‐1.3 0.85 0.0% 0.0% 1.0%
2006.2‐2016.2 ‐2.7 +‐3.9 0.36 17.8% 0.4% 86.2% 0.9 +‐3.6 0.19 61.4% 8.0% 21.5% ‐3.5 +‐1.3 0.84 0.0% 0.0% 1.5%
2007.1‐2016.2 ‐2.7 +‐4.4 0.31 21.2% 0.7% 87.2% 0.7 +‐3.9 0.18 71.5% 8.8% 24.2% ‐3.3 +‐1.5 0.79 0.0% 0.0% 2.0%
2007.2‐2016.2 ‐3 +‐4.7 0.3 19.9% 1.2% 94.7% 0.2 +‐4.1 0.04 93.6% 13.4% 32.9% ‐3.1 +‐1.5 0.78 0.1% 0.0% 3.2%
2008.1‐2016.2 ‐3 +‐4.7 0.3 19.9% 1.2% 94.7% 0.2 +‐4.1 0.04 93.6% 13.4% 32.9% ‐3.1 +‐1.5 0.78 0.1% 0.0% 3.2%
2008.2‐2016.2 ‐3.1 +‐5.1 0.29 21.3% 2.2% 99.5% ‐0.1 +‐4.3 ‐0.06 96.7% 20.3% 45.1% ‐3 +‐1.6 0.77 0.2% 0.1% 6.5%
2009.1‐2016.2 ‐3.4 +‐5.7 0.25 22.4% 2.8% 92.7% ‐0.2 +‐4.9 ‐0.08 92.4% 22.1% 52.2% ‐3.2 +‐1.8 0.73 0.3% 0.1% 6.9%
2009.2‐2016.2 ‐4.8 +‐6 0.28 11.0% 5.2% 98.7% ‐1.8 +‐4.9 ‐0.09 43.9% 37.1% 40.8% ‐3.1 +‐2.1 0.72 0.9% 0.2% 8.2%
2010.1‐2016.2 ‐3.2 +‐7.3 0.12 35.0% 11.2% 72.5% ‐0.5 +‐5.9 ‐0.27 86.0% 58.4% 68.5% ‐2.7 +‐2.6 0.68 4.4% 0.5% 8.4%
2010.2‐2016.2 ‐4.1 +‐9.5 0.09 35.9% 15.8% 90.4% ‐0.4 +‐7.9 ‐0.32 91.8% 60.7% 75.9% ‐3.7 +‐3.2 0.7 2.8% 0.9% 28.6%
2011.1‐2016.2 ‐10.4 +‐9.7 0.45 4.8% 3.5% 34.0% ‐5.3 +‐8.6 0.01 20.3% 23.3% 22.1% ‐5.4 +‐3.9 0.76 1.5% 0.5% 78.2%
2011.2‐2016.2 ‐5.8 +‐13 0.48 32.6% 2.3% 76.6% ‐2.6 +‐12.3 ‐0.06 62.0% 19.9% 47.1% ‐3.3 +‐4.7 0.82 14.6% 0.3% 30.9%
2012.1‐2016.2 1.8 +‐20 0.38 82.0% 5.7% 59.8% 5.8 +‐17.6 ‐0.05 41.7% 43.0% 75.4% ‐3.8 +‐7.8 0.78 27.6% 0.9% 52.6%
2012.2‐2016.2 ‐6.9 +‐30.2 0.32 56.9% 11.4% 86.9% 1.7 +‐30.4 ‐0.55 88.0% 58.6% 95.5% ‐8.4 +‐10.8 0.84 10.6% 1.6% 75.9%
2013.1‐2016.2 0.2 +‐79.7 0 99.4% 21.9% 87.6% 21 +‐73 ‐0.27 36.6% 87.0% 48.2% ‐17.2 +‐13.4 0.92 3.4% 0.8% 13.0%
2013.2‐2016.2 0.2 +‐79.7 0 99.4% 21.9% 87.6% 21 +‐73 ‐0.27 36.6% 87.0% 48.2% ‐17.2 +‐13.4 0.92 3.4% 0.8% 13.0%2014.1‐2016.2 64 +‐769.9 ‐0.04 44.4% 94.0% 43.0% 77.8 +‐504.8 ‐0.1 29.6% 54.0% 32.0% ‐7.8 +‐48.1 0.79 55.7% 9.7% 85.3%
128
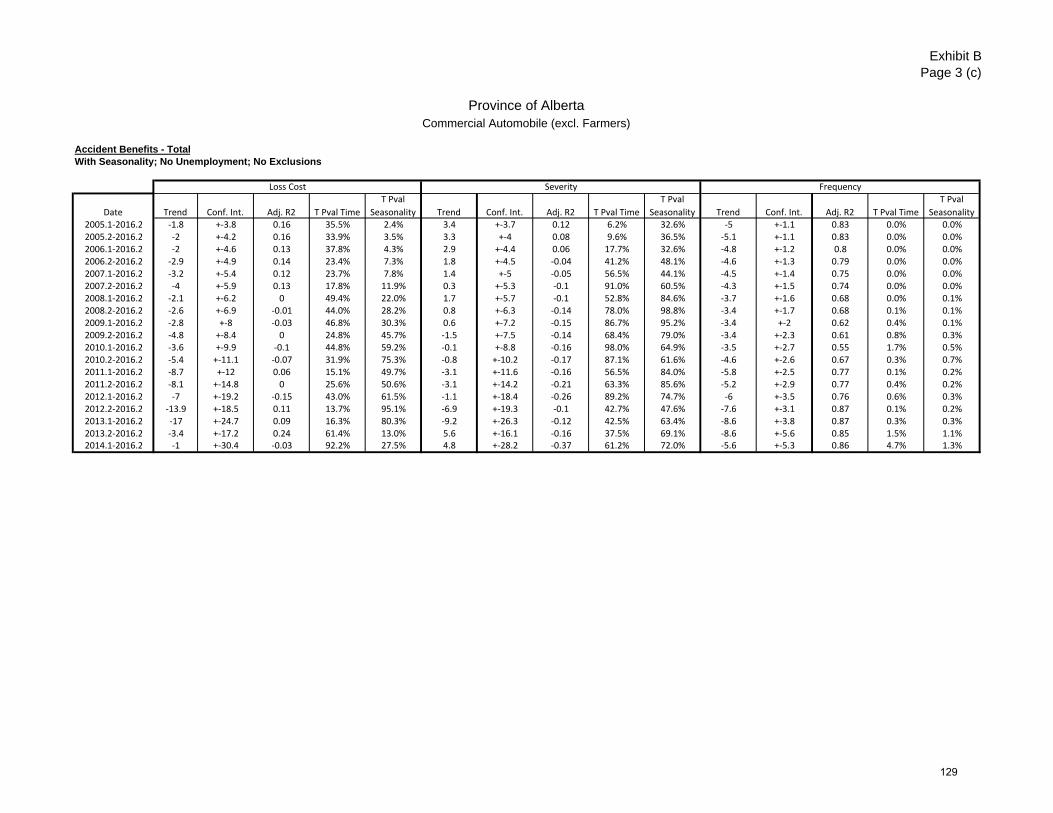
Exhibit BPage 3 (c)
Province of AlbertaCommercial Automobile (excl. Farmers)
Accident Benefits - TotalWith Seasonality; No Unemployment; No Exclusions
Loss Cost Severity Frequency
Date Trend Conf. Int. Adj. R2 T Pval Time
T Pval
Seasonality Trend Conf. Int. Adj. R2 T Pval Time
T Pval
Seasonality Trend Conf. Int. Adj. R2 T Pval Time
T Pval
Seasonality2005.1‐2016.2 ‐1.8 +‐3.8 0.16 35.5% 2.4% 3.4 +‐3.7 0.12 6.2% 32.6% ‐5 +‐1.1 0.83 0.0% 0.0%2005.2‐2016.2 ‐2 +‐4.2 0.16 33.9% 3.5% 3.3 +‐4 0.08 9.6% 36.5% ‐5.1 +‐1.1 0.83 0.0% 0.0%2006.1‐2016.2 ‐2 +‐4.6 0.13 37.8% 4.3% 2.9 +‐4.4 0.06 17.7% 32.6% ‐4.8 +‐1.2 0.8 0.0% 0.0%2006.2‐2016.2 ‐2.9 +‐4.9 0.14 23.4% 7.3% 1.8 +‐4.5 ‐0.04 41.2% 48.1% ‐4.6 +‐1.3 0.79 0.0% 0.0%2007.1‐2016.2 ‐3.2 +‐5.4 0.12 23.7% 7.8% 1.4 +‐5 ‐0.05 56.5% 44.1% ‐4.5 +‐1.4 0.75 0.0% 0.0%2007.2‐2016.2 ‐4 +‐5.9 0.13 17.8% 11.9% 0.3 +‐5.3 ‐0.1 91.0% 60.5% ‐4.3 +‐1.5 0.74 0.0% 0.0%2008.1‐2016.2 ‐2.1 +‐6.2 0 49.4% 22.0% 1.7 +‐5.7 ‐0.1 52.8% 84.6% ‐3.7 +‐1.6 0.68 0.0% 0.1%2008.2‐2016.2 ‐2.6 +‐6.9 ‐0.01 44.0% 28.2% 0.8 +‐6.3 ‐0.14 78.0% 98.8% ‐3.4 +‐1.7 0.68 0.1% 0.1%2009.1‐2016.2 ‐2.8 +‐8 ‐0.03 46.8% 30.3% 0.6 +‐7.2 ‐0.15 86.7% 95.2% ‐3.4 +‐2 0.62 0.4% 0.1%2009.2‐2016.2 ‐4.8 +‐8.4 0 24.8% 45.7% ‐1.5 +‐7.5 ‐0.14 68.4% 79.0% ‐3.4 +‐2.3 0.61 0.8% 0.3%2010.1‐2016.2 ‐3.6 +‐9.9 ‐0.1 44.8% 59.2% ‐0.1 +‐8.8 ‐0.16 98.0% 64.9% ‐3.5 +‐2.7 0.55 1.7% 0.5%2010.2‐2016.2 ‐5.4 +‐11.1 ‐0.07 31.9% 75.3% ‐0.8 +‐10.2 ‐0.17 87.1% 61.6% ‐4.6 +‐2.6 0.67 0.3% 0.7%2011.1‐2016.2 ‐8.7 +‐12 0.06 15.1% 49.7% ‐3.1 +‐11.6 ‐0.16 56.5% 84.0% ‐5.8 +‐2.5 0.77 0.1% 0.2%2011.2‐2016.2 ‐8.1 +‐14.8 0 25.6% 50.6% ‐3.1 +‐14.2 ‐0.21 63.3% 85.6% ‐5.2 +‐2.9 0.77 0.4% 0.2%2012.1‐2016.2 ‐7 +‐19.2 ‐0.15 43.0% 61.5% ‐1.1 +‐18.4 ‐0.26 89.2% 74.7% ‐6 +‐3.5 0.76 0.6% 0.3%2012.2‐2016.2 ‐13.9 +‐18.5 0.11 13.7% 95.1% ‐6.9 +‐19.3 ‐0.1 42.7% 47.6% ‐7.6 +‐3.1 0.87 0.1% 0.2%2013.1‐2016.2 ‐17 +‐24.7 0.09 16.3% 80.3% ‐9.2 +‐26.3 ‐0.12 42.5% 63.4% ‐8.6 +‐3.8 0.87 0.3% 0.3%2013.2‐2016.2 ‐3.4 +‐17.2 0.24 61.4% 13.0% 5.6 +‐16.1 ‐0.16 37.5% 69.1% ‐8.6 +‐5.6 0.85 1.5% 1.1%2014.1‐2016.2 ‐1 +‐30.4 ‐0.03 92.2% 27.5% 4.8 +‐28.2 ‐0.37 61.2% 72.0% ‐5.6 +‐5.3 0.86 4.7% 1.3%
129

Exhibit BPage 3 (d)
Province of AlbertaCommercial Automobile (excl. Farmers)
Accident Benefits - TotalWith Seasonality; No Unemployment; Excluding 2007.2 and 2013.1
Loss Cost Severity Frequency
Date Trend Conf. Int. Adj. R2 T Pval Time
T Pval
Seasonality Trend Conf. Int. Adj. R2 T Pval Time
T Pval
Seasonality Trend Conf. Int. Adj. R2 T Pval Time
T Pval
Seasonality2005.1‐2016.2 ‐1.9 +‐2.4 0.44 11.9% 0.0% 3.3 +‐2.5 0.35 1.2% 6.9% ‐5 +‐1.1 0.83 0.0% 0.0%2005.2‐2016.2 ‐2 +‐2.7 0.44 14.6% 0.1% 3.3 +‐2.7 0.31 1.8% 7.8% ‐5.1 +‐1.2 0.82 0.0% 0.0%2006.1‐2016.2 ‐1.8 +‐3 0.39 22.3% 0.2% 3 +‐3 0.29 5.1% 7.1% ‐4.6 +‐1.2 0.79 0.0% 0.0%2006.2‐2016.2 ‐2.5 +‐3.2 0.4 12.4% 0.3% 2 +‐3 0.16 16.9% 11.0% ‐4.4 +‐1.3 0.78 0.0% 0.0%2007.1‐2016.2 ‐2.5 +‐3.7 0.35 16.7% 0.5% 1.8 +‐3.5 0.15 29.4% 11.1% ‐4.2 +‐1.5 0.71 0.0% 0.1%2007.2‐2016.2 ‐2.9 +‐4.1 0.35 15.4% 0.9% 0.9 +‐3.7 0.04 59.6% 16.1% ‐3.8 +‐1.6 0.71 0.0% 0.0%2008.1‐2016.2 ‐2.9 +‐4.1 0.35 15.4% 0.9% 0.9 +‐3.7 0.04 59.6% 16.1% ‐3.8 +‐1.6 0.71 0.0% 0.0%2008.2‐2016.2 ‐3.1 +‐4.6 0.34 17.5% 1.5% 0.4 +‐4.1 ‐0.03 84.5% 24.1% ‐3.5 +‐1.7 0.71 0.1% 0.0%2009.1‐2016.2 ‐3.4 +‐5.3 0.31 19.4% 2.0% 0 +‐4.7 ‐0.03 99.3% 23.5% ‐3.4 +‐2 0.66 0.3% 0.1%2009.2‐2016.2 ‐4.8 +‐5.6 0.35 8.9% 4.0% ‐1.5 +‐4.7 ‐0.07 51.7% 40.9% ‐3.4 +‐2.3 0.65 0.8% 0.2%2010.1‐2016.2 ‐3.6 +‐6.4 0.2 24.4% 7.7% ‐0.1 +‐5.3 ‐0.17 96.7% 62.2% ‐3.5 +‐2.7 0.59 1.8% 0.4%2010.2‐2016.2 ‐4.4 +‐7.4 0.19 22.7% 13.0% 0.2 +‐6.3 ‐0.18 94.2% 60.4% ‐4.6 +‐2.7 0.69 0.4% 0.7%2011.1‐2016.2 ‐7.5 +‐7.2 0.45 5.1% 4.2% ‐1.9 +‐6.7 ‐0.09 54.0% 36.7% ‐5.7 +‐2.6 0.79 0.1% 0.2%2011.2‐2016.2 ‐4.6 +‐7.7 0.55 21.3% 1.5% 0.3 +‐7.7 0 92.5% 19.9% ‐4.9 +‐3 0.81 0.7% 0.2%2012.1‐2016.2 ‐1.8 +‐9.1 0.45 64.8% 2.6% 4 +‐8 0.11 26.1% 31.8% ‐5.5 +‐3.7 0.8 1.2% 0.3%2012.2‐2016.2 ‐5.1 +‐10.9 0.45 28.9% 7.5% 2.3 +‐10.8 ‐0.24 60.3% 53.9% ‐7.3 +‐4 0.87 0.6% 0.7%2013.1‐2016.2 ‐3.4 +‐17.2 0.24 61.4% 13.0% 5.6 +‐16.1 ‐0.16 37.5% 69.1% ‐8.6 +‐5.6 0.85 1.5% 1.1%2013.2‐2016.2 ‐3.4 +‐17.2 0.24 61.4% 13.0% 5.6 +‐16.1 ‐0.16 37.5% 69.1% ‐8.6 +‐5.6 0.85 1.5% 1.1%2014.1‐2016.2 ‐1 +‐30.4 ‐0.03 92.2% 27.5% 4.8 +‐28.2 ‐0.37 61.2% 72.0% ‐5.6 +‐5.3 0.86 4.7% 1.3%
130

Exhibit BPage 3 (e)
Province of AlbertaCommercial Automobile (excl. Farmers)
Accident Benefits - TotalWith Unemployment; No Seasonality; No Exclusions
Loss Cost Severity Frequency
Date Trend Conf. Int. Adj. R2 T Pval Time
T Pval
Unemploym
ent Trend Conf. Int. Adj. R2 T Pval Time
T Pval
Unemploym
ent Trend Conf. Int. Adj. R2 T Pval Time
T Pval
Unemploym
ent2005.1‐2016.2 0 +‐5.6 ‐0.04 99.9% 40.2% 3.7 +‐4.9 0.08 11.9% 91.1% ‐3.6 +‐1.9 0.68 0.1% 4.3%2005.2‐2016.2 ‐0.6 +‐6 ‐0.03 83.9% 44.1% 3.4 +‐5.3 0.04 17.9% 93.6% ‐3.9 +‐2 0.68 0.1% 5.3%2006.1‐2016.2 ‐0.2 +‐6.4 ‐0.05 95.9% 43.8% 3.2 +‐5.7 0 24.8% 95.1% ‐3.2 +‐1.9 0.66 0.3% 2.7%2006.2‐2016.2 ‐1.3 +‐6.4 0.01 67.2% 37.4% 2.1 +‐5.6 ‐0.07 44.5% 86.4% ‐3.3 +‐2.1 0.64 0.4% 3.0%2007.1‐2016.2 ‐1.3 +‐6.9 ‐0.01 70.0% 39.1% 1.8 +‐6 ‐0.09 52.2% 84.8% ‐3.1 +‐2.2 0.58 0.9% 3.8%2007.2‐2016.2 ‐2.4 +‐7.1 0.05 48.4% 32.2% 0.8 +‐6 ‐0.12 79.5% 73.0% ‐3.1 +‐2.3 0.55 1.2% 4.3%2008.1‐2016.2 ‐0.8 +‐7 ‐0.08 80.3% 49.7% 1.8 +‐6.2 ‐0.1 53.1% 95.0% ‐2.6 +‐2.3 0.44 2.9% 7.4%2008.2‐2016.2 ‐1.8 +‐7.4 ‐0.04 61.9% 38.0% 1.1 +‐6.5 ‐0.13 73.0% 77.8% ‐2.8 +‐2.5 0.4 3.2% 7.3%2009.1‐2016.2 ‐1.9 +‐8.2 ‐0.06 62.2% 40.0% 0.7 +‐7.2 ‐0.14 82.5% 73.0% ‐2.7 +‐2.8 0.29 6.0% 11.9%2009.2‐2016.2 ‐4.3 +‐8.7 0 30.7% 48.9% ‐1.3 +‐7.7 ‐0.15 71.3% 85.5% ‐3 +‐3.2 0.3 6.1% 15.0%2010.1‐2016.2 ‐1.7 +‐10.2 ‐0.02 71.6% 30.4% 0.3 +‐9.2 ‐0.16 95.3% 66.7% ‐2 +‐3.6 0.29 25.5% 7.9%2010.2‐2016.2 ‐3.4 +‐13.2 ‐0.04 58.7% 53.3% 0.3 +‐12.3 ‐0.18 95.9% 72.2% ‐3.7 +‐4.3 0.36 9.2% 35.4%2011.1‐2016.2 ‐7.6 +‐16.6 0.01 34.5% 89.9% ‐4 +‐15.3 ‐0.17 57.8% 88.1% ‐3.8 +‐5.9 0.33 18.9% 45.4%2011.2‐2016.2 ‐6.9 +‐24.3 ‐0.06 53.9% 88.3% ‐4.1 +‐22.2 ‐0.21 68.6% 89.6% ‐3 +‐8.5 0.26 45.1% 44.7%2012.1‐2016.2 0 +‐38.5 ‐0.15 99.9% 64.5% ‐0.2 +‐34.6 ‐0.28 99.0% 91.3% 0.2 +‐12.5 0.2 97.6% 29.2%2012.2‐2016.2 ‐24.2 +‐36.8 0.18 19.8% 48.9% ‐18.8 +‐39.3 ‐0.09 31.6% 45.5% ‐6.6 +‐16.5 0.35 37.8% 87.8%2013.1‐2016.2 ‐33.8 +‐43.7 0.25 14.8% 33.7% ‐30.9 +‐43.6 0.1 17.1% 26.9% ‐4.2 +‐24 0.15 67.7% 75.6%2013.2‐2016.2 9.7 +‐85.2 ‐0.35 73.8% 62.8% 22 +‐52.7 0.03 25.8% 36.9% ‐10.1 +‐41.7 0.12 54.5% 91.5%2014.1‐2016.2 69.8 +‐157.6 0.3 13.5% 13.8% 40.1 +‐111.9 0.07 23.9% 29.3% 21.2 +‐53.4 0.24 24.8% 18.3%
131
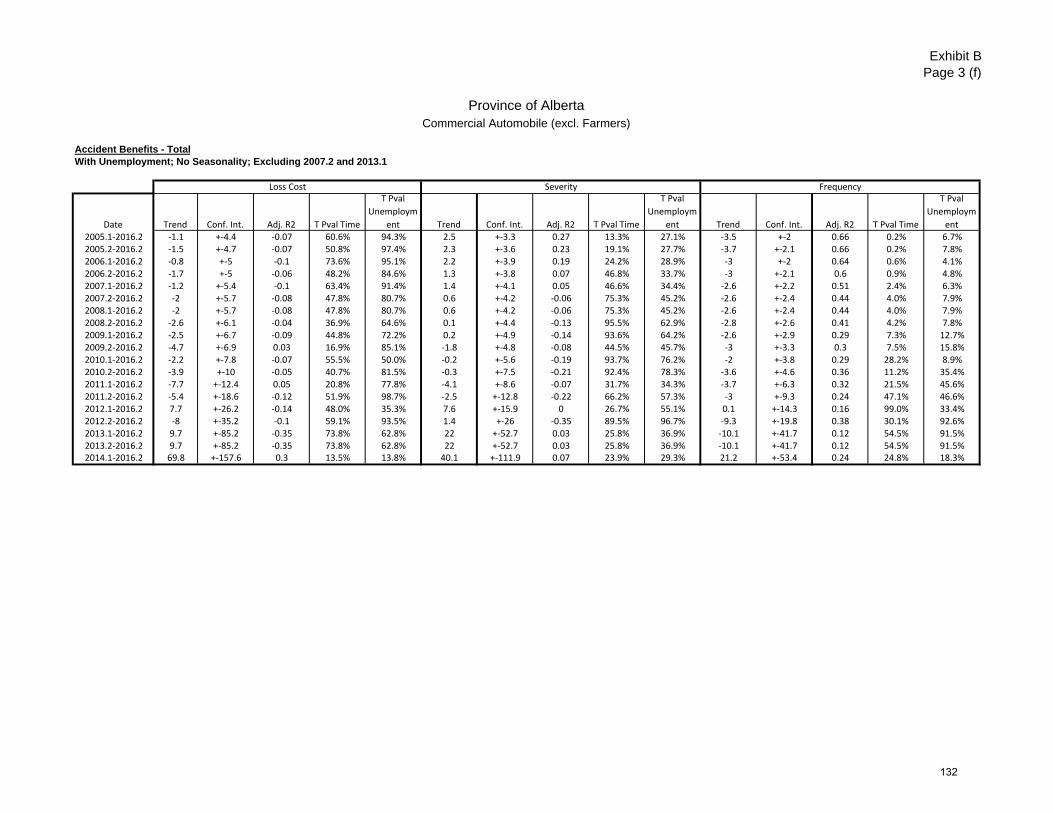
Exhibit BPage 3 (f)
Province of AlbertaCommercial Automobile (excl. Farmers)
Accident Benefits - TotalWith Unemployment; No Seasonality; Excluding 2007.2 and 2013.1
Loss Cost Severity Frequency
Date Trend Conf. Int. Adj. R2 T Pval Time
T Pval
Unemploym
ent Trend Conf. Int. Adj. R2 T Pval Time
T Pval
Unemploym
ent Trend Conf. Int. Adj. R2 T Pval Time
T Pval
Unemploym
ent2005.1‐2016.2 ‐1.1 +‐4.4 ‐0.07 60.6% 94.3% 2.5 +‐3.3 0.27 13.3% 27.1% ‐3.5 +‐2 0.66 0.2% 6.7%2005.2‐2016.2 ‐1.5 +‐4.7 ‐0.07 50.8% 97.4% 2.3 +‐3.6 0.23 19.1% 27.7% ‐3.7 +‐2.1 0.66 0.2% 7.8%2006.1‐2016.2 ‐0.8 +‐5 ‐0.1 73.6% 95.1% 2.2 +‐3.9 0.19 24.2% 28.9% ‐3 +‐2 0.64 0.6% 4.1%2006.2‐2016.2 ‐1.7 +‐5 ‐0.06 48.2% 84.6% 1.3 +‐3.8 0.07 46.8% 33.7% ‐3 +‐2.1 0.6 0.9% 4.8%2007.1‐2016.2 ‐1.2 +‐5.4 ‐0.1 63.4% 91.4% 1.4 +‐4.1 0.05 46.6% 34.4% ‐2.6 +‐2.2 0.51 2.4% 6.3%2007.2‐2016.2 ‐2 +‐5.7 ‐0.08 47.8% 80.7% 0.6 +‐4.2 ‐0.06 75.3% 45.2% ‐2.6 +‐2.4 0.44 4.0% 7.9%2008.1‐2016.2 ‐2 +‐5.7 ‐0.08 47.8% 80.7% 0.6 +‐4.2 ‐0.06 75.3% 45.2% ‐2.6 +‐2.4 0.44 4.0% 7.9%2008.2‐2016.2 ‐2.6 +‐6.1 ‐0.04 36.9% 64.6% 0.1 +‐4.4 ‐0.13 95.5% 62.9% ‐2.8 +‐2.6 0.41 4.2% 7.8%2009.1‐2016.2 ‐2.5 +‐6.7 ‐0.09 44.8% 72.2% 0.2 +‐4.9 ‐0.14 93.6% 64.2% ‐2.6 +‐2.9 0.29 7.3% 12.7%2009.2‐2016.2 ‐4.7 +‐6.9 0.03 16.9% 85.1% ‐1.8 +‐4.8 ‐0.08 44.5% 45.7% ‐3 +‐3.3 0.3 7.5% 15.8%2010.1‐2016.2 ‐2.2 +‐7.8 ‐0.07 55.5% 50.0% ‐0.2 +‐5.6 ‐0.19 93.7% 76.2% ‐2 +‐3.8 0.29 28.2% 8.9%2010.2‐2016.2 ‐3.9 +‐10 ‐0.05 40.7% 81.5% ‐0.3 +‐7.5 ‐0.21 92.4% 78.3% ‐3.6 +‐4.6 0.36 11.2% 35.4%2011.1‐2016.2 ‐7.7 +‐12.4 0.05 20.8% 77.8% ‐4.1 +‐8.6 ‐0.07 31.7% 34.3% ‐3.7 +‐6.3 0.32 21.5% 45.6%2011.2‐2016.2 ‐5.4 +‐18.6 ‐0.12 51.9% 98.7% ‐2.5 +‐12.8 ‐0.22 66.2% 57.3% ‐3 +‐9.3 0.24 47.1% 46.6%2012.1‐2016.2 7.7 +‐26.2 ‐0.14 48.0% 35.3% 7.6 +‐15.9 0 26.7% 55.1% 0.1 +‐14.3 0.16 99.0% 33.4%2012.2‐2016.2 ‐8 +‐35.2 ‐0.1 59.1% 93.5% 1.4 +‐26 ‐0.35 89.5% 96.7% ‐9.3 +‐19.8 0.38 30.1% 92.6%2013.1‐2016.2 9.7 +‐85.2 ‐0.35 73.8% 62.8% 22 +‐52.7 0.03 25.8% 36.9% ‐10.1 +‐41.7 0.12 54.5% 91.5%2013.2‐2016.2 9.7 +‐85.2 ‐0.35 73.8% 62.8% 22 +‐52.7 0.03 25.8% 36.9% ‐10.1 +‐41.7 0.12 54.5% 91.5%2014.1‐2016.2 69.8 +‐157.6 0.3 13.5% 13.8% 40.1 +‐111.9 0.07 23.9% 29.3% 21.2 +‐53.4 0.24 24.8% 18.3%
132

Exhibit BPage 3 (g)
Province of AlbertaCommercial Automobile (excl. Farmers)
Accident Benefits - TotalNo Seasonality; No Unemployment; No Exclusions
Loss Cost Severity Frequency
Date Trend Conf. Int. Adj. R2 T Pval Time Trend Conf. Int. Adj. R2 T Pval Time Trend Conf. Int. Adj. R2 T Pval Time2005.1‐2016.2 ‐1.4 +‐4.2 ‐0.02 49.1% 3.6 +‐3.7 0.12 5.3% ‐4.8 +‐1.6 0.62 0.0%2005.2‐2016.2 ‐2 +‐4.5 ‐0.01 38.1% 3.3 +‐4 0.09 9.4% ‐5.1 +‐1.7 0.63 0.0%2006.1‐2016.2 ‐1.6 +‐5 ‐0.03 50.7% 3.1 +‐4.4 0.05 15.3% ‐4.6 +‐1.7 0.58 0.0%2006.2‐2016.2 ‐2.9 +‐5.2 0.02 26.3% 1.8 +‐4.5 ‐0.01 40.6% ‐4.6 +‐1.9 0.55 0.0%2007.1‐2016.2 ‐2.8 +‐5.7 0 33.1% 1.5 +‐4.9 ‐0.03 51.4% ‐4.3 +‐2 0.49 0.0%2007.2‐2016.2 ‐4 +‐6.1 0.04 19.7% 0.3 +‐5.2 ‐0.06 90.7% ‐4.3 +‐2.2 0.44 0.1%2008.1‐2016.2 ‐1.7 +‐6.3 ‐0.04 57.7% 1.8 +‐5.5 ‐0.03 50.0% ‐3.4 +‐2.3 0.34 0.6%2008.2‐2016.2 ‐2.6 +‐7 ‐0.02 44.2% 0.8 +‐6 ‐0.06 77.2% ‐3.4 +‐2.6 0.3 1.4%2009.1‐2016.2 ‐2.4 +‐8 ‐0.04 53.8% 0.6 +‐6.9 ‐0.07 85.5% ‐2.9 +‐2.9 0.2 4.8%2009.2‐2016.2 ‐4.8 +‐8.2 0.04 23.9% ‐1.5 +‐7.2 ‐0.06 67.2% ‐3.4 +‐3.2 0.23 4.2%2010.1‐2016.2 ‐3.3 +‐9.5 ‐0.04 47.0% ‐0.3 +‐8.3 ‐0.08 93.2% ‐3 +‐3.7 0.13 11.1%2010.2‐2016.2 ‐5.4 +‐10.5 0.02 29.7% ‐0.8 +‐9.8 ‐0.09 86.6% ‐4.6 +‐3.6 0.37 1.7%2011.1‐2016.2 ‐8.2 +‐11.5 0.11 15.9% ‐3.3 +‐10.8 ‐0.05 52.0% ‐5.1 +‐4.2 0.35 2.5%2011.2‐2016.2 ‐8.1 +‐14.1 0.06 23.9% ‐3.1 +‐13.2 ‐0.08 61.2% ‐5.2 +‐5.1 0.29 5.1%2012.1‐2016.2 ‐6.3 +‐17.7 ‐0.04 45.0% ‐1.5 +‐16.5 ‐0.12 83.6% ‐4.8 +‐6.3 0.17 12.8%2012.2‐2016.2 ‐13.9 +‐16.6 0.23 10.6% ‐6.9 +‐18 ‐0.03 40.9% ‐7.6 +‐6.4 0.44 3.1%2013.1‐2016.2 ‐16.4 +‐21.1 0.23 12.9% ‐10.3 +‐22.5 0.02 32.6% ‐6.9 +‐8.5 0.28 10.4%2013.2‐2016.2 ‐3.4 +‐19.7 ‐0.15 67.7% 5.6 +‐13.7 0.03 32.6% ‐8.6 +‐11.3 0.29 12.1%2014.1‐2016.2 2.7 +‐28.7 ‐0.23 79.9% 5.8 +‐21 ‐0.08 46.8% ‐2.9 +‐12.7 ‐0.14 56.2%
133
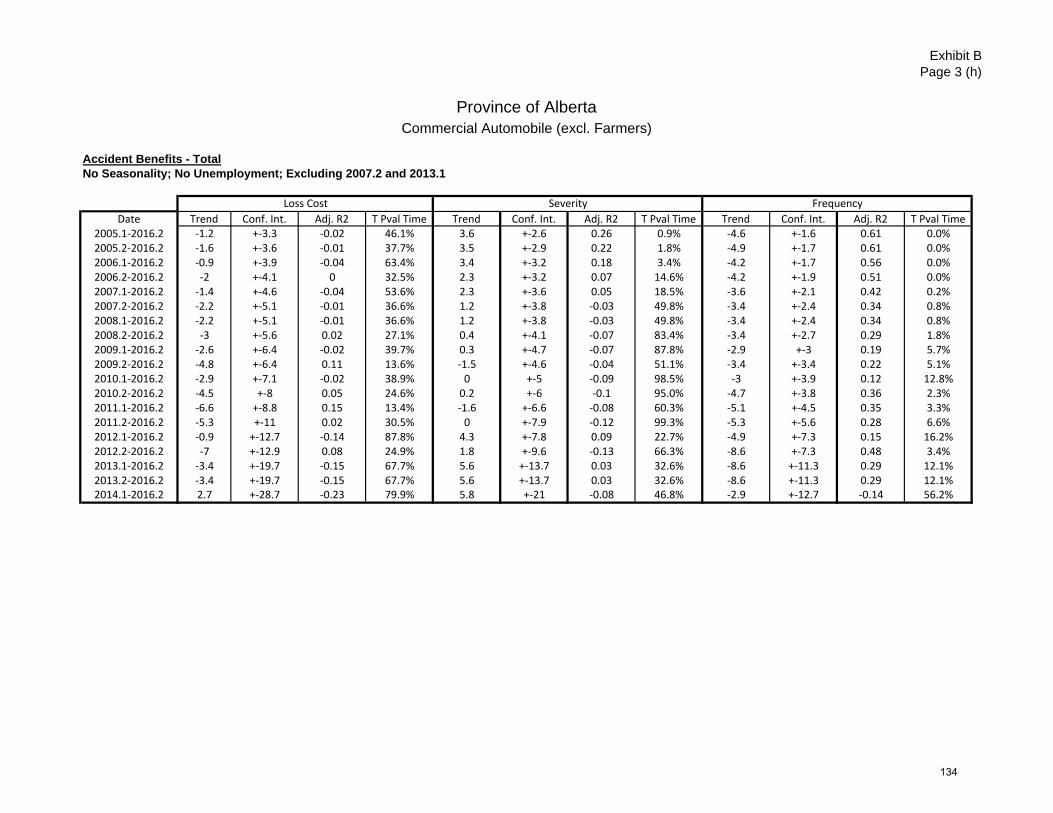
Exhibit BPage 3 (h)
Province of AlbertaCommercial Automobile (excl. Farmers)
Accident Benefits - TotalNo Seasonality; No Unemployment; Excluding 2007.2 and 2013.1
Loss Cost Severity Frequency
Date Trend Conf. Int. Adj. R2 T Pval Time Trend Conf. Int. Adj. R2 T Pval Time Trend Conf. Int. Adj. R2 T Pval Time2005.1‐2016.2 ‐1.2 +‐3.3 ‐0.02 46.1% 3.6 +‐2.6 0.26 0.9% ‐4.6 +‐1.6 0.61 0.0%2005.2‐2016.2 ‐1.6 +‐3.6 ‐0.01 37.7% 3.5 +‐2.9 0.22 1.8% ‐4.9 +‐1.7 0.61 0.0%2006.1‐2016.2 ‐0.9 +‐3.9 ‐0.04 63.4% 3.4 +‐3.2 0.18 3.4% ‐4.2 +‐1.7 0.56 0.0%2006.2‐2016.2 ‐2 +‐4.1 0 32.5% 2.3 +‐3.2 0.07 14.6% ‐4.2 +‐1.9 0.51 0.0%2007.1‐2016.2 ‐1.4 +‐4.6 ‐0.04 53.6% 2.3 +‐3.6 0.05 18.5% ‐3.6 +‐2.1 0.42 0.2%2007.2‐2016.2 ‐2.2 +‐5.1 ‐0.01 36.6% 1.2 +‐3.8 ‐0.03 49.8% ‐3.4 +‐2.4 0.34 0.8%2008.1‐2016.2 ‐2.2 +‐5.1 ‐0.01 36.6% 1.2 +‐3.8 ‐0.03 49.8% ‐3.4 +‐2.4 0.34 0.8%2008.2‐2016.2 ‐3 +‐5.6 0.02 27.1% 0.4 +‐4.1 ‐0.07 83.4% ‐3.4 +‐2.7 0.29 1.8%2009.1‐2016.2 ‐2.6 +‐6.4 ‐0.02 39.7% 0.3 +‐4.7 ‐0.07 87.8% ‐2.9 +‐3 0.19 5.7%2009.2‐2016.2 ‐4.8 +‐6.4 0.11 13.6% ‐1.5 +‐4.6 ‐0.04 51.1% ‐3.4 +‐3.4 0.22 5.1%2010.1‐2016.2 ‐2.9 +‐7.1 ‐0.02 38.9% 0 +‐5 ‐0.09 98.5% ‐3 +‐3.9 0.12 12.8%2010.2‐2016.2 ‐4.5 +‐8 0.05 24.6% 0.2 +‐6 ‐0.1 95.0% ‐4.7 +‐3.8 0.36 2.3%2011.1‐2016.2 ‐6.6 +‐8.8 0.15 13.4% ‐1.6 +‐6.6 ‐0.08 60.3% ‐5.1 +‐4.5 0.35 3.3%2011.2‐2016.2 ‐5.3 +‐11 0.02 30.5% 0 +‐7.9 ‐0.12 99.3% ‐5.3 +‐5.6 0.28 6.6%2012.1‐2016.2 ‐0.9 +‐12.7 ‐0.14 87.8% 4.3 +‐7.8 0.09 22.7% ‐4.9 +‐7.3 0.15 16.2%2012.2‐2016.2 ‐7 +‐12.9 0.08 24.9% 1.8 +‐9.6 ‐0.13 66.3% ‐8.6 +‐7.3 0.48 3.4%2013.1‐2016.2 ‐3.4 +‐19.7 ‐0.15 67.7% 5.6 +‐13.7 0.03 32.6% ‐8.6 +‐11.3 0.29 12.1%2013.2‐2016.2 ‐3.4 +‐19.7 ‐0.15 67.7% 5.6 +‐13.7 0.03 32.6% ‐8.6 +‐11.3 0.29 12.1%2014.1‐2016.2 2.7 +‐28.7 ‐0.23 79.9% 5.8 +‐21 ‐0.08 46.8% ‐2.9 +‐12.7 ‐0.14 56.2%
134
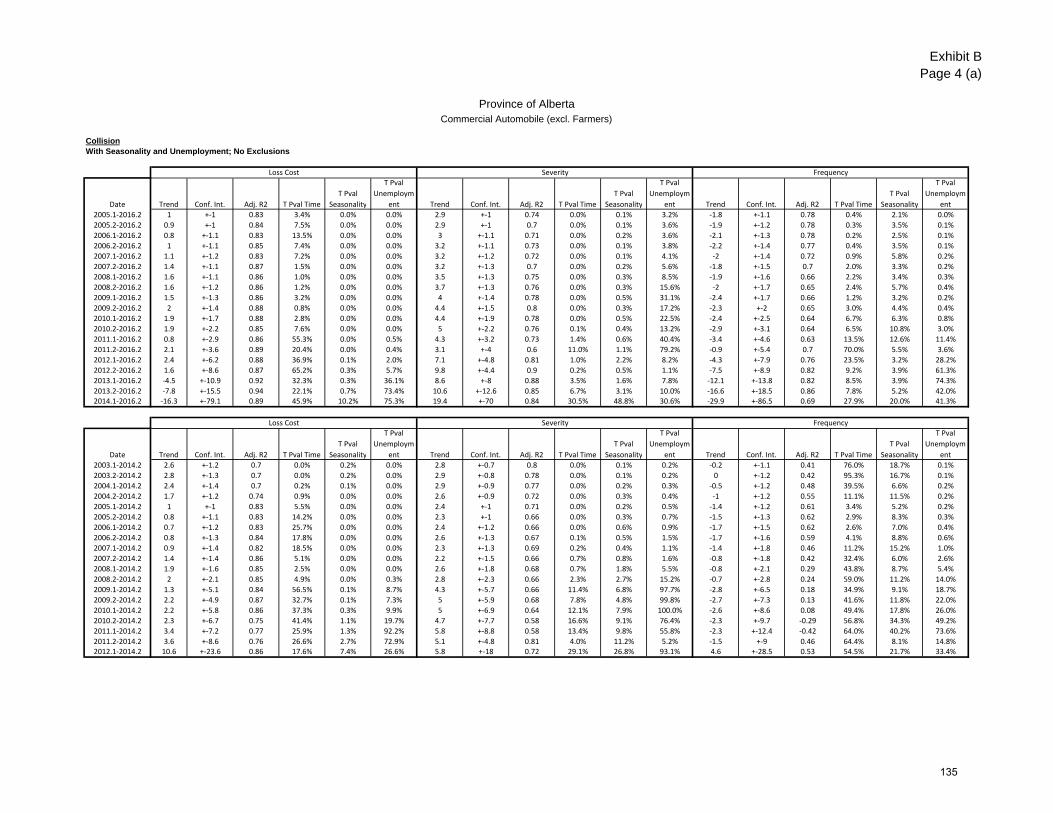
Exhibit BPage 4 (a)
Province of AlbertaCommercial Automobile (excl. Farmers)
CollisionWith Seasonality and Unemployment; No Exclusions
Loss Cost Severity Frequency
Date Trend Conf. Int. Adj. R2 T Pval Time
T Pval
Seasonality
T Pval
Unemploym
ent Trend Conf. Int. Adj. R2 T Pval Time
T Pval
Seasonality
T Pval
Unemploym
ent Trend Conf. Int. Adj. R2 T Pval Time
T Pval
Seasonality
T Pval
Unemploym
ent
2005.1‐2016.2 1 +‐1 0.83 3.4% 0.0% 0.0% 2.9 +‐1 0.74 0.0% 0.1% 3.2% ‐1.8 +‐1.1 0.78 0.4% 2.1% 0.0%
2005.2‐2016.2 0.9 +‐1 0.84 7.5% 0.0% 0.0% 2.9 +‐1 0.7 0.0% 0.1% 3.6% ‐1.9 +‐1.2 0.78 0.3% 3.5% 0.1%
2006.1‐2016.2 0.8 +‐1.1 0.83 13.5% 0.0% 0.0% 3 +‐1.1 0.71 0.0% 0.2% 3.6% ‐2.1 +‐1.3 0.78 0.2% 2.5% 0.1%
2006.2‐2016.2 1 +‐1.1 0.85 7.4% 0.0% 0.0% 3.2 +‐1.1 0.73 0.0% 0.1% 3.8% ‐2.2 +‐1.4 0.77 0.4% 3.5% 0.1%
2007.1‐2016.2 1.1 +‐1.2 0.83 7.2% 0.0% 0.0% 3.2 +‐1.2 0.72 0.0% 0.1% 4.1% ‐2 +‐1.4 0.72 0.9% 5.8% 0.2%
2007.2‐2016.2 1.4 +‐1.1 0.87 1.5% 0.0% 0.0% 3.2 +‐1.3 0.7 0.0% 0.2% 5.6% ‐1.8 +‐1.5 0.7 2.0% 3.3% 0.2%
2008.1‐2016.2 1.6 +‐1.1 0.86 1.0% 0.0% 0.0% 3.5 +‐1.3 0.75 0.0% 0.3% 8.5% ‐1.9 +‐1.6 0.66 2.2% 3.4% 0.3%
2008.2‐2016.2 1.6 +‐1.2 0.86 1.2% 0.0% 0.0% 3.7 +‐1.3 0.76 0.0% 0.3% 15.6% ‐2 +‐1.7 0.65 2.4% 5.7% 0.4%
2009.1‐2016.2 1.5 +‐1.3 0.86 3.2% 0.0% 0.0% 4 +‐1.4 0.78 0.0% 0.5% 31.1% ‐2.4 +‐1.7 0.66 1.2% 3.2% 0.2%
2009.2‐2016.2 2 +‐1.4 0.88 0.8% 0.0% 0.0% 4.4 +‐1.5 0.8 0.0% 0.3% 17.2% ‐2.3 +‐2 0.65 3.0% 4.4% 0.4%
2010.1‐2016.2 1.9 +‐1.7 0.88 2.8% 0.0% 0.0% 4.4 +‐1.9 0.78 0.0% 0.5% 22.5% ‐2.4 +‐2.5 0.64 6.7% 6.3% 0.8%
2010.2‐2016.2 1.9 +‐2.2 0.85 7.6% 0.0% 0.0% 5 +‐2.2 0.76 0.1% 0.4% 13.2% ‐2.9 +‐3.1 0.64 6.5% 10.8% 3.0%
2011.1‐2016.2 0.8 +‐2.9 0.86 55.3% 0.0% 0.5% 4.3 +‐3.2 0.73 1.4% 0.6% 40.4% ‐3.4 +‐4.6 0.63 13.5% 12.6% 11.4%
2011.2‐2016.2 2.1 +‐3.6 0.89 20.4% 0.0% 0.4% 3.1 +‐4 0.6 11.0% 1.1% 79.2% ‐0.9 +‐5.4 0.7 70.0% 5.5% 3.6%
2012.1‐2016.2 2.4 +‐6.2 0.88 36.9% 0.1% 2.0% 7.1 +‐4.8 0.81 1.0% 2.2% 8.2% ‐4.3 +‐7.9 0.76 23.5% 3.2% 28.2%
2012.2‐2016.2 1.6 +‐8.6 0.87 65.2% 0.3% 5.7% 9.8 +‐4.4 0.9 0.2% 0.5% 1.1% ‐7.5 +‐8.9 0.82 9.2% 3.9% 61.3%
2013.1‐2016.2 ‐4.5 +‐10.9 0.92 32.3% 0.3% 36.1% 8.6 +‐8 0.88 3.5% 1.6% 7.8% ‐12.1 +‐13.8 0.82 8.5% 3.9% 74.3%
2013.2‐2016.2 ‐7.8 +‐15.5 0.94 22.1% 0.7% 73.4% 10.6 +‐12.6 0.85 6.7% 3.1% 10.0% ‐16.6 +‐18.5 0.86 7.8% 5.2% 42.0%2014.1‐2016.2 ‐16.3 +‐79.1 0.89 45.9% 10.2% 75.3% 19.4 +‐70 0.84 30.5% 48.8% 30.6% ‐29.9 +‐86.5 0.69 27.9% 20.0% 41.3%
Loss Cost Severity Frequency
Date Trend Conf. Int. Adj. R2 T Pval Time
T Pval
Seasonality
T Pval
Unemploym
ent Trend Conf. Int. Adj. R2 T Pval Time
T Pval
Seasonality
T Pval
Unemploym
ent Trend Conf. Int. Adj. R2 T Pval Time
T Pval
Seasonality
T Pval
Unemploym
ent
2003.1‐2014.2 2.6 +‐1.2 0.7 0.0% 0.2% 0.0% 2.8 +‐0.7 0.8 0.0% 0.1% 0.2% ‐0.2 +‐1.1 0.41 76.0% 18.7% 0.1%
2003.2‐2014.2 2.8 +‐1.3 0.7 0.0% 0.2% 0.0% 2.9 +‐0.8 0.78 0.0% 0.1% 0.2% 0 +‐1.2 0.42 95.3% 16.7% 0.1%
2004.1‐2014.2 2.4 +‐1.4 0.7 0.2% 0.1% 0.0% 2.9 +‐0.9 0.77 0.0% 0.2% 0.3% ‐0.5 +‐1.2 0.48 39.5% 6.6% 0.2%
2004.2‐2014.2 1.7 +‐1.2 0.74 0.9% 0.0% 0.0% 2.6 +‐0.9 0.72 0.0% 0.3% 0.4% ‐1 +‐1.2 0.55 11.1% 11.5% 0.2%
2005.1‐2014.2 1 +‐1 0.83 5.5% 0.0% 0.0% 2.4 +‐1 0.71 0.0% 0.2% 0.5% ‐1.4 +‐1.2 0.61 3.4% 5.2% 0.2%
2005.2‐2014.2 0.8 +‐1.1 0.83 14.2% 0.0% 0.0% 2.3 +‐1 0.66 0.0% 0.3% 0.7% ‐1.5 +‐1.3 0.62 2.9% 8.3% 0.3%
2006.1‐2014.2 0.7 +‐1.2 0.83 25.7% 0.0% 0.0% 2.4 +‐1.2 0.66 0.0% 0.6% 0.9% ‐1.7 +‐1.5 0.62 2.6% 7.0% 0.4%
2006.2‐2014.2 0.8 +‐1.3 0.84 17.8% 0.0% 0.0% 2.6 +‐1.3 0.67 0.1% 0.5% 1.5% ‐1.7 +‐1.6 0.59 4.1% 8.8% 0.6%
2007.1‐2014.2 0.9 +‐1.4 0.82 18.5% 0.0% 0.0% 2.3 +‐1.3 0.69 0.2% 0.4% 1.1% ‐1.4 +‐1.8 0.46 11.2% 15.2% 1.0%
2007.2‐2014.2 1.4 +‐1.4 0.86 5.1% 0.0% 0.0% 2.2 +‐1.5 0.66 0.7% 0.8% 1.6% ‐0.8 +‐1.8 0.42 32.4% 6.0% 2.6%
2008.1‐2014.2 1.9 +‐1.6 0.85 2.5% 0.0% 0.0% 2.6 +‐1.8 0.68 0.7% 1.8% 5.5% ‐0.8 +‐2.1 0.29 43.8% 8.7% 5.4%
2008.2‐2014.2 2 +‐2.1 0.85 4.9% 0.0% 0.3% 2.8 +‐2.3 0.66 2.3% 2.7% 15.2% ‐0.7 +‐2.8 0.24 59.0% 11.2% 14.0%
2009.1‐2014.2 1.3 +‐5.1 0.84 56.5% 0.1% 8.7% 4.3 +‐5.7 0.66 11.4% 6.8% 97.7% ‐2.8 +‐6.5 0.18 34.9% 9.1% 18.7%
2009.2‐2014.2 2.2 +‐4.9 0.87 32.7% 0.1% 7.3% 5 +‐5.9 0.68 7.8% 4.8% 99.8% ‐2.7 +‐7.3 0.13 41.6% 11.8% 22.0%
2010.1‐2014.2 2.2 +‐5.8 0.86 37.3% 0.3% 9.9% 5 +‐6.9 0.64 12.1% 7.9% 100.0% ‐2.6 +‐8.6 0.08 49.4% 17.8% 26.0%
2010.2‐2014.2 2.3 +‐6.7 0.75 41.4% 1.1% 19.7% 4.7 +‐7.7 0.58 16.6% 9.1% 76.4% ‐2.3 +‐9.7 ‐0.29 56.8% 34.3% 49.2%
2011.1‐2014.2 3.4 +‐7.2 0.77 25.9% 1.3% 92.2% 5.8 +‐8.8 0.58 13.4% 9.8% 55.8% ‐2.3 +‐12.4 ‐0.42 64.0% 40.2% 73.6%
2011.2‐2014.2 3.6 +‐8.6 0.76 26.6% 2.7% 72.9% 5.1 +‐4.8 0.81 4.0% 11.2% 5.2% ‐1.5 +‐9 0.46 64.4% 8.1% 14.8%2012.1‐2014.2 10.6 +‐23.6 0.86 17.6% 7.4% 26.6% 5.8 +‐18 0.72 29.1% 26.8% 93.1% 4.6 +‐28.5 0.53 54.5% 21.7% 33.4%
135
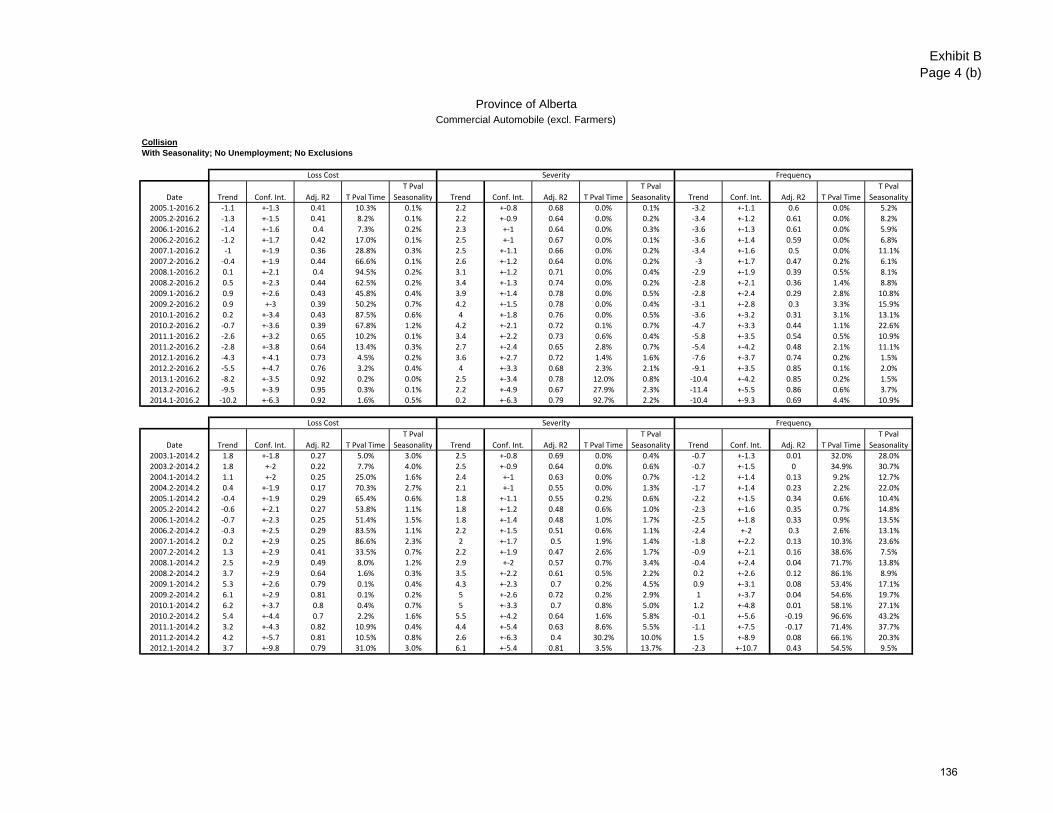
Exhibit BPage 4 (b)
Province of AlbertaCommercial Automobile (excl. Farmers)
CollisionWith Seasonality; No Unemployment; No Exclusions
Loss Cost Severity Frequency
Date Trend Conf. Int. Adj. R2 T Pval Time
T Pval
Seasonality Trend Conf. Int. Adj. R2 T Pval Time
T Pval
Seasonality Trend Conf. Int. Adj. R2 T Pval Time
T Pval
Seasonality
2005.1‐2016.2 ‐1.1 +‐1.3 0.41 10.3% 0.1% 2.2 +‐0.8 0.68 0.0% 0.1% ‐3.2 +‐1.1 0.6 0.0% 5.2%
2005.2‐2016.2 ‐1.3 +‐1.5 0.41 8.2% 0.1% 2.2 +‐0.9 0.64 0.0% 0.2% ‐3.4 +‐1.2 0.61 0.0% 8.2%
2006.1‐2016.2 ‐1.4 +‐1.6 0.4 7.3% 0.2% 2.3 +‐1 0.64 0.0% 0.3% ‐3.6 +‐1.3 0.61 0.0% 5.9%
2006.2‐2016.2 ‐1.2 +‐1.7 0.42 17.0% 0.1% 2.5 +‐1 0.67 0.0% 0.1% ‐3.6 +‐1.4 0.59 0.0% 6.8%
2007.1‐2016.2 ‐1 +‐1.9 0.36 28.8% 0.3% 2.5 +‐1.1 0.66 0.0% 0.2% ‐3.4 +‐1.6 0.5 0.0% 11.1%
2007.2‐2016.2 ‐0.4 +‐1.9 0.44 66.6% 0.1% 2.6 +‐1.2 0.64 0.0% 0.2% ‐3 +‐1.7 0.47 0.2% 6.1%
2008.1‐2016.2 0.1 +‐2.1 0.4 94.5% 0.2% 3.1 +‐1.2 0.71 0.0% 0.4% ‐2.9 +‐1.9 0.39 0.5% 8.1%
2008.2‐2016.2 0.5 +‐2.3 0.44 62.5% 0.2% 3.4 +‐1.3 0.74 0.0% 0.2% ‐2.8 +‐2.1 0.36 1.4% 8.8%
2009.1‐2016.2 0.9 +‐2.6 0.43 45.8% 0.4% 3.9 +‐1.4 0.78 0.0% 0.5% ‐2.8 +‐2.4 0.29 2.8% 10.8%
2009.2‐2016.2 0.9 +‐3 0.39 50.2% 0.7% 4.2 +‐1.5 0.78 0.0% 0.4% ‐3.1 +‐2.8 0.3 3.3% 15.9%
2010.1‐2016.2 0.2 +‐3.4 0.43 87.5% 0.6% 4 +‐1.8 0.76 0.0% 0.5% ‐3.6 +‐3.2 0.31 3.1% 13.1%
2010.2‐2016.2 ‐0.7 +‐3.6 0.39 67.8% 1.2% 4.2 +‐2.1 0.72 0.1% 0.7% ‐4.7 +‐3.3 0.44 1.1% 22.6%
2011.1‐2016.2 ‐2.6 +‐3.2 0.65 10.2% 0.1% 3.4 +‐2.2 0.73 0.6% 0.4% ‐5.8 +‐3.5 0.54 0.5% 10.9%
2011.2‐2016.2 ‐2.8 +‐3.8 0.64 13.4% 0.3% 2.7 +‐2.4 0.65 2.8% 0.7% ‐5.4 +‐4.2 0.48 2.1% 11.1%
2012.1‐2016.2 ‐4.3 +‐4.1 0.73 4.5% 0.2% 3.6 +‐2.7 0.72 1.4% 1.6% ‐7.6 +‐3.7 0.74 0.2% 1.5%
2012.2‐2016.2 ‐5.5 +‐4.7 0.76 3.2% 0.4% 4 +‐3.3 0.68 2.3% 2.1% ‐9.1 +‐3.5 0.85 0.1% 2.0%
2013.1‐2016.2 ‐8.2 +‐3.5 0.92 0.2% 0.0% 2.5 +‐3.4 0.78 12.0% 0.8% ‐10.4 +‐4.2 0.85 0.2% 1.5%
2013.2‐2016.2 ‐9.5 +‐3.9 0.95 0.3% 0.1% 2.2 +‐4.9 0.67 27.9% 2.3% ‐11.4 +‐5.5 0.86 0.6% 3.7%2014.1‐2016.2 ‐10.2 +‐6.3 0.92 1.6% 0.5% 0.2 +‐6.3 0.79 92.7% 2.2% ‐10.4 +‐9.3 0.69 4.4% 10.9%
Loss Cost Severity Frequency
Date Trend Conf. Int. Adj. R2 T Pval Time
T Pval
Seasonality Trend Conf. Int. Adj. R2 T Pval Time
T Pval
Seasonality Trend Conf. Int. Adj. R2 T Pval Time
T Pval
Seasonality
2003.1‐2014.2 1.8 +‐1.8 0.27 5.0% 3.0% 2.5 +‐0.8 0.69 0.0% 0.4% ‐0.7 +‐1.3 0.01 32.0% 28.0%
2003.2‐2014.2 1.8 +‐2 0.22 7.7% 4.0% 2.5 +‐0.9 0.64 0.0% 0.6% ‐0.7 +‐1.5 0 34.9% 30.7%
2004.1‐2014.2 1.1 +‐2 0.25 25.0% 1.6% 2.4 +‐1 0.63 0.0% 0.7% ‐1.2 +‐1.4 0.13 9.2% 12.7%
2004.2‐2014.2 0.4 +‐1.9 0.17 70.3% 2.7% 2.1 +‐1 0.55 0.0% 1.3% ‐1.7 +‐1.4 0.23 2.2% 22.0%
2005.1‐2014.2 ‐0.4 +‐1.9 0.29 65.4% 0.6% 1.8 +‐1.1 0.55 0.2% 0.6% ‐2.2 +‐1.5 0.34 0.6% 10.4%
2005.2‐2014.2 ‐0.6 +‐2.1 0.27 53.8% 1.1% 1.8 +‐1.2 0.48 0.6% 1.0% ‐2.3 +‐1.6 0.35 0.7% 14.8%
2006.1‐2014.2 ‐0.7 +‐2.3 0.25 51.4% 1.5% 1.8 +‐1.4 0.48 1.0% 1.7% ‐2.5 +‐1.8 0.33 0.9% 13.5%
2006.2‐2014.2 ‐0.3 +‐2.5 0.29 83.5% 1.1% 2.2 +‐1.5 0.51 0.6% 1.1% ‐2.4 +‐2 0.3 2.6% 13.1%
2007.1‐2014.2 0.2 +‐2.9 0.25 86.6% 2.3% 2 +‐1.7 0.5 1.9% 1.4% ‐1.8 +‐2.2 0.13 10.3% 23.6%
2007.2‐2014.2 1.3 +‐2.9 0.41 33.5% 0.7% 2.2 +‐1.9 0.47 2.6% 1.7% ‐0.9 +‐2.1 0.16 38.6% 7.5%
2008.1‐2014.2 2.5 +‐2.9 0.49 8.0% 1.2% 2.9 +‐2 0.57 0.7% 3.4% ‐0.4 +‐2.4 0.04 71.7% 13.8%
2008.2‐2014.2 3.7 +‐2.9 0.64 1.6% 0.3% 3.5 +‐2.2 0.61 0.5% 2.2% 0.2 +‐2.6 0.12 86.1% 8.9%
2009.1‐2014.2 5.3 +‐2.6 0.79 0.1% 0.4% 4.3 +‐2.3 0.7 0.2% 4.5% 0.9 +‐3.1 0.08 53.4% 17.1%
2009.2‐2014.2 6.1 +‐2.9 0.81 0.1% 0.2% 5 +‐2.6 0.72 0.2% 2.9% 1 +‐3.7 0.04 54.6% 19.7%
2010.1‐2014.2 6.2 +‐3.7 0.8 0.4% 0.7% 5 +‐3.3 0.7 0.8% 5.0% 1.2 +‐4.8 0.01 58.1% 27.1%
2010.2‐2014.2 5.4 +‐4.4 0.7 2.2% 1.6% 5.5 +‐4.2 0.64 1.6% 5.8% ‐0.1 +‐5.6 ‐0.19 96.6% 43.2%
2011.1‐2014.2 3.2 +‐4.3 0.82 10.9% 0.4% 4.4 +‐5.4 0.63 8.6% 5.5% ‐1.1 +‐7.5 ‐0.17 71.4% 37.7%
2011.2‐2014.2 4.2 +‐5.7 0.81 10.5% 0.8% 2.6 +‐6.3 0.4 30.2% 10.0% 1.5 +‐8.9 0.08 66.1% 20.3%2012.1‐2014.2 3.7 +‐9.8 0.79 31.0% 3.0% 6.1 +‐5.4 0.81 3.5% 13.7% ‐2.3 +‐10.7 0.43 54.5% 9.5%
136
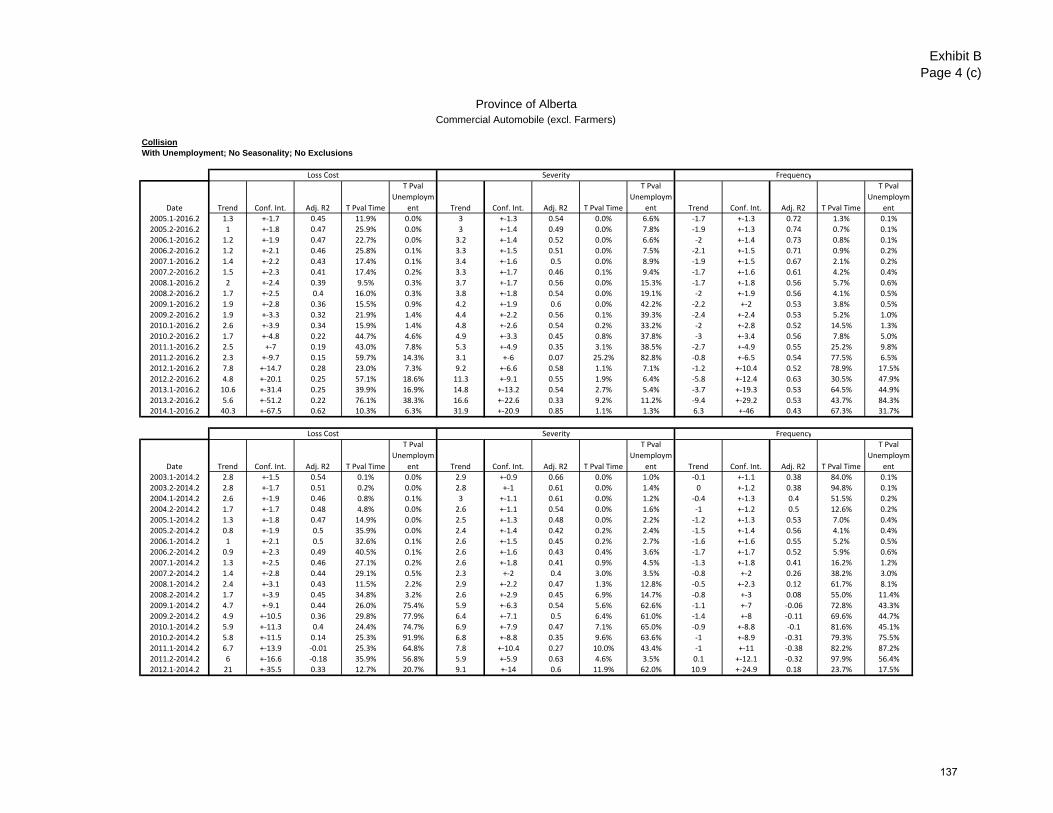
Exhibit BPage 4 (c)
Province of AlbertaCommercial Automobile (excl. Farmers)
CollisionWith Unemployment; No Seasonality; No Exclusions
Loss Cost Severity Frequency
Date Trend Conf. Int. Adj. R2 T Pval Time
T Pval
Unemploym
ent Trend Conf. Int. Adj. R2 T Pval Time
T Pval
Unemploym
ent Trend Conf. Int. Adj. R2 T Pval Time
T Pval
Unemploym
ent
2005.1‐2016.2 1.3 +‐1.7 0.45 11.9% 0.0% 3 +‐1.3 0.54 0.0% 6.6% ‐1.7 +‐1.3 0.72 1.3% 0.1%
2005.2‐2016.2 1 +‐1.8 0.47 25.9% 0.0% 3 +‐1.4 0.49 0.0% 7.8% ‐1.9 +‐1.3 0.74 0.7% 0.1%
2006.1‐2016.2 1.2 +‐1.9 0.47 22.7% 0.0% 3.2 +‐1.4 0.52 0.0% 6.6% ‐2 +‐1.4 0.73 0.8% 0.1%
2006.2‐2016.2 1.2 +‐2.1 0.46 25.8% 0.1% 3.3 +‐1.5 0.51 0.0% 7.5% ‐2.1 +‐1.5 0.71 0.9% 0.2%
2007.1‐2016.2 1.4 +‐2.2 0.43 17.4% 0.1% 3.4 +‐1.6 0.5 0.0% 8.9% ‐1.9 +‐1.5 0.67 2.1% 0.2%
2007.2‐2016.2 1.5 +‐2.3 0.41 17.4% 0.2% 3.3 +‐1.7 0.46 0.1% 9.4% ‐1.7 +‐1.6 0.61 4.2% 0.4%
2008.1‐2016.2 2 +‐2.4 0.39 9.5% 0.3% 3.7 +‐1.7 0.56 0.0% 15.3% ‐1.7 +‐1.8 0.56 5.7% 0.6%
2008.2‐2016.2 1.7 +‐2.5 0.4 16.0% 0.3% 3.8 +‐1.8 0.54 0.0% 19.1% ‐2 +‐1.9 0.56 4.1% 0.5%
2009.1‐2016.2 1.9 +‐2.8 0.36 15.5% 0.9% 4.2 +‐1.9 0.6 0.0% 42.2% ‐2.2 +‐2 0.53 3.8% 0.5%
2009.2‐2016.2 1.9 +‐3.3 0.32 21.9% 1.4% 4.4 +‐2.2 0.56 0.1% 39.3% ‐2.4 +‐2.4 0.53 5.2% 1.0%
2010.1‐2016.2 2.6 +‐3.9 0.34 15.9% 1.4% 4.8 +‐2.6 0.54 0.2% 33.2% ‐2 +‐2.8 0.52 14.5% 1.3%
2010.2‐2016.2 1.7 +‐4.8 0.22 44.7% 4.6% 4.9 +‐3.3 0.45 0.8% 37.8% ‐3 +‐3.4 0.56 7.8% 5.0%
2011.1‐2016.2 2.5 +‐7 0.19 43.0% 7.8% 5.3 +‐4.9 0.35 3.1% 38.5% ‐2.7 +‐4.9 0.55 25.2% 9.8%
2011.2‐2016.2 2.3 +‐9.7 0.15 59.7% 14.3% 3.1 +‐6 0.07 25.2% 82.8% ‐0.8 +‐6.5 0.54 77.5% 6.5%
2012.1‐2016.2 7.8 +‐14.7 0.28 23.0% 7.3% 9.2 +‐6.6 0.58 1.1% 7.1% ‐1.2 +‐10.4 0.52 78.9% 17.5%
2012.2‐2016.2 4.8 +‐20.1 0.25 57.1% 18.6% 11.3 +‐9.1 0.55 1.9% 6.4% ‐5.8 +‐12.4 0.63 30.5% 47.9%
2013.1‐2016.2 10.6 +‐31.4 0.25 39.9% 16.9% 14.8 +‐13.2 0.54 2.7% 5.4% ‐3.7 +‐19.3 0.53 64.5% 44.9%
2013.2‐2016.2 5.6 +‐51.2 0.22 76.1% 38.3% 16.6 +‐22.6 0.33 9.2% 11.2% ‐9.4 +‐29.2 0.53 43.7% 84.3%2014.1‐2016.2 40.3 +‐67.5 0.62 10.3% 6.3% 31.9 +‐20.9 0.85 1.1% 1.3% 6.3 +‐46 0.43 67.3% 31.7%
Loss Cost Severity Frequency
Date Trend Conf. Int. Adj. R2 T Pval Time
T Pval
Unemploym
ent Trend Conf. Int. Adj. R2 T Pval Time
T Pval
Unemploym
ent Trend Conf. Int. Adj. R2 T Pval Time
T Pval
Unemploym
ent
2003.1‐2014.2 2.8 +‐1.5 0.54 0.1% 0.0% 2.9 +‐0.9 0.66 0.0% 1.0% ‐0.1 +‐1.1 0.38 84.0% 0.1%
2003.2‐2014.2 2.8 +‐1.7 0.51 0.2% 0.0% 2.8 +‐1 0.61 0.0% 1.4% 0 +‐1.2 0.38 94.8% 0.1%
2004.1‐2014.2 2.6 +‐1.9 0.46 0.8% 0.1% 3 +‐1.1 0.61 0.0% 1.2% ‐0.4 +‐1.3 0.4 51.5% 0.2%
2004.2‐2014.2 1.7 +‐1.7 0.48 4.8% 0.0% 2.6 +‐1.1 0.54 0.0% 1.6% ‐1 +‐1.2 0.5 12.6% 0.2%
2005.1‐2014.2 1.3 +‐1.8 0.47 14.9% 0.0% 2.5 +‐1.3 0.48 0.0% 2.2% ‐1.2 +‐1.3 0.53 7.0% 0.4%
2005.2‐2014.2 0.8 +‐1.9 0.5 35.9% 0.0% 2.4 +‐1.4 0.42 0.2% 2.4% ‐1.5 +‐1.4 0.56 4.1% 0.4%
2006.1‐2014.2 1 +‐2.1 0.5 32.6% 0.1% 2.6 +‐1.5 0.45 0.2% 2.7% ‐1.6 +‐1.6 0.55 5.2% 0.5%
2006.2‐2014.2 0.9 +‐2.3 0.49 40.5% 0.1% 2.6 +‐1.6 0.43 0.4% 3.6% ‐1.7 +‐1.7 0.52 5.9% 0.6%
2007.1‐2014.2 1.3 +‐2.5 0.46 27.1% 0.2% 2.6 +‐1.8 0.41 0.9% 4.5% ‐1.3 +‐1.8 0.41 16.2% 1.2%
2007.2‐2014.2 1.4 +‐2.8 0.44 29.1% 0.5% 2.3 +‐2 0.4 3.0% 3.5% ‐0.8 +‐2 0.26 38.2% 3.0%
2008.1‐2014.2 2.4 +‐3.1 0.43 11.5% 2.2% 2.9 +‐2.2 0.47 1.3% 12.8% ‐0.5 +‐2.3 0.12 61.7% 8.1%
2008.2‐2014.2 1.7 +‐3.9 0.45 34.8% 3.2% 2.6 +‐2.9 0.45 6.9% 14.7% ‐0.8 +‐3 0.08 55.0% 11.4%
2009.1‐2014.2 4.7 +‐9.1 0.44 26.0% 75.4% 5.9 +‐6.3 0.54 5.6% 62.6% ‐1.1 +‐7 ‐0.06 72.8% 43.3%
2009.2‐2014.2 4.9 +‐10.5 0.36 29.8% 77.9% 6.4 +‐7.1 0.5 6.4% 61.0% ‐1.4 +‐8 ‐0.11 69.6% 44.7%
2010.1‐2014.2 5.9 +‐11.3 0.4 24.4% 74.7% 6.9 +‐7.9 0.47 7.1% 65.0% ‐0.9 +‐8.8 ‐0.1 81.6% 45.1%
2010.2‐2014.2 5.8 +‐11.5 0.14 25.3% 91.9% 6.8 +‐8.8 0.35 9.6% 63.6% ‐1 +‐8.9 ‐0.31 79.3% 75.5%
2011.1‐2014.2 6.7 +‐13.9 ‐0.01 25.3% 64.8% 7.8 +‐10.4 0.27 10.0% 43.4% ‐1 +‐11 ‐0.38 82.2% 87.2%
2011.2‐2014.2 6 +‐16.6 ‐0.18 35.9% 56.8% 5.9 +‐5.9 0.63 4.6% 3.5% 0.1 +‐12.1 ‐0.32 97.9% 56.4%2012.1‐2014.2 21 +‐35.5 0.33 12.7% 20.7% 9.1 +‐14 0.6 11.9% 62.0% 10.9 +‐24.9 0.18 23.7% 17.5%
137

Exhibit BPage 4 (d)
Province of AlbertaCommercial Automobile (excl. Farmers)
CollisionNo Seasonality; No Unemployment; No Exclusions
Loss Cost Severity Frequency
Date Trend Conf. Int. Adj. R2 T Pval Time Trend Conf. Int. Adj. R2 T Pval Time Trend Conf. Int. Adj. R2 T Pval Time
2005.1‐2016.2 ‐0.9 +‐1.7 0.01 28.4% 2.3 +‐1 0.49 0.0% ‐3.2 +‐1.2 0.54 0.0%
2005.2‐2016.2 ‐1.3 +‐1.8 0.05 16.3% 2.2 +‐1.1 0.43 0.0% ‐3.4 +‐1.3 0.57 0.0%
2006.1‐2016.2 ‐1.2 +‐2 0.03 22.2% 2.4 +‐1.2 0.45 0.0% ‐3.5 +‐1.4 0.55 0.0%
2006.2‐2016.2 ‐1.2 +‐2.2 0.01 28.8% 2.5 +‐1.3 0.45 0.0% ‐3.6 +‐1.5 0.53 0.0%
2007.1‐2016.2 ‐0.7 +‐2.4 ‐0.03 54.0% 2.6 +‐1.4 0.43 0.1% ‐3.3 +‐1.7 0.45 0.1%
2007.2‐2016.2 ‐0.4 +‐2.7 ‐0.05 75.2% 2.6 +‐1.6 0.39 0.3% ‐3 +‐1.8 0.37 0.3%
2008.1‐2016.2 0.4 +‐2.8 ‐0.06 75.4% 3.3 +‐1.6 0.53 0.0% ‐2.8 +‐2 0.3 1.1%
2008.2‐2016.2 0.5 +‐3.2 ‐0.06 72.3% 3.4 +‐1.8 0.51 0.1% ‐2.8 +‐2.3 0.26 2.0%
2009.1‐2016.2 1.4 +‐3.4 ‐0.02 40.5% 4.1 +‐1.8 0.61 0.0% ‐2.6 +‐2.6 0.19 5.0%
2009.2‐2016.2 0.9 +‐3.9 ‐0.05 60.7% 4.2 +‐2.1 0.57 0.1% ‐3.1 +‐2.9 0.23 3.8%
2010.1‐2016.2 0.9 +‐4.5 ‐0.07 67.6% 4.4 +‐2.4 0.54 0.2% ‐3.3 +‐3.3 0.22 5.4%
2010.2‐2016.2 ‐0.7 +‐4.7 ‐0.08 75.3% 4.2 +‐2.8 0.45 0.7% ‐4.7 +‐3.3 0.4 1.2%
2011.1‐2016.2 ‐1.6 +‐5.4 ‐0.05 51.7% 4 +‐3.4 0.36 2.3% ‐5.4 +‐3.8 0.44 1.1%
2011.2‐2016.2 ‐2.8 +‐6.3 0 34.4% 2.7 +‐3.5 0.17 11.4% ‐5.4 +‐4.6 0.36 3.1%
2012.1‐2016.2 ‐2.8 +‐7.8 ‐0.04 43.2% 4.2 +‐3.7 0.4 3.0% ‐6.8 +‐5.2 0.45 2.0%
2012.2‐2016.2 ‐5.5 +‐8.7 0.12 19.1% 4 +‐4.8 0.28 8.2% ‐9.1 +‐5.1 0.65 0.5%
2013.1‐2016.2 ‐5.8 +‐11.6 0.05 28.1% 3.7 +‐6.4 0.14 19.6% ‐9.1 +‐6.9 0.55 2.1%
2013.2‐2016.2 ‐9.5 +‐14 0.23 15.7% 2.2 +‐8.3 ‐0.1 52.6% ‐11.4 +‐8.4 0.62 2.1%
2014.1‐2016.2 ‐5.9 +‐20.7 ‐0.09 47.9% 2.8 +‐12.7 ‐0.14 57.3% ‐8.5 +‐11.3 0.37 11.8%
Loss Cost Severity Frequency
Date Trend Conf. Int. Adj. R2 T Pval Time Trend Conf. Int. Adj. R2 T Pval Time Trend Conf. Int. Adj. R2 T Pval Time
2003.1‐2014.2 2 +‐2 0.12 5.2% 2.6 +‐1 0.55 0.0% ‐0.6 +‐1.3 ‐0.01 35.9%
2003.2‐2014.2 1.8 +‐2.2 0.08 10.1% 2.5 +‐1.1 0.5 0.0% ‐0.7 +‐1.5 0 34.9%
2004.1‐2014.2 1.4 +‐2.3 0.02 23.4% 2.5 +‐1.2 0.47 0.0% ‐1.1 +‐1.5 0.07 12.7%
2004.2‐2014.2 0.4 +‐2.2 ‐0.05 73.3% 2.1 +‐1.2 0.39 0.1% ‐1.7 +‐1.4 0.2 2.3%
2005.1‐2014.2 ‐0.2 +‐2.3 ‐0.05 88.0% 2 +‐1.3 0.32 0.5% ‐2.1 +‐1.5 0.27 1.1%
2005.2‐2014.2 ‐0.6 +‐2.5 ‐0.04 60.5% 1.8 +‐1.4 0.25 1.8% ‐2.3 +‐1.7 0.3 0.9%
2006.1‐2014.2 ‐0.4 +‐2.7 ‐0.05 73.8% 2 +‐1.6 0.27 1.5% ‐2.4 +‐1.9 0.27 1.5%
2006.2‐2014.2 ‐0.3 +‐3.1 ‐0.06 86.5% 2.2 +‐1.8 0.27 1.9% ‐2.4 +‐2.1 0.22 3.2%
2007.1‐2014.2 0.6 +‐3.4 ‐0.06 70.7% 2.3 +‐2 0.25 2.8% ‐1.6 +‐2.2 0.09 13.3%
2007.2‐2014.2 1.3 +‐3.8 ‐0.03 46.1% 2.2 +‐2.3 0.19 5.9% ‐0.9 +‐2.3 ‐0.02 42.9%
2008.1‐2014.2 3 +‐3.7 0.15 9.7% 3.2 +‐2.3 0.39 1.0% ‐0.2 +‐2.5 ‐0.08 87.2%
2008.2‐2014.2 3.7 +‐4.3 0.19 7.9% 3.5 +‐2.7 0.38 1.5% 0.2 +‐2.9 ‐0.09 87.4%
2009.1‐2014.2 5.9 +‐4 0.49 0.7% 4.7 +‐2.7 0.57 0.3% 1.2 +‐3.2 ‐0.03 43.0%
2009.2‐2014.2 6.1 +‐4.9 0.43 1.7% 5 +‐3.3 0.54 0.6% 1 +‐3.9 ‐0.07 56.5%
2010.1‐2014.2 7.2 +‐5.8 0.46 1.8% 5.5 +‐4 0.52 1.1% 1.6 +‐4.8 ‐0.05 45.9%
2010.2‐2014.2 5.4 +‐6.7 0.26 9.1% 5.5 +‐5.2 0.42 3.6% ‐0.1 +‐5.3 ‐0.14 96.5%
2011.1‐2014.2 5 +‐8.8 0.12 20.9% 5.5 +‐6.9 0.3 9.1% ‐0.5 +‐7 ‐0.16 86.2%
2011.2‐2014.2 4.2 +‐12.3 ‐0.03 41.3% 2.6 +‐7.6 ‐0.03 40.6% 1.5 +‐9.2 ‐0.16 69.2%
2012.1‐2014.2 7.2 +‐18 0.06 31.1% 7.1 +‐6.1 0.67 2.8% 0.1 +‐13.5 ‐0.25 98.7%
138
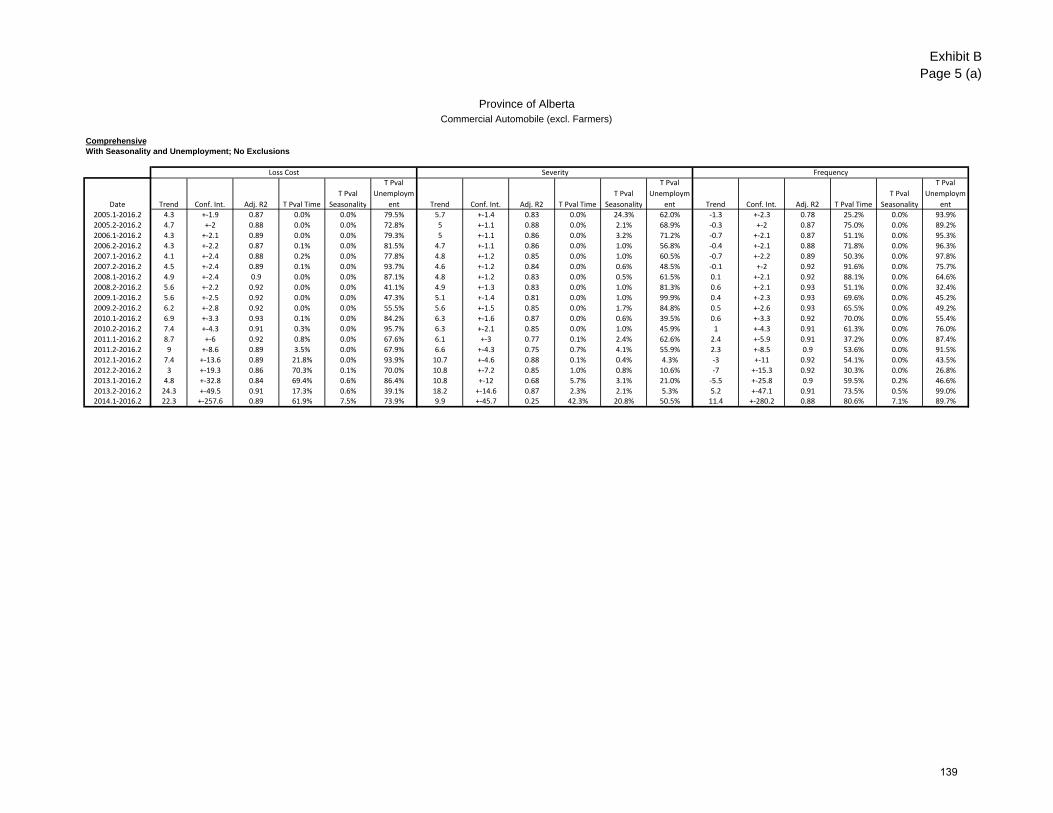
Exhibit BPage 5 (a)
Province of AlbertaCommercial Automobile (excl. Farmers)
ComprehensiveWith Seasonality and Unemployment; No Exclusions
Loss Cost Severity Frequency
Date Trend Conf. Int. Adj. R2 T Pval Time
T Pval
Seasonality
T Pval
Unemploym
ent Trend Conf. Int. Adj. R2 T Pval Time
T Pval
Seasonality
T Pval
Unemploym
ent Trend Conf. Int. Adj. R2 T Pval Time
T Pval
Seasonality
T Pval
Unemploym
ent
2005.1‐2016.2 4.3 +‐1.9 0.87 0.0% 0.0% 79.5% 5.7 +‐1.4 0.83 0.0% 24.3% 62.0% ‐1.3 +‐2.3 0.78 25.2% 0.0% 93.9%
2005.2‐2016.2 4.7 +‐2 0.88 0.0% 0.0% 72.8% 5 +‐1.1 0.88 0.0% 2.1% 68.9% ‐0.3 +‐2 0.87 75.0% 0.0% 89.2%
2006.1‐2016.2 4.3 +‐2.1 0.89 0.0% 0.0% 79.3% 5 +‐1.1 0.86 0.0% 3.2% 71.2% ‐0.7 +‐2.1 0.87 51.1% 0.0% 95.3%
2006.2‐2016.2 4.3 +‐2.2 0.87 0.1% 0.0% 81.5% 4.7 +‐1.1 0.86 0.0% 1.0% 56.8% ‐0.4 +‐2.1 0.88 71.8% 0.0% 96.3%
2007.1‐2016.2 4.1 +‐2.4 0.88 0.2% 0.0% 77.8% 4.8 +‐1.2 0.85 0.0% 1.0% 60.5% ‐0.7 +‐2.2 0.89 50.3% 0.0% 97.8%
2007.2‐2016.2 4.5 +‐2.4 0.89 0.1% 0.0% 93.7% 4.6 +‐1.2 0.84 0.0% 0.6% 48.5% ‐0.1 +‐2 0.92 91.6% 0.0% 75.7%
2008.1‐2016.2 4.9 +‐2.4 0.9 0.0% 0.0% 87.1% 4.8 +‐1.2 0.83 0.0% 0.5% 61.5% 0.1 +‐2.1 0.92 88.1% 0.0% 64.6%
2008.2‐2016.2 5.6 +‐2.2 0.92 0.0% 0.0% 41.1% 4.9 +‐1.3 0.83 0.0% 1.0% 81.3% 0.6 +‐2.1 0.93 51.1% 0.0% 32.4%
2009.1‐2016.2 5.6 +‐2.5 0.92 0.0% 0.0% 47.3% 5.1 +‐1.4 0.81 0.0% 1.0% 99.9% 0.4 +‐2.3 0.93 69.6% 0.0% 45.2%
2009.2‐2016.2 6.2 +‐2.8 0.92 0.0% 0.0% 55.5% 5.6 +‐1.5 0.85 0.0% 1.7% 84.8% 0.5 +‐2.6 0.93 65.5% 0.0% 49.2%
2010.1‐2016.2 6.9 +‐3.3 0.93 0.1% 0.0% 84.2% 6.3 +‐1.6 0.87 0.0% 0.6% 39.5% 0.6 +‐3.3 0.92 70.0% 0.0% 55.4%
2010.2‐2016.2 7.4 +‐4.3 0.91 0.3% 0.0% 95.7% 6.3 +‐2.1 0.85 0.0% 1.0% 45.9% 1 +‐4.3 0.91 61.3% 0.0% 76.0%
2011.1‐2016.2 8.7 +‐6 0.92 0.8% 0.0% 67.6% 6.1 +‐3 0.77 0.1% 2.4% 62.6% 2.4 +‐5.9 0.91 37.2% 0.0% 87.4%
2011.2‐2016.2 9 +‐8.6 0.89 3.5% 0.0% 67.9% 6.6 +‐4.3 0.75 0.7% 4.1% 55.9% 2.3 +‐8.5 0.9 53.6% 0.0% 91.5%
2012.1‐2016.2 7.4 +‐13.6 0.89 21.8% 0.0% 93.9% 10.7 +‐4.6 0.88 0.1% 0.4% 4.3% ‐3 +‐11 0.92 54.1% 0.0% 43.5%
2012.2‐2016.2 3 +‐19.3 0.86 70.3% 0.1% 70.0% 10.8 +‐7.2 0.85 1.0% 0.8% 10.6% ‐7 +‐15.3 0.92 30.3% 0.0% 26.8%
2013.1‐2016.2 4.8 +‐32.8 0.84 69.4% 0.6% 86.4% 10.8 +‐12 0.68 5.7% 3.1% 21.0% ‐5.5 +‐25.8 0.9 59.5% 0.2% 46.6%
2013.2‐2016.2 24.3 +‐49.5 0.91 17.3% 0.6% 39.1% 18.2 +‐14.6 0.87 2.3% 2.1% 5.3% 5.2 +‐47.1 0.91 73.5% 0.5% 99.0%2014.1‐2016.2 22.3 +‐257.6 0.89 61.9% 7.5% 73.9% 9.9 +‐45.7 0.25 42.3% 20.8% 50.5% 11.4 +‐280.2 0.88 80.6% 7.1% 89.7%
139
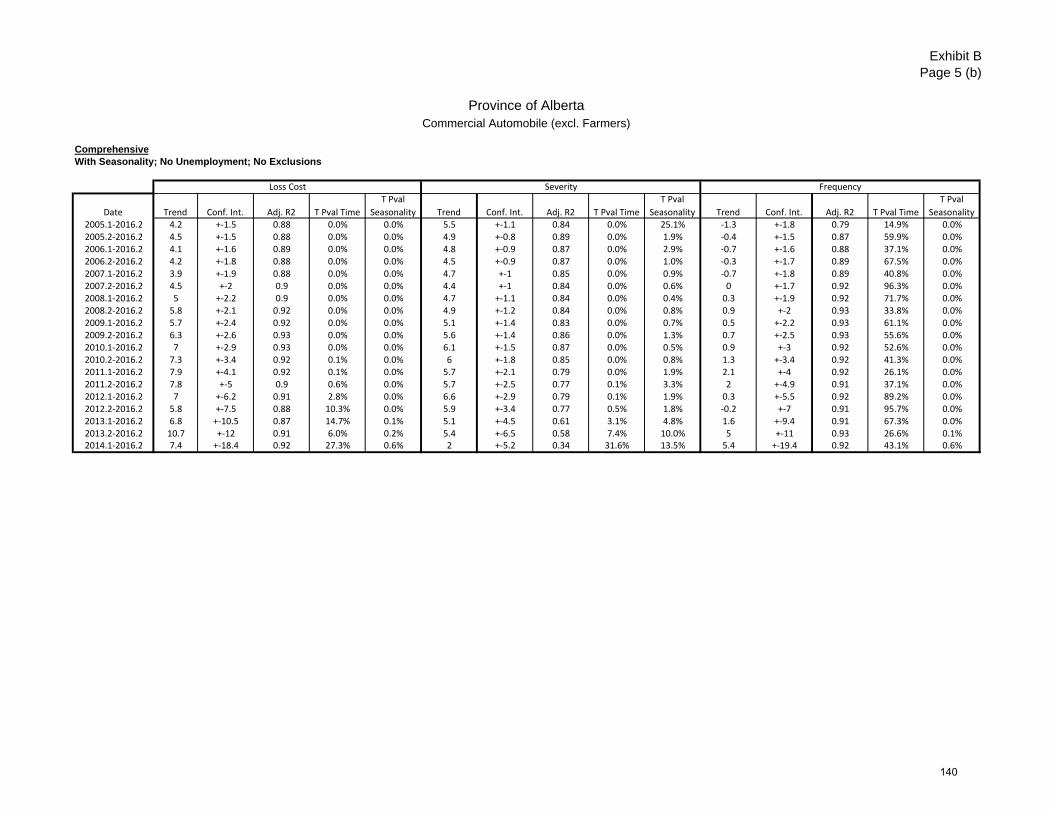
Exhibit BPage 5 (b)
Province of AlbertaCommercial Automobile (excl. Farmers)
ComprehensiveWith Seasonality; No Unemployment; No Exclusions
Loss Cost Severity Frequency
Date Trend Conf. Int. Adj. R2 T Pval Time
T Pval
Seasonality Trend Conf. Int. Adj. R2 T Pval Time
T Pval
Seasonality Trend Conf. Int. Adj. R2 T Pval Time
T Pval
Seasonality2005.1‐2016.2 4.2 +‐1.5 0.88 0.0% 0.0% 5.5 +‐1.1 0.84 0.0% 25.1% ‐1.3 +‐1.8 0.79 14.9% 0.0%2005.2‐2016.2 4.5 +‐1.5 0.88 0.0% 0.0% 4.9 +‐0.8 0.89 0.0% 1.9% ‐0.4 +‐1.5 0.87 59.9% 0.0%2006.1‐2016.2 4.1 +‐1.6 0.89 0.0% 0.0% 4.8 +‐0.9 0.87 0.0% 2.9% ‐0.7 +‐1.6 0.88 37.1% 0.0%2006.2‐2016.2 4.2 +‐1.8 0.88 0.0% 0.0% 4.5 +‐0.9 0.87 0.0% 1.0% ‐0.3 +‐1.7 0.89 67.5% 0.0%2007.1‐2016.2 3.9 +‐1.9 0.88 0.0% 0.0% 4.7 +‐1 0.85 0.0% 0.9% ‐0.7 +‐1.8 0.89 40.8% 0.0%2007.2‐2016.2 4.5 +‐2 0.9 0.0% 0.0% 4.4 +‐1 0.84 0.0% 0.6% 0 +‐1.7 0.92 96.3% 0.0%2008.1‐2016.2 5 +‐2.2 0.9 0.0% 0.0% 4.7 +‐1.1 0.84 0.0% 0.4% 0.3 +‐1.9 0.92 71.7% 0.0%2008.2‐2016.2 5.8 +‐2.1 0.92 0.0% 0.0% 4.9 +‐1.2 0.84 0.0% 0.8% 0.9 +‐2 0.93 33.8% 0.0%2009.1‐2016.2 5.7 +‐2.4 0.92 0.0% 0.0% 5.1 +‐1.4 0.83 0.0% 0.7% 0.5 +‐2.2 0.93 61.1% 0.0%2009.2‐2016.2 6.3 +‐2.6 0.93 0.0% 0.0% 5.6 +‐1.4 0.86 0.0% 1.3% 0.7 +‐2.5 0.93 55.6% 0.0%2010.1‐2016.2 7 +‐2.9 0.93 0.0% 0.0% 6.1 +‐1.5 0.87 0.0% 0.5% 0.9 +‐3 0.92 52.6% 0.0%2010.2‐2016.2 7.3 +‐3.4 0.92 0.1% 0.0% 6 +‐1.8 0.85 0.0% 0.8% 1.3 +‐3.4 0.92 41.3% 0.0%2011.1‐2016.2 7.9 +‐4.1 0.92 0.1% 0.0% 5.7 +‐2.1 0.79 0.0% 1.9% 2.1 +‐4 0.92 26.1% 0.0%2011.2‐2016.2 7.8 +‐5 0.9 0.6% 0.0% 5.7 +‐2.5 0.77 0.1% 3.3% 2 +‐4.9 0.91 37.1% 0.0%2012.1‐2016.2 7 +‐6.2 0.91 2.8% 0.0% 6.6 +‐2.9 0.79 0.1% 1.9% 0.3 +‐5.5 0.92 89.2% 0.0%2012.2‐2016.2 5.8 +‐7.5 0.88 10.3% 0.0% 5.9 +‐3.4 0.77 0.5% 1.8% ‐0.2 +‐7 0.91 95.7% 0.0%2013.1‐2016.2 6.8 +‐10.5 0.87 14.7% 0.1% 5.1 +‐4.5 0.61 3.1% 4.8% 1.6 +‐9.4 0.91 67.3% 0.0%2013.2‐2016.2 10.7 +‐12 0.91 6.0% 0.2% 5.4 +‐6.5 0.58 7.4% 10.0% 5 +‐11 0.93 26.6% 0.1%2014.1‐2016.2 7.4 +‐18.4 0.92 27.3% 0.6% 2 +‐5.2 0.34 31.6% 13.5% 5.4 +‐19.4 0.92 43.1% 0.6%
140
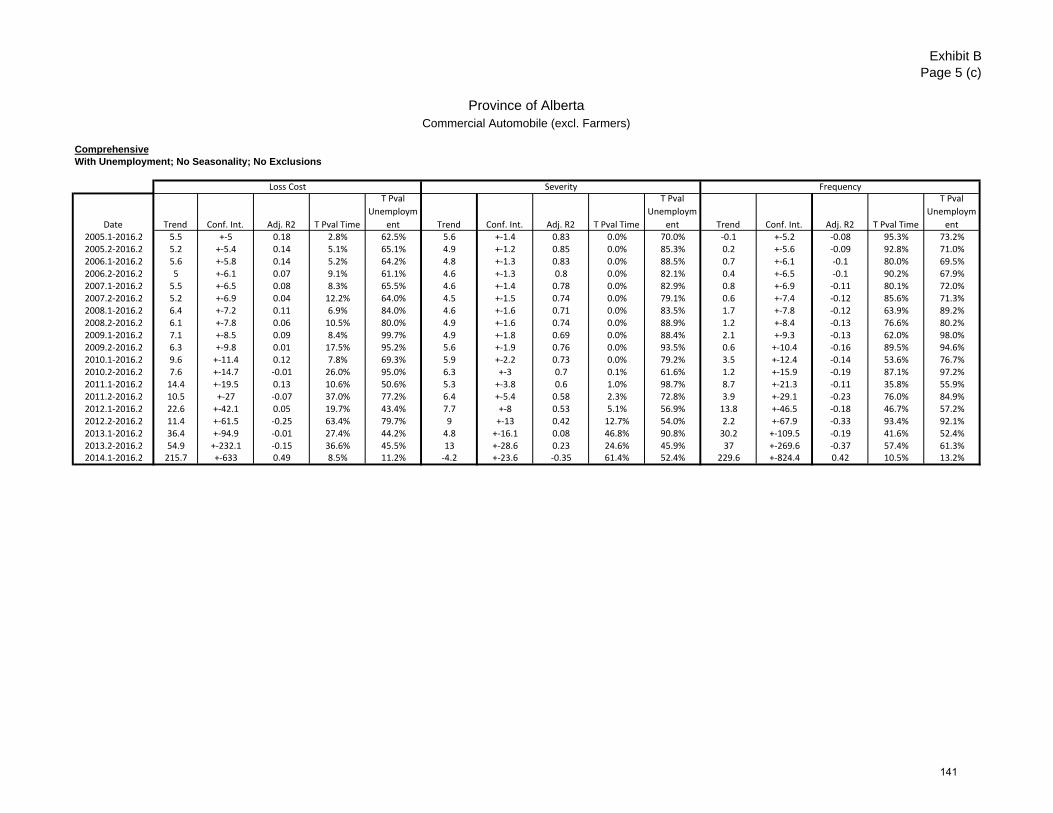
Exhibit BPage 5 (c)
Province of AlbertaCommercial Automobile (excl. Farmers)
ComprehensiveWith Unemployment; No Seasonality; No Exclusions
Loss Cost Severity Frequency
Date Trend Conf. Int. Adj. R2 T Pval Time
T Pval
Unemploym
ent Trend Conf. Int. Adj. R2 T Pval Time
T Pval
Unemploym
ent Trend Conf. Int. Adj. R2 T Pval Time
T Pval
Unemploym
ent2005.1‐2016.2 5.5 +‐5 0.18 2.8% 62.5% 5.6 +‐1.4 0.83 0.0% 70.0% ‐0.1 +‐5.2 ‐0.08 95.3% 73.2%2005.2‐2016.2 5.2 +‐5.4 0.14 5.1% 65.1% 4.9 +‐1.2 0.85 0.0% 85.3% 0.2 +‐5.6 ‐0.09 92.8% 71.0%2006.1‐2016.2 5.6 +‐5.8 0.14 5.2% 64.2% 4.8 +‐1.3 0.83 0.0% 88.5% 0.7 +‐6.1 ‐0.1 80.0% 69.5%2006.2‐2016.2 5 +‐6.1 0.07 9.1% 61.1% 4.6 +‐1.3 0.8 0.0% 82.1% 0.4 +‐6.5 ‐0.1 90.2% 67.9%2007.1‐2016.2 5.5 +‐6.5 0.08 8.3% 65.5% 4.6 +‐1.4 0.78 0.0% 82.9% 0.8 +‐6.9 ‐0.11 80.1% 72.0%2007.2‐2016.2 5.2 +‐6.9 0.04 12.2% 64.0% 4.5 +‐1.5 0.74 0.0% 79.1% 0.6 +‐7.4 ‐0.12 85.6% 71.3%2008.1‐2016.2 6.4 +‐7.2 0.11 6.9% 84.0% 4.6 +‐1.6 0.71 0.0% 83.5% 1.7 +‐7.8 ‐0.12 63.9% 89.2%2008.2‐2016.2 6.1 +‐7.8 0.06 10.5% 80.0% 4.9 +‐1.6 0.74 0.0% 88.9% 1.2 +‐8.4 ‐0.13 76.6% 80.2%2009.1‐2016.2 7.1 +‐8.5 0.09 8.4% 99.7% 4.9 +‐1.8 0.69 0.0% 88.4% 2.1 +‐9.3 ‐0.13 62.0% 98.0%2009.2‐2016.2 6.3 +‐9.8 0.01 17.5% 95.2% 5.6 +‐1.9 0.76 0.0% 93.5% 0.6 +‐10.4 ‐0.16 89.5% 94.6%2010.1‐2016.2 9.6 +‐11.4 0.12 7.8% 69.3% 5.9 +‐2.2 0.73 0.0% 79.2% 3.5 +‐12.4 ‐0.14 53.6% 76.7%2010.2‐2016.2 7.6 +‐14.7 ‐0.01 26.0% 95.0% 6.3 +‐3 0.7 0.1% 61.6% 1.2 +‐15.9 ‐0.19 87.1% 97.2%2011.1‐2016.2 14.4 +‐19.5 0.13 10.6% 50.6% 5.3 +‐3.8 0.6 1.0% 98.7% 8.7 +‐21.3 ‐0.11 35.8% 55.9%2011.2‐2016.2 10.5 +‐27 ‐0.07 37.0% 77.2% 6.4 +‐5.4 0.58 2.3% 72.8% 3.9 +‐29.1 ‐0.23 76.0% 84.9%2012.1‐2016.2 22.6 +‐42.1 0.05 19.7% 43.4% 7.7 +‐8 0.53 5.1% 56.9% 13.8 +‐46.5 ‐0.18 46.7% 57.2%2012.2‐2016.2 11.4 +‐61.5 ‐0.25 63.4% 79.7% 9 +‐13 0.42 12.7% 54.0% 2.2 +‐67.9 ‐0.33 93.4% 92.1%2013.1‐2016.2 36.4 +‐94.9 ‐0.01 27.4% 44.2% 4.8 +‐16.1 0.08 46.8% 90.8% 30.2 +‐109.5 ‐0.19 41.6% 52.4%2013.2‐2016.2 54.9 +‐232.1 ‐0.15 36.6% 45.5% 13 +‐28.6 0.23 24.6% 45.9% 37 +‐269.6 ‐0.37 57.4% 61.3%2014.1‐2016.2 215.7 +‐633 0.49 8.5% 11.2% ‐4.2 +‐23.6 ‐0.35 61.4% 52.4% 229.6 +‐824.4 0.42 10.5% 13.2%
141

Exhibit BPage 5 (d)
Province of AlbertaCommercial Automobile (excl. Farmers)
ComprehensiveNo Seasonality; No Unemployment; No Exclusions
Loss Cost Severity Frequency
Date Trend Conf. Int. Adj. R2 T Pval Time Trend Conf. Int. Adj. R2 T Pval Time Trend Conf. Int. Adj. R2 T Pval Time2005.1‐2016.2 4.7 +‐3.7 0.21 1.4% 5.4 +‐1.1 0.84 0.0% ‐0.7 +‐3.9 ‐0.04 71.8%2005.2‐2016.2 4.5 +‐4.1 0.17 2.9% 4.9 +‐0.9 0.86 0.0% ‐0.4 +‐4.3 ‐0.05 85.4%2006.1‐2016.2 4.8 +‐4.5 0.17 3.3% 4.8 +‐1 0.84 0.0% 0 +‐4.7 ‐0.05 98.4%2006.2‐2016.2 4.2 +‐4.8 0.11 8.1% 4.5 +‐1 0.81 0.0% ‐0.3 +‐5.1 ‐0.05 89.0%2007.1‐2016.2 4.8 +‐5.3 0.12 7.0% 4.5 +‐1.1 0.79 0.0% 0.2 +‐5.7 ‐0.06 93.7%2007.2‐2016.2 4.5 +‐5.9 0.08 12.2% 4.4 +‐1.3 0.76 0.0% 0 +‐6.3 ‐0.06 99.0%2008.1‐2016.2 6.1 +‐6.4 0.17 5.2% 4.5 +‐1.4 0.73 0.0% 1.5 +‐6.9 ‐0.05 64.1%2008.2‐2016.2 5.8 +‐7.2 0.12 9.4% 4.9 +‐1.5 0.75 0.0% 0.9 +‐7.7 ‐0.06 80.5%2009.1‐2016.2 7.1 +‐8.1 0.16 7.0% 4.9 +‐1.7 0.72 0.0% 2.1 +‐8.8 ‐0.05 60.6%2009.2‐2016.2 6.3 +‐9.2 0.09 14.9% 5.6 +‐1.8 0.78 0.0% 0.7 +‐9.8 ‐0.07 87.9%2010.1‐2016.2 8.9 +‐10.3 0.18 7.0% 5.8 +‐2 0.75 0.0% 3 +‐11.1 ‐0.05 56.3%2010.2‐2016.2 7.3 +‐11.7 0.08 17.9% 6 +‐2.4 0.72 0.0% 1.3 +‐12.7 ‐0.09 82.3%2011.1‐2016.2 10.6 +‐13.5 0.18 9.6% 5.3 +‐2.7 0.64 0.1% 5 +‐14.7 ‐0.04 45.2%2011.2‐2016.2 7.8 +‐15.6 0.04 26.5% 5.7 +‐3.2 0.62 0.2% 2 +‐16.8 ‐0.1 79.1%2012.1‐2016.2 10.9 +‐19.3 0.09 20.6% 6 +‐4 0.57 0.7% 4.6 +‐21.1 ‐0.09 61.6%2012.2‐2016.2 5.8 +‐22.1 ‐0.08 54.4% 5.9 +‐5.1 0.47 2.5% ‐0.2 +‐24.6 ‐0.14 98.8%2013.1‐2016.2 12.6 +‐28.7 0.04 29.3% 4.1 +‐5.8 0.23 12.9% 8.2 +‐32 ‐0.09 53.2%2013.2‐2016.2 10.7 +‐40 ‐0.08 49.3% 5.4 +‐7.8 0.28 12.6% 5 +‐43.8 ‐0.18 77.0%2014.1‐2016.2 19.8 +‐63.8 ‐0.01 38.1% 1 +‐5.8 ‐0.18 66.0% 18.7 +‐69.3 ‐0.06 44.0%
142

Exhibit BPage 6 (a)
Province of AlbertaCommercial Automobile (excl. Farmers)
Comprehensive - TheftWith Seasonality and Unemployment; No Exclusions
Loss Cost Severity Frequency
Date Trend Conf. Int. Adj. R2 T Pval Time
T Pval
Seasonality
T Pval
Unemploym
ent Trend Conf. Int. Adj. R2 T Pval Time
T Pval
Seasonality
T Pval
Unemploym
ent Trend Conf. Int. Adj. R2 T Pval Time
T Pval
Seasonality
T Pval
Unemploym
ent
2005.1‐2016.2 4.6 +‐3.2 0.5 0.6% 5.1% 53.9% 4.1 +‐1.1 0.85 0.0% 0.4% 94.8% 0.5 +‐2.9 ‐0.02 74.0% 29.0% 52.7%
2005.2‐2016.2 4.3 +‐3.4 0.43 1.4% 7.2% 52.4% 3.8 +‐1 0.84 0.0% 0.6% 80.8% 0.6 +‐3.1 ‐0.03 71.4% 29.5% 54.6%
2006.1‐2016.2 4 +‐3.7 0.4 3.1% 6.9% 51.0% 3.5 +‐1 0.84 0.0% 0.2% 69.9% 0.5 +‐3.4 ‐0.04 74.2% 31.8% 55.7%
2006.2‐2016.2 4.3 +‐3.9 0.38 3.1% 6.5% 48.9% 3.3 +‐1 0.81 0.0% 0.4% 77.5% 0.9 +‐3.5 0 59.1% 24.7% 50.8%
2007.1‐2016.2 4.4 +‐4.2 0.37 3.9% 8.6% 49.6% 3.2 +‐1 0.8 0.0% 0.3% 82.8% 1.2 +‐3.8 0 52.4% 31.6% 49.9%
2007.2‐2016.2 4.5 +‐4.5 0.32 4.5% 9.2% 48.7% 2.9 +‐1 0.77 0.0% 0.5% 96.9% 1.6 +‐4 0.04 41.5% 25.5% 44.1%
2008.1‐2016.2 5.4 +‐4.7 0.39 2.3% 15.7% 34.6% 3.1 +‐1 0.79 0.0% 1.0% 83.4% 2.2 +‐4.2 0.09 27.1% 38.0% 33.4%
2008.2‐2016.2 6.5 +‐4.5 0.53 0.6% 5.7% 13.5% 3.2 +‐1.1 0.78 0.0% 0.9% 65.7% 3.2 +‐4.1 0.27 11.0% 17.7% 13.8%
2009.1‐2016.2 8.5 +‐3.8 0.74 0.0% 7.7% 1.2% 3.3 +‐1.2 0.76 0.0% 1.6% 63.8% 5.1 +‐3.3 0.61 0.5% 29.4% 0.9%
2009.2‐2016.2 10.1 +‐3.6 0.82 0.0% 1.9% 0.9% 3.6 +‐1.3 0.78 0.0% 0.8% 74.8% 6.3 +‐3.4 0.7 0.1% 13.6% 0.9%
2010.1‐2016.2 11.5 +‐4.1 0.85 0.0% 4.4% 3.0% 3.2 +‐1.5 0.78 0.1% 0.6% 45.3% 8 +‐3.5 0.79 0.0% 29.9% 2.8%
2010.2‐2016.2 13.5 +‐4.9 0.87 0.0% 2.3% 16.1% 3.9 +‐1.7 0.81 0.0% 0.3% 93.1% 9.2 +‐4.4 0.8 0.1% 22.7% 12.6%
2011.1‐2016.2 15.7 +‐6.5 0.89 0.0% 5.8% 48.0% 3.2 +‐2.3 0.81 1.0% 0.3% 62.9% 12.1 +‐5.2 0.86 0.0% 50.6% 52.4%
2011.2‐2016.2 18.1 +‐8.9 0.88 0.1% 5.0% 89.8% 2.3 +‐2.9 0.75 10.5% 0.5% 34.5% 15.5 +‐6 0.9 0.0% 25.9% 72.6%
2012.1‐2016.2 20.7 +‐14.5 0.86 0.8% 12.8% 80.6% 3.9 +‐4.3 0.8 6.3% 1.9% 94.1% 16.1 +‐9.8 0.88 0.5% 38.6% 70.3%
2012.2‐2016.2 18.3 +‐22 0.79 6.7% 17.8% 97.9% 4.9 +‐6.6 0.74 11.2% 2.9% 82.3% 12.8 +‐14 0.81 5.4% 46.9% 87.7%
2013.1‐2016.2 21.4 +‐37.4 0.74 15.0% 35.3% 87.7% 5.9 +‐11 0.71 19.9% 9.3% 71.6% 14.6 +‐23.5 0.76 13.6% 67.6% 96.4%
2013.2‐2016.2 31.7 +‐74.3 0.65 20.2% 38.1% 63.2% 10.5 +‐18.2 0.71 14.9% 10.0% 38.3% 19.2 +‐45.6 0.65 23.2% 69.1% 77.2%2014.1‐2016.2 104.3 +‐405.5 0.75 16.6% 68.6% 25.7% 25.7 +‐59.2 0.8 16.4% 67.8% 22.2% 62.6 +‐186.5 0.75 16.7% 45.9% 27.6%
143

Exhibit BPage 6 (b)
Province of AlbertaCommercial Automobile (excl. Farmers)
Comprehensive - TheftWith Seasonality; No Unemployment; No Exclusions
Loss Cost Severity Frequency
Date Trend Conf. Int. Adj. R2 T Pval Time
T Pval
Seasonality Trend Conf. Int. Adj. R2 T Pval Time
T Pval
Seasonality Trend Conf. Int. Adj. R2 T Pval Time
T Pval
Seasonality2005.1‐2016.2 5.2 +‐2.4 0.52 0.0% 5.2% 4.1 +‐0.8 0.86 0.0% 0.4% 1 +‐2.2 0.01 34.0% 30.8%2005.2‐2016.2 5 +‐2.6 0.45 0.1% 7.4% 3.8 +‐0.7 0.85 0.0% 0.5% 1.1 +‐2.4 0 34.0% 30.7%2006.1‐2016.2 4.7 +‐2.9 0.42 0.2% 7.2% 3.6 +‐0.8 0.85 0.0% 0.2% 1.1 +‐2.6 0 38.2% 33.3%2006.2‐2016.2 5 +‐3.2 0.4 0.3% 6.9% 3.4 +‐0.8 0.82 0.0% 0.3% 1.6 +‐2.9 0.03 26.5% 26.5%2007.1‐2016.2 5.1 +‐3.5 0.39 0.6% 8.9% 3.2 +‐0.9 0.81 0.0% 0.2% 1.8 +‐3.2 0.03 24.3% 33.5%2007.2‐2016.2 5.3 +‐4 0.34 1.1% 9.8% 2.9 +‐0.8 0.78 0.0% 0.4% 2.3 +‐3.5 0.06 18.7% 28.3%2008.1‐2016.2 6.2 +‐4.3 0.4 0.6% 17.3% 3.2 +‐0.9 0.81 0.0% 0.8% 3 +‐3.9 0.09 11.8% 41.5%2008.2‐2016.2 7.5 +‐4.6 0.47 0.3% 9.5% 3.3 +‐1 0.79 0.0% 0.8% 4 +‐4.1 0.19 5.2% 26.6%2009.1‐2016.2 9.2 +‐4.7 0.58 0.1% 18.8% 3.3 +‐1.1 0.77 0.0% 1.3% 5.7 +‐4.2 0.35 1.0% 49.2%2009.2‐2016.2 11 +‐4.7 0.69 0.0% 6.8% 3.7 +‐1.2 0.8 0.0% 0.6% 7.1 +‐4.4 0.47 0.3% 27.7%2010.1‐2016.2 13.1 +‐4.8 0.78 0.0% 13.8% 3.4 +‐1.3 0.79 0.0% 0.5% 9.4 +‐4 0.68 0.0% 56.4%2010.2‐2016.2 15.3 +‐4.4 0.86 0.0% 2.9% 3.9 +‐1.4 0.83 0.0% 0.2% 11 +‐4.1 0.77 0.0% 27.0%2011.1‐2016.2 17.1 +‐4.7 0.89 0.0% 5.9% 3.5 +‐1.6 0.83 0.1% 0.2% 13.2 +‐3.7 0.87 0.0% 56.4%2011.2‐2016.2 18.5 +‐5.2 0.89 0.0% 3.6% 3.3 +‐1.8 0.75 0.3% 0.4% 14.8 +‐3.5 0.92 0.0% 22.1%2012.1‐2016.2 19.4 +‐6.6 0.88 0.0% 7.6% 4 +‐2 0.83 0.2% 0.9% 14.8 +‐4.5 0.89 0.0% 27.6%2012.2‐2016.2 18.5 +‐8.3 0.82 0.1% 13.3% 4.3 +‐2.5 0.78 0.5% 1.4% 13.6 +‐5.3 0.84 0.0% 43.4%2013.1‐2016.2 19.4 +‐11.6 0.79 0.5% 23.3% 4.5 +‐3.5 0.76 2.0% 3.7% 14.3 +‐7.4 0.81 0.3% 59.1%2013.2‐2016.2 21 +‐16.5 0.71 1.8% 25.2% 5.1 +‐4.8 0.71 4.0% 5.3% 15.1 +‐10.6 0.73 1.3% 57.0%2014.1‐2016.2 22.1 +‐29.2 0.63 7.5% 40.8% 4.7 +‐8.4 0.66 16.3% 11.3% 16.5 +‐18.4 0.65 5.3% 77.3%
144
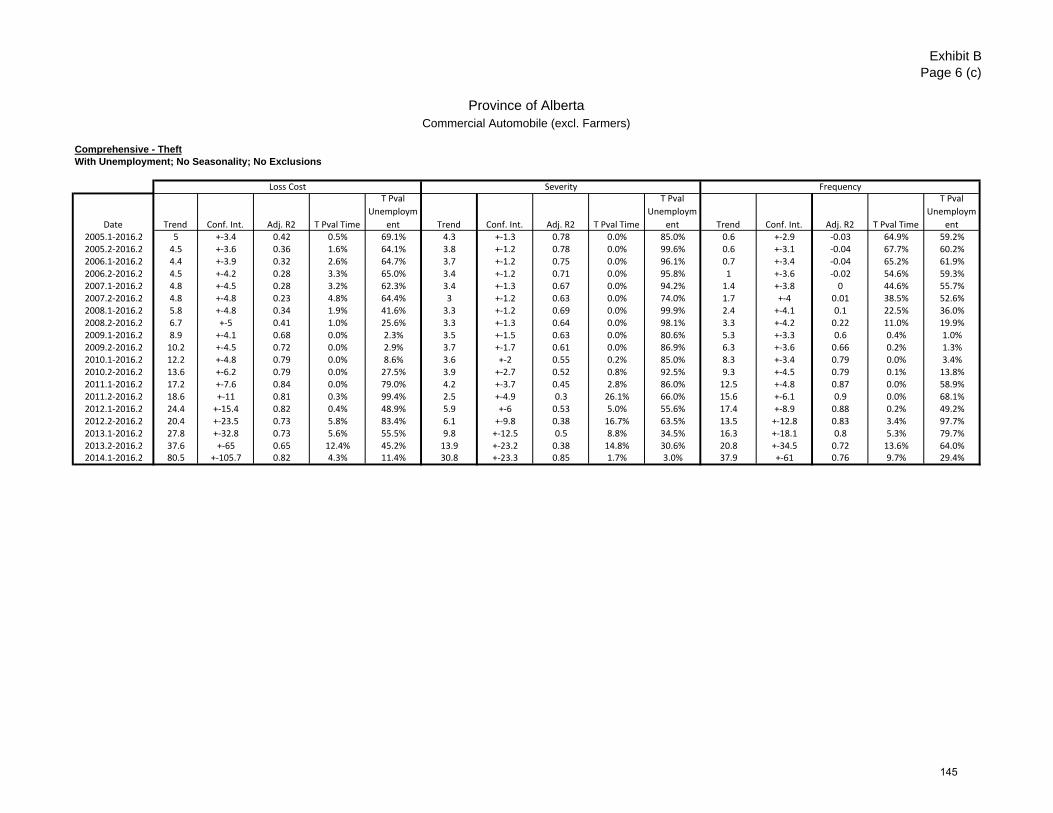
Exhibit BPage 6 (c)
Province of AlbertaCommercial Automobile (excl. Farmers)
Comprehensive - TheftWith Unemployment; No Seasonality; No Exclusions
Loss Cost Severity Frequency
Date Trend Conf. Int. Adj. R2 T Pval Time
T Pval
Unemploym
ent Trend Conf. Int. Adj. R2 T Pval Time
T Pval
Unemploym
ent Trend Conf. Int. Adj. R2 T Pval Time
T Pval
Unemploym
ent2005.1‐2016.2 5 +‐3.4 0.42 0.5% 69.1% 4.3 +‐1.3 0.78 0.0% 85.0% 0.6 +‐2.9 ‐0.03 64.9% 59.2%2005.2‐2016.2 4.5 +‐3.6 0.36 1.6% 64.1% 3.8 +‐1.2 0.78 0.0% 99.6% 0.6 +‐3.1 ‐0.04 67.7% 60.2%2006.1‐2016.2 4.4 +‐3.9 0.32 2.6% 64.7% 3.7 +‐1.2 0.75 0.0% 96.1% 0.7 +‐3.4 ‐0.04 65.2% 61.9%2006.2‐2016.2 4.5 +‐4.2 0.28 3.3% 65.0% 3.4 +‐1.2 0.71 0.0% 95.8% 1 +‐3.6 ‐0.02 54.6% 59.3%2007.1‐2016.2 4.8 +‐4.5 0.28 3.2% 62.3% 3.4 +‐1.3 0.67 0.0% 94.2% 1.4 +‐3.8 0 44.6% 55.7%2007.2‐2016.2 4.8 +‐4.8 0.23 4.8% 64.4% 3 +‐1.2 0.63 0.0% 74.0% 1.7 +‐4 0.01 38.5% 52.6%2008.1‐2016.2 5.8 +‐4.8 0.34 1.9% 41.6% 3.3 +‐1.2 0.69 0.0% 99.9% 2.4 +‐4.1 0.1 22.5% 36.0%2008.2‐2016.2 6.7 +‐5 0.41 1.0% 25.6% 3.3 +‐1.3 0.64 0.0% 98.1% 3.3 +‐4.2 0.22 11.0% 19.9%2009.1‐2016.2 8.9 +‐4.1 0.68 0.0% 2.3% 3.5 +‐1.5 0.63 0.0% 80.6% 5.3 +‐3.3 0.6 0.4% 1.0%2009.2‐2016.2 10.2 +‐4.5 0.72 0.0% 2.9% 3.7 +‐1.7 0.61 0.0% 86.9% 6.3 +‐3.6 0.66 0.2% 1.3%2010.1‐2016.2 12.2 +‐4.8 0.79 0.0% 8.6% 3.6 +‐2 0.55 0.2% 85.0% 8.3 +‐3.4 0.79 0.0% 3.4%2010.2‐2016.2 13.6 +‐6.2 0.79 0.0% 27.5% 3.9 +‐2.7 0.52 0.8% 92.5% 9.3 +‐4.5 0.79 0.1% 13.8%2011.1‐2016.2 17.2 +‐7.6 0.84 0.0% 79.0% 4.2 +‐3.7 0.45 2.8% 86.0% 12.5 +‐4.8 0.87 0.0% 58.9%2011.2‐2016.2 18.6 +‐11 0.81 0.3% 99.4% 2.5 +‐4.9 0.3 26.1% 66.0% 15.6 +‐6.1 0.9 0.0% 68.1%2012.1‐2016.2 24.4 +‐15.4 0.82 0.4% 48.9% 5.9 +‐6 0.53 5.0% 55.6% 17.4 +‐8.9 0.88 0.2% 49.2%2012.2‐2016.2 20.4 +‐23.5 0.73 5.8% 83.4% 6.1 +‐9.8 0.38 16.7% 63.5% 13.5 +‐12.8 0.83 3.4% 97.7%2013.1‐2016.2 27.8 +‐32.8 0.73 5.6% 55.5% 9.8 +‐12.5 0.5 8.8% 34.5% 16.3 +‐18.1 0.8 5.3% 79.7%2013.2‐2016.2 37.6 +‐65 0.65 12.4% 45.2% 13.9 +‐23.2 0.38 14.8% 30.6% 20.8 +‐34.5 0.72 13.6% 64.0%2014.1‐2016.2 80.5 +‐105.7 0.82 4.3% 11.4% 30.8 +‐23.3 0.85 1.7% 3.0% 37.9 +‐61 0.76 9.7% 29.4%
145
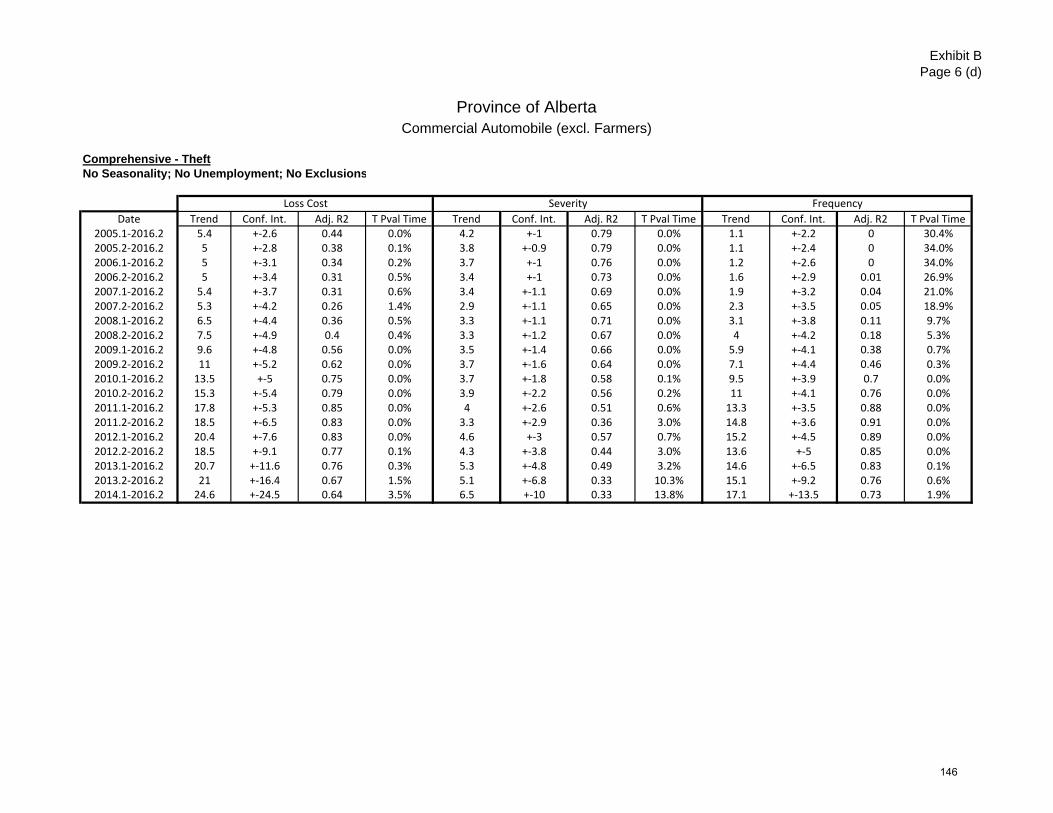
Exhibit BPage 6 (d)
Province of AlbertaCommercial Automobile (excl. Farmers)
Comprehensive - TheftNo Seasonality; No Unemployment; No Exclusions
Loss Cost Severity Frequency
Date Trend Conf. Int. Adj. R2 T Pval Time Trend Conf. Int. Adj. R2 T Pval Time Trend Conf. Int. Adj. R2 T Pval Time2005.1‐2016.2 5.4 +‐2.6 0.44 0.0% 4.2 +‐1 0.79 0.0% 1.1 +‐2.2 0 30.4%2005.2‐2016.2 5 +‐2.8 0.38 0.1% 3.8 +‐0.9 0.79 0.0% 1.1 +‐2.4 0 34.0%2006.1‐2016.2 5 +‐3.1 0.34 0.2% 3.7 +‐1 0.76 0.0% 1.2 +‐2.6 0 34.0%2006.2‐2016.2 5 +‐3.4 0.31 0.5% 3.4 +‐1 0.73 0.0% 1.6 +‐2.9 0.01 26.9%2007.1‐2016.2 5.4 +‐3.7 0.31 0.6% 3.4 +‐1.1 0.69 0.0% 1.9 +‐3.2 0.04 21.0%2007.2‐2016.2 5.3 +‐4.2 0.26 1.4% 2.9 +‐1.1 0.65 0.0% 2.3 +‐3.5 0.05 18.9%2008.1‐2016.2 6.5 +‐4.4 0.36 0.5% 3.3 +‐1.1 0.71 0.0% 3.1 +‐3.8 0.11 9.7%2008.2‐2016.2 7.5 +‐4.9 0.4 0.4% 3.3 +‐1.2 0.67 0.0% 4 +‐4.2 0.18 5.3%2009.1‐2016.2 9.6 +‐4.8 0.56 0.0% 3.5 +‐1.4 0.66 0.0% 5.9 +‐4.1 0.38 0.7%2009.2‐2016.2 11 +‐5.2 0.62 0.0% 3.7 +‐1.6 0.64 0.0% 7.1 +‐4.4 0.46 0.3%2010.1‐2016.2 13.5 +‐5 0.75 0.0% 3.7 +‐1.8 0.58 0.1% 9.5 +‐3.9 0.7 0.0%2010.2‐2016.2 15.3 +‐5.4 0.79 0.0% 3.9 +‐2.2 0.56 0.2% 11 +‐4.1 0.76 0.0%2011.1‐2016.2 17.8 +‐5.3 0.85 0.0% 4 +‐2.6 0.51 0.6% 13.3 +‐3.5 0.88 0.0%2011.2‐2016.2 18.5 +‐6.5 0.83 0.0% 3.3 +‐2.9 0.36 3.0% 14.8 +‐3.6 0.91 0.0%2012.1‐2016.2 20.4 +‐7.6 0.83 0.0% 4.6 +‐3 0.57 0.7% 15.2 +‐4.5 0.89 0.0%2012.2‐2016.2 18.5 +‐9.1 0.77 0.1% 4.3 +‐3.8 0.44 3.0% 13.6 +‐5 0.85 0.0%2013.1‐2016.2 20.7 +‐11.6 0.76 0.3% 5.3 +‐4.8 0.49 3.2% 14.6 +‐6.5 0.83 0.1%2013.2‐2016.2 21 +‐16.4 0.67 1.5% 5.1 +‐6.8 0.33 10.3% 15.1 +‐9.2 0.76 0.6%2014.1‐2016.2 24.6 +‐24.5 0.64 3.5% 6.5 +‐10 0.33 13.8% 17.1 +‐13.5 0.73 1.9%
146

Exhibit BPage 7 (a)
Province of AlbertaCommercial Automobile (excl. Farmers)
Comprehensive - Excluding Cat, Without TheftNo Snow; No Exclusions
Loss Cost Severity Frequency
Date Trend Conf. Int. Adj. R2 T Pval Time Trend Conf. Int. Adj. R2 T Pval Time Trend Conf. Int. Adj. R2 T Pval Time2002‐2016 3.7 +‐1.6 0.65 0.0% 6.7 +‐1.1 0.93 0.0% ‐2.8 +‐1.8 0.42 0.5%2003‐2016 3 +‐1.5 0.58 0.1% 6.5 +‐1.2 0.91 0.0% ‐3.3 +‐2 0.48 0.4%2004‐2016 2.2 +‐1.3 0.51 0.4% 6.9 +‐1.4 0.91 0.0% ‐4.3 +‐1.7 0.7 0.0%2005‐2016 1.4 +‐1 0.46 1.0% 6.7 +‐1.7 0.89 0.0% ‐5 +‐1.8 0.77 0.0%2006‐2016 0.9 +‐1 0.29 5.2% 6.7 +‐2 0.86 0.0% ‐5.4 +‐2.1 0.76 0.0%2007‐2016 0.9 +‐1.2 0.2 10.9% 7 +‐2.5 0.83 0.0% ‐5.7 +‐2.6 0.72 0.1%2008‐2016 1.3 +‐1.4 0.34 5.9% 7.6 +‐3 0.82 0.0% ‐5.8 +‐3.3 0.66 0.5%2009‐2016 1.2 +‐1.9 0.19 15.4% 8.4 +‐3.8 0.81 0.1% ‐6.6 +‐4.1 0.66 0.9%2010‐2016 0.6 +‐2.3 ‐0.09 50.9% 9.3 +‐5.1 0.79 0.4% ‐7.9 +‐5.1 0.7 1.2%2011‐2016 0.6 +‐3.6 ‐0.19 66.4% 10.1 +‐7.6 0.74 1.8% ‐8.7 +‐7.5 0.63 3.8%2012‐2016 ‐0.7 +‐5 ‐0.26 69.7% 13 +‐11 0.79 2.8% ‐12.1 +‐8.3 0.82 2.2%2013‐2016 ‐2.3 +‐9.2 0.05 39.7% 16.5 +‐22 0.79 7.3% ‐16.1 +‐8 0.95 1.5%2014‐2016 ‐2.4 +‐64.5 ‐0.59 70.1% 17.1 +‐184.5 0.45 35.1% ‐16.7 +‐54.5 0.87 16.5%
Loss Cost Severity Frequency
Date Trend Conf. Int. Adj. R2 T Pval Time Trend Conf. Int. Adj. R2 T Pval Time Trend Conf. Int. Adj. R2 T Pval Time2002‐2015 4.1 +‐1.8 0.67 0.0% 6.1 +‐0.8 0.95 0.0% ‐1.8 +‐1.5 0.3 2.5%2003‐2015 3.3 +‐1.7 0.6 0.1% 5.7 +‐0.8 0.96 0.0% ‐2.2 +‐1.7 0.36 1.7%2004‐2015 2.5 +‐1.6 0.52 0.5% 5.9 +‐0.9 0.95 0.0% ‐3.3 +‐1.3 0.72 0.0%2005‐2015 1.5 +‐1.2 0.44 1.6% 5.6 +‐1 0.95 0.0% ‐3.9 +‐1.3 0.81 0.0%2006‐2015 1 +‐1.2 0.24 8.3% 5.3 +‐1.1 0.93 0.0% ‐4.1 +‐1.6 0.79 0.0%2007‐2015 1 +‐1.5 0.16 15.8% 5.3 +‐1.4 0.91 0.0% ‐4.1 +‐2 0.73 0.2%2008‐2015 1.5 +‐1.8 0.32 8.2% 5.6 +‐1.8 0.89 0.0% ‐3.9 +‐2.6 0.62 1.3%2009‐2015 1.5 +‐2.6 0.18 19.0% 6 +‐2.5 0.87 0.1% ‐4.3 +‐3.6 0.56 3.1%2010‐2015 0.8 +‐3.5 ‐0.14 57.1% 6.3 +‐3.7 0.82 0.8% ‐5.2 +‐5 0.58 4.8%2011‐2015 0.8 +‐6.2 ‐0.26 71.3% 6.1 +‐6.5 0.68 5.4% ‐5 +‐8.8 0.34 17.6%2012‐2015 ‐1.2 +‐11.5 ‐0.36 69.6% 8 +‐13 0.69 10.9% ‐8.6 +‐12.9 0.68 11.2%2013‐2015 ‐4.9 +‐42.2 0.38 37.6% 9.7 +‐90.5 0.42 36.3% ‐13.3 +‐28.3 0.94 11.2%
147
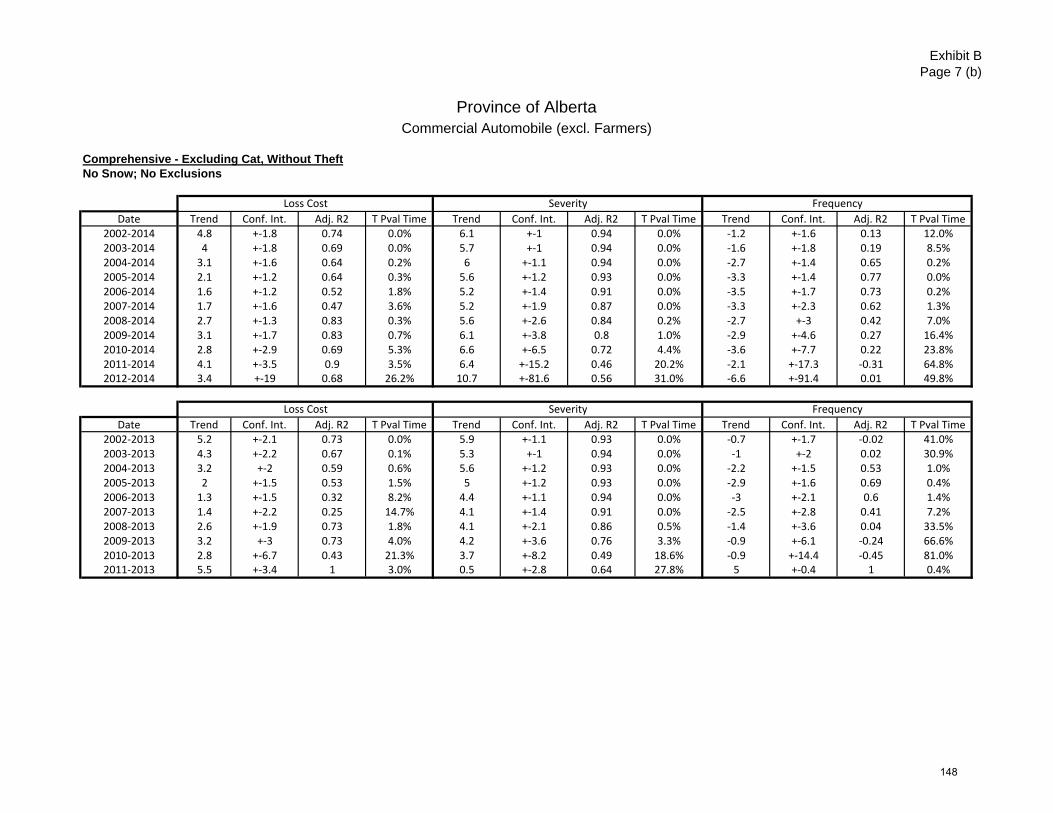
Exhibit BPage 7 (b)
Province of AlbertaCommercial Automobile (excl. Farmers)
Comprehensive - Excluding Cat, Without TheftNo Snow; No Exclusions
Loss Cost Severity Frequency
Date Trend Conf. Int. Adj. R2 T Pval Time Trend Conf. Int. Adj. R2 T Pval Time Trend Conf. Int. Adj. R2 T Pval Time2002‐2014 4.8 +‐1.8 0.74 0.0% 6.1 +‐1 0.94 0.0% ‐1.2 +‐1.6 0.13 12.0%2003‐2014 4 +‐1.8 0.69 0.0% 5.7 +‐1 0.94 0.0% ‐1.6 +‐1.8 0.19 8.5%2004‐2014 3.1 +‐1.6 0.64 0.2% 6 +‐1.1 0.94 0.0% ‐2.7 +‐1.4 0.65 0.2%2005‐2014 2.1 +‐1.2 0.64 0.3% 5.6 +‐1.2 0.93 0.0% ‐3.3 +‐1.4 0.77 0.0%2006‐2014 1.6 +‐1.2 0.52 1.8% 5.2 +‐1.4 0.91 0.0% ‐3.5 +‐1.7 0.73 0.2%2007‐2014 1.7 +‐1.6 0.47 3.6% 5.2 +‐1.9 0.87 0.0% ‐3.3 +‐2.3 0.62 1.3%2008‐2014 2.7 +‐1.3 0.83 0.3% 5.6 +‐2.6 0.84 0.2% ‐2.7 +‐3 0.42 7.0%2009‐2014 3.1 +‐1.7 0.83 0.7% 6.1 +‐3.8 0.8 1.0% ‐2.9 +‐4.6 0.27 16.4%2010‐2014 2.8 +‐2.9 0.69 5.3% 6.6 +‐6.5 0.72 4.4% ‐3.6 +‐7.7 0.22 23.8%2011‐2014 4.1 +‐3.5 0.9 3.5% 6.4 +‐15.2 0.46 20.2% ‐2.1 +‐17.3 ‐0.31 64.8%2012‐2014 3.4 +‐19 0.68 26.2% 10.7 +‐81.6 0.56 31.0% ‐6.6 +‐91.4 0.01 49.8%
Loss Cost Severity Frequency
Date Trend Conf. Int. Adj. R2 T Pval Time Trend Conf. Int. Adj. R2 T Pval Time Trend Conf. Int. Adj. R2 T Pval Time2002‐2013 5.2 +‐2.1 0.73 0.0% 5.9 +‐1.1 0.93 0.0% ‐0.7 +‐1.7 ‐0.02 41.0%2003‐2013 4.3 +‐2.2 0.67 0.1% 5.3 +‐1 0.94 0.0% ‐1 +‐2 0.02 30.9%2004‐2013 3.2 +‐2 0.59 0.6% 5.6 +‐1.2 0.93 0.0% ‐2.2 +‐1.5 0.53 1.0%2005‐2013 2 +‐1.5 0.53 1.5% 5 +‐1.2 0.93 0.0% ‐2.9 +‐1.6 0.69 0.4%2006‐2013 1.3 +‐1.5 0.32 8.2% 4.4 +‐1.1 0.94 0.0% ‐3 +‐2.1 0.6 1.4%2007‐2013 1.4 +‐2.2 0.25 14.7% 4.1 +‐1.4 0.91 0.0% ‐2.5 +‐2.8 0.41 7.2%2008‐2013 2.6 +‐1.9 0.73 1.8% 4.1 +‐2.1 0.86 0.5% ‐1.4 +‐3.6 0.04 33.5%2009‐2013 3.2 +‐3 0.73 4.0% 4.2 +‐3.6 0.76 3.3% ‐0.9 +‐6.1 ‐0.24 66.6%2010‐2013 2.8 +‐6.7 0.43 21.3% 3.7 +‐8.2 0.49 18.6% ‐0.9 +‐14.4 ‐0.45 81.0%2011‐2013 5.5 +‐3.4 1 3.0% 0.5 +‐2.8 0.64 27.8% 5 +‐0.4 1 0.4%
148
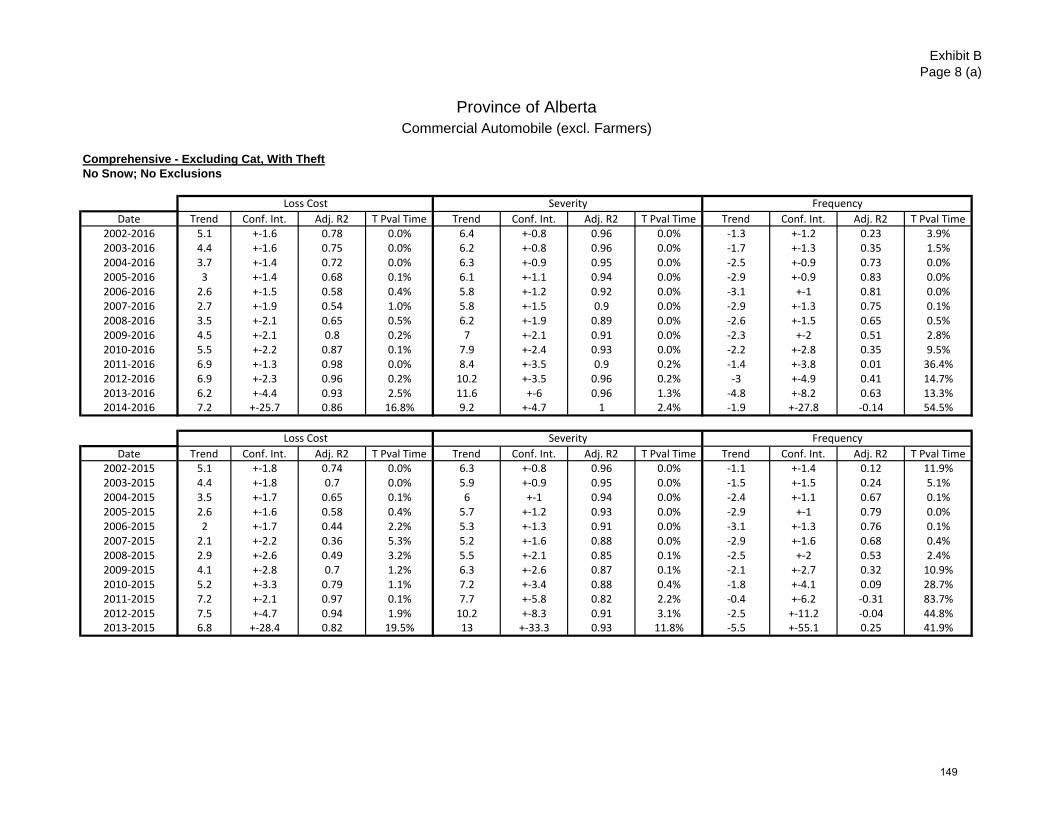
Exhibit BPage 8 (a)
Province of AlbertaCommercial Automobile (excl. Farmers)
Comprehensive - Excluding Cat, With TheftNo Snow; No Exclusions
Loss Cost Severity Frequency
Date Trend Conf. Int. Adj. R2 T Pval Time Trend Conf. Int. Adj. R2 T Pval Time Trend Conf. Int. Adj. R2 T Pval Time2002‐2016 5.1 +‐1.6 0.78 0.0% 6.4 +‐0.8 0.96 0.0% ‐1.3 +‐1.2 0.23 3.9%2003‐2016 4.4 +‐1.6 0.75 0.0% 6.2 +‐0.8 0.96 0.0% ‐1.7 +‐1.3 0.35 1.5%2004‐2016 3.7 +‐1.4 0.72 0.0% 6.3 +‐0.9 0.95 0.0% ‐2.5 +‐0.9 0.73 0.0%2005‐2016 3 +‐1.4 0.68 0.1% 6.1 +‐1.1 0.94 0.0% ‐2.9 +‐0.9 0.83 0.0%2006‐2016 2.6 +‐1.5 0.58 0.4% 5.8 +‐1.2 0.92 0.0% ‐3.1 +‐1 0.81 0.0%2007‐2016 2.7 +‐1.9 0.54 1.0% 5.8 +‐1.5 0.9 0.0% ‐2.9 +‐1.3 0.75 0.1%2008‐2016 3.5 +‐2.1 0.65 0.5% 6.2 +‐1.9 0.89 0.0% ‐2.6 +‐1.5 0.65 0.5%2009‐2016 4.5 +‐2.1 0.8 0.2% 7 +‐2.1 0.91 0.0% ‐2.3 +‐2 0.51 2.8%2010‐2016 5.5 +‐2.2 0.87 0.1% 7.9 +‐2.4 0.93 0.0% ‐2.2 +‐2.8 0.35 9.5%2011‐2016 6.9 +‐1.3 0.98 0.0% 8.4 +‐3.5 0.9 0.2% ‐1.4 +‐3.8 0.01 36.4%2012‐2016 6.9 +‐2.3 0.96 0.2% 10.2 +‐3.5 0.96 0.2% ‐3 +‐4.9 0.41 14.7%2013‐2016 6.2 +‐4.4 0.93 2.5% 11.6 +‐6 0.96 1.3% ‐4.8 +‐8.2 0.63 13.3%2014‐2016 7.2 +‐25.7 0.86 16.8% 9.2 +‐4.7 1 2.4% ‐1.9 +‐27.8 ‐0.14 54.5%
Loss Cost Severity Frequency
Date Trend Conf. Int. Adj. R2 T Pval Time Trend Conf. Int. Adj. R2 T Pval Time Trend Conf. Int. Adj. R2 T Pval Time2002‐2015 5.1 +‐1.8 0.74 0.0% 6.3 +‐0.8 0.96 0.0% ‐1.1 +‐1.4 0.12 11.9%2003‐2015 4.4 +‐1.8 0.7 0.0% 5.9 +‐0.9 0.95 0.0% ‐1.5 +‐1.5 0.24 5.1%2004‐2015 3.5 +‐1.7 0.65 0.1% 6 +‐1 0.94 0.0% ‐2.4 +‐1.1 0.67 0.1%2005‐2015 2.6 +‐1.6 0.58 0.4% 5.7 +‐1.2 0.93 0.0% ‐2.9 +‐1 0.79 0.0%2006‐2015 2 +‐1.7 0.44 2.2% 5.3 +‐1.3 0.91 0.0% ‐3.1 +‐1.3 0.76 0.1%2007‐2015 2.1 +‐2.2 0.36 5.3% 5.2 +‐1.6 0.88 0.0% ‐2.9 +‐1.6 0.68 0.4%2008‐2015 2.9 +‐2.6 0.49 3.2% 5.5 +‐2.1 0.85 0.1% ‐2.5 +‐2 0.53 2.4%2009‐2015 4.1 +‐2.8 0.7 1.2% 6.3 +‐2.6 0.87 0.1% ‐2.1 +‐2.7 0.32 10.9%2010‐2015 5.2 +‐3.3 0.79 1.1% 7.2 +‐3.4 0.88 0.4% ‐1.8 +‐4.1 0.09 28.7%2011‐2015 7.2 +‐2.1 0.97 0.1% 7.7 +‐5.8 0.82 2.2% ‐0.4 +‐6.2 ‐0.31 83.7%2012‐2015 7.5 +‐4.7 0.94 1.9% 10.2 +‐8.3 0.91 3.1% ‐2.5 +‐11.2 ‐0.04 44.8%2013‐2015 6.8 +‐28.4 0.82 19.5% 13 +‐33.3 0.93 11.8% ‐5.5 +‐55.1 0.25 41.9%
149
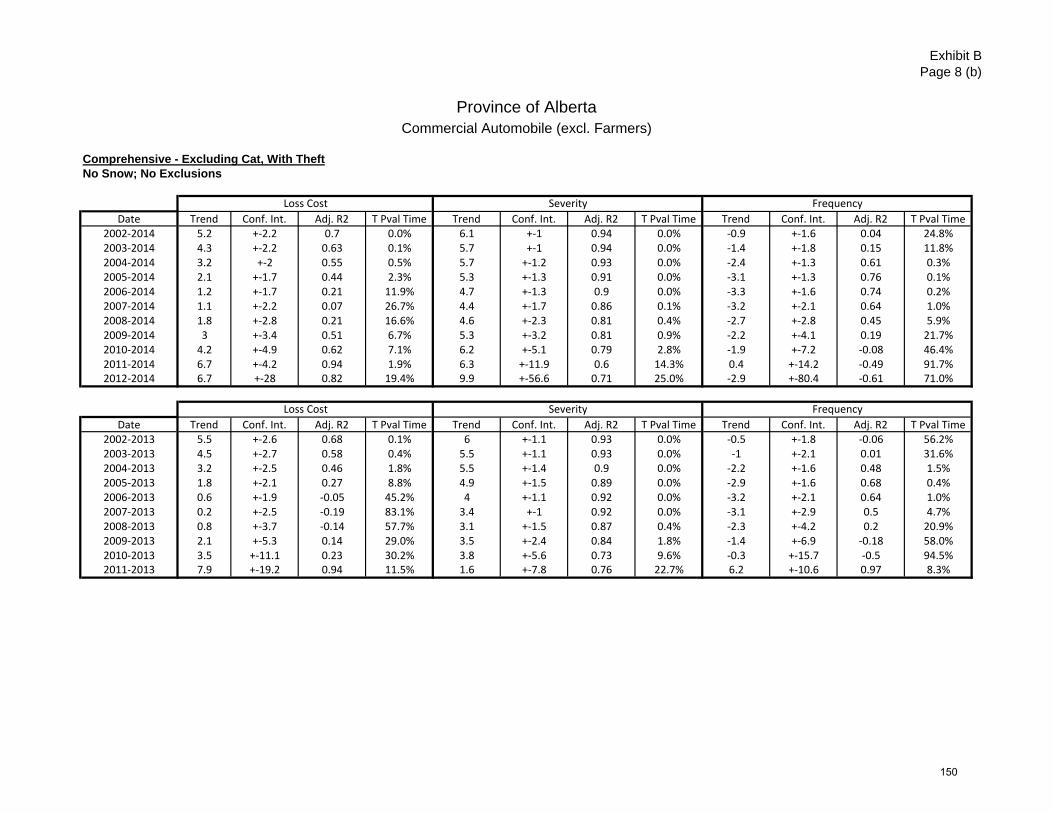
Exhibit BPage 8 (b)
Province of AlbertaCommercial Automobile (excl. Farmers)
Comprehensive - Excluding Cat, With TheftNo Snow; No Exclusions
Loss Cost Severity Frequency
Date Trend Conf. Int. Adj. R2 T Pval Time Trend Conf. Int. Adj. R2 T Pval Time Trend Conf. Int. Adj. R2 T Pval Time2002‐2014 5.2 +‐2.2 0.7 0.0% 6.1 +‐1 0.94 0.0% ‐0.9 +‐1.6 0.04 24.8%2003‐2014 4.3 +‐2.2 0.63 0.1% 5.7 +‐1 0.94 0.0% ‐1.4 +‐1.8 0.15 11.8%2004‐2014 3.2 +‐2 0.55 0.5% 5.7 +‐1.2 0.93 0.0% ‐2.4 +‐1.3 0.61 0.3%2005‐2014 2.1 +‐1.7 0.44 2.3% 5.3 +‐1.3 0.91 0.0% ‐3.1 +‐1.3 0.76 0.1%2006‐2014 1.2 +‐1.7 0.21 11.9% 4.7 +‐1.3 0.9 0.0% ‐3.3 +‐1.6 0.74 0.2%2007‐2014 1.1 +‐2.2 0.07 26.7% 4.4 +‐1.7 0.86 0.1% ‐3.2 +‐2.1 0.64 1.0%2008‐2014 1.8 +‐2.8 0.21 16.6% 4.6 +‐2.3 0.81 0.4% ‐2.7 +‐2.8 0.45 5.9%2009‐2014 3 +‐3.4 0.51 6.7% 5.3 +‐3.2 0.81 0.9% ‐2.2 +‐4.1 0.19 21.7%2010‐2014 4.2 +‐4.9 0.62 7.1% 6.2 +‐5.1 0.79 2.8% ‐1.9 +‐7.2 ‐0.08 46.4%2011‐2014 6.7 +‐4.2 0.94 1.9% 6.3 +‐11.9 0.6 14.3% 0.4 +‐14.2 ‐0.49 91.7%2012‐2014 6.7 +‐28 0.82 19.4% 9.9 +‐56.6 0.71 25.0% ‐2.9 +‐80.4 ‐0.61 71.0%
Loss Cost Severity Frequency
Date Trend Conf. Int. Adj. R2 T Pval Time Trend Conf. Int. Adj. R2 T Pval Time Trend Conf. Int. Adj. R2 T Pval Time2002‐2013 5.5 +‐2.6 0.68 0.1% 6 +‐1.1 0.93 0.0% ‐0.5 +‐1.8 ‐0.06 56.2%2003‐2013 4.5 +‐2.7 0.58 0.4% 5.5 +‐1.1 0.93 0.0% ‐1 +‐2.1 0.01 31.6%2004‐2013 3.2 +‐2.5 0.46 1.8% 5.5 +‐1.4 0.9 0.0% ‐2.2 +‐1.6 0.48 1.5%2005‐2013 1.8 +‐2.1 0.27 8.8% 4.9 +‐1.5 0.89 0.0% ‐2.9 +‐1.6 0.68 0.4%2006‐2013 0.6 +‐1.9 ‐0.05 45.2% 4 +‐1.1 0.92 0.0% ‐3.2 +‐2.1 0.64 1.0%2007‐2013 0.2 +‐2.5 ‐0.19 83.1% 3.4 +‐1 0.92 0.0% ‐3.1 +‐2.9 0.5 4.7%2008‐2013 0.8 +‐3.7 ‐0.14 57.7% 3.1 +‐1.5 0.87 0.4% ‐2.3 +‐4.2 0.2 20.9%2009‐2013 2.1 +‐5.3 0.14 29.0% 3.5 +‐2.4 0.84 1.8% ‐1.4 +‐6.9 ‐0.18 58.0%2010‐2013 3.5 +‐11.1 0.23 30.2% 3.8 +‐5.6 0.73 9.6% ‐0.3 +‐15.7 ‐0.5 94.5%2011‐2013 7.9 +‐19.2 0.94 11.5% 1.6 +‐7.8 0.76 22.7% 6.2 +‐10.6 0.97 8.3%
150
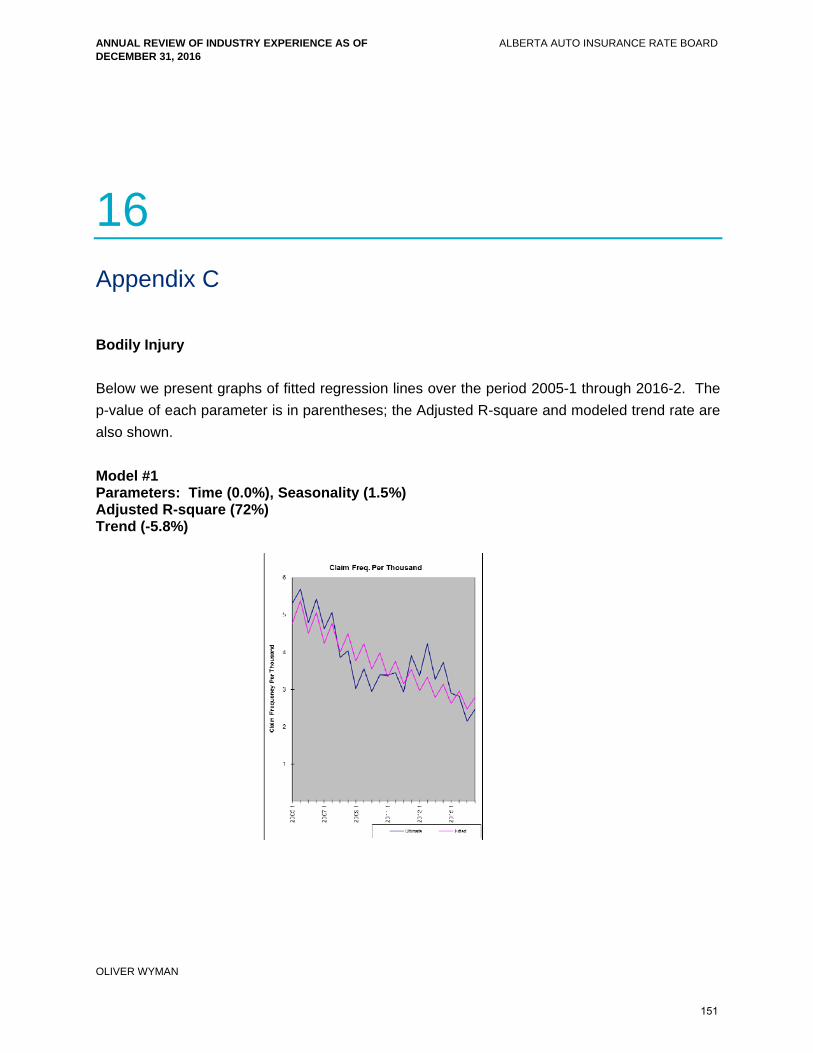
ANNUAL REVIEW OF INDUSTRY EXPERIENCE AS OF DECEMBER 31, 2016
ALBERTA AUTO INSURANCE RATE BOARD
OLIVER WYMAN
16 Appendix C
Bodily Injury
Below we present graphs of fitted regression lines over the period 2005-1 through 2016-2. The
p-value of each parameter is in parentheses; the Adjusted R-square and modeled trend rate are
also shown.
Model #1 Parameters: Time (0.0%), Seasonality (1.5%) Adjusted R-square (72%) Trend (-5.8%)
151
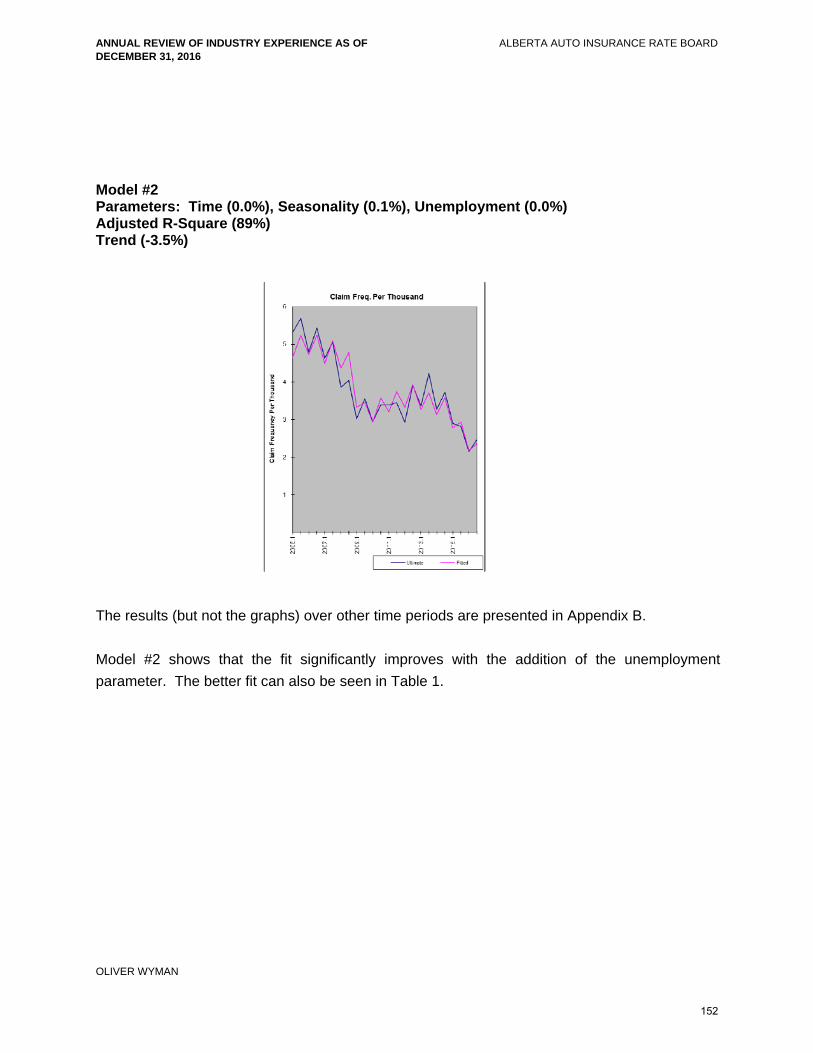
ANNUAL REVIEW OF INDUSTRY EXPERIENCE AS OF DECEMBER 31, 2016
ALBERTA AUTO INSURANCE RATE BOARD
OLIVER WYMAN
Model #2 Parameters: Time (0.0%), Seasonality (0.1%), Unemployment (0.0%) Adjusted R-Square (89%) Trend (-3.5%)
The results (but not the graphs) over other time periods are presented in Appendix B.
Model #2 shows that the fit significantly improves with the addition of the unemployment
parameter. The better fit can also be seen in Table 1.
152
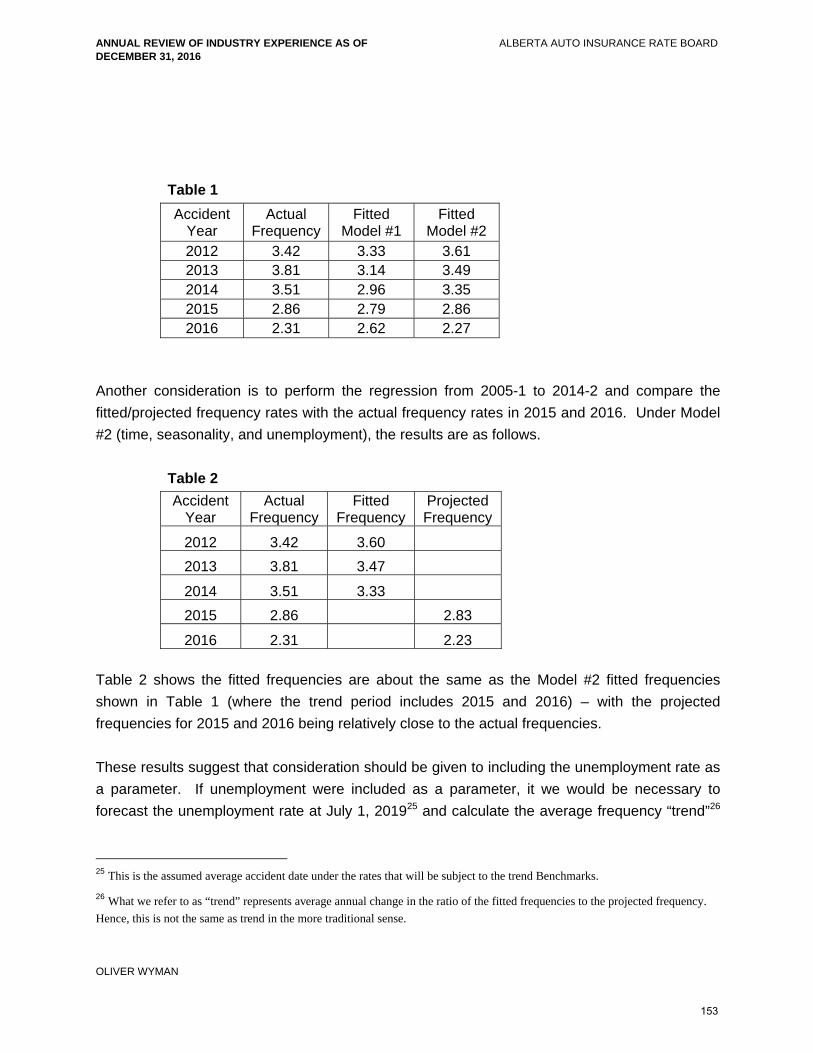
ANNUAL REVIEW OF INDUSTRY EXPERIENCE AS OF DECEMBER 31, 2016
ALBERTA AUTO INSURANCE RATE BOARD
OLIVER WYMAN
Table 1
Accident Year
Actual Frequency
Fitted Model #1
Fitted Model #2
2012 3.42 3.33 3.61 2013 3.81 3.14 3.49 2014 3.51 2.96 3.35 2015 2.86 2.79 2.86 2016 2.31 2.62 2.27
Another consideration is to perform the regression from 2005-1 to 2014-2 and compare the
fitted/projected frequency rates with the actual frequency rates in 2015 and 2016. Under Model
#2 (time, seasonality, and unemployment), the results are as follows.
Table 2
Accident Year
Actual Frequency
Fitted Frequency
Projected Frequency
2012 3.42 3.60
2013 3.81 3.47
2014 3.51 3.33
2015 2.86 2.83
2016 2.31 2.23
Table 2 shows the fitted frequencies are about the same as the Model #2 fitted frequencies
shown in Table 1 (where the trend period includes 2015 and 2016) – with the projected
frequencies for 2015 and 2016 being relatively close to the actual frequencies.
These results suggest that consideration should be given to including the unemployment rate as
a parameter. If unemployment were included as a parameter, it we would be necessary to
forecast the unemployment rate at July 1, 201925 and calculate the average frequency “trend”26
25 This is the assumed average accident date under the rates that will be subject to the trend Benchmarks.
26 What we refer to as “trend” represents average annual change in the ratio of the fitted frequencies to the projected frequency.
Hence, this is not the same as trend in the more traditional sense.
153
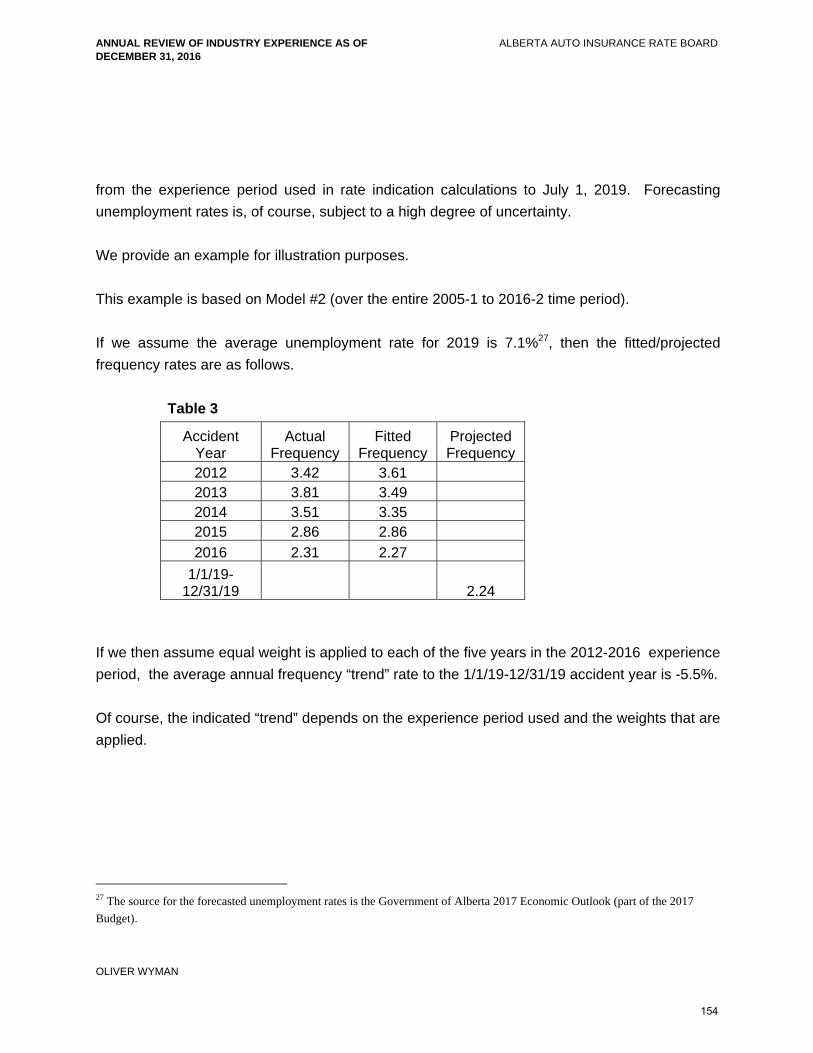
ANNUAL REVIEW OF INDUSTRY EXPERIENCE AS OF DECEMBER 31, 2016
ALBERTA AUTO INSURANCE RATE BOARD
OLIVER WYMAN
from the experience period used in rate indication calculations to July 1, 2019. Forecasting
unemployment rates is, of course, subject to a high degree of uncertainty.
We provide an example for illustration purposes.
This example is based on Model #2 (over the entire 2005-1 to 2016-2 time period).
If we assume the average unemployment rate for 2019 is 7.1%27, then the fitted/projected
frequency rates are as follows.
Table 3
Accident Year
Actual Frequency
Fitted Frequency
Projected Frequency
2012 3.42 3.61 2013 3.81 3.49 2014 3.51 3.35 2015 2.86 2.86
2016 2.31 2.27
1/1/19-12/31/19 2.24
If we then assume equal weight is applied to each of the five years in the 2012-2016 experience
period, the average annual frequency “trend” rate to the 1/1/19-12/31/19 accident year is -5.5%.
Of course, the indicated “trend” depends on the experience period used and the weights that are
applied.
27 The source for the forecasted unemployment rates is the Government of Alberta 2017 Economic Outlook (part of the 2017
Budget).
154
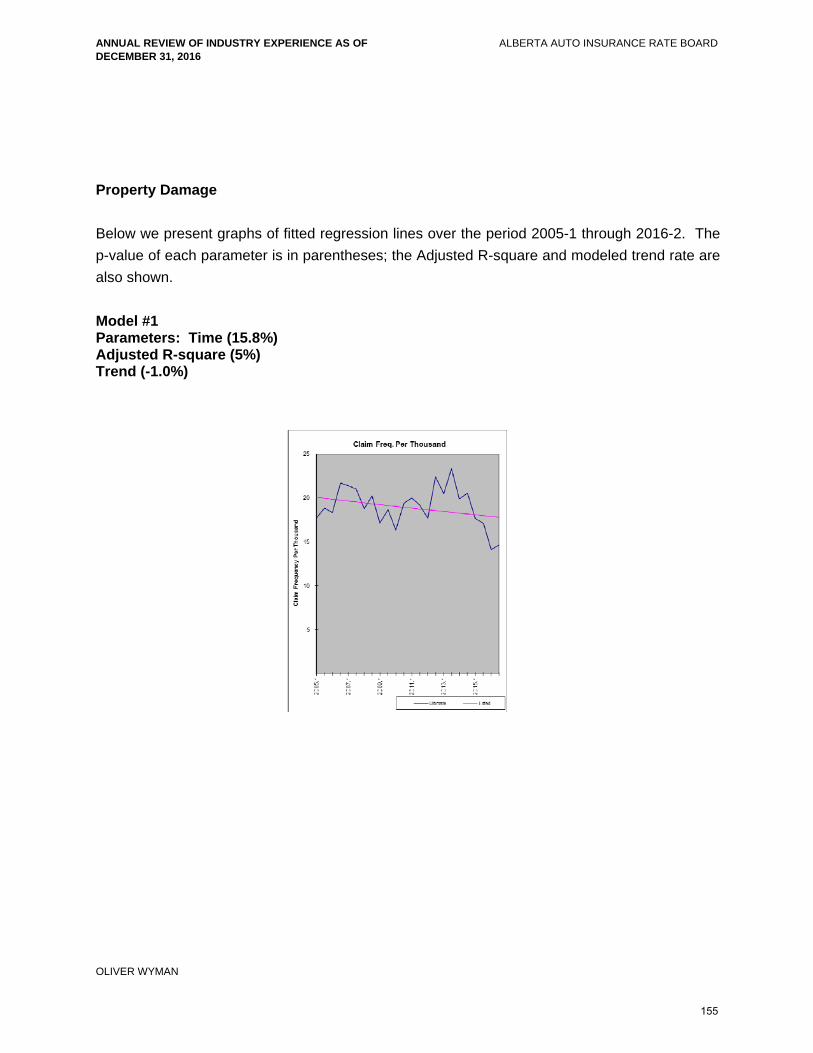
ANNUAL REVIEW OF INDUSTRY EXPERIENCE AS OF DECEMBER 31, 2016
ALBERTA AUTO INSURANCE RATE BOARD
OLIVER WYMAN
Property Damage
Below we present graphs of fitted regression lines over the period 2005-1 through 2016-2. The
p-value of each parameter is in parentheses; the Adjusted R-square and modeled trend rate are
also shown.
Model #1 Parameters: Time (15.8%) Adjusted R-square (5%) Trend (-1.0%)
155
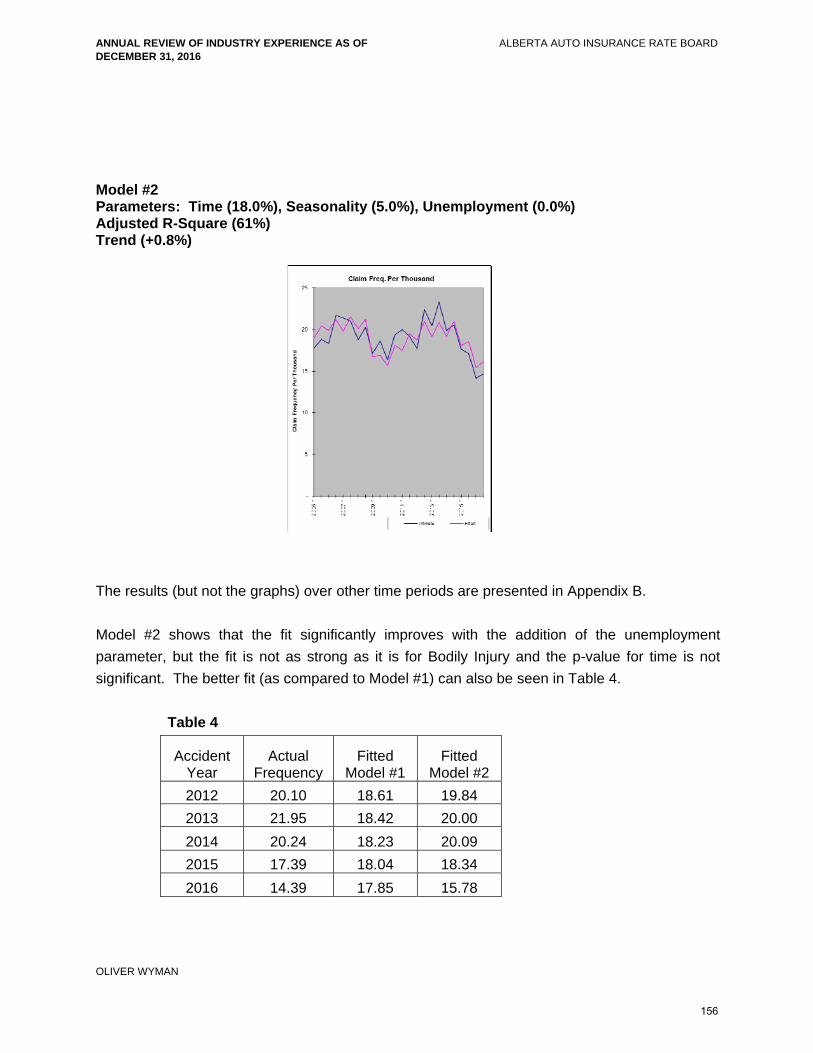
ANNUAL REVIEW OF INDUSTRY EXPERIENCE AS OF DECEMBER 31, 2016
ALBERTA AUTO INSURANCE RATE BOARD
OLIVER WYMAN
Model #2 Parameters: Time (18.0%), Seasonality (5.0%), Unemployment (0.0%) Adjusted R-Square (61%) Trend (+0.8%)
The results (but not the graphs) over other time periods are presented in Appendix B.
Model #2 shows that the fit significantly improves with the addition of the unemployment
parameter, but the fit is not as strong as it is for Bodily Injury and the p-value for time is not
significant. The better fit (as compared to Model #1) can also be seen in Table 4.
Table 4
Accident Year
Actual Frequency
Fitted Model #1
Fitted Model #2
2012 20.10 18.61 19.84
2013 21.95 18.42 20.00
2014 20.24 18.23 20.09
2015 17.39 18.04 18.34
2016 14.39 17.85 15.78
156
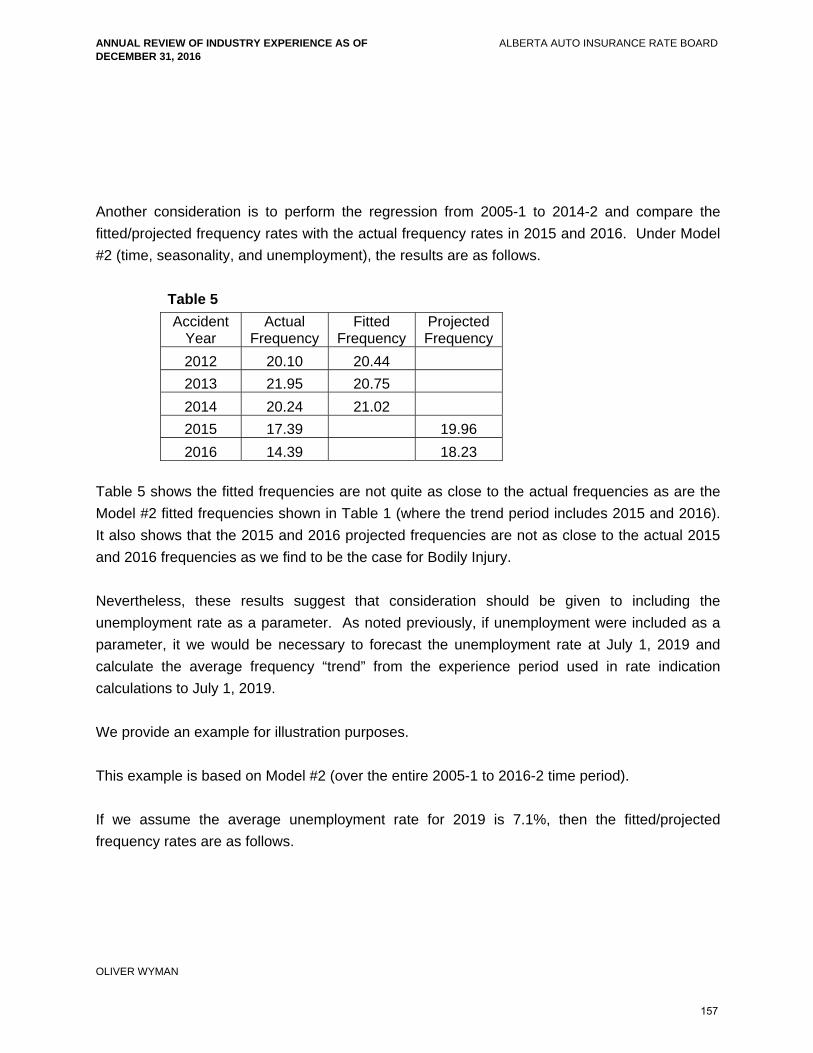
ANNUAL REVIEW OF INDUSTRY EXPERIENCE AS OF DECEMBER 31, 2016
ALBERTA AUTO INSURANCE RATE BOARD
OLIVER WYMAN
Another consideration is to perform the regression from 2005-1 to 2014-2 and compare the
fitted/projected frequency rates with the actual frequency rates in 2015 and 2016. Under Model
#2 (time, seasonality, and unemployment), the results are as follows.
Table 5
Accident Year
Actual Frequency
Fitted Frequency
Projected Frequency
2012 20.10 20.44
2013 21.95 20.75
2014 20.24 21.02
2015 17.39 19.96
2016 14.39 18.23
Table 5 shows the fitted frequencies are not quite as close to the actual frequencies as are the
Model #2 fitted frequencies shown in Table 1 (where the trend period includes 2015 and 2016).
It also shows that the 2015 and 2016 projected frequencies are not as close to the actual 2015
and 2016 frequencies as we find to be the case for Bodily Injury.
Nevertheless, these results suggest that consideration should be given to including the
unemployment rate as a parameter. As noted previously, if unemployment were included as a
parameter, it we would be necessary to forecast the unemployment rate at July 1, 2019 and
calculate the average frequency “trend” from the experience period used in rate indication
calculations to July 1, 2019.
We provide an example for illustration purposes.
This example is based on Model #2 (over the entire 2005-1 to 2016-2 time period).
If we assume the average unemployment rate for 2019 is 7.1%, then the fitted/projected
frequency rates are as follows.
157
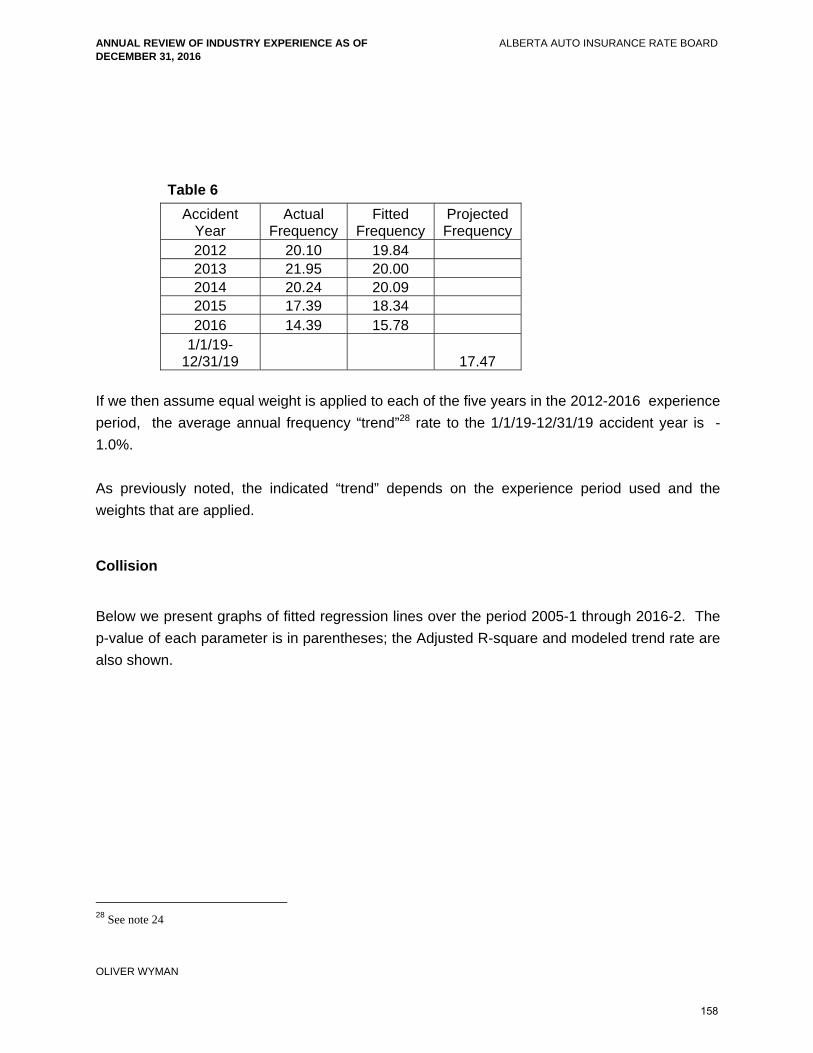
ANNUAL REVIEW OF INDUSTRY EXPERIENCE AS OF DECEMBER 31, 2016
ALBERTA AUTO INSURANCE RATE BOARD
OLIVER WYMAN
Table 6
Accident Year
Actual Frequency
Fitted Frequency
Projected Frequency
2012 20.10 19.84 2013 21.95 20.00 2014 20.24 20.09 2015 17.39 18.34 2016 14.39 15.78
1/1/19-12/31/19 17.47
If we then assume equal weight is applied to each of the five years in the 2012-2016 experience
period, the average annual frequency “trend”28 rate to the 1/1/19-12/31/19 accident year is -
1.0%.
As previously noted, the indicated “trend” depends on the experience period used and the
weights that are applied.
Collision Below we present graphs of fitted regression lines over the period 2005-1 through 2016-2. The
p-value of each parameter is in parentheses; the Adjusted R-square and modeled trend rate are
also shown.
28 See note 24
158
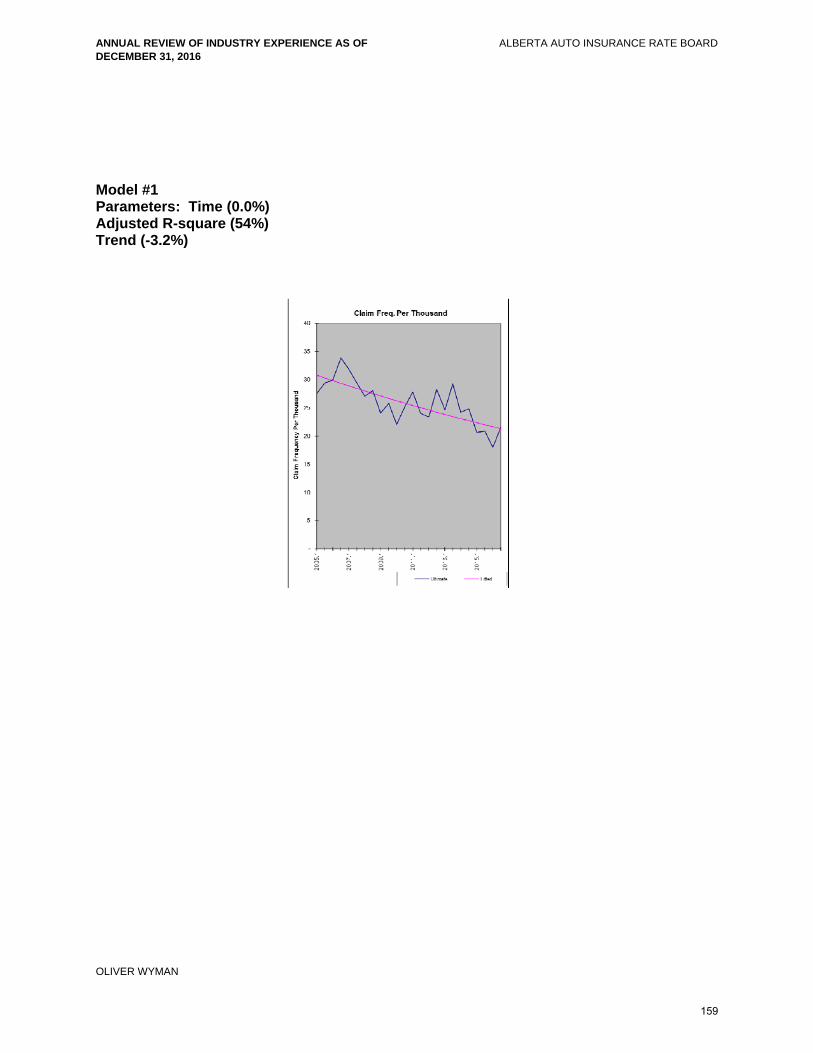
ANNUAL REVIEW OF INDUSTRY EXPERIENCE AS OF DECEMBER 31, 2016
ALBERTA AUTO INSURANCE RATE BOARD
OLIVER WYMAN
Model #1 Parameters: Time (0.0%) Adjusted R-square (54%) Trend (-3.2%)
159

ANNUAL REVIEW OF INDUSTRY EXPERIENCE AS OF DECEMBER 31, 2016
ALBERTA AUTO INSURANCE RATE BOARD
OLIVER WYMAN
Model #2 Parameters: Time (0.3%), Seasonality (3.1%), Unemployment (0.1%) Adjusted R-Square (77%) Trend (-1.8%)
The results (but not the graphs) over other time periods are presented in Appendix B.
Model #2 shows that the fit significantly improves with the addition of the unemployment
parameter. The better fit can also be seen in Table 7.
Table 7
Accident Year
Actual Frequency
Fitted Model #1
Fitted Model #2
2012 25.87 24.43 25.59
2013 27.04 23.66 25.20
2014 24.54 22.91 24.59
2015 20.74 22.19 22.44
2016 19.76 21.49 19.60
160
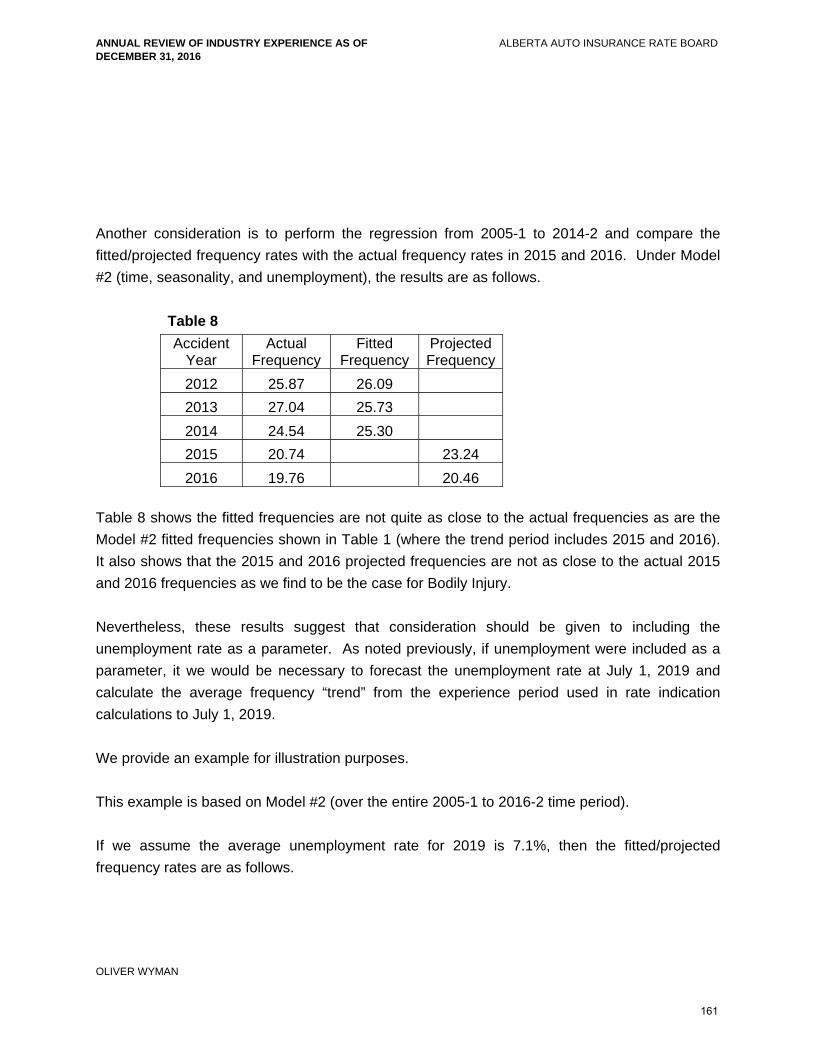
ANNUAL REVIEW OF INDUSTRY EXPERIENCE AS OF DECEMBER 31, 2016
ALBERTA AUTO INSURANCE RATE BOARD
OLIVER WYMAN
Another consideration is to perform the regression from 2005-1 to 2014-2 and compare the
fitted/projected frequency rates with the actual frequency rates in 2015 and 2016. Under Model
#2 (time, seasonality, and unemployment), the results are as follows.
Table 8
Accident Year
Actual Frequency
Fitted Frequency
Projected Frequency
2012 25.87 26.09
2013 27.04 25.73
2014 24.54 25.30
2015 20.74 23.24
2016 19.76 20.46
Table 8 shows the fitted frequencies are not quite as close to the actual frequencies as are the
Model #2 fitted frequencies shown in Table 1 (where the trend period includes 2015 and 2016).
It also shows that the 2015 and 2016 projected frequencies are not as close to the actual 2015
and 2016 frequencies as we find to be the case for Bodily Injury.
Nevertheless, these results suggest that consideration should be given to including the
unemployment rate as a parameter. As noted previously, if unemployment were included as a
parameter, it we would be necessary to forecast the unemployment rate at July 1, 2019 and
calculate the average frequency “trend” from the experience period used in rate indication
calculations to July 1, 2019.
We provide an example for illustration purposes.
This example is based on Model #2 (over the entire 2005-1 to 2016-2 time period).
If we assume the average unemployment rate for 2019 is 7.1%, then the fitted/projected
frequency rates are as follows.
161

ANNUAL REVIEW OF INDUSTRY EXPERIENCE AS OF DECEMBER 31, 2016
ALBERTA AUTO INSURANCE RATE BOARD
OLIVER WYMAN
Table 9
Accident Year
Actual Frequency
Fitted Frequency
Projected Frequency
2012 25.87 25.59 2013 27.04 25.20 2014 24.54 24.59 2015 20.74 22.44
2016 19.76 19.60
1/1/19-12/31/19 19.62
If we then assume equal weight is applied to each of the five years in the 2012-2016 experience
period, the average annual frequency “trend” rate to the 1/1/19-12/31/19 accident year is -
3.1%.
Of course, the indicated “trend” depends on the experience period used and the weights that are
applied.
162
120 Bremner Boulevard Suite 800 Toronto, Ontario M5J 0A8 1 416 868 2200