Embed Size (px)
Citation preview

OLEFINS PRODUCTION
Olefins by steam cracking

2
Content
Importance of ethylene and propylene in the chemical industry
History
Characteristics of steam cracking
Raw materials and products
Steam cracking processes, steam cracking at TVK
Safety aspects
Control systems
Key equipment
Overview of investment and operating costs

3
Importance of ethylene and propylene
in the chemical industry
4
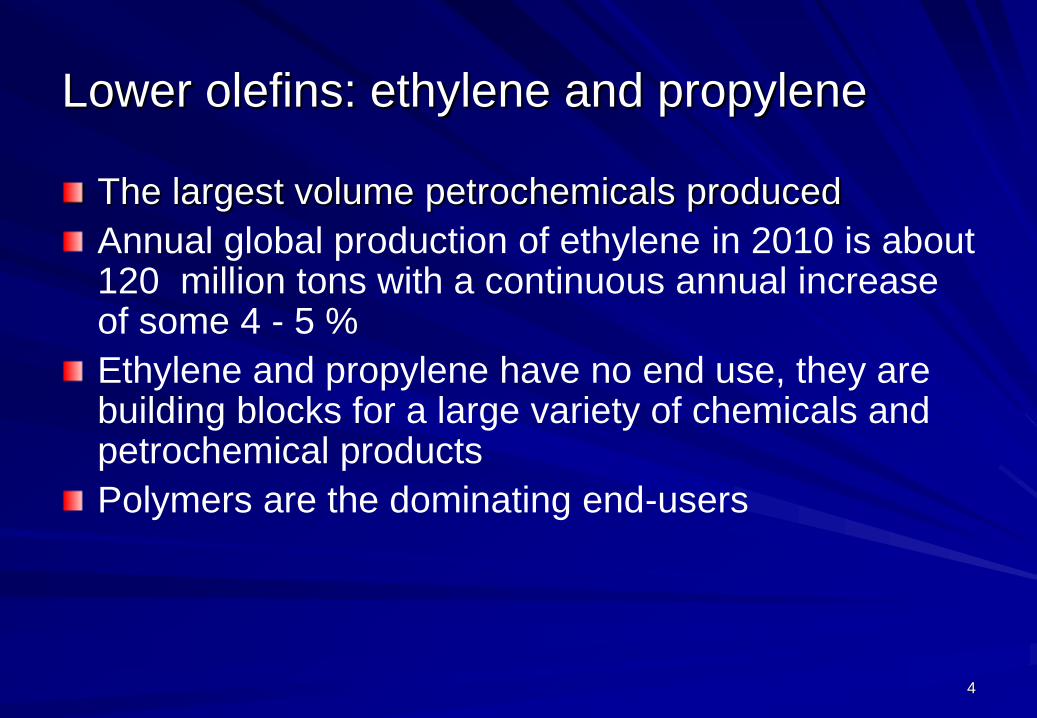
Lower olefins: ethylene and propylene
The largest volume petrochemicals produced
Annual global production of ethylene in 2010 is about 120 million tons with a continuous annual increase of some 4 - 5 %
Ethylene and propylene have no end use, they are building blocks for a large variety of chemicals and petrochemical products
Polymers are the dominating end-users

5
Building block for petrochemicals – ethylene
consumption 2009
PE
61%Ethylene oxide
14%
EDC (PVC)
12%
Styrene
6%
VAM
1%
Others
6%

6
Building block for petrochemicals – propylene
consumption 2009
PP
64%Acrylonitrile
7%
Propylene oxide
7%
Cumene
5%
Acrilic acid
4%
Isopropanol
2%
Others
11%

7
Main drivers for ethylene and propylene
demand: PE and PP

8
Global consumption of ethylene and propylene
0
20
40
60
80
100
120
140
1990
1992
1994
1996
1998
2000
2002
2004
2006
2008
2010
Ethylene
Propylene

9
Hungary: ethylene produced by TVK only
LDPE-265 kt/yr
HDPE-1200 kt/yr
HDPE-2220 kt/yr
PP-3100 kt/yr
PP-4180 kt/yr
OLEFIN-2290 kt/yr
OLEFIN-1370 kt/yr
RAW MATERIALS FROM MOL ETHYLENE TO BORSODCHEM
PROPYLENE TO SPC
FUEL OIL TO CARBON BLACK PRODUCER
CUSTOMERS
CUSTOMERS
CUSTOMERS
BY-PRODUCTS TO MOL
(ISOBUTHYLENE, BT CUT, C8 AND C9 CUT)
(NAPHTHA, LPG AND GAS OIL)

10
History

11
Ethylene milestones
1913: Standard Oil’s scientist patented thermal cracking process
1930ties: Ethylene was first separated from coke oven gas and the first commercial plant for the production of ethylene was built by Linde at that time
1941: Standard Jersey (ExxonMobil’s predecessor) developed the world’s first steam cracker at Baton Rouge
1950ties: Ethylene emerged as a large-volume intermediate, replacing acetylene as prime material for synthesis
Today ethylene is primarily produced by thermal cracking of hydrocarbons in the presence of steam. Plant capacities are up to 1-1,5 million t/yr ethylene.
Other processes are also available or under development

12
Olefin production by processes, 2008
0
20
40
60
80
100
120
ethylene propylene
mill
ion
t
steam cracking refinery operation others

13
Ethylene at TVK
1975: First steam cracker with Linde process
started operation
– Original nameplate capacity: 250 kt/yr ethylene
– After several debottlenecking nowadays the actual
capacity is 370 kt/yr
2004: Second cracker (also Linde process) with
250 kt/yr capacity was commissioned
– Today the capacity is 290 kt/yr

14
Present and future processes to ethylene and
propylene production Steam cracking dominating technology
Refinery processes minor importance for ethylene
important for propylene only
MTO Methanol to Ethylene and Propylene technology is ready but
not yet commercialized
MTP Methanol selectively to Propylene commercialisation phase
Syngas via Fisher Tropsch minor importance
Green Ethylene
- Biomass via Fermentation to Ethanol
and Dehydration of Ethanol
- Biomass > Syngas > Fischer Tropsch
commercialisation phase
study phase

15
Characteristics of steam cracking

16
What is steam cracking?
Steam cracking is a pyrolysis process
A hydrocarbon mixture is heated in metal tubes inside a furnace in the presence of steam to a temperature at which the hydrocarbon molecules thermally decomposes
For ethane the primary reaction is dehydrogenation C2H6 → H2C=CH2 + H2
Other free radical reactions also occur – Cracking and dehydrogenation of longer molecules resulting in
hydrogen, methane, ethylene, propylene, butadiene and heavier
– Continued dehydrogenation to form acetylene, aromatics and coke
These reactions require a residence time of less than one second and are endothermic

17
Principle of the cracking process

18
Key words for cracking
Yield Product/Feed
Cracking severity
–Propylene/Ethylene ratio
(used for liquid feed)
Depth of cracking e.g. P/E=0,45 T~ 850 C; P/E=0,60 T~ 810 C
–Conversion
(used for gas feeds)
Conversion rate of feed component
e.g. 60-70 % for ethane
Dilution steam ratio Steam/HC feed e.g. 0,5 kg/kg for naphtha
Residence time Residence time of one molecule in the
cracking coil e.g. 0,1 – 0,5 sec
Run time Time between two decokings e.g. 50 – 80 days

19
Cracking conditions
Residence time 0,1 – 0,5 sec – Short residence time favours primary reactions where olefins are formed
– Long residence time favours secondary reactions where olefins are destroyed
Pressure 2 – 3 bar – High pressure favours secondary reactions
– Low pressure favours primary reactions
Dilution steam 0,3 – 0,8 kg/kg – Reduces partial pressure of HC
– Suppresses secondary reactions
– Prevents excessive coke formation
– Heavier feedstock needs more steam
Temperature 800 – 850 C – High temperature promotes the formation of lower olefins, low temperatures
favour oligomerization
– Fast temperature rise favours ethylene and propylene
– The heavier the feed the lower the temperature – coke formation!

20
Severity vs. product yield
Yields for naphtha feed
0
5
10
15
20
25
30
35
40
Ethylene Propylene Hydrogen Fuel gas C4 Gasoline Oil
%
0,4
0,5
0,6
P/E

21
Raw materials and products

22
Wide range of feedstocks
Gaseous feeds
– Ethane
– Propane
– N-butane/i-butane
Liquid feeds
– Condensates from natural gas
– Naphtha
– Atmospheric gas oil (AGO)
– Hydrocracker residue (HCR), hydrogenated vacuum gas
oil (HVGO)

23
Liquid feeds Main components
– Paraffins
– Naphthenes
– Olefins and aromatics (associated components in heavy feedstocks)
0,00
0,50
1,00
1,50
2,00
2,50
3,00
3,50
0 5 10 15 20 25 30 35 40
H/C
mo
le r
ati
o
Carbon number
Aromatics
Paraffins
NaphthaAGO
VGOResidue
HCRHVGO
Ethylene&
Propylene

24
Cracked gas composition vs. feedstock
Ethane Propane n-c4/i-c4 Naphtha AGO
H2 + CO 4.06 1.70 1.23 1.03 0.71
CH4 3.67 23.37 21.75 15.35 10.69
C2H2 0.50 0.67 0.50 0.69 0.34
C2H4 52,45 39.65 31.74 31.02 24.85
C2H6 34.76 4.57 3.67 3.42 2.75
C3H6 + C3H4 1.15 13.28 19.85 16.21 14.28
C3H8 0.12 7.42 0.69 0.38 0.31
C4 2.24 4.03 12.90 9.54 9.61
Pyrolysis Gasoline 0.87 4.27 6.41 19.33 20.6
Pyrolysis Fuel Oil 0.16 1.11 1.26 3.01 15.78
wt %

25
Ethylene yield vs paraffin content
26
27
28
29
30
31
32
34 36 38 40 42
a v.benzin n-paraffin tartalma, s%
etil
énh
oza
m,
s%
etilénhozam - elméleti etilénhozam - gyakorlatban mért
vegyipari benzin n-paraffin tartalom, %
eti
lén
ho
zam
, %
szá
mít
ott
mért

26
Considerations for feedstocks
Paraffins are the best raw materials
Lower carbon number gives higher ethylene yield
Cracking severity influences product yield
Steam crackers are mostly integrated into refineries
therefore
– both gaseous and liquid feeds are used,
– profitability is very complex issue and evaluated together
with refinery operation

27
Main and byproducts
Hydrogen
Fuel gas
Ethylene
Propylene
C4
Gasoline
Oil
Recovery
sectionPyrolysis
section
Feedstock
Steam
Crack gas

28
Steam cracking processes
Steam cracking at TVK

29
Process design considerations
Ethylene process is one of most complex systems in petrochemical industry. The following challenges have to be faced:
– Safety first
– High energy efficiency and minimum environmental emissions
– Low production costs and low investment costs
– High plant reliability
– Simple operation
– Good maintainability
– Minimum losses

30
Olefins production block diagram

31
Material and energy streams at TVK
Olefin-2
Ethane (repyrolysis)
Propane (repyrolysis)
C4/C5 (repyrolysis)
Naphtha
Gasoil
LPG (propane, butane)
Olefin-2
Methane (to fuel gas)
Steam
Electric power
Natural gas
Hydrogen
BT fraction
C8 fraction
C9+fraction
Quench oil
TIFO
MOL
MOL
MOL
CTK
Ethylene
Propylene
PE production
PP production

32
Tasks of a cracking furnace
Production of ethylene and propylene by
endothermic cracking reaction
Preheating of feed and dilution steam by utilization of
waste heat
Cooling of the cracked gas to freeze chemical
reactions
Production of superheated HP steam by utilization of
waste heat

33
Cracking furnaces
Radiant section: thermal cracking reactions (800 – 850 °C)
Convection section: heat recovery from hot flue gas
– Feed preheating
– Boiler feed water preheating
– Process steam superheating
– HHP steam superheating
Linear quench exchanger
– Freezing cracking reactions in order to avoid product losses by secondary reactions (400 - 600 °C)
– Heat recovery -> HHP steam production
Olefin-1 and Olefin-2 represent two generations
– O-1: 11 furnaces
– O-2: 4 furnaces

34
Cracking furnace in Olefin-2
Radiant coils
Quench exchangers
Convection section
Side-wall burners
Floor burners

35
Tube arrangement in the radiant zone
(Olefin-2)

36
Oil and water quench
Further cracked gas cooling by direct oil injection downstream the quench coolers (220 - 250 °C)
Oil Fractionation (primary fractionation) and Quench Oil Cycles Two quench oil cycles (Pyrolysis Fuel Oil and Pyrolysis Gas Oil) are
used as heat carrier to cool the cracked gas (~100 °C) and to shift the recovered heat to consumers
Both quench oil cycles are formed by condensing the heavy ends of the cracked gas
Process steam generation by hot quench oil
Water Scrubbing (Water quench column) Cracked gas is cooled by water circulation to ambient (~30 °C)
temperature to condense heavy gasoline and process (dilution) steam
Circulating water is withdrawn from the bottom of the column and pumped to several consumers for low temperature heat recovery

37
Hot section: Oil fractionating and water
quench column in O-2
38
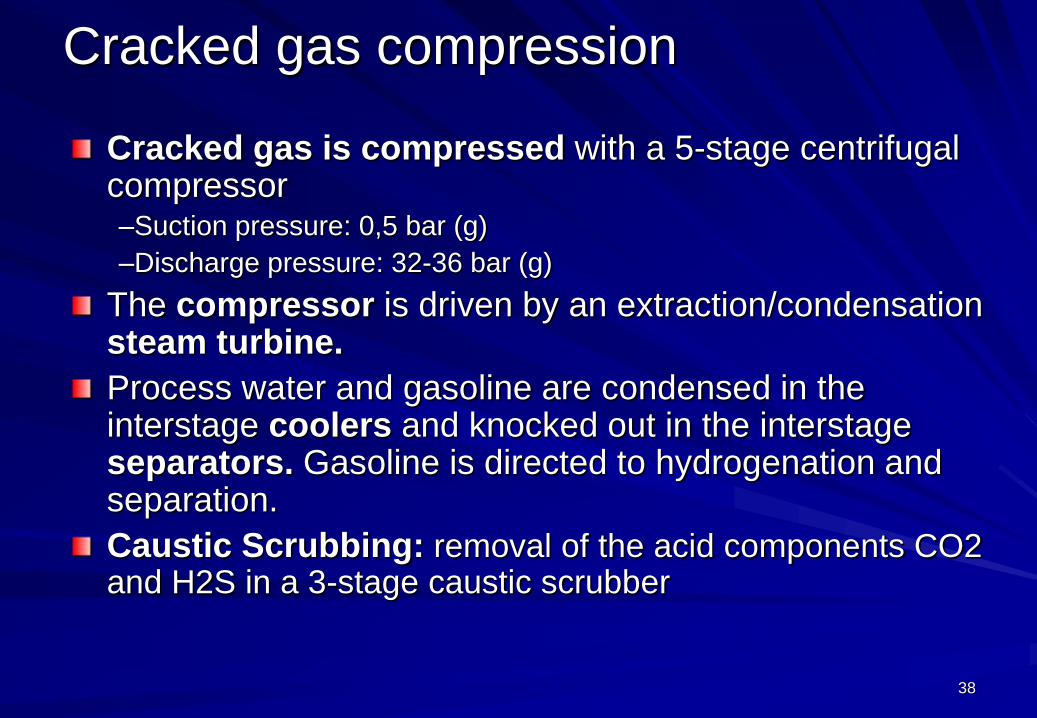
Cracked gas compression
Cracked gas is compressed with a 5-stage centrifugal compressor –Suction pressure: 0,5 bar (g)
–Discharge pressure: 32-36 bar (g)
The compressor is driven by an extraction/condensation steam turbine.
Process water and gasoline are condensed in the interstage coolers and knocked out in the interstage separators. Gasoline is directed to hydrogenation and separation.
Caustic Scrubbing: removal of the acid components CO2 and H2S in a 3-stage caustic scrubber
39
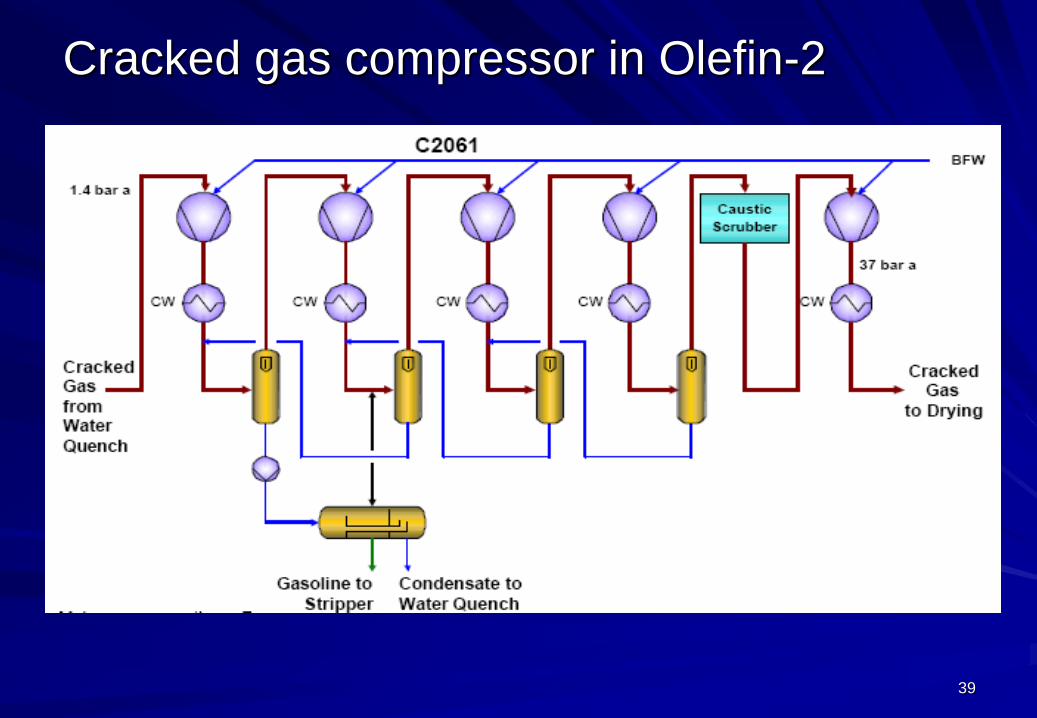
Cracked gas compressor in Olefin-2

40
Cold section block diagram

41
Cold section 1
Precooling, drying, deethanizer – Cracked gas cooling to drying temperature
– Cracked gas drying to eliminate water content
– Cooling to -40 °C (cooling with propylene refrigerant and cold streams from the low temperature section)
– Separation of C2- and C3+ fraction (deethanizer)
C3+ processing – C3/C4+ separation (depropanizer)
– C3 hydrogenation: conversion of methyl-acetylene and propadiene to propylene and propane
– C3H6/C3H8 separation: propylene product, propane recycle
– C4/C5 separation

42
Cold section 2
C2 hydrogenation
– Acetylene is selectively hydrogenated to ethylene
– Max. 1 ppm acetylene downstream the catalytic reactor
Low temperature section (cold train)
– C2- fraction is cooled with ethylene refrigerant and expanded cold
streams (-145 C)
– Separation of C2 from C1 and hydrogen from methane: ethylene,
ethane, and almost all methane is condensed, the remaining gas
consists of a hydrogen-rich fraction
C2 splitter
– To separate ethylene (top product) and ethane (recycled to feed)

43
Safety aspects

44
About safety
Safety first concept has to be applied for a plant
during
– design,
– construction and
– operation
in line with the industrial standards and norms
Safety is expensive – there is nothing for free

45
Major risk factors in olefin plants
High volume of highly flammable hydrocarbon
gases and liquids
Extremely high and low temperatures
High pressure
Corrosion
Complexity of operation

46
Plant safety: based on risk evaluation
Risk consideration
Risk matrix
Consequence
Fre
qu
en
cy
low
medium
high
Frequency of
hazardous events
Consequence of
hazardous events
Process risk

47
Risk reduction
Levels of risk reduction measures
Emergency ResponseEmergency Response Plan
Fire Brigade/First Aid
MitigationMechanical System
(e.g. safety valves, blow-down system)
Safety Instrumented System
PreventionInherent Design
Mechanical System
Safety Instrumented System
Operating Instruction
Control and MonitoringBasic Process Control System
Monitoring System (process alarms)
ProcessOperating condition
Normal Operation
Start-up/Shut-down
Process variation
Process upsetfrequent with minor consequences
failure of control system, utility system, simple
operating failure
Failureseldom with serious consequences
failure of control system, failure of plant
components, severe operating failures
Incidentremote with very serious consequences
failure of safety system

48
Example for risk reduction: selection of
construction materials
Suitable material is not subject to unexpected material related failures during the calculated plant lifetime under nominal operation conditions
Calculated plant lifetime: ~15-20 Years
Nominal operation conditions: – Specified cases of operation
– Design pressure and temperatures, fluid composition, flow velocity as specified
– Start up
– Shut down
– Site condition

49
Example for risk reduction: fire and
explosion protection
Proper selection of mechanical equipment to avoid leakages
Explosion proof electric equipment and instrumentation
Gas detection systems
Steam curtains (e.g. for the furnaces)
Closed blow-down system
Safety distances between plant section
Fire proofing insulation
Fire water systems including hydrants and monitors
Water spray systems

50
Control systems

51
The automation pyramid of a company
ERP
P&S
Supervision,
Control,
Data Acquisition,
Advance Control,
Process control, PLC, PID, APC,
Safety instrumentation, etc.
Sensors, Actuators, Switchgears, etc. Field level
Controller level
Operator level
Management level

52
Plant control systems

53
Key equipment

54
Main groups of equipment
Furnaces
Static equipment – Columns, reactors and other pressure vessels
– Heat exchangers
– Storage tanks
Rotating equipment – Turbo machineries
Turbo compressors
Steam turbines
– Reciprocating compressors
– Pumps

55
Turbo compressors in O-2 plant
Crack gas compressor
– Duty: 13,5 MW
– Drive: steam turbine
Ethylene compressor
– Duty: 6,5 MW
– Drive: steam turbine
Propylene compressor
– Duty: 4,5 MW
– Drive: steam turbine

56
Crack gas compressor O-2 plant
1st stage
0,3→1,5 bar
2nd and 3rd stage
1,35→9,3 bar
4th and 5th stage
9,0→36 bar

57
Crack gas compressor O-2 plant

58
Crack gas compressor LP section

59
Steam turbine

60
Turbine driven BFW pump

61
Multistage BFW pump

62
Overview of investment and operating
costs

63
Investment costs Basis: WE 2010 Q1 Capacity: 800 kt
million EUR
ISBL 704
OSBL 352
Other project cost 400
Total investment 1 456
EUR/t Ethylene
Specific cost 1820

64
Ethylene production cost Basis: WE 2010 Q1/Q2 Capacity: 800 kt
PRODUCTION COST SUMMARY Quantity Units 2010 Q1 2010 Q2
(per ton)
Naphtha 3,230 ton 1 651,1 1 755,0
Catalyst & Chemicals 3,6 4,0
Total Raw Materials Costs 1 655 1 759,0
Fuel 0,587 ton 195,1
High Pressure Steam (40 bar) 0,750 ton 24,1
Cooling Water 0,454 kton 14,0
Electricity 0,084 MWh 5,9
Other (Utility) 0,145 - 0,3
Total Utility Costs 239 259,0
Propylene (0,516) ton ( 427,5) (496,0)
Fuel (FOE) (0,813) ton ( 270,2) (293,0)
Benzene (0,239) ton ( 172,9) (201,0)
C7 - C9 cut (0,267) ton ( 139,6) (154,0)
Butadiene (0,148) ton ( 137,4) (186,0)
Other (0,391) ton ( 214,9) (227,0)
Total Co-Products ( 1 363) (1 557,0)
Total Variable Costs 531 461,0
Total Direct Fixed Costs 38,8 38,0
Total Allocated Fixed Costs 31,8 31,0
Total Cash Cost 602 530,0
(€/ton)
0%
20%
40%
60%
80%
100%
Raw material less coproduct Total utility costs
Total direct f ix costs Total allocated f ix costs
2010 Q22010 Q1