Embed Size (px)
Citation preview

OLDER STUDENTS AND THE
GRE APTITUDE TEST
Terry Hartle Joan Baratz
Mary Jo Clark
GRE Board Research Report GREB No. 76-1313 ETS Research Report 83-20
June 1983
This report presents the findings of a research project funded by and carried out under the auspices of the Graduate Record Examinations Board.
EDUCATIONAL TESTING SERVICE, PRINCETON, NJ
GRE BOARD RESEARCH REPORTS FOR GENERAL AUDIENCE
Altman, R. A. and Wallmark, M. M. A Summary of Data from the Graduate Programs and Admissions Manual. 74-lR, 1975.
Baird, L. L. An Examination of the Graduate Study Application and Enrollment Decisions of GRE Candidates. 79-llR, 1982.
Baird, L. L. plishments.
An Inventory 77-3R, 1979.
of Documented Accom-
Baird, L. L. Cooperative Student Survey (The Graduates [$2.50 each], and Careers and Curricula). 70-4R, 1973.
Baird, L. L. The Relationship Between Ratings of Graduate Departments and Faculty Publication Rates. 77-2aR, 1980.
Baird, L. L. and Knapp, J. E. The Inventory of Documented Accomplishments for Graduate Admis- sions: Results of a Field Trial Study of Its Reliability, Short-Term Correlates, and Evaluation. 78-3~, 1981.
Burns, R. L. Graduate Admissions and Fellowship Selection Policies and Procedures (Part I and II>. 69-5R, 1970.
Centra, J. A. How Universities Evaluate Faculty Performance: A Survey of Department Heads. 75-5bR, 1977. ($1.50 each)
Centra, J. A. Women, Men and the Doctorate. 71-lOR, 1974. ($3.50 each)
Clark, M. J. The Assessment of Quality in Ph.D. Programs: A Preliminary Report on Judgments by Graduate Deans. 72-7aR, 1974.
Clark, M. J. Program Review Practices of University Departments. 75-5aR, 1977. ($1.00 each)
Clark, M. J and Centra, J. A. Conditions Influencing the Career Accomplishments of Ph.Ds. 76-2R, 1982.
Donlon, T. F. Annotated Bibliography of Test Speededness. 76-9R, 1979.
Knapp, J. and Hamilton, I. B. The Effect of Nonstandard Undergraduate Assessment and Reporting Practices on the Graduate School Admissions Process. 76-14R, 1978.
Lannholm, G. V. and Parry, M. E. Programs for Disadvantaged Students in Graduate Schools. 69-lR, 1970.
Miller, R. and Wild, C. L. Restructuring the Graduate Record Examinations Aptitude Test. GRE Board Technical Report, 1979.
Powers, D. E. and Lehman, J. GRE Candidates' Perceptions of the Importance of Graduate Admission Factors. 81-2R, 1982.
Powers, D. E. and Swinton, S. S. Effects of Self-Study of Test Familiarization Materials for the Analytical Section of the GRE Aptitude Test. 79-9R, 1982.
Reilly, R . R. critic al Inc Student Performance. 70-5R,
i dents 1974.
of Graduate
Rock, D. and Werts, C. An Analysis of Time Related Score Increments and/or Decrements for GRE Repeaters across Ability and Sex Groups. 77-9R, 1979.
Rock, D. A. The Prediction of Doctorate Attainment in Psychology, Mathematics and Chemistry. 69-6aR, 1974.
Schrader, W. B. Admissions Test Scores as Predictors of Career Achievement in Psychology. 76-laR, 1978.
Schrader, W. B GRE Scores as Predictors Achievement in History. 76-lbR, 1980.
of Career
Swinton, S. S. and Powers, D. E. A Study of the Effects of Special Preparation on GRE Analytical Scores and Item Types. 78-2R, 1982.
Wild, C. L., Swinton, S. S., and Wallmark, M. M. A Summary of the Research Leading to the Revision of the Format of the Graduate Record Examina- tions Aptitude Test in October 1981. 80-laR, 1982.
Flaugher, R. L. The New Definitions of Test Wild, C. L. Summary of Research on Restructuring Fairness In Selection: Developments and the Graduate Record Examinations Aptitude Test. Implications. 72-4R, 1974. 1979.
Fortna, R. 0. Annotated Bibli ography of the Graduate Record Examinations. 1 979.
Frederiksen, N. and Ward, W. C. Measures for the Study of Creativity in Scientific Problem- Solving. 1978.
Hartnett, R. T. Sex Differences in the Environ- ments of Graduate Students and Faculty. 77-2bR, 1981.
rtnett, R. T. The Information Needs of Prospective Graduate Students. 77-8R, 1979.
Hartnett, R. T. and Willingham, W. W. The Criterion Problem: What Measure of Success in Graduate Education? 77-48, 1979.
Wild, C. L. and Durso, R. Effect of Increased Test-Taking Time on Test Scores by Ethnic Group, Age, and Sex. 76-6~, 1979.
Wilson, K. M. A Study of the Validity of the Restructured GRE Aptitude Test for Predicting First-Year Performance in Graduate Study. 78-6~, 1982.
Wilson, K. M. The GRE Cooperative Validity Studies Project. 75-8R, 1979.
Wiltsey, R. G. Doctoral Use of Foreign Languages: A Survey. 70-14R, 1972. (Highlights $1.00, Part I $2.00, Part II $1.50).
Witkin, H. A.; Moore, C. A.; Oltman, P. K.; Goodenough, D. R.; Friedman, F.; and Owen, D. R. A Longitudinal Study of the Role of Cognitive Styles in Academic Evolution During the College Years. 76-lOR, 1977 ($5.00 each).

Older Students and the GRE Aptitude Test
Terry Hartle Joan Baratz Mary Jo Clark
GRE Board Research Report GREB No. 76013R
June 1983
Copyright@1983 by Educational Testing Service. All rights reserved.
Abstract
This report reviews background and test performance data on one large segment of potential graduate school applicants--GRE test takers who were 30 years of age or older and test takers who had received their bachelor's degrees more than eight years earlier, It also provides a brief review of literature on the relationship of age and learning ability.
Older Students and the GRE Aptitude Test
The expansion that was the most prominent feature of graduate education in the United States in the last 20 years has drastically decelerated. Reductions in support of basic research, less financial support for graduate students, and other institutional financial problems have combined to cloud the future of graduate research and education. Despite these problems of finance, however, graduate enrollments have continued to rise (CGS/GRE Board, 1978). Part of this growth is caused by a tight job market that induces some students to return to or remain in school; the desire for better jobs or promotions encourages other students to undertake part-time graduate studies. The dissolution of some of the social barriers that have limited the participation of women and minorities also enhances graduate school enrollments.
Many of these conditions associated with increasing graduate enrollments also indicate a more diverse graduate student body--more persons who are changing fields, who are returning to study after several years of employment or homemaking, or who are upgrading professional skills. Many of these "returning" students are in business, social work, education, or other fields that encourage a period of employment prior to graduate study or that design programs specifically for the advancement of professionals already in the field. Older students, and students who have been away from formal study for a period of time, are no novelty in such programs. Other delayed or returning students, however, choose to pursue more traditional academic goals, such as a master's or doctor's degree in chemistry or psychology or English literature, and these students differ from younger applicants only in age or the recency of previous academic enrollment.
These older applicants for admission to graduate school sometimes pose a problem for admissions committees. Questions frequently asked include: How should the undergraduate record of an older applicant be evaluated relative to the records of more recent graduates? What is the effect of grade inflation? Will older students be able to learn as quickly or easily as their younger classmates? Are scores on tests of academic aptitude useful predictors of performance in graduate study when the person has been away from school for several years? Should one expect aptitude test scores to decline with increasing age? These questions are most likely to arise in relation to the application of an older person for admission to a traditional academic graduate program, where there is no relevant experience in the field to offset years away from academic study. Few such graduate programs have sought answers to such questions, however , probably because of the relatively small number of older men and women who have applied for admission to most traditional academic degree programs.

-2-
The project reported here was undertaken by the GRE Board in response to such questions. It is an effort to learn more about older graduate school applicants, particularly about their academic interests and abilities, by examining their performance on the GRE Aptitude Test and the information the applicants supplied voluntarily when they registered to take the test.
Number of Older Students in Graduate Study
Several years ago the Carnegie Commission on Higher Education and the American Council on Education surveyed a representative sample of graduate students in American colleges and universities, reporting a normative description appropriately weighted to represent the population of graduate students (Creager, 1971). Their results included students who had been enrolled in graduate study for several years as well as those recently enrolled; nevertheless, the ages reported by respondents help us gain some appreciation for the number of older graduate students even in the early 1970's.
Table 1 summarizes the results of Creager's survey. Clearly, the largest number as well as the greatest percentage of older students are in education; 22 percent of the graduate students in education, or about 49,000 students, reported that they were at least 40 years old. Also, the fairly high proportions of older students who come from business and health fields are not surprising, since many of the graduate programs in these fields tend, like education, to build on the practical experience of students and to encourage periodic returning to study throughout one's professional career. Similarly, relatively small proportions of older students in the biosciences, mathematics, the physical sciences, and law are consistent with the tradition of early graduate study for most of those who aspire to advanced degrees and professional employment in these fields.
Somewhat more surprising, however, are the ages reported by graduate students in the arts and humanities and the social sciences, where 12.4 percent and 9.9 percent respectively were at least 40 years old. Such proportions represent about 19,000 students in the arts and humanities and more than 11,000 students in the social sciences. No doubt these numbers include some “perpetual students" who are attempting to complete long-overdue degree requirements. In addition, the data are 10 years old. Taking both of these limitations into consideration, however, the number of American graduate students beyond the "traditional" ages of 22 to 30 appears to be sizable in certain research-oriented as well as practice-oriented fields.

-3-
Table 1
The Ages of American Graduate Students in 1969
Department of Graduate Study
Total Percentage Percentage Weighted Age 30 Age 40
Number or more or more
Biosciences 54,727
Business 81,440
Education 222,885
Engineering 79,981
Arts and Humanities 152,987
Mathematics and Physical Sciences 81,031
Social Sciences 113,663
Health Fields 16,846
Law 43,955
18.4
37.6
53.0
31.8
32.9
19.4 3.5
30.5 9.9
38.7 15.1
10.6 2.0
3.9
10.5
22.0
4.4
12.4
Note. Adapted from Creager, 1971, Tables 2 and 10.

There is no easy way to learn about the number and character- istics of all the men and women who apply for admission to graduate study in any given year. However, one large segment of this group undoubtedly consists of those who elect to take the GRE Aptitude Test. At the least, the test takers must think that they will possibly apply for admission to one or more of the graduate programs that require or recommend GRE scores as part of the admissions procedure. We do not know how many actually complete an application for admission or the number who finally enroll. We do, however, know the ages of the test takers, their anticipated graduate fields of study, and the years in which they earned their undergraduate degrees. Though limited to GRE test takers, and therefore only one part of the total graduate applicant population, the characteristics of test takers of various ages would appear to provide more information about older applicants to graduate school than is currently available from any other source. In addition, the data should provide an improved frame of reference for interpreting the GRE verbal and quantitative ability scores that are submitted to graduate schools by applicants of various ages.
This report focuses on the characteristics of the 234,796 men and women who took the GRE Aptitude Test at one of the six regularly scheduled national administrations during 1975-76 and who voluntarily answered at least one of the "background questions" when they registered for the test. A general summary of responses to these background questions is available in another publication of the GRE Board (Altman & Holland, 1977), whereas this report considers only selected questions in relation to the ages of the test takers. A copy of the background questions is included in this report as Appendix A.
Characteristics of GRE Test Takers by Age
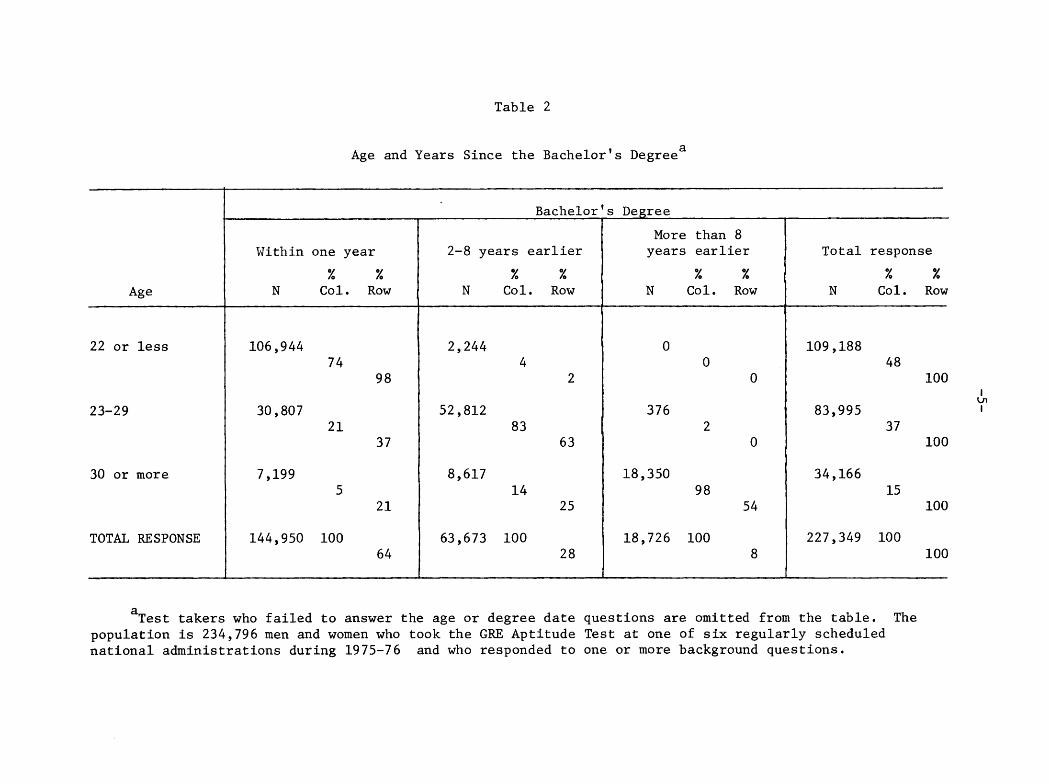
Only about half of those who took the GRE Aptitude Test in 1975-76 were 22 years of age or younger, the usual age of college graduation. Though there was a steady decline in the number of test takers at each year of age beyond 22, more than 34,000 of the test takers (about 15%) were 30 or older; more than 2,500 (about 1%) were 50 or older. About two-thirds of the test takers had not yet completed their undergraduate studies or had received their degrees in the previous spring. Almost all of those age 22 or less were in this group; but this group also included more than 7,000 person8 age 30 or more. In contrast, almost all of the 19,000 men and women who took the test more than eight years after receiving their bachelor's degrees (about 8% of the total) were over 30. These divisions--age 22 or less, 23-29, 30 or more, and more than eight years after the bachelor's degree --appeared to provide reasonable contrasts between "younger" and "older" potential applicants to graduate school and were adopted as analytic categories for this report. A cross tabulation of cases in categori es related to age and years since the bachelor's degree is present ed in Table 2.
Age
22 or less
23-29
30 or more
TOTAL RESPONSE
Table 2
Age and Years Since the Bachelor's Degreea
Bachelor's Degree
Within one year 2-8 years earlier
% % % % N Cal. Row I N Cal. Row
106,944 2,244 0 74 4 0
98 2 0
30,807 52,812 21 83
37 63
7,199 8,617 5 14
21 25
144,950 100 63,673 100 64 28
More than 8 years earlier
% % N Cal. Row
376 2
0
18,350 98
54
18,726 100 8
Total response
% % N Cal. Row
109,188 48
83,995 37
34,166 15
227,349 100
100
& I
100
100
100
aTest takers who failed to answer the age or degree date questions are omitted from the table. The population is 234,796 men and women who took the GRE Aptitude Test at one of six regularly scheduled national administrations during 1975-76 and who responded to one or more background questions.

The test takers who were 30 years old or older are of particular interest in this report. Table 2 indicates that only slightly more than half of them earned undergraduate degrees more than eight years earlier. These might be termed the "returning" students-- the men and women considering graduate study several years after completing their undergraduate studies. The others in the 30-and-over group completed their bachelor's degrees more recently, or were still enrolled as undergraduates when they took the GRE Aptitude Test. Their condition might be termed "delayed," since they were beyond the usual age of about 22 when completing the baccalaureate, but were like the younger test takers in their plans to move fairly quickly from undergraduate to graduate study.
Though the "older" categories in this report are labeled "age 30 or more," and "bachelor's degree more than eight years earlier," it should be emphasized that many of the test-takers in these groups were much older and much farther removed from their undergraduate studies than is suggested by the numbers in the labels. Figure 1 shows the distribution of ages and years since degree for the test takers in these categories. More than a quarter of the 30-or-more group were 42 or older; almost 40 percent of the prospective "returning" students reported more than 15 years since earning their bachelor's degrees, and 20 per- cent reported having finished their undergraduate studies more than 20 years earlier. Because there were some persons in each group who were beyond the usual age of college graduation, there are larger percentages of older students than of returning students at all but the first age/time periods in Figure 1.
Since the background questions (see Appendix A) did not ask about the nonacademic activities of respondents, we can only speculate about the life experiences of test takers in either the "returning" or "delayed" category. Clearly, these people made decisions about higher education that were different from the decisions made by test takers who were 22 or younger, such as deciding to postpone undergraduate degrees, to take time out from studies to raise a family, or to work for a period of time before entering graduate school. Such intervening experiences as these may have contributed to some decay in the skills being measured by the GRE tests of developed verbal and quantitative abilities. On the other hand, we know that some of the test takers had been taking graduate courses, and we can assume that some had been working in positions that should improve their ability to deal with the test materials. Unfortunately, the details of such activities are not available to us. Instead, we are limited to a less satisfying but more manageable question: In what ways are these "returning" or "delayed" older test takers similar to or different from the younger test takers? Table 3 summarizes the comparisons that can be made from information supplied on the background questionnaires.

-7-
Years since degree
9-10 11-15 16-20 21-25 26 or more
Figure 1. Distribution of test takers age 30 or more and more than eight years after receiving the bachelor's degree. (Adapted from Altman & Holland, 1977, Tables 7 and 11.)

Table 3
Comparisons of Age Groups
(in percentages)a
Age Bachelor's 22 or 30 or more than 8 less 23-29 more years earlier
Bachelor's degree: within one year 2-8 years earlier more than 8 years earlier
Type of undergraduate institution: Public Private
Gender: Male Female
Ethnic identification: b
AmericanIndian Black Mexican American Oriental Puerto Rican Other Hispanic White Other and NA
Degree Objective: Nondegree study Master's Intermediate Doctorate Postdoctorate
Previous graduate study: No Yes, half-time or more
98% 37% 21% 2 63 25 0 0 54
__ me
100 %
59 73 68 64 41 27 32 36
48 55 45 41 52 45 55 59
0.3 0.5 0.7 0.5 5.7 5.7 9.4 9.7 0.8 1.7 2.0 1.3 1.5 1.0 1.0 1.2 0.6 0.6 0.6 0.5 0.4 0.5 0.6 0.3
84.3 84.1 80.6 81.6 6.5 5.9 5.3 4.8
1 1 1 1 57 65 65 62
2 2 3 4 36 29 30 32
4 3 1 1
94 67 47 36 6 33 53 64
(continued on next page)

-9-
Table 3 (cont'd.)
Age Bachelor's 22 or 30 or more than 8 less 23-29 more years earlier
Intended graduate major field:' Chemistry English History Psychology
Education 5.5 11.2 16.4 19.6 Guidance/Counseling 1.7 3.1 4.0 4.4 Education Administration 0.5 2.1 6.3 8.5
Business/Commerce 2.0 2.0 2.4 2.1 Public Administration 1.3 1.8 2.5 2.1 Social work 2.1 1.9 1.6 1.4 Nursing 1.1 2.5 3.1 2.5 Library Science 1.5 2.1 2.8 3.4
Undecided
1.8% 0.8% 0.3% 0.3%
2.5 2.4 2.0 1.8 2.0 1.6 1.2 0.9 7.4 5.8 4.7 3.3
6.6 3.4 2.5 2.0
aPercentages are based on the number of persons who answered the relevant set of questions and who took the GRE Aptitude Test between September 1975 and June 1976. Total base N's range from 232,920 for age and sex to 213,245 for U.S. citizens by age and ethnicity. See the marginals in Table 2 for the maximum number of test takers in each category. b See Table 4 for N's.
'Tables in Appendix C rank order intended graduate major fields by number of men and women in each age category who indicated that field. Only specific fields attracting 1.8 percent or more of the total number in at least one age category are listed in Table 3.

-lO-
The distribution of men and women by age group that is reported in Table 3 is consistent with what we know about the ages of men and women when they graduate from college --a higher proportion of men in the 23-29 age group, probably reflecting military service or other brief delays in completing their undergraduate studies, and more women in the 30-or-more group, probably reflecting some tendency to postpone both undergraduate and graduate study in favor of marriage and motherhood (cf., Baird, Clark, & Hartnett, 1973, p. 94). In addition, we have come to expect that a disproportionate number of older applicants to graduate school will be women who have spent several years raising families and now want to prepare for or reenter careers requiring postbaccalaureate study. This pattern is reflected in the larger percentage of women than men in the group of test takers who finished their undergraduate degrees more than eight years earlier (59% vs. 41%).
Ethnic and racial minorities tend to be somewhat overrepresented in the older age group of test takers, and blacks, particularly, are overrepresented in the group proposing to return to study more than eight years after the baccalaureate. Though some minority test-takers enter almost every field of graduate study, more than half of them intend to enter the fields of education, the behavioral sciences, and other social sciences, which are also the fields that attract the largest number of older test takers (see Table 4 of this report and Altman & Holland, 1977, p. 32).
Table 3 also summarizes the degree objectives of test takers in the different age categories. The anticipated highest degrees vary somewhat by age group, but they are not as different as might be expected given the groups' rather different life situations and, as we will see shortly, differences in their anticipated major fields. Test-takers who plan to continue immediately from undergraduate to graduate study are most likely to aspire to the doctorate or post- doctorate (40%); however, this is also the degree objective of 33 percent of the prospective graduate students who are more than eight years away from their undergraduate studies. The latter group is much more likely to have already pursued some graduate study (64% vs. 6%), which might be expected to result in degree objectives and choices of graduate major field that are somewhat more stable than the intentions of college seniors and recent graduates. Also, fewer of the older test takers are "undecided" about their intended graduate major field.
The last section of Table 3 lists 12 specific major fields and the percentage of all test takers in each age group who indicated plans to undertake graduate study in each field. These are the individual fields that attract the largest number of graduate students-- about 30 percent of those age 22 or less, 37 percent of those age 23-29, 47 percent in the 30-or-more group, and half of those more than eight years beyond the bachelor's degree. In

-11-
Table 4
Number and Percentage of GRE Test takers
by Age and Ethnicity
(U.S. Citzens Only)
Ethnicity
Bachelor's Age more than 8
22 or less 23-29 30 or more years earlier
American Indian Number Percentage
Black Number Percentage
Mexican American Number Percentage
Oriental Number Percentage
Puerto Rican Number Percentage
Other Hispanic Number Percentage
White Number Percentage
Other Number 1995 1524 406 195 Percentage 1.9 2.0 1.3 1.1
No reponse Number Percentage
4796 2964 1267 651 4.6 3.9 4.0 3.7
TOTAL Number 104365 75613 31719 17513 Percentage 100.1 100.0 100.2 99.9
309 351 217 82 0.3 0.5 0.7 0.5
5942 4338 2972 1704 5.7 5.7 9.4 9.7
817 1261 624 236 0.8 1.7 2.0 1.3
1524 734 303 210 1.5 1.0 1.0 1.2
603 463 182 87 0.6 0.6 0.6 0.5
426 365 181 60 0.4 0.5 0.6 0.3
87953 63613 25567 14288 84.3 84.1 80.6 81.6

-12-
general, plans to undertake graduate study in traditional academic fields (the first cluster) decline with age and with time away from the baccalaureate* , plans for graduate study in professional fields (the second and third clusters) remain steady or increase with age. The most dramatic shift is in education, which attracts about 8 percent of those who plan to take graduate work right after college and four times that percentage of those more than eight years beyond undergraduate degrees. No doubt many of the older test takers have work experience and also previous graduate study in the indicated professional field and are contemplating an advanced degree to increase employment options in a career direction that is already established. Others may be changing career direction or preparing to reenter employment. Professional fields also may be somewhat more attractive than academic fields among older persons because the relationship to employment is more clear-cut, the time needed to complete the degree is often shorter, and frequently there are special arrangements for part-time or evening study. These conditions will obviously have greater weight in the career decisions of adults with family and other economic responsibilities than in the career decisions of those who have not yet taken on such responsi- bilities. It should be noted, however, that even a traditional academic field like chemistry is the aim of some test takers who are far removed from their undergraduate studies.
A more general summary of intended graduate major fields by test taker's age is presented in Table 5. Education, the behavioral sciences, other social sciences, and the humanities attract the largest number of older test takers (columns 3 and 4); the behavioral sciences, biological sciences, humanities, other social sciences, and education are most popular among the youngest test takers (column 1). Again we note that the proportion interested in education is much greater among older test takers; relative interest in the social and behavioral sciences, the humanities, and the arts remains fairly stable across the age groups, and there is much less interest in the biological and physical sciences in the older groups. As might be expected from the sex and ethnic distributions reported in Table 3, the major areas that are most attractive to older test takers also tend to be fields that attract relatively high proportions of women and nonwhites, as reported in Tables 39 and 42 of the summary of background data presented by Altman & Holland (1977).
Test Scores bv Age and Sex
Questions about GRE test scores as measures of academic ability for older graduate school applicants, and particularly for those who have been away from formal study for a number of years, do not lend themselves to simple answers. As we have seen in

-13-
Table 5
Intended Graduate Major Area by Agea
Age Bachelor's 22 30 more than 8
or less 23-29 or more years earlier
Arts
Other Humanities
Education
Other Social Sciences
Behavioral Science
Biological Science
Health
Applied Biology
Engineering
Math Science
Physical Science
Not in above
Undecided
TOTAL RESPONSE
N 3233 2262 XC 3 3
N 11752 8060 %C 11 10
N 9561 15312 %C 9 18
N 10294 8189 xc 10 10
N 25730 20217 xc 24 24
N 12389 6586 xc 12 8
N 7123 5881 %C 7 7
N 2541 1397 %C 2 2
N 4521 3503 xc 4 4
N 3109 1698 %C 3 2
N 6662 3712 %C 6 4
N 3505 4003 %C 3 5
N 7095 2833 %C 7 3
N 107515 83653 xc 100 100
600 2
2738 8
9794 29
3633 11
8341 24
1352 4
2040 6
298 1
787 2
471 1
805 2
2597 8
842 2
34298 100
327 2
1411 8
6479 35
1887 10
4001 21
601 3
944 5
192 1
370 2
282 2
402 2
1402 8
371 2
18669 100
aSee Appendix B for lists of disciplines included in each group. Based on GRE test takers, October 1975 to June 1976, who took the GRE Aptitude Test and completed the background questionnaire.

the previous section, test takers' age differences are associated with intended graduate field of study, gender, ethnic identification, and previous graduate study, in addition to the number of years since receiving the undergraduate degree. Also, GRE test takers are not a random sample of college graduates in various age groups. Since we know from other reports (e.g., ETS, 1973; Altman & Holland, 1977) that there are differences in the GRE verbal and quantitative mean scores of persons classified by,major field or by sex, we would not expect mean scores based on different proportions of these groups to be the same. We are not surprised, therefore, to note in Table 6 that there are differences in the mean verbal and quantitative scores of test takers classified by age or years since receiving the bachelor's degree.
The average GRE verbal score for all male and female test takers in 1975-76 was almost exactly the same--497 for men, 499 for women. Looking first at mean verbal scores in Table 5, we see that the youngest group of test takers (and particularly young males) scored above the mean, whereas older males scored slightly lower than the mean. For both men and women the variability of verbal scores is greater in the older age groups, as indicated by larger standard deviations; however, the average verbal score of women who are 30 or more is about equal to the verbal score of younger women. In fact, those who were more than eight years beyond the baccalaureate on the average scored above the mean for all women. Thus, even without taking into account the different fields of study anticipated by the younger and older groups, there is no indication that older women (defined either by age or years since the baccalaureate) who elect to take the GRE Aptitude Test earn lower verbal scores on the average than do women college seniors or recent graduates. The slightly lower average verbal scores of older men may reflect a tendency for a larger percentage of very bright young men to pursue graduate studies directly after receiving the undergraduate degree, whereas more of the very bright women do not undertake graduate study immediately after college, but begin it several years later.
The average GRE quantitative score for all test takers in 1975-76 was 514, with marked differences in the mean scores of men (554) and women (473). This difference is reflected in the mean quantitative scores of men and women in each age group in Table 6, though the difference between the mean quantitative scores of the two sexes decreases somewhat with increasing age (89 points between quantitative scores for men and women age 22 or less, as compared with 70 points for those age 30 or more). For both sexes, the average quantitative scores earned by older age groups are lower than the average scores earned by the younger age groups. As with the verbal score, test takers "returning" eight or more years after the baccalaureate averaged slightly higher quantitative scores than did all those age 30 or more, suggesting the influence of self-selection, particularly among those planning graduate study several years after earning the bachelor's degree.

-15-
Table 6
Mean GRE Scores by Age and Sexa
Ap;e Bachelor's more than 8
22 or less 23-29 30 or more years earlier GRE GRE GRE GRE GRE GRE GRE GRE v Q v Q v Q v Q
Male Mean 517 588 486 540 467 485 483 498
S.D. 114 127 129 130 131 134 133 135
Female Mean 506 499 492 464 496 416 506 425
S.D. 117 122 125 119 132 116 134 118
Total Mean 511 542 489 506 483 447 496 455
S.D. 116 132 127 131 132 129 134 130
aBased on GRE test takers, October 1975 to June 1976, who took the GRE Aptitude Test and completed the background questionnaire.

-16-
Test Scores bv Field
More detailed information about the average GRE Aptitude Test scores of prospective graduate students in specific fields is provided in Tables 7 and 8. Table 7 lists the number and mean GRE verbal and quantitative scores, by age group and sex, for each of eight academic fields. Table 8 lists similar information for each of seven professional fields. Data in these two tables are compiled from detailed tables of mean scores by field, sex, and age that are attached to this report as Appendix C.
The patterns of mean test scores suggested by the data in Table 6 are apparent in these field-by-field summaries. Although there is an occasional exception for a specific field, in general the highest mean Aptitude Test scores were earned by prospective graduate students who were age 22 or less; test takers beyond this age tended to average lower scores, especially on the quanti- tative measure. However, there are some notable exceptions for verbal scores, especially among prospective applicants in professional fields (Table 8) and among women over age 30 who are considering graduate study in academic fields (Table 7). In both of these cases, frequently the average verbal scores of older test takers were higher than the average verbal scores of those going directly from college to graduate school, suggesting a high level of self- selection among these applicants.
The average quantitative scores of both men and women are lower in the older age groups in every field, whether academic or professional, although here, too, self-selection is indicated by the relatively high average scores made on this measure by older prospective applicants in the sciences.
Clearly, the GRE verbal and quantitative scores of test takers who are beyond the usual age of admission to graduate study reflect many things-- formal learning opportunities, life and employment experiences, the recency of reviewing knowledge or practicing skills required by the test (probably particularly relevant to performance on the quantitative section), and self-confidence in dealing with the testing situation, to name only some of the more important factors. It is likely that these factors are much more highly related to differences in test scores than is the age of the test taker.
Age and Learning Ability
IS there any evidence to suggest that a given individual might be expected to earn lower test scores with increasing age, suggesting an age-related decline in learning skills? Only scores from the reported administration of the GRE Aptitude Test to the same individuals over several years would provide a good answer to this question, and

-17-
Table 7
Mean GBE Scores by Age, Sex, and Intended Graduate Major:
Selected Academic Fieldsa
Field
Bachelor's Age more than 8
22 or less 23 - 29 30 or more years earlier M F M F M F M F
English
French
History
Economics
Psychology
Biology
Chemistry
Physics
V Q N
V Q N
V Q N
V Q N
V Q N
V Q N
602 585 601 552 487 532
(1023) (1624) (929)
572 554 579 539 495 504
( 83) (361) ( 47)
565 567 557 537 481 511
(1331) (789) (916)
543 546 480 636 593 590
(1194) (374) (962)
533 532 538 561 510 541
(3603) (4391) (2840)
516 538 511 601 558 575
(1086) (686) (595)
531 549 469 664 640 610
(1460) (477) (541)
574 548 499 713 667 674
(1056) (125) (422)
579 469
(1068)
559 478
(122)
559 459
(380)
475 546
(154)
554 503
(2007)
542 547
(286)
491 603
(124)
488 651
( 34)
579 589 582 605 471 422 472 430
(167) (501) ( 80) (263)
498 563 503 608 473 423 441 433
( 19) ( 44) ( 11) ( 26)
545 576 575 600 473 443 505 439
(246) (167) (102) ( 71)
470 525 500 502 557 509 588 513
(242) ( 40) (114) ( 17)
546 579 593 608 513 477 542 506
(610) (986) (240 (375)
473 543 466 554 477 510 491 524
( 76) ( 87) ( 28) ( 60)
456 568 468 575 582 596 491 613
( 65) ( 28) ( 36) ( 20)
478 526 446 493 619 616 640 648
( 60) ( 05) ( 22) ( 4)
aBased on GRE test takers, October 1975 to June 1976, who took the GRE Aptitude Test and completed the background questionnaire.
See Appendix C for similar data in other fields.

-18-
Table 8
Mean GRE Scores by Age, Sex, and Intended Graduate Major:
Selected Professional Fieldsa
Bachelor's Age more than 8
22 or less 23 - 29 30 or more years earlier M F M F M F M F
V 487 462 Q 539 471 N ( 859) (5000)
478 461 509 449
(2536) (6850)
471 476 476 410
(1456) (4156)
455 486 463 412
(1338) ( 820)
468 488 453 408
( 471) ( 899)
486 516 451 428
( 55) (1023)
568 547 478 434
( 123) ( 841)
494 529 489 436
( 636) ( 207)
478 519 543 474
( 648) ( 156)
484 487 487 417
( 821) (2842)
463 494 467 421
( 957) ( 613)
478 505 459 422
( 261) ( 559)
388 521 363 427
C 4) C 456)
587 556 482 444
( 76) ( 551)
511 561 510 463
( 300) ( 93)
494 542 559 487
( 314) ( 82)
Education
468 480
( 294)
444 473 489 456
(1145) ( 568)
458 526
N ( 198) Educational Administration
V 470 476 Q 500 475 N ( 439) (1403)
470 468 480 441
(1019) (1534) Guidance/ Counseling
V 476 501 Q 546 499 N ( 23) (1132)
526 514 530 482
( 111) (1951) Nursing
566 541 516 464
( 406) (1354)
V 555 554 Q 524 487 N ( 175) (1480)
Library Science
V 500 502 Q 522 469 N ( 939) ( 450)
494 518 502 459
(1087) ( 389) Public Administration
V 583 495
Q 587 529 N (1515) ( 674)
466 481 557 502
(1346) ( 349) Business and Commerce
aBased on GRE test takers, October 1975 to June 1976, who took the GRE Aptitude Test and completed the background questionnaire.
See Appendix C for similar data in other fields.
-19-
such longitudinal data are not available. However, there has been considerable research in recent years on the stability of learning abilities over time, and the results of this research should help us anticipate the GRE test performance we might expect of older test takers.
In a recent summary of research evidence concerning adult development and learning, Knox (1977) pointed out that both longi- tudinal and cross-sectional studies present certain problems in the study of age trends in learning ability during adulthood. In particular, social changes may alter the learning tasks that are presented to subjects in both types of studies, and cross-sectional studies may also include persons in the different age groups who differ in ways that are unrelated to age (for example, different intended graduate major fields, as shown in Table 3 in this study).
In general, cross-sectional studies tend to report gradually lower test scores and other indexes of learning ability after about age 24 or 25. However, there is no way of knowing from such results whether any specific individual's ability would decline over time because of the likely differences in the compositions of the groups. Longitudinal studies, designed to come closer to answering this
. question, p resent a different picture. According to Knox (1977, p. 416), these studies indicate a rapid increase in learning ability into the early twenties, followed by a continued gradual increase in ability until age 60 or beyond. There may be some shifts in the ability to learn various kinds of tasks between the twenties and the sixties, with a gradual decline in fluid intelligence (the ability to engage in short-term memory, form concepts, and engage in reasoning), but any such decline probably is accompanied by a continuing gradual increase in crystallized intelligence (the ability to engage in formal reasoning and abstraction based on knowledge of the intellectual and cultural heritage of society). Knox concludes: "During adulthood, as fluid intelligence decreases and as crystallized intelligence increases , general learning ability remains relatively stable, but the older person tends to increasingly compensate for the loss of fluid intelligence by substituting wisdom for brilliance" (p. 421).
Since the GRE verbal ability measure clearly emphasizes the ability to reason and solve problems in forms that are related to cultural knowledge, or crystallized intelligence, Knox's conclusions from the research literature would not lead us to expect that any given individual would score lower on the verbal section of the test with increasing age and might, in fact, score higher with increasing age, at least up to age 60 or more.
Schaie and Gribbin (1975, p. 73) reported that a number of studies "have now conclusively demonstrated that actual decrement for Verbal Meaning, Space, Reasoning, and Number does not occur

-2o-
until the late sixties." However, an earlier longitudinal study indicated no change in verbally-related abilities but "a significant decline on the numerical component" (Owens & Charles, 1963, p. 143), and tests of developed mathematical skills like the SAT mathematics test or the GRE quantitative measure almost always show lower scores for older test takers. Reasons for the lower scores by older test takers on the GRE quantitative ability measure are not clear, but they appear to operate similarly for men and for women and to be unrelated to performance on the verbal measure. It seems likely that performance on this quantitative part of the test is influenced to a considerable extent by the recency of involvement with or review of mathematical operations and concepts.
The cross-sectional studies of age trends in learning ability indicate an increasing range of individual differences in learning abilities from the twenties through the fifties, probably reflecting greater variability in life experiences, health, and personalities in the older age groups. Thus, average trends in learning ability will be lowered by including the adults who have been adversely affected by life's conditions, but the abilities of other individuals of the same age will remain high. It seems likely that older persons who are thinking of returning to graduate study and who elect to take the GRE Aptitude Test are self-selected from among the more intellectually active members of their age groups.
Some of the performance and motivational factors that are more likely to interfere with the intellectual functioning of older adults include a greater tendency toward cautiousness (less willingness to be embarrassed or to guess); slower responses, including possibly a slowing of information processing, so that time limitations may be emotionally upsetting; problems with eyesight or hearing; and an increase in susceptibility to distraction with increasing age (Schonfield, Schaie, & Birren, 1974; Schaie & Gribbin, 1975). However, it should be emphasized that most of the studies that reported these results were contrasting subjects in their twenties with those who were 60 or more; few if any of these conditions should affect the "older" test takers in this report, most of whom are in their thirties and forties.
Predictive Validity
There is some evidence that college admission based on test scores and high school grades will underpredict the first-year grade point average of applicants age 21 or more who accept college admission (American College Testing Program, 1973, pp. 260-264). The elimination of the use of test scores with adults has been suggested, but the ACT analyses suggest that test scores will tend to be better predictors of college grades than high school grades for the older group. The relationship between GRE test scores, college grades, and first-year graduate school grades for older test takers has yet to be examined.

-21-
Conclusions
This review of one large segment of potential graduate school applicants, the men and women who took the GRE Aptitude Test in 1975-76, indicates that many of them are well beyond the usual age of college attendance. Two ways of identifying "older" potential graduate students were used: test takers 30 years of age or older, and test takers who had received their bachelor's degrees more than eight years earlier (essentially, a subset of the 30-and-over age group). When contrasted with test takers who were 22 or younger, the older groups included a larger proportion of women and minorities, were less likely to aspire to doctoral degrees, and were much more likely to anticipate graduate study in the field of education. However, a sizable number of the older test takers anticipated graduate major fields in academic areas, as well as in other profes- sional fields, and indicated that they planned to work for doctoral degrees.
Although the average test scores of older test takers were lower than the average scores of younger test takers, in many cases the differences in scores on the verbal ability measure disappeared or were reduced substantially when the data were examined by anticipated field of graduate study. Older test takers consistently had lower average scores on the quantitative measure. Differences in performance on the two measures may reflect differences in opportunities for adults to maintain verbal and quantitative skills, with much more verbal stimulation in everyday living for most persons.
A brief review of the literature on learning ability and age suggests that methodological problems and changing times probably account for most of the reported age differences in both learning ability and performance. One author refers to this as the "myth of intellectual decline," noting that "the presumed universal decline in adult intelligence is at best a methodological artifact and at worst a popular misunderstanding of the relation between individual development and sociocultural change" (Schaie, 1974, p. 802).
The evidence presented in this report suggests that older individuals who elect to take the GRE Aptitude Test earn scores on the verbal section that average about the same as the verbal section scores of college seniors who expect to enter the same graduate fields of study. Because of different score levels among fields and different mixes of fields among age groups, the overall average verbal scores are lower for the older age groups, but these differences are largely eliminated when the verbal test scores are examined field by field. This is not the case for scores on the quantitative section of the test; the average quantitative scores of both men and women in the older age groups are lower than the average quantitative scores of those age 22 or less regardless of field. to he1 P expl ain why the quantitative scar ‘es
There are no data are low for older

-22-
test takers, but one might speculate that extent of use in every day life and changing social conditions (such as the increased use of computers and hand calculators) might help explain the differences.
Unfortunately, information about the relative performance of younger and older graduate students was not available for this report, and it is these data that would be most helpful in determining the usefulness of the GRE Aptitude Test scores earned by older test takers when such applicants are considered for graduate admission. From the data avilable, it appears that, in any given department, verbal scores probably can be treated similarly for applicants of all ages. The lower quantitative scores of older applicants may or may not be important depending on the field, and the skills may or may not respond to intensive review or relearning once an individual is enrolled in a graduate program of study. Only further study will answer these questions.
The data reported in this study are for GRE test takers only; they do not accurately reflect all aspects of graduate admissions, where many decisions are made on the basis of applicants' past experience, motivation, and purpose rather than test performance. In many fields, those taking the GRE tests are a small proportion of those who apply for admission. Therefore, these results should be interpreted cautiously, consistent with their status as self-selected samples of college graduates at various points in their lives rather than representative samples of different age groups.
Graduate departments with sizable numbers of older students could help answer the predictive validity questions by systematically collecting and sharing data on admissions criteria and graduate study performance for different age groups of applicants. It seems likely that other factors may be increasingly important for older applicants, such as reasons for wanting to undertake a particular program of study, economic and personal responsibilities at home and at work, and self-confidence. These and other factors, in addition to test scores and previous grade records, deserve further study.

-23-
References
Altman, R. A., 61 Holland, P. W. A summary of data collected from Graduate Record Examinations test-takers during 1975-76. Princeton, N. .I.: Educational Testing Service, 1977.
Baird, L. L., Clark, M. J., & Hartnett, R. T. The graduates: A report on the characteristics and plans of college seniors. Princeton, N. J.: Educational Testing Service, 1973.
American College Testing Program. Assessing students on the way to college: Technical report volume one. Iowa City, Iowa, ACT Publications, 1973.
Council of Graduate Schools/Graduate Record Examinations Board. Survey of graduate enrollment, 1978.
Creager, J. A. The American graduate student: A normative description. Washington, D. C.: American Council on Education, 1971.
Educational Testing Service. Guide to the use of GRE scores in graduate admissions, 1973-74. Princeton, N.J.: Author, 1973.
Knox, A. B. Adult development and learning. San Francisco: Jossey-Bass, 1977.
Owens, W. A., & Charles, D. C. Life history correlates of age changes in mental abilities. West Lafayette, Indiana: Purdue University, 1963.
Schaie, K. W. Intellectual functioning. In Schonfield D., Schaie, K. w., 61 Birren, J. E., Translations in gerentology--from lab to life. American Psychologist, 1974, 29(11), 802-807.
Schaie, K. W., & Gribbin, K. Adult development and aging. Annual Review of Psychology, 1975, 26, 65-96.
Schonfield, D., Schaie, K. W., & Birren, J. E. Translations in gerontology--from lab to life. American Psychologist, 1974, 29 (ll), 796-815.

APPENDIXES

Rxkgwrrnd Information Questions Yocrr alWkr~ to thcsu queslions will rut alfact your score In any way. They will be used for rcseatrch and in group statistics
to dcs;ldbr, GHE candrclald Populations; mdlvlducll responses
wrll no1 bb communlcaldd to any irlstllutloo.
Ire the area on your rcglslration forr~, l~llcd “&i&ground
InforrnJtron Ouestrons.” indicate your r~spor~se to cxh ques-
tion We hope lhat you will answer all qucst~on~. However,
you are frw to omit any question you cl0 not wish lo answer.
A. tlaue you previously token.one or more GRE lurts7
(0 No (2) Yes-took the Iusl($) on or prior to Seplvrnbet 30, 1975 (3) Yes-look the lesl(s) more recently than September 30,
1975
/I your answbr lo question A is (3) and your responses to lhe rclsl 01 the queslions would be the samd JS they were batore, you need no1 answer llre queslir>ns again.
8. Are you II clllzcn of Ihe United Staler?
(1) Yes (2) No
C. Do you communicate belter In Engtlsh lhan In any other language?
(1, Yes (2) No
Or& questron D il you ere nol a Unifed Slates citizen.
0. How do you describe yoursell?
(1) American Indian, Eskimo, or Aleul (2) Black or Afro-American or Negro (3) Mexican-American or Chlcailo (4) Qrienlal or A&n-Amrrlcan (5) Puerto Rican (6) Olner Hispanic or Latin-American (7) While or Caucasian (8) Other
E. Approximately how many full-time undergraduate students Wend Ihe school from which you received or will receive your bachelor’s degree?
(1) Fewer than 1,000 (2) 1,000 - 4,999 (3) 5,cloo - 9,999 (4) 10,000 - 19,999 (5) 20,000 or more
F. Which 01 the followulng best describes your undergraduate Insltlution?
(1) Public (2) Prlvete-no church affiliation (3) Prfvate-church atfillallon
G.
t1.
I.
J.
K.
L
In what ybar did you receive or do YOU 0rpcC1 10 Ir)(:bl*e your bachelor’s dagrre? (Please biqckcn Ihv SC)~~LPS on your registration fo/c,r L’UC .
responding to 11~8 iasl two digits of Ihe year.)
nl:ferrtnr_ tu the M.ljw Fbld Code List below, find Yotrr ran- Jcrgradu;,te III,J~O~ twld ol rldy. UJ;&en thu spaces for thdl fl&j’s code r~~\bdr II your uurjr)r Is no1 tistacf, selecl one 01 Iha fcrllowing codes and blacken the CofrtWOndlni) spaces:
10 Other FweiUtI L;III~UJ~~S 99 Other ti~~inr~nlllur 80 Other Socldl Sciences JO Ott,ar Rlulo~icnl Sciences 60 Other Physical Sclunctio 02 Nol lnclrldcd in above calegOrf8s
Which of the foilowing best describes the graduate in&It- tulion you mosl recently Aended or currently oltend <rn at leas4 a hall-time basis?
I (1) I have newer altended graduate school or have allenddd graduate school on less than a hail-time basis wly.
(Skip lo K.) (2) Public (3) Private-no church alliltallon (4) Privale-church afflll&ion
In what year Jld you 1~31 attend graduate school on srt least a half-time bdsls?
(Blacken the spaces cm your regfslrallon form corrcsfz3r~J= Ing lo lhe I&t l&o dic)itS of the year; if you have not altended gra3uata sckol, Iti:civtt ttris question blank.)
wft;rl fr YOUI CV~IIIII~ Jf;&dUat8 degree obJ&ive’)
(1) IJondqrce study (2) Mirsler’r (M.A., M.S., M.Ed., etc.) (3) Interm&diale (such as Speciaflst) (4) Doctorate (Ph.D., Ed D., etc.) (5) Postdoctoral sludy
Fkferring Lo Ihe Major Field Code List below, llnd tha 1~3 In which you plan to do your graduate work. Blackerl tha spaces for thal field’s code number. If your Intended inajor Is not iiskd, or it you are undecided, select one 01 tho foliowlng codes and U&ken the corresponding space,;
10 Other Foreign Languages 98 Dlh8r Humanities 80 Other Soci~i Sclerlces 30 Other Diuloglcal Sciences 60 Other Physical Sclencus
02 Nol Intluded II; ,Ihove c3legorfer 00 Undecided
Appendix A
MAJOR FIELD CODE LIST - _- -_.
PH 54 61
62
70
Cl
6a
65
66
0
68
69
/I
? :
71
14
75
76
59
, I

Appendix B Groups of Disciplines Used in "Major Area" Tables.
Hulixanitics:
Arts=Droriutic Art Other Iluol~ini~icuahrchneolo~ Music Art History Fine Arts Comparative Lit.
Far Eastern Lang. German Linguistics l'hilosopl~y Russian Speech Other lluiwni tics
hrchitcctute Classical Lang. English French Italian Near F~stern Long. Religion Spanish Other Foreign Lang.
Social Scientes:
Educatiorl-Education Other Social Sciences=R~*siness Educational Admin. Communications Educational Psych. Tndus trial Relations Guidance Journalism Physical Education Law
Library Science Public Administration Social t!ork
Behavioral Sciences-American Studies Anthropolog] Econonics Geography Government History fntcrnationzl Rel. Psychology Slavic Study Social P!;ychology sociology Urban Development Other Social Sciences Political Science
_Riological Sciences:
Bioscience=)iiochemistry Biology Biophysics Botany Genetics Microbiology Physiology Zoology Other Biological Sci.
Other Applied Eiology=Agriculture
Entozwlogy Forestry Home i3xwomics~ Veterinary Nedicine
Hcalt:h=Anatomy Audiology Bacteriology Dentistry Health Admin. Medicine Nur:.ing Nutrition Occupational Therapy Optometry Osteopathy Parasitology fatholoT,y Pharmacology Pharrwxy Physical Therppy Public Health
Etll;inc~Drinfi=Aerol~;?utic~l Eng. Chemical E11g. Civil Eag. Electric.?1 Eng. Industrial Eng. N~~l~;lni~i~l Eng. Other Eng. Hctalluq;y Minia~
Math. Scicncc!=Apljljed Xcrthcmatics Coqwtcr Science Kathcm;ltics stl?tir.tics

APPENDIX C
The following tables are included as supplemental information:
Table C.l --
Table C.2 --
Table C.3 --
Table C.4 --
Table C.5 --
Table C.6 --
Table C.7 --
Table C.8 --
Table C.9 --
Table C.10 --
Table C.ll --
Table C.12 --
Table C. 13 --
Table C.14 --
Rank Order of Intended Graduate Major for Candidates Age 22 or Less
Rank Order of Intended Graduate Major for Candidates Age 23-29
Rank Order of Graduate Major for Candidates Age 30 or More
Rank Order of Intended Graduate Major for Males
Rank Order of Intended Graduate Major for Females
Rank Order of Intended Graduate Major for Males Age 22 or Less
Rank Order of Intended Graduate Major for Females Age 22 or Less
Rank Order of Intended Graduate Major for Males Age 23-29
Rank Order of Intended Graduate Major for Females Age 23-29
Rank Order of Intended Graduate Major for Males Age 30 or More
Rank Order of Intended Graduate Major for Females Age 30 or More
Rank Order of Intended Graduate Major for Candiates Who Received Bachelor's Degrees in 1967 or Earlier
Rank Order of Intended Graduate Major for Males Who Received Bachelor's Degrees in 1967 or Earlier
Rank Order of Intended Graduate Major for Females Who Received Bachelor's Degrees in 1967 or Earlier

TABLE C.l. RANK ORDER OF INTENDED GlbWJATE MAJOR FOR CANDIDATES AGE 22 OR LESS
MEAN
N % cm-v ---_-__-_-__ _____ -_________-____--__-___----- I I
I
I I Ii PSYCt-CLCCY 7999 I 7.44 I 532 I II CIhLR SCC SCI
I
7949 I 7.39 I 455 I
I I Ecucar lcrd 5661 I 5.45 I 466 i
ii OTt:FK BILL SC1 i 5576 1 5.19 I 501 I ‘I EhGLISH 2645 i 2.46 i 4Y2 I II SCC!fiL hCPY I 2250 ’ 2‘09 ! 403 I
I I RL:ir;kSS/CI’I~CE I 2191 i 2.04 1 487 I
Ii kIS1CRY
r
2C94 i 1.95 I 566 I
i i Ct-EI, ISTRY 1938 I 1.80 i 535 I 1 I r:: ! Lr’Ar,lTl~s
I
1929 ’ :.79 t 492 i
” CLICChCE/CCLKS le43 I 1.71 I 475 I II PLSIC I 1615 I 1.69 ’ 5.16 I Ii PIC1Cc.Y
I
1772 i 1.65 i 525 ’
ii CTI-ER PkYS SC.1 1719 I 1.60 i 472 ’
I’ LlbFPRY SC1 16<5 i
‘I PELlClCLS STC I a
1.54 I 554 I
1612 I 1.50 I =ae I Ii FCr_!tbCClCS I 1566 ’ 1.46 ’ ;44 I ll VET PECIClhE 1 1520 i 1.41 I 518 1 ‘I PCLITICPL SC1 1403 I 1.30 1 538 i
Ii PL@LlC AcrIr\
I
1389 I 1.29 I SC1 I
” CCt”FUTER SC1 1709 I 1.22 I 531 I
” t’dTl-EPATICS
I
12es I 1.2c I 536 i i 1 CECLCGY 1288 i 1.2c I 534 I
i i ELECTRICAL ENG i 1235 I 1.15 I 506 i
ii t?ICCtEb’ISTRY
I
1206 ’ 1.12 I 556 i
‘I PHYSICS 1182 I 1.10 i 571 I
I’ SFEtCt- I
1168 I 1.09 I 478 i
I I PICPCCILLCCY 1167 ’ 1.09 I 5le I ” F:LRZ IhG I 1155 I 1.07 1 501 I i’ IhTLPhPl REL
I
1cez I l.Cl I 568 I I I see ICLCCY 991 I 0.92 i 4S6 I ii LHBPh CEVELCF
ii CC~!‘bhlCATlChS I
se0 I 0.91 I 529 I
943 I 0.88 I 50s I I I ZLCLCGY 890 I o.e3 I 546 i
’ i JClJRhAL 1st’ I 052 I 0.79 I 541 I I’ CTHCR EFvGIh I 836 I 0.78 I 523 i i i ARC1 ITEClLRE
I e26 I 0.77 I 525 I
i i PLCL IC kEALTt- 812 i 0.76 1 511 I ii CIVIL EhG I 778 ’ 0.72 ’ 484 1 11 Ft-YSICAL EC 77e I 0.52 I 427 I i’ FINE ARTS I 751 I 0.70 I 495 I
i’ AhIt-FCPCLCCY I
749 I 0.70 I 572 1 I I F’EC IC INE 704 I 0.65 I 546 I i I FFYSICLCGY
I’ Lbk’ I 690 I 0.64 1 533 I 677 I 0.63 ’ 527 ’
ii hLTPITlCh 669 ’ 0.62 ’ 492 i
i ’ CRArATlC APTS I 667 I 0.62 ’ 536 t
’ ’ 6GR ICLLTLHE I 656 I 0.61 ’ 467 I ‘i t-CSFITAL CCFIN 651 ’ 0.61 1 4E4 I i I Ct;FlCAL Ebb 623 i 0.58 I SC6 i
i I PI-Y5 TIiCFAPY I 507 I 0.55 I 485 I ’ i ECLC t-SYCt- 507 I 0.55 I 504 I
ll__________________ ________J________l____-_-l-
MEAN
GIU-Q -a __-_
533 461
481
554
512 466
569
516 658
470
473
511
585
609
491
538
626 606
519
505
679
6e9
612 695
652
708
461
504
500
540
404
552
491 598
495
683
599
545
664 474
469
531 619
606
535 534
497
557
532
684 533
511
-_--
II II I I ii I I
I I
II I I
II I I
II -11
MEAN MEAN
N % GRE-V CRE-Q 7 I_ _ - -_____ __-_I____-__I_____-_ j-“__‘~““-~i
’ i PECt-ANICPL Er\‘G
ii ART I-ISTORY I 'I Ft-ILCSCFPY
ii ECLC 4CClN I i ’ t-CCE ECCNCWICS i it PfTAhY I I ’ LEtbET ICS
‘I ALCICL(ICY 1 ii FREhCH I ! ! CTfCPAPt-Y
I' SPbhlSF i i i Ft-ARt’ACCLCGY
ii CCEAhCGRAFHk I I’ FCPESTRY
I I LlhGUISTlCS I ” IhCLSTRIhL REL
ii SCCIAL PSYCk I ii AFPLIEC IvATt- I i i FRCt-AECLCCY
i’ CCFPARE LIT I 11 FbThCLCEY
I I INCUSTRIAL ENG I ‘i ZTATISTICS
’ i PhbTC’r’Y ! ‘i ASTRCKGh’Y I i i EhTCPCLCGY
ii CTt-ER FCR LANG 1 11 AEPChALT EhG ‘I CEPtJAN 1 I! At’ER STLCIEC I ” FbAPb’ACY
ii CLASSICAL LAKG I ” CCCLF Tt-ERLFY
” EfACTFRlCLOGY I ii elCPrYSlCS I ii CEhTISTRY i’ FAR EAST LAhG I II HLSSIbh
‘i SLAVIC STUCIES I Ii PETALLLHGY
1’ hEAR EAST LANG I i I CPTCf’ETRY I i l FPFASITCLCGY
1 i CSTECPATt-Y 1 ” IIkLlAN
‘1 P’lhlhG ;
II I ii hCT Ih bPCLE I
575 i 0.53 I 485 i 681
57c i c.s3 I 557 I 493
543 I O-51 I 607 I 577
492 i OI4t I 464 ’ 498 491 I O-46 I 442 i 47C
485 I OI45 i 548 I se9
471 I c-44 i 557 I 615
448 I 0.42 i 4@2 i 479
445 I 0.41 I 55e I 503
378 I 0.35 1 512 I 558
369 I 0.34 I 5c9 I 4t2
622 Ii 347 I 528 I 627 I I 343 1 0.32 I 513 I 59e ii 343 I 0.32 I 594 I 469 I i 337 I 0.31 I 504 I 529 ii
299 i 0.2e I 509 I 509 I I 255 I 0.27 i 2e3 I C.26 I :“,: I 695 ” a 522 Ii 231 I 0.21 1 613 ’ 526 ii
222 I 0.21 I 496 i 549 ii
220 I 0.2c I 466 i 652 I i
216 i 0.20 I 513 i 6S5 II 191 I O.lE I 516 I 555 Ii 168 I 0.17 I 594 I 694 ‘1 187 I 0.17 I 523 I 574 II lE7 I c-17 I 478 I 441 II 170 I 0.16 i 514 I 668 Ii 169 I 0.16 I 56E ’ 530 ‘I lC8 I 0.16 ’ se4 I 534 I I 157 I 0.15 I 472 I 578 Ii 149 I 0.14 I 641 I 564 II 145 I 0.13 1 496 ’ 503 ii 1=c I 1;; I
0.13 I 51c I 56e II 0.12 I 5C6 I 668 I I
115 I 0.11 I 471 I 560 Ii 106 ’
i c-10 1 592 I 534 ii
100 0.09 I 619 I 550 11 70 I
i
o.c7 I 615 i 563 i’ 70 0.07 I 594 i 682 i ’ cc 1 0.05 I 589 i 529 ii 5C I 0.05 I 4so I 576 I I 38 I 0.04 i 526 ’ 556 ‘i
25 1 O-02 I 554 I 5t3e Ii
23 I 0.02 I 498 I 423 II 14 I 0.01 I 469 I 621 ii
I I I II 35c5 I 3.26 I 450 I 475 I I
I’ LhCEClCEC I 7095 I 6.60 I 526 f 551 ii
11 TCTPL I lC7215 I 100.00 I 512 I 542 ii
ii hC RESPChSE 4230
________-_--_____ : I 3.791 I 495 I 522 i I
11 _______ 1 _______ 1 _-_____ 1 _-_____11
r> pbStC Ch ALL CRE PELPChCkbTS CCTCPEQ, 1975 - Jl;hE.l97cr hl-C CCt’PLETEC GRE Aht f!ACKGRCLhC CLESTlChhPlPE

TABLE C.2. RANK ORDER OF INTENDED GRADUATE MAJOR FOR CANDIDATES AGE 23-29
_------_-________ I I I I ECLCPIILr, 11 ClhER :LC SC1
II PSYChC.LLGY 11 ClkEP t!lCL SC1
l l CL: lCbkCt/CCLhS 11 hLbC’““
I I the; i.1’ II LIPRAHY SC1 II Clt- I-LtJAhITlLS I I [Ci_,C ,*:* ;'.
II PLSlhEZS/CrRCC
11 CTkER PtYS SC1
]l SCCIAL hLKK
I I FLEL IC PCt’Ih
I I rISTCRY
II RELIEICLS STC
I I ECChCf' ICS II rt_src 11 ELECTRICAL EhG
I I CCtJl’UTEH SC1
II Ft-YSICAL EC
II t?ICLCGY II PCLITICAL SC1
11 FIhE ARTS
I I URBAh CEVELCP
II GECLCCY
II Ecpc PSYCI- 11 FLE’LIC I-EBLTI-
I I ccc ICLUGY
II CCFFLnICPTIChS
II CIVIL EKG
II CktCISTRY
I I ARCb ITECTLRE
I I k’ICRCE?lC.LCGY
II VET CECICIXE
1 I AGR ICLLTURE
I I CTHER EhGIh
I I t’ATl-Et’AT 1CS
11 AhTl-PCPCLCCY
I I JCUPhPL 1st’
II I-CSPITAL ACbIE;
II F/ECkChICPL EhC
II ZCCLCGY
ll CPAFPllC PPTS
II PbYSICS 11 FCt’E ECCF;CPlCS 1 I IhTERhAT PEL
I I SPEFCk
II EICCt-ECISTRY
II PkILCCCP~Y
l I II\CCSlRIPL EhG
II CECCPLPbY
ll---_----_
MEAN
N % GRE-V ____--___---__-----_-----_---
I I I I I 9’389 89RC 1 I 11.72 10.73 I 1 466 444 I I
I 4e5c I 5.80 I 545 I
I 3459 2556 I I 4.13 3.06 I I 480 469 I 1
I 2C67 I 2.47 1 51: 1 I lS9t! I 2.39 1 569 I
‘r 1760 I 2.10 f 547 I
* 1715 I 2.c5 I 404 I I I714 ; 2.05 I 454 I I 1695 1645 1 I 2.03 1.57 I 1 469 422 1 I
I lcc5 I
*;1;7 1
1.86 I SC2 I 1.77 I c,Cl I
I 12S6 I 1.55 1 557 I
I Ilit 12E6 1 I 1.5c I 53 2 I I.33 I 479 I
1 990 951 1 I 1.19 1.14 I I 510 437 I I
I 932 I 1.11 I 494 I
I 914 I 1.c9 I 420 I BE1 I l.C5 I 521 I
I e50 804 I I 0.96 1.03 I I 488 526 1 I
I i7C I 0.92 I 525 I
I 758 1 0.91 I 518 I
73s I 0.8e I 510 I
1 712 711 I I 0.85 O.E5 I 1 491 521 I I
1 689 665 1 I o.e2 0.92 I I 446 515 I I 1 665 652 1 I 0.79 0.78 I I 473 512 I I
I 625 605 I I 0.75 0.72 1 I SC5 531 I I
I 5so I 0.71 I 439 I
I 563 1 0.67 I 459 I
I i
563 I o.e7 I 49@ I 557 I 0.67 1 576 I
I 550 543 I I 0.66 0.65 I I 496 557 I I
I 480 I 0.57 I 424 I
I 471 I 0.56 I 538 I
I 460 456 I I 0.55 0.55 I I 4$8 542 I I
I 44e 442 I I 0.54 0.53 I I 453 530 l I
I 39? I 0.47 I 495 I
I 3t!s I 0.47 I 518 I I 371 I 0.44 I 601 I
342 I 0.41 I 4c5 I
336 I 0.4c I 517 I
MEAN
GRE-Q ___---a
465 II
446 II
525 II
521 II 456 II 485 II 4S8 II 476 I I 455 I I 478 II 546 II 577 II 4t1 II 4Sl II 496 II 515 II 5.83 I I 491 II 646 11 653 II
458 Ii
566 II
549: iI 539 II 594 II 492 I I 521 II 4eo II 4E7 II 609 l I 605 II 580 II 556 II 590 II 521 II C?B II 664 II 515 II 495 II
2: iI 577 II 494 I I 672 11 453 II 505 II 455 II 6C9 I I 550 I I 620 II s39 II
.______I1
I I I I PbYSlOLCGY II hLlRITlCh
I I ART kISTCRY
ll Ct-EPICAL thG
I I Pt-YS 7rERbFY
! 1 LIhGUISlIC’
I I f?ClAhY
I I IhCLSTR IAL PEL
I I LAk I I I-CPESTRY
II SPAKISH
II PI-LRPACCLCGY
II PI-ARPACY
II SCCIAL FSYCk I I FREKCt-
II I’ECICIhE
I I GEhETICS
1 I ALC ICLOGY I I ARCt’AECLCtY
II CTkER FCR LANG
)I CEhTISTRY
II CCEbhCGPAFkY
11 PATt-CLCCY
11 EhlCPCLCGY
II CCCLP Tl-ERAPY
II CCIJPARE LIT
I I Ah!lCCY
II AEPCKALT EhG
II APER STLCIES I I ‘TPTISTICS
I I AFPLIEC t’ATt-
I I GEPCAK
II FAR EAST LbhG
II PETALLURGY
11 EACTERICLCGY II ASlROKCt’Y
II CLASSICAL LANG
I I i?IcPl-YsICs I I PARAS ITCLCGY
II RLCSIAh
1 I hE1R EAST LANG
II CSIECPATFY
t 1 SLCVIC STLCIES
II CPTCt’ETRY
II ITbLIAh
iI CIhING
II 11 hC1 Iti PECVE
Ii LhCECICEC 1 I TCTAL
II hC RESPChSE I I
I I II 322 I 0.3E I 534 590 II 319 I 0.38 I 4e3 I 51c II 305 I 0.36 I 579 I fde If 301 I C-36 I 432 I 637 I I
292 I c-35 I 495 I 522 II 279 I c-33 I 5ts ! 537 II 233 I 0.28 I 544 I 579 II 232 I c.2e 1 50s I 505 II 231 I c.2e I 49C I 489 I I 209 I 0.25 I 514 ! 586 If 207 I c-25 I 4p1 I 432 II 154 I 0.23 I 502 I 578 I I 173 I 0.21 I 439 I 567 II 172 1 0.21 I 525 I 511 II It9 I 0.20 I C,t4 I 485 II 167 I c-20 I 547 I 583 I I 1t1 I 0.19 I 535 I 587 II 155 I 0.19 I 493 I 481 I I 154 1 0.18 I SC0 1 496 I I
147 I 0.18 I 479 I 449 II 145 I c.17 I 501 I se1 II 143 I 0.17 I 516 I 606 II 143 I 0.17 I 4E9 I 52e II 135 I 0.16 I 499 I 541 II 134 I C-16 I 516 I 487 Ii 125 I 0.15 I 6C2 I 513 II 117 I c-14 I 530 I 561 II 113 I 0.14 I 476 I 64s I I 112 I 0.13 I 590 I 522 II <lo8 I 0.13 I
45 I 0.11 I ::"5 I c56 1' 673 II 87 I O.lC I 582 1 536 I I
74 I 0.09 I 5'36 I 555 II
61 I o.c7 I 3E0 I c24 II 55 I 0.07 I 474 I 525 I1 45 I 0.05 I 547 I C27 II 45 I 0.05 I 632 I 544 I I
45 I 0.05 I 57c I ct2 I I 45 I 0.05 I 506 I 531 II 41 I 0.05 I 606 I 536 II
25 I 0.03 I cot I SL4 II
2c I 0.02 I 517 I 533 I I
17 I o.c2 I 474 I I
14 I 0.02 I ;;; 1 655 I I 13 I 0.02 I 505 I 477 II
7 I 0.01 I 471 I 583 II
1 I I 4003 I 4.79 I 427 I 4 t 2 ii
2833 I 3.39 I 507 I 5i5 II
490 I 507 II
458 i 4e7 I I 11 ________--_----_-_ 1 1 _---_- -----I_ 1,_--_1_____11
MEAN
N % GRE-V ----------------___---
MEAN
GRE-Q --_-e--e
* eASlIt Ch ALL C-RL RESFfhCFhTS CCTCPER~ lS75 - JbhEv197tr bib0 CCFPLETEC GRE AKC @ACKGRClhC CLFSTIChhPIPE

TABLE C.3. RANK OiDER OF GRADUATE MAJOR FOR CANDIDATES AGE 30 OR MORE
MEAN N 9: GRE-V GRE-Q ___-_______---______~-~~~----_---~_~~~~~~~~~~~~~~~~~.--
CCLCAllLh CTI-EP see SC1 ECLC PUPIh FSYCI-CLCCY
CL ICAhCE/CCLNS f hLP> IhG
L II!PbRY ;c1 1 CTtiEP f!1IrL SC1
FLPL IC ACt’Ih I L!‘LS!‘<z”,‘Cr’Rt E I Cli- FLt’AhIT 1ES
EhCL ISt- 1 SCC IAL hCRK
CTI-ER PI-YS SC1 I REL IGICLS STC I ECl,C FSYCI-
t_ISTCRY I
SCCICLCGY
FCLITICPL SC1 I
CCE'PLTEH SC1
ECChCt'ICS I
lvLSlC I t-CSFITAL ACpIh
FINE ARTS I PL@LlC t_EALTh
CIVIL EhG I
Pt-YSICAL EC I
CCkt’LhICAT IChS
AhTkRCPCLCGY I LRRPh CEVELCF
kCf'E ECChCt'ICS I
ELECTRICAL EhG 1
e ICLCEY CTI-ER EIF;CI& I IhlERhAT REL
PATbEt’AT ICS I AGH ICLLTLRE
SFAhlSl- I
JCLJHKALISIZ I SFEECI-
CRACAT IC ARTS 1 IhCLSTKIAL EhG 1
CRT I- ISTCRY Cl--CpISTRY I
LIhELISTICS
tJICPCl?lCLCGy I IhCL:TRIAL RCL
AF~kITELTLRE 1 ‘aLTRIT1L.h I ClhER FCk LChC
EtCCHAPbY I GECLCGY I
1 1
5617 I 16.38 1 475 I
4712 f 13.74 1 446 I 4II II 2155 I 6.2s 1 467 I 444 II
l&O1 I 4.67 I 567 I 491 II I370 I 3.99 I 481 I 474 II
107P I 3.14 ! 514 I 429 II
st4 I 2.81 I 550 I 439 II 8S0 I 1.59 I 454 I 431 II 845 I i-46 1 5c2 I 47t II E05 I 2.35 I 4&6 I 520 II 7q9 I 2.07 I 467 I 3s7 II 668 I 1.95 I L,E4 I 435 II
558 I 1.63 1 523 I 426 II 533 I I.55 1 434 I 528 II
494 I 1.44 I 528 I 470 II 435 I 1.27 t 535 I 4c7 II 414 I Iail I 557 1 4t1 II 300 I 0.90 I 5C8 1 430 11
303 I 0.88 I 5 26 I 473 II 288 I 0.@4 I 537 I 644 II 282 I 0.82 1 478 I 550 II 2t9 I O.-l& I 5Cl I 432 II 234 I 4.68 I 485 1 443 II
i3 2 I O.C& I 457 I 42E II
229 I 0.67 1 526 I 472 II 216 I 0.63 I 441 1 533 II 213 I 0.67 1 409 I 4ce II 198 I 0.58 1 523 I 457 II 194 I 0.57 I 576 I 4t3 II 194 I 0.57 I 515 1 5c5 II 182 I 0.53 I 4co I 405 II 174 I 0.51 I 451 I 621 II 163 1 0.48 I 510 1 505 II 159 I 0.46 I 4C6 I 604 II 142 I 0.41 I 5Cl I 49@ II 135 I 0.39 I 492 1 t3i II 125 I 0.36 1 411 I 46E il 111 I 0.32 I 472 1 378 II 109 I 0.32 I 564 I 453 II 104 1 0.30 I 528 I 421 II
99 I' 0.29 I 557 I 437 II se I 0.29 1 476 I 613 II 97 1 o.ze I 595 I 458 II
93 I 0.97 I 489 I 586 II
91 I 0.27 1 547 I 487 ii 90 I 0.26 1 466 I 507 II 68 I 0.26 I 479 I 478 II ec I 0.2b 1 478 1 546 II ~7 I 0.25 I 496 I 449 II e5 1 O-i5 I 410 1 356 II 80 I 0.23 1 531 I 502 II
00 I 0.23 1 492 I 56i II
MEAN MEAN N x GRE-V GRE-Q ----_---_--_--_ ____________________~~~~~~~~~~~~-~~-~~~~
f-'ECkANICAL FNG
FkILCSCF~Y
LAh
PI-YSICS
e ICCt’EYISlPY crrra!_ PZYCk
FPLi.Ch
VFI CFCICINE
ZCCLCGY I’ ’ ‘-I pry I & LL LI.L
FCRESTRL
At’ER STLCIES
CEhTISTPY
PkYSICLCGY ARCkAEGLCGY
CCPFARE LIT
eCTAhY
f'ECIC.IKE Ft-VS Tl-ERAFY
CbEt'ICAL ENE PI-PRPACY
APPLIEC b'ATk
CCEANCGRAPt'Y
FATFCLCEY GERt'AN
PtARCACCLCGY
CCCl,P TkERAFY
STATISTICS
t'ETALLUPGY
AERCKALT EhG
CLACSICCL LChC
CEhET ICC
EhlCl’CLCGY
PhATClPY
FAR EASl LAhG
f?AClERItLCGY
RLSSIAN ASlRChCCY
PARASITCLCGY
t!ICPt-YSICS hEPR EAST LdNC
SLAV It STLO IES
IlALIAh
CFTCCETRY
PIhIhG
CSTECFATbY
hCT IN PPCVE LhCEC ICEC TCTPL
KC RFSPChSE
I I I 75 I 0.22 I 44c I
71 I 0.21 I 350 I
66 I 0.15 I 469 1
65 I c-19 I 482 I
65 I 0.15 I 475 I 64 ! 0.19 I 544 I
43 i 0.18 I 543 1
57 I c-17 I 563 I 47 I c.14 I se9 I 9: ’ ; 0.13 1 55e 1
c-13 t 4e9 I 41 I 0.12 I 5Sl I 41 I c.12 I 4C2 1
40 I 6.12 I 556 l 39 I 0.11 I SC@ 1
39 I 0.11 I 550 I 34 I O*lC I 54t 1
24 I O.lC I 553 I 29 1 0.08 1 512 I 2s I O-O& I 355 I 29 I 0.08 I 452 I ie I C.OE 1 SC4 1
26 I 0.08 I 514 I 25 1 0.07 I 45t I 25 I o.c7 I 52C I 24 1 0.07 I 421 1 21 I o.oc I 545 I
2c I o.cc I SC9 I
18 I 0.05 I 4Cl I
17 I 0.05 I 454 I
16 I 0.05 I 667 1
1c I 0.05 1 5E9 1
16 I 0.05 I 428 I
16 1 0.05 I 5if! I 16 I c.05 I 545 I
12 I 0.03 I 47E 1
11 I 0.03 I St6 1
@ I 0.02 I 579 I
71 c-02 I 463 I 7 I 0.02 I 521 1 6 1 0.02 I 5E3 I 6 I 0.02 I SE2 1 5 I 0.01 I 480 1
3 I 0.01 I 4eo 1 1 I 0.00 I 540 1
11 0.00 I 490 I I I
1 I 1 is97 I 7.57 I 413 1
e42 I 2.45 I 484 I 34298 I 100.00 I 404 1
994 I z.e2*1 431 I
6te
512
41c
t19
520
450 43e
573
554
474
527
460
SOC
572 457
428 546
592 459
t11 536 t4e 5C2 5c9 41e 454 425 C78 Cl2 cc5 546 571 4t6 EC2 514 4ef 501 SC0 470 604 430 443 41c 4E7 630 420
397 443
4 4.e
412
II II II
!I II
ii
I I II II II II
* kbSLC Ch ALL CKF KFSFThCfATS CClCPER* 1575 - JLhE,l57t, k1.C CCPPLETEC GRE AhC E!PCKCRCLhC CLESTIChh!IPE

TABLE C.4. RANK ORDER OF INTENDED GRADUATE MAJOR FOR MALES
II II
II II
II II II II
iI II II
N % GRE-V .----~~~~+~~~~~~~~-_~~~~~~~~~~~~---~~~~~~~~~
I I I
MEAN
GRFrQ _-___--- I
.__ II
Clt-EQ SCC SC1 I 9625 I 8.45 I 450 I 477 II
PSYCtCLCGY
CTkER MICL SC1 r 7109 I 6.74 I 536 I 548 II
5225 I ‘.55 I 4EO 1 562 II tCLCA7 ICh’
I
4e74 I 4.28 I 478 I 5c4 I I ELS IhESS/CYPCE 3547 I 3.11 I 476 I 56-i II
‘-?*ER Pt-YS ,cCI ! 3094 I 2.72 I 441 I 603 !! SE1 ICICLS STC
1
27?1 I 2.4c I 527 I 575 II
ECbC AOlFlh 2707 I 2.3E I 451 I 479 II PLL!LIC Acrlh I ?C@O I 7.35 I 496 I 505 II : ::;ck!y i 2489 I i.lE I 55s I 521 11
FCChCf'lCS I 2416 I 2.12 I 510 I 605 II
ELECTPICAL EI\G
I
22ec I 2.00 I 472 I 671 It
EhGLlSh 2143 I l.E@ I 559 I 536 It
Cl-Ek ISTRY
I
zcec I 1.83 I 512 I 647 II
CCb’FLTER SC I IS51 I 1.71 I 520 I 674 II GLI CAhCE/CCLhS 1 193e I 1.70 1 469 I 47e II CTl- l--Lt”CKlT IES
I
19cc I 1.67 I 4e4 I 479 II
PCLITICAL SC1 1FEC I 1.65 1 530 I E!ICLCGY I 1771 I 1.55 I 512 I :g: )I
GECLCGY ICE’7 I 1.4e I 516
pI-Y:lcs I 1543 I 1.35 I 550 I 889” II
FLS IC 1449 I 1.27 I 513 I 517 II CTkFR EhGlh I 1446 I 1.27 I 491 I 661 II
CIVIL EhC
I
1427 I 1 25 I 11lE I
45e I 651 II VET t’EC IC INE 132s I 500 CAT~EFATICS 12ee I 1.13 I 535 I 6":; II
L:P@fh GEVELCP I 1272 I 1.12 I 5 16 I 55s II ARCI- I lECTL’?E I Ii22 I 1.07 I 5C8 I 595 II
ElCCt-E?‘lSTRY r 1127 I o.ss 1 542 II IVECkAhICAL EKG 1113 I 0.58 I 454 1 6”:: AGPICLLTLRE I 1111 I 0.98 1 436
SCC IAL hCRK llC1 I 0.57 I 4s4 ; 45;: [/
IhTERhAT REL
I
lC84 I 0.95 I 546 I 544 II rxccce ICLCGY lC8C 1 0.95 I 5c4 I 582 II Pk-YSICAL EC I 1c2t I a.90 I 413 I 467 II ZCCLCEY 577 I O.P6 I I 5sc II see ICLOGY I 563 I o.e5 I 25 l 458 II I’CSFITAL PCFln
I
919 I 0.81 I 4f?6 I ___ 11 Eli
CCpt’UhlCATlChS SC5 I o.eo I 517 I 517 II Cl-EC ICAL EhG I Et2 I 0.76 I 475 I 670 II Ft-Y S ICLCGY
I
7t7 I 0.67 I 529 If
PbILCSOPhY 726 I 0.64 I 6G5 1 ;;; LIBFARY SC1
FlkE ARTS
I 7CR I 0.62 1 5t4 I 511 II
c53 I 0.61 I 481 JCLRhAL I St’ I C8C I 0.60 I 552 I ::I” 1:
AhTt-RCPCLCCY I 671 1 0.59 I cc7 1 546 II 1 I LAM I tt3 I 0.5P I 5c9 I 531 II 11 f’ECIClhE I t5u I 0.5e I 541 1 t23 II I I PLBLIC ktALTt- 1 t42 I 0.5t I I I ECLC Fc-YCI- t29 I 0.55 I I I CRACdTlC ARTS Lll I 0.54 I II IhClSTRIAL EhG 55s I 0.53 I 431
11 __________________:_______ ________ 1 1
MEAN
N x GRE-V GRE-Q ___~____-_-____I___-___-~~~~~~~~~~~~~~~~~~~~-~-~ II l l GECCRAPFY
II FCPESTRY
I I PCTPhY
I I IhCLSTRlAL PEL
11 CCEAhCGRAPHt
I I PI-PPtJACCLCCY
11 PI-tS THERAPY
II AFFLIEC PETI-
I I GEhET ICS
I I SFEECE
11 AERCNACT ENG
II CEhllSTPY 11 LINECISTICS II EtiTCk’C!LCGY
II SCCIAL FSYCk I I PI-ARt’ACY
I I AhATCfrY
11 STATISTICS
I I ARCbAECL@GY
II PSTRCkCCY
II hL.RSlNG
I 1 Fb TkCLCGY
II SPCNlSt-
ll AR1 v!ISTCRY
11 Pt’ER STLCIES
1 I FREhCH
II CCPPARE LIT
II eIcPbYsIcs
II YETALLLPGY
I I hLTRITICN
II CTI-ER FCR LbNG
It CLCSSICCL LCNG lt EACTERICLCGY
II 6LCICLCEY
l l EERCAN
1 I FAR EAST LAhG
11 FCRASITCLCEY
I I KEAR EAST LANG
I I CFTCPETRY
I I RL,‘SIAh’
11 SLAbIt STCCIES
I I CCCLP TkERAPY
II I’CI’E ECCkiCPICf
I I CIhIhG I I CSTECPATI’Y
11 IlALIAh
II I I hCT Ih i@CVE
II LhCECICEC
II
::_
1ClAL
KC RESPCFiSE
I
I
I I
5co I 0.49 I 509 I 555 I’: 452 I 0.43 I 5oe 1 597 II
450 I 0.39 I 517 I 5S6 II 42E I 0.3e I 492 I 527 I!
422 I 0.37 I 51t I t24 II 359 I 0.?5 ! 509 I 607 tt
372 I c-33 I 475 I 534 I I zc2 I c-27 I 595 I cs2 II 2se I 0.26 I 539 I tfs 11 297 1 C-26 : 505 I soi: II 27E I 0.24 I 496 I tts II
273 I 0.24 I 4s5 I 574 I I it5 I 0.23 1 586 I 587 11 258 I C-23 I 4Q9 I 557 II 252 I O-it I 514 I 525 II 24E I 0.22 I 454 I 575 II 232 I 0;2c I 509 I 558 II i31 I 0.2c I 493 I CES II
221 I c-19 I 553 I 523 II iC1 I C-18 I 584 I 691 II 153 I c-17 I 5c7 I 5oe II
190 I 0.17 I 456 I 571 II
1E-l I C-16 I 4C1 I 436 iI lE6 I C.16 I 1== I
1;; I c-13 I
5c7 I y; (1 5e4 I
c.13 I 565 1 5i0 II 148 I 0.13 I Cl4 I 54e II 14F I 0.13 I 567 1.43 I 0.13 I 441 1 :7: c. 1;
135 I 0.12 I 492 I :;3 I I 13c I c-11 I 462 I 110 I 0.10 I c5c I 2;; 1;
lC7 I 0.0s I 4e7 I 5cc It lC3 I 0.09 I 4EQ 1 457 It
lC3 I C-OS I 5EO I 5co I1 51 I O.CB I Cl5 I 576 ll 60 I o-c5 I 457 I 540 II 57 I
53 I
o.c.5 I 57t I ;:a 11' 0.05 I 4EE I
tc I 0.04 I El6 I 5E6 II
38 I c-03 I 565 I 34 I 0.03 I 473 I zf;
28 I 0.02 I 458 I 501
1;
II
23 I t15 II 21 I
"0-g ; 47E
524 ;
57s II 8 l 0:01 I 615 I
I I I 555 :I
I I I 4sco I 4.35 I 429 I 4e5 II 4425 I
I 11394c
I 3725
3.EE 1 519 I lCO.00 I
I 3.17*1 45e I y; 470 I ---
1 1 --_----- m--e 1 ---- 11
* CASLt Ch PLL GRE PESFChttbTS CCTCPEP, 197!~ - JUhEv1976r hk(! CCYpLFTEC GRE AKC @ACKGRCLhC Cl.ESTIChhAIPE
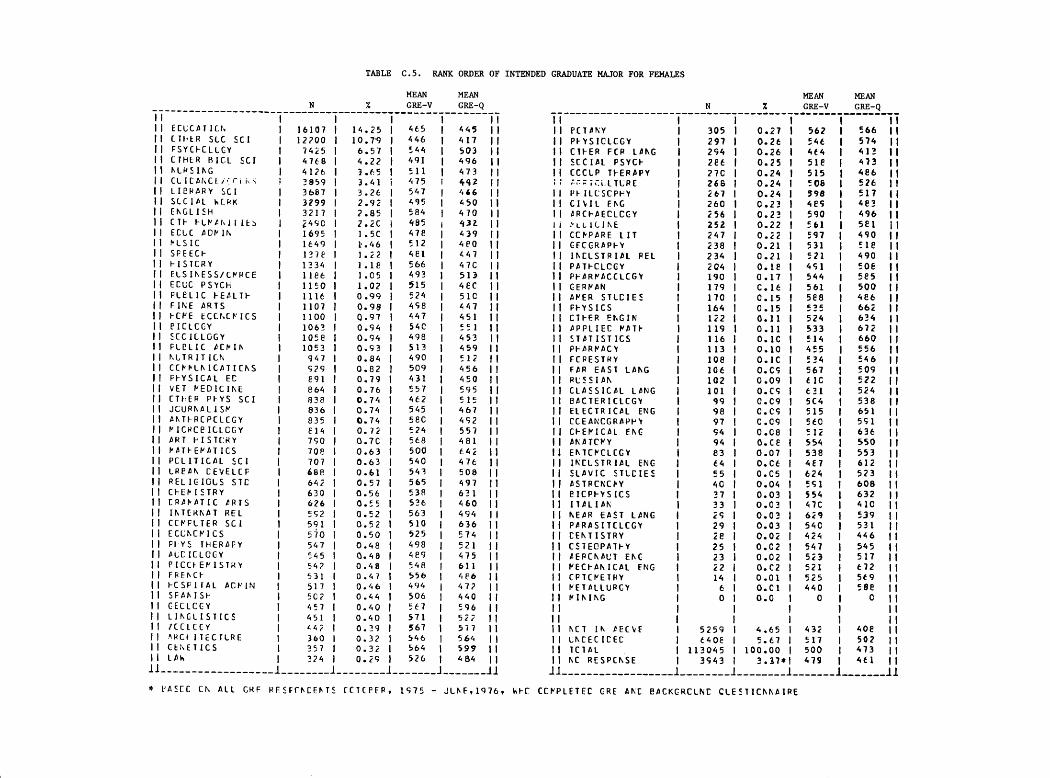
TABLE C.5. RANK ORDER OF INTENDED GRADUATE MAJOR FOR FEMALES
MEAN MEAN
N % GRE-V GRE-Q ----a---------_-___ II
_-_____-____________~~~~~~~~~~~~~~~~- I I I I I I
I I ECLC6rIc.r” i t 1 CTt*tR SLC Cc1 II FSYC~CLLCY I 11 CTHLR RICL SC1 1
II hLt’SfhG I I I CL ICbhCLi;rl h-7
II LICRARY SC1 i I I SLCIAL hC.RK
]I EhGLISH I I I C?k t--LIvCf\II AtS I I ECLC PDt’Ih I II PLSIC 11 SFEECt- 1 II I-ISTCRY It ELSI~ESS/CPPCE I I I ECI;C PSYCh I 11 FLELIC FEPLTt-
II FIh;E ARTS I I I kCb’E ECchcE’Ics
II eICLCCY I i 1 CCC ALLGGY I 11 FLCLIC C’CCIh
I I hLTRITICh I II CCt”FLhICATIChS
11 FkYSICAL EC I 11 VET F’EDICIhE II CTt*ER PbYS SCI I I I JCUPhALISv I I l PhTbRCPCLCGy
11 PICHCP ICLCGY I I I PHT t’ISTI’RY 1 I t’ATkEt’4T ICS r II PCLITICAL SC1 I
II LRPAh CEVELCF
II RELIEIGLS STC I I I Ct-EFISTRY II CRbFbTIC bRTS 1 11 IhTCHhAT REL I l l CCt’FLTER SC1
I I ECChCfJICS I I I FtyS 1HERbFY
I I PLC ICLOCY f I I PICCkErISTHk
I I FPEhCt I II t-CSFITAL PCCIN I
II SFlhISt-
I I CECLCCY r 1 I LIhCLISTICS
I I lCCLCCY I I I fiHCkIliCTLRE I I I CtnETICS 11 LPh I
16107 1 14.25 1 4t5 I 445 II 12lOO I 10.7’9 1 446 I 417 II
74i5 1 6.57 1 I 503 I I 4768 I 4.22 1 1;; I 496 II 4176 I 3.65 I 511 I 473 II 3859 I 3.41 i 475 i 642 II 3687 I 3.26 I 547 I 446 II
3P99 I 2.92 I 495 I 450 II 3217 I 2.85 I 584 I 470 II Z4YC I 2.2c I 485 432 II 1695 1 l.5C I 471! I 439 II 1649 I k.46 I 512 I 4eo ii 137E 1 .i2 I
LE I 4e1 I 447 II
1334 I 566 I 47c II llf!b I 1.05 I 493 I 513 II 1150 I 1.02 I 515 I 4EC II 1116 I 0.99 I 524 1 5lC II 1107 I 0.98 I 4F8 I
1100 I 0.97 I 447 I “4:: 1;
1063 I 0.94 I 54c 1 551 II
1o:e I 0.94 I 498 I 453 II 1053 1 0.93 I 513 I 459 I1
947 I 0.84 I 490 I 512 II
929 I 0.82 I 509 I 456 II e91 I 0.79 I 431 1 450 II
e64 I 0.76 I 557 I 595 II
838 I 0.74 I 4t2 I 515 II
836 I 0.74 I 545 I 467 II 835 I 0.74 I 5ec I 492 II El4 I 0.72 1 524 I 557 II 790 I O.7C I 566 I 481 II 7oe I 0.63 I 500 I 642 11
707 I 0.63 I 540 I 476 II 6ae I 0.61 I 543 I 508 II
642 I 0.57 I 565 I 497 II 630 I 0.56 I 538 1 631 II
626 I 0.55 I 536 I 460 II 552 I 0.52 I 563 I 494 I I 591 I 0.52 I 510 I 636 5jo
II I 0.50 I 525 I 574 II
547 1 0.48 I 498 I 521 II
545 I 0.48 I 4F9 I 475 II 547 I 0.48 I 548 I 611 II 531 I 0.47 I 556 I 4F6 11
517 I 0.46 I 494 I 472 II 5c1 I 0.44 I SO6 I 440 II 457 I 0.40 I 5t7 I 596 II
451 I 0.40 I 571 I 52; II
L4i I 0 .39 I 567 l 577 II 360 I 0.32 I 546 I 564 II ?57 I 0.3.2 I 564 I 599 I I 324 I 0.2s I 526 1 484 II
11 -__-----------__-- 1 1 1 1 ________ ____-___ ------- ------- 11
MEAN MEAN N x GRE-V GRE-Q
___________________---~~~~~-~~-~~~~~~--~~~~~~~~~~~~~~~~~ I I 11 PCTAKY
I I PkYSICLCGY
11 Clt-ER FCR LPhG
I I SCCIAL PSYCt-
11 CCCLP TkERCPY ; : :*lt; iC.i.LTcRE
I I PI- ILCSCP~Y
II CIbIL EhG 11 bRCt-AECLCGY
I i f’LL 1CIhE
II CClvPARE LIT I I EECGRAPFY
II IhCLSTRIbL PEL
II PbTkCLCGY 11 Ft-PRt’ACCLCGY
1 I CERCAN
II PP’ER STLCIES
II Ft-YSICS I I Clt-ER EhGIN
II PPFLIEC CATk
I I STATIST ICS II PkPRtJACY
II FCPESTHY
11 FPR EAST LAhG
II PLSSIbh
I I CLASSICAL LANG
II BPCTERICLCGY
I I ELECTRICAL ENG II CCEAKCGRAtJt’b
II CkECICAL EhE
I I 4hATCt’Y
11 EhlCt’CLCGY
I I Ih’CLSTRlbL ENG
11 SLAVIC STLCIES
II PSlRCNCCY
I I CICPI-YS ICS 11 ITbLlbh II hEPR EAST LANG
II PARASITCLCGY
I I CEhTISTRY
11 CSTEOPATkY
II AEPChbUT Eht II t’ECt-AhICAL ENG
II CPTCPETPY
II CETALLUPGY II CIhIhG
11 11 hC1 Ih PECLE
I 305 I 0.27 ;
I 562 I 566 II
297 I 0.26 I 546 I 574 II 294 I 0.26 I 4t4 I 413 II 2et I 0.25 I 51e 1 473 II
27c I 0.24 I 515 1 268 I 0.24 I 508 I 2;: If
i67 I 0.24 I 598 I 517 (1
260 I 0.23 I 4e5 I be3 I I 256 I 0.23 I 590 I 496 I I 252 I 0.22 I 561 I 5El ii 247 I 0.22 I 597 I 490 II 238 I 0.21 I 531 I tie 11
234 I 0.21 I 521 I 490 II 204 I 0.1e I 451 I 50E II 190 I 0.17 I 544 I 179 I C.16 I 561 I :z 1;
170 I 0.15 I 5ee I 164 I 0.15 I *-- E1E I ‘6:; 1 I 122 I 0.11 I 524 1 634 1 I 119 I 0.11 I 533 I 672 II
116 1 O.lC I 514 l 660 I I 113 I 0.10 I 455 I
IO@ I O.lC I 5’4 l ;z; 1;
Iat I O.CF I 567 1 509 II 102 I 0.09 I CIC I 522 II
101 I o.cs 1 631 I 524 II 99 I o.c9 I SC4 I 538 II 98 I o.cs I 515 I 651 II 97 I c.09 I 5co I 94 I o.cEl I 512 I 56s: 1 I
94 I O.Cf i 554 I 550 I I 83 I 0.07 I 538 I t4 I o.cc I 4E7 I z:: ;I 55 I O.C5 I 624 I 523 II 40 I 0.04 I 5Sl I I I 37 I 0.03 I 554 I
z;;
33 I 0.03 I 47c I 41c II is I 0.03 I 6i9 I 539 l l 29 i 0.03 I 540 I 531 II 2e I 0.02 I 424 I 446 II
25 I 0.02 I 547 I 23 I 0.02 I 523 I ::: 1; i2 I o.c2 I 521 I 14 I 0.01 I 525 I :i: 1; 6 I O.Cl I 440 1 58f! 11
0 I 0.0 I 0 I 0 II
I I I ; 1:
5259 I 4.65 I 43i I 4ofJ II I I LhCEC ICEC
Il 1ClAL
I I ht RESPCr\SE
517 I 502 II 500 I
I 3943 I 3.37+1 479 I
ll__________________l _--_____ 1 1 __---___ ____--- 1 --_--_- 11
* PASKC Ch ALL GKF PE’FChCEFTS fCTCPEP, 1975 - JLhFt1976r hkf CCt’PLETEC GRE Ah’C @PCKGRCLF;C CLE’TIChKAIRE

TABLE c.6. RANK ORDER OF INTENDED GRADUATE MAJOR FOR MALES AGE 22 OR LESS
I I 11 PSYChCLIGY
II CII~LH SIC SCI t t CTktR UIUL SC1 I I t!LSlhESS/CFHCL
t t Cl-Ek ISTHY It t-ISTCKY
II CTkLR t:-YS SC1 II HELlCIC!lrS STC
It ECCLCCICS
t t ELLCTDICAL EXG
tt BICLCGY
II FkYSICS II EhGLlSH
11 CCCFLTER SC1 iI PCLITICAL SC1
II FLCLIC ACFIh
II GECLCCY II VET I'EUICIhE
II EClrCbTICh
II f?ICCkEMISTRY I I t'ATktt'ATICS
I I ?JLSIC
tt CTHER EhGIA
tt CTI- 1Ut’CkITIES
t t CIVIL EhG
It t’ICFCf?ICLCGY tt !hTERhAT REL
11 ARCI-ITECTCRE
II LRCCh CtVELCF
11 t'ECkAhICAL EhG
II 7CCLCCY
II CkCPICAL ENG
11 k'ECICIhE
I I Fl-YSICLCGY 1 1 AGR ICLLTLRE 11 GLICPhCE/CCLKS I I Lbh 11 HCSFITAL PCklr\; I 1 see ICLCGY tt CCFFLXICATIL~S 11 FI-ILCSCFt-Y 11 SCCIAL hCHK
11 Ft-YSICAL tC
11 JCURhALISI
II AhTtPbPLLCGY
11 CRAFbTlC ARTS
I I FCRCSTRY 11 CCEbhCGRPFl-Y 11 PLCLIC t-EALTI- tt t'C1PhY
II EtCcl~bPl-Y
1 I Pt-AHPACCLCGY
MEAN
GTE-Q _a_______
I I ?603 t 6.9e t 533 t 561 ti
2953 t 5.72 t 465 I 503 II 2880 I 5.58 t 502 t
151s I 2.93 I 483 I 1460 t 2.P? I 531 t bb4 I I 1313 I 2.54 ! 565 I 537 II 1295 I 2.5: i 472 I 630 II 1268 I 2.45 I 531 I 542 11 1194 1 2.31 I 543 I 1174 I 2.27 1 505 I
y; I I
1oec t 2.10 t 516 t 1056 I 2.04 t 574 t
;y: ii
1023 I l-G@ I 602 I 960 t 1.@6 I 542 I
934 I 1.81 078 I 1.70
859 I I .66
821 I 1.59 814 I 1.58
324 t 617 tJ
497 I 614 II 4E!7 1 539 II 553 I bb3 I I 556 I 714 II
751 I 1.45 I 523 I 538 II 750 I 1.45 I 520 I 687 II 720 ! 1.39
679 I 1.31
652 t 1.26
626 I 1.21
616 I 1.19
574 I 1.11
558 I 1.08
553 I 1.07
548 I 1.06
512 I 0.99 495 I 0.96
476 I 0.92
43s I 0.85
437 I 0.85
430 I 0.83
430 I 0.83 401 I 0.78
3.79 1 0.73
37E I 0.73
337 I 0.65
334 I 0.65
317 I 0.61
?P5 I 0.55 275 I 0.53
274 t 0.53
277 I 0.53
504 I 507 tt
481 I ceo II 507 I 5s7 II SC4 I 562 I I 519 I bo9 I I 521 I 573 II 483 I 53e I “bfY 1; so3 I 689 II 542 t
529 I :i: 1)
452 t
470 I ‘5:: ;I
$28 I 561 II
482 t
508 I :;“8 II
512 I 608 t
;;; 1)
479 I 418 I 2: t; 548 I !I31 II
~ 570 I 545 I ::: ;I 511 I 605 II 518 I 632 tt
505 I 572 II 268 t 0.52 t 546 t 6C2 tt 242 t 0.47 1 308 I 573 II 234 t 0.45 I 530 635 I I
II___________-______l_-______l________ _______l_______ll 1
MEm MEAN
N I GRE-V GRE-Q _______________-_----~~~~~~~~~~~~~~~~~-~~~~~~~~~~~~~~~ II I I I I II
II Ii I I II II
FIhE ARTS GEhETICS AFFLIEC PbTt- ECLC ACPIh I FFYS lPER!FY IhCLSTR IAL REL I IhCLSTRlAL EhG LIPRARY SC1 ! ASTRONCPY I SFEECI-’ AERCNAL’T ENG I AhPTCPY STATISTICS I EhTCk’OLCGY I ECLC PSYCl- SCC I AL PSYCP I ARCFAECLCGY LIhEL IS7 ICS I BICPI-VSICS I CEhT ISTPY Pt-ARrACt I FP Tt’CLCGY ART HISTCRY 1 FREhCH KLTR IT ICN 1 SPAKI Sh 1 CLCSSICPL L6NG CCPPARE LIT I BlJER STLCIEC ‘I YETALLURGY E!ACTERICLCGL I GEPPAK ALC ICLCIGY 1 FAR EAST LAhG CPTCPETRY I CTI-ER FCR LAhG 1 RLSSIAN REAR EAST LANG 1 SLAVIC STLCIES hLRS ING I PARASITCLCGY C lh ING I CCCLP TFERIPY I CSTECPATt-Y I--CPE ECCNCPICS I ITPLIAh I
hCT Ih CE’CVE LhCEC ICEC I TClPL KC RESPCNSE I
220 1 0.43 I 202 1 0.39 I 201 I a.39 I 198 I 0.3e I 192 I 0.37 I 168 I 0.3k I 179 I 0.35 1 175 I 0.34 1 It1 I 0.31 I 160 i 0.31 I 155 1 0.30 t
136 t 0.26 I
::I 5 I I 0.25 0.26 I I 129 1 0.25 I 126 I a.24 1 108 I 0.21 1 1oe 1 0.21 I 103 I 0.20 I 103 I 0.2c I
94 I o.ie I 91 I 0.18 I 85 I 0.16 I 83 I 0.16 t
78 I 0.15 I 76 1 0.15 I 75 I 0.15 I If I 0.15 1 70 I 0.14 I 66 I a I 65 I :::; 1 45 I 0.0s I 42 I o.oe 1 41 I 0.08 I 39 I o.oe I 37 I 0.07 1 28 I 0.05 I 28 I 0.05 1 25 I 0.05 1 23 I 0.04 I 18 I 0.03 I 14 I 0.03 I 12 I o.c2 I
11 I 0.02 I 7 I 0.01 I 3 I 0.01 I
I 1 I 1
1376 1 2.t6 1 2716 1 5.26 I
51650 t 100.00 t
1906 t 3.5w I
489 549 547
458
464
491
459
55s
591
508
515
501
517
507
509
518
560 629 566
472
475
515
578
572 5oe
452
656
619
582
505
500
554
479
bC9
4e4
4ec
634
5t7
588
476
53C 469 463
52a
4e9
617
450 534 517 499
493 11
’ G’: f1 I 5ft jI
543 II 553 11 660 II 524 II 705 II 517 II b7E 11 558 II 712 II 571 I1 536 Ii
545 II 535 11 629 11 tei ii 574 II 593 II 611 11 52e 11 539 II 6OP 1 I 479 II 603 11 561 II 580 II 686 II 585 II 577 II 497 II 564 It 583 1 I 473 II 605 II 516 11 404 II 546 11 598 11 621 II 508 II 586 II 500 II 513 II
II
524 II
604 11 58s II 565 II
9 CA’EI: Ch ALL GRE CESFCbCEhTS CCTCFEP. 1975 - JLhE,lS7t, k’l-C CCPPLETEC GRE AhC f!ACKGRCLhC CLE’TIChhbIFE

TABLE C. 7. RANK ORDER OF INTENDED GRADUATE MAJOR FOR FEMALES AGE 22 OR LESS
MEAN MEAN
GRE-V GRE-Q ---__----------_
MEAN MEAN N x GRE-V GRE-0
--_____--_-_________~~~~~~~~~~~~~~~~~~~~~~~~~~~~~~~~~~~~ I I I I I I I
1 I PPCI-IIICTCPE
I I PI-US ICLCCY
II CECICIr\E I I PCFICUL7~PE
II PRCkAECLCGY
11 SCCIbL FSYCk
l l PI-ILCSOFkY
II CCPPAPE LIT 11 CTkER FCR LANG
II IhCLSTRIAL KEL
11 CECCRAPI-Y
11 CCCLP Tt-ERAPY
Ii PAlI-CLCEY
II Ft-PRCACCLCGY
II FI-YSICS
II EFPFPh
I I APEH STLCIES
ll CIbIL EhC
II APPLIEC YATt-
11 CTI-ER EhGIh
I I SlPTIS7 ICS ll CI-Ef'ICAL EhG
II CLCSSICbL LEtiG
II CCEAKCGRAPt-Y
!I RLCSIAh
1 I PACTERICLCGY 11 FCPESTRY
II FAR EbS7 LAhG
II PkbRtJPCY
11 ELECTRICAL EhC
I I ENTCfJCLCGY
I I PhPTCCY
I I SLPVIC STLCIES I I IhCLSTRIbL EKG
II e1cptYSICS II ASlRChCk'Y
II hEbR EAST LEhG
11 ITALIAN
II PPPASITCLCGY
II FECkPNICAL EKG
II AERCNAUT EhG
11 CSlECPAll-Y
I I CEhTISTKY
II CPTCCETRY
I I IVETALLUPGY
iI PIkING
II II hC7 Ih AECVE ll LhCECICEC 11 TCTAL
11 hC RESPCNSE
210 i 0.38 i 195 I 0.35 I 191 I 0.34 I
1ec I 0.32 I
0.31 I
0.31 I 164 i 0.29 l 156 i o.2e I
150 I 0.27 I lb9 I 0.27 I 136 I 0.24 I 133 I 0.24 I 131 I 0.23 I 129 I 0.23 I 125 I 0.22 I li4 I 0.22 I
98 i 0.18 l
97 I 0.17 I 94 I 0.17 I
86 I 0.15 1
e1 I 0.15 I 74 I 0.13 I 74 I 0.13 I 73 I 0.13 1
72 I 0.13 I 69 I O.li I 68 I 0.12 I
65 I 0.12 I 63 I 0.11 I 61 I 0.11 1
56 I 0.10 I 55 I O.lC I
45 I 0.08 I 41 I 0.07 I
29 I 0.05 I 27 1 0.05 I 22 I 0.04 I 20 i 0.04 I 2c I 0.04 I
17 I 0.03 I 15 1 0.03 1 14 i 0.03 I 12 I o-c2 I 11 I a.02 i
4 I 0.01 I 0 I 0.0 I
544
542 558
50s
592
503
to4
t10 47t
517
51.5
499
483
550
548
55e
565
507
5i7 542
505 528
626
5c5
613
517
522
581
467
535
559
551
CiS 4S6
5c1
t14 618
4El
523
540
5c7
574
4t2
512
47e
0
I I I I
2127 I 3.@1 1
4376 I 7.04 I 55e23 1 ico.00 I
2322 I 3.99* I
451 522
507
491
i 571 ii
1 579 II I 5e6 II
! 537 514 ll 11
I 4E3 II
I 533 ,I
1 z 1; 1 498 !!
I 53c II 1 506 502 Il II
I 599 II I 667 I I I 513 II
I 547 501 II II
I 600 II I 642 II
! 667 I I
i 9;: II
I Ef8 1; 553 II
I 56e 515 II 11
I 556 II I 663 582 II II
I 548 II
I z II 622 II
I 632 I I I 409 546 II II
I 519 691 II II
i 590 565 II 11
I 439 II
I 620 551 I II I f 0 II
I I I
I 2’;; j/
I 486 499 II II
11 1 ---------------__- __--__-_ 1 _-__-_- 1 1 _____-_ ----_-_ 11
1 I 5000 I 8.36 I 4994 I 8.95 I 4391 I 7.87 I 2693 I 4.82 I 1872 I 3.35 I 1624 I 2.01 I
1480 I 2.65 i
1403 I 2.51 I
1209 I 2.17 I 1132 I 2.03 ’
1064 1 1.51 I 1007 I 1.80 I
780 I 1.40 I 686 I 1.73 I 674 I 1.21 I 642 I I.15 I 591 I 1.C6 I
560 I 1.00 I 540 I 0.97 I 540 I 0.97 1 531 I 0.95 I
516 I 0.92 1 515 I 0.92 I 485 I 0.87 I
484 I 0.87 I 477 I 0.85 1
474 I 0.85 I 458 I 0.82 1
456 I 0.82 I
452 I 0.81 I 450 I 0.81 I
441 1 0.75 I 432 I 0.77 I
424 1 0.76 I
406 I 0.73 I 405 I 9.73 I
395 I 0.71 I 385 I 0.69 I 381 I 0.68 I 374 I 0.,67 I
361 I 0.65 I
354 I 0.63 I 349 I 0.63 I
344 I 0.62 I
336 I 0.60 I
294 1 0.53 I
293 I 0.52 1
269 I 0.48 1
?4C I 0.43 I r’35 I 0.42 I 271 I 0.40 I
217 I 0.39 I
I I LCLCAT ICI\
CTHER SLC SC1 : FSYCt-CLCGY
TTt-ER BIUL SC1 i
SCC IPL hCRK ! EhCLISb ! L IPRAKY Lil
CL1L~l\Ct/CLLI\S I
CTt+ t--Ll'PhITIES I hLHcIhC 1
FLSIC ;
SPEECk
t ISTCRY i
e 1CLCGY I PLSIhESS/Ct'FCE
VET PEL'IClhE I hLTbITICh
see ICLCCY f I'LPLlC !-EALTh I CCFFLhICPTIChS I
Flr‘!E ARTS I JCLFhPLIStJ
v ICRCe ICLCGY I 4RT I-ISTC’RY
kcrt ECCr\CFICS I Cl-EC ISTHY I t'AT~EPATICS I ECUC PSYCt- I IhTEKhAT REL
FCLITICPL SC1 I PLELIC AI:b'Ih I FIYSICAL EC I AhTkHCPCLCGY I CTtitzF PI-YS cc1
ALCICLCGY I LR8Ah CEVELCP I Ft-YS Tt-ERIFY
PICCI-Et'ISTRY I CHAFPlIC AR15
ECChCF'ICS I FKthCb
CECLCCY I CCF’PUTEK SC 1 I REL ICICLS STC
ZCCLCCY I LCLC PCkIh
SFrsh ISt- I
CEr\ETICT I LLk I LIr.CLISlICS I kCSFIlAL ACbIri f'LTAhY
462
448
532
500
483
585
554 476 484
501
510 474
567
538
495
547 490
486 515
507
450 536
531 553
441
549 503
503
574 537 502
435 574
474
483 540
495
563 529
546
554
562
SC1 564 561
468
513
562
526
578 488
559
471
436 510
ciI d
454 487
407 465 448
lr99 492
452
481
558
529 596
524
458
531
463 459 471
569 4e7
470
640 646
498
509 483
469
466
513 544
477
521
529
630 469
553 495
598
639
523
570 4ec
458
603
409
541
502
573
II I I I I
I I
II I I
II
I I
II
II I I
iI I I I I
II
fI I I
II I I
I! I I ll__________________l-------1_,,,,___1_-___-_l___-___ll
* tc>LC (_h ALL GKt Nf SFChCEhlC CCTCCEP, 1975 - JLhE,lS7t, hl-0 CCIJPLETEC GRE AhC IZACKGRCLhC CLESTIChhAIPE

TABLE c. 8. RANK ORDER OF INTENDED GRADUATE MAJOR FOR MALES AGE 23-29
MEAN MEAN
GRE-V GRE-Q ._-_-----__--_-
I CTI-ER SCC SC1 !
PCYCt-CLLGY
CLUCPl ILh CTtlCH ClclL SC1 I
tTHER PI-YS SCI
PCS lNEqq/cb’RCE I LLLC PLklh
FLELIC CCp’Ih r REL IGIGLS STC I
C:!rP:cc/CCLhS
ECChCb’lCS I
EhGL I Ct! ELECTRICAL EhG I PIS’ICRY CTt- I-I-PARITIES I CCMFUTER SC1 I PCLIllCAL SC1
CECLCCY I’ fi! ICLCGY
CIVIL EhG !
PL;SIC I LRBbh CEVELCF
SCC IAL hCRK 1’
CktFIZTRY
Cll-ER ERCIh I
PbYCICAL EC I ARCt-ITECTLRE
ACR ICCLTLRE I
PECI-Ah ICAL EhG
PI-YSICS I VET f’EDiCIhE I LIF!RPRY SC1
CCt’b’bNICATICNS I
FIhE ARTS
see ICLCGY r
ZCOLCGY I FAT~EtJAT ICS
P ICRLd ICLCGY I t-CSFITAL PCCIN
IhTERKAl REL I IhCLSlRlAL EhG
ECUC FSYCI- I JCLRhALIS?’
Fl- ILCSLFI-Y I
PLI.?LIC I-EALTh I Cl-tFICAL EhG
AhTkKCPLLCCY I CKAFATIC ARTS
ClCCkE~ISTRY I CEbCKAPbY I Ft-YSICLCGY FCRESTRY
1 I L411 I 9.58 I 447 I 478 If ie40 I 6.17 I 53A I 541 II 2536 I 5.51 I 47P I so9 II 1991 I 4.33 I 477 I 545 II 1360 1 7.95 I 418 I 592 II
1346 ! 2.92 1 466 I 557 !I
1145 I 2.49 I 444 I 4e9 II
lOE7 1 2.36 I 494 1 502 ii
1074 I 2.33 I 526 I 51s 1019 ! 2.21 I 470 I 480
I/ (4
962 I ?.C9 I 92s I 1.02 I “6:; l !j90 1l I 532 II
921 I 2.00 I 436 I 648 II 916 I I.99 I 557 I 511 II 851 I i.e5 1 4E2 1 479 11
754 I 1.64 1 490 1 659 11
6&?5 I 1.49 I 524 I 514 II 671 1 1.46 I 510 I 594 II 595 I I.29 1 511 I 575 II 5eb I I.27 1 440 1 632 I I
565 I 1.23 I 509 I SC6 I I 552 1 1.70 I 516 I 557 1 I 551 I I.iO 1 503 I 487 11 541 1 1.18 I 469 I 6lG I I
537 I 1.17 I 458 I 639 I I 532 I 1.16 I 415 I 472 II
528 I 1.15 1 504 I 585 I I 515 I 1.12 I 430 I 523 11 477 1 1.c4 I 424 1 641 II
422 I 0.92 I 499 I 674 11
414 I 0.50 I SC5 I 588 11
406 I 0.88 I S66 1 516 II 392 I 0.85 I 518 I 513 II 300 I 0.84 I 483 1 478 II 388 I 0.84 I 4E3 I 492 11
384 I 0.83 I 528 I 577 I I 383 I 0.83 I 498 1 673 II 374 I 0.e1 I 502 I 566 I I 363 I 0.79 I 4s3 1 536 11 334 I 0.73 I 527 I 521 II 324 I 0.70 I 403 I 621 II 320 1 0.7c I 516 I 517 II 294 1 0.64 I 557 I 51e I I 294 I 0.64 I 602 I 561 II 292 I 0.63 I 503 I 547 II 2E!4 I 0.62 1 429 I C3t! ! I 282 I 0.61 I 566 I 546 II 270 I 0.59 I 542 I 520 I I 270 I 0.59 I 516 1 618 II
259 I 0.56 I 507 I 544 I I 243 I 0.53 I 53C I 596 t I 178 I 0.39 I 509 I 595 I I
N x GRE-V m-Q _-__________________-~~~~~~~~~-~~-~~~~~~~~~~~~~~~~~__ II I
Lbk IhCLSTR /AL RFL RClAhY
PkYS TPERAPY
PI-ARt’ACCLCCb
CEhTISlRY
CCEANCGRLPbb
FkPRIVACY
L IhCC IS7 ICS
FECICIh\C
SFEECt- NLRSIKG
EhlCCCLCGY
AERChAUl ENG
SCC I AL FSYCk
ARCbAEOLCGY
GEhETICS
AhdTCPY
PATWLCCY
CTPlISlICS ART k ISlCRY
AFFL IEO PATI-
SFLhISk CCPPARE LIT
ACER STLCIES
CTtER FCR LANG
CElALLLRGY CERt’Ah
NLTRITICN
ALclCLCcY FRENCH
FAR EAST LAFG
PARASITCLCGY
BICPI-YSICS ASJRChCFY
PACTERICLCGY
CLCSSICLL LBhC
&EAR EAST LANG
CCCLP Jl-ERAFY
RLSS I Ah t-CCE ECCKCC ICS CFlCPElFY
SLAVIC SlbCIES
CSTECPAlHY
CIhING
ITALIAk
I I I 174 I O-3@ 1 4fP I 491 II
I I
II II
II II
I I I I
hC1 Ih PEC\rE LhCEC ICEC TCTPL hC RESPChSE
4 I 0.01 I co5 I 580 II
I t I II
2212 I 4.81 1 428 i 4e7 If 1250 I 2.93 I so5 I 551 II
46033 I ~00.00 I 487 I 540 1 I 1318 I 2.7e* I 450 ! 518 II
11 1 1 _______________-__ -__----- ________ 1 1 --e---e --m-e_ 11
165 1 0.36 I 505 1 518 162 1 0.35 I 531 I 586 159 I 0.35 1 4E6 I 535
147 I o-32 1 490 I 580 135 I 0.29 1 510 ! 589
127 I C-26 1 509 I 609 127 1 0.28 I 439 i 569
--- 123 I 0.27 1 :cs I 572
117 I 0.25 1 526 : 594
lr II II II
I’: II II
116 I 0.25 I so3 I 491 II 111 I O-24 1 526 i 530 II 111 I 0.24 1 497 1 549 il 107 I 0.23 1 474 1 664 II 105 I 0.23 1 526 I 533 II
97 I 0.21 I 553 I 520 II 92 I 0.20 I 512 I 588 II 88 1 0.19 I 517 I 557 II 84 I O-16 I 474 I 534 II 81 I 0.18 I 461 I 657 II 77 I 0.17 I 55f! I 510 II 76 I 0.17 I 519 I be2 II 75 I 0.16 I 451 I 433 II 68 I 0.15 I 620 1 545 II 63 I 0.14 I 590 I 553 II 62 I 0.13 I 484 I 482 II 59 I 0.13 I 381 I 627 II 51 I 0.11 I 579 I 557 II 48 I 0.10 I 471 I 555 II 47 I 0.10 I 504 I 509 II 47 I 0.10 I 579 1 504 II 42 I o-c9 I 617 I 589 II 28 I 0.OE i 496 I 528 1 t
37 I O.C8 I 581 I 660 II 36 I 0.08 1 554 1 639 II 33 I o-07 l 472 1 531 II
28 I 0.06 I 631 I 555 II 24 1 0.05 I 587 I 558 it
20 I 0.04 I 474 ' 17 I 0.04 I 634 1
5;; 1;
16 I 0.03 I 499 1 504 II 12 I 0.03 I 494 I 639 II 11 I o.c2 I 518 I 480 II 10 I e-c2 I 519 I 571 II
7 I o.c2 I 471 I 583 II
a L'I\:FC Ch ALL GKE KFSFChCEhT' CClCPER. 1975 - JLhE11976r hFC CCVPLETEC CRE Aht E!ACKGRCLhC CLE'lIChKAIRE

TAiiLE C.9. RANK ORDER OF INTENDED GRADUATE MAJOR FOR FEMALES AGE 23-29
MEAN MEAN MEAN N % GRE-V GRE-Q N % GRE-V ____________________~-~~-~~~~~~~~~~~~~~~~~~~~ ----------- ____________________~~~~~~~~~~~~~~~~~~~-~----
I I
II I I I I I I !I
II I I I I II
ECLCDI 1Ch
ClHCR SCC SC1
PSYCt-CLCGY
hLKS IFiG
GL I CAhCE/CCLhS
TTFEP e1cL SC1
L ItiHAHY SC1
EhGLISt SCC 1 AL hORK
;Tt. I-LFAhITIES
ECUC ACIJIh
CLSIC
FCt’E ECChCF 1CS
PLt?L IC FEALTt-
ECLC FSVCt- FINE ARTS
PLE?L IC ACt’Ih Ft-YSICPL EC
I-ISTCRY
ELSIhESS/Ct’RCE
see ICLUGY CCbkLKICATIChS
PICLCCY
CTHER PbYS SC1
SFE ECt- LhTkRCPCLOGL
hLlRIlICh
JCURhALISf’
F ICPLBICLCG!
ART t-ASTCRY t,ROAh CEVELOP
VET FkCICIhE
CRAt’AT IC ARTS
RELIGIOLS STC
t-CSF ITAL ACf’ IN t’ATt-Et’AT ICS
CCt’PLTER SC 1
PCL IT ICAL SC I
LIhGLISTIXS
ECChCt’lCS
PkYS THERAPY
SFAh ISt-
Ct-EC ISTRY
ARCt- I TECTLRE
FRLhCt-
c ILCkEt’I STKV
CCCLF Tt-EWAFY
IhTEKNAT KEL
ALCICLCGY
CIVIL thC_ ZLCLCGY
CECLCCY
I I 6850 I 18.23 I 4564 I lP.15 1
2007 I 5.34 I
1451 I 5.19 I
1534 I 4.08 1
1467 I 3.90 I 1354 I 3.60 1
1068 I 2.84 1
I002 I 2.67 I
862 I 2.29 I 566 1 1.51 1
432 I 1.15 I
432 I 1.15 1
420 I 1.12 I 419 I 1.12 I 415 I 1.10 I 389 I l.C4 I
382 I 1.02 I 3EO I l.Cl I 349 I 0.93 I 322 I O.ft I 297 I 0.79 I
286 I 0.76 I 284 I 0.76 I 277 I 0.74 I 275 I Ta I 271 I :::; I
255 I o.te I 251 I 0.67 I 228 I 0.61 I i16 I 0.58 I 191 I 0.51 1
190 I 0.51 I 181 I 0.48 I 180 I cl.4l? I 178 I 0.47 I 170 I 0.47 I 173 I 0.46 1
156 I 0.42 I
154 I 0.41 I 133 I 0.35 I 132 I 0.35 I 124 I 0.33 I 123 I 0.33 I 122 I 0.32 I
118 I 0.31 I
114 I 0.30 I 107 I 0.2e I 107 I 0.7R 1
90 I 0.26 1
f?7 I 0.23 I
H7 I 0.23 I
461
440
554
514 468
484
541
579
501
406 473
512 451
533
506
492
518 426
559
481
500
511 542 444
491
585 485
557 510
585
548
587
542
568
502 496
50@
333 561
475
505
49e
491
545
559 52J
524
539
468
4e1
SE!5
582
416
503
I 482
I 441 488
I 464 469
I 447
; 4 456 3 2
I 472 451
I 474 503
I 440
I 459 439
I 459
5Ci I 465
I 454 547 1 505 I 439
I :0"3 1 47c I 541 1 4ei I 491
I zs: I 490 I 473 I 642 I 627
I 472
I 509
I 54t
I 5CE
I 432
1 603
I 5to
I 478
1 z:;
I 455
I 468
I 471
I 578 I 593
II
II
I CTkER FCR LPhG I
l I I II 85 I 0.23 I 474 I 425
PkYSIOLCCY
I
79 I 0.21 I 549 I 572
I I Pk ILCSCPbY 77 I 0.2c I too I 509
II GECCRAPkY 76 I 0.20 I 54s I 523
!f ACR ICULTCRE 1 BCTAhv
r
:5 I I 0.19 a.2c I 1 459 575 I I L,O@ 563
I I EEhET Ids 69 I c.1e I 566 I 586 I I SCCIAL FSVCk
I
67 I 0.18 I 524 1 476
I I IhCLSTRIAL REL 6-I I O.lE I 519 I 473 PETkr’ pp*I LLC & I I 59 I 0.16 I 509 I 519 ARCbAECLCCY
I 57 I 0.15 I 571 I 455
LAh 57 I 0.15 I 526 I 4E2 CCCPARE LIT I 57 I 0.15 1 5el I 474
II PECICIhE
1
5c I 0.13 I 572 I 559 At’ER STLCIES 49 I 0.13 I 59c I 482
I I FkARt’ACCLCCV 47 I G.13 I 541 I 571 Pt-ARYACY I 46 I 0.12 I 43e I 563 GERCAh
f
36 I c.10 I 587 t 505
If PkYS ICS 34 I c.os I 48e I t51 FAR EAST LAhG 32 I o.c9 I 5c9 I 51c
I 1 FCRESTRY I :i I I 0.08 1 54e I 535
I I ELECTRICAL EhG I O.CE I 470 I 635
II PhATClvY
I
29 I C.08 I 570 I 572
II STATIST ICS 27 I 0.07 I 527 I 653 CTFER EhGIh I 26 I 0.07 I 4t1 I 628
I I EhTCt’CLCCY
I
24 I o.cc I 50E I 505
1 I HLZSIAN 24 I o.ct I 5e7 I 495
I I EACTERICLCEV
I
22 I 0.06 I 478 1 515
!I AFFL IEO l’ATk 19 I 0.05 I 546 1 636 IhCLSTRIAL EhG 18 I 0.05 I 449 I to1
I I CLASSICAL LANG 1 17 I 0.05 I 635 t 525 I I Ct-EPICAL EhC I 17 I 0.05 I 480 I 621
I I CCEAhCGRAPt-Y
I
15 I 0.04 I 579 I 57s
II CSTECIPATHY 10 I 0.03 I 514 I 454 CEhTISTRY I 10 I 0.03 I 383 I 472
11 IT AL IAR
1
9 I o.c2 I 461 I 431 ASTRChCCY 9 I 0.02 I 521 1 579
I I e ICPkYSICS
I
8 I 0.02 I 32c I 6i 1
I I SLAVIC STLCIES 6 I 0.02 I 593 I 4t2 I I FARASITCLCEY
I
6 I 0.02 I 570 I $53
II FERCNAUT ENE 6 I o.ci I 507 I 393 hEPR EAST LbhG 1 5 I O.Cl I 694 I 536
If t’ECl-AN ICAL EhC
I
3 I O.Cl I 417 I 647 CPTCt’ETRV 2 I O.Cl I 665 I 750
I I PETPLLURGY 2 I 0.01 I 365 I 525 t’ Ih ING 0 I 0.0 I 0 I 0
1 I I hCT IN Af!CVE I 1788 I 4.76 I 425 1 409
iI LhCECICEC
I 1480 I 3.94 I 510 I 482
TC TAL 37575 I 100.00 I 492 i 465 I I ht RESPChSE I 1031 I 2.67*1 467 I 447
ll-__-________-___ 1 _______- 1 -_-____l___---- ___-__I1 1
GRE-Q ----------
9 pASEC CN aLL cKE dE:FChCEhTZ CCTCBER, lS75 - JLhE.1976, hl-C CCPPLETEC GRE khC PACKERCl;hC_ CLESTIChNAIRE

TABLE C.10. RANK ORDER OF INTENDED GRADUATE MAJOR FOR MALES AGE 30 OR MORJZ
MEAN
N % GRE-V ~-~-----~---------~~_____L______________~~~_~~~
MEAN
GRE-Q .-B-_-m---
l I I I CTVCR see SC1
11 ECUC4TICh
I I CCLC ADCIh
I I EfLSlhESS/CtJHCE
II PLRLIC ACt-‘Ih
!! !‘SYCI-CLCGY
Ii CLICA~CE/CCLNS
I I CTHER I’t YS SC1
II RCLICICLS SIC I I C;I’:R RICL :c1
i i CTb WJAhITIES
II I-ISTCRY
I I ECClrCt’ ICS 11 FCLITICCL SC1
1 I CCt’PLTER SC1
iI ECLC FSYCt-
II FLECTRICAL ENG
II EhGLISt’
11 SCCIAL hCl?K
II CIVIL EAG
II FtYSICAL EC
I I CThER EAGIN
I I SCCICLCGY
II LRUEN CEVELCP
11 LIBRARY SC1
11 t-CSFITPL PCtJIN
II PbSIC II IhTEPhAT REL
1 I ACR ICliLTLRE
II CCFFLhICATIChS II IhCLSTRIAL ERG
II FINE ARTS
I I PAlI-EFAT ICS
I I EICLCC-Y I I FLf?LIC ktALTt-
II t-‘ECtAhICAL EhG
II IKLCSTRIAL REL
1 I AhTtPCPCLCCY I I Cl-EPISTRY
II GECLCGY
1 I ARCE ITECTLRE
[I Ft-YSICS
II GECGPPPI-Y
1 I hLK:IhG 11 JCLPhELISt’
II CRAt’ATIC ARTS
I I PI-ILCCCFt-Y
II FICCCeiCLCGY
I I LAh I I FCIJCSIPY
I I SFAk 1LI-l
II LEI t’tClCIhL
1 I 2162 I 14.07 1
1456 1 9.47 I
1338 I 8.71 I
64.2 1 4.22 I
636 I 4.14 I
610 I 3.97 I
471 I 3.07 I
414 I 2.69 1
379 I 2.47 I
322 I 2.10 I
31Q I 2.02 I 746 I 1.60 1
242 I 1.57 I
225 I I.46 I
224 I 1.46 I
171 I 1.11 I
lt8 I 1.09 I
167 I 1.09 I
161 1 1.05 I 152 I 0.99 I
151 I 0.98 I 150 I 0.58 I 139 I 0.9c I
130 I O.E5 I 123 I 0.80 I
121 I 0.79 I 119 I 0.77 I
119 I 0.77 I
114 I 0.74 I 111 I 0.72 I
93 I o-t1 I 80 I 0.52 I
e0 I 0.52 I
76 I 0.49 I 75 I 0.49 I 73 I 0.4E I
71 I 0.46 1
69 I 0.45 I 65 I 0.42 1
65 I 0.42 I
65 I 0.42 1
to I 0.39 I
56 I 0.3t I 55 I 0.36 I
51 I 0.33 I 50 I 0.33 I 49 I 0.32 I
44 I 0.3c I 42 I 0.77 I
36 1 0.2? I
36 I 0.23 I
35 I 0.73 I
438
471
455 478
494
546
468
425 518
425
444
545
470
5CS
530
51c 449
569
501
427
357
460
474
496
5C8
479
476
5ct 398
530
473
465
490
473
508
438
459
554
456
471
44c
478 523
4@6
551
549
604
465
440
471
418
525
I
I 444 476 1; II I 463 II I 543 II I 485 ll
i 51? II 453 II CE3 II
I <iI II I 477 II I 417 II I 473 II
I 557 478 II II I 645 II
t 4e2 ll 623 II I 471 II l 442 II
I :Ki II l 605 II
I 449 II
1 I:: II I 473 II l 442 II
I 41-i II I 4t7 II I 4e7 II I t14 II l 448 II
1 t44 499 II II I 509 II I c10 II I 477 II I 505 II
I ‘St: II I 551 II
l 4;; 1) I I 451 II I 4e7 II
1 2;: II I 51; II I 4Cl II I 550 II I 361 II l 576 II
Jl_________-------_J,_______l,______-_l_______l______ll
N --___________--_____---------- I I II CFhTISTRY I
II LIhCLISTICS I I LCCLCCY 1 II CTkER FCR LAhG
I I CkEYICAL EKE 1 11 l?lC-cl-Ft’ IcTRY I I I Pk.Akt’AcY
I I PECICItiE I II ART I-ISTCRY
I I BFFLIEC :‘rTl- I II SCCIAL FZYCt- I l l APER STLCIES
I I FREhCH I 1 I SFEECI’
11 CETALLL’RGY I II CCEAhCGRAFlfY I 11 r!CTAKY
1 I PkYSICLCGY I 11 Fl-YS THERAFk
I I ARCt’AECLCGY I II AERChALT EhG
1 I STATISTICS I II PkARt”ACCLCG\ I ll EhTCPCLCGY
I I ALCICLOEY i
I I PPTHCLCEY I l l KCTR IT ICN
1 I FAR EAST LbFG I I I EICFI-YSICS I I Ah’PTCt’Y 1 I I CEErAh
II f?ACTERICLCCY : II CLASSICAL LAKG 1
11 CCt’PARE LIT I 1 l FCk’E ECCNCPICS 1
II RCSSIAK
I I hEAR EAST LPNG 1 II PARASITCLCGY
II ASTROhlCrY 1 1 I CFTCt’ETRY I ll CCCLF Tl-ER6FY
I I SLAVIC STLCIES
11 EEhETIC’ i
II PIhII\‘G II 1TALIAh I II CSTECPbTbY
11
I
II KC1 IN Af?CvE : II ChCECICEC I
I I TCTAL
II hC RESPChSE
35 I 0.23
33 I 0.21
32 I 0.21
3c I 0.2c
27 I C.lE 27 I 0.1e 25 I 0.16 25 I 0.16 23 I 0.15 22 I 0.14 2C I 0.13 I 4ei
20 I 0.13 I 572 19 I 0.12 I 498 19 I 0.12 1 492 1E I 0.12 I 401 18 I C-12 I 527 18 I 0.12 I 550
l@ I c-12 I 537
18 I 0.12 I 485
1t I O.lC I 503 15 I 0.10 I 467
14 I cwcs I 451 13 I O.C8 I 3c5 13 I o.ca I 44c
12 I o.ce I 4el 11 I 0.07 I 5c9 . .
9 I c.cc: I 454 I 7 I c.c5 I 654 I z II 7 I o-c5 I 521 1 604 II 7 I o-c5 I 541 I 537 II 7 I 0.05 I 594 1 461 II t I 6 I 5 I 5 I 5 I 5 I 4 I 4 I o-c3 I 565 I 613 ii 2 I o.Cl l 525 I 525 II 2 I 0.01 I 5ic I 450 II
2 I O.Cl I 2 I 0.01 I 535 1 715 ::i II 1 I O-Cl I 540 1 I 0.01 I
tf;c 1 s”g 1;
01 0.01 01 0 II I I I I II
1306 1 8.50 I 411
32t I 2.12 I 449 ‘I 4446: 15367 1 100.00 f
II 46& I 486 I!
448 I 406 446 I I . 2.@3*! !
MEAN
4; GRE-V -_________________
GRE-Q ----___
505 I 515 ‘1;
1 Cl7 I 5ae II 580 1 562 II
1 3et I 3eo ii
401 I 623 II 466 I 568 II 450 I 545 II 543 I 594 II ==I a_ I 503 II
489 1 645 I I 4e3
489
4i3
445
612 616 592 606 449
4t4
t15 669
435
4&5
473 543
o.c4 I 463 O-C4 I 682 o-c3 I 44t I 400 II o.c3 I 51c
0.03 1 456 1 %Z 1; o.c3 I SE0 I 440 II 0.03 I 3t3 I 393 II
II________________-_ -------_I 1 -___ 1 __-___ ---__ll 1
d EISEC Cr. ALL CRE RESFGhCEhTS CCICPER, 1975 - JL.hF.lS7t. WC CCf’PlETEC ERE Aht @ACKGRClht ClESTIChhkIPE

TABLE C.ll. RANK ORDER OF INTENDED GRADUATE MAJOR FOR FEMALES AGE 30 OR MORE
MEAN MEAN MEAN N x GRE-V GRE-Q N x GRE-V ______________~~~~~---~~~~~~------------~~~~~-~~~*~-*~-- GRE-Q ___-____________________^_______________~~~~~~~~~~~~~~_
ECllCAl ICN
Cll~tR see SC1
hLKS IhlG
FSYCt-CLLGY
GUICPhCt/CCLhS LIRKARY SC1
ECLC 6Cl"lh
CT)rtR 81OL SC1
EhCL ISH
CT!- f-:rAr. IT IES
SCC IAL hCRK
ECUC FSYCt-
PLE!LIC ADCIh
t-CPE ECCI\CIUICS
SGC ICLIJGY
I-ISTCdY
E!uS IhESS/CCRCE
PLBLIC PEALTh
FIhE bRTS
rLSIC AhTbRCFCLCCY
Clt-EP PkYS SC1
RELIGICLS STC
I-CSFITAL PCrIN
E! ICLCGY
CC~~LhICATIChS
SPEECt--
hLTKITICN
PCLITICPL SC1 SPAhISH
ART FASTCRY
CIVIL ENG
CCYFLTER SC1
LRPLK CEVELCP
PFY'ICAL EC
JCLRhALISC
LINGLISTICS
k'ATt-EFATICS
CTt-tR FCR LANG
CKAt'ATIC ARTS
SCCIAL PSYCk
FKEhCH
PICFCt! ICLCGY
ECChCb’ ICS
PICCt-Er’ISTRY
CCt’F@RE LIT
ALC ICLCGY
Ct-Eb ISTKY
GECERAPt-Y
LAk
IhTEPhAT REL ARCk I TECTLRE
I I
4156 I 21.98 I 476 1 410 1;
2547 I 13.47 I 453 I 383 I I 1023 I 5.41 1 516 1 42E II
986 1 5.22 I 579 I 477 II e99 I 4.76 I 488 I 408 II E41 I 4.45 1 547 I 434 I! 820 1 4.34 I 4Eb I 412 II $66 I 2.99 I 471 I 404 II 501 I 2.65 1 589 I 422 I I 399 I 2.11 ’ 4135 I 382 II 396 I 2.09 i 532 1 419 Ii 263 ! 1.39 I 551 I 458 II 207 I 1.10 I 529 I 436 11 177 I 0.94 I 458 1 402 I I
1ts I O-E9 1 535 I 415 II 167 I O.f?R 1 576 I 443 II 156 I 3 I
,“:h I 519 I 474 II
153 I 536 i 456 II
152 I 0.80 I 513 I 418 II 15c I 0.75 I 520 I 423 II 125 I 0.66 I 587 I 440 11
11s I 0.63 I 465 I 443 I I 115 I 0.61 I 561 I 432 I I 113 I 0.6C I 491 I 412 II
87 I 0.46 I 543 I 510 II 87 I 0.46 I 514 I 418 II 85 I 0.45 I 537 I 416 II 7@ I 6.41 I 5Cl I 441 I I 78 I 0.41 I 574 I 458 11
75 I 0.4c I 498 I 386 II 74 I 0.39 I 609 I 444 II
64 I 0.34 I 472 1 400 II 64 I 0.34 I 562 1 643 1 I 63 I 0.33 I 553 I 480 II 62 I 0.33 I 437 I 401 I I 58 I 0.31 I 575 I 423 iI
58 I 0.31 I 5c4 I 475 I I 55 I 0.29 I 495 I 613 II 55 I 0.2s I 422 I 343 II 49 I 0.26 I 566 I 4c9 11
44 I 0.23 I c7c I 43s II 44 I 0.23 I 563 i 423 II 43 I 0.23 I 510 I 499 II 40 I 0.21 I 525 I 38 I 0.2C t 482 i ;o”; I) 34 I 0.18 I 565 I 433 I1 31 I O.lC I 585 I 480 II 28 1 0.15 1 56P I 596 II
241 0.13f 549 I 427 ii
24 I 0.13 I 521 I 424 II 23 I 0.12 I 477 I 401 II 23 I 0.12 1 5E!b i 533 II
eAStC Ch ALL GRE PESFChCEhTZ CCTCEER, 1975 - JchF, 197t v k-it0 CCt’PLETEC GRE AhC BACKGRCLhC CLESTIChhbIRE
11 ll ARCt-AECLCGY
11 PI ILCSCFt-Y
II FbYSICLCCY
11 VET PECICIKE
11 bt'ER STLCIES
11 rCClrP TkERAPY
II (;tPt'Ah
II IhCLSTHIAL EEL 11 PCTANY
!! 'FC?fCY
II ZCCLCGY
II PAThCLCGY
II EEhETICS
I/ AGPICL'LTLRE
II Ft-YS Tt-ERPPY
11 Pt-ARFACCLCGY
I! CLCZSICPL LChG 11 CTkER EhGfh'
II PhATCrY
II FPP EAST LbhG
11 t'EClCIKE
II CCEAhCGRAFkY
II FCQESTRY
iI ELECTRICAL EhG
II RLSSIPN
II STATISTICS
II AFFLIEC PATk
Ii CEhTISTRY
II t?PCTERICLCGY
II PkYSICS 11 IhCLSTRIAL EhG
I I PSTRChCFY
II ITPLIAhl
II CL@LIC STLCIES 11 PkPRb'ACY
)I PARASITCLCGY
II EhTCt'OLCGY
1 I t'ECt-AKICAL EF;G
II PERChbUT EhG
II Ct-Et'ICAL ENG
I] CPTCCETPY
11 CSTEOPATFY
II hEbR EAST LANG
I I PIhIhG II IJETALLURGY
I I eIcw-YsIcs
II I I hCT Ih LeCvE
1 I LhCECICEC II TCTAL
I I hC RESPCNSE
23
22
22
22
21
19
18
17 1t
:5
lK
14
14
11 11
11
10
9
9
9 9
8
6
t
6
6
6
6
5 5
4
4
4
4
3
3
2
2
2
0 0 0
1291
516 18904
543
I 0.12 I t14 1 453
0.12 I 559 I 0.12 I 571 I f:J 1;
0.12 I 622 I 56e II
c.cs I 565 I 4E4 I I o.ce 1 541
0.08 I 581
O.Oe I 607
0.07 I 485 I 4e2 I I 0.07 I 571 I 551 I I 0.C6 I 542 i 4G I I 0.06 I 551 I 47s I I o.ct I 4E6 I 475 C-05 I 658 I 512 o.cs I 552 i 593
0.05 I 517 I 474
0.05 I 460 I 462 0.05 1 580 I 58e 0.04 I c.04 I 0.03 1 523 I 0.02 I 65@ I 540
0.c3 I 643 I 698 0.03 I 578 I 66C o.c3 I 415 1 415 0.03 I 492 I 307
0.03 I 526 I 616 0.03 I 544 I too 0.02 I 593 I 508
0.02 I 438 I 368 0.02 I 605 I 423 o.c2 I 4t5 I 480 0.c2 I o-c2 I
‘3;; ) 5G I I 383 I I
O.Cl I 52c
0.01 1 635
O.Cl I 305
0.01 I 390
O.Cl I 490
0.01 I 600 0.0 I 0 0.0 I 0 0.0 I 0
I 6.83 I 415
506
497
2.7C*I 451
353 I 429 I 417 I 3E5 1

TABLE C.12. RANR ORDER OF INTENDED GRADUATE MAJOR FOR CANDIDATES WHO RECEIVED BACHELORS DEGREE 1967 OR EARLIER
-______-_____-___ I I
MEAN
GRE-V __m_--__m
N % _____------________----
I
MEAN
GRE-Q &m-d_-_
MEAN MEAN
N % GRE-V GRE-Q ____________________~~~~~~~~~~~~~~~-~~-~~~~~~~~~~~~~
II II II
II
LcLcATIc:k
CTPlH sl_c SCI
ccuc dUFIh
GLIcflhCE/Cc~hs L IERPRY scl
P:Yct-cLCGy
hkRS II\G
BLSIhE:S/CFRCE PLCL IC fiL:Ivlh
CTl+ER L!l(:I SC1
CTI- t-Lt’Ar\Il IES
EhGL ISt-
HELIGIULS STC
ECUC FSYCI- CTHER PHYS SC1 SCC IAL hCRK CCKFUTER SC I tJLSIC I-IS’ICRY PCL 1TlCAL SC1 I-Ct’E ECChCF ICS
ECChCY ICS
PI-YSICAL EC see ICLCEY CIVIL EhG
FLELIC t-EALTk CCEFLKICATICNS rCS%IT-AL ACFIh: FIhC ARTS ElCLCGY UPCPh CEVELCP PATbEt’ATICS ELECTRICAL EhG CT)_ER ENGIh AhTkRCPCLCGY IhTERhAT REL JCLRhAL I SIJ SFE ECI- Cl-Eb’ISTRY hl.TRITlCh CRAWAT IC ARTS AGK ICLLTLRE 1hCLSTRIAL EhG
LINGLISTICS
SFAh ISH GECCRAPI-Y t’ICRCf?ICLCGY ART l- ISTCRY CTHER FCH LAhG FREhCl- I’ECt- AK ICAL EKG ARCt- I TECTLRE
I I 3667 I 13.64 I 4@6 1 433 II
7517 1 13.46 I 455 1 416 11 ltE9 I 8.51 I 475 I 448 II
I320 I 4.39 I 496 I 434 II 627 I 3.36 I I 449 I I 6’9 I 3.32 I ;c”; 1 520 !! ‘161 I 2.47 I 520 I 427 i I
396 I 2.12 I 504 I 544 I I 395 I 2.12 I 522 I 498 II
ssz I 2.05 I 475 I 447 !I
378 1 2.02 I 495 I 413 II 343 I 1.84 1 600 I 440 II 315 I 1.69 1 548 I 480 II 279 I 1.49 I 272 I 1.46 I
:4’: 1 482 II
l 532 II 252 I 1.35 1 548 I 445 II 177 I a.s5 I 557 I 659 II 175 i 0.94 i 512 i 429 II 173 I 0.93 I Ee5 I 478 II 140 I 0.75 I 540 I 492 II 131 I 0.70 I 459 I 406 11
131 I 0.70 I 500 I 579 II 124 I 0.66 I 4c5 I 4ce II 12c I 0.64 i 546 I 457 II 114 i 0.61 i 457 ; 543 II 113 I 0.61 I 57c 1 510 II
107 I 0.57 I 558 I 4eo II 105 I 0.56 1 509 I 450 II
93 I =’ I y; I 443
ee I x:,-i I J ) !j14
II El I 0.43 I 534 517 II 79 I 0.42 I 489 1 645 11 77 I 0.41 I 474 1 641 Ii
71 I 0.7e I 473 I 604 1 I
68 I 0.36 I 63 I 0.34 I Ki ) 2:: II
se I 0.31 1 598 1 456 11 57 I 0.31 I 558 I 432 I I 56 i 0.30 I
55 I 0.29 I 53 I 0.28 I 584 I 447 51 I 0.27 I 498 I 448 5c I 0.27 I 494 1 615 48 I 0.26 1
;;; I 4e6
44 1 0.24 I 4 1 6 43 I 0.23 I 534
I
43 I 0.23 1 458 I ;;2”
40 I 0.21 I 38 I 0.20 I :;: 1 ::: 37 I 0.20 I 577 I 4’5
35 I 0.19 I
35 I 0.19 I
II
II II II
II II II
II
II
II
II
hCT IK ACCVE LhCEC ICEC TCTPL hC RECPCkcE ” ”
I 1
II 33 ode I 352 495
32 I 0.17 I 492 I 536 II 29 I 0.16 I 491 I 561 II
27 i 0.14 I 596 I 470 II 27 i 0.14 I 571’ l 469 II 26 I 0.14 I 453 I t41 II 25 I 0.13 I 469 I 482 II 22 I 0.12 I 54t i 53e II 22 I c-12 I 63C I 558 II 20 I 0.11 I 639 I 4E4 II 2c I c.11 I 635 I 580 II 19 I 0.10 I 582 I 641 II
19 I O.lC I 457 I 392 II 18 I O.lC I 618 I 591 II 18 I O.lC I 565 I 549 I I 17 I o-c9 I 436 I 509 II 17 I o.c9 I 573 I 447 I I 1t I O.CG I 53e I 596 11 16 I 0.09 I 582 l 583 1 I 16 I o-c9 I 546 I 540 II 15 I O-C8 I 475 I 653 I I 14 I 0.07 I 520 I 469 II 13 I o-c7 I 695 1 542 II 12 I C-06 I 617 I 436 II 11 I o.oc I 445 I 660 iI 11 I C.06 I 571 I 690 II 9 I 0.C5 I 614 I 4il II 9 I 0.05 I 514 I 4e3 iI 9 I 0.05 I 3E3 I 473 II e I 0.04 I 603 I 574 II 7 I 0.04 I 550 I to4 II 7 I 0.04 I szc I 541 II 7 I 0.04 I 460 I 487 I1 6 I 0.03 I 528 1 462 11 4 I c.02 I 473 I 573 II 4 I 0.02 I 550 1 463 11 4 I o.c2 I 505 I 550 II 4 I c.c2 I 513 I 54e II 4 I 0.c2 I 390 I 5E5 I I 3 I 0.62 I 593 I 503 II 3 I 0.02 I 693 I 630 II 2 I O.Cl I 575 I 500 I I 2 I 0.01 I 445 I 55c II 2 I 0.01 I 66C I 480 II 1 I 9.01 I 540 I 630 II 0 I 0.0 I 0 I 0 II
I I I I i fI
1402 I 7.51 I 421 1 406 iI 371 I 1.99 I 501 I 457 II
lE669 1 100.00 i 497 I 455 11 220 I 1.1611 438 1 424 II
lo___________-____l-______ __~_--~-1,~----l~~__ll 1
1hCLSTR IAL REL TCPESTRY CECLOGY CCCIAL F$YCk ALC ICLCCY PkYSIfr. PICC~tk ijil0
CEhl ISTPY LEl ~EGIClhE Af’Er! :::I::!.: PI-ILCSCPPY t’ECICIhE Lbh
PI-YSICLCGY
ZCCLOGY
PkARt’ACY
CCCL+’ TkEREFY
CCEANOGRAPI-Y
EaCTAhY
PATl-CLCEY
STATISTICS
PbYS Tl-ERAFY
CLASSICAL LPNG
CCbFARE LIT
Ct-Et’ ICAL ENG
APPLIEC CAlt-
ARCbAECLCGY
FAR EAST LAhG Ft-ARPACCLCGY PNATCt’Y PERChALl EhE EEhET ICS EhTCYCLCGY EEPCAh cIcPtJYsIcs SLAVIC STLC IES CPTCPETRY BACTER ICLCGY CETALLURCY RLZSIAN ASlRChCkY ITALIAN PARASITCLCGY
I\EAR EAST LANG
FIhlNG CSTECPATbY
* EASEL Ch ALL CRE RESFChCEt.TS CCTtl?ER, 1975 - JLhE.lS7C. hi-C CCCPLETEC GRE Pht @ACKGRCLht CLESTIChhClPE

TABLE C.13. RANK ORDEK OF IiW&NDED GRADUATE MAJOR FOR MALES WHO RECEIVED BACHELORS DEGREE 1967 OR EARLIER
II I I CTI-ER SCC 'Cl 1 I ECC;C ACk,lh 11 ECLCAliLK I It ELSihESS/CFRCE
II PLPLIC Pcrlh I II GLlCAhCL/CCLhS
II RELIGIOLS STC 1 I I P’YCPLLLGY
II CTI-ER PI-YS SC1 I
I I CTI- hLb’AkiT1ES I
II CCrFLlER sci
Ii ECOhCf'lCS I II CTHER UIOL SC1
ll ECLC FSYCF I II I-ISTCRY I II PCLITICPL SC1
II PkYSICAL EC I II CIVIL EhG
II EhCLIStJ I 11 LIBRARY SC1
I I ELECTRICAL EnG I II PLSIC I II CTHER EhGIh
11 SCCIAL hCRK I II SCC ICLLIGY
ll I-CSFITAL ACCIN I 11 CCf”~LhlCATlChS 1 II IhTEKhAT REL
Ii LRBPh CEVELGP 1’ i t ACRICLLTLRE
11 IhCLSTRIAL ENG I 1 1 b’ATk:IJAT ICC I II FLELIC 1EPLTb
II CtEb’ISTRY I It kECkAhICAL EhG
II GECCRPPI-Y I 11 FIhE ARTS
II eICLcEY I 11 GECLCGY I ll FCRESTRY
11 CRAt’ATIC ARTS I iI IhDLSTRiAL REL 1
11 ARCklTECTLRE
I I CEltTICTRY I II Pt-YZICS
I I Pk ILCSCPI-Y I I I riCRCeICLCCY
t I JCURhLL 1st t 1 I ZCGLCGY I 1 l C:hLR FCR L61.G
II AhTt-RLPCLCGY I 11 lYECiClhE I
MEN1
GRE-Q -d----L---
l I 1033 I 13.39 I 451 456 )I
9:7 I 12.41 I 463 I 467 It
821 I lQ.64 I 4e4 I 4f7 II 314 1 4.07 I 494 I 559 I]
300 I 3.P9 I 511 1 510 JI 261 I 3.38 I 47P I 459 11
242 I 3.14 I 537 I 493 II 24C 1 3.11 1 593 I 542 II ZCl 1 2.61 1 426 1 562 II 160 I 2.07 I 476 I 439 II 133 1 1.72 I 551 1 t6i II
I14 I 1.48 I 5cc l 5Ef ll
113 I 1.46 I 445 I 500 11
105 I 1.36 I 522 I II 102 t 1.32 1 575 I
;g
99 I 1.2e I 53s I 501 If
El I 1.05 I 396 I 411 II 80 I 1.04 1 453 1 613 It 60 I 1.04 I c,e2 l 472 It
76 I a.99 I 587 I 412 II 75 I 0.97 I $69 I 643 II 64 I o.es I 4e8 I 44e II 65 1 0.84 I 461 l 6C5 ll
64 I O.e3 1 533 I 48E II 5E I 0.75 1 525 1 4@6 II
57 I 0.74 I 500 I I’ 57 I 0.74 I 556 1 2::
53 I 0.69 I 534 I 534 1;
4s I 0.64 I 517 I 535 II
46 I Q.6C 1 390 I 451 II 45 I 0.58 I 452 I 6Ic II 44 I
::zz 1 487 I 669 II
42 t I 555 I 545 II 3t I 0.47 I 468 I 591 It
34 I 0.44 1 470 1 640 II 33 I 0.43 I 538 I 548 II
31 I 0.4u I 491 I 471 II 28 I 0.36 I 466 1 491 II
26 I 0.34 I 468 I 25 I 0.32 1 493 I c;z’b 1;
25 I 0.32 I 593 1 487 II 23 I 0.30 I 517 l 487 II 22 I 0.29 I 455 I 561 11
22 I 0.29 1 546 1 53e II 22 I 0.29 I 446 I 640 II 1E I 0.23 l 626 l 5f9 II 1e I 0.23 t 506 I 523 It
17 I 0.22 I 601 I 491 II
1= A I 0.19 I 569 l 15 I 0.19 I 417 ! Zif II
1;1 lE I I 0.18 0.19 1 I 572 561 l l 641 513 11 II
II
II
II
II
II II
II
II
II
II II
MEAN N % GRE-V
~~,~__~_~~~-~--Y------~~~ -----ah--c--
CCEAhCGRAPk-t I Ft-API’ACY i VET CEI‘IC INE I LIhGLISTICS
SPCh'ISP 1 LPk I STfTISTICS FREtiCh I Cf-'EPICAL EhC
APPL IEC CATb I Pi-YSICLCGY I EfICCpEt’ISTRY
PCTANY 1 Pi-YS TbERAFY
ART I-ISTGRY 1 SPEECH I At’ER STLCIES SCCIAL PSYCk 1 EhTCCCLCGY I FPTbCLCEY I AERChALT EhC
ALC ICLCEY ; hLTRITICh I FkbRt’ACCLCGY
I?ICPt-YSICS I hLRSIhG I CLASS ICPL LANG
I’ETALLLRGY I Ph67Cb’Y
I-CCE ECCKCC ICS I F6P EbSl LAFG
CFTCCETRY I ARChAECLCGY
SLAVIC STLC IES I ASTRCNOFY I GERt’Ah
NEAR EAST LANG I IlALIAh I CCCUP Tl-ERAPY
)JIhING I FAPASITCLCEY
CCb'PARE LIT f RLCSIAh
EEhETICS 1 CCTECPAThY I ~ACTERICLCGV I
KC7 IN AeCVE I ChCECICEC I TCTPL
NC RESPCNSE
I I 14 I 0.18 I 536
14 I 0.18 I 435
I’ I
1; I
0.17 I 615
0.17 I 515
I' I
lf I
0.17 I 464
0.16 l 407
I1 I 0.14 I 43t
11 I 0.14 I 503
91 0.12 I 460
9 I 0.12 I 557
91 0.12 l 572 e I 0.10 I 440
e I C.lC I 538
81 0.10 l 46t
e I O.lC I 56@
8 I C.lC I 533
71 o.cs I 616 6 I o.ce I 533
6 I o.ca I 45e
MEAN
GRE-Q -..a_---
512 625
513
391
365
674
441
679
C72
Cl8
4EO
596
431 47c
465
c,c4 495
4ee
II
iI II II II
I1 61 O.CE 1 563 1 582 II 51 C-06 I 452 I 634 II 5 I o.cft I 44E I 420 II 4 I C-C5 l 4E@ 1 593 1 t
4 I 0.05 I zi=
47;
I 470 II 41 0.05 I I 573 II
4 I 0.05 I 3e8 I 363 II 4 I ;.g ) 690 I 573 II
4 I c:o4 I
390 I 5e5 II _; I 540 533 I I 547 II 0.04 I
31 0.04 I 650 I 3:: ;I
2 I 3 I
::,"3 I 525 I 525 II
2 I 510 I 455 II
2 I c-c3 I 535 I 4E5 If 21 o.c3 I ec5 I 760 II
1 I c.01 I 4zc I 33O Il 1 f 0.01 I 72C t 580 II 11 0.01 I t:o I 5eO II 1 I 0.01 I 53c I 290 II
1 I O.Cl I 54c I tzo II 11 0.01 I 26C I 440 II 1 I 0.01 I 51c I 25c II 1 I 0.01 I 270 I 340 II 0 I 0.c I 0 I 0 II 0 I 0.0 I 0 I 0 II OI 0.0 I 0 I c II
1 I I f II
664 l e.ci I 421 1 453 II 123 I 1.59 I 475 I be5 II
7714 I 100.00 I 484 I 498 II 86 I 1.10*1 42C 1 473 II
* EASEL Ch ALL CRE PESFChCENTS CCTCf!ER, 1975 - JLhEvlS7tr hi-C CCt’PLETEC GRE AhC BACKGRCChC CLESTIChhbIPE

TABLE C.14. RANK ORDER OF INTENDED GRADUATE MAJOR FOR FEMALES WHO RECEIVED BACHELORS DEGREE 1967 OR EARLIER
I I I I ECLCATILN
Ii CTbER SCC SC1
11 ECL’C ACt’lK
i\ GLICAhCE/CCLhS
iI LlE!FARY SC1
I I hLH:IhG
1 I PSYCI-CLCGY
I I CTtER k!IOL SC1
I I EhGLISH
I I CTt I-LCPrhITIES l I SCCIAL hCRK
iI ECLC FSYCI-
II I-CrE ECCI\;Ct’ICS
II PLSIC
ii PLi?LIC ACrIh
ii BLSIhESS/Cf’RCE
ii RELIGIOUS STC ii PLE!LIC I-EALTH
Ii CTbER PI-YS SC1
iI bISlCRY
ii FINE AHTS
I i SCC ICLCCY
I I BICLCGY
Ii AhTt-RCPCLCEY
11 NLTRITIOhi
iI CCFFLhICATIChS
11 SFEECI-
iI I-C’PITAL AOClI\1
i i CCt’FLlER SC1
I I PkYSICAL EC
i 1 JCLPhAL 1st’
ii PCLITICAL SC1
I i t’ATkECAT ICS
ii CIVIL EhG I I LIKGLISTICS t 1 ART t+ISlCRY
ii SFAhISt’
11 LPI?Ah CEVELCP
i 1 CRAPATIC ARTS
i I FREhCH
II CICPCI?ICLCEY
11 CTbER FCR LANG
I I ALCICLCGY
1 I SCCIAL PSYCk i 1 CkEF ISTRY
i i ECChCt' ICS iI BICCt-EMIST2Y
ii CCCLF Tl-EPAFY
Ii Pt’ER STLCIES
ii AHCFIIECTLRE
ii CCf”FA*E LIT
II PAT!-CLUGY
I
MEAN
GRE-Q e-m_.._
2642 I 25.99 I 1477 I 13.50 I
631 I 5.77 I 55s I 5.11 I 551 I 5.c4 I 456 I 4.17 I 375 I 3.43 I 269 I 2.46 1
263 I 2.40 I
218 i I.99 I
188 I 1.72 I 173 I 1.58 I 128 I 1.17 I 1Cb I 0.97 I
93 I 5 I 82 I ,“:;5 I 73 I 0.67 I 71 I 0.65 I 71 I 0.65 I
71 1 o.t5 I ce I 0.62 i 67 ! 0.57 I
60 I c5 I 53 i kt! I 51 I 0.47 I 50 I 0.46 !
49 I 0.45 I 48 I 0.44 1
44 I 0.4c I 43 I 0.39 I 41 I 0.37 I
41 I 0.37 I 35 I 0.32 I
34 I 0.31 1
34 I 0.31 I 32 1 0.29 I 31 I o.ze I 31 I 0.28 I 28 I 0.26 1 26 I 0.24 t 25 I 0.23 i z3 I 0.21 I 21 I 0.19 I ;: - I I 0.15 I
o.ie I 17 I 0.16 f 11 I 0.16 I 16 1 0.15 I 13 I 0.12 I 13 I 0.12 I 11 I O.lC I 10 I O.CF I
4e7
459 454
5c5
556
521
608 4EP
605 5oe 553 569 457 528 5t1 542 502 579 460 600 546 5t5 554 631 5c7 559 562 519 577 422 596 5>tS 491 466 568 631 se7 56C 576 6C8 492 434 6Cl 614 575 502 4e3 576 651 653 626 536
I 417
1 ;4";
I 422 I 444
1 427 I 506 1 4.24 \ 430
I 395 I 430
1 476
1 404
1 417
i 463 I 4e7
1 439
I 4es
1 445
I 439
I 430
i 4i9 I 524 1 460 I 435 i 444
I 427 I 430
i t51
I 397
1 441
i 469 l 615 i 379 l 472 i 479 i 4i6 I 4e7 I 41i I 433 l 4e-I I 357
I
4eo
463
I 613 I 513
i 4t?i
1 457 477 I 453 554
I 515
ii 1 I I 11 EECCRAPt-Y
I I IhCLSTRIAL REL i 1 I IhTERhAT REL
II VET PECICINE I iI CLACSICPL LA&G
I I PI-YS ICLCCY 1 i I ECTANY 1 I I FCPESTRY
I I Lbk t t I CEhETICS
II ARCI-AECLCCY 1’ Ii Clt-ER EhGIh
Ii PkYS Tt-ERAFY I 11 FAR EASl LAhG 1
i 1 IhCLSTRIAL EhE
i 1 AhATCrY f il GERPAh
I I CECICINE I II AGRICULTLRE I i 1 FFFPPACCLCGY
I I PkYSICS 1 i I ~1ATISTICS
I i f!ACTER ICLCCY I i I ZCCLCGY I 11 FkAPIVACY
i 1 GECLCGY 1 ii AERChALl EhE I I PI- ILCSCPI-Y I ii CI-Er’ICAL EAC I i 1 CPTCCETRY
Ii SLAVIC STLCIES I I I AFFLLEC PATI- i 1 CCEAKCGRAPbY 1 11 tLECTRICPL EhG I
iI RLSSIAN
ii ACTRCKCt’Y I iI FPPASITCLCCY
11 NEAR EAST LANG I iI EhlC)rCLCGY
II ITALIAN I ii t’ECI-AhICAL EhG 1
11 CEFTISTFY
ii PETALLLRGY I i i CSlECFAltY
II FlhING I II BICPI-YSICS
II I
I I I hC7 Ih tecvE i 1 LhCECICEC I II 1ClAL
I I hC RESPCNSE
MEAN
GRE-Q .-__-_--
I I I 1c I o.c9 I 524 I 450 I
1c I o-c9 I 631 I 512 I IO I 0.05 I 50s I 467 I
9 I a.ofz I 652
9 I o.oe I 697 1 555; i 1 5 I a.oe I 664 i 563 I 8 I 0.07 I t28 I 5es I
7 I o.co I 490 I 4i6 I 7 I O.C6 1 544 I 437 I
7 I 0.06 I 5z6 i 541 7 I 0.06 i 644 I 6 I o.c5 I 597 1 :z;
6 I 0.05 I S65 i 51E I
6 I c-05 I 447 1 452 i
5 I 0.05 l 514 I 612 I 5 1 0.05 I 644 1 590 I
5 I 0.05 I 550 ’ 4E8 5 I
;.E; I
610 1. C42 ! 5 I
a:c5
456 I 4i2 I 5 I I 432 I 476 1 4 I a.04 1 493 I 648 I 4 I o.c4 I 583 I 595 I
4 I 0.04 I 513 I 54f I 3 I 0.03 I 543 I 427 I 3 I 0.0’ I 443 I 453 I 3 I 0.03 I 6E7 I ~17 I
2 I 0.02 I 695 I 530 I 2 i o.ct I 71c I 6i5 4
2 1 o.c2 I 375 I 575 I 2 I 0.02 I 4f5 I 515 I 2 1 0.02 I 565 I 44c I 2 I o.cz I 635 i 770 I
I I o.c2 I 545 I 390 I 0.02 I 640 I 545 I
2 I O.CI I 755 I 585 I 1 I O.Cl I 1 I c-01 I
: 1 O.Cl I 6CO I %I I C.Cl I 470 I 4EO I
738
24f
10937
134
O.Cl 0.01 0.0 0.0 0.0 0.0 0-c
6.75
2.27 1co .co
1.211
I I I I I 422 I 364 1
514 I 443 I I 506 I 4i5 I
45c I 352 I
+ CASEC CN ALL GRE RESFChCEKlS CClCPERv 1575 - JLhE.1576~ kHC CCPPLETEC GRE ChC PACtkRCLhC CUESTIChhAIRE

GRE BOARD RESEARCH REPORTS OF A TECHNICAL NATURE
Boldt, R. R. Comparison of a Bayesian and a Least Squares Method of Educational Prediction. 70-3P, 1975.
Campbell, J. T. and Belcher, L. H. Word Associa- tions of Students at Predominantly White and Predominantly Black Colleges. 71-6P, 1975.
Campbell, J. T. and Donlon, T. F. Relationship of the Figure Location Test to Choice of Graduate Major. 75-7P, 1980.
Carlson, A. B.; Reilly, R. R.; Mahoney, M. H.; and Casserly, P. L. The Development and Pilot Testing of Criterion Rating Scales. 73-lP, 1976.
Carlson, A. B.; Evans, F.R.; and Kuykendall, N. M. The Feasibility of Common Criterion Validity Studies of the GRE. 71-lP, 1974.
Centra, J. A. Graduate Degree Aspirations of Ethnic Student Groups Among GRE Test-Takers. 77-7P, 1980.
Oltman, P. K. Content Representativeness of the Graduate Record Examinations Advanced Tests in Chemistry, Computer Science, and Education. 81-12P, 1982.
Pike, L. Implicit Guessing Strategies of GRE Aptitude Examinees Classified by Ethnic Group and Sex. 75-lOP, 1980.
Powers, D. E.; Swinton, S.; Thayer, D.; and Yates, A. A Factor Analytic Investigation of Seven Experimental Analytical Item Types. 77-lP, 1978.
Powers, D. E.; Swinton, S. S.; and Carlson, A. B. A Factor Analytic Study df the GRE Aptitude Test. 75-llP, 1977.
Reilly, R. R. and Jackson, R. Effects of Empirical Option Weighting on Reliability and Validity of the GRE. 71-9P, 1974.
Reilly, R. R. Factors in ante . 71-2P, 1974.
Graduate Student Perform-
Donlon, T. F. An Exploratory Study of the Implica- tions of Test Speededness. 76-9P, 1980.
Donlon, T. F.; Reilly, R. R.; and McKee, J. D. Development of a Test of Global vs. Articulated Thinking: The Figure Location Test. 74-9P, 1978.
Rock, D. A. The Identification of Population Moderators and Their Effect on the Prediction of Doctorate Attainment. 69-6bP, 1975.
Rock, D. A. The "Test Chooser": A Different Approach to a Prediction Weighting Scheme. 70-2P, 1974.
Echternacht, G. Al ternate Methods Advanced Tests. 69-2P, 1974.
of Equating
Echternacht, G. A Comparison of Various Item Option Weighting Schemes/A Note on the Variances of Empirically Derived Option Scoring Weights. 71-17P, 1975.
Echtemacht, G. A Quick Method for Determining Test Bias. 70-8P, 1974.
Evans, F. R. The GRE-Q Coaching/Instruction Study. 71-5aP, 1977.
Fredericksen, N. and Ward, W. C. Development of Measures for the Study of Creativity. 72-2P, 1975.
Kingston, N. and Dorans, N. Effect of the Position of an Item Within a Test on Item Responding Behavior: An Analysis Based on Item Response Theory. 79-12bP, 1982.
Rock, D., Werts, C., and Grandy, J. Construct Validity of the GRE Aptitude Test Across Populations--An Empirical Confirmatory Study. 78-lP, 1982.
Sharon, A. T. Test of English as a Foreign Language as a Moderator of Graduate Record Examinations Scores in the Prediction of Foreign Students' Grades in Graduate School. 70-lP, 1974.
Stricker, L. J. A New Index of Differential Subgroup Performance: Application to the GRE Aptitude Test. 78-7P, 1981.
Swinton, S. S. and Powers, D. E. A Factor Analytic Study of the Restructured GRE Aptitude Test. 77-6P, 1980.
Ward, W. C. A Comparison of Free-Response and Multiple-Choice Forms of Verbal Aptitude Tests. 79-8P, 1982.
_ Kingston, N. M. and Dorans, N. J. The Feasibility Ward, W. C.; Frederiksen, N.; and Carlson, S. B.
I of Using Item Response Theory as a Psychometric Construct Validity of Free-Response and Machine- Model for the GRE Aptitude Test. 79-12P, Storable Versions of a Test of Scientific 1982. Thinking. 74-8P, 1978.
Levine, M. V. and Drasgow, F. Appropriateness Ward, W. C. and Frederiksen, N. A Study of the Measurement with Aptitude Test Data and Esimated Predictive Validity of the Tests of Scientific Parameters. 75-3P, 1980. Thinking. 74-6P, 1977.
McPeek, M.; Altman, R. A.; Wallmark, M.; and Wingersky, B. C. An Investigation of the Feasibility of Obtaining Additional Subscores on the GRE Advanced Psychology Test. 74-4P, 1976.
Wild, C. L., Swinton, S. S., and Wallmark, M. M. Research Leading to the Revision of the Format of the Graduate Record Examinations Aptitude Test in October 1981. 80-lbP, 1982.