Embed Size (px)
Citation preview
Old Mutual SA Businesses Day
28 May 2003
Richard Laubscher
Chief Executive

Programme
• The marketplace
• Nedcor’s position
• Strategic framework / SWOT
• Key drivers / issues
• Bancassurance
• Conclusion

The marketplace
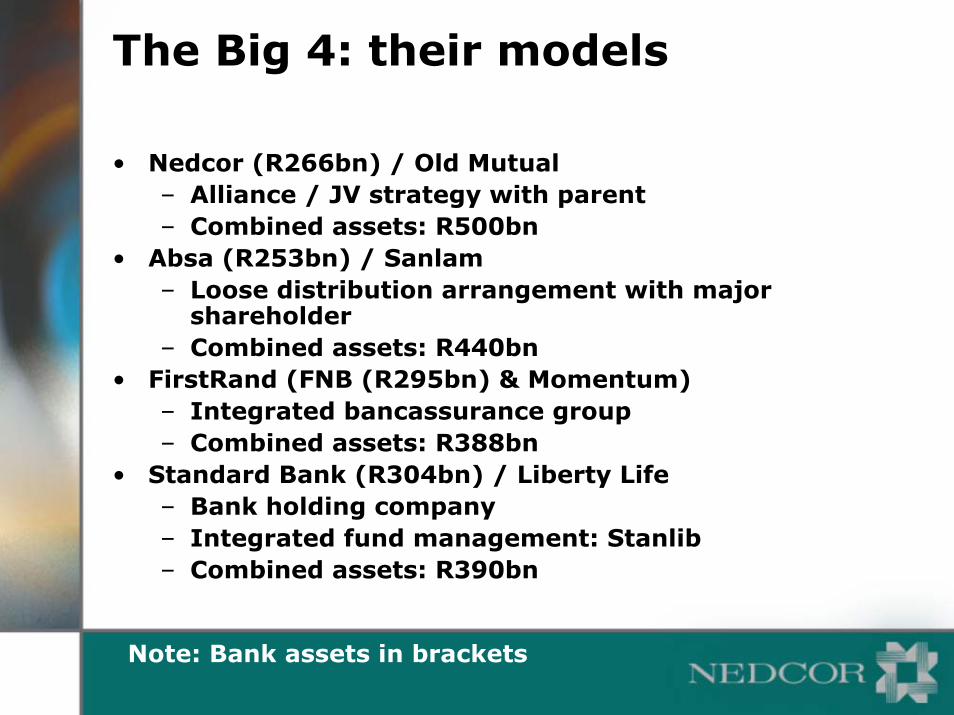
The Big 4: their models
• Nedcor (R266bn) / Old Mutual– Alliance / JV strategy with parent– Combined assets: R500bn
• Absa (R253bn) / Sanlam– Loose distribution arrangement with major
shareholder– Combined assets: R440bn
• FirstRand (FNB (R295bn) & Momentum)– Integrated bancassurance group– Combined assets: R388bn
• Standard Bank (R304bn) / Liberty Life– Bank holding company– Integrated fund management: Stanlib– Combined assets: R390bn
Note: Bank assets in brackets

Ranking the Big 4
1243Total bank assets *
3412Deposits **
3124Instalment credit **
3412Mortgage lending **
3421Other private sector loans **
1243Market capitalisation
3412SA-based 3rd party lending **
3421SA-based loans & advances **
Standard FirstRandBank
AbsaNedcorMeasure
* Source: Last annual/interim report
** Source: March DI 900 returns

Nedcor’s position

Structure
Capital One
JD Group
Old Mutual Group Schemes
R299m R72m
74.5%
DIVISIONS
R2 114m
100%/50%
70% 50.1%
R56mR206m
Stenham Gestinor & Chiswell
R354m
Amex/
Capital One
Contributions to F2002 core earnings shown above
BoE contributed R265m in its standalone form

The Big 4: Retail vs Corporate Banking
53475545Big 4 (weighted)
35064367525Standard Bank
11081197723Nedcor
11433674555FirstRand
55032682278Absa
RmCorporate (%)
Retail(%)
Corporate (%)
Retail(%)
Banc-assurance
contribution
Total bank earningsTotal bank assets
Source: JP Morgan
Annual / Interim Reports
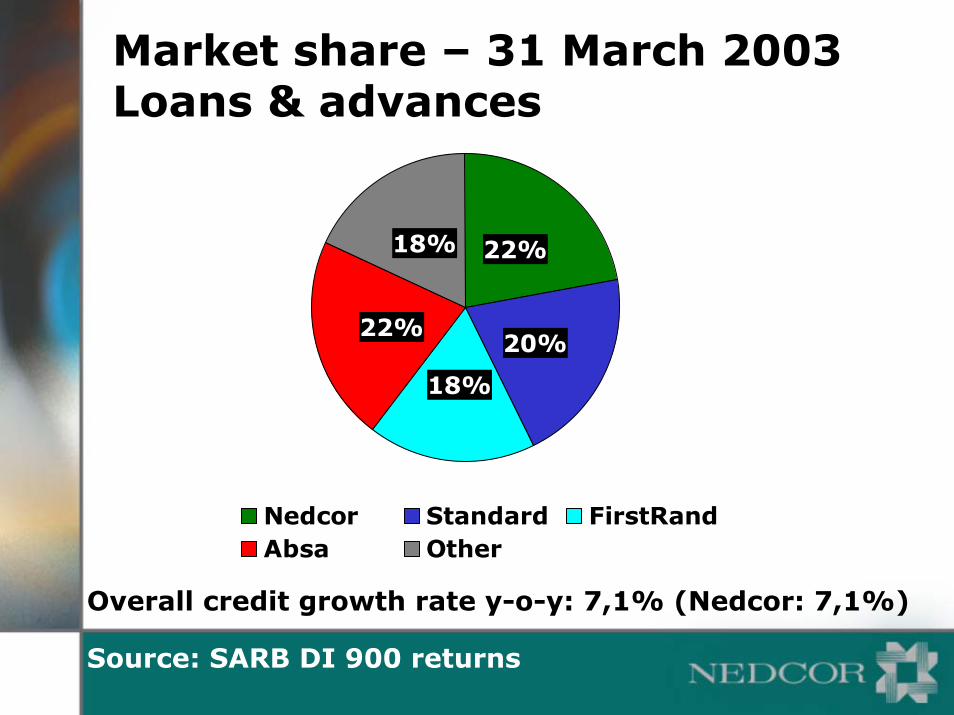
Market share – 31 March 2003Loans & advances
22%
20%
18%
22%
18%
Nedcor Standard FirstRandAbsa Other
Overall credit growth rate y-o-y: 7,1% (Nedcor: 7,1%)
Source: SARB DI 900 returns

Market share – 31 March 2003
12%
15%
18%
21%
24%
27%
30%
Jun-9
7Dec
-97
Jun-9
8Dec
-98
Jun-9
9Dec
-99
Jun-0
0Dec
-00
Jun-0
1Dec
-01
Jun-0
2Dec
-02
ABSA Firstrand Nedcor Standard
Mortgages
Growth rate: 11,4% y-o-y (Nedcor 11,0%)
Source: SARB DI 900 returns

14%
18%
22%
26%
30%
Jun-9
7Dec
-97
Jun-9
8Dec
-98
Jun-9
9Dec
-99
Jun-0
0Dec
-00
Jun-0
1Dec
-01
Jun-0
2Dec
-02
ABSA Firstrand Nedcor Standard
Market share – 31 March 2003
Loans to non-banks
Growth rate: 6,9% y-o-y (Nedcor 11,5%)
Source: SARB DI 900 returns

Market share – 31 March 2003
9%
12%
15%
18%
21%
24%
27%
30%
Jun-9
7O
ct-9
7Fe
b-98
Jun-9
8O
ct-9
8Fe
b-99
Jun-9
9O
ct-9
9Fe
b-00
Jun-0
0O
ct-0
0Fe
b-01
Jun-0
1O
ct-0
1Fe
b-02
Jun-0
2O
ct-0
2Fe
b-03
ABSA Firstrand Nedcor Standard
Instalment credit
Growth rate: 13,3% y-o-y (Nedcor 16,2%)
Source: SARB DI 900 returns

Market share – 31 March 2003
13%
16%
19%
22%
25%
28%
Jun-9
7O
ct-9
7Fe
b-98
Jun-9
8O
ct-9
8Fe
b-99
Jun-9
9O
ct-9
9Fe
b-00
Jun-0
0O
ct-0
0Fe
b-01
Jun-0
1O
ct-0
1Fe
b-02
Jun-0
2O
ct-0
2Fe
b-03
ABSA Firstrand Nedcor Standard
Deposits
Growth rate: 1,9% y-o-y (Nedcor –0,9%)
Source: SARB DI 900 returns

Net interest margin
Rbn %
50
70
90
110
130
150
170
190
210
1997 1998 1999 2000 2001 20022
2.5
3
3.5
4
4.5
AdvancesMargin
Growth rate: 103% y-o-y (Nedcor 217%)

Summary
• Volumes and market share achieved in all areas except retail
• Opportunities in retail and bancassurance to take market share to 23%
• Opportunities in margin normalisation• Focus on holding/gaining market share
while realising merger synergies

Strategic framework / SWOT

Strategy
SA Banking
Corporates
Individuals Treasury
Businesses
WealthManagement International
Peoples Bank
Bancassurance
AlliancesT&O platform Outsourcing
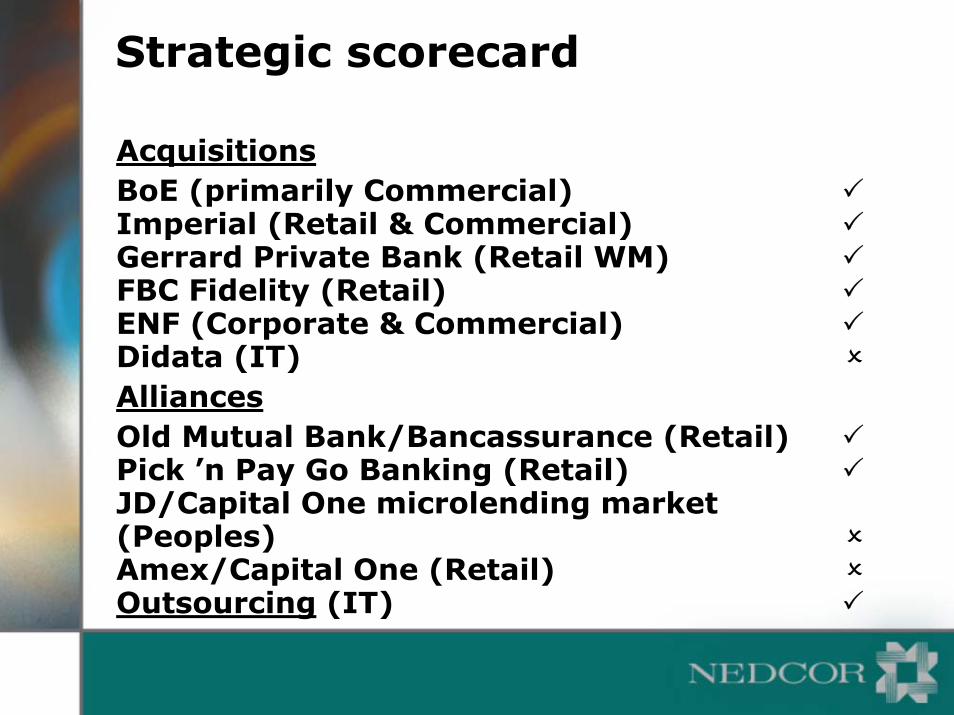
Strategic scorecard
AcquisitionsBoE (primarily Commercial)Imperial (Retail & Commercial)Gerrard Private Bank (Retail WM)FBC Fidelity (Retail)ENF (Corporate & Commercial)Didata (IT)AlliancesOld Mutual Bank/Bancassurance (Retail)Pick ’n Pay Go Banking (Retail)JD/Capital One microlending market(Peoples)Amex/Capital One (Retail)Outsourcing (IT)
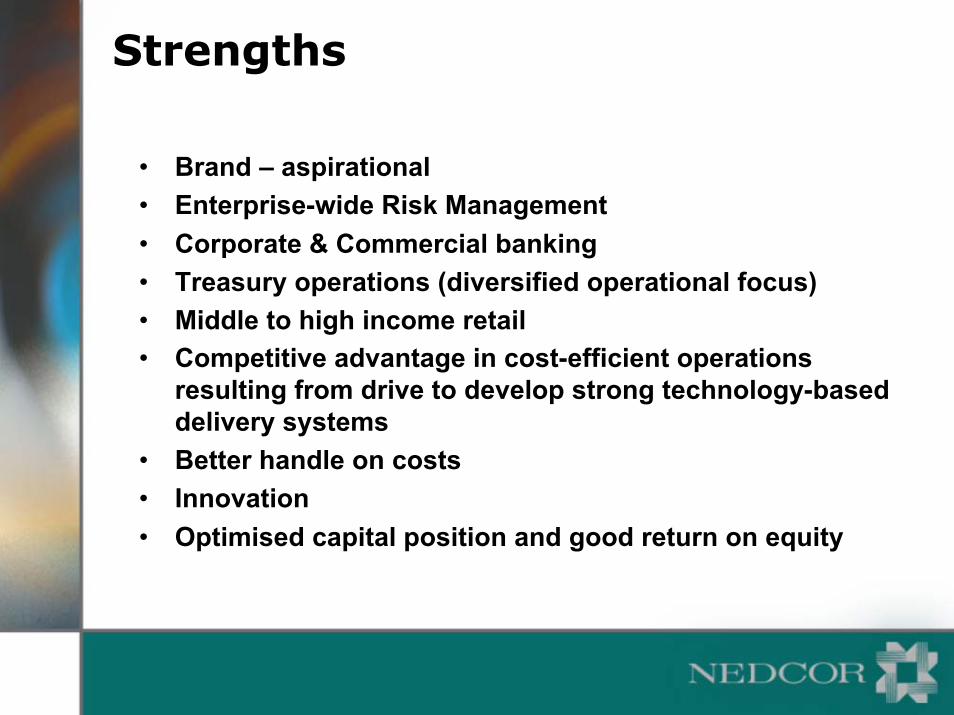
Strengths
• Brand – aspirational• Enterprise-wide Risk Management• Corporate & Commercial banking• Treasury operations (diversified operational focus)• Middle to high income retail• Competitive advantage in cost-efficient operations
resulting from drive to develop strong technology-based delivery systems
• Better handle on costs• Innovation• Optimised capital position and good return on equity
Weaknesses
• Brand – Not strong in middle and lower end• Media and domestic investor perception• Equity exposure to Didata• Limited international & African franchise• Earnings uncertainty• Material in-market consolidation over• SME• Microlending
Opportunities
• Retail• Gearing on operational platform• BEE charter• Insourcing of card processing• Increased low-cost reach (points of presence) through
alliances• Alternative delivery – smart cards• International private banking – in alliance with Old Mutual• Bancassurance and other cross-selling• Cost-cutting in merged base

Threats
• Foreign entrants• Prescribed lending and regulatory issues
– Community Reinvestment Act– BEE
• AIDS• Managing alliances without complete control• Internationalisation of information technology
processing is an unproven strategy• Mortgage originators and integrators

Summary
• Middle and underserved market segments require further focus
• Limit international expansion, but focus on wealth management, Asian trade finance and insourcing
• Extraneous factors, regulatory and accounting issues to be managed

Key drivers / issues
Macro issues
• A challenging and volatile operating climate
– Rand strength beyond expectations
– High interest rate with drops on hold
– Margin squeeze
– Credit demand constrained
– Weak equity markets globally and domestically
– 2,3 % GDP growth in 2003; 3,0% in 2004
– 8,6% average CPI in 2003; 4,0% in 2004
• Community Reinvestment Act & Financial Charter in progress
• AC133
• Basle II / Enterprise-wide Risk Management
Nedcor’s experience
• Core banking business resilient– Nedbank Retail, Peoples Bank ,Nedbank
Corporate (including Commercial & Treasury)
• Investment Banking and Wealth Management well below target
• International earnings down more than 20% due to strong Rand
• Organic advances’ growth in line with domestic market
• Margins maintained

Nedcor’s experience (cont.)
• Non-interest revenue well below expectations– Private equity, investment banking assets,
advisory fees and trading profits– One-off items in NIB in F2002
• Credit quality satisfactory and provisions stable
• Expense growth in line with expectations– Additional expense reduction drive due to
subdued income• Taxation increased significantly

Nedcor’s experience (cont.)
• Translation losses• AC133 impact not accounted for• Capital adequacy expected to remain
sound• Group integration on track
– Synergy estimates unchanged from R110m in F2003 growing to R905m in F2006

Capital adequacy
2002 2001Rbn %* Rbn %*
– Ordinary capital& reserves 12,5 6,0 14,1 8,6
– Preference capital 2,0 1,0 – –Tier 1 14,5 7,0 14,1 8,6– Callable notes 6,0 2,6 2,0 1,2– Other 2,5 1,4 2,6 1,6Tier 2 8,5 4,0 4,6 2,8Total 23,0 11,0 18,7 11,4*Percentage of risk-weighted assets

AC 133 (IAS 39) – recognition and measurement of financial instruments
• Deviation from standard IAS approach• Applicable on year-ends commencing 1
July 2002 (IAS only in 2005)– Complex, rule-based– Components approach– Form over substance– Inconsistent measurement bases– Increased use of fair value– Geared to sophisticated financial
environment and data

Core earnings to headline earnings
Dec Dec% 2002 2001
change Rm Rm
Core earnings 9 3 366 3 093
Translation gains/(losses) (1 011 1 096
General risk provision 400 (400Merger costs (170 –
Headline earnings -32 2 585 3 789
Headline eps -35 1 022 1 574
)
))

Translation gains / losses
31 Dec 2002Offshore capital of USD 200m = R1 720m(Closing exchange rate = 8.60)
31 Dec 2003Offshore capital of USD 200m = R1 600m(Closing exchange rate = 8.00)
If an “integrated operation” as defined:Translation loss recognised inincome statement = R 120m

The Financial Services Charter
• Ownership– Peoples Bank = 30%– Quaystone Asset Management = 50%– Nedcor = 17% +
• Banking services to PDIs– Peoples Bank– JD– Aplitec– Pick ‘n Pay Go Banking

The Financial Services Charter(continued)
• Employment Equity– AIC = 49% of total staff– 20% of management– Females = 63% of total staff– Female = 35% of management
• Empowerment alliances• Empowerment financing
– Southern Sun/Tsogo Sun
– African Legend/Caltex
– Harmony/Armgold
– Shell/Thebe
– Total/Tosaco
– MTN

The Financial Services Charter(continued)
• Procurement• Awards
–2001• Enterprise Development Forum (EDF), Black
Business Executive Circle and Black Business Council - Empowerment Company of the Year
• Business Map - Empowerment Deal of the Year
–2002• Black Management Forum - Most Progressive
Company of the Year• Black Business Quarterly - Financier of the Year
Award
Summary
• Environment remains challenging requiring additonal focus on cost optimisation
• Accounting issues leading to volatility in earnings but aimed at fair value balance sheet representation
• Well positioned as regards Financial Services Charter

Bancassurance

Gerrard Private Bank
• 25,5 % interest held by Old Mutual• Fairbairn Trust business incorporated• A range of banking, treasury, trust and
discretionary asset management products• Target market: clients with investable
assets of at least £50 000• Based in Isle of Man and Jersey, with Rep
offices in SA and Honk Kong• 2002 Awards:
– Best offshore banking group– Best offshore product range

Nedcor Wealth Management
Jointly-owned Businesses with Old Mutual
Private Clients
(South Africa)
Wholly-owned Businesses
International Companies
(On and Offshore)
Credit Protection
(South Africa)
Retail Investment Products & Services
• Scope of offering to High Net Worth Individuals:– Discretionary Portfolio Management– Private Banking– Other Investment Products– Fiduciary Services:Trusts, Wills,
Estates
Complete offeringboth onshore & offshore
No. of staff 554/Clients 17500/AUM R23bn

Nedcor Wealth Management
Jointly-owned Businesses with Old Mutual
Private Clients
(South Africa)
Wholly-owned Businesses
International Companies
(On and Offshore)
Credit Protection
(South Africa)
Retail Investment Products & Services
• Scope of providing banking customers with credit protection– Nedbank customers– JV and Alliances – Other banks customers
No. of staff 105 / Premium income R491m / EV R44m

Nedbank
• 150 Personal Financial Planners• Branch-based insurance specialists• 50% of overall insurance product sold is
sourced from Old Mutual• F2002 contribution of R110m provides
vast scope for growth
Peoples Bank
• Old Mutual Group Schemes (“OMGS”)• Public and private sector entities targeted• Pre-packaged insurance product provided
by OMGS– 16 000 assurance policies sold in F2002– 68 000 credit life policies sold in F2002– 80 advisers
• Banking product provided by Peoples Bank– 12 000 new accounts in F2002– 41 dedicated OMGS staff
• Joint client education undertaken

Old Mutual Bank
• Division of Nedbank Ltd – 50/50 JV
• Leverage dominant Old Mutual brand
• Banking products, systems and processes supplied by Nedcor
• Sales, marketing and channel management supplied by Old Mutual
• 2 million OMPF customers
• 300 000 ex-Permanent Bank customers
• Huge intermediary network
• Established branch distribution network
• No need to use expensive originators for mortgages

Summary
• Focus on greater share of customer wallet for Old Mutual and Nedcor
• Numerous initiatives with Old Mutual aimed at premium generation and commission income
• Two-way focus on cross-selling both insurance and bank products
• Opportunities for rationalisation of product factories and leverage of distribution channels

Conclusion

Key targets
• RoE 25% (21,9%)• RoA 2% (1,6%)• Cost-to-income ratio < 50% (55,4%)• Non-interest revenue : net interest income
> 50% (52,4%)• Provisions : average advances < 0,7%
(1%)• Capital adequacy 12% (11%)
RoE and RoA must be viewed in the light of the inflation level

Conclusion
• Challenging environment• Maintain/grow market share while
completing merger• Opportunity in retail, bancassurance and
cost reductions• Limited conventional offshore aspirations• Low-cost expanded reach