Embed Size (px)
Citation preview

Old age pensions across countriesStefanie König
Workshop of the project “Determinants of Retirement Decisions in Europe, the US and Japan”
01.-02.07.2015, MZES Mannheim

old age dependency ratio
United St
ates
Czech Rep
ublic
Netherl
ands
Switz
erlan
dSp
ain
United Kingd
omEst
onia
Denmark
Euro
pean Union
Austria
Swed
en Italy
German
yJap
an0
5
10
15
20
25
30
35
40
45
196019902012

INSTITUTIONAL CONTEXT
Data on old age pensions across countries and over time is provided by the “Social Citizenship Indicator Program“ (SCIP)
The research leading to these results has received support under the European Commission’s 7th Framework Programme (FP7/2013-2017) under grant agreement n°312691, InGRID – Inclusive Growth Research Infrastructure Diffusion.

Replacement rates for minimum (blue), standard (red) and full (green) pensions
1990
2010
1990
2010
1990
2010
1990
2010
1990
2010
1990
2010
1990
2010
1990
2010
1990
2010
1990
2010
2005
2010
2005
2010
1990
2010
austria denmark germany italy japan netherla sweden switzerl united k united s Czech Re Estonia Spain
0
0.1
0.2
0.3
0.4
0.5
0.6
0.7
0.8
0.9
1
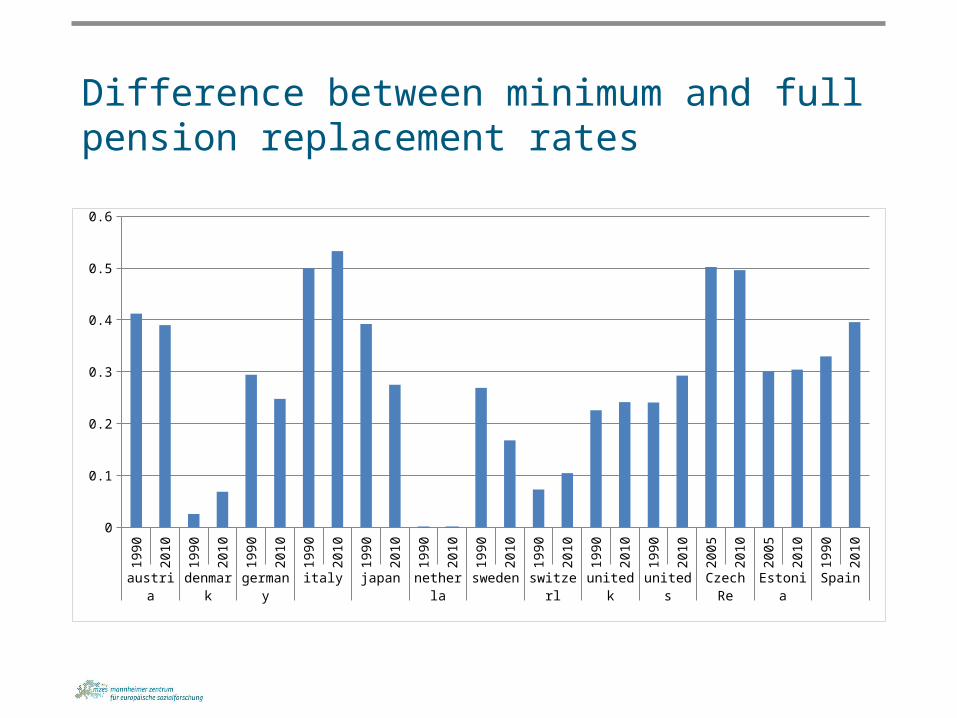
Difference between minimum and full pension replacement rates
1990
2010
1990
2010
1990
2010
1990
2010
1990
2010
1990
2010
1990
2010
1990
2010
1990
2010
1990
2010
2005
2010
2005
2010
1990
2010
austria denmark germany italy japan netherla sweden switzerl united k united s Czech Re Estonia Spain
0
0.1
0.2
0.3
0.4
0.5
0.6
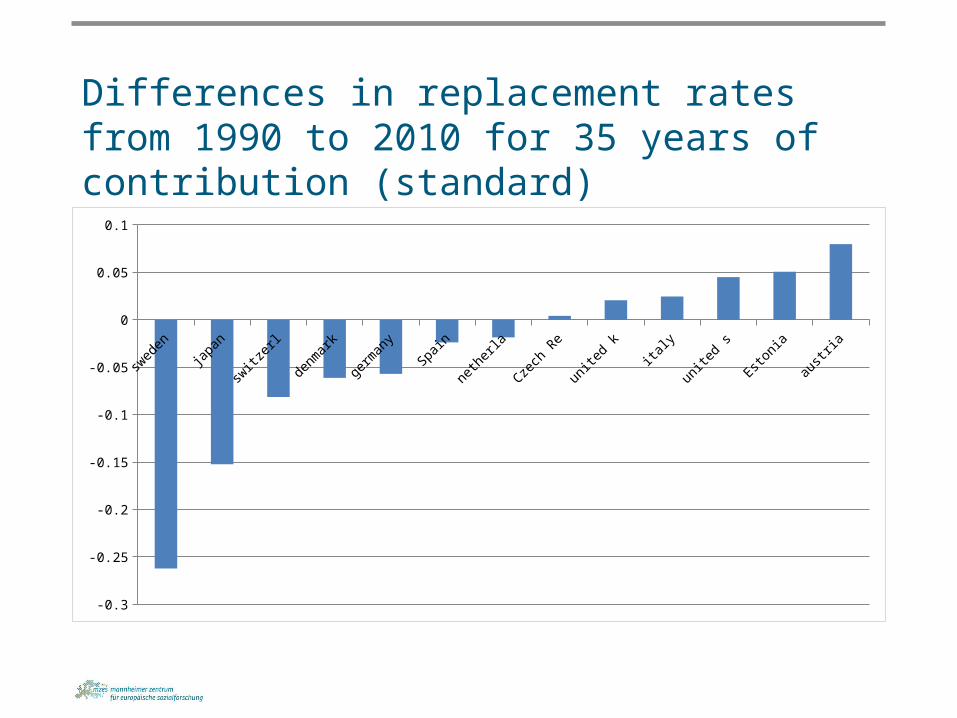
Differences in replacement rates from 1990 to 2010 for 35 years of contribution (standard)
sweden japan switzerl denmark germany Spain netherla Czech Re united k italy united s Estonia austria
-0.3
-0.25
-0.2
-0.15
-0.1
-0.05
0
0.05
0.1

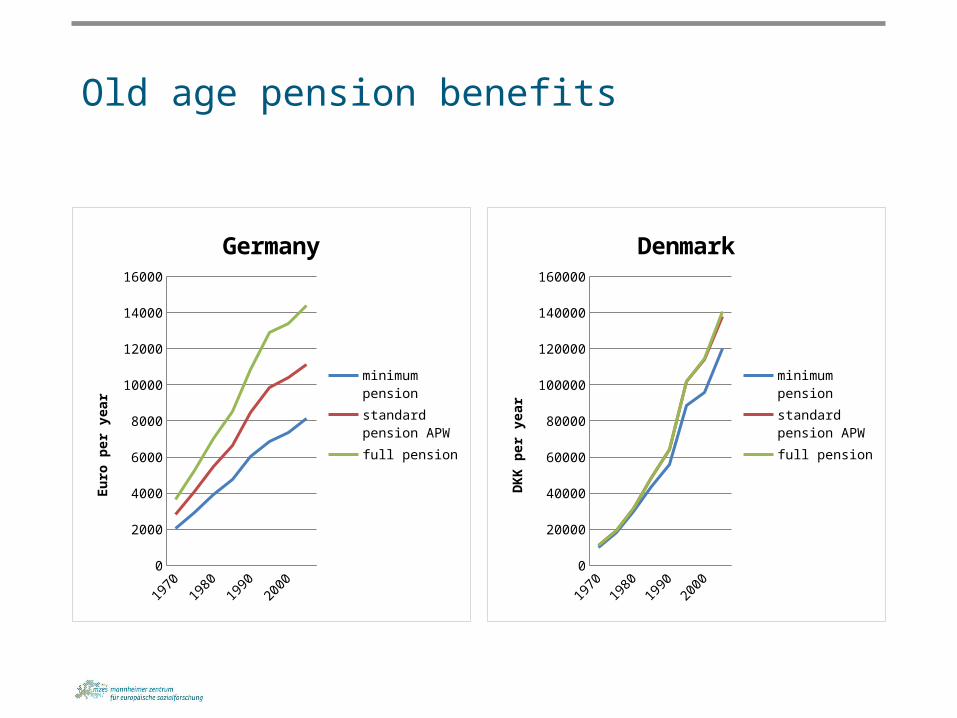
Old age pension benefits
19701975
19801985
19901995
20002005
0
20000
40000
60000
80000
100000
120000
140000
160000
Sweden
minimum pensionstandard pension APWfull pension
SEK
per y
ear
19701975
19801985
19901995
20002005
0
2000
4000
6000
8000
10000
12000
14000
16000
18000
20000
United States
minimum pensionstandard pension APWfull pension
US D
olla
rs p
er y
ear
Old age pension benefits
19701975
19801985
19901995
20002005
0
2000
4000
6000
8000
10000
12000
14000
16000
Germany
minimum pensionstandard pension APWfull pension
Euro
per
yea
r
19701975
19801985
19901995
20002005
0
20000
40000
60000
80000
100000
120000
140000
160000
Denmark
minimum pensionstandard pension APWfull pension
DKK
per y
ear

Correlation of standard replacement rates and effective retirement age (1970-2010)
0.2 0.3 0.4 0.5 0.6 0.7 0.8 0.9 1 1.1 1.250.0
55.0
60.0
65.0
70.0
75.0
R² = 0.234658410148604
men
standard replacement rate
effec
tive
retir
emen
t age
SPAIN
0.2 0.3 0.4 0.5 0.6 0.7 0.8 0.9 1 1.1 1.250.0
55.0
60.0
65.0
70.0
75.0
R² = 0.108232482231641
women
standard replacement rate
effec
tive
retir
emen
t age
SPAIN
R² = 0,2677 (without Spain)
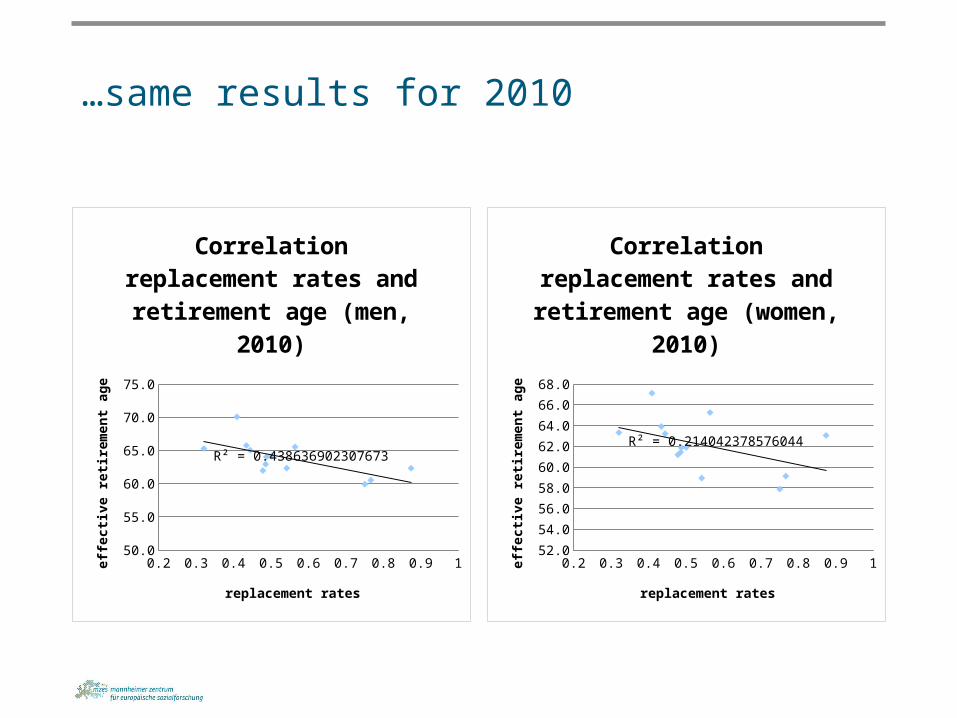
…same results for 2010
0.2 0.3 0.4 0.5 0.6 0.7 0.8 0.9 154.0
56.0
58.0
60.0
62.0
64.0
66.0
68.0
70.0
72.0
R² = 0.438636902307673
Correlation replacement rates and retirement age (men,
2010)
replacement rates
effec
tive
retir
emen
t age
0.2 0.3 0.4 0.5 0.6 0.7 0.8 0.9 152.0
54.0
56.0
58.0
60.0
62.0
64.0
66.0
68.0
R² = 0.214042378576044
Correlation replacement rates and retirement age (women,
2010)
replacement rates
effec
tive
retir
emen
t age

Who is financing the old age pension?
austr
ia
denmark
germ
any
italy
japan
netherl
and
swed
en
switz
erlan
united ki
n
united st
a0%
10%
20%
30%
40%
50%
60%
70%
80%
90%
100%
2005
otheremployerstateindividual
austr
ia
denmark
germ
any
italy
japan
netherl
and
swed
en
switz
erlan
united ki
n
united st
a0%
10%
20%
30%
40%
50%
60%
70%
80%
90%
100%
1990
otheremployerstateindividual