Embed Size (px)
Citation preview
Oklahoma Public Schools
Fast Facts2019-20
UPDATED FEBRUARY 2020
2 FAST FACTS | 3
PILLARS ■ Achieve academic success. To ensure a high-quality public education, the Oklahoma State Department of Education (OSDE) will close the opportunity and achievement gap for each student.
■ Build exceptional educators and schools. The OSDE will support the recruitment, preparation and retention of highly effective teachers and leaders.
■ Create engaged communities. The OSDE will build external capacity to provide strong academic support through family and community engagement.
■ Develop internal capacity. The OSDE will build its internal capacity to serve the field and use data to make informed decisions.
GOALS ■ Score among the Top 20 highest-performing states on the National Assessment of Educational Progress (NAEP) in all subjects for fourth grade and eighth grade.
■ Reduce by 50% the need for math and English language arts remediation after high school.
■ Rank among the Top 10 states with the highest graduation rate for students in four-, five- and six-year cohorts.
■ Ensure that 100% of students in grades 6 through 12 engage in useful and meaningful Individual Career Academic Planning (ICAP).
■ Align early childhood education and learning foundations to ensure at least 75% of students are “ready to read” upon kindergarten entry.
■ Increase student access to effective teachers, thereby reducing the need for emergency-certified teachers by 95%.
The U.S. Department of Education approved Oklahoma’s comprehensive education plan, Oklahoma Edge, in July 2018. The plan to meet student needs and drive progress is built on a four-pillar foundation with measurable goals.
Oklahoma Edge 8-Year Strategic Plan
4 FAST FACTS | 5
GlossaryALTERNATIVE CERTIFICATIONA pathway to becoming a teacher for those who did not complete a teacher education program. A college-credit course in classroom management and pedagogical principles is required during the initial certification.
AVERAGE DAILY ATTENDANCE (ADA)Total days of student attendance divided by total days of instruction.
AVERAGE DAILY MEMBERSHIP (ADM)An average number of students taken twice a year to arrive at a student population. This is calculated by dividing the sum of enrolled students’ total days present and days absent by the number of days taught. The First-Quarter Statistical Report (FQSR) is completed after the first nine weeks, and the Annual Statistical Report (ASR) is completed after the school year.
COMMUNITY ELIGIBILITY PROVISION (CEP)A meal service option for low-income areas that allows schools to serve breakfast and lunch to all enrolled students at no cost without collecting household applications.
ECONOMICALLY DISADVANTAGED STUDENTAny student eligible for federally funded free and reduced-price meal programs.
EMERGENCY CERTIFICATIONA teaching certificate issued on an emergency basis for one year to someone who has not yet met the certification qualifications of a state-approved program. Districts may request emergency certification for a specific candidate only after exhausting every option to find an appropriately certified person for the open position.
ENROLLMENTA count of students enrolled in a school on October 1.
FINANCIAL SUPPORT OF SCHOOLSThe primary allocation of state funds appropriated by the Legislature to schools. Also known as the State Aid Funding Formula, this allocation distributes money to districts based on their Weighted Average Daily Membership (WADM) and accounts for other funding the district may receive, including property taxes and other state-dedicated revenue such as gross production tax and school land earnings. The goal of the formula is to provide equity across all schools, regardless of socio-economic status or proportion of students with special needs.
6 FAST FACTS | 7
INDIVIDUAL CAREER ACADEMIC PLANNING (ICAP)A multi-year process to guide students as they explore their own career and academic opportunities. ICAP identifies student interests, skills, secondary/postsecondary coursework, certificates, credentials, degrees and workforce experiences that help chart the progress needed to prepare students for college and career. The ICAP program is required for all ninth-graders in 2019-20.
INDIVIDUALIZED EDUCATION PROGRAM (IEP)A written document developed collaboratively by parents and school personnel that outlines the special education program for a student with a disability. This document is developed, reviewed and revised at an IEP meeting at least annually and required by the federal Individuals with Disabilities Education Act (IDEA).
INSTRUCTIONAL STAFFIn NEA’s annual ranking of educator compensation, instructional staff refers to all staff members with teacher certification other than district superintendents.
SCHOOL CALENDAR HOURS REQUIREMENTDistricts must provide at least 180 six-hour days or 1,080 hours of instruction per school year. They may suspend school days or hours as long as those hours are made up by the end of the year.
STATE AID FUNDINGSee Financial Support of Schools on previous page.
SUPPORT OF TEACHERS AND STUDENTSProvides line-item support for an array of initiatives separate from the State Aid Funding Formula. This allocation supports initiatives including alternative education, professional development, Advanced Placement teacher training and fee assistance, Reading Sufficiency and Sooner Start.
TEACHERPer statute, any person who is employed to serve as district superintendent, principal, supervisor, counselor, librarian, school nurse or classroom teacher or in any other instructional, supervisory or administrative capacity.
WEIGHTED AVERAGE DAILY MEMBERSHIP (WADM) The ADM adjusted to reflect the weights of individual students. Students are assigned a greater weight if they belong to a student group that requires additional educational services, such as students with disabilities. WADM determines funding allocations to the district.
8 FAST FACTS | 9
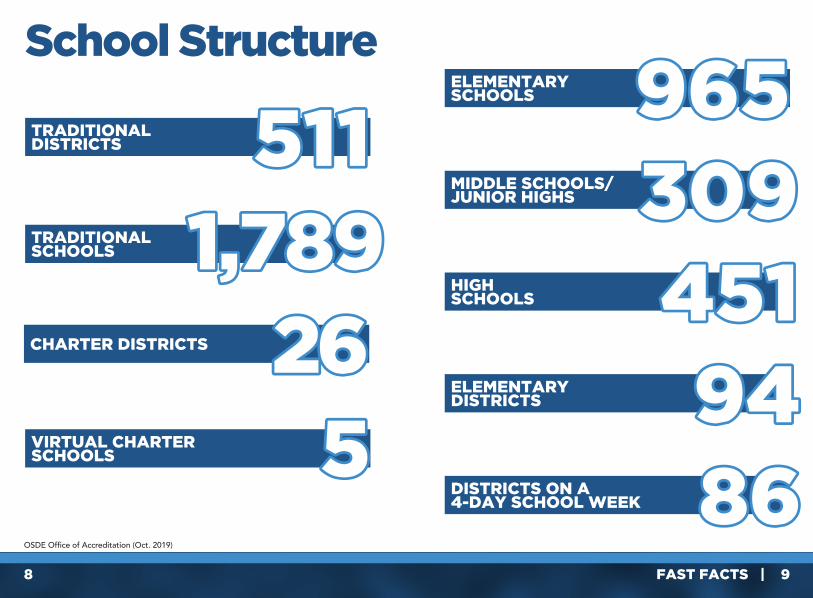
OSDE Office of Accreditation (Oct. 2019)
School Structure
TRADITIONALDISTRICTS 511511
CHARTER DISTRICTS 2626
ELEMENTARYSCHOOLS 965965MIDDLE SCHOOLS/JUNIOR HIGHS 309309
TRADITIONALSCHOOLS 1,7891,789
HIGHSCHOOLS 451451ELEMENTARYDISTRICTS 9494DISTRICTS ON A 4-DAY SCHOOL WEEK 8686
VIRTUAL CHARTERSCHOOLS 55
10 FAST FACTS | 11
668,537
676,396
683,294
689,930
695,524
701,299
706,081
711,561715,169
2011-12 2012-13 2013-14 2014-15 2015-16 2016-17 2017-18 2018-19 2019-20
668,537
676,396
683,294
689,930
695,524
701,299
706,081
711,561715,169
2011-12 2012-13 2013-14 2014-15 2015-16 2016-17 2017-18 2018-19 2019-20
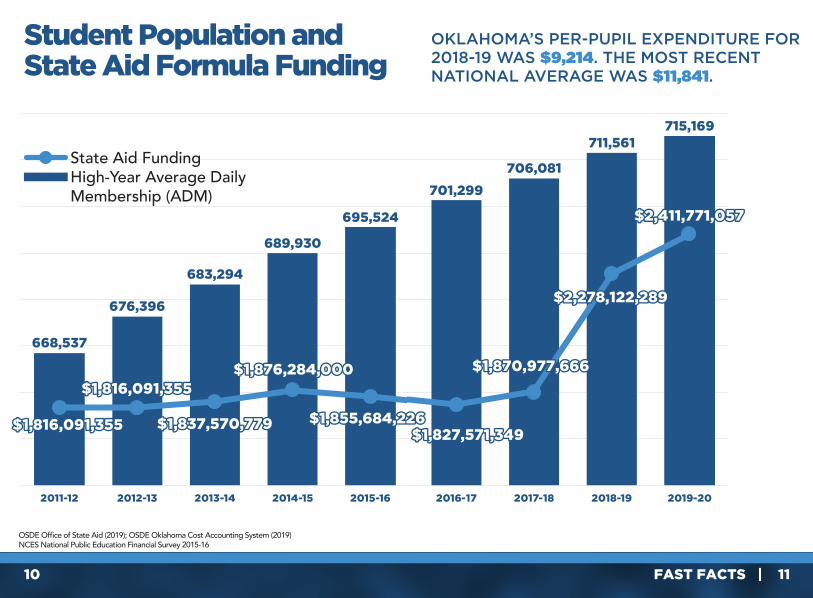
Student Population and State Aid Formula Funding
OSDE Office of State Aid (2019); OSDE Oklahoma Cost Accounting System (2019)NCES National Public Education Financial Survey 2015-16
$1,816,091,355$1,816,091,355
$1,816,091,355$1,816,091,355$1,876,284,000$1,876,284,000
$1,837,570,779$1,837,570,779$1,827,571,349$1,827,571,349
$1,855,684,226$1,855,684,226
$2,278,122,289$2,278,122,289
OKLAHOMA’S PER-PUPIL EXPENDITURE FOR 2018-19 WAS $9,214. THE MOST RECENT NATIONAL AVERAGE WAS $11,841.
State Aid FundingHigh-Year Average Daily Membership (ADM)
$1,870,977,666$1,870,977,666
$2,411,771,057$2,411,771,057
12 FAST FACTS | 13
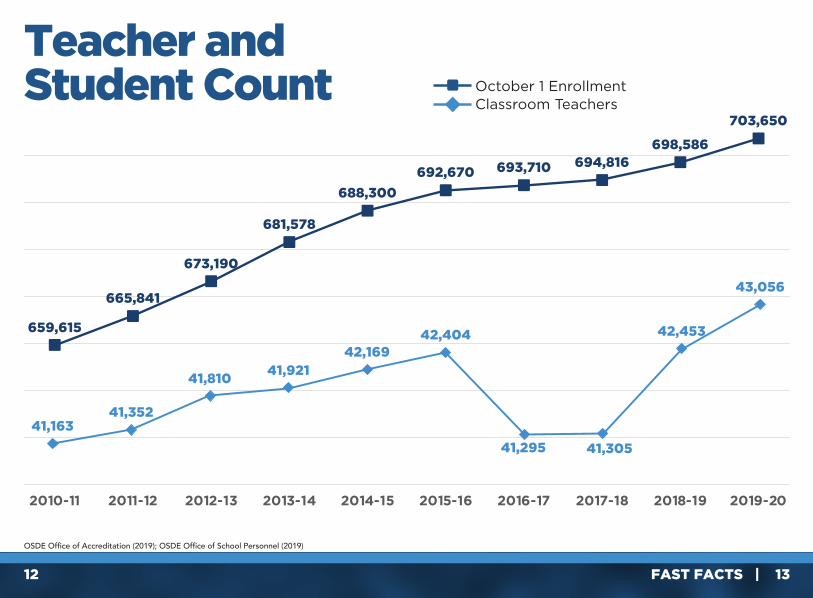
659,615
665,841
673,190
681,578
688,300
692,670 693,710 694,816698,586
703,650
2010-11 2011-12 2012-13 2013-14 2014-15 2015-16 2016-17 2017-18 2018-19 2019-20
41,16341,352
41,81041,921
42,16942,404
41,295 41,305
42,453
43,056
OSDE Office of Accreditation (2019); OSDE Office of School Personnel (2019)
Teacher and Student Count October 1 Enrollment
Classroom Teachers
14 FAST FACTS | 15
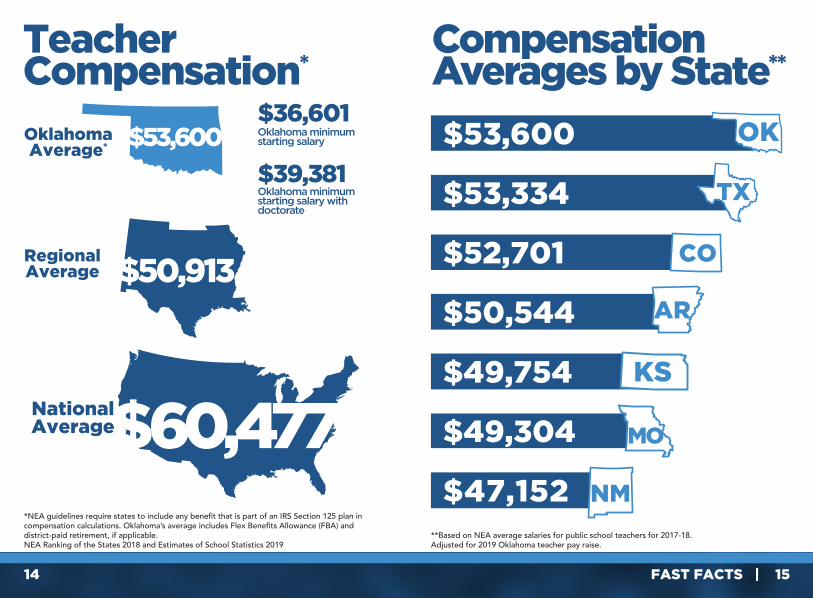
*NEA guidelines require states to include any benefit that is part of an IRS Section 125 plan in compensation calculations. Oklahoma’s average includes Flex Benefits Allowance (FBA) and district-paid retirement, if applicable.NEA Ranking of the States 2018 and Estimates of School Statistics 2019
Teacher Compensation*
OklahomaAverage*
RegionalAverage
NationalAverage
Oklahoma minimum starting salary
$36,601
Oklahoma minimum starting salary with doctorate
$39,381
$53,600
$50,913
$60,477
**Based on NEA average salaries for public school teachers for 2017-18. Adjusted for 2019 Oklahoma teacher pay raise.
Compensation Averages by State**
$53,600
$53,334
$52,701
OK
$50,544 AR
$49,304
$47,152
MO
$49,754
NM
TX
KS
CO
16 FAST FACTS | 17
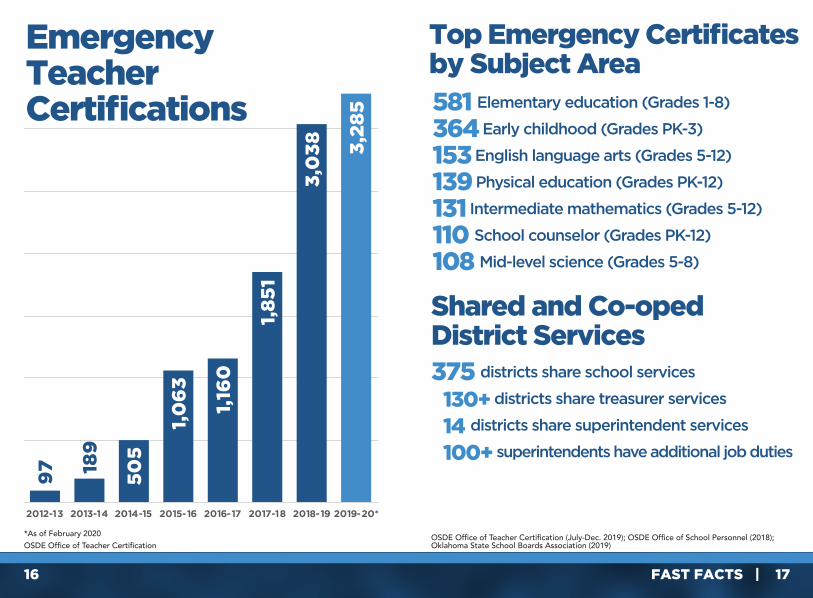
97 18
9
50
5
1,0
63
1,16
0
1,8
51
3,0
38
3,2
85
2012-13 2013-14 2014-15 2015-16 2016-17 2017-18 2018-19 2019-20*
Top Emergency Certificates by Subject Area
Shared and Co-oped District Services375 districts share school services
130+ districts share treasurer services
14 districts share superintendent services
100+ superintendents have additional job duties
581 Elementary education (Grades 1-8)
364 Early childhood (Grades PK-3)
153 English language arts (Grades 5-12)
139 Physical education (Grades PK-12)
131 Intermediate mathematics (Grades 5-12)
110 School counselor (Grades PK-12)
108 Mid-level science (Grades 5-8)
OSDE Office of Teacher Certification (July-Dec. 2019); OSDE Office of School Personnel (2018); Oklahoma State School Boards Association (2019)
EmergencyTeacher Certifications
OSDE Office of Teacher Certification*As of February 2020
18 FAST FACTS | 19
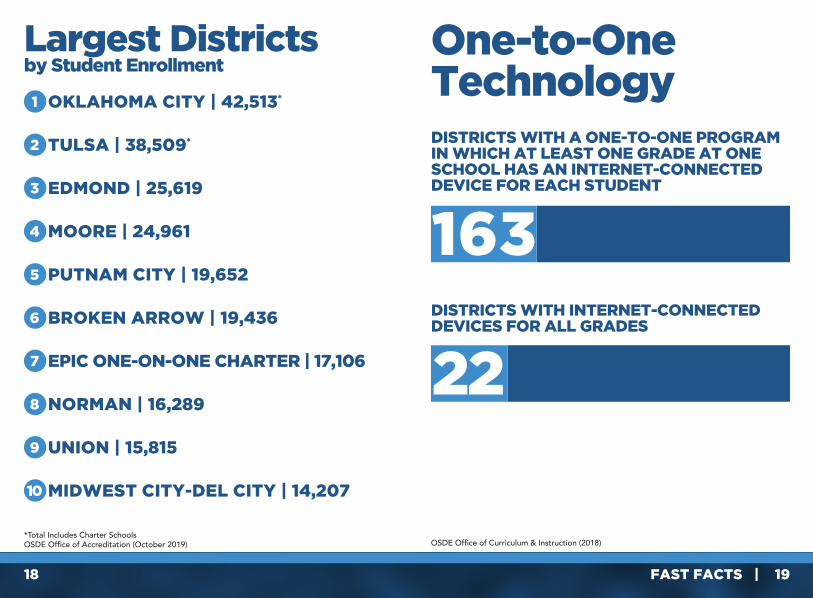
*Total Includes Charter SchoolsOSDE Office of Accreditation (October 2019)
Largest Districts
OKLAHOMA CITY | 42,513*
TULSA | 38,509*
EDMOND | 25,619
MOORE | 24,961
PUTNAM CITY | 19,652
BROKEN ARROW | 19,436
EPIC ONE-ON-ONE CHARTER | 17,106
NORMAN | 16,289
UNION | 15,815
MIDWEST CITY-DEL CITY | 14,207
1
2
3
4
5
6
7
8
9
10
by Student EnrollmentOne-to-One TechnologyDISTRICTS WITH A ONE-TO-ONE PROGRAM IN WHICH AT LEAST ONE GRADE AT ONE SCHOOL HAS AN INTERNET-CONNECTED DEVICE FOR EACH STUDENT
163
OSDE Office of Curriculum & Instruction (2018)
DISTRICTS WITH INTERNET-CONNECTED DEVICES FOR ALL GRADES
22
20 FAST FACTS | 21
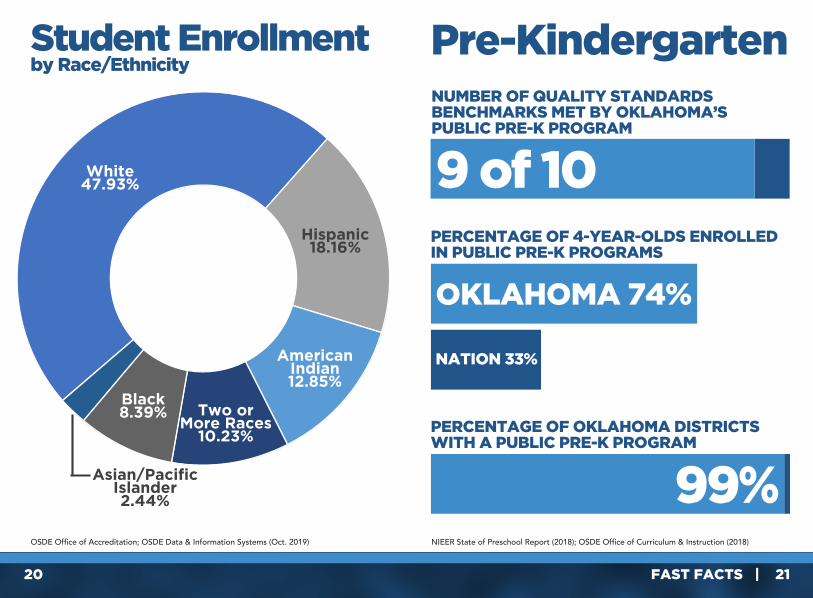
OSDE Office of Accreditation; OSDE Data & Information Systems (Oct. 2019)
Student Enrollmentby Race/Ethnicity
Pre-Kindergarten
NIEER State of Preschool Report (2018); OSDE Office of Curriculum & Instruction (2018)
PERCENTAGE OF 4-YEAR-OLDS ENROLLED IN PUBLIC PRE-K PROGRAMS
PERCENTAGE OF OKLAHOMA DISTRICTS WITH A PUBLIC PRE-K PROGRAM
NUMBER OF QUALITY STANDARDS BENCHMARKS MET BY OKLAHOMA’S PUBLIC PRE-K PROGRAM
99%
NATION 33%
OKLAHOMA 74%
9 of 10White47.93%
Hispanic18.16%
American Indian12.85%
Two or More Races
10.23%
Black8.39%
Asian/Pacific Islander2.44%
22 FAST FACTS | 23
0 2,000 4,000 6,000
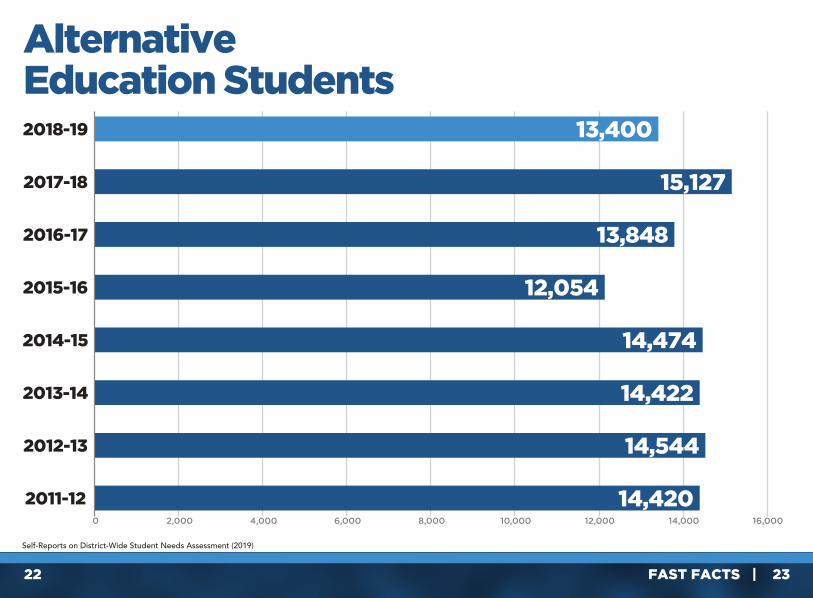
Self-Reports on District-Wide Student Needs Assessment (2019)
Alternative Education Students
2014-15 14,474
2013-14 14,422
2012-13 14,544
2011-12 14,420
2016-17 13,848
2015-16 12,054
8,000 10,000 12,000 14,000 16,000
2017-18 15,127
2018-19 13,400
24 FAST FACTS | 25
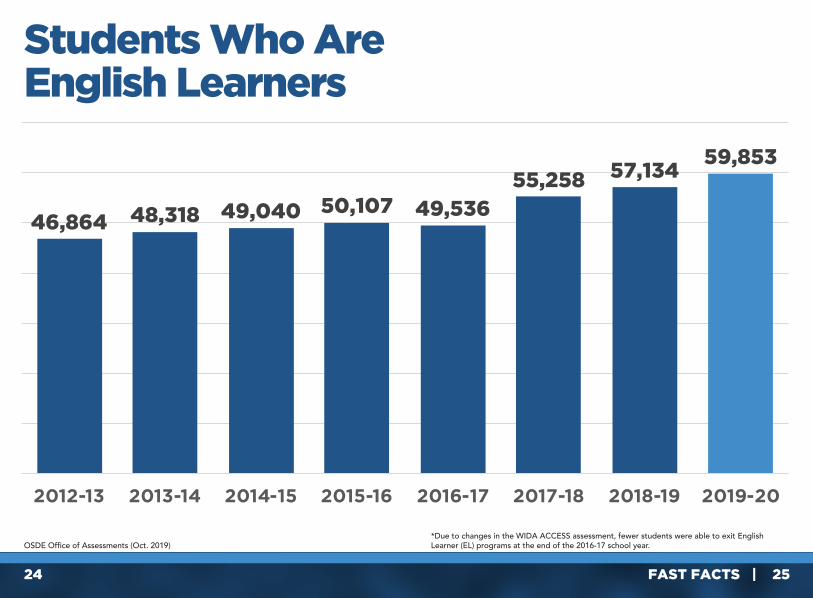
OSDE Office of Assessments (Oct. 2019)
Students Who Are English Learners
*Due to changes in the WIDA ACCESS assessment, fewer students were able to exit English Learner (EL) programs at the end of the 2016-17 school year.
46,864 48,318 49,040 50,107 49,53655,258 57,134
59,853
0
10,000
20,000
30,000
40,000
50,000
60,000
70,000
2012-13 2013-14 2014-15 2015-16 2016-17 2017-18 2018-19 2019-20
26 FAST FACTS | 27
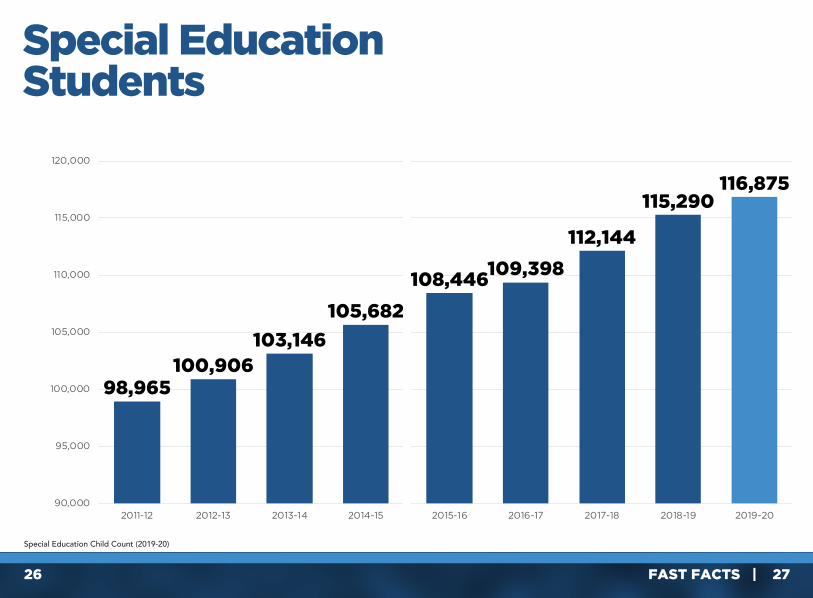
Special Education Child Count (2019-20)
Special Education Students
98,965100,906
103,146
105,682
108,446109,398
112,144
115,290116,875
90,000
95,000
100,000
105,000
110,000
115,000
120,000
2011-12 2012-13 2013-14 2014-15 2015-16 2016-17 2017-18 2018-19 2019-20
98,965100,906
103,146
105,682
108,446109,398
112,144
115,290116,875
90,000
95,000
100,000
105,000
110,000
115,000
120,000
2011-12 2012-13 2013-14 2014-15 2015-16 2016-17 2017-18 2018-19 2019-20
28 FAST FACTS | 29
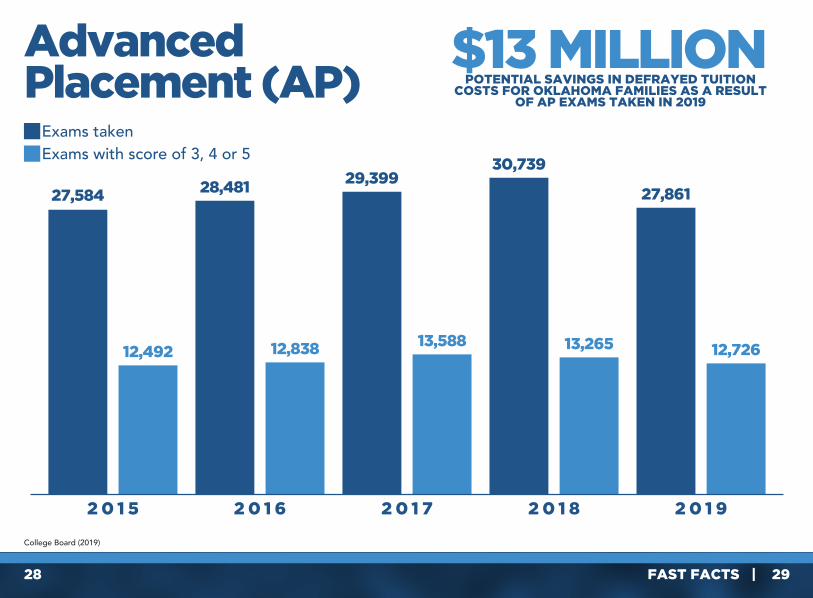
Advanced Placement (AP)
2 0 1 5 2 0 1 6 2 0 1 7 2 0 1 8 2 0 1 9
27,584
$13 MILLIONPOTENTIAL SAVINGS IN DEFRAYED TUITION
COSTS FOR OKLAHOMA FAMILIES AS A RESULT OF AP EXAMS TAKEN IN 2019
College Board (2019)
12,492
28,481
12,838
29,399
13,588
30,739
13,265
27,861
12,726
Exams takenExams with score of 3, 4 or 5
30 FAST FACTS | 31
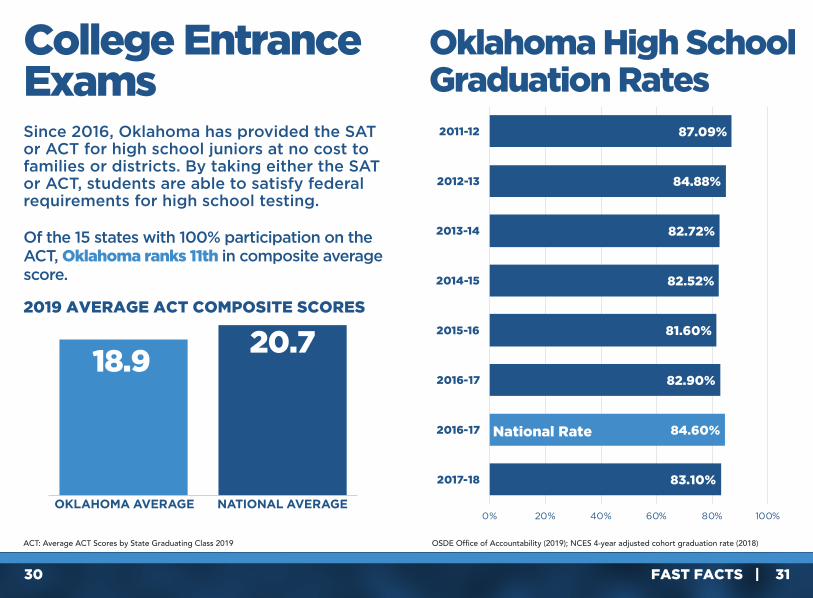
College Entrance ExamsSince 2016, Oklahoma has provided the SAT or ACT for high school juniors at no cost to families or districts. By taking either the SAT or ACT, students are able to satisfy federal requirements for high school testing.
Of the 15 states with 100% participation on the ACT, Oklahoma ranks 11th in composite average score.
2019 AVERAGE ACT COMPOSITE SCORES
ACT: Average ACT Scores by State Graduating Class 2019
OKLAHOMA AVERAGE NATIONAL AVERAGE
18.920.7
Oklahoma High School Graduation Rates
OSDE Office of Accountability (2019); NCES 4-year adjusted cohort graduation rate (2018)
83.10%
84.60%
82.90%
81.60%
82.52%
82.72%
84.88%
87.09%
0% 20% 40% 60% 80% 100%
2017-18
2016-17
2016-17
2015-16
2014-15
2013-14
2012-13
2011-12
National Rate
32 FAST FACTS | 33
OSDE Office of School Personnel (2019-20);OSDE Office of State Aid (Oct. 2019)
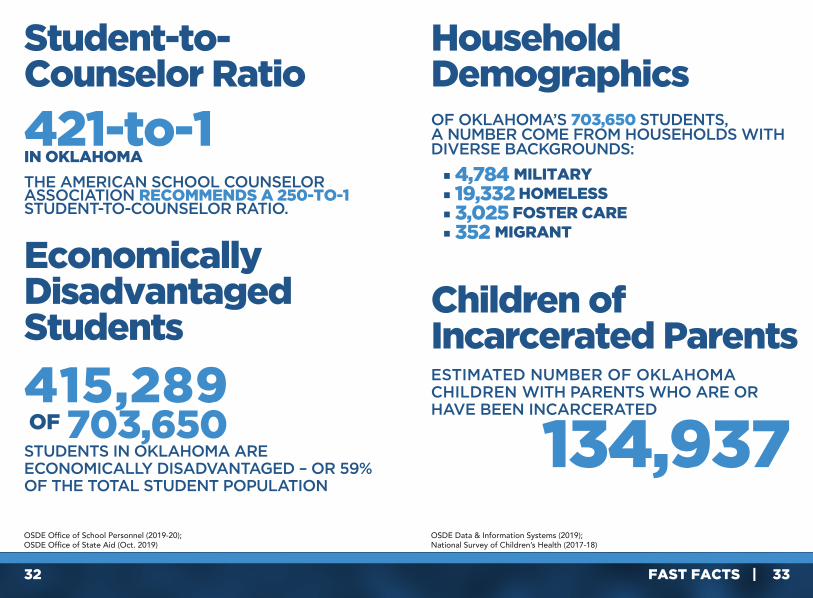
Student-to-Counselor Ratio
421-to-1IN OKLAHOMA
THE AMERICAN SCHOOL COUNSELOR ASSOCIATION RECOMMENDS A 250-TO-1 STUDENT-TO-COUNSELOR RATIO.
STUDENTS IN OKLAHOMA ARE ECONOMICALLY DISADVANTAGED – OR 59% OF THE TOTAL STUDENT POPULATION
Economically Disadvantaged Students
703,650OF415,289 ESTIMATED NUMBER OF OKLAHOMA
CHILDREN WITH PARENTS WHO ARE OR HAVE BEEN INCARCERATED
OSDE Data & Information Systems (2019);National Survey of Children’s Health (2017-18)
Children of Incarcerated Parents
134,937
Household DemographicsOF OKLAHOMA’S 703,650 STUDENTS,A NUMBER COME FROM HOUSEHOLDS WITH DIVERSE BACKGROUNDS:
■4,784 MILITARY ■ 19,332 HOMELESS ■ 3,025 FOSTER CARE ■ 352 MIGRANT
34 FAST FACTS | 35
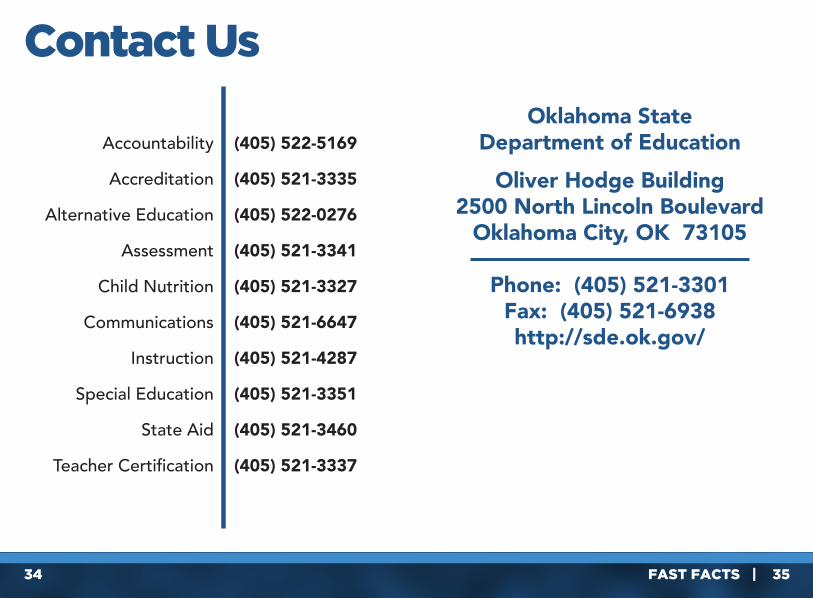
Accountability
Accreditation
Alternative Education
Assessment
Child Nutrition
Communications
Instruction
Special Education
State Aid
Teacher Certification
(405) 522-5169
(405) 521-3335
(405) 522-0276
(405) 521-3341
(405) 521-3327
(405) 521-6647
(405) 521-4287
(405) 521-3351
(405) 521-3460
(405) 521-3337
Contact Us
Oklahoma StateDepartment of Education
Oliver Hodge Building2500 North Lincoln Boulevard
Oklahoma City, OK 73105
Phone: (405) 521-3301Fax: (405) 521-6938http://sde.ok.gov/