Embed Size (px)
Citation preview

Oklahoma School Testing Program
Oklahoma Core Curriculum Tests
Test and Item Specifications
Science
Biology
Published by:
100 EDUCATION WAY, DOVER, NH 03820 (800) 431-8901 WWW.MEASUREDPROGRESS.ORG

Page 2
Table of Contents
Test Specifications ......................................................................................................................... 3
Purpose of the Biology End-of-Instruction Assessment ........................................................................... 4
Test Structure, Format, and Scoring ......................................................................................................... 5
Test Alignment with the Oklahoma Academic Standards for Science ..................................................... 7
Test Blueprint............................................................................................................................................ 8
Depth of Knowledge Assessed by Test Items ........................................................................................... 9
DOK Level 1 ......................................................................................................................................... 9
DOK Level 2 ......................................................................................................................................... 9
DOK Level 3 ....................................................................................................................................... 10
Universal Test Design Considerations .................................................................................................... 12
Test Administration Details .................................................................................................................... 12
Online Administration ........................................................................................................................ 12
Paper/Pencil Accommodation ............................................................................................................. 12
Estimated Testing Time ...................................................................................................................... 13
Item Specifications ...................................................................................................................... 14
Introduction ............................................................................................................................................. 15
General Cluster Specifications ................................................................................................................ 16
General Item Writing Mechanics ............................................................................................................ 20
Overview of Layout of Item Specifications by Performance Expectation .............................................. 22
Item Specifications by Performance Expectation ................................................................................... 23

Page 3
Test Specifications
Important Note:
The material in the test and item specifications should not be used
as a curriculum guide.

Page 4
Purpose of the Biology End-of-Instruction Assessment
The purpose of the Biology End-of-Instruction test is to measure Oklahoma students’ level of
proficiency in the discipline of life science. On this test, students are required to respond to
clusters of items aligned to the assessable biology performance expectations (standards)
identified in the 2014 Oklahoma Academic Standards for Science (OASS). A cluster is either a
set of three multiple-choice items linked with a common stimulus or a set of two multiple-choice
items and a technology-enhanced item (TE item/TEI) linked with a common stimulus.
All Biology test forms will assess a sampling of the performance expectations in each of the
reporting categories below. The reporting categories represent the grouping of performance
expectations based on the topics laid out in the OASS. Note that results for the Biology test will
be reported at the topic level, not at the level of individual performance expectations.
Biology Reporting Categories and Assessable Performance Expectations
from the Oklahoma Academic Standards for Science
Structure and Function
HS-LS1-1
HS-LS1-2
HS-LS1-3
HS-LS1-4
HS-LS1-5
HS-LS1-6
HS-LS1-7
Ecosystem Dynamics
HS-LS2-1
HS-LS2-2
HS-LS2-3
HS-LS2-4
HS-LS2-5
HS-LS2-6
HS-LS2-8
Heredity, Variation, and Diversity
HS-LS3-1
HS-LS3-2
HS-LS3-3
HS-LS4-1
HS-LS4-2
HS-LS4-3
HS-LS4-4
HS-LS4-5

Page 5
Test Structure, Format, and Scoring
The Oklahoma Core Curriculum Test for Biology consists of clusters of items. A cluster is either
a set of three multiple-choice items linked with a common stimulus or a set of two multiple-
choice items and a technology-enhanced item linked with a common stimulus.
A cluster stimulus consists of the passages, graphs, models, figures, diagrams, data tables,
etc. that students must read and examine to respond to the items in the cluster. The
stimulus may be a combination of multiple stimulus elements (e.g., some text plus a
diagram and a data table).
Each multiple-choice item within the cluster is worth one point and is scored as correct or
incorrect.
Each technology-enhanced item is worth two points and is scored as completely correct
(two points), partially correct (one point), or incorrect (zero points).
Items within a cluster are arranged logically, typically with easier and/or less complex
items first.
The table below shows the total number of items (in clusters) that students respond to and the
total number of points allocated on a test form. Further explanation is provided in the paragraph
below the table.
Total Number of Items and Point Values for Biology Test
Content
Assessment
Total
Items
Total
Operational Items
and Points
Total
Field-Test Items
Biology 63 items
(21 clusters)
45 items
(15 clusters)
48 points
18 items
(6 clusters)
As shown in the table, the test form for Biology contains both operational clusters and field-test
clusters. The operational clusters contribute to the student’s score; the raw score (number of
points earned) is converted to a scaled score to report test results. (Note that because three of the
operational clusters contain two multiple-choice items and a technology-enhanced item, rather
than three multiple-choice items, the number of operational items and points is not the same.)
The field-test clusters do not contribute to the student’s score, but the results are used to evaluate
new clusters for use in future operational forms. Clusters that have suitable statistics are used to
construct operational tests in subsequent years.
Each cluster aligns to a single OASS performance expectation (consisting of a Science and
Engineering Practice, Disciplinary Core Idea, and Crosscutting Concept). The clusters are also

Page 6
structured to assess a range of skills and knowledge applications within the performance
expectation. In this way, the assessment will gather data measuring a breadth and depth of
student ability within the performance expectations.

Page 7
Test Alignment with the Oklahoma Academic Standards for Science
The following criteria are used to ensure alignment of the Biology test with the performance
expectations (standards) in the OASS:
1. Range of Knowledge Correspondence
The Biology test is constructed so that a minimum of approximately 60% of the
performance expectations in each reporting category have at least one corresponding cluster
of items in the operational portion of the assessment.
2. Categorical Concurrence
The Biology test is constructed so that there are at least 13 score points measuring each
reporting category. This number of points is based on the typical psychometric
recommendations for a minimum of 10–12 score points needed to produce a reasonably
reliable estimate of a student’s mastery of the constructs measured.
3. Depth of Knowledge Consistency
On the Biology test, the items in the clusters require various Depth of Knowledge (DOK)
levels. Because items in a cluster are structured to assess a range of skills and knowledge
applications within a performance expectation, items at DOK levels 1, 2, and 3 are all
included on the test.

Page 8
Test Blueprint
The blueprint describes the content and structure of the operational test and defines the target
number of test items by reporting category for the Biology assessment.
Reporting Categories1
(Oklahoma Academic
Standards for Science)
Target
Number of
MC Items
Target
Number of
TE Items2
Target Range of
Score Points3
(Percentage of Total)
Target
Number of
Clusters4
Structure and Function 11–14
1 13–16
(27–33%)
4–5
HS-LS1-1
HS-LS1-2
HS-LS1-3
HS-LS1-4
HS-LS1-5
HS-LS1-6
HS-LS1-7
Ecosystem Dynamics 11–14 1 13–16
(27–33%)
4–5
HS-LS2-1
HS-LS2-2
HS-LS2-3
HS-LS2-4
HS-LS2-5
HS-LS2-6
HS-LS2-8
Heredity, Variation, and
Diversity
14–17 1 16–19
(33–40%)
5–6
HS-LS3-1
HS-LS3-2
HS-LS3-3
HS-LS4-1
HS-LS4-2
HS-LS4-3
HS-LS4-4
HS-LS4-5
Total
Operational Test 42 3
48 total score points
(100%) 15
(Please note that this blueprint does not include items that will be field-tested.)
1 Reporting category names are abbreviated from the topic names in the OASS. 2 Technology-enhanced items (TE items/TEIs) may be used to more authentically address some aspects of
the performance expectations (PEs). Each TEI will have a value of two score points. At this time, it is expected that each reporting category will include one TEI. More TEIs may possibly be introduced in future operational cycles. For a paper accommodation, the TEIs will be replaced by paired MC items (two linked multiple-choice questions), also worth two score points.
3 A minimum of 13 points is required to report results for a reporting category for Biology. 4 Performance expectations will be assessed using a cluster-based format: a set of three multiple-choice
items linked with a common stimulus or a set of two multiple-choice items and a technology-enhanced item linked with a common stimulus. Each cluster will align to a single performance expectation. The Biology operational test will contain a total of 15 clusters.

Page 9
Depth of Knowledge Assessed by Test Items
The Oklahoma Core Curriculum Test for Biology will, as closely as possible, reflect the
following Depth of Knowledge distribution of items within the clusters.
Biology Test DOK Distribution
Depth of Knowledge Percent of Total Test Points
Level 1 – Recall and Reproduction 5–10%
Level 2 – Skills and Concepts 65–75%
Level 3 – Strategic Thinking 15–25%
Items within a cluster are structured to assess a range of skill and knowledge applications within
a performance expectation. Some parts of the cluster may reflect more routine concepts and
skills, and thus require only DOK Level 1 cognition. Other parts of the cluster will reflect more
sophisticated use of knowledge and skills, as well as multi-dimensional thinking, and therefore
will require DOK Level 2 and DOK Level 3 cognition.
DOK Level 1
Level 1—Recall and Reproduction—is defined as recalling information such as a fact, definition,
term, or simple procedure, as well as performing a simple science process or procedure. At
Level 1, students supply basic knowledge; plug in numbers to use a simple formula; make simple
measurements; or perform a clearly defined, given series of steps. In simple/DOK 1 procedures,
the step or steps to follow are already outlined and are very familiar to/routinely performed by
students.
Some examples that represent, but do not constitute all, Level 1 performances are
recognizing or showing the correct representation of a basic scientific concept or
relationship in words, diagrams, or simple models.
performing a routine procedure, such as measuring length.
identifying basic tools or steps needed for a defined scientific investigation.
reading data from a graph or stating a simple, obvious pattern from data.
restating information from scientific text.
DOK Level 2
Level 2—Skills and Concepts—extends the mental processing beyond recalling or reproducing a
response at DOK Level 1. The content knowledge and process involved are more complex than
in Level 1. Level 2 items often require students to reason and make decisions as to how to
approach the question or problem and to plan or consider a series of steps.

Page 10
Some examples that represent, but do not constitute all, Level 2 performances are
specifying and explaining the relationship between basic concepts, properties, or
variables.
developing and using a scientific model in basic conceptual interpretations.
determining/planning a procedure for a scientific investigation according to specified
criteria and then performing the investigation.
asking clarifying questions about a phenomenon, a scientific investigation, or an
engineering problem.
classifying objects or data into logical categories.
organizing, displaying, comparing, and interpreting data in different graphical forms.
predicting the outcome of changes in a system, scientific investigations, or other events.
DOK Level 3
Level 3—Strategic Thinking—requires reasoning, planning, using evidence, and using a higher
level of thinking than the previous two levels. The cognitive demands of Level 3 are complex
and abstract. The complexity does not result only from the fact that there could be multiple
answers, a possibility for both Levels 1 and 2, but because the multistep task requires more
demanding reasoning. In most instances, requiring students to explain their thinking is at
Level 3, while requiring a very simple explanation or a word or two should be at Level 2. An
activity that has more than one possible answer and requires students to justify the response they
give would most likely be at Level 3.
Some examples that represent, but do not constitute all, Level 3 performances are
identifying rich research questions and designing investigations for a scientific or an
engineering problem, typically with more than one dependent variable.
developing a scientific model for a complex situation.
interpreting and drawing conclusions from complex experimental data.
justifying and providing evidence for explanations of phenomena.
constructing a scientific argument with a claim, evidence, and scientific reasoning.
evaluating the merits and limitations of models, investigative designs, scientific
arguments, etc.
using evidence to revise models, explanations, claims, etc.
solving non-routine science and engineering problems.
obtaining and combining information from multiple sources to explain or compare
scientific issues.
Note that while the DOK levels are presented discretely, the cognitive demands of items really
fall along a continuum. Many cognitive processes and their associated action verbs can be

Page 11
classified at different DOK levels depending on the complexity of what students are expected to
do. Therefore, relying primarily on verbs to make a DOK assignment is not reliable. For
example, the cognitive process of understanding can include clarifying, giving examples,
classifying, summarizing, inferring, comparing, making a model, and explaining. The depth of
knowledge at which such processes are carried out can vary, however, as shown in the chart.
Example of Cognitive Process Across Various DOK Levels
Cognitive
Process:
Understanding
DOK 1
Solve a one-step
problem
Represent simple
relationships in
words, pictures, or
symbols
DOK 2
Specify and explain
relationships
(e.g., non-examples/
examples;
cause-effect)
Make and record
observations
Make basic inferences
or logical predictions
from data/
observations
Use models/diagrams
to represent or
explain concepts
DOK 3
Use concepts to solve
non-routine problems
Explain, generalize,
or connect ideas
using supporting
evidence
Make and justify
claims
Explain thinking
when more than one
response is possible
Explain phenomena
in terms of concepts
References:
Webb Science Levels of Depth of Knowledge:
http://www.newleaders.org/wp-content/uploads/All-content-areas-DOK-levels-32802.pdf
Hess Cognitive Rigor Matrix, Science:
http://static.pdesas.org/content/documents/M2-Activity_2_Handout.pdf

Page 12
Universal Test Design Considerations
Universal design, as applied to assessments, is a concept that allows the widest possible range of
students to participate in assessments and may even reduce the need for accommodations and
alternative assessments by expanding access to the tests themselves. In the Oklahoma Core
Curriculum Tests, modifications have been made to some items to simplify and clarify their
instructions and to provide maximum readability, comprehensibility, and legibility. This includes
such changes as reduction of language load in content areas other than Reading, increased font
size, fewer items per page, and boxed items to assist visual focus. Specifically in the Science
tests, the cluster-based design reduces the number of unique stimuli that students must process.
The stimuli and items are constructed with clear wording and presentation, and they exclude
extraneous information. Additionally, the vocabulary level for the Biology test is two grade
levels below (at a Grade 8 level), except for science content words.
Test Administration Details
Online Administration
During online testing, the items within a cluster will be presented one at a time. The stimulus
will appear on the screen with each associated item.
For longer stimuli or items, a scroll bar will be present to allow students to scroll through the text
and/or answer choices.
Students may use the embedded scientific calculator or a scientific calculator that meets the
current Oklahoma School Testing Program’s calculator policy as documented by SDE. (See
http://ok.gov/sde/sites/ok.gov.sde/files/documents/files/Calculator%20Policy%202014_0.pdf).
No reference sheets/resource materials may be used by students during the Biology test. All
necessary formulas and information will be provided within the items.
Students will be able to use scratch paper for the online Biology test. This paper must be
collected and destroyed by the test administrator immediately following the test. The test
administrator must not look at what the student has written on the scratch paper.
Paper/Pencil Accommodation
Paper/pencil testing is used only as a testing accommodation. In the paper/pencil test booklet,
any technology-enhanced items that appear in the online test form will be replaced by paired
multiple-choice items that target the same constructs.

Page 13
Students may use a scientific calculator that meets the current Oklahoma School Testing
Program’s calculator policy as documented by SDE. (See
http://ok.gov/sde/sites/ok.gov.sde/files/documents/files/Calculator%20Policy%202014_0.pdf.)
Scratch paper will not be provided, as scratch work may be done in the test booklet.
Estimated Testing Time
The Biology test is divided into two sessions. Districts may exercise flexibility in determining
how to administer the sessions. When testing a session, test administrators may give students
additional time if they need it, but the additional time is to be given as an extension of that
specific testing session.
The following table provides estimates of the time required to administer the Biology test by
session. These time approximations are provided to facilitate planning administration logistics
within schools and to ensure adequate testing time for all students. Actual testing times may vary
from these approximations.
Biology Estimated Testing Times
Session Approximate Duration
Directions 20 minutes
Test Session 1 60–80 minutes
Test Session 2 60–80 minutes
Total Testing Time 140–180 minutes
Page 14
Item Specifications
Important Note:
The material in the test and item specifications should not be used as a curriculum guide.
The item specifications provide guidelines and suggestions for the type of content to be included in
item clusters, but they do not provide an exhaustive list of what can be included. The cluster
stimulus attributes, model item descriptions, and sample item clusters are not intended to be
completely definitive in nature or construction—the cluster stimuli and items may differ from one
test form to another, as may their presentations.
All item clusters are expected to be of the highest quality and be tightly aligned to the OASS. All
item clusters developed using these specifications are reviewed by Oklahoma educators and
approved by the Oklahoma State Department of Education.

Page 15
Introduction
The item specifications documentation is intended to provide guidance on the structure and
content of the test material developed for the Oklahoma Core Curriculum Test (OCCT) for
Biology. The Biology performance expectations of the Oklahoma Academic Standards for
Science (OASS) will be assessed on the OCCT using a cluster-based format: a set of three
multiple-choice items linked with a common stimulus or a set of two multiple-choice items and a
technology-enhanced item linked with a common stimulus.
Functionally, the item specifications documentation represents a bridge between the constructs in
the OASS, the Oklahoma Science Framework, the test specifications, and the test blueprint for
Biology. The item specifications delineate core emphases, examples, and boundaries for item
clusters written for each OASS performance expectation as well as expectations for the format
and structure of the cluster stimuli and items. In this way, the item specifications help ensure that
the item clusters appearing on the Biology test consistently and accurately reflect the constructs
in the OASS and validly measure students’ proficiency in the performance expectations of the
OASS.
The information utilized for the specifications for each Biology performance expectation draws
extensively from the OASS and from the Oklahoma Science Framework, thus providing a strong
link between instruction and assessment. The information in the item specifications is also
informed by the tenets in A Framework for K-12 Science Education1 and recognized best
practices in assessment (Standards for Educational and Psychological Testing2, Code of Fair
Testing Practices in Education3).
The item specifications are intended to be used by multiple audiences: Oklahoma educators,
Oklahoma State Department of Education staff, and testing vendors. The item specifications
provide outlines and suggestions for the types of content and presentation that can be utilized in
developing the item clusters for the Biology test. As such, the item specifications provide all
users with information to gauge the types of skills and understandings that students will be asked
to demonstrate on the Biology test. This information is useful to Oklahoma educators in planning
instruction and conducting classroom formative and summative assessment. It is also useful to
Oklahoma educators and State Department of Education staff in reviewing and approving item
clusters for use on the Biology test because it provides a clearly delineated description of the
intent of each performance expectation and what item clusters aligned to each performance
expectation should measure.
1 National Research Council. (2011). A Framework for K-12 Science Education: Practices, Crosscutting Concepts,
and Core Ideas. Committee on a Conceptual Framework for New K-12 Science Education Standards. Board on Science Education, Division of Behavioral and Social Sciences and Education. Washington, DC: The National Academies Press.
2 American Educational Research Association, American Psychological Association, and National Council on Measurement in Education (2014). Standards for Educational and Psychological Testing. Washington, DC: American Educational Research Association.
3 Code of Fair Testing Practices in Education (2004). Washington, DC: Joint Committee on Testing Practices.

Page 16
General Cluster Specifications
The Biology performance expectations of the OASS will be assessed on the OCCT by using a
cluster-based format: a set of three multiple-choice items linked with a common stimulus or a set
of two multiple-choice items and a technology-enhanced item linked with a common stimulus.
The Biology test consists of some clusters containing only multiple-choice items and some
clusters containing both multiple-choice and technology-enhanced items.
A cluster requires students to actively use the Science and Engineering Practice of the
performance expectation while applying their knowledge of the Crosscutting Concept and
drawing on their understanding of the Disciplinary Core Idea to explain a phenomenon or to
solve a science/engineering problem.
Cluster Stimulus
A cluster stimulus consists of the passages, graphs, models, figures, diagrams, data tables, etc.,
that students must read and examine in order to respond to the items in the cluster. To meet the
intent of the OASS, stimuli must represent a variety of topics and scenarios, many of them novel.
An individual stimulus may be a combination of multiple stimulus elements (e.g., some text plus
a diagram and a data table).
While the specific content and context requirements of a stimulus will vary depending on the
performance expectation being assessed (and are outlined in the individual specification for each
performance expectation), the following characteristics are necessary for all cluster stimuli:
1. Information in the stimulus is representative of the Science and Engineering Practice,
Disciplinary Core Idea, and Crosscutting Concept for a specific performance expectation.
2. The stimulus presents an example of an event, a phenomenon, an observation, an
investigation, or a problem that is engaging, realistic, meaningful, and appropriate for
Oklahoma students in a high school biology course (Grade 10).
3. The stimulus includes a “hook” or driving reason students would want to find out or know
more about the example presented, which is aligned with the core emphasis of the
performance expectation. When students are given information, data, or an experimental
setup to evaluate, they should know the research question and/or purpose of the research
when applicable. To avoid increases in reading load, hooks should be brief (1 or 2 sentences).
Additionally, hooks should be integral to the item, not gratuitous.
4. The stimulus provides sufficient information (in the form of tables, graphs, text, diagrams,
etc.) for the assessment of a specific performance expectation. In other words, the stimulus
must supply sufficient information to allow students to engage in the Science and

Page 17
Engineering Practice of the performance expectation in conjunction with the Disciplinary
Core Idea and Crosscutting Concept to respond to items.
5. The stimulus information must be necessary, but not conceptually sufficient, for the student
response (i.e., students must also utilize their own knowledge of the constructs in the
performance expectation to answer the items).
6. The information included within the stimulus must pertain to multiple items. Unique lead
information that supports only one item will be placed in the introduction to that particular
item. Extraneous information should be eliminated from the cluster stimulus and from item
lead information (i.e., only relevant, concise information is utilized in order to reduce
information overload).
7. There is a balance of graphic and textual stimulus materials among the set of clusters for the
test form. The pictorial and graphic representations in the stimulus are appropriate for the
grade level and performance expectation being assessed. The stimulus (text and graphic
elements) is presented on the screen in the layout that best facilitates student accessibility.
Scrolling is minimized when possible.
8. The placement of graphic and textual materials within the stimulus follows a logical flow of
information. This is facilitated by the use of clear language, transitions, and pointers between
text and graphics.
9. The stimulus avoids material or subject matter that might introduce bias or sensitivity issues:
a. The material is balanced and culturally diverse.
b. There is a balance of gender and active/passive roles by gender.
c. The stimulus does not display unfair representations of gender, race, ethnicity,
disability, culture, or religion; nor does the stimulus contain elements that are
offensive to any such groups.
d. The content of the stimulus avoids subject matter that might prompt emotional
distress on the part of the students.
10. The content of the stimulus is developed and verified using valid and reliable scientific
sources for contexts, examples, and data.
11. Permission to use stimuli from copyrighted material is obtained as necessary by the testing
vendor.
12. The stimulus supports the development of 6–8 associated items. (While clusters will contain
only three items on the operational test, additional items must be field-tested with the

Page 18
stimulus to ensure enough items are available to construct the operational clusters. Items are
sometimes rejected after the field test if the performance data for the item do not meet
psychometric requirements.)
13. Careful attention is given to the wording, length, and complexity of the stimulus:
word count of approximately 50–300 words
vocabulary level two grade levels below (at a Grade 8 level), except for science content
words
use of footnotes to define unfamiliar science content words (exception: one-word
parentheticals may be used)
focus on shorter sentence structure and less complex grammatical constructions
consideration of qualitative and quantitative readability measures to review text
complexity
Note: The exact vocabulary, word count, and complexity of each stimulus will be reviewed
by Oklahoma educators and approved by the Oklahoma State Department of Education to
achieve the most appropriate stimulus for each cluster based on the grade level and content
being assessed.
Cluster Items
The items within each cluster must work together cohesively to provide a valid measure of the
performance expectation being assessed. The following criteria should guide the development of
items in each cluster:
1. The items are tied closely to their specific stimulus so that the impact of non-curricular
knowledge and experience, while never wholly avoidable, is minimized.
2. The items cover the concepts, information, and evidence that are central to students’
understanding of the specific cluster stimulus and are focused on the Science and
Engineering Practice, Disciplinary Core Idea, and Crosscutting Concept of the performance
expectation. Across an item set it must be clearly evident that students have used all three
dimensions of the given performance expectation.
3. The items do not assess Science and Engineering Practices that are not part of the
performance expectation that the cluster is aligned to.
4. The items within a cluster address different depths and breadths of understanding of the
specific performance expectation. Items are to be written to a range of depths of knowledge,
from basic representation and skill applications to strategic thinking and reasoning.

Page 19
5. The model item stems described in the specifications for each performance expectation are
utilized whenever possible. The model item stems represent general ways (and specific ways,
in brackets) to assess the multiple dimensions of each performance expectation. The model
item stems are not meant to be an exhaustive listing; rather, they represent a selection that
can be used with an appropriate stimulus to craft well-aligned items. Other stems may be
used in place of these model item stems, but they must capture multiple dimensions such that
the finished cluster shows alignment to all three dimensions of the performance expectation.
6. Graphics and information for all cluster items are generally placed in the cluster stimulus, but
items may have additional information or graphics when necessary. (Unique lead information
supporting only one item will be placed in the introduction to that specific item.) Graphics
must be clearly associated with their intended items.
7. Each item in the cluster is independent of the other items; that is, the answer to one item is
not required to answer the other items.
8. To the greatest extent possible, no item or answer choice clues the correct answer to any
other item.
9. The items in the cluster are presented to the student one at a time online. The stimulus
appears on the screen with each item in the cluster.

Page 20
General Item Writing Mechanics
All items written during the development of the item clusters for the Biology test will follow best
practices in assessment pertaining to the structure and format of the items per item type.
Consideration is also given to vocabulary word choices.
Multiple-Choice Items
Each multiple-choice item has a stem (formatted as a question or an incomplete
statement) and four answer options, only one of which is correct.
All item stems clearly indicate what is expected in the item to help students focus on
selecting a response. The stem presents a complete problem so that students know what
to do before looking at the answer choices; students should not need to read all the
answer choices before knowing what is expected.
All multiple-choice options—the correct response and the three distractors—are similar
in length and syntax. Students should not be able to rule out an incorrect answer or
identify a correct response solely because it looks or sounds different from the other
answer choices. Distractors are created so that students reason their way to the correct
answer rather than simply identify incorrect responses because of a distractor’s obviously
inappropriate nature. Distractors should always be plausible (but incorrect) in the context
of the item stem.
Any art within individual items (e.g., additional lead art, graphic options) must be
functional and necessary for the item.
Most item stems are positively worded and avoid the use of the word “not.” If a negative
is required, the preferred format is “All of the following . . . except.”
The responses “Both of the above,” “All of the above,” “None of the above,” and
“Neither of the above” are not used as options.
Technology-Enhanced Items
Technology-enhanced items should be used to more authentically address some aspects
of the OASS performance expectations and/or to provide more opportunity for students to
construct rather than select their response.
Interaction types are match, hot-spot, drag-drop, and drop-down. Each technology-
enhanced item contains only one interaction type per item.
For each technology-enhanced item, the interaction type used is that which is the most
appropriate and enhancing to the construct to be measured.
Each technology-enhanced item is structured to contain the question (content) first,
followed by a single sentence with directions on how to complete the interaction in that
item. Consistent style and language are used in these directions (e.g., “Drag the pictures,”
“Click the object”).

Page 21
Each technology-enhanced item is worth two points. Students may earn two, one, or zero
points for their response; the scoring rubric will define responses that are completely
correct and partially correct based on the skill and understanding being assessed.
Note that for each technology-enhanced item that is authored, a paired multiple-choice
item is also created for the paper accommodation. Each paired multiple-choice item
consists of two linked multiple-choice questions and assesses information similar to that
in the technology-enhanced item. The paired multiple-choice item, like the technology-
enhanced item, is worth two points.
Item Vocabulary
No single source is available to determine the reading level of various words. Therefore,
the appropriateness and difficulty of a word is determined in various ways. Vocabulary is
checked in the following: EDL Core Vocabularies in Reading, Mathematics, Science, and
Social Studies; Basic Reading Vocabularies; the Living Word; or other reliable
readability sources.
In addition, each vocabulary word must be approved by Oklahoma’s Content Review
Committee. The committee, composed of Oklahoma educators from across the state,
reviews proposed vocabulary in item clusters for grade-level appropriateness.
Except for science content words, the Biology test will have a vocabulary level two grade
levels below (at a Grade 8 level).
Unfamiliar science words in stimuli are to be defined using footnotes. The exception to
this is single-word definitions, which may be placed in parentheses [e.g., mean
(average)].

Page 22
Overview of Layout of Item Specifications by Performance Expectation
For each OASS performance expectation, the item specifications are organized in the following way:
Core Idea Category: Performance Expectation Code1
Performance Expectation Code and Text2
OASS Clarification Statement: 3
OASS Assessment Boundary: 4
Science & Engineering
Practice: 5
Disciplinary Core
Idea:
Crosscutting
Concept:
In Lay Terms: 6
Cluster Clarifications: 7
Cluster Stimulus Attributes: 8
Typical stimulus elements:
Possible contexts:
Content and evidence to be included:
Types of student responses that need to be supported:
Allowable Item Types: 9
Model Item Descriptions for Performance Expectation: 10
Item Type DOK Model Stem Response Characteristics*
MC
MC
MC
MC
MC
MC
MC
MC
*Response options can make use of Student Misconceptions (examples of
scientifically incorrect assumptions) related to this performance
expectation; references to misconceptions are listed in the links below: 11
Sample Cluster for Performance Expectation: 12
1 Core idea category and code for each
performance expectation from the OASS
(e.g., Biological Unity and Diversity, HS-
LS4-5)
2 Coding and text of the performance
expectation from the OASS
3 Clarification statement for the performance
expectation from the OASS
4 Assessment boundary for the performance
expectation from the OASS
5 Science & Engineering Practice, Disciplinary
Core Idea, and Crosscutting Concept that
underpin the performance expectation from
the OASS
6 Description of the basic meaning and intent
of the performance expectation in easily
understandable terms
7 Additional details, clarifications, and content
limits needing to be conveyed
8 Specific information about the typical
features of the stimuli for clusters aligned to
this performance expectation
9 Item types that may comprise the item clusters
10 Descriptions of possible item stems/starters
that could be included in clusters for this
performance expectation; i.e., general
statements (and/or specific statements, in
brackets) of ways to assess each
performance expectation are given
11 Common student misconceptions related to
the performance expectation, to be used
when writing items
12 Example of a cluster for this performance
expectation (*will eventually be available for
all clusters)

Page 23
Item Specifications by Performance Expectation
HS-LS1-1
HS-LS1-2
HS-LS1-3
HS-LS1-4
HS-LS1-5
HS-LS1-6
HS-LS1-7
HS-LS2-1
HS-LS2-2
HS-LS2-3
HS-LS2-4
HS-LS2-5
HS-LS2-6
HS-LS2-8
HS-LS3-1
HS-LS3-2
HS-LS3-3
HS-LS4-1
HS-LS4-2
HS-LS4-3
HS-LS4-4
HS-LS4-5

Page 24
From Molecules to Organisms: Structure and Processes: HS-LS1-1 back to Item Specifications list
HS-LS1-1. Construct an explanation based on evidence for how the structure of DNA determines the
structure of proteins, which carry out the essential functions of life through systems of specialized cells.
OASS Clarification Statement:
Emphasis is on the conceptual understanding that DNA sequences determine the amino acid sequence,
and thus, protein structure. Students can produce scientific writings, oral presentations and/or physical
models that communicate constructed explanations.
OASS Assessment Boundary:
Assessment does not include identification of specific cell or tissue types, whole body systems, specific
protein structures and functions, or the biochemistry of protein synthesis.
Science & Engineering Practice:
Constructing Explanations and
Designing Solutions
Construct an explanation based
on valid and reliable evidence
obtained from a variety of
sources (including students’ own
investigations, models, theories,
simulations, peer review) and the
assumption that theories and
laws that describe the natural
world operate today as they did
in the past and will continue to
do so in the future.
Disciplinary Core Idea:
LS1.A: Structure and Function
Systems of specialized cells
within organisms help them
perform the essential
functions of life.
All cells contain genetic
information in the form of
DNA molecules.
Genes are regions in the DNA
that contain the instructions
that code for the formation of
proteins, which carry out
most of the work of cells.
Crosscutting Concept:
Structure and Function
Investigating or
designing new systems
or structures requires a
detailed examination of
the properties of
different materials, the
structures of different
components, and
connections of
components to reveal its
function and/or solve a
problem.
In Lay Terms:
Students should be able to explain how molecules called DNA serve as the instructions that all living
organisms use to produce proteins, which in turn perform essential functions of life.
Cluster Clarifications:
Items will not ask students to memorize which specific codons produce which amino acid by
name. Codon charts can be provided as a reference (being clear about DNA vs. RNA code).
Item focus should be on the interrelationships of components and the conceptual process, and not
on nomenclature/mechanics.
In order to address the CCC, stimuli should involve, and items should address, how the function
of DNA and proteins relate to structure(s) in cells and/or organisms.
For clusters with a mutation context, the stimulus should show a mutation that still allows a
protein to be produced, but in an altered form (rather than a mutation that prevents a protein from
being produced at all).
In order to address the SEP, real data showing the expression of proteins must be used, including
proteins that show codominant expression. However, the specifics of the codominant inheritance
pattern is not to be discussed in stimulus or items.
Page 25
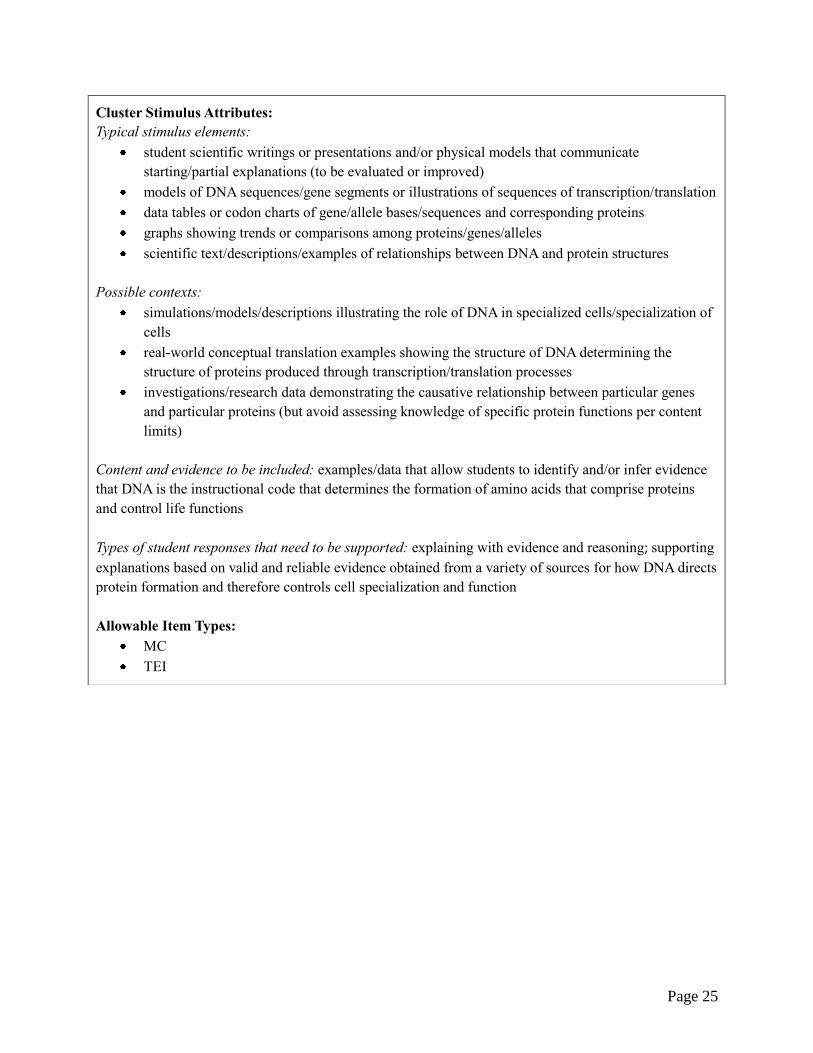
Cluster Stimulus Attributes:
Typical stimulus elements:
student scientific writings or presentations and/or physical models that communicate
starting/partial explanations (to be evaluated or improved)
models of DNA sequences/gene segments or illustrations of sequences of transcription/translation
data tables or codon charts of gene/allele bases/sequences and corresponding proteins
graphs showing trends or comparisons among proteins/genes/alleles
scientific text/descriptions/examples of relationships between DNA and protein structures
Possible contexts:
simulations/models/descriptions illustrating the role of DNA in specialized cells/specialization of
cells
real-world conceptual translation examples showing the structure of DNA determining the
structure of proteins produced through transcription/translation processes
investigations/research data demonstrating the causative relationship between particular genes
and particular proteins (but avoid assessing knowledge of specific protein functions per content
limits)
Content and evidence to be included: examples/data that allow students to identify and/or infer evidence
that DNA is the instructional code that determines the formation of amino acids that comprise proteins
and control life functions
Types of student responses that need to be supported: explaining with evidence and reasoning; supporting
explanations based on valid and reliable evidence obtained from a variety of sources for how DNA directs
protein formation and therefore controls cell specialization and function
Allowable Item Types:
MC
TEI
Page 26
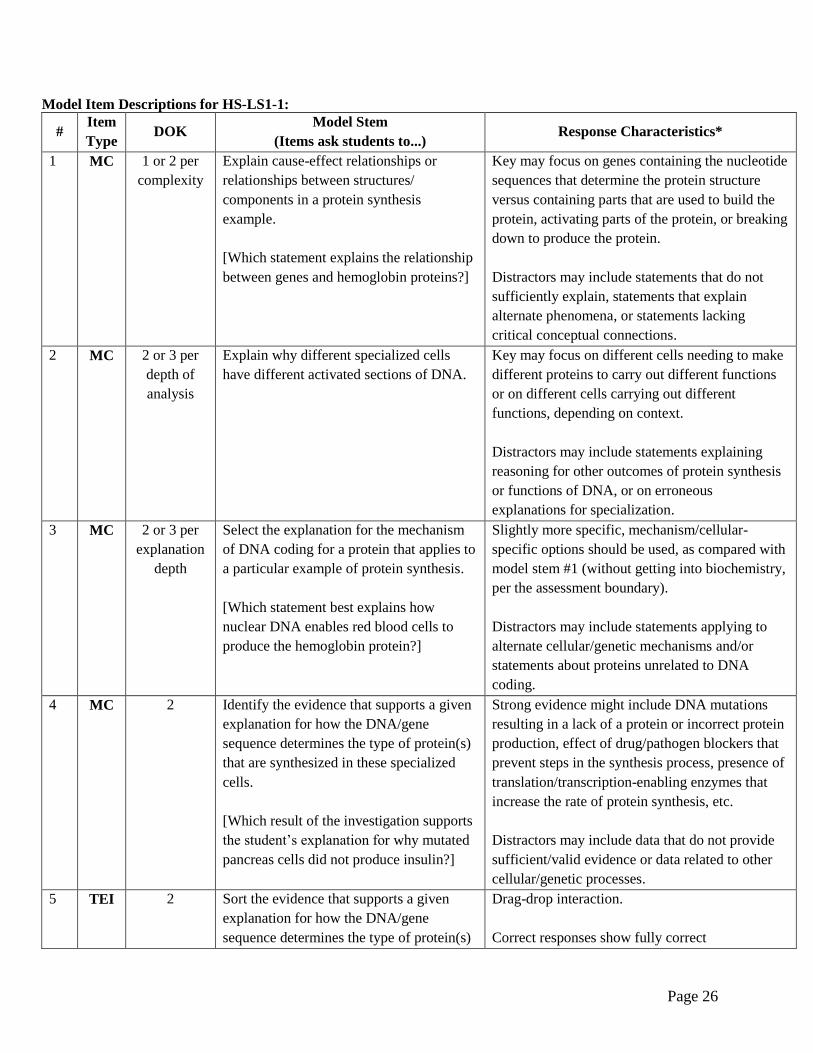
Model Item Descriptions for HS-LS1-1:
# Item
Type DOK
Model Stem
(Items ask students to...) Response Characteristics*
1 MC 1 or 2 per
complexity
Explain cause-effect relationships or
relationships between structures/
components in a protein synthesis
example.
[Which statement explains the relationship
between genes and hemoglobin proteins?]
Key may focus on genes containing the nucleotide
sequences that determine the protein structure
versus containing parts that are used to build the
protein, activating parts of the protein, or breaking
down to produce the protein.
Distractors may include statements that do not
sufficiently explain, statements that explain
alternate phenomena, or statements lacking
critical conceptual connections.
2 MC 2 or 3 per
depth of
analysis
Explain why different specialized cells
have different activated sections of DNA.
Key may focus on different cells needing to make
different proteins to carry out different functions
or on different cells carrying out different
functions, depending on context.
Distractors may include statements explaining
reasoning for other outcomes of protein synthesis
or functions of DNA, or on erroneous
explanations for specialization.
3 MC 2 or 3 per
explanation
depth
Select the explanation for the mechanism
of DNA coding for a protein that applies to
a particular example of protein synthesis.
[Which statement best explains how
nuclear DNA enables red blood cells to
produce the hemoglobin protein?]
Slightly more specific, mechanism/cellular-
specific options should be used, as compared with
model stem #1 (without getting into biochemistry,
per the assessment boundary).
Distractors may include statements applying to
alternate cellular/genetic mechanisms and/or
statements about proteins unrelated to DNA
coding.
4 MC 2 Identify the evidence that supports a given
explanation for how the DNA/gene
sequence determines the type of protein(s)
that are synthesized in these specialized
cells.
[Which result of the investigation supports
the student’s explanation for why mutated
pancreas cells did not produce insulin?]
Strong evidence might include DNA mutations
resulting in a lack of a protein or incorrect protein
production, effect of drug/pathogen blockers that
prevent steps in the synthesis process, presence of
translation/transcription-enabling enzymes that
increase the rate of protein synthesis, etc.
Distractors may include data that do not provide
sufficient/valid evidence or data related to other
cellular/genetic processes.
5 TEI 2 Sort the evidence that supports a given
explanation for how the DNA/gene
sequence determines the type of protein(s)
Drag-drop interaction.
Correct responses show fully correct

Page 27
that are synthesized in these specialized
cells.
[Drag evidence statements to support event
sequences or connect cause and effect.]
sort/selection/placement.
Partial credit would be given for a subset of
correct responses.
6 MC 2 Describe the reasoning that connects the
evidence of protein synthesis to DNA
control of the process(es).
Reasoning might relate to evidence for the
valid/actual steps in the process versus steps that
don’t involve the DNA control process, such as
evidence for the roles of molecules during
transcription/translation/synthesis as opposed to
cell reproduction, respiration, mutation, etc.
Distractors may include statements including
invalid/unsupported reasoning or reasoning for
alternate phenomena.
7 MC 2 or 3 per
complexity
Identify which statement/clarification will
best improve the explanation for protein
synthesis in this example.
Distractors may include information/data/trivial
statements that do not provide an improved
explanation.
8 MC 2 Explain how protein synthesis in these
various types of body cells enables the
organism to survive.
Distractors may include roles of protein not
related to specialization of cells or organism
survival.
9 MC 2 or 3 per
complexity
of example/
explanation
Identify which explanation is supported by
the evidence in this example of how
specialized cells function in the body.
Distractors may include incomplete or incorrect
descriptions/explanations.
*Response options can make use of Student Misconceptions (examples of scientifically incorrect
assumptions) related to this performance expectation; references to misconceptions are listed in
the links below:
From http://assessment.aaas.org:
Amino acids are the subunits that make up DNA.
Only animals have DNA; plants and mushrooms do not have DNA.
The information in the DNA molecules of an organism does not affect the functions of an organism’s cells.
Each DNA molecule is made up of more than one chromosome.
Each chromosome is made up of more than one DNA molecule.
Genes do not contain hereditary/genetic information.
Genes are sequences of amino acids.
Genes are proteins.
From http://www.carolina.com/teacher-resources/Interactive/5-common-misconceptions-in-genetics/tr10631.tr:
Students confuse genetic terms such as chromosomes, genes, and alleles and do not understand the
difference between them.

Page 28
Sample Cluster for HS-LS1-1:
Students learned some information about red blood cells:
Red blood cells carry oxygen through the bloodstream to all cells of the body.
Red blood cells use the protein hemoglobin to carry oxygen. Hemoglobin binds and carries oxygen
molecules.
Hemoglobin normally forms a ring-shaped molecule.
A mutation in the DNA of the hemoglobin gene produces clumped hemoglobin molecules that can reduce
oxygen transport.
The students wondered exactly how the DNA mutation causes changes in the hemoglobin. The students found a
diagram comparing what happens in cells with and without the DNA mutation. The diagram shows only a small
part of the DNA sequence of the hemoglobin gene.
(Items on the following pages)

Page 29
Item 1
Item Type: MC
DOK 1
Key: D
Which statement explains the relationship between DNA and the hemoglobin in red blood cells?
A. The DNA sequence mutates to allow the hemoglobin to carry oxygen.
B. The DNA sequence folds at the proper location to shape the hemoglobin.
C. The DNA sequence is built from the RNA determined by the hemoglobin.
D. The DNA sequence encodes the amino acid sequence that forms the hemoglobin.
Item 2
Item Type: MC
DOK 2
Key: C
Which statement best explains how RNA supports the production of hemoglobin proteins?
A. Mutations in the structure of the protein cause changes in the RNA sequences.
B. RNA sequences from the same chromosomes produce identical protein structures.
C. RNA sequences direct the correct order of amino acids that join to form the protein.
D. Blood type determines which sequences become RNA, amino acids, and hemoglobin proteins.
Item 3
Item Type: MC
DOK 3
Key: A
The information about hemoglobin production can be used as evidence to support which inference about
hemoglobin gene expression?
A. Mutations in the hemoglobin gene may change its function in the body
B. Mutations in the hemoglobin gene will not change the amount of hemoglobin produced
C. Production of mutant hemoglobin may lead to mutations in other genes.
D. Production of mutant hemoglobin will not lead to changes in amount of hemoglobin produced.

Page 30
From Molecules to Organisms: Structure and Processes: HS-LS1-2 back to Item Specifications list
HS-LS1-2. Develop and use a model to illustrate the hierarchical organization of interacting systems that
provide specific functions within multicellular organisms.
OASS Clarification Statement:
Emphasis is on the levels of organization including cells, tissues, organs, and systems of an organism.
OASS Assessment Boundary: Assessment does not include interactions and functions at the molecular or chemical level.
Science & Engineering Practice:
Developing and Using Models
Develop and use a model based
on evidence to illustrate the
relationships between systems or
between components of a
system.
Disciplinary Core Idea:
LS1.A: Structure and Function
Multicellular organisms have
a hierarchical structural
organization in which any
one system is made up of
numerous parts and is itself a
component of the next level.
Crosscutting Concept:
Systems and System Models
Models (e.g., physical,
mathematical, computer
models) can be used to
simulate systems and
interactions—including
energy, matter, and
information flows—
within and between
systems at different
scales.
In Lay Terms:
Students should be able to create or analyze models that show the structural organization of multicellular
organisms: Cells are the smallest unit of life. Cells make up tissues. Tissues make up organs. Organs
make up organ systems. Organ systems make up multicellular organisms.
Cluster Clarifications:
Interactions and relationships that students need to represent, describe, and analyze in the model
include (1) structure-function relationships in the system, and (2) the interdependence of body system
functions.
In order to address the SEP and CCC, when students develop a model, they are expected to construct
a model from evidence/data, complete a model, or choose the best model to illustrate a given
phenomenon. When students use a model, they interact with an already complete model. When
students develop and use a model, they are expected to construct a model from evidence/data,
complete a model or choose the best model to illustrate a given concept in some items. In other items
they interact with the portions of the model that are already complete. A "develop and use" cluster
must contain both types of items. A physical demonstration of a phenomenon is not a model as it does
not differ from the reality it represents (in materials, scale, etc.).

Page 31
Cluster Stimulus Attributes:
Typical stimulus elements:
models (complete or partial) of cells, tissues, organs, organ systems, organisms. Relevant
components that students need to include in the model are system parts (e.g., cell, tissue, organ,
organ system) and any necessary functions/processes.
models comparing organizational levels at different scales
diagrams/picture/text description of combinations of organizational levels
Possible contexts:
differentiation between levels of structural organization using provided models
comparisons of organization levels from a model organism to another organism
constructions of models to illustrate hierarchal relationships
Content and evidence to be included: models and/or information about hierarchical structural
organization
Types of student responses that need to be supported: constructing and using models to identify and show
different levels of organization and their influence/contribution to body function
Allowable Item Types:
MC
TEI

Page 32
Model Item Descriptions for HS-LS1-2:
# Item
Type DOK
Model Stem
(Items ask students to...) Response Characteristics*
1 MC 1 or 2 per
context
Identify the model that shows the
correct labeling of cells, tissues,
organs, and/or organ systems.
Distractors may include models with incorrect
organization/labeling.
2 MC 1 or 2 per
context
Identify the level of organization that
includes each individual unit OR the
groups of cells/tissues/organs shown in
the model/diagram.
[Which level of organization is
represented by the tendon in the
muscle diagram?]
Key may focus on a particular level of
organization apparent in the model.
Distractors may include levels of organization
above and below or physiological units other
than organizational levels.
3 TE 2 Arrange/locate the structures to show
the correct levels of organization.
Drag-drop or hot-spot interaction.
A minimum of three and a maximum of four
correct associations should be used.
Correct responses show all required
associations/locations.
Partial credit would be given for a subset of
correct responses.
4 TE 2 Label a model of a complex organism
to indicate the levels of organization
present.
[Label the structures/levels of
organization in the organism (by
selecting the correct drop-down option
or dragging labels).]
Drag-drop or drop-down interaction.
A minimum of three labels should be required.
Correct responses show all labels accurately
placed/selected.
Partial credit would be awarded for a subset of
correct responses.
5 MC 2 Identify the description that best fits
the component of the model indicated.
[Which statement best describes the
part of the model that includes the
optic nerve?]
Key may focus on structural physiology, the
component, or the correct organizational level.
Distractors may include descriptions of other
structural components within the system or
structural components of other systems per
common misconceptions.
6 MC 2 Identify the organizational level of a
modeled structure.
[Which term best describes the tendons
and ligaments of the arm structure?]
Distractors may include incorrect organizational
levels.

Page 33
7 MC 1 or 2 per
evaluative
distinctions
Describe the purpose/system of the
organizational hierarchy in the model.
[Which statement best describes how
this model is organized?]
[Which system of classification applies
to this model?]
Key may focus on describing the hierarchic
nature of the model’s components.
Distractors may include misinterpretations/
misconceptions of the model and/or its
components, other common features of the
model, or levels not shown in the model.
8 MC 1 or 2 per
relationship
complexity
Describe structural relationships
between hierarchical levels or
components in a given model.
Key may focus on describing positions/
functioning of organizational parts that support a
higher level of organization or component
smaller parts of an organism, organ system,
organ, or tissue.
Distractors may include descriptions of structural
relationships not related to the model or model
characteristics not related to structural
organization.
9 MC 2 Describe the interactions/relationships
among components of the model.
[How do the stomata cells relate to the
various leaf tissues?]
Question and key may focus on different levels
to which indicated components belong and on
structure and/or function of parts of a higher
structural level.
Distractors may include misinterpretations/
misconceptions about the relationships in the
model and the way different structural levels
work together.
10 MC 2 or 3 per
the model/
concept
Complete/modify the model to
demonstrate an underlying concept
about the hierarchical organization of
multicellular organisms.
Key may focus on missing elements of the model
that provide reasoning for classification of
components due to structure,
common/differentiated function, position, etc.
Distractors may include components associated
or not associated with the model but not involved
in the underlying concept of the model.
11 MC 2 Describe one thing the model shows
about body/body system/organ system
structure or function.
Key could be very general (idea of hierarchical
organization) or more specific (one aspect of
hierarchical organization).
Distractors may include statements that describe
aspects of another level or system.

Page 34
*Response options can make use of Student Misconceptions (examples of scientifically incorrect
assumptions) related to this performance expectation; references to misconceptions are listed in
the links below:
From http://assessment.aaas.org:
Cells are not organized into the body structures of the organism they are part of.
From http://www.rpdp.net/sciencetips_v3/L8B4.htm:
Organ systems (and their parts) act independently of each other.
Students may also believe the following:
Tissues and organs are “overgrown” cells.
Organs are internal structures only.
Cells have organs and tissues (instead of organelles and structural components).

Page 35
From Molecules to Organisms: Structure and Processes: HS-LS1-3 back to Item Specifications list
HS-LS-1-3. Plan and conduct an investigation to provide evidence of the importance of maintaining
homeostasis in living organisms.
OASS Clarification Statement:
A state of homeostasis must be maintained for organisms to remain alive and functional even as external
conditions change within some range. Examples of investigations could include heart rate response to
exercise, stomata response to moisture and temperature, root development in response to water levels, and
cell response to hyper and hypotonic environments.
OASS Assessment Boundary:
Assessment does not include the cellular processes involved in the feedback mechanism.
Science & Engineering Practice
Planning and Carrying Out
Investigations
Plan and conduct an
investigation individually and
collaboratively to produce data
to serve as the basis for
evidence, and in the design:
decide on types, how much, and
accuracy of data needed to
produce reliable measurements
and consider limitations on the
precision of the data (e.g.,
number of trials, cost, risk,
time), and refine the design
accordingly.
Disciplinary Core Idea:
LS1.A: Structure and Function
Feedback mechanisms
maintain a living system’s
internal conditions within
certain limits and mediate
behaviors, allowing it to
remain alive and functional
even as external conditions
change within some range.
Outside that range (e.g., at
too high or too low external
temperature, with too little
food or water available) the
organism cannot survive.
Crosscutting Concept:
Stability and Change
Feedback (negative or
positive) can stabilize or
destabilize a system.
In Lay Terms:
Students should be able to describe ways to design or improve an investigation about the importance of
homeostasis. Homeostasis is a process that regulates or balances an organism’s cellular functions as
external factors change, allowing the organism to remain alive.
Cluster Clarifications:
Interactions and relationships that students need to focus on when using body systems as examples
for homeostasis should be at the large-scale, conceptual level (heartbeat, shivering, sweating, etc.),
and not on the details of the system.

Page 36
Cluster Stimulus Attributes:
Typical stimulus elements:
initial observations or question to be investigated
investigation design and data (to be analyzed/improved)
lists of materials and tools to use for an investigation
Possible contexts:
investigations of heat regulation by evaporation of water (perspiration/transpiration)
research showing weather/climate’s role in humans’ body temperature (electrolyte deficiency
sweating, shivering, etc.)
investigations showing cell response to hyper- and hypotonic environments; investigations or
research data regarding cells’ reactions in different solutions, e.g., saltwater vs. freshwater fish
the fight-or-flight response
heart rate response to exercise
investigations or study results of plant stomata’s response to moisture and temperature or root
development in response to water levels
Content and evidence to be included: tables/charts/pictures/diagrams containing information to plan an
investigation and/or evaluate a given investigation, with a focus on obtaining the necessary evidence for
the importance of homeostasis
Types of student responses that need to be supported: describing and justifying procedures, tools,
materials, data to collect, and/or a way to revise an investigation
Allowable Item Types:
MC
TEI
Page 37
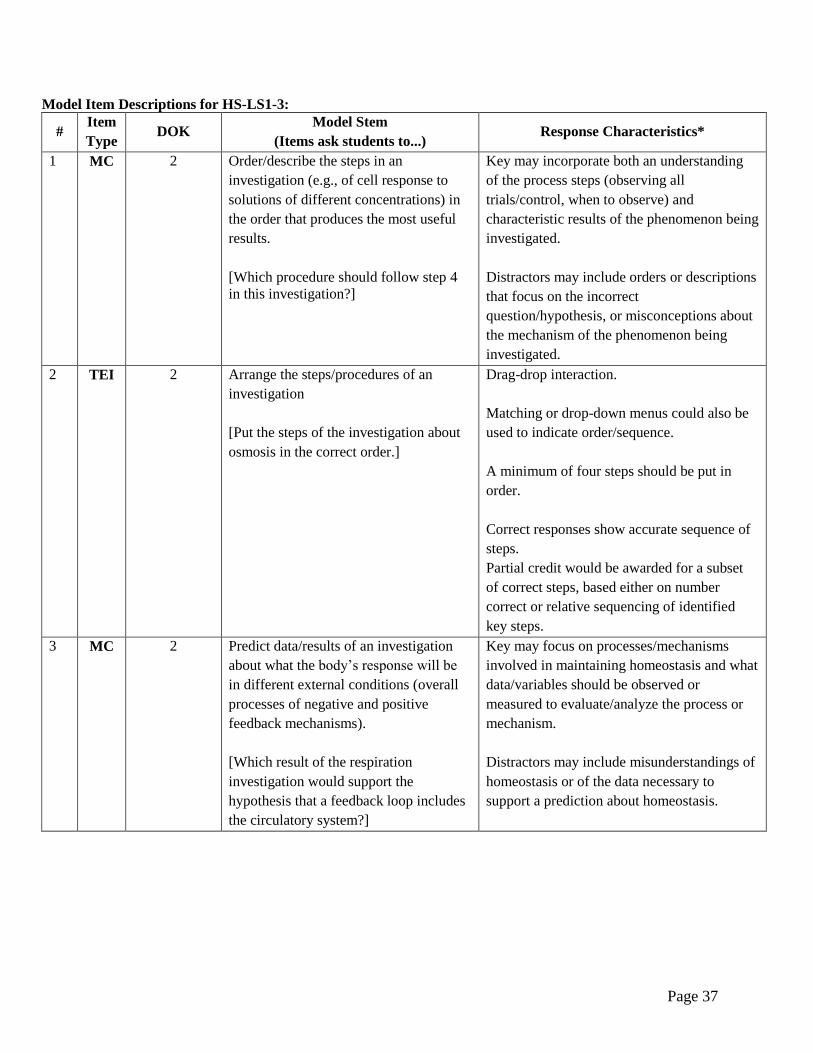
Model Item Descriptions for HS-LS1-3:
# Item
Type DOK
Model Stem
(Items ask students to...) Response Characteristics*
1 MC 2 Order/describe the steps in an
investigation (e.g., of cell response to
solutions of different concentrations) in
the order that produces the most useful
results.
[Which procedure should follow step 4
in this investigation?]
Key may incorporate both an understanding
of the process steps (observing all
trials/control, when to observe) and
characteristic results of the phenomenon being
investigated.
Distractors may include orders or descriptions
that focus on the incorrect
question/hypothesis, or misconceptions about
the mechanism of the phenomenon being
investigated.
2 TEI 2 Arrange the steps/procedures of an
investigation
[Put the steps of the investigation about
osmosis in the correct order.]
Drag-drop interaction.
Matching or drop-down menus could also be
used to indicate order/sequence.
A minimum of four steps should be put in
order.
Correct responses show accurate sequence of
steps.
Partial credit would be awarded for a subset
of correct steps, based either on number
correct or relative sequencing of identified
key steps.
3 MC 2 Predict data/results of an investigation
about what the body’s response will be
in different external conditions (overall
processes of negative and positive
feedback mechanisms).
[Which result of the respiration
investigation would support the
hypothesis that a feedback loop includes
the circulatory system?]
Key may focus on processes/mechanisms
involved in maintaining homeostasis and what
data/variables should be observed or
measured to evaluate/analyze the process or
mechanism.
Distractors may include misunderstandings of
homeostasis or of the data necessary to
support a prediction about homeostasis.

Page 38
4 MC 2 Select which variable to measure to
gather data about how a body system
will respond to an environmental
condition.
[What measurement will provide data to
best help answer the research question?]
Use common body systems (e.g., circulatory,
nervous, respiratory, digestive, immune) that
respond directly to a stimulus.
Distractors may include variables that
measure body system responses to other
common stimuli, body system characteristics
that are not responses to stimuli, or
measurements of the stimuli rather than the
response.
5 MC 1 or 2 per
clarity/
complexity
of the results
Identify the hypothesis of a described
investigation about homeostasis.
[Which question/hypothesis is being
investigated in this procedure to test
cells?]
Key may focus on the dependent variable’s
response to the intended change in the
independent variable.
Distractors may include variables or
questions/predictions that do not connect the
relevant cause-effect pattern.
6 MC 2 Based on supplied data/observations,
identify the phenomenon being
investigated.
[Which statement best describes the
human body mechanism being
investigated by gathering the data in
Table 1?]
Distractors may include related phenomena
that cannot be investigated with the data or
observations supplied.
7 MC 2 Describe the data/observations that
would support the purpose of an
investigation or claim being investigated.
[Which of the following observations
would provide evidence that a person
cannot produce an adequate amount of
adrenaline?]
Distractors may include descriptions of
related claims that cannot be investigated (or
may be only partially investigated) with the
data or observations supplied.
8 MC 2 Describe how data can be used as
evidence of the phenomenon being
investigated.
[Based on the information in the
investigation plan, which step in the
process shows how the thyroid gland
controls metabolism?]
Key may focus on the operative mechanism in
a system that maintains homeostasis.
Distractors may include process steps/data
that do not support a conclusion about the
investigated phenomenon.

Page 39
9 MC 2 or 3 per
complexity
of critique
points/depth
Critique an investigation for
inaccuracies, limitations, or flaws in
tools, procedures, or expected results
considering the question or hypothesis.
[Which statement best explains why the
data from the table may not be reliable to
answer the question being investigated?]
DOK Level 3 items should incorporate
elements of content misconceptions in
addition to consideration of varying degrees
of impact of the investigative shortcomings on
the results.
Distractors may include steps/procedures that
do not significantly affect results or
conclusions.
10 MC 2 Explain how to measure relevant
properties of the parameter(s) being
investigated (e.g., metabolic rates, cell
size, time), including units where
appropriate.
[Which tools and units should students
use to measure the response of both the
circulatory and respiratory systems in
this investigation?]
[Which of the following explains how
the scientists should measure the effect
of cold temperatures on the autonomic
nervous system?]
Distractors may include incorrect procedures,
correct procedures but incorrect units, units
for an incorrect variable, or the use of familiar
but incorrect or less useful or accurate tools or
methods.
11 MC 2 Explain how to manipulate or analyze
measurements to be collected in an
investigation.
Distractors may include manipulations of
inappropriate factors, inappropriate
calculations or relationships, incorrect
selection of measurement criterion, or
inappropriate limits of acceptable
accuracy/reliability.
12 MC 3 Describe the investigation plan that will
provide the most useful evidence to
answer a given question or support/reject
a claim related to homeostasis
mechanisms.
[Which investigation plan should the
students use to demonstrate the idea that
heart rate changes in response to
exercise?]
Distractors may include irrelevant steps or
process that will be less useful in providing
data to answer the question or support/ reject
the claim.

Page 40
13 MC 3 Modify an investigation plan (e.g., to
improve quality of data) to produce data
to support a given claim related to
changes in a system that maintains
homeostasis in cells or organisms.
[Which of the following shows how to
modify the investigation/plan/procedure
to test whether the different solutions
affect cell volume?]
[How should the students modify their
investigation to increase the validity of
their conclusion about water balance
inside and outside of cells?]
Distractors may include modifications that
will make the data less useful in supporting
the claim or will add procedures irrelevant to
supporting the claim. This may include
increasing the number of trials while
introducing uncontrolled variables, limiting
uncontrolled variables while also decreasing
the number of trials, or increasing the amount
of data collected while reducing the number
of trials for each factor tested.
14 MC 1 or 2 per
analysis
required
Identify or justify the independent,
dependent, and/or controlled variables in
an investigation set up to measure the
effect of an external stimulus on body
systems.
[In this investigation, why is time the
independent variable?]
[What is one variable the students should
control to increase the accuracy of results
in this investigation?]
Distractors may include independent and
dependent variables as well as variables that
may be/are controlled.
15 MC 3 Explain how the manipulation of one or
more tools or procedures would be
expected to influence the result of an
investigation of homeostasis.
[What would taking measurements more
often show about the relationship of the
dependent variable to homeostasis?]
Key may focus on impacts of changes in
procedures or tools on the dependent variable
or on the significance of the data relative to
the hypothesis.
Distractors may include statements that reveal
an incorrect understanding of how the
procedure influences the results.
16 TEI 2 or 3 per
setup
complexity
Modify a diagram to represent an
investigation setup that will test the
claim described.
[Modify the diagram to show how to test
the claim that cell pressure increases in
plant cells in hypotonic solutions.]
Drag-drop interaction.
Correct responses will show all required
associations that modify the diagram as
intended.
Partial credit would be given for a subset of
correct responses.

Page 41
17 TEI 3 Given a diagram of a system in
homeostasis, decide on types of data,
how much data, and the accuracy of data
needed to produce reliable measurements
of how the system changes in response to
an environmental stimuli.
[Identify the type of data, how much
data, and the accuracy of data needed to
provide measurements to support the
claim that soil moisture must remain at a
minimum level for the plant to maintain
homeostasis.]
Drop-down interaction.
Include menus placed strategically on labels
of the diagram of the system in homeostasis,
such that at each point students decide one of
the three data dimensions (i.e., type, how
much, accuracy).
Menus should contain one example of each
data dimension (only one correct dimension)
plus 1-3 extraneous dimensions.
Correct responses will show all selections
correctly.
Partial credit would be given for a subset of
correct responses.
*Response options can make use of Student Misconceptions (examples of scientifically incorrect
assumptions) related to this performance expectation; references to misconceptions are listed in
the links below:
From http://assessment.aaas.org:
A given experiment can test for the effects of everything that is included in the study, whether these
variables are allowed to vary or are held constant.
A given experiment tests for the effects of ALL related variables, regardless of whether they are allowed
to vary or are held constant.
A given experiment tests for the effect of a variable that remains constant while other variables change.
It is not important to hold a variable constant in an experimental study if the purpose of the study is not to
find out the effect of that variable on the outcome of the study.
Air is distributed through the body in air tubes.
Molecules from food are distributed by way of special tubes, not by way of the circulatory system, to the
rest of the body.
Molecules from food enter the digestive tract and pass through the body without entering cells of the
body.
Air is breathed in and out of the body without being absorbed or used in any way.

Page 42
From Molecules to Organisms: Structure and Processes: HS-LS1-4 back to Item Specifications list
HS-LS1-4. Use a model to illustrate the role of cellular division (mitosis) and differentiation in producing
and maintaining complex organisms.
OASS Clarification Statement:
Emphasis is on conceptual understanding that mitosis passes on genetically identical materials via
replication, not on the details of each phase in mitosis.
OASS Assessment Boundary:
Assessment does not include specific gene control mechanisms or rote memorization of the steps of
mitosis.
Science & Engineering Practice:
Developing and Using Models
Use a model based on evidence
to illustrate the relationships
between systems or between
components of a system.
Disciplinary Core Idea:
LS1.B: Growth and Development
of Organisms
In multicellular organisms
individual cells grow and
then divide via a process
called mitosis, thereby
allowing the organism to
grow.
The organism begins as a
single cell (fertilized egg)
that divides successively to
produce many cells, with
each parent cell passing
identical genetic material
(two variants of each
chromosome pair) to both
daughter cells.
Cellular division and
differentiation produce and
maintain a complex
organism, composed of
systems of tissues and organs
that work together to meet the
needs of the whole organism.
Crosscutting Concept:
Systems and System Models
Models (e.g., physical,
mathematical, computer
models) can be used to
simulate systems and
interactions—including
energy, matter, and
information flows—
within and between
systems at different
scales.
In Lay Terms:
Students should be able to use models to illustrate that in multicellular organisms, individual cells divide
to form two identical cells. All multicellular organisms begin as a single cell, which undergoes this
process of dividing. Cells undergo mitosis in order to grow, repair, or replace injured or worn-out cells.

Page 43
Cluster Clarifications:
Relevant components in the models should include genetic material/chromosome pairs, parent
cells and daughter cells, and multicellular tissue/body representations.
Interactions and relationships that students need to describe and analyze in the model include (1)
daughter cells receive identical genetic information from the parent cell, making them genetically
identical, (2) differences between cell types within an organism are due to different genes being
turned on (differentiation), not different genetic material, and (3) the cell division/mitotic process
allows for growth, differentiation, tissue repair, and replacement of dead cells to produce and
maintain complex organisms.
In order to address the SEP and CCC, when students use a model, they interact with an already
complete model. Whereas when students develop and use a model, they are expected to construct
a model from evidence/data, complete a model or choose the best model to illustrate a given
concept in some items. A physical demonstration of a phenomenon is not a model as it does not
differ from the reality it represents (in materials, scale, etc.).
Cluster Stimulus Attributes:
Typical stimulus elements:
pictures/diagrams/models of beginning and ending of mitosis
text descriptions of the importance of a cell’s need to divide and the importance of identical DNA
being passed down
Possible contexts:
evaluating models that show why is it important for different tissues to produce identical cells
(with identical DNA)
evaluating/constructing models to observe how cancer cells and uncontrollable cell division occur
evaluating the genetic content of parent and daughter cells in mitosis
modeling the role of mitosis before and after cell differentiation
explaining how models illustrate the mitotic process or its products
Content and evidence to be included: information (descriptions and/or partial models) about cell division
(mitosis and differentiation)
Types of student responses that need to be supported: interpreting a provided model in order to identify
and describe the necessary process components and the interaction/ relationships among them that
accomplish growth, tissue repair, and cell replacement via mitosis and differentiation in organisms
Allowable Item Types:
MC
TEI

Page 44
Model Item Descriptions for HS-LS1-4:
# Item
Type DOK
Model Stem
(Items ask students to...) Response Characteristics*
1 MC 1 or 2 per
complexity
Use evidence from the model to explain
why cells divide through mitosis/the
purpose of the model.
[Which statement best explains the purpose
of cell mitosis in the diagram?]
[Why do cells undergo the process shown
in the model?]
Key may focus on one of the purposes of
cell division (mitosis) in multicellular
organisms (i.e., growth, repair, or
replacement of cells in organisms).
Distractors may include alternate cell
roles/functions in organisms or alternate
purposes of the process(es) illustrated in
the model, based on misconceptions of the
model and/or its components.
2 MC 2 Identify the impact of uncontrolled cell
division that is illustrated by a specific
component of the model.
[Which statement best describes the
importance of the process of cell cycle
regulation shown in the model?]
Distractors may include functional
descriptions of the components of the
model that do not play a role in cell cycle
regulation or that pertain to controlled
division of cells vs. uncontrolled division.
3 MC 2 Identify the key process shown in the
mitosis model.
[Which step in the model shows the
process by which organisms replace cells
that die?]
Key may focus on model steps/processes
relevant to producing genetically identical
daughter cells.
Distractors may include processes or steps
not related to or dependent upon mitotic
cell division.
4 MC 2 Describe the interactions among
components of the model related to
mitosis.
[Based on the information shown in the
model, which cell organelle must be
transferred exactly to achieve successful
mitosis?]
Key may focus on the exact numbers of
chromosomes or nuclear material.
Distractors may include organelles that are
important to cellular function but not to
genetic identity.
5 MC 2 Identify the best model to describe a
related phenomenon involving cellular
division, based on the initial model.
[Based on the students’ model, which
model demonstrates how a plant leaf cell
produces a new leaf cell?]
Key should focus on a model depicting
mitosis.
Distractors may include models that show
additional or insufficient steps/parts/
products.

Page 45
6 MC 2 or 3 per
model/
explanation
complexity
Select and explain the model that best fits a
set of observations or data illustrating
mitosis or cell differentiation.
[Which model of plant cells and its
explanation best illustrates the rapidly-
growing tips of the plant’s roots?]
Key may focus on cell morphological
changes with explanations related to
genetic similarity between parent and
daughter cells.
Distractors may include models and
explanations that do not represent cells
undergoing mitosis.
7 MC 3 Explain how a model demonstrates the
scale of the mitosis phenomenon.
[Which statement describes how the model
differs from the actual process of mitosis in
cells?]
Key may focus on the macroscopic nature
of the model compared to the microscopic
nature of the actual process or discuss
duplicity of the model in terms of
exponential factors on a diminutive scale.
Distractors may include statements related
to model components that are similar to the
actual process of mitosis.
8 MC 3 Relate the accuracy/validity of the mitosis
model to supporting evidence.
[Which evidence from the data table would
support the claim that the mitosis model is
accurate?]
Key may focus on the degree of support or
extent of the evidence that supports the
model claim about mitosis.
Distractors may include data that relate to
broader processes/relationships but do not
support the idea that daughter cells are
genetically identical to parent cells.
*Response options can make use of Student Misconceptions (examples of scientifically incorrect
assumptions) related to this performance expectation; references to misconceptions are listed in
the links below:
From http://assessment.aaas.org:
In the early development of an organism, cells that result from cell division do not grow before dividing
again.
Organisms grow by cell division, but cells do not themselves increase in size or mass.
In the early development of an organism, cells grow in size but the number of cells remains constant.
In the early development of an organism, the organism grows in size and mass without cell division or
cell growth.
Chromosomes are divided up at each cell division, such that when a single body cell forms two body
cells, the resulting cells each contain fewer chromosomes than the original cell.
Students may also believe the following:
All cell components are replicated during the process of mitosis.
Chromosomes separate in random groups during mitosis to produce daughter cells with varying numbers
of chromosomes.

Page 46
From Molecules to Organisms: Structure and Processes: HS-LS1-5 back to Item Specifications list
HS-LS1-5. Use a model to illustrate how photosynthesis transforms light energy into stored chemical
energy.
OASS Clarification Statement:
Emphasis is on illustrating inputs and outputs of matter and the transfer and transformation of energy in
photosynthesis by plants and other photosynthesizing organisms. Examples of models could include
diagrams, chemical equations, conceptual models, and/or laboratory investigations.
OASS Assessment Boundary:
The assessment should provide evidence of students’ abilities to describe the inputs and outputs of
photosynthesis, not the specific biochemical steps (e.g., photosystems, electron transport, and Calvin
cycle).
Science & Engineering Practice:
Developing and Using Models
Use a model based on evidence
to illustrate the relationships
between systems or between
components of a system.
Disciplinary Core Idea:
LS1.C: Organization for Matter
and Energy Flow in Organisms
The process of
photosynthesis converts light
energy to stored chemical
energy by converting carbon
dioxide plus water into sugars
plus released oxygen.
Crosscutting Concept:
Energy and Matter
Changes of energy and
matter in a system can
be described in terms of
energy and matter flows
into, out of, and within
that system.
In Lay Terms:
Students should be able to describe and interpret a model showing that photosynthesis uses sunlight,
carbon dioxide, and water to make oxygen and sugars. These sugars provide energy for living things.
Cluster Clarifications:
Relevant components in the models should include light energy, reaction/bond rearrangements
(absorbing/releasing energy), carbon dioxide, water, sugar, and oxygen.
Interactions and relationships that students need to describe and analyze in the model include (1)
input-output relationships (carbon dioxide and water produce sugar and oxygen), (2) energy is
transformed from light to chemical energy, (3) photosynthesis results in a storage of energy, and
(4) photosynthesis transfers matter and energy between the organism and environment.
In order to address the SEP, when students use a model, they interact with an already complete
model. Whereas when students develop and use a model, they are expected to construct a model
from evidence/data, complete a model or choose the best model to illustrate a given concept in
some items. A physical demonstration of a phenomenon is not a model as it does not differ from
the reality it represents (in materials, scale, etc.).

Page 47
Cluster Stimulus Attributes:
Typical stimulus elements:
model/picture/diagram/chemical equation of cellular level of photosynthesis (chloroplast) or an
entire producer in its habitat
text descriptions/chemical equations showing the inputs and outputs of photosynthesis
observed evidence/data (in text, tables, graphs) from investigations of photosynthesis, including
data tables evaluating the inputs’ effect on photosynthesis
Possible contexts:
study of vegetation native to Oklahoma or North America, emphasizing the overall process of
photosynthesis
evaluation of investigations that include different environmental conditions and their effect on the
outputs of photosynthesis
comparison, using evidence, of the different forms of energy found before and after
photosynthesis (solar energy vs. chemical energy)
computer simulations of the photosynthetic process
counting oxygen bubbles from Elodea leaves underwater and the glowing splint test
Content and evidence to be included: models of photosynthesis (transforming light energy into stored
chemical energy); amounts of inputs/outputs of photosynthesis (in models or as data to support models)
Types of student responses that need to be supported: describing and analyzing the components and
interactions in a model of photosynthesis in order to explain how photosynthesis transforms light energy
into stored chemical energy (i.e., inputs, outputs, and energy transformations)
Allowable Item Types:
MC
TEI

Page 48
Model Item Descriptions for HS-LS1-5:
# Item
Type DOK
Model Stem
(Items ask students to...) Response Characteristics*
1 MC 2 Determine how the outputs of
photosynthesis will be affected when
variables are changed.
[Which evidence shows that sunlight
intensity affects the rate of
photosynthesis?]
Key may focus on increases or decreases in
glucose or oxygen production.
Distractors may include controlled variables
or factors not relevant to the investigation.
2 MC 1 or 2 per
complexity
Identify/distinguish what model
components/data illustrate the form of
energy before (solar/radiant) or after
photosynthesis (chemical/stored
“sugar”).
[Based on the model, which statement
describes the form of energy stored in
plant leaves?]
Key may include sunlight transforming to
chemical/electrical (charged electrons)
and/or chemical potential energy buildup.
Distractors may include illustrations not
related to energy, energy forms not related
to photosynthesis, or transformations of
relevant energy forms outside the process of
photosynthesis.
3 MC 1 or 2 per
explanatory
analysis
Identify/explain how the model shows
the changes from input to output (from
before to after photosynthesis).
[Based on the model, which event
during the investigation is evidence that
photosynthesis occurred?]
Key may focus on reactants and/or products
of photosynthesis corresponding to the
given model.
Distractors may include non-participating
components, energy vs. physical
components, or components undergoing
processes outside of photosynthesis.
4 MC 2 Identify the impact of photosynthesis/
respiration on the carbon cycle that is
illustrated by a specific component of
the model.
[Which statement best describes the
importance of the process illustrated in
the model?]
Distractors may include functional
descriptions of the components of the
aerobic respiration process that are not high
in importance (per the specific cycle or
process).
Key may focus on the flow or forms of
carbon in the photosynthesis/respiration
paths.

Page 49
5 MC 1 or 2 per
relationship
complexity
Identify relationships between inputs
and outputs of the model.
[Based on the model, which statement
describes the relationship between
photosynthesis and carbon dioxide?]
[Based on the model, what can be
inferred about the relationship between
available sunlight and the amount of
glucose produced in algae?]
Key may focus on evidence of a particular
input/output component or on proportions
or totals of reactants and products.
Distractors may include statements
describing alternate relationships or
misconceptions about functions/ processes.
6 MC 2 Describe the interactions among
components of the model related to
energy transactions.
[Based on the information shown in the
model, how is oxygen related to energy
storage in plants?]
Key may focus on energy transactions or
conversions.
Distractors may include descriptions of
roles not related to the specified process/
function or interactions that occur but are
not involved directly in the process.
7 MC 2 or 3 per
model/
explanation
complexity
Select and explain the model that best
fits a set of observations or data about
photosynthesis.
[Which model of photosynthesis
reactions best fits the data from this
experiment, and why?]
Distractors may include models and
explanations that do not consider
conservation of matter.
8 MC 3 Explain how data support a particular
model of photosynthesis.
[Which statement describes how the
data collected in this investigation
support the model?]
Distractors may include statements related
to data that do not support the model or
model components unrelated to the data.
*Response options can make use of Student Misconceptions (examples of scientifically incorrect
assumptions) related to this performance expectation; references to misconceptions are listed in
the links below:
From http://assessment.aaas.org:
Substances in soil are food for plants.
Plants have multiple food sources, not just the sugars that they make from water and carbon dioxide.
Food enters a plant through the roots.
Plants make sugars from minerals.
Plants get organic food substances such as starch and sugar or protein from the soil.
Plants use oxygen [and produce carbon dioxide] during photosynthesis.

Page 50
From Molecules to Organisms: Structure and Processes: HS-LS1-6 back to Item Specifications list
HS-LS1-6. Construct and revise an explanation based on evidence for how carbon, hydrogen, and oxygen
from sugar molecules may combine with other elements to form amino acids and/or other large carbon-
based molecules.
OASS Clarification Statement:
Emphasis is on students constructing explanations for how sugar molecules are formed through
photosynthesis and the components of the reaction (i.e., carbon, hydrogen, oxygen). This hydrocarbon
backbone is used to make amino acids and other carbon-based molecules that can be assembled
(anabolism) into larger molecules (such as proteins or DNA).
OASS Assessment Boundary:
Assessment does not include the details of the specific chemical reactions or identification of
macromolecules.
Science & Engineering Practice:
Constructing Explanations and
Designing Solutions
Construct and revise an
explanation based on valid and
reliable evidence obtained from
a variety of sources (including
students’ own investigations,
models, theories, simulations,
peer review) and the assumption
that theories and laws that
describe the natural world
operate today as they did in the
past and will continue to do so in
the future.
Disciplinary Core Idea:
LS1.C: Organization for Matter
and Energy Flow in Organisms
The sugar molecules thus
formed contain carbon,
hydrogen, and oxygen: their
hydrocarbon backbones are
used to make amino acids and
other carbon-based molecules
that can be assembled into
larger molecules (such as
proteins or DNA), used for
example to form new cells.
As matter and energy flow
through different
organizational levels of living
systems, chemical elements
are recombined in different
ways to form different
products.
Crosscutting Concept:
Energy and Matter
Changes of energy and
matter in a system can
be described in terms of
energy and matter flows
into, out of, and within
that system.
In Lay Terms:
Students should be able to explain how molecules combine, break apart, and recombine to form necessary
compounds for life. These include sugars, amino acids, carbohydrates, and proteins. The process of
creating these compounds is done by plants and animals at a cellular level.
Cluster Clarifications: (none)

Page 51
Cluster Stimulus Attributes:
Typical stimulus elements:
models and diagrams
data tables and graphs
scientific reports or summaries
Possible contexts:
examples of biological products, food, digestion
investigations or models of how basic molecules are used to build more complex molecules and
cellular constituents (cell walls, membranes, organelles, etc.)
Content and evidence to be included: information to use as evidence of the relationship of carbon,
hydrogen, and oxygen in formation of essential cellular molecules
Types of student responses that need to be supported: constructing explanations, including analyzing the
evidence for the explanation
Allowable Item Types:
MC
TEI
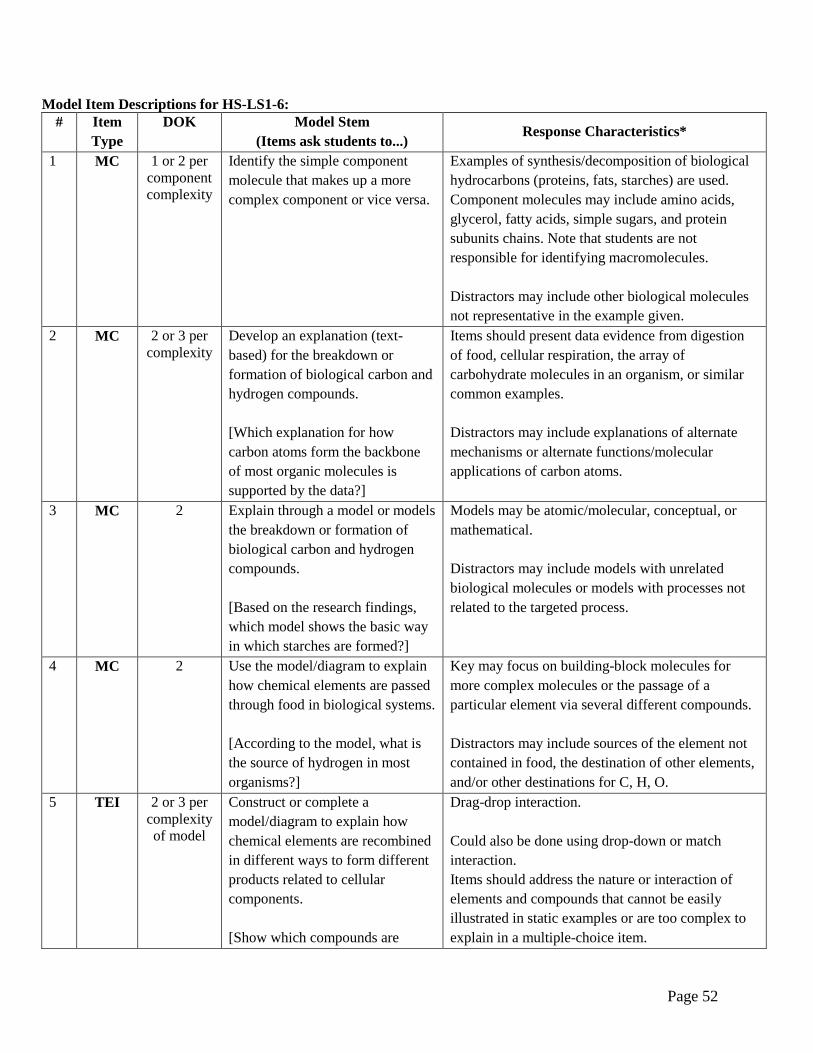
Page 52
Model Item Descriptions for HS-LS1-6:
# Item
Type
DOK Model Stem
(Items ask students to...) Response Characteristics*
1 MC 1 or 2 per
component
complexity
Identify the simple component
molecule that makes up a more
complex component or vice versa.
Examples of synthesis/decomposition of biological
hydrocarbons (proteins, fats, starches) are used.
Component molecules may include amino acids,
glycerol, fatty acids, simple sugars, and protein
subunits chains. Note that students are not
responsible for identifying macromolecules.
Distractors may include other biological molecules
not representative in the example given.
2 MC 2 or 3 per
complexity
Develop an explanation (text-
based) for the breakdown or
formation of biological carbon and
hydrogen compounds.
[Which explanation for how
carbon atoms form the backbone
of most organic molecules is
supported by the data?]
Items should present data evidence from digestion
of food, cellular respiration, the array of
carbohydrate molecules in an organism, or similar
common examples.
Distractors may include explanations of alternate
mechanisms or alternate functions/molecular
applications of carbon atoms.
3 MC 2 Explain through a model or models
the breakdown or formation of
biological carbon and hydrogen
compounds.
[Based on the research findings,
which model shows the basic way
in which starches are formed?]
Models may be atomic/molecular, conceptual, or
mathematical.
Distractors may include models with unrelated
biological molecules or models with processes not
related to the targeted process.
4 MC 2 Use the model/diagram to explain
how chemical elements are passed
through food in biological systems.
[According to the model, what is
the source of hydrogen in most
organisms?]
Key may focus on building-block molecules for
more complex molecules or the passage of a
particular element via several different compounds.
Distractors may include sources of the element not
contained in food, the destination of other elements,
and/or other destinations for C, H, O.
5 TEI 2 or 3 per
complexity
of model
Construct or complete a
model/diagram to explain how
chemical elements are recombined
in different ways to form different
products related to cellular
components.
[Show which compounds are
Drag-drop interaction.
Could also be done using drop-down or match
interaction.
Items should address the nature or interaction of
elements and compounds that cannot be easily
illustrated in static examples or are too complex to
explain in a multiple-choice item.

Page 53
produced in each step of the
digestive process (by dragging the
elements and/or compounds into
the product areas).]
Correct responses show all products requested.
Partial credit would be awarded for a subset of
correct responses.
6 MC 1 or 2 per
complexity
of
relationship
Describe or explain relationships
(cause-effect, or other) in the
synthesis or decomposition of C-
H-O compounds.
[Which statement explains the
relationship between carbon
dioxide and starch molecules?]
Key may focus on processes or steps in the cause-
effect chain of events.
Distractors may include statements that do not
sufficiently explain, statements that explain alternate
phenomena, or statements lacking critical
conceptual connections.
7 MC 2 or 3 per
depth of
analysis
Develop an explanation for a real-
world/macro observation or
phenomenon based on the
evidence.
[Which statement best explains
why the starchy cracker tasted
sweet after 10 minutes?]
Key may focus on explanation of the macro
observation or phenomenon based on interpreting
the molecule synthesis or breakdown occurring.
Distractors include statements explaining reasoning
for other outcomes or erroneous explanations for the
observation or phenomenon.
8 MC 2 Identify/use evidence to support an
explanation of relationships among
components of a C-H-O driven
system.
[What evidence supports the
students’ explanation for how
energy is related to food
molecules?]
Key may include evidence such as production of
carbon dioxide gas, calorimeter data, proportions of
complex vs. simple molecules in organisms, etc.
Distractors may include data that do not provide
sufficient/valid evidence or data related to other
cellular/genetic processes.
9 MC 2 or 3 per
complexity
Connect reasoning to the evidence
for the origin or production of C-
H-O compounds in biological
systems (i.e., how the data support
the particular explanation).
[Which statement best describes
the reason high levels of CO2 gas
are produced by yeasts in bread
dough?]
Key may focus on a biological process or product
that illustrates the flow of carbon through or
between organisms.
Distractors may include statements including
invalid/unsupported reasoning or reasoning for
alternate phenomena, incorrect data interpretations,
and/or misconceptions.

Page 54
10 MC 2 or 3 per
complexity
Provide evidence-based
clarification/additional data to
improve an explanation of a C-H-
O process.
[Based on the evidence, which
additional statement/clarification
will best improve the explanation
for the transfer of carbon in the
plant?]
Distractors may include information/data/trivial
statements that do not provide an improved
explanation.
11 TEI 2 Build an explanatory model/flow
chart to explain how C, H, or O
moves into and through a cell.
[Put the process steps in order to
show how oxygen moves through
cells.]
Drag-drop interaction to reorder.
May present item with 4-6 descriptions of
processes/compounds as options to order/drag.
Students may have to order options given, or choose
which options to place into a partially completed
sequence provided.
Correct responses show an accurate sequence,
completed as required.
Partial credit would be given for a subset of correct
responses/sequencing.
*Response options can make use of Student Misconceptions (examples of scientifically incorrect
assumptions) related to this performance expectation; references to misconceptions are listed in
the links below:
From http://assessment.aaas.org:
Food is a source of energy but not a source of building materials.
Food is a source of building materials, but not a source of energy.
Food is any material (water, air, minerals, etc.) that organisms take in from their environment.
Oxygen supplies energy for animals.
Plants get organic food substances such as starch and sugar from the soil.
Plants make sugar from minerals or minerals and water.
Carbon dioxide is food for plants.
Water is food for plants.
Plants use oxygen during photosynthesis.

Page 55
From Molecules to Organisms: Structure and Processes: HS-LS1-7 back to Item Specifications list
HS-LS1-7. Use a model to illustrate that cellular respiration is a chemical process whereby the bonds of food
molecules and oxygen molecules are broken and the bonds in new compounds are formed resulting in a net
transfer of energy.
OASS Clarification Statement:
Emphasis is on the conceptual understanding of the inputs and outputs of the process of cellular respiration.
Examples of models could include diagrams, chemical equations, conceptual models, and/or laboratory
investigations.
OASS Assessment Boundary:
Assessment should not include identification of the steps or specific processes involved in cellular respiration
(e.g., glycolysis and Kreb’s Cycle).
Science & Engineering
Practice:
Developing and Using Models
Use a model based on
evidence to illustrate the
relationships between
systems or between
components of a system.
Disciplinary Core Idea:
LS1.C: Organization for Matter and Energy
Flow in Organisms
As matter and energy flow through
different organizational levels of living
systems, chemical elements are
recombined in different ways to form
different products.
As a result of these chemical reactions,
energy is transferred from one system
of interacting molecules to another.
Cellular respiration is a chemical
process in which the bonds of food
molecules and oxygen molecules are
broken and new compounds are formed
that can transport energy to muscles.
Cellular respiration also releases the
energy needed to maintain body
temperature despite ongoing energy
transfer to the surrounding
environment.
Crosscutting Concept:
Energy and Matter
Energy cannot be created or
destroyed—it only moves
between one place and
another place, between
objects and/or fields, or
between systems.
In Lay Terms:
Students should be able to analyze and explain models illustrating the process of cellular respiration (making
energy from sugar in plants and animals) as a process that provides energy for life on Earth.
Cluster Clarifications:
To address the CCC, stimuli and items should focus on how/why energy is stored, transferred, or
released with respect to cellular respiration.

Page 56
Relevant components in the models should include food molecules (sugars), oxygen, water, carbon
dioxide, reaction/bond rearrangements, and energy.
Interactions and relationships that students need to describe and analyze include (1) sugar and oxygen
produce carbon dioxide and water in cellular respiration, (2) cellular respiration releases energy (due to
bond energies/bond rearrangement), (3) matter and energy are conserved during cellular respiration
(bonds break and new bonds form and energy is released, but matter and energy are neither created nor
destroyed), and (4) body cells can use energy from cellular respiration to sustain life processes.
Note that conservation of matter is a critical component of this PE and must be addressed in the cluster.
In order to address the SEP, when students use a model, they interact with an already complete model.
Whereas when students develop and use a model, they are expected to construct a model from
evidence/data, complete a model or choose the best model to illustrate a given concept in some items. A
physical demonstration of a phenomenon is not a model as it does not differ from the reality it represents
(in materials, scale, etc.).
Cluster Stimulus Attributes:
Typical stimulus elements:
models/pictures/diagrams/chemical equations of cellular respiration (mitochondria) or an entire
producer/consumer in its habitat
text descriptions/chemical equations showing the inputs and outputs of cellular respiration
diagrams of experimental setups and results/data from investigations involving cellular respiration
Possible contexts:
investigations that include different environmental conditions and their effect on the outputs of cellular
respiration
evaluations of simulations/models/diagrams providing an explanation from evidence for the different
forms of energy found before and after cellular respiration [chemical energy (glucose) vs. chemical
energy (ATP)]
text/diagram examples of the role of cellular respiration in maintaining body temperature despite
surrounding environment
investigations demonstrating the respiration process
Content and evidence to be included: experimental results/observations containing simulations, illustrations,
model components or inputs/outputs, along with text describing processes or results
Types of student responses that need to be supported: describing or analyzing the components and relationships
of a model that illustrates the chemical process of cellular respiration, with emphasis on the breaking and
formation of chemical bonds resulting in a release of energy and formation of new molecules as atoms are
rearranged
Allowable Item Types:
MC
TEI

Page 57
Model Item Descriptions for HS-LS1-7:
# Item
Type DOK
Model Stem
(Items ask students to...) Response Characteristics*
1 MC 1 or 2 per
complexity
Evaluate a model of respiration to
identify/describe the inputs/outputs of
cellular respiration in terms of their
energy roles.
[According to the model, which
component stores chemical energy for
release during cellular respiration?]
Key may focus on sugar as the source of
chemical energy, oxygen/sugar as the molecule
that reacts to release energy, or carbon
dioxide/water as the product of energy release.
Distractors may include model components
unrelated to the transfer of energy or energy-
storing processes not included in the model.
2 MC 2 Determine from the model how the
outputs of cellular respiration will be
affected when respiration variables are
changed.
[Based on the model, how will a low-
oxygen environment affect energy
production in cells?]
Key may focus on the contrast between aerobic
and anaerobic processes, differentiation of total
ATP produced, or output evidence indicating a
significant difference in energy consumed in
aerobic versus anaerobic conditions.
Distractors may include misconceptions about
the sources of energy, how energy is converted
during respiration, or the process by which
respiration occurs in a low-oxygen
environment.
3 MC 1 or 2 per
degree of
analysis
Infer from the model the form of energy
before (stored) or after cellular
respiration (released).
[Based on the model, which statement
best describes the energy produced
during respiration?]
Options may require students to differentiate
compounds or forms/amounts of energy
associated with the stage indicated.
4 MC 3 Explain how a (given) respiration model
supports or fits
observations/experimental results, or
vice versa.
[Which explanation for the results of the
(respiration) experiment is best
supported by the model and why?]
[How do observations of the different
forms of gas before and after cellular
respiration provide evidence for the
model of respiration the students
created?]
Explanatory statements may include
inputs/outputs or component comparisons and
reasoning based on energy transformation(s).
Distractors may include plausible explanations
that do not directly provide evidence for
respiration.

Page 58
5 MC 2 Analyze the model to identify the impact
of cellular respiration on the availability
of energy.
[Which statement best describes how a
decrease in the amount of available food
affects the amount of energy available to
an organism?]
Distractors may include functional descriptions of
the components of the aerobic respiration process
that are not high in importance (per the specific
cycle or process).
6 MC 1 or 2 per
complexity
Describe the purpose of a respiration
model.
[Which statement best describes why this
model is important to understanding how
organisms function?]
Key may focus on how respiration supplies
energy needed by organisms or why energy is
needed or used by organisms.
Distractors may include
misinterpretations/misconceptions of the model
and/or its components.
7 MC 1 or 2 per
relationship
complexity
Identify relationships between inputs and
outputs of a respiration model.
[Based on the model, which statement
describes the relationship between
respiration and carbon dioxide?]
[Which inference about the relationship
between glucose and energy is supported
by the model?]
Key may focus on component and energy
relationships.
Distractors may include statements describing
alternate relationships or misconceptions about
functions/processes.
8 MC 2 Describe the interactions among
components of the model related to
energy transactions.
[Based on the model, how is the amount
of glucose related to oxygen
consumption in the two examples?]
Distractors may include descriptions of roles not
related to the specified process/function or
interactions that occur but are not involved
directly in the process.
9 MC 2 or 3 per
model/
explanation
complexity
Select and explain the model that best
fits a set of observations or data.
[Which model of carbon atom
transformations and its explanation best
fit the data from this experiment?]
Distractors may include models and explanations
that do not appropriately address respiration
molecules and processes.
10 MC 3 Relate a model to supporting evidence.
[Which evidence from the data table
would support the claim that the
respiration model is accurate?]
Key may focus on energy evidence or component
evidence that supports energy transformations.
Distractors may include data that relate to broader
respiration processes/ relationships but do not
support the claim of accuracy.

Page 59
*Response options can make use of Student Misconceptions (examples of scientifically incorrect
assumptions) related to this performance expectation; references to misconceptions are listed in
the links below:
From http://assessment.aaas.org:
Animals cannot store molecules from food in their bodies.
Molecules from food are not stored in the fat tissue of animals.
Plants cannot store molecules from food in their body structures.
Carbon dioxide is food for plants.
Food is a source of building materials, but not a source of energy.
Food is any material (water, air, minerals, etc.) that organisms take in from their environment.
Oxygen supplies energy for animals.
Energy can be created.
Energy can be destroyed.
One form of energy cannot be transformed into another form of energy (e.g., chemical energy cannot be
converted to kinetic energy).
Energy cannot be transferred from one object to another.

Page 60
Ecosystems: Interactions, Energy, and Dynamics: HS-LS2-1 back to Item Specifications list
HS-LS2-1. Use mathematical and/or computational representations to support explanations of factors that
affect carrying capacity of ecosystems at different scales.
OASS Clarification Statement:
Emphasis is on quantitative analysis and comparison of the relationships among interdependent factors
including boundaries, resources, climate and competition. Examples of mathematical comparisons could
include graphs, charts, histograms, or population changes gathered from simulations or historical data
sets.
OASS Assessment Boundary:
Assessment does not include deriving mathematical equations to make comparisons.
Science & Engineering Practice:
Using Mathematics and
Computational Thinking
Use mathematical OR
computational representations of
phenomena or design solutions
to support explanations.
Disciplinary Core Idea:
LS2.A: Interdependent
Relationships in Ecosystems
Ecosystems have carrying
capacities, which are limits to
the numbers of organisms and
populations they can support.
These limits result from such
factors as the availability of
living and nonliving
resources and from
challenges such as predation,
competition, and disease.
Organisms would have the
capacity to produce
populations of great size were
it not for the fact that
environments and resources
are finite. This fundamental
tension affects the abundance
(number of individuals) of
species in any given
ecosystem.
Crosscutting Concept:
Scale, Proportion, and
Quantity
The significance of a
phenomenon is
dependent on the scale,
proportion, and quantity
at which it occurs.
In Lay Terms:
Students should be able to use numerical data, charts, and graphs to draw conclusions about the influence
of various living and non-living factors on population sizes and the ability of ecosystems to support
sustainable populations.

Page 61
Cluster Clarifications:
Examples of ecosystems and organisms outside of Oklahoma can be utilized, but their definitive
characteristics should be clearly explained.
Food webs, energy pyramids, and biomass pyramids are considered mathematical expressions.
Carrying capacity is a characteristic of habitats/ecosystems and not of a species.
K may be defined as carrying capacity.
Population graph shapes may be described with the terms J-shaped, S-shaped, exponential, and
logistic.
Graphs should not be dual-axis graphs; use two separate graphs instead.
Cluster Stimulus Attributes:
Typical stimulus elements:
graphs, histograms, charts/tables
descriptions of simulations and the quantitative data generated
other mathematical representations of relationships, populations, or resources changes provided
in given examples or data sets
Possible contexts:
real-world research revealing trends, averages, and data that are relevant to carrying capacity and
population dynamics in a given environment
graphical comparisons of historical population-related data for a species or group of interrelated
species in the context of limiting resources
graphical or textual representations of predator/prey, mutualistic, parasitic, or commensal
relationships
student or scientific claims of what can limit population size or how populations are affected
given data or observations in specific examples
Content and evidence to be included: mathematical data about population sizes, including data or text
about factors affecting the ecosystem’s ability to sustain those populations
Types of student responses that need to be supported: describing conclusions about what the
mathematical data show about populations/carrying capacity, with the conclusions related to what/how
factors affect the carrying capacity
Allowable Item Types:
MC
TE

Page 62
Model Item Descriptions for HS-LS2-1:
# Item
Type DOK
Model Stem
(Items ask students to...) Response Characteristics*
1 MC 1 or 2 per
level of
analysis
Select the graphical representation for
population size, growth, or capacity
based on the data provided.
[Which graph best represents the type of
growth experienced by the producer
population?]
Key may focus on logistic vs. exponential
growth or trend differences.
Distractors may include graphs depicting other
population growth trends.
2 MC 2 State conclusions about population
growth, reproductive rate, survival rate,
etc. based on the graphs/data provided.
[Which statement about the reproduction
rate of bacteria compared to the
reproduction rate of sharks is supported
by the population data?]
Key may focus on trends or patterns in
population curves/comparisons.
Distractors may include unrelated or
unsupported statements.
3 MC 2 Select the graph that shows the
correct relationship between the
dependent and independent variable
based on the provided population and
environmental data.
[Which graph shows how the two
pollinator insect populations will most
likely respond to a drought that reduces
the populations of flowering plants?]
Key should focus on the graph that correctly
displays the relationship between independent
and dependent variables.
Distractors may include graphs depicting
inaccurate/incorrect population response curves.
4 MC 2 or 3 per
complexity
Analyze environmental factors and a
population change data to evaluate how
the data do or do not support the given
explanation for the change.
[Which statement best describes how the
data relate to the student’s claim about
the population change?]
[How do the data on the limiting factors
in the pond ecosystem support the
student’s explanation of the changes in
bluegill population density?]
Key should focus on the data and reasoning
about the causative factors limiting the
population, as indicated in the explanation.
Distractors may include explanations of factors
that are not limiting or limiting factors that are
not supporting.

Page 63
5 MC 2 Identify data to support explanations of
birth, death, immigration, emigration,
disease, competition, predation, etc. as
causative factors in determining carrying
capacity.
[What data support the explanation of
disease as a causative factor in the
declining pinion pine tree population?]
Key may focus on a clear relationship between
one of the causative factors and a responding
trend in the population.
Distractors may include data/factors of lesser or
no impact on the population.
6 MC 3 Compare the relative degree of influence
on a population of several causative
factors to determine which explanation is
best supported.
[Based on the data, which statement best
describes how weather factors most
impacted the change in deer population?]
Key may focus on a dominant determining
factor or a factor that has a direct rather than
indirect impact on the population.
Distractors may include statements about factors
that are subordinate to a main factor or that
incorrectly describe impacts of factors.
7 MC 2 Make predictions about carrying capacity
and/or population change using the math
representation.
[Which prediction about the effect of
temperature on the coral population is
supported by the data?]
Distractors may include cause-and-effect
statements that are not supported by
the data.
8 MC 2 or 3 per
complexity
Using data, determine which explanation
most accurately compares the impact of a
factor observed on a micro scale to the
same factor observed on a macro scale
(on populations of the same species in
the same ecosystem).
Key should focus on the differential effects
shown in or inferred from the data.
Distractors may include explanations of impacts
that are not related to the macro vs. micro scale
difference or not related to the factor.
9 TEI 2 Using the data, match explanations about
population size to relevant factors.
[Match each of the factors affecting the
coral reef to the correct explanation of
that factor’s effect on the reef food web.]
Match interaction.
Interaction direction text should specify whether
all choices will be matched.
Correct responses show all correct associations
between the factors and the explanations.
Partial credit would be awarded for a subset of
correct responses.

Page 64
10 TEI 3 Determine whether population
size/carrying capacity explanations are
supported or unsupported by the data for
a population trend shown in the graph.
[Select all the explanations about
population size effects that are supported
by the data in the graph.]
Interaction type may be drag-drop (sorting
which explanations are supported) or drop-down
(menus for evaluating each explanation).
Explanations to evaluate may include statements
that do not adequately explain the trend,
statements that explain trends not shown, or
statements that explain effects not observed.
Correct response shows the multiple
explanations that are supported by the data.
Partial credit would be awarded for a subset of
correct responses.
*Response options can make use of Student Misconceptions (examples of scientifically incorrect
assumptions) related to this performance expectation; references to misconceptions are listed in
the links below:
From http://assessment.aaas.org:
Organisms higher in a food web eat everything that is lower in the food web.
Populations exist in states of either constant growth or decline.
Competition between organisms always involves direct, aggressive interaction (i.e., physical encounters
for resources).
Organisms of the same species do not compete with each other for resources.
Different kinds of organisms (species) do not compete for resources.
Plants do not compete for resources, space or light; animals do not compete for resources, shelter, or
water.
Students may also believe the following:
All populations exist in an unchanging steady state unless disturbed.
Organisms can have only one role in an ecosystem.

Page 65
Ecosystems: Interactions, Energy, and Dynamics: HS-LS2-2 back to Item Specifications list
HS-LS2-2. Use mathematical representations to support and revise explanations based on evidence about
factors affecting biodiversity and populations in ecosystems of different scales.
OASS Clarification Statement:
Examples of mathematical representations include finding the average, determining trends, and using graphical
comparisons of multiple sets of data.
OASS Assessment Boundary:
Assessment is limited to the provided data.
Science & Engineering
Practice:
Using Mathematics and
Computational Thinking
Use mathematical
representations of
phenomena or
design solutions to
support and revise
explanations.
Disciplinary Core Idea:
LS2.A: Interdependent Relationships in Ecosystems
Ecosystems have carrying capacities, which are
limits to the numbers of organisms and
populations they can support. These limits result
from such factors as the availability of living and
nonliving resources and from challenges such as
predation, competition, and disease.
Organisms would have the capacity to produce
populations of great size were it not for the fact
that environments and resources are finite. This
fundamental tension affects the abundance
(number of individuals) of species in any given
ecosystem.
LS2.C: Ecosystem Dynamics, Functioning, and
Resilience
A complex set of interactions within an
ecosystem can keep its numbers and types of
organisms relatively constant over long periods
of time under stable conditions.
If a modest biological or physical disturbance to
an ecosystem occurs, it may return to its more or
less original status (i.e., the ecosystem is
resilient), as opposed to becoming a very
different ecosystem.
Extreme fluctuations in conditions or the size of
any population, however, can challenge the
functioning of ecosystems in terms of resources
and habitat availability.
Crosscutting Concept:
Scale, Proportion, and
Quantity
Using the concept of
orders of magnitude
allows one to
understand how a
model at one scale
relates to a model at
another scale.

Page 66
In Lay Terms:
Students should be able to use numerical data and graphic information to draw conclusions about how various
living and non-living factors (resource availability, predators, disease, etc.) affect the numbers and types of
organisms in ecosystems over time. The numbers and types of organisms may remain fairly constant when
resources and conditions follow normal patterns, but they may change when the normal patterns are disturbed.
Students should be able to compare ecosystems of different scales as well as interactions within one ecosystem.
Cluster Clarifications:
Graphical comparisons may include diagrams with numerical values or classic energy/food/biomass
models conveying accurate scale and proportion.
A cluster can include interactions within one ecosystem or interactions between ecosystems of different
scales, but not both in the same cluster.
Cluster Stimulus Attributes:
Typical stimulus elements:
graphs, charts, tables
diagrams (energy/food/biomass models providing scale/proportion)
other mathematical representations of population data per unit of area in an ecosystem
text information about conditions/factors for which data have been provided
Possible contexts:
research studies with mathematical representations showing trends, averages, and data about one or
more factors affecting an ecosystem (e.g., average Arctic seal pup survival compared to average air
temperatures)
numerical population relationship data that indicate changes in the numbers and types of organisms
over time and at different scales (e.g., North American bison population estimates from 1800 to
present)
research explanations based on mathematical models/analyses addressing the response of ecosystems to
both small-scale and large-scale changes (e.g., a summary of scientific studies concerning the response
of short-grass prairie habitats to farming and ranching practices)
mathematical representations demonstrating varying scales of ecosystems in the same geographic
region (e.g., distribution of oak-hickory forest in central Oklahoma)
mathematical representations illustrating interactions between ecosystems at different scales (e.g., how
competition affects pond versus large lake reproductive rate of two freshwater snail species)
mathematical representations of how changes at one scale level can effect multiple other scale levels
(e.g., effects of large-scale intensive cattle grazing on the abundance of a rare stream fish species
inhabiting only streams of a certain size and temperature)
scientific/student claims of what limits population size based on mathematical representations or their
derivatives (e.g., claims made based on a model simulating the effects of changes in two limiting
factors of a bird species population)
mathematical representations of both modest and extreme environmental changes and their effect on
existing populations (e.g., effects of different patterns of periodic fire on the distribution of two woody
plant species)

Page 67
Content and evidence to be included: numerical data and graphs as evidence to support explanations about the
relationship between environmental factors and biodiversity and stability of ecosystems
Types of student responses that need to be supported: describing, inferring, and making conclusions in regards
to what the mathematical data show about how various factors influence biodiversity and stability of an
ecosystem; revising explanations using data
Allowable Item Types:
MC
TEI

Page 68
Model Item Descriptions for HS-LS2-2:
# Item
Type DOK
Model Stem
(Items ask students to...) Response Characteristics*
1 MC 2 Determine which explanation for how
variation of a limiting factor can adversely
affect or benefit an existing or introduced
population (biodiversity) is supported by the
mathematical data.
Key should focus on the adverse or beneficial
aspect of the factor shown in the data.
Distractors may include explanations
unsupported by the data or explanations that
do not relate limiting factors in an appropriate
way to the population response.
2 MC 2 or 3 per
the data
and
explanation
complexity
Identify appropriate revision of an
explanation supported by averages of
population growth and/or trends in growth.
[Which revised explanation would best
account for the most recent population
census of alligators in the park?]
Key may focus on a revision that adds detail,
clarity, or additional data support to the
explanation.
Distractors may include explanations that
detract from or reduce the value of the given
explanation or explanations that add
information but do not logically account for
all of the referred-to data.
3 MC 3 Revise an explanation based on
new/additional data for a causative
relationship between a factor (predation,
competition, disease, drought, flood,
climatic shift, etc.) and the diversity or
stability of an ecosystem.
[Based on the second study’s data, which
revised explanation for the effect of
decreased farming on the distribution of
antelope is better supported?]
Distractors may include explanations of
relationships irrelevant to the causative
factor(s).
4 MC 2 or 3 per
data
complexity
Select applicable age structure diagrams,
population size graphs, extrapolations of
future growth, etc. that display the
numerical data.
[Which graph best represents how the three
species of sunfish respond to muddy water?]
Key may focus on direct or inferred
relationships extending from the numerical
evidence.
Distractors may include diagrams or displays
with inaccurate or unsupported characteristics
(including common misconceptions).
5 MC 1 or 2 per
extent of
data or
depth of
explanation
Identify the data/evidence from the
mathematical representation that supports
an explanation for the impact of various
conditions or factors (e.g., weather, disaster,
competition, disease) on the number/variety
of species in an ecosystem.
Key may focus on data that support a direct or
inferred relationship between the relevant
factor and ecosystem diversity.
Distractors may include unsupported or
incomplete explanations, explanations related
to other factors, or explanations that impact

Page 69
[Which evidence supports the scientists’
conclusion about the effect of chronic
wasting disease on mule deer populations in
the Rocky Mountains?]
ecosystem characteristics other than diversity
of species.
6 MC 2 or 3 per
complexity
Determine how/why the data in the
mathematical representation support/do not
support a given explanation for biodiversity
or ecosystem change.
[Which statement best describes how the
data for moth and tree populations in the
Ouachita Mountains relate to the students’
explanation of how species diversity has
changed in this ecosystem?]
Key should provide reasoning for how the
data connects to the explanation. Key may
focus on numerical evidence for the
explanation.
Distractors may include represented elements
that do not support the explanation, invalid
reasoning, or factors not included in the
representation.
7 MC 2 Identify the explanation for the impact of
various conditions or factors (e.g., weather,
disaster, competition, disease) on ecosystem
stability that is supported by the
mathematical data.
[Which conclusion about the condition of
the pond ecosystem before and after
introduction of grass carp is supported by
the data?]
Distractors may include explanations focused
on data elements that do not support the
premise/conclusion, explanations related to
factors that are constant or unmeasured, or
factors that affect ecosystem characteristics
unrelated to stability.
8 MC 2 Compare how two or more local
populations at different scales are
differentially affected by a factor in the
ecosystem.
[Which statement about how predation
affects the tomato horn worms in individual
gardens versus wild prairie habitats is
supported by the population data?]
Key may focus on trends or significant
differences in populations at distinctly
different ecosystem scales.
Distractors may include invalid statements
related to the population or general statements
derived from misconceptions.
9 MC 2 Use the data to explain how the same
causative factor (drought, fire, invasive
predation/vegetation, disease, etc.)
differentially impacts ecosystem stability in
two different ecosystems.
[Which explanation for the way drought
impacts forest versus prairie ecosystems is
supported by the population data?]
Key may focus on clear differences between
the two ecosystems in populations, available
resources, or distribution of species due to the
causative factor.
Distractors may include explanations
involving ecosystem differences unrelated to
the causative factor or explanations involving
unmeasured/unrelated factors.

Page 70
10 MC 1 or 2 per
complexity
State conclusions from the graph/data that
reflect the relationship between variables
related to biodiversity or stability.
Key may focus on direct or inferred
relationships.
Distractors may include misconceptions or
misinterpretation of the data.
11 MC 1 or 2 per
claim
complexity
Recognize or describe the mathematical
pattern in the data that indicates what
relationship exists or what change is taking
place in the ecosystem.
[Based on the data, what is the relationship
between the dependent and independent
variables studied in this ecosystem?]
[How does the graph show the way in which
the fish populations are related?]
[What pattern in the graphs demonstrates
the different effect of herbicides on the
species in the pond versus in the river
drainage?]
Distractors may include expressions of a
numeric or quantitative scale that do not
correspond with the relevant ecosystem
change.
12 MC 2 Make or justify predictions about the
changes in organism numbers or the relative
size/degree of ecosystem change expected
using the math representation.
[Which data support the students’ prediction
about the river ecosystem’s stability after
1990?]
Predictions may be plausible outcome
statements regarding general ecosystem
diversity/stability or inferred responses of the
dependent variable.
Distractors may include cause-and-effect
statements relating irrelevant variables or
predicted results that are not supported by the
data.
13 TEI 2 Select appropriate explanations of impact
points on population graphs to indicate the
relationships between causative factors and
ecosystem stability.
[Select the explanation that best fits each
indicated point on the population graphs.]
Interaction type may be drop-down or hot-
spot depending on selection requirements.
May give cause and effect options.
Relationships are inferred from food web and
species distribution data in the stimulus.
Correct responses show/select all correct
explanations as required.
Partial credit would be awarded for a subset
of correct responses.

Page 71
*Response options can make use of Student Misconceptions (examples of scientifically incorrect
assumptions) related to this performance expectation; references to misconceptions are listed in
the links below:
From http://assessment.aaas.org:
Populations exist in states of either constant growth or decline.
Competition between organisms always involves direct, aggressive interaction. Exploitative competition
(e.g., getting to the resource before other organisms) is not competition.
Organisms of the same species do not compete for resources.
Different kinds of organisms (species) do not compete for resources.
Plants do not compete for resources, space or light; animals do not compete for resources, shelter, or
water.
Plants and animals do not compete (with each other) for space or water.
If a population in a food web is disturbed, there will be little or no effect on populations that are not
within the linear sequence in the food web (e.g., no effect on populations below it in the food web, such
as if a predator is removed, there will be no effect on prey).
Organisms higher in a food web eat everything that is lower in the food web.
If the size of one population in a food web is altered, all other populations in the web will be altered in
the same way.
A change in the size of a prey population has no effect on its predator population.
Changes in a population in a food web do not affect the populations of any other organism in the
food web.
The top predator in a food web will never be significantly affected by changes in the populations of
organisms below it in the food web.
From http://www.binghamton.edu/ecomisconceptions/ecological-misconceptions:
Varying the population size of species will only affect the others that are directly connected through a
food chain.
Students may also believe the following:
Organisms can have only one role in an ecosystem.
Populations exist in constant states that neither grow nor decline.
Diversity is the variation of traits in a population.
Variation is the number and distribution of species in a community.

Page 72
Ecosystems: Interactions, Energy, and Dynamics: HS-LS2-3 back to Item Specifications list
HS-LS2-3. Construct and revise an explanation based on evidence for the cycling of matter and flow of
energy in aerobic and anaerobic conditions.
OASS Clarification Statement:
Emphasis is on conceptual understanding of the role of aerobic and anaerobic respiration in different
environments (e.g., chemosynthetic bacteria, yeast, and muscle cells).
OASS Assessment Boundary:
Assessment does not include the specific chemical processes of either aerobic or anaerobic respiration.
Science & Engineering Practice:
Constructing Explanations and
Designing Solutions
Construct and revise an
explanation based on valid and
reliable evidence obtained from
a variety of sources (including
students’ own investigations,
models, theories, simulations,
peer review) and the assumption
that theories and laws that
describe the natural world
operate today as they did in the
past and will continue to do so in
the future.
Disciplinary Core Idea:
LS2.B: Cycles of Matter and
Energy Transfer in Ecosystems
Photosynthesis and cellular
respiration (including
anaerobic processes) provide
most of the energy for life
processes.
Crosscutting Concept:
Energy and Matter
Energy drives the
cycling of matter within
and between systems.
In Lay Terms:
Students should be able to use evidence to explain how cellular respiration (both aerobic and anaerobic)
provides most of the energy for life processes. This energy drives the transportation of matter within and
between biological systems.
Cluster Clarifications: (none)

Page 73
Cluster Stimulus Attributes:
Typical stimulus elements:
models of relationships between cellular respiration, available energy, and/or cycling of matter
investigation results related to cellular respiration and matter/energy flow
Possible contexts:
student-generated or referenced models that demonstrate how cycling of matter and/or flow of
energy and the drivers of these processes
research evidence that demonstrates examples of differential energy production in various
conditions (aerobic and anaerobic)
investigations that include manipulation of variables in aerobic or anaerobic conditions to
measure energy and matter inputs/outputs
Content and evidence to be included: models, diagram, and/or experimental data that can be used as
evidence for how energy flows and matter cycles in various conditions
Types of student responses that need to be supported: constructing explanations of matter cycling and
energy flow using data and models, as well as describing evidence and reasoning to support or evaluate
explanations
Allowable Item Types:
MC
TEI

Page 74
Model Item Descriptions for HS-LS2-3:
# Item
Type DOK
Model Stem
(Items ask students to...) Response Characteristics*
1 MC 2 Determine which explanation for how
cellular respiration impacts the flow of
energy in organisms or ecosystems is
supported/not supported by the data.
[Based on the experimental data, which
is the best explanation of the energy
produced during cellular respiration?]
Key may focus on conversion of chemical
energy in glucose into forms used for life
functions as shown by the data.
Distractors may include explanations of energy
flow unrelated to respiration, descriptions of
chemical/physical changes rather than energy
flow, or respiration effects in other organisms or
ecosystems.
2 MC 2 Determine which explanation for how
cellular respiration impacts the cycling
of matter in organisms or ecosystems is
supported/not supported by the data.
[Which statement best explains the
connection between carbon flow in the
prairie ecosystem and the process of
cellular respiration?]
Key may focus on C-H-O reactions (without
being too specific, per assessment boundary)
and molecular exchanges.
Distractors may include inaccurate or unrelated
explanations of matter transformations or
explanations of matter involved in other
functions of organisms or ecosystems.
3 MC 2 Revise an explanation based on
contrasting energy-availability data for
aerobic versus anaerobic conditions.
[Which new explanation is best
supported by the additional data for
aerobic respiration in muscles cells?]
Distractors may include explanations that do not
adequately describe or do not address the
contrasting data.
4 MC 2 Identify the data that support an
explanation of energy related to
respiration.
[Which data support the explanation
about energy consumption in the cells?]
Key may focus on data that show a relationship
between aerobic or anaerobic respiration and a
corresponding high or low level of energy
consumption.
Distractors may include identification of
extraneous data or data that do not adequately
support the explanation.
5 MC 1 or 2 per
depth of
explanation
Identify appropriate explanations of
cause-effect relationships in the
respiration process indicated by the data.
[Which statement explains the
relationship between oxygen availability
and carbon dioxide production in yeast
cells?]
Key should focus on relationships critical to the
transfer of energy or matter via either aerobic or
anaerobic respiration.
Distractors may include statements that do not
sufficiently explain, statements that explain
alternate phenomena, or statements lacking
critical conceptual connections.

Page 75
6 MC 2 or 3 per
depth of
analysis
Develop an explanation for differences
in data (different respiration outputs -
energy or matter) due to aerobic versus
anaerobic conditions.
[Which statement best explains why
bacterial cells in the closed dish
consumed less glucose than the bacteria
in the open dish?]
Key should focus on/include reasoning for the
contrast in outputs based on the data.
Distractors may include statements explaining
reasoning for other outcomes of protein
synthesis or functions of DNA or erroneous
explanations for specialization.
7 MC 2 or 3 per
complexity
of example
Reason from the evidence to identify an
explanation for which respiration
mechanism (aerobic or anaerobic)
applies to a particular phenomenon or
example.
[Which explanation for the mechanism
of energy production applies to the
making of yogurt?]
Key may focus on conditions in combination
with the data evidence for the mechanism.
Distractors may include statements applying to
the alternate mechanism (aerobic/ anaerobic as
appropriate) or statements about energy
unrelated to the respiration mechanism.
8 MC 2 Identify evidence that supports a student
explanation for the transformation of
organic molecules to produce energy
during cellular respiration.
[What evidence supports the students’
explanation for how liver cells obtain the
energy for active transport of waste into
the urinary tract?]
Key should focus on data evidence of processes
requiring energy or decomposing organic
molecules.
Distractors may include data that do not provide
sufficient/valid evidence or data related to other
cellular/genetic processes.
9 MC 2 or 3 per
complexity
Provide additional clarification to
improve an explanation for cellular
respiration based on conditional limits or
resources.
[Which additional statement/clarification
will best improve the explanation for the
cellular process that caused cells in an
aerobic condition to require oxygen?]
Key may focus on statements linking the limits
or resources of the condition to the respiration
process.
Distractors may include information/data/ trivial
statements that do not provide an improved
explanation.
10 MC 2 or 3 per
context
Explain the data support for how the
different respiration processes provide
energy advantages or disadvantages to
organisms.
[Which statement best explains what the
data illustrate about both aerobic and
anaerobic respiration and the energy
needs of complex organisms?]
Key may focus on advantages or disadvantages
to organisms from using either or both (aerobic,
anaerobic) respiration processes.
Distractors may include data characteristics that
do not connect the types of respiration to
organism survival.

Page 76
11 TEI 2 Explain the process of respiration by
constructing a model of what is
accomplished throughout the process
(arranging explanations in sequential
order).
[Explain how cells obtain energy from
food molecules (by dragging statements
to each label box).]
Drag-drop interaction.
Item may have more draggable options/choices
than are needed to construct the model
explanation.
Correct responses show the correct
sequence/model explanation with all necessary
labels/selected text.
Partial credit would be awarded for a subset of
correct responses.
12 TEI 3 Construct an explanation for how energy
is transformed during aerobic or
anaerobic respiration by providing an
explanation statement, evidence, and
reasoning based on experimental data.
[Identify an explanation, evidence, and
reasoning for the process by which yeast
cells produce carbon dioxide.]
Drag-drop interaction.
Could also be completed with match or drop-
down interaction in some cases.
Item provides table/columns for placing and
connecting explanation, evidence, and
reasoning.
Multiple pieces of evidence/reasoning could be
required.
Correct responses show accurate identification
and association of explanation, evidence, and
reasoning.
Partial credit would be awarded for a subset of
correct responses.
*Response options can make use of Student Misconceptions (examples of scientifically incorrect
assumptions) related to this performance expectation; references to misconceptions are listed in
the links below:
From http://umaine.edu/center/files/2009/11/Clegg_Thesis_FINAL.pdf
Carbon atoms (or carbon dioxide molecules) are an energy source for plants.
Sugar (glucose) provides energy directly for cell functions (no ATP is necessary).
Cells never require oxygen to undergo respiration.
Plants and animals use gases to produce energy, not carbohydrate molecules (glucose).
Respiration is necessary to eliminate carbon dioxide, not to produce energy.
Respiration occurs in organs and tissues, not in cells.
Respiration cannot occur without oxygen (or carbon dioxide) present.
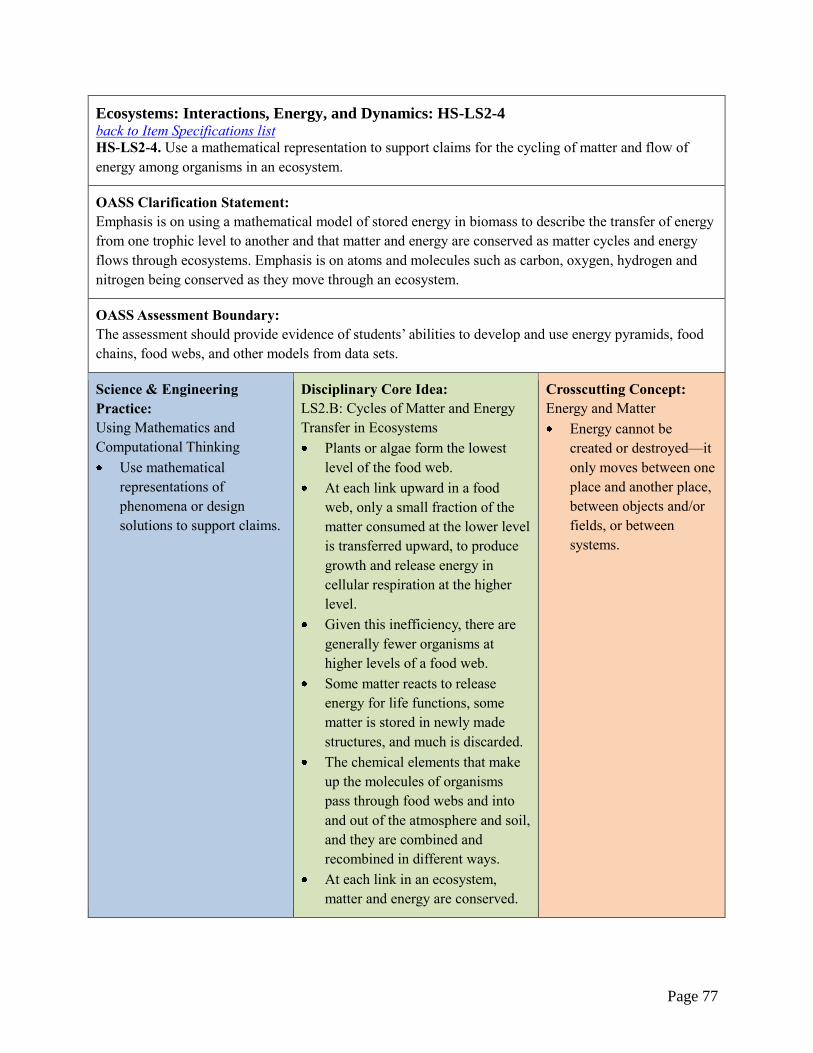
Page 77
Ecosystems: Interactions, Energy, and Dynamics: HS-LS2-4 back to Item Specifications list
HS-LS2-4. Use a mathematical representation to support claims for the cycling of matter and flow of
energy among organisms in an ecosystem.
OASS Clarification Statement:
Emphasis is on using a mathematical model of stored energy in biomass to describe the transfer of energy
from one trophic level to another and that matter and energy are conserved as matter cycles and energy
flows through ecosystems. Emphasis is on atoms and molecules such as carbon, oxygen, hydrogen and
nitrogen being conserved as they move through an ecosystem.
OASS Assessment Boundary:
The assessment should provide evidence of students’ abilities to develop and use energy pyramids, food
chains, food webs, and other models from data sets.
Science & Engineering
Practice:
Using Mathematics and
Computational Thinking
Use mathematical
representations of
phenomena or design
solutions to support claims.
Disciplinary Core Idea:
LS2.B: Cycles of Matter and Energy
Transfer in Ecosystems
Plants or algae form the lowest
level of the food web.
At each link upward in a food
web, only a small fraction of the
matter consumed at the lower level
is transferred upward, to produce
growth and release energy in
cellular respiration at the higher
level.
Given this inefficiency, there are
generally fewer organisms at
higher levels of a food web.
Some matter reacts to release
energy for life functions, some
matter is stored in newly made
structures, and much is discarded.
The chemical elements that make
up the molecules of organisms
pass through food webs and into
and out of the atmosphere and soil,
and they are combined and
recombined in different ways.
At each link in an ecosystem,
matter and energy are conserved.
Crosscutting Concept:
Energy and Matter
Energy cannot be
created or destroyed—it
only moves between one
place and another place,
between objects and/or
fields, or between
systems.

Page 78
In Lay Terms:
Students should be able to use mathematical models (ecological pyramids illustrating proportional/ numerical
quantities of energy and mass, and food web diagrams highlighting the flow of matter or energy) as evidence to
make or support claims about the movement of matter and/or energy through an ecosystem. Emphasis is on the
relative amounts of matter or energy being transferred and hence the degree of efficiency/inefficiency in the
system.
Cluster Clarifications:
Avoid misleading portrayal of species with multiple roles in ecosystems/food webs/food chains (e.g., a
human portrayed only as an herbivore, an omnivorous raccoon portrayed only as a carnivore); avoid
ambiguous or overly complex role combinations. Roles must be well documented with source material.
The terms primary, secondary, and tertiary consumers may be used as labels, but if not defined or used
as labels, the terms should not be used in the stimulus and items. Preference is for referring to first
level, second level, third level consumers, etc.
Mathematic representations should be conceptual, not algebraic expressions (e.g., 10y = x).
Students should not be expected to balance chemical equations or perform stoichiometry.
Cluster Stimulus Attributes:
Typical stimulus elements:
text descriptions of ecosystems
diagrams of food webs and ecological pyramids
data tables and graphs of biomass or net productivity
diagrams of biogeochemical cycles with data
Possible contexts:
ecosystems familiar to Oklahoma students through existence in the state or common coverage in
curriculum
scientists’ application of computer models/simulations describing relationships within ecosystems
predator-prey relationships that affect biomass over time
ecological investigations and resulting data about trophic levels, energy sources, and/or biomass for
organisms found in an ecosystem
natural or human disturbances that affect matter and energy flow in an ecosystem
rates or amounts of nutrients in biogeochemical cycles, with emphasis on biotic portions of the cycle
Content and evidence to be included: data regarding cycling of matter (may include roles of central
molecules/elements) and/or flow of energy within an ecosystem
Types of student responses that need to be supported: describing and analyzing mathematical relationships in
provided data/representations to make, analyze, justify, or reject claims about matter and energy flow
Allowable Item Types:
MC
TE

Page 79
Model Item Descriptions for HS-LS2-4:
# Item
Type DOK
Model Stem
(Items ask students to...) Response Characteristics*
1 MC 1 or 2 per
expression
complexity
Choose the most appropriate
mathematical representation for parts
or relationships in the system.
[Which mathematical (algebraic)
expression best represents the parts
and/or relationships shown within the
food web?]
Key may focus on the mathematical
representation that best illustrates the
specified parts or relationships.
Distractors may include expressions that
contain a subset of the factors seen in the
correct expression or that contain similar but
not identical factors.
2 MC 1 or 2 per
degree of
analysis
required
Make a conclusion or claim describing
what the mathematical representation
shows about matter or energy
distribution.
[Which statement best describes what
the food pyramid shows about the
amount of matter at different levels in
the ecosystem?]
Key may focus on describing what the
representation illustrates overall about matter
or energy proportions.
Distractors may include unsupported claims
or claims unrelated to energy flow.
3 MC 2 Relate the mathematical representation
to the claim/describe how the
mathematical representation links to
the concept (in the claim).
[How do the biomass relationships
shown in the pyramid relate to the
student’s claim about matter or energy
flow?]
Key may focus on how the mathematical
representation provides support for the
concept presented in the claim (reasoning
with content).
Distractors may include explanations that
misinterpret the relationship described in the
expression or representation.
4 MC 2 Identify which claim for movement of
matter, energy flow, or efficiency is
supported based on the mathematical
representation.
[Which claim about the percentage of
energy stored at a given trophic level is
supported (given an ecological
pyramid or a data table showing
energy stored at each level)?]
[Which claim about nitrogen’s role in
the grassland ecosystem is supported
by the data (role of elements)?]
Key may focus on a claim explaining
reasoning for movement of matter, energy
flow, or efficiency based on variable
relationships shown in the data (typically with
more inference than model stem #2).
Distractors may include claims unsupported
by the data or irrelevant to the matter or
energy concept.

Page 80
5 MC 3 Identify which evidence from the
mathematical representation best
supports the claim for movement of
matter or energy flow.
Key may focus on data directly supporting the
claim.
Distractors may include claims describing
levels of energy transfer varying from those
indicated in the ecological pyramid or the data
table.
6 MC 2 or 3 per
statement
complexity
Determine which claim about the
conservation of matter or energy
within the biological system is
supported by the data.
[Which claim about the exchange of
matter between trophic levels is
supported by the data?]
Key may focus on gradual reduction in
available energy and food at each level due to
energy and matter being converted into other
forms.
Distractors may include claims describing loss
or gain of matter between trophic levels or
other claims based on misconceptions and not
supported by the data.
7 MC 3 Use mathematical data to
select/support a claim for how
energy/matter transport in the
biological system results in
inefficiency.
[Based on the biomass pyramid data,
which claim about how energy/matter
moves through the ecosystem is
supported?]
Key may focus on only the food portion of
biomass providing energy to the next trophic
level; various other processes (heat loss,
movement, reproduction, digestion, growth
and development, etc.) result in inefficiency
in both energy and matter transformations at
each level.
Distractors may include statements describing
inverse/tangential/irrelevant relationships to
those seen in the data (per common
misconceptions) or comparisons of
uncorrelated data.
8 MC 3 Determine which claim about the
relationship between numbers of
organisms (trophic level populations)
and total biomass is supported by
the data.
[Which claim about the relationship
between the number of organisms at
each trophic level and the biomass
stored at each level is supported by the
population data and the biomass
pyramid?]
Key may focus on correlations between
numbers of organisms and biomass or reasons
for seemingly disproportionate biomass due to
accumulations/depletions (e.g., large ocean
predator biomass exceeding producer
populations at a particular time, great amounts
of biomass stored cumulatively over time in
tree wood, etc.).
Distractors may include claims describing
inverse relationships to those seen in the data
or comparisons of uncorrelated data.
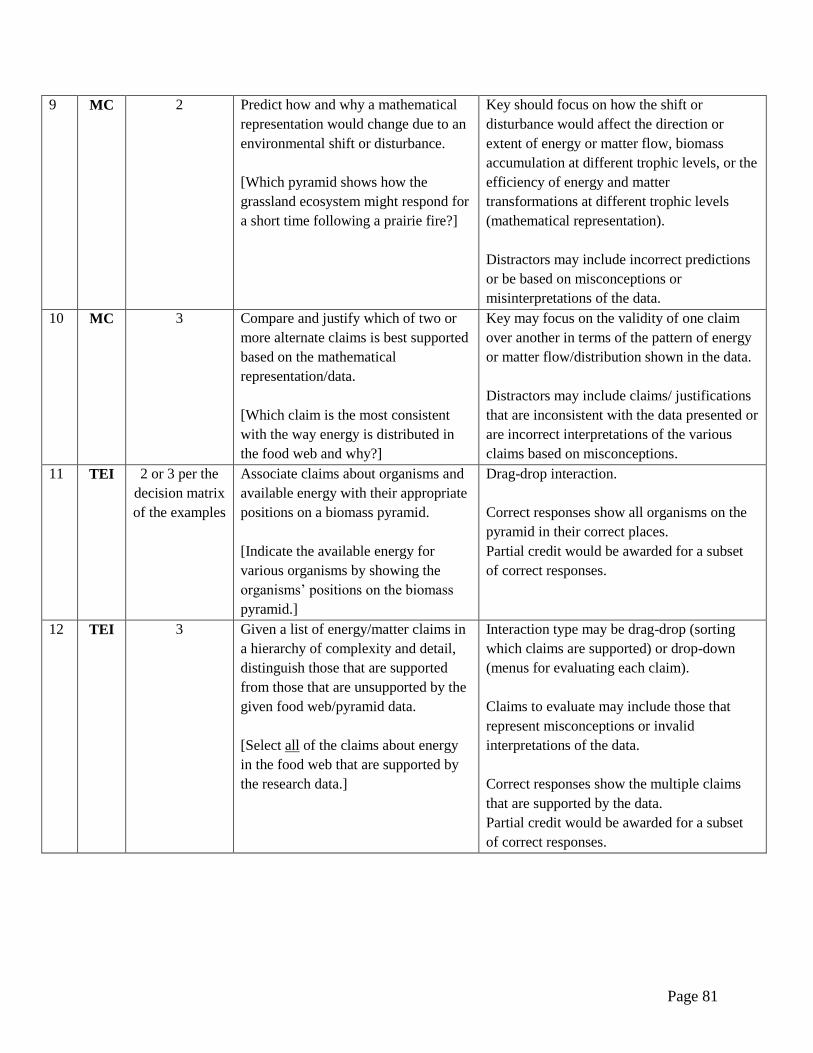
Page 81
9 MC 2 Predict how and why a mathematical
representation would change due to an
environmental shift or disturbance.
[Which pyramid shows how the
grassland ecosystem might respond for
a short time following a prairie fire?]
Key should focus on how the shift or
disturbance would affect the direction or
extent of energy or matter flow, biomass
accumulation at different trophic levels, or the
efficiency of energy and matter
transformations at different trophic levels
(mathematical representation).
Distractors may include incorrect predictions
or be based on misconceptions or
misinterpretations of the data.
10 MC 3 Compare and justify which of two or
more alternate claims is best supported
based on the mathematical
representation/data.
[Which claim is the most consistent
with the way energy is distributed in
the food web and why?]
Key may focus on the validity of one claim
over another in terms of the pattern of energy
or matter flow/distribution shown in the data.
Distractors may include claims/ justifications
that are inconsistent with the data presented or
are incorrect interpretations of the various
claims based on misconceptions.
11 TEI 2 or 3 per the
decision matrix
of the examples
Associate claims about organisms and
available energy with their appropriate
positions on a biomass pyramid.
[Indicate the available energy for
various organisms by showing the
organisms’ positions on the biomass
pyramid.]
Drag-drop interaction.
Correct responses show all organisms on the
pyramid in their correct places.
Partial credit would be awarded for a subset
of correct responses.
12 TEI 3 Given a list of energy/matter claims in
a hierarchy of complexity and detail,
distinguish those that are supported
from those that are unsupported by the
given food web/pyramid data.
[Select all of the claims about energy
in the food web that are supported by
the research data.]
Interaction type may be drag-drop (sorting
which claims are supported) or drop-down
(menus for evaluating each claim).
Claims to evaluate may include those that
represent misconceptions or invalid
interpretations of the data.
Correct responses show the multiple claims
that are supported by the data.
Partial credit would be awarded for a subset
of correct responses.

Page 82
*Response options can make use of Student Misconceptions (examples of scientifically incorrect
assumptions) related to this performance expectation; references to misconceptions are listed in
the links below:
From http://assessment.aaas.org:
Organisms and other things can “use up” energy.
Plants take in food from the outside environment, and/or plants get their food from the soil via roots.
Organisms higher in a food web eat everything that is lower in the food web.
The top of the food chain has the most energy because it accumulates up the food chain.
Populations higher on a food web increase in number because they deplete those lower in the food web.
There are more herbivores because people keep and breed them. Decomposers release some energy that is
cycled back to plants.
The number of producers is high to satisfy consumers.
Varying the population size of species will only affect the others that are directly connected through a
food chain.
A model is always a three-dimensional object. Therefore, pictures, diagrams, graphs, written descriptions,
and abstract mathematical or conceptual models are not models.

Page 83
Sample Cluster for HS-LS2-4:
A group of students studied a grassland ecosystem. The students learned that biomass is a measure of the amount
of matter in an ecosystem. They also learned that energy is primarily transferred through an ecosystem in the form
of food. The students created a diagram to show what they learned.
After the students created the diagram, their teacher asked them to answer this question: How is biomass related to
energy flow in the grassland ecosystem?
To help them answer the question, the students found biomass data. They created this second diagram to illustrate
the data.
(Items on the following pages)

Page 84
Item 1
Item Type: MC
DOK 3
Key: D
ITEM: A student makes a claim about how the heat energy shown in the diagram “Matter and Energy Flow in a
Grassland Ecosystem” helps explain the amounts of biomass shown in the diagram “Pyramid of Biomass.”
Which statement best analyzes the student’s claim?
A. The claim is supported; organisms store heat energy in food to produce biomass, and the available heat energy
decreases at the higher levels.
B. The claim is supported; the amount of biomass stored at higher levels is very small, and small amounts of
biomass show that energy and matter are lost from a system.
C. The claim is rejected; heat energy flows in all directions among the levels, and this allows food energy to be
stored within biomass at all levels.
D. The claim is rejected; energy from food is used to produce biomass, and the conversion of some of this energy
to heat in each level reduces energy to be stored in biomass.
Claim: As heat energy is released by consumers, less heat is available to organisms at the
next level. Therefore the higher pyramid levels contain less biomass.

Page 85
Item 2
Item Type: TEI
DOK 2

Page 86
Item 3
Item Type: EBSR
DOK 1
Key: A; B
INTERACTION (MC) #1:
Based on the diagrams, which mathematical expression correctly compares the amounts of energy in
different parts of the ecosystem?
a. producer energy > herbivore energy
b. carnivore energy > herbivore energy
c. carnivore energy = herbivore energy
d. producer energy = herbivore energy
INTERACTION (MC) #2:
Based on the diagrams, which mathematical expression correctly compares the amounts of energy in
different parts of the ecosystem?
a. microbe energy= carnivore energy
b. herbivore energy>microbe energy
c. microbe energy > carnivore energy
d. herbivore energy = microbe energy

Page 87
Ecosystems: Interactions, Energy, and Dynamics: HS-LS2-5 back to Item Specifications list
HS-LS2-5. Develop a model to illustrate the role of photosynthesis and cellular respiration in the cycling
of carbon among the biosphere, atmosphere, hydrosphere, and geosphere.
OASS Clarification Statement:
Examples of models could include simulations and mathematical models (e.g., chemical equations that
demonstrate the relationship between photosynthesis and cellular respiration).
OASS Assessment Boundary:
Assessment does not include the specific chemical steps of photosynthesis and respiration.
Science & Engineering Practice:
Developing and Using Models
Develop a model based on
evidence to illustrate the
relationships between systems or
components of a system.
Disciplinary Core Idea:
LS2.B: Cycles of Matter and
Energy Transfer in Ecosystems
Photosynthesis and cellular
respiration are important
components of the carbon
cycle, in which carbon is
exchanged among the
biosphere, atmosphere,
oceans, and geosphere
through chemical, physical,
geological, and biological
processes.
PS3.D: Energy in Chemical
Processes
The main way that solar
energy is captured and stored
on Earth is through the
complex chemical process
known as photosynthesis.
(secondary to HS-LS2-5)
Crosscutting Concept:
Systems and System Models
Models (e.g., physical,
mathematical, computer
models) can be used to
simulate systems and
interactions—including
energy, matter, and
information flows—
within and between
systems at different
scales.
In Lay Terms:
Students should be able to construct models to show the movement of carbon through biological systems
and between organisms and the environment. Models should illustrate that the processes of photosynthesis
(primarily in plants) and cellular respiration in all organisms utilize carbon compounds to provide energy
for life on Earth. Models should also demonstrate that carbon undergoes a continuous process of cycling
as various compounds in the geosphere, biosphere, hydrosphere, and atmosphere of Earth.

Page 88
Cluster Clarifications:
The cluster stimulus should address 2 or 3 of the Earth systems identified in the performance
expectation (i.e., biosphere, atmosphere, hydrosphere, and geosphere).
Relevant components that students need to include in the model are photosynthesis inputs and
outputs, cellular respiration inputs and outputs, and Earth system components (e.g., biosphere,
atmosphere, hydrosphere, geosphere).
Interactions and relationships that students need to represent and describe in the model include (1)
exchange of carbon between organisms and the environment (Earth’s systems) via photosynthesis
and cellular respiration inputs and outputs, and (2) storage of some carbon in organisms as part of
the carbon cycle.
Students are not expected to calculate quantities of inputs, outputs, products, or reactants.
In order to address the SEP and CCC, when students develop a model, they are expected to
construct a model from evidence/data, complete a model, or choose the best model to illustrate a
given phenomenon. A physical demonstration of a phenomenon is not a model as it does not differ
from the reality it represents (in materials, scale, etc.).
Cluster Stimulus Attributes:
Typical stimulus elements:
graphs, data tables, and textual descriptions of the processes or steps in the carbon cycle,
respiration, and/or photosynthesis
partial diagrams, equations, models, simulations, flow charts of these processes or steps
Possible contexts:
creating and/or completing diagrams, models, or simulations illustrating the roles and impacts of
photosynthesis and/or cellular respiration in the carbon cycle
creating and/or completing diagrams, models, or simulations illustrating inputs and outputs of
photosynthesis and/or cellular respiration
creating and/or completing diagrams, models, or descriptions illustrating biological mechanisms
and processes that move carbon between Earth systems
Content and evidence to be included: data, descriptions, and/or partial models to support model
creation/completion and/or revision
Types of student responses that need to be supported: creating and improving/modifying models, through
the use of evidence, in order to describe and analyze the role of photosynthesis and cellular respiration in
carbon cycling within and among Earth’s system
Allowable Item Types:
MC
TE

Page 89
Model Item Descriptions for HS-LS2-5:
# Item
Type DOK
Model Stem
(Items ask students to...) Response Characteristics*
1 MC 2 Identify the impacts of photosynthesis/
respiration on the carbon cycle that
specific components of the model need
to show.
[How can the model be developed to
show the importance of process X?]
Key may focus on consumption or production
of CO2, organic substrates, or inorganic
biological byproducts (such as carbonate
minerals) in the carbon cycle.
Distractors may include descriptions of
components of the aerobic respiration process
that are not high in importance (per the
specific cycle or process).
2 MC 2 Identify the cycle sequence of a key
process associated with the carbon cycle
model.
[At which position in the model being
developed would the description of
glucose decomposition belong?]
Key may focus on the description of carbon-
based molecule reactions/ transitions at the
appropriate step in the carbon cycle model
(without being too specific, per assessment
boundary).
Distractors may include processes not related
to or dependent upon the step(s) indicated.
3 MC 1 or 2 per
complexity
Describe the purpose/system that needs
to be shown by a photosynthesis,
respiration, or carbon cycle model being
developed.
[To represent X, which series of
processes need to be shown in the
model?]
Key may focus on transfer of carbon between
Earth spheres or biological energy storage and
transfer.
Distractors may include
misinterpretations/misconceptions of the
model and/or its components and the
associated purposes.
4 MC 1 or 2 per
relationship
complexity
Identify relationships between inputs
and outputs that should be shown in a
carbon cycle, photosynthesis, or
respiration model.
[Which statement describes how to
show the relationship between
photosynthesis and carbon dioxide in
the model?]
[How should the relationship between
available sunlight and the amount of
glucose produced in the algae be shown
in the model?]
Key may focus on links between forms of
carbon or the energy processes that drive or
are driven by the carbon cycle.
Distractors may include statements describing
alternate relationships or misconceptions
about functions/ processes.

Page 90
5 MC 2 Describe the representations needed in
the model to show interactions among
components of the model related to
energy transactions.
[What is one way the model can be
developed to show how carbon is
related to energy storage in plants?]
Key may focus on the role of carbon
molecules in the capture of sunlight energy by
plants, their role in biological energy storage
via organic hydrocarbon molecules, and/or its
role in the release/use of energy via
respiration.
Distractors may include descriptions of roles
not related to the specified process/function or
interactions that occur but are not involved
directly in the process.
6 MC 2 or 3 per
model/
concept
complexity
Complete/modify the model to
demonstrate the underlying concept.
[Which change will allow this model to
demonstrate organic carbon cycling to
inorganic forms?]
Key may focus on missing components or
additional model steps that illustrate a key
process or outcome of the cycle.
Distractors may include components
associated with model components but not
involved in the underlying model concept.
7 MC 2 Identify the best model to describe a
given carbon phenomenon/process/
relationship shown in the data.
[Which molecular model demonstrates
how carbon is cycled from plants to the
atmosphere?]
Key may focus on the dependent variable in
the data and its corresponding place in the
model.
Distractors may include models that show
additional components or unrelated
processes/relationships.
8 MC 2 Explain how the model being
developed can show the underlying
concept of carbon exchange between
hydrosphere, geosphere, biosphere, and
atmosphere.
[Which statement explains how the
model being developed can demonstrate
carbon’s importance on Earth?]
Key may focus on the transfer of carbon
between the various Earth spheres as a
process that impacts the geology, climate, and
ecosystems of Earth.
Distractors may include statements that
discuss carbon but do not define its
importance as shown in the model.
9 MC 3 Explain how collected data/evidence
support a given model of carbon cycling
(fit of model and data set).
[Which statement describes how the
data collected in this investigation
support the model being developed?]
Key may focus on characteristics of the data
set that support the model or its components,
using data as evidence plus content reasoning
as appropriate.
Distractors may include statements related to
data that do not support the model or model
components unrelated to the data.

Page 91
10 MC 3 Relate the validity/accuracy of a model
to the quality or quantity of supporting
evidence.
[Which evidence from the data table
would support the claim that the carbon
cycle model is accurate?]
Key may focus on aspects of the evidence that
validate or provide greater accuracy to the
model.
Distractors may include data that relate to
broader processes/relationships but do not
support the claim or central concept.
11 TEI 3 Construct or complete a model of
carbon cycling based on photosynthesis
and/or cellular respiration processes.
[Complete the carbon flow model for an
ocean biome to show the processes that
occur to transfer carbon.]
Drag-drop interaction.
Correct responses show components,
processes, and interactions correctly
indicated.
Partial credit would be awarded for a subset
of correct responses.
*Response options can make use of Student Misconceptions (examples of scientifically incorrect
assumptions) related to this performance expectation; references to misconceptions are listed in
the links below: From http://energyeducation.eku.edu/sites/energyeducation.eku.edu/files/energyFlowinEcologicalSystems.pdf:
Plants take in food from the outside environment, and/or plants get their food from the soil via roots.
Energy cannot be created or destroyed.
Carbon dioxide is a source of energy for plants.

Page 92
Ecosystems: Interactions, Energy, and Dynamics: HS-LS2-6 back to Item Specifications list
HS-LS2-6. Evaluate the claims, evidence, and reasoning that the complex interactions in ecosystems
maintain relatively consistent numbers and types of organisms in stable conditions, but changing
conditions may result in a new ecosystem.
OASS Clarification Statement:
Examples of changes in ecosystem conditions could include modest biological or physical changes, such
as moderate hunting or a seasonal flood; and extreme changes, such as volcanic eruption or sea level rise.
OASS Assessment Boundary:
The assessment should provide evidence of students’ abilities to derive trends from graphical
representations of population trends. Assessments should focus on describing drivers of ecosystem
stability and change, not on the organismal mechanisms of responses and interactions.
Science & Engineering Practice:
Engaging in Argument from
Evidence
Evaluate the claims, evidence,
and reasoning behind currently
accepted explanations or
solutions to determine the
merits of arguments.
Disciplinary Core Idea:
LS2.C: Ecosystem Dynamics,
Functioning, and Resilience
A complex set of interactions
within an ecosystem can keep its
numbers and types of organisms
relatively constant over long
periods of time under stable
conditions.
If a modest biological or physical
disturbance to an ecosystem
occurs, it may return to its more
or less original status (i.e., the
ecosystem is resilient), as
opposed to becoming a very
different ecosystem.
Extreme fluctuations in
conditions or the size of any
population, however, can
challenge the functioning of
ecosystems in terms of resources
and habitat availability.
Crosscutting Concept:
Stability and Change
Much of science deals
with constructing
explanations of how
things change and how
they remain stable.
In Lay Terms:
Students should be able to evaluate the strength of arguments about how stability is maintained or
disrupted in ecosystems based on data provided. Under most circumstances environmental factors ensure
that a natural continuity is maintained, but more extreme changes to one or more of these factors can
result in major ecosystem changes.

Page 93
Cluster Clarifications:
To address the CCC, stimuli and items should address factors regarding stability and change of
populations and resulting diversity in ecosystems.
Cluster Stimulus Attributes:
Typical stimulus elements:
claims, evidence, and/or reasoning presented as text, models, and/or graphical charts/diagrams
Possible contexts:
investigations of which type of succession occurs based on degree of ecological disturbance
comparisons of primary and secondary succession
descriptions or computer models demonstrating characteristics and/or minimal flux of a climax
community over long periods of time
population changes caused by ecological disturbance in an ecosystem
the non-static way in which a community re-establishes after an ecological disturbance
graphical representations and case studies used as references to evaluate and predict future
changes within an ecosystem
assessments and/or comparisons of modest and extreme fluctuations in conditions of ecosystems
Content and evidence to be included: claims and a given amount of evidence and/or reasoning about
interactions or conditions that either maintain or disturb ecosystem stability
Types of student responses that need to be supported: evaluating claims in order to determine strength of
claim, quality of evidence, appropriate reasoning, and additional evidence or revisions to the claims
Allowable Item Types:
MC
TE

Page 94
Model Item Descriptions for HS-LS2-6:
# Item
Type DOK
Model Stem
(Items ask students to...) Response Characteristics*
1 MC 2 or 3 per
complexity
of claim/
reasoning
Identify or describe the reasoning that
best supports the claim/conclusion for an
ecosystem change.
[Which reasoning best supports the
scientists’ claim about the type of
ecological disturbance that caused
primary succession (or secondary
succession) in the forest community?]
Key should focus on reasoning from
information and content provided in stimulus
plus knowledge of the DCI.
Distractors may include invalid or unsupported
reasoning.
2 MC 1 or 2 per
claim
complexity
Compare claims to evaluate which claim
(about ecosystem continuity or change
based on a disturbance) is best supported
by the data.
[Which claim made by the students about
the succession model after the flood is
best supported by the data?]
Key may focus on distinguishing/using data
showing an ecosystem response to the same or
a similar disturbance.
Distractors may include unsupported claims or
claims based on reasoning not included in or
not relevant to the data.
3 MC 2 or 3 per
claim/
support
Evaluate the merit of a claim about the
stability of an ecosystem based on data
evidence.
[Which statement best describes the
(strength of the) claim made about the
stability of the forest ecosystem after the
fire?]
Key may focus on the degree of stability
(normal fluctuation versus significant change)
supported by the data evidence.
Distractors may include unsupported claims or
claims about effects not related to the
disturbance event.
4 MC 1 or 2 per
evidence
context
Identify evidence that supports a claim or
an argument for what event(s) caused an
ecosystem change.
[What evidence supports the student’s
claim that a new ecosystem formed
because of overgrazing?]
Key should focus on data supporting the claim
or argument.
Distractors may include unrelated or
insignificant data.
5 MC 2 Identify the argument that best rejects the
claim for ecosystem stability based on the
evidence.
[Which argument best rejects the claim
that a new ecosystem resulted from the
fire?]
Key should focus on an argument for a
counterclaim based on the evidence.
Distractors may include arguments not based
on evidence or unsupported by the evidence.

Page 95
6 MC 2 Identify additional evidence that would
support the claim that a particular event
may cause an ecosystem to maintain or
shift stability (e.g., undergo succession).
[Which additional evidence would
support the scientists’ claims that
succession happens in the forest
community after clear-cutting of timber?]
Key may focus on evidence specific to the data
(e.g., populations of nesting birds decreased by
40% after the clear-cutting) or more general
data/evidence needed (e.g., evidence about how
increased light favors certain tree species).
Distractors may include added evidence that does
not support the claim.
7 MC 3 Distinguish the evidence and/or reasoning
from evidence that best improves/supports
the scientific reliability of an argument or
conclusion about ecosystem stability.
[Which evidence and reasoning would
improve the reliability of the scientists’
explanation of which plants are dominant
at which stage of succession?]
Key may focus on data/reasoning that offers
better control of variables, support from
additional studies, or repetition of the
investigation.
Distractors may include evidence or reasoning
that does not improve the reliability or evidence
unrelated to the argument/conclusion.
8 MC 2 Revise a claim about the stability/
instability of an ecosystem based on
evidence from a study or an observation.
[Which revised claim about the ecosystem
best reflects the data from the new study?]
Key may focus on additional or alternative
statements incorporating the impact of the new
evidence.
Distractors may include unsupported/ unrelated
revisions or revisions contradicted by the
evidence.
9 MC 3 Explain the relative merit, supporting
evidence, and reasoning for comparing
and ranking claims about changes in an
ecosystem.
[Which of the scientists’ claims about the
impact of warmer temperatures on the
grassland ecosystem is better supported,
and why?]
Explanation/analysis must be included, as
compared to model stem #2.
Key may focus on merit due to better data
support or reasoning.
Distractors may include incorrect conclusions
and justifications based on invalid interpretation
of the data and/or misconceptions.
10 TEI 3 Distinguish between the merits of various
claims about ecosystem stability based on
the evidence that supports each claim.
[Match each claim to the data that best
supports that claim.]
Match interaction.
Interaction direction text should specify whether
all choices will be matched (extraneous or
irrelevant data may be included in data choices).
Correct responses show all correct associations
between the claims and the data.
Partial credit would be awarded for a subset of
correct responses.
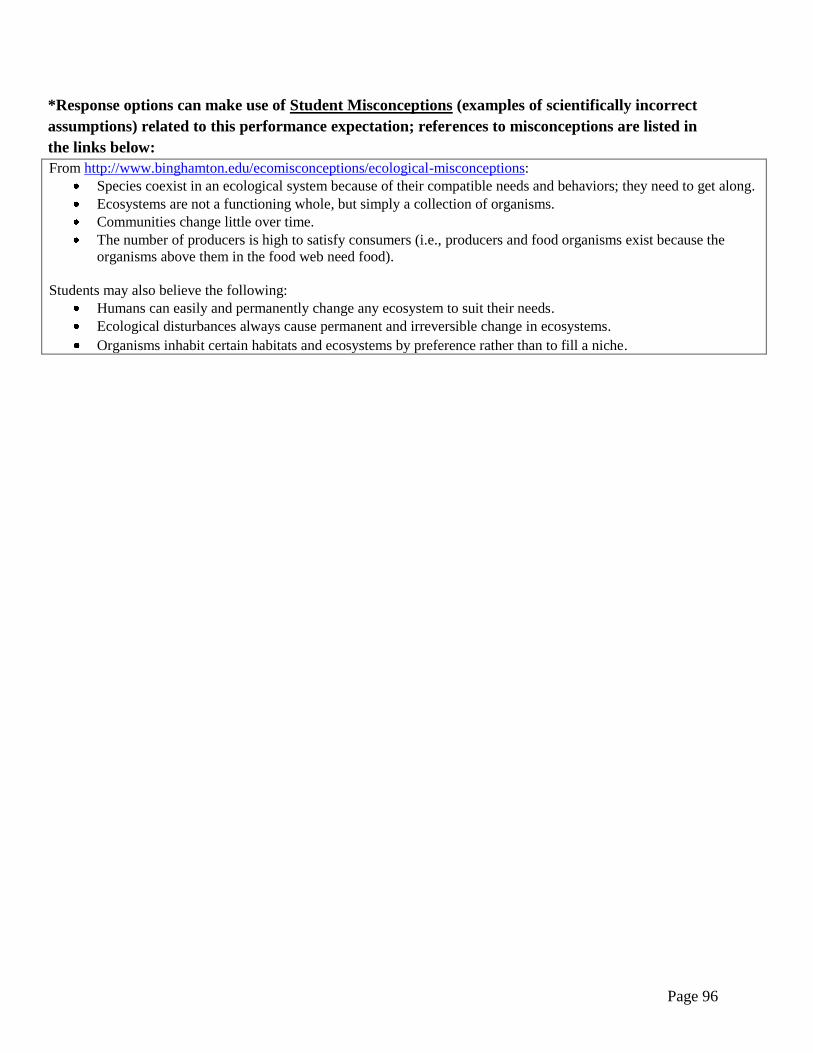
Page 96
*Response options can make use of Student Misconceptions (examples of scientifically incorrect
assumptions) related to this performance expectation; references to misconceptions are listed in
the links below:
From http://www.binghamton.edu/ecomisconceptions/ecological-misconceptions:
Species coexist in an ecological system because of their compatible needs and behaviors; they need to get along.
Ecosystems are not a functioning whole, but simply a collection of organisms.
Communities change little over time.
The number of producers is high to satisfy consumers (i.e., producers and food organisms exist because the
organisms above them in the food web need food).
Students may also believe the following:
Humans can easily and permanently change any ecosystem to suit their needs.
Ecological disturbances always cause permanent and irreversible change in ecosystems.
Organisms inhabit certain habitats and ecosystems by preference rather than to fill a niche.

Page 97
Ecosystems: Interactions, Energy, and Dynamics: HS-LS2-8 back to Item Specifications list
HS-LS2-8. Evaluate evidence for the role of group behavior on individual and species’ chances to
survive and reproduce.
OASS Clarification Statement:
Emphasis is on advantages of grouping behaviors (e.g., flocking, schooling, herding) and cooperative
behaviors (e.g., hunting, migrating, swarming) on survival and reproduction.
OASS Assessment Boundary:
The assessment should provide evidence of students’ abilities to: (1) distinguish between group versus
individual behavior, (2) identify evidence supporting the outcomes of group behavior, and (3) develop
logical and reasonable arguments based on evidence.
Science & Engineering Practice:
Engaging in Argument from
Evidence
Evaluate the claims, evidence,
and reasoning behind currently
accepted explanations or
solutions to determine the merits
of arguments.
Disciplinary Core Idea:
LS2.D: Social Interactions and
Group Behavior
Group behavior has evolved
because membership can
increase the chances of
survival for individuals and
their genetic relatives.
Crosscutting Concept:
Cause and Effect
Empirical evidence is
required to differentiate
between cause and
correlation and make
claims about specific
causes and effects.
In Lay Terms:
Students should be able to evaluate and critique scientific claims, evidence, and reasoning from data used
to explain the group behaviors of animals in response to factors limiting survival. For example, many
herbivore prey species demonstrate herding behavior. Herding may increase the chance of the individual
animal to survive due to enabling the species as a whole to become more efficient at finding food,
avoiding danger, and reproducing.
Cluster Clarifications:
To address the CCC, stimuli and items should contain empirical evidence relating to claims,
arguments, or reasoning that allow students to differentiate cause and/or correlation and observed
effects.
Cluster Stimulus Attributes:
Typical stimulus elements:
research results in the form of text summaries/conclusions, tables, graphs, and maps
Possible contexts:
scientific investigations that provide examples of group behaviors that impact species survival
analysis/comparisons of research findings about the group behaviors of animals in varying
environments/conditions
discoveries of additional data/evidence that supports claims or reasoning for group behavior

Page 98
influences on survival rates
evaluations of the validity, strengths, and weaknesses of available evidence for the
advantages/disadvantages of group behavior
analysis/comparisons of evidence and arguments/conclusions from investigations of group versus
individual behavior, including survival or population measures
Content and evidence to be included: data, information, and/or claims about relationships between animal
behaviors (group and/or individual) and survival, reproduction, or population measures; sufficient
evidence to help distinguish cause and correlation in relationships
Types of student responses that need to be supported: evaluating claims, evidence, and reasoning from the
data presented
Allowable Item Types:
MC
TEI
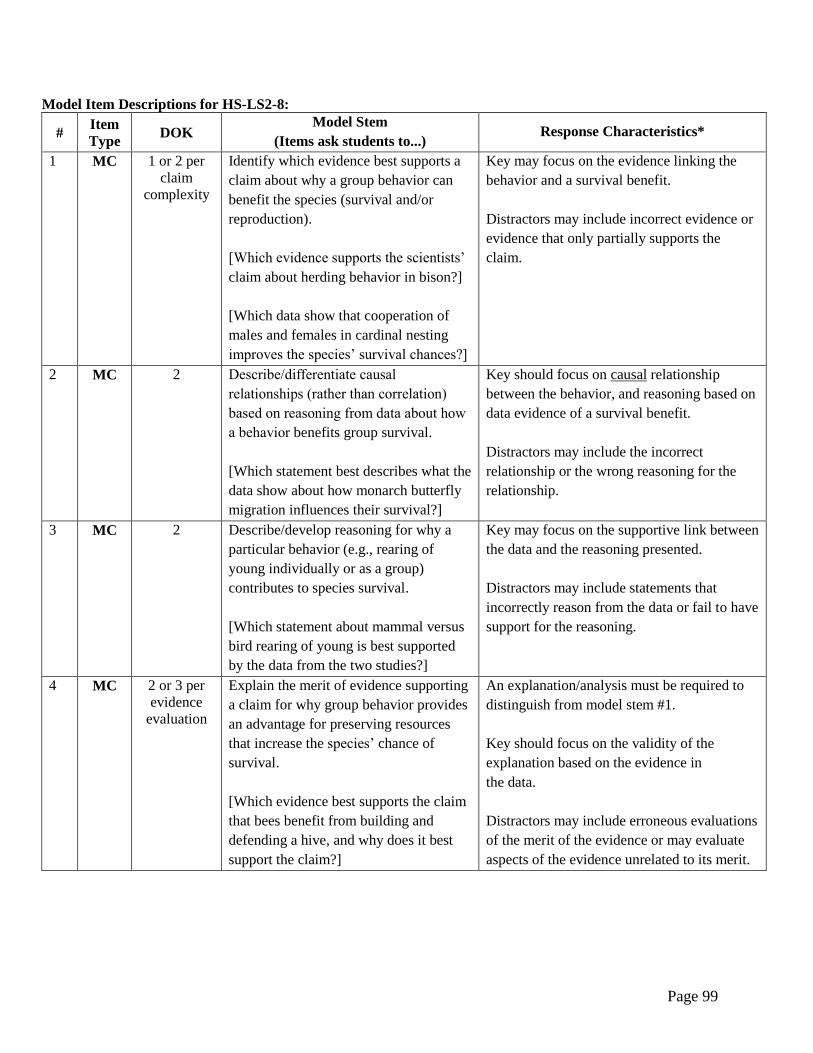
Page 99
Model Item Descriptions for HS-LS2-8:
# Item
Type DOK
Model Stem
(Items ask students to...) Response Characteristics*
1 MC 1 or 2 per
claim
complexity
Identify which evidence best supports a
claim about why a group behavior can
benefit the species (survival and/or
reproduction).
[Which evidence supports the scientists’
claim about herding behavior in bison?]
[Which data show that cooperation of
males and females in cardinal nesting
improves the species’ survival chances?]
Key may focus on the evidence linking the
behavior and a survival benefit.
Distractors may include incorrect evidence or
evidence that only partially supports the
claim.
2 MC 2 Describe/differentiate causal
relationships (rather than correlation)
based on reasoning from data about how
a behavior benefits group survival.
[Which statement best describes what the
data show about how monarch butterfly
migration influences their survival?]
Key should focus on causal relationship
between the behavior, and reasoning based on
data evidence of a survival benefit.
Distractors may include the incorrect
relationship or the wrong reasoning for the
relationship.
3 MC 2 Describe/develop reasoning for why a
particular behavior (e.g., rearing of
young individually or as a group)
contributes to species survival.
[Which statement about mammal versus
bird rearing of young is best supported
by the data from the two studies?]
Key may focus on the supportive link between
the data and the reasoning presented.
Distractors may include statements that
incorrectly reason from the data or fail to have
support for the reasoning.
4 MC 2 or 3 per
evidence
evaluation
Explain the merit of evidence supporting
a claim for why group behavior provides
an advantage for preserving resources
that increase the species’ chance of
survival.
[Which evidence best supports the claim
that bees benefit from building and
defending a hive, and why does it best
support the claim?]
An explanation/analysis must be required to
distinguish from model stem #1.
Key should focus on the validity of the
explanation based on the evidence in
the data.
Distractors may include erroneous evaluations
of the merit of the evidence or may evaluate
aspects of the evidence unrelated to its merit.

Page 100
5 MC 2 Explain why a claim made from
evidence about a group or an individual
behavior pattern is due to correlation
rather than cause and effect.
[Which statement explains why the
relationship between the whitetail deer
behavior and survival rates is
correlation?]
Key must focus on correlation and the
evidence that supports this relationship (lack
of evidence of cause-effect).
Distractors may include insufficient or invalid
explanations.
6 MC 2 Critique the reasoning for a scientific
claim about the relationship between
behavior and reproductive rates (e.g.,
hunting behavior and reproductive rates
of a predator species).
[Which statement evaluates the
reasoning for the claims made by
scientists based on the data for the three
wolf populations?]
Key may focus on the match between the
data, claim, and underlying concept, as well
as the direction relationship supported or not
supported.
Distractors may include faulty evaluation of
reasoning, emphasizing reasoning unrelated to
the claims, or reasoning supporting aspects of
the claims unrelated to the link between the
data and claim.
7 MC 1 or 2 per
argument
reasoning
Identify evidence from the data that
rejects an argument related to a behavior
and survival rates.
[Which data provides evidence that
would reject the student’s claim about
the schooling of menhaden?]
Key may focus on data that counter the
premise or reasoning for the argument.
Distractors may include data that support or
are irrelevant to the argument, or data that
refute a different argument.
8 MC 2 or 3 per
complexity
of analysis
Determine which evidence from the data
supports a cause-effect relationship
rather than a correlation between a
species’ behavior and a survival
advantage.
[Which data show that the link between
the herding instinct of antelope and their
increased survival is a cause-effect
relationship and not a correlation?]
[Which of these data best support the
argument made by the scientist that the
benefit of cooperative hunting to the
wolf species is a cause-effect
relationship and not correlation?]
Key may focus on specific data that link the
cooperative behavior and the survival
advantage.
Distractors may include evidence that
supports correlation instead of cause-effect or
that supports neither relationship.

Page 101
9 TEI 3 Distinguish correlation from causation in
examples of species’ behavior patterns
and provide reasoning to support each
choice.
[Using the data from the study, classify
the relationship between each group
behavior and its benefit, and label each
relationship as causation or correlation.]
Drag-drop, drop-down, or match interaction.
Reasoning associations may be incorporated
in some items.
Correct responses show proper associations
between behaviors (e.g., cooperative hunting),
benefits (e.g., increased reproduction,
increased survival), and correlation vs.
causation.
Partial credit would be awarded for a subset
of correct responses.
*Response options can make use of Student Misconceptions (examples of scientifically incorrect
assumptions) related to this performance expectation; references to misconceptions are listed in
the links below:
From http://www.tandfonline.com/doi/abs/10.1080/00958964.1994.9941962#.VPpv-uEpvm4:
Adaptation occurs due to individual needs (or will to change) (i.e., Lamarck’s theory).
In all selection fitness is a function of the bigger and stronger organisms.
All members of a species are very similar and there is little variation within species or populations.
From http://life.bio.sunysb.edu/~spgp/2004_02_10/Alters_and_Nelson_2002.pdf:
Students misunderstand the meaning of the terms “adapt” and fitness (e.g., students think adapt means to
resist or withstand rather than change in response to selection; they think fitness means the ability to do
physically demanding tasks or having good general health rather than having favorable characteristics).
Students do not understand the amount of cause of genetic variation among organisms (e.g., students
think all genetic variation is due to mutation or due to environmental factors).

Page 102
Heredity: Inheritance and Variation of Traits: HS-LS3-1 back to Item Specifications list
HS-LS3-1. Ask questions to clarify relationships about the role of DNA and chromosomes in coding the
instructions for characteristic traits passed from parents to offspring.
OASS Clarification Statement:
Emphasis should be on asking questions and making predictions to obtain reliable information about the
role of DNA and chromosomes in coding the instructions for traits (e.g., pedigrees, karyotypes, genetic
disorders, Punnett squares).
OASS Assessment Boundary:
Assessments may include codominance, incomplete dominance, and sex-linked traits, but should not
include dihybrid crosses.
Science & Engineering
Practice:
Asking Questions and
Defining Problems
Ask questions that
arise from examining
models or a theory to
clarify relationships.
Disciplinary Core Idea:
LS3.A: Inheritance of Traits
Each chromosome consists of a
single very long DNA molecule,
and each gene on the
chromosome is a particular
segment of that DNA.
The instructions for forming
species’ characteristics are
carried in DNA.
All cells in an organism have the
same genetic content, but the
genes used (expressed) by the
cell may be regulated in
different ways.
Not all DNA codes for protein,
some segments of DNA are
involved in regulatory or
structural functions, and some
have no as-yet known function.
LS1.A: Structure and Function
All cells contain genetic
information in the form of DNA
molecules. Genes are regions in
the DNA that contain the
instructions that code for the
formation of proteins.
(secondary to HS-LS3-1)
Crosscutting Concept:
Cause and Effect
Empirical evidence
is required to
differentiate
between cause and
correlation and make
claims about specific
causes and effects.

Page 103
In Lay Terms:
Students should be able to ask questions and make predictions about the role of chromosomes and DNA
in the inheritance of traits. Inheritance of traits in observable patterns occurs because DNA instructions
carried on segments of chromosomes called genes are passed from parents to offspring during
reproduction. By studying patterns of inheritance, characteristic functions of genes can be learned and the
likelihood of traits occurring in offspring can be predicted.
Cluster Clarifications:
To address the CCC, stimuli and items should contain empirical evidence (in a model,
explanation, etc.) relating to claims regarding cause and/or correlation and observed effects.
Cluster Stimulus Attributes:
Typical stimulus elements:
research results/conclusions in the form of text summaries/conclusions, tables, and/or graphs
models (e.g., Punnett squares)
Possible contexts:
scientific investigations that provide examples of patterns of inheritance in both sexual and
asexual reproduction
analysis/comparisons of ratios of traits in offspring for the purpose of establishing inheritance
patterns
application of mathematical models (i.e., Punnett squares) to predict the likely inheritance of
traits with known inheritance patterns (dominant-recessive, codominant, incompletely dominant,
sex-linked)
evaluations of claims about inheritance based on evidence of parent and offspring genotypes and
phenotypes
analysis/evaluations of evidence, predictions, and claims regarding the heritability of observed
characteristics based on genetic evidence (i.e., whether characteristics are heritable/inherited and
why or why not)
Content and evidence to be included: data, models, and other information showing inheritance patterns,
inherited vs. non-inherited traits, etc.
Types of student responses that need to be supported: stating questions and predictions, along with
evidence-based rationales, derived from text, tables, graphs, and/or diagrams
Allowable Item Types:
MC
TEI

Page 104
Model Item Descriptions for HS-LS3-1:
# Item
Type DOK
Model Stem
(Items ask students to...) Response Characteristics*
1 MC
1 or 2 per
complexity
Identify which question about
heritability of a trait can be answered
by examining evidence from a
Punnett square, pedigree, or
karyotype.
[Based on the data, which question
about soybean plants can be
answered by using a karyotype
comparing the varieties of
soybeans?]
Key may focus on questions about inheritance
patterns identifiable through examination of DNA
similarities, generational inheritance patterns, or
predictive models/analysis based on parent
genotype.
Distractors may include inheritance patterns not
identifiable by examination of three generation
phenotypes or characteristics that are not heritable.
2 MC 2 Identify a question that tests the
conclusion or claim that a
characteristic can be inherited.
[Which question about the claim can
be answered by observing the
offspring characteristics?]
Key may focus on heritability or a specific genetic
inheritance pattern.
Distractors may include questions that do not
address the premise of the claim or that do not
demonstrate heritability of the characteristic.
3 MC 2 Predict the traits (disorders or
common traits) of offspring based on
their parents (genotypes, phenotypes,
chromosome code).
[Which group of children is most
likely to demonstrate the AB blood
type trait?]
[Which traits will all of the bull’s
offspring likely have as adult cattle?]
Key may focus on the distinctive inheritance of a
trait in preference to other traits or on patterns of
inheritance in offspring that demonstrate the
predictable heritability.
Distractors may include traits or offspring less
likely to inherit or unable to inherit the specified
trait.
4 MC 2 Identify which evidence is needed to
addresses a question about the
likelihood of inheritance of a trait
based on the parents’ genotypes.
[Which evidence is needed to answer
the student’s question about why
none of the first generation of
offspring will have the white coat
color trait?]
Key may focus on the evidence linking the parents’
genotype to the possible allele combinations that
may produce the trait.
Distractors may include the wrong evidence or
evidence that only partially answers the question.

Page 105
5 MC 2 or 3 per
logic of
distinctions
Identify questions that would
differentiate between cause and
correlation based on reasoning from
data about the heritability of a trait.
[Which question would identify
whether the distribution of the curled
leaf characteristic is due to
correlation or to a cause-effect
relationship?]
Key may focus on causation due to inheritance
from parents to offspring
and reasoning based on data evidence for this link.
Distractors may include the incorrect relationship
or the wrong reasoning for the relationship.
6 MC 2 or 3 per
complexity
and amount
of
explanation
required
Identify which of two or more
questions or predictions is best
supported by the data evidence (and
explain reasoning for why).
[Which inheritance question asked
by the two student groups can more
accurately be answered from the data
gathered?]
Key may focus on the supportive link between the
data and the question/ prediction presented.
Distractors may include statements that incorrectly
reason from the data or fail to have a
preponderance of support for the reasoning.
7 MC 2 or 3 per
evidence
complexity
Evaluate whether a question or
prediction can be addressed with the
information/evidence provided
and/or whether the question will
clarify/extend understanding of the
topic.
[Which statement is the best
evaluation of the students’ prediction
about the coat color of a colt born
from the roan mare?]
Key should focus on the quality of the question and
potential to be answered and/or provide useful
information (related to DCI content).
Distractors may include misconceptions and/or
invalid reasoning for the merit of a particular
question.
8 MC 2 Identify which question will provide
the best evidence to support a
specific cause-effect relationship
(i.e., which inheritance pattern
applies).
[Which of these questions will
provide the best evidence that pod
color is caused by dominant-
recessive inheritance?]
Key should focus on questions eliciting data that
show a specific cause-effect relationship due to a
predictable inheritance pattern.
Distractors may include questions that will not
elicit data/observations to provide evidence for a
genetic cause-effect relationship, such as
observations of other crosses, different populations,
other traits, etc.

Page 106
9 TEI 2 or 3 per
complexity
and
reasoning
required
Sort questions that allow students to
distinguish correlation from
causation.
[Using the data from the study,
classify questions related to
pedigrees, percent traits/phenotypes,
etc., as being able to distinguish
correlation or causation with the data
gathered in answering the question.]
Drag-drop, drop-down, or match interaction.
Reasoning associations may be incorporated in
some items.
Correct responses show proper classifications for
questions distinguishing correlation vs. causation.
Partial credit would be awarded for a subset of
correct responses.
*Response options can make use of Student Misconceptions (examples of scientifically incorrect
assumptions) related to this performance expectation; references to misconceptions are listed in
the links below:
From http://assessment.aaas.org:
The information in the DNA molecules of an organism does not affect the functions of an organism’s
cells or the physical characteristics of the organism.
Genes are traits.
The timing of the occurrence of an environmentally induced characteristic will affect whether the
characteristic is transmitted to offspring (i.e., the age at which an organism acquires an environmentally
induced characteristic will affect whether the characteristic is passed on to its offspring). For example, if
a father lost a finger as a child, he will pass the missing finger trait to his children, but if he lost his finger
as an adult he will not pass the missing finger to his children.
From http://www.carolina.com/teacher-resources/Interactive/5-common-misconceptions-in-genetics/tr10631.tr:
Students often confuse genetic terms (e.g., chromosomes are genes, chromosomes and genes are traits).
A dominant trait is the most likely to be found in the population (and recessive traits are expressed to a
lesser degree than dominant traits).
Students may also believe the following:
All characteristics of organisms are traits (heritable).

Page 107
Heredity: Inheritance and Variation of Traits: HS-LS3-2 back to Item Specifications list
HS-LS3-2. Make and defend a claim based on evidence that inheritable genetic variations may result
from: (1) new genetic combinations through meiosis, (2) viable errors occurring during replication,
and/or (3) mutations caused by environmental factors.
OASS Clarification Statement:
Emphasis is on using data to support arguments for the way variation occurs.
OASS Assessment Boundary:
Assessment does not include the phases of meiosis or the biochemical mechanisms of specific steps in the
process.
Science & Engineering
Practice:
Engaging in Argument from
Evidence
Make and defend a
claim based on
evidence about the
natural world that
reflects scientific
knowledge, and
student-generated
evidence.
Disciplinary Core Idea:
LS3.B: Variation of Traits
In sexual reproduction,
chromosomes can sometimes
swap sections during the process
of meiosis (cell division), thereby
creating new genetic
combinations and thus more
genetic variation.
Although DNA replication is
tightly regulated and remarkably
accurate, errors do occur and
result in mutations, which are
also a source of genetic variation.
Environmental factors can also
cause mutations in genes, and
viable mutations are inherited.
Environmental factors also affect
expression of traits, and hence
affect the probability of
occurrences of traits in the
population. Thus the variation
and distribution of traits observed
depends on both genetic and
environmental factors.
Crosscutting Concept:
Cause and Effect
Empirical evidence
is required to
differentiate
between cause and
correlation and make
claims about specific
causes and effects.
In Lay Terms:
Students should be able to make and defend claims about how variations in DNA sequences and
environmental factors may affect the expression of traits in organisms and result in multiple sources of
variation with populations. Variation in individuals can result from different combinations of the genetic
material of parents. Individual variation can also be caused by errors made while cells are copying genetic

Page 108
material (DNA). Cells have mechanisms to check for mistakes, but some mistakes go undetected or
uncorrected. Environmental factors, such as temperature, ultraviolet light, and exposure to certain
chemicals, may cause individual variation.
Cluster Clarifications:
To address the CCC, stimuli and items should contain empirical evidence relating to claims or
reasoning.
Cluster Stimulus Attributes:
Typical stimulus elements:
models showing crossing over/mutation/replication error examples
tables containing data related to variations and offspring genotype/phenotype or
gene/chromosome/mutation frequency
text descriptions of experimental designs/procedures/results
Possible contexts:
models that demonstrate how meiosis leads to genetic variation due to random assortment
diagrams depicting crossing over of chromosomes during meiosis
graphics that represent coding errors during replication
research, investigation, and data that indicate genetic variations resulting from environmental
factors
data that identify patterns in DNA replication errors
Content and evidence to be included: models/diagrams, graphs, and scientific investigation scenarios to
provide data for claims, evidence, and reasoning
Types of student responses that need to be supported: making, evaluating, and/or revising claims, with
evidence and reasoning based on data and models related to sources and expressions of genetic variation
Allowable Item Types:
MC
TEI

Page 109
Model Item Descriptions for HS-LS3-2:
# Item
Type DOK
Model Stem
(Items ask students to...) Response Characteristics*
1 MC 1 or 2 per
depth of
claim and
evidence
Using a meiosis/chromosome model and
data for variation in offspring, identify
which claim explaining how meiosis
leads to genetic variation is supported by
the evidence.
Key may focus on recombination
(independent assortment) or crossing over
outcomes.
Distractors may include explanations of
results not related to the meiosis process or
explanations of outcomes not related to
variation.
2 MC 2 Using data that illustrate patterns in
DNA replication and possible errors,
make, defend, or reject a claim regarding
the probable effect on offspring.
[Based on the replication pattern shown
in the data, how will the offspring of this
parent cell be affected?]
Key may focus on the appearance, effect, or
distribution of results of replication errors
on offspring.
Item may be in the context of sexual or
asexual reproduction (and distinguishing
how the mutation will/will not be passed
on.)
Distractors may include patterns or
combinations that have no effect or do not
have the specified effect, or on claims that
are unsupported.
3 MC 2 or 3 per
claim/
reasoning
complexity
Identify or describe the data support or
reasoning for a claim, using evidence
about environmental factors that
influence genetic variation.
[Which data from the study of the
mosquitoes’ resistance support the claim
made by the students?]
Key may focus on the most relevant
variable and results that support the claim
presented.
Distractors may include data/reasoning that
does not support the claim or that provides
only partial support of the claim.
4 MC 2 or 3 per
claim/
reasoning
complexity
Identify or describe the reasoning from
investigative evidence that best supports
the claim/conclusion for a result of a new
genetic combination in offspring or
succeeding generation(s).
[Based on the research data, which
reasoning best supports the scientists’
claim about the effect of independent
assortment on the goose population?]
Key may focus on reasoning from empirical
data supporting a redistribution of traits in
offspring/F2 generations.
Distractors may include invalid or
unsupported reasoning.

Page 110
5 MC 2 Identify or evaluate data support for a
claim about predicted results of a cross
based on a model of crossing over during
meiosis.
[Based on the crossing over model,
which statement best describes the data
support for the students’ claim regarding
the cross of the two parents (one parent
having the given trait)?]
Key may focus on relevant data showing the
appearance rate or frequency of traits
resulting from crossing over in populations
or generations.
Distractors may include unsupported claims
or claims based on reasoning not included
in or relevant to the data.
6 MC 2 Identify empirical evidence that supports
a claim for what genetic event caused the
appearance or redistribution of a trait in a
population or succeeding generations.
[What statement best describes the
evidence that supports the student’s
claim that the deleterious mutation was
the result of a replication error?]
[Which reasoning best supports the
scientists’ claim about the origin of the
mutation in the second and third
generations?]
Key may focus on data supporting the claim
or reasoning for the claim (using data
evidence/stimulus information and
knowledge of the DCI.
Distractors may include unrelated or
insignificant data.
7 MC 2 Identify the evidence that best rejects a
claim for the influence of the
environment on the expression of a trait.
[Which evidence best rejects the claim
that temperature is not a significant
factor that determines the coat color of
the snowshoe hare?]
Key may focus on data support for a
counterclaim based on the evidence.
Distractors may include evidence not based
on the data or unsupported by the data.
8 MC 2 Identify additional evidence that would
support the claim that an environmental
factor caused a viable gene mutation.
[Which additional evidence would
support the student’s claim that
ultraviolet radiation caused a mutation in
the bacteria’s DNA?]
Key may focus on evidence that is specific
to the data (e.g., mutation rates increased by
5% while other variables did not change) or
more general data/evidence needed (e.g.,
evidence about mutation rate vs. other
measures/variables).
Distractors may include other
information/data that do not support the
claim.

Page 111
9 MC 3 Distinguish the evidence and/or
reasoning from evidence that best
improves/supports the scientific
reliability of a claim related to variation
caused by a meiosis process.
[Which evidence and reasoning would
improve the claim made by the students
about the source of the variation in the
fruit fly populations?]
[Which evidence and reasoning would
improve the reliability of the scientists’
claim about why meiosis contributes to
the variation in Amazon guppies?]
Key may focus on data/reasoning that offers
better control of the variables, support from
additional studies, or repetition of the
investigation.
Distractors may include evidence/ reasoning
that does not improve the reliability or
evidence unrelated to the claim.
10 MC 2 Revise a claim about the mechanism by
which a trait is passed based on evidence
from a study/observation.
[How should the claim (about how the
trait was passed from parent rats to baby
rats) be revised based on data from the
study?]
Key may focus on additional or alternative
statements incorporating the impact of the
new evidence on the original claim.
Distractors may include unsupported/
unrelated revisions or revisions contradicted
by the evidence.
11 MC 2 or 3 per
required
claim-
reasoning
elaboration
Compare multiple claims about varied
inheritance of DNA via meiotic
processes or mutations in terms of their
accuracy, supporting evidence, and/or
reasoning for the claims.
[Which of the scientists’ claims about the
impact of mutations on the genetic
variation in the population is better
supported and why?]
Key may focus on merit due to better data
support or reasoning.
Distractors may include incorrect
identification of the more supported claim
and/or claim support inconsistent with the
evidence or logical reasoning.
12 TEI 2 or 3 per
required
claim-
reasoning
elaboration
Compare multiple claims about varied
inheritance of DNA via meiotic
processes or mutations in terms of their
accuracy, supporting evidence, and/or
reasoning for the claims.
[Order the three claims from best to least
supported by the data.]
Drag-drop interaction.
Correct responses show claims in specified
order.
Partial credit would be given for prioritized
portions of the sequences (e.g., able to
distinguish which claim is most supported).

Page 112
13 MC 1 or 2 per
evidence
context
Identify evidence that supports a claim
for the occurrence of crossing over based
on two comparative lines of offspring.
[What evidence supports the student’s
claim that crossing over occurred in
population #2?]
Key may focus on data that show traits
controlled by genes on the same
chromosome being inherited in a pattern
that does not resemble either parent’s gene
pattern.
Distractors may include unrelated or
insignificant data.
*Response options can make use of Student Misconceptions (examples of scientifically incorrect
assumptions) related to this performance expectation; references to misconceptions are listed
below:
From http://assessment.aaas.org:
The information in the DNA molecules of an organism does not affect the functions of an organism’s
cells or the physical characteristics of the organism.
Genes are traits.
The timing of the occurrence of an environmentally induced characteristic will affect whether the
characteristic is transmitted to offspring (i.e., the age at which an organism acquires an environmentally
induced characteristic will affect whether the characteristic is passed on to its offspring). For example, if
a father lost a finger as a child, he will pass the missing finger trait to his children, but if he lost his finger
as an adult he will not pass the missing finger to his children.
From http://www.carolina.com/teacher-resources/Interactive/5-common-misconceptions-in-genetics/tr10631.tr:
Students often confuse genetic terms (e.g., chromosomes are genes, chromosomes and genes are traits).
A dominant trait is the most likely to be found in the population (and recessive traits are expressed to a
lesser degree than dominant traits).
Students may also believe the following:
All characteristics of organisms are traits (heritable).

Page 113
Heredity: Inheritance and Variation of Traits: HS-LS3-3 back to Item Specifications list
HS-LS3-3. Apply concepts of statistics and probability to explain the variation and distribution of
expressed traits in a population.
OASS Clarification Statement:
Emphasis is on distribution and variation of traits in a population and the use of mathematics (e.g.,
calculations of frequencies in Punnett squares, graphical representations) to describe the distribution.
OASS Assessment Boundary:
The assessment should provide evidence of students’ abilities to use mathematical reasoning to explain the
variation observed in a population as a combination of genetic and environmental factors. Hardy-Weinberg
calculations are beyond the intent.
Science & Engineering Practice:
Analyzing and Interpreting Data
Apply concepts of statistics
and probability (including
determining function fits to
data, slope, intercept, and
correlation coefficient for
linear fits) to scientific and
engineering questions and
problems, using digital tools
when feasible.
Disciplinary Core Idea:
LS3.B: Variation of Traits
Environmental factors
also affect expression of
traits, and hence affect
the probability of
occurrences of traits in
the population. Thus the
variation and distribution
of traits observed
depends on both genetic
and environmental
factors.
Crosscutting Concept:
Scale, Proportion, and
Quantity
Algebraic thinking is used
to examine scientific data
and predict the effect of a
change in one variable on
another (e.g., linear
growth vs. exponential
growth).
In Lay Terms:
Students should be able to manipulate and analyze mathematical data to support/explain the effect of
genetic inheritance and environmental factors on variation and distribution of traits in populations.
Cluster Clarifications:
The focus should be on the conceptual understanding rather than knowledge of specific
terminology (e.g., directional, stabilizing, disruptive selection; frequency distribution; etc.)
Algebraic thinking in this context includes interpretation of Punnett square ratios, trends/shifts in
population distribution graphs, and interpretation of comparative data for resources/selective
factors and trait expression. Students are not actually expected to calculate or identify function
fitness, slopes, intercepts, or correlation coefficients (listed in the Science and Engineering Practice
dimension).
In order to address the CCC, stimuli and items should focus on the relationship between
independent variables and trait frequency/distribution in an investigative context.

Page 114
Cluster Stimulus Attributes:
Typical stimulus elements:
tables, charts, summaries with percentages or ratios (genotypes and/or phenotypes in a population)
Punnett squares
graphical representations of directional/stabilizing/disruptive selection
histograms of species’ trait frequencies or distributions
range distribution maps of species trait variations in populations
Possible contexts:
literature examples containing descriptions of genotype and phenotype percentages of organisms as
they relate to variations and/or environmental conditions
student investigations of phenomena including mathematical claims based on Punnett squares in
contrast to or in combination with environmental data
scientific studies including graphical representations of examples of directional, stabilizing, or
disruptive selection along with information about the function of selective pressure(s)
student investigations of advantageous/disadvantageous adaptations in changing environments or
between contrasting environments for a species of interest
surveys/summaries of scientific studies regarding the impact of environment/disease/predators/food
on the survival of organisms with advantageous/disadvantageous traits and the distribution of those
traits as a consequence
Content and evidence to be included: mathematical data about distribution and variation of traits
Types of student responses that need to be supported: analyzing data and making conclusions/supporting
explanations about the influence of inheritance and environment on trait distribution according to the data
Allowable Item Types:
MC
TE

Page 115
Model Item Descriptions for HS-LS3-3:
# Item
Type DOK
Model Stem
(Items ask students to...) Response Characteristics*
1 MC 1 or 2 per
data
complexity
State trends, observations, or direct
conclusions about trait variation and
distribution as shown by the data/graphs
from an investigation.
[What trend is shown in the frequency of
the coat color of the field mice before and
after the introduction of flying drones into
the study area?]
[Which conclusion is best supported by
the graphs of lizard body size versus
clutch survival on each island?]
Key may focus on changes/contrasts in
percentages, frequency distributions, or
ranges of distribution for a trait in a
population.
Distractors may include statements about the
trait(s) or populations that are unrelated to or
not supported by the variable relationships in
the data.
2 MC 1 or 2 per
depth of
factor
analysis
Use empirical data to make a conclusion
about cause-effect relationships for trait
distribution or variation.
[Which environmental factor most likely
causes the gray color phase in the western
screech owl population?]
[Which statement best describes the
relationship between habitat type and
color variation in the screech owl
population?]
[Based on the data, what factor is most
responsible for the distribution pattern of
the different whitetail sub-species shown
on the map?]
Key may focus on descriptions of the cause
and/or effect illustrated between independent
and dependent variables.
Distractors may include environmental factors
that do not influence the relationship or
factors that are not distinctly environmental.
3 MC 2 or 3 per
number of
relevant
factors
Use empirical data to make a conclusion/
claim about the degree of variation or
distribution of traits.
[Which claim about the variation of traits
in the owl population is best supported by
the probability shown in the Punnett
square?]
Key should involve some level of data
inference or analysis to distinguish it from
model stem #1.
Distractors may include claims unsupported
by the Punnett square evidence.

Page 116
4 MC 2 Describe or explain the relevance of data
used to construct an explanation for trait
distribution/variation measured in an
investigation.
[How does the trend shown in the graph
(directional selection) help explain the
distribution of the gray phase in the owl
population?]
Key may focus on how/why the data support
or refute the claim/argument made in the
explanation.
Distractors may include data or explanation
elements that are unrelated or irrelevant.
5 MC 3 Describe, compare, or distinguish the
effect of genetic versus environmental
factors on a trait.
[According to the graph and the Punnett
square, which of the following best
describes the influence of climate on
expression of the gray feather color trait
in this screech owl population?]
Key may focus on comparing or
distinguishing genetic causation from
environmental factor correlation based on the
data (as both genetic and environmental
factors influence expression).
Distractors may include descriptions of effects
that do not change expression of the trait or of
effects that change the expression of the trait
in other ways.
6 MC 2 Describe how the data support a given
claim or explanation about trait variation
or distribution.
[How does the change in the distribution
of the gray color phase trait in screech
owls support the claim that fires became
more frequent in the owl’s environment
after (year)?]
Key may focus on the logical connection
between the data and the claim/ explanation.
Distractors may include statements
connecting the trait distribution change
erroneously to factors other than the
environment or to factors resulting from
rather than causing the distribution pattern.
7 MC 2 or 3 per
data
complexity
Relate the validity or accuracy of
statistical data to the reliability of a
claim/conclusion about distribution or
inheritance of traits.
[How does the color phase distribution
data affect the reliability of the claim that
habitat type affects distribution of this
trait in the owl population?]
Key may focus on data measurement or
reporting that demonstrates either
accuracy/validity or the lack thereof in
relation to the claim/conclusion
being made.
Distractors may include characteristics of the
color phase distribution data that do not affect
reliability or that affect the reliability of a
different claim.

Page 117
8 MC 2 Represent or reorganize empirical data in
a different form to show trend, frequency,
distribution, etc. based on the variables of
the investigation.
[Which graph illustrates the frequency
distribution pattern of the dark versus buff
coat color trait shown in the data table?]
Key may focus on converting table data to
graphs or map data to tables/charts/graphs.
Distractors may include trends, frequencies,
or distribution patterns of other data, or may
include incorrect patterns or trends.
9 TEI 2 Represent or reorganize empirical data in
a different form to show trend, frequency,
distribution, etc. based on the variables of
the investigation.
[Show the correct frequency distribution
graphs and the explanation for each
pattern in the correct places on the data
chart for both species.]
Drag-drop interaction.
Match interaction might alternately be used in
some cases.
Correct responses show
selection/identification/association of correct
data representations or transformations.
Partial credit would be awarded for a subset
of correct responses.
10 MC 1 or 2 per
calculation
required
Calculate relevant averages, changes,
percentage, ratio, etc. to analyze and
apply the data from an investigation.
[Based on the genetics that determine the
seed type of the blue grama grass plant,
what is the approximate predicted
frequency of awnless seeds in a wild
population of blue grama grass?]
Key may focus on calculating averages,
percentages, or ratios to determine frequency
or distribution patterns of traits in a
population.
Distractors may include ratios, percentages,
comparative values based on common
misconceptions, or common application
errors.
*Response options can make use of Student Misconceptions (examples of scientifically incorrect
assumptions) related to this performance expectation; references to misconceptions are listed in
the links below:
From http://assessment.aaas.org:
The information in the DNA molecules of an organism does not affect the functions of an organism’s cells or the
physical characteristics of the organism.
Genes are traits.
The timing of the occurrence of an environmentally induced characteristic will affect whether the characteristic
is transmitted to offspring (i.e., the age at which an organism acquires an environmentally induced characteristic
will affect whether the characteristic is passed on to its offspring). For example, if a father lost a finger as a
child, he will pass the missing finger trait to his children, but if he lost his finger as an adult he will not pass the
missing finger to his children.
From http://www.carolina.com/teacher-resources/Interactive/5-common-misconceptions-in-genetics/tr10631.tr:
Students often confuse genetic terms (e.g., chromosomes are genes, chromosomes and genes are traits).

Page 118
A dominant trait is the most likely to be found in the population (i.e., always more common than recessive traits
in a population) (and recessive traits are expressed to a lesser degree than dominant traits).
Students may also believe the following:
All characteristics of organisms are traits (heritable).
Expression of traits is controlled only by genes.
Genetic makeup and the expression of traits can only change through mutation.
New traits will automatically become more common in a population.
Organisms act or will themselves to change genetically over time (Lamarck’s theory).
Genes mutate in favorable ways as a response to environmental change.

Page 119
Sample Cluster for HS-LS3-3:
Meadow voles are small rodents similar to mice that are found in grassy areas. They store food and give birth to
their young in underground burrows. Meadow voles usually have dark fur, but they can sometimes have white fur.
Voles with white fur are called albinos. The genetic cause of the albino trait is the recessive form of a gene for fur
color in voles. The dominant form of the gene codes for dark fur.
Albino voles are typically rare and usually have low survival rates in the population. Scientists recorded the
distribution of fur color traits in a vole population in one particular habitat, as shown in the graph.
Because the data were not what the scientists expected, they decided to investigate how genetic and
environmental factors affect trait distribution in the vole population.

Page 120
Item 1
Item Type: TEI
DOK 2
Scoring:

Page 121

Page 122
Item 2
Item Type: MC
DOK 3
Key: B
When thinking about environmental factors to explain the data in the graph “Fur Color Distribution in a Vole
Population,” scientists observed that there were many plants growing close together in the habitat. The scientists
hypothesized that the thick plant cover allowed albino voles to be hide from predators, and that this caused the fur
color distribution seen in the vole population.
The scientists set up an experiment to test how the spacing of plants in an area affects the abundance of dark-furred
and albino voles. In late spring, scientists released equal numbers of dark-furred and albino voles into habitats
with different spacing and numbers of plants. Three months later, they set traps to capture some of the voles
remaining in each area.
Which graph shows results that best support the scientists’ hypothesis?

Page 123
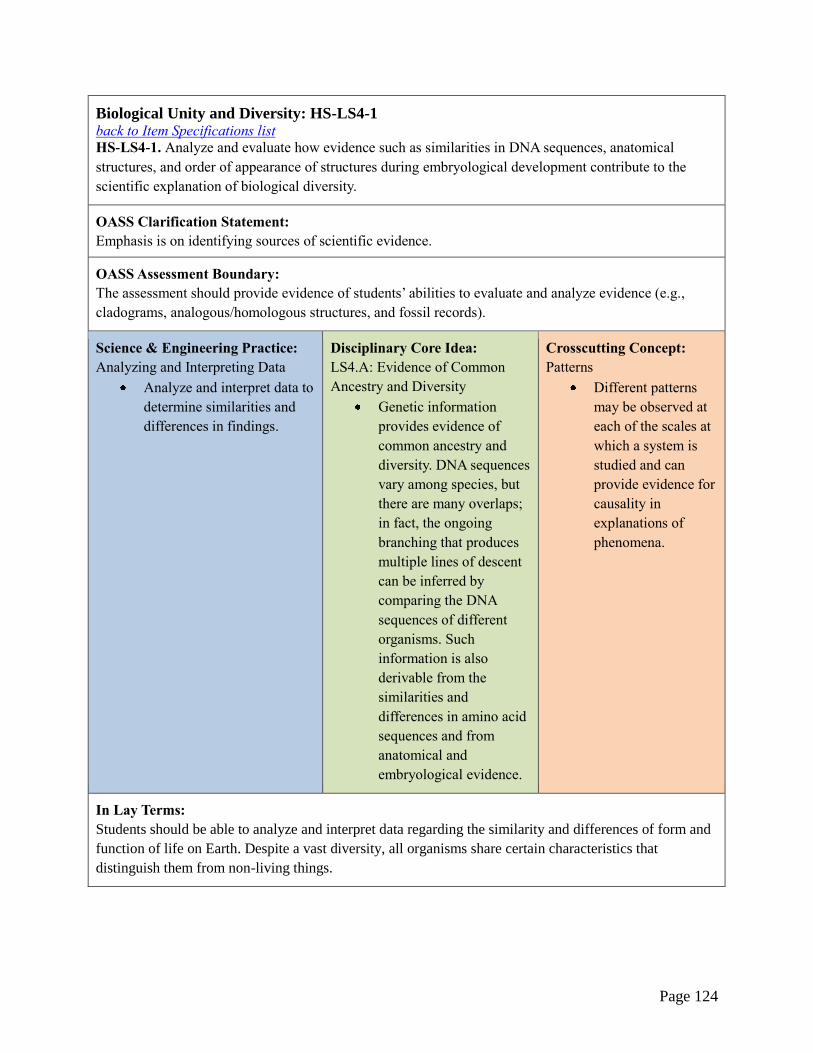
Page 124
Biological Unity and Diversity: HS-LS4-1 back to Item Specifications list
HS-LS4-1. Analyze and evaluate how evidence such as similarities in DNA sequences, anatomical
structures, and order of appearance of structures during embryological development contribute to the
scientific explanation of biological diversity.
OASS Clarification Statement:
Emphasis is on identifying sources of scientific evidence.
OASS Assessment Boundary:
The assessment should provide evidence of students’ abilities to evaluate and analyze evidence (e.g.,
cladograms, analogous/homologous structures, and fossil records).
Science & Engineering Practice:
Analyzing and Interpreting Data
Analyze and interpret data to
determine similarities and
differences in findings.
Disciplinary Core Idea:
LS4.A: Evidence of Common
Ancestry and Diversity
Genetic information
provides evidence of
common ancestry and
diversity. DNA sequences
vary among species, but
there are many overlaps;
in fact, the ongoing
branching that produces
multiple lines of descent
can be inferred by
comparing the DNA
sequences of different
organisms. Such
information is also
derivable from the
similarities and
differences in amino acid
sequences and from
anatomical and
embryological evidence.
Crosscutting Concept:
Patterns
Different patterns
may be observed at
each of the scales at
which a system is
studied and can
provide evidence for
causality in
explanations of
phenomena.
In Lay Terms:
Students should be able to analyze and interpret data regarding the similarity and differences of form and
function of life on Earth. Despite a vast diversity, all organisms share certain characteristics that
distinguish them from non-living things.

Page 125
Cluster Clarifications:
Avoid examples comparing humans to other organisms.
Time scale, comparative patterns, and causality are important focal points for this performance
expectation.
Cluster Stimulus Attributes:
Typical stimulus elements:
text descriptions of evolutionary patterns/history of organisms’ structures, behaviors, and
adaptations
diagrams/photographs of organisms’ structures
data tables, graphs, or models of DNA sequence distributions/patterns
diagrams/charts/tables that give evidence of organism evolution/relatedness (e.g., cladogram,
analogous/homologous structures, fossil records)
Possible contexts:
comparisons of DNA/amino acid sequences of various organisms to determine degrees of
relatedness
comparisons of characteristics and time scale data for modern species and/or those found in the
fossil record to evaluate organism relatedness and evolutionary patterns
analysis of cladograms along with supporting genetic/physiological evidence to explain common
or divergent ancestry
analysis of vestigial, analogous, homologous, and/or embryological structures to infer patterns of
ancestry/evolution
Content and evidence to be included: data regarding various evidence (e.g., DNA sequences, anatomical
structures, fossils, development) to analyze in terms of organisms’ relatedness and ancestry
Types of student responses that need to be supported: analyzing and interpreting data to describe, explain,
and evaluate evidence for relatedness of organisms and biological diversity
Allowable Item Types:
MC
TEI

Page 126
Model Item Descriptions for HS-LS4-1:
# Item
Type DOK
Model Stem
(Items ask students to...) Response Characteristics*
1 MC 2 Analyze similarities/differences in
DNA and amino acid sequence
evidence among various modern
species to determine patterns of origin
or diversification over time.
[Based on the DNA evidence, which
species evolved from the same
common ancestor?]
[Which conclusion about reptile
evolution is best supported by the
reptiles’ genetic data?]
Key may focus on a pattern showing
diversification or similar ancestry based on
time scale evidence.
Distractors may include incorrect
descriptions of patterns or origins/ diversity.
2 MC 2 Analyze and evaluate specific evidence
of DNA and amino acid sequences to
explain genetic similarities that
contrast with variations in physical
form among different species.
[Which DNA evidence from the study
rejects the relationships in the
cladogram based on physical
similarities?]
Key may focus on how DNA/amino acid
evidence contrasts with physical evidence.
Distractors may include
misinterpretations/misconceptions regarding
DNA patterns or incorrect explanations of the
evidence.
3 MC 2 Analyze current data to support
explanations of the similarities and
differences of organisms illustrated by
patterns of genetics, anatomical
structures, and embryonic development
among species.
This is a broadly focused stem asking for
direct comparisons of current data to
distinguish relatedness of species/ genera.
Key may focus on data distinctions that
illustrate closeness or gaps in
relatedness/evolution of the organisms.
Distractors may include incorrect
interpretations of patterns or incorrect
explanations of organism relationships.

Page 127
4 MC 1 or 2 per
necessary
distinctions
Compare evidence of analogous,
homologous, and vestigial structures to infer
possible origins or ancestral patterns of
evolution.
[Which relationship shown in the data
suggests that whale ancestors once lived on
land?]
[Which statement about amphibian ancestry
is best supported by the structures of the
developing frog and fish?]
This stem focuses on comparisons between
two data sets for the same organism(s). Key
may focus on similarities that illustrate
relatedness or common origin/evolution.
Distractors may include inferences that are
not supported by the data or interpretations
of the data that do not infer correct
relationships.
5 MC 2 Analyze cladograms (or other evolutionary
models) to describe similarities and
differences in the ancestry/origins of
species, genera, or families.
[Based on the cladogram in study #2, which
modern species evolved first?]
[Which relationship between modern
species is supported by the scientists’
evolutionary model?]
Key may focus on correct evaluation of the
model to make the necessary distinction of
relatedness/diversity.
Distractors may include misinterpretations
or misconceptions about relationships
shown in the model.
6 MC 2 or 3 per
fossil record
and
relationships
Compare species via the time scale of their
appearance(s) in the fossil record to support
an explanation of similar or different
origins/ancestry.
[Based on the data table, which model best
illustrates the order in which the snail
species evolved?]
[Which evolutionary relationship between
flying birds and flying reptiles is supported
by the fossil data?]
Key may focus on fossil evidence to support
the order of appearance of organisms, their
relatedness, or their evolutionary pathway.
Distractors may include misinterpretations
or misconceptions about fossil sequences or
the superposition logic for the explanation.
7 MC 2 Identify order or sequence of diagrams to
show how an organism changed over time
based on empirical evidence of ancestry or
evolution.
[Which sequence shows the evolution of the
horse over time based on the fossil
evidence?]
Key may focus on sequences showing
progressive evolution in accordance with the
data. Data may include time scale,
structures, or genetic comparisons as a
reference for sequencing.
Distractors may include random ordering or
ordering based on misinterpretations or
misconceptions regarding the evidence.

Page 128
8 TEI 2 Order diagrams to show how an organism
changed over time based on empirical
evidence of ancestry or evolution.
[Use the pictures to show how the changes
in the organism occurred over time.]
Drag-drop interaction.
May also be completed via match or drop-
down interaction (to indicate sequence
number).
Correct responses show accurate selection,
placement, and order of organisms. (In some
items, student may need to distinguish
between options not needed/used).
Partial credit would be awarded for a subset
of correct responses.
9 MC 2 or 3 per
complexity
Determine the correct position of one or
more organisms on a cladogram from
provided genetic/fossil data.
[Based on the information shown in the data
table and diagram, which number on the
cladogram represents the most likely
position of marine turtles?]
Key may focus on positions distinguished
by relationships shown in the data.
Distractors may include positions
inconsistent with the data.
10 MC 2 or 3 per
complexity
Identify which diagram shows the
evolutionary relationships between
organisms given data about their
genetics/fossils/anatomy.
[Based on the evidence provided, which
evolutionary tree shows the correct
relationships between the organisms?]
Key should show a correct arrangement
based on the relatedness/origins shown in
the data.
Distractors may include combinations of
incorrect and correct placements based on
misconceptions or erroneous deductions.
11 TEI 2 or 3 per
complexity
Construct a diagram or show the correct
position of organisms (two or more) on a
cladogram, evolutionary tree, etc. using data
about their genetics/fossils/anatomy.
[Based on the data, place the four species
into their correct positions on the
cladogram.]
Drag-drop interaction.
May also be completed via match or drop-
down interaction (to indicate labeled
position).
Correct responses show accurate placement
of organisms.
Partial credit would be awarded for a subset
of correct responses.

Page 129
12 MC 3 Interpret data in range or distribution maps
of fossil organisms along with
genetic/anatomy data to support/ reject
claims for common ancestry or lines of
evolution.
[Based on the data shown in the table and
the map, which conclusion is best supported
about the evolution of flightless birds?]
Key may focus on patterns of evolution
reflected in geographic or time scale
distribution.
Distractors may include misinterpretations
or misconceptions relating to the data or its
implications.
13 MC 1 or 2 per
complexity
Describe simple patterns and trends in the
evolution of a group of organisms based on
empirical data.
[What pattern is shown in the evolution of
hooved mammals?]
Key may focus on traits or characteristics
that undergo observable patterns of change
through the evolutionary time scale.
Distractors may include characteristics/
traits of organisms unrelated to the
evolutionary pattern/trend.
14 MC 2 or 3 per data
complexity
Describe the additional data needed to
support a given conclusion about the
relatedness or evolution of an organism
based on partial data given.
[Which additional information would be
needed to support the students’ conclusion
about the evolution of pandas and bears?]
Key may focus on data evidence in another
form (genetic, fossil, anatomy) or more
accurate/complete data.
Distractors may include irrelevant data, data
that are less useful in supporting the
conclusion, or data that refute/reject the
conclusion.
*Response options can make use of Student Misconceptions (examples of scientifically incorrect
assumptions) related to this performance expectation; references to misconceptions are listed in
the links below:
From
http://www.montana.edu/kalinowski/KalinowskiReprints/2011_Andrews_et_al_AreHumandEvolving_EvoEduOutreach.pdf:
Students believe change happens as a result of need or desire.
Students believe change has always occurred and always will occur.
Students believe traits that are used are retained and those traits that are not used are lost.
Students believe selection only occurs when organisms die.
Students believe all organisms in a species are essentially alike.
Students believe evolution equals speciation.

Page 130
Biological Unity and Diversity: HS-LS4-2 back to Item Specifications list
HS-LS4-2. Construct an explanation based on evidence that biological diversity is influenced by (1) the
potential for a species to increase in number, (2) the heritable genetic variation of individuals in a species
due to mutation and sexual reproduction, (3) competition for limited resources, and (4) the proliferation
of those organisms that are better able to survive and reproduce in the environment.
OASS Clarification Statement:
Emphasis is on using evidence to explain the influence each of the four factors has on number of
organisms, behaviors, morphology, or physiology in terms of ability to compete for limited resources and
subsequent survival of individuals and adaptation of species. Examples of evidence could include
mathematical models such as simple distribution graphs and proportional reasoning.
OASS Assessment Boundary:
Assessment does not include genetic drift, gene flow through migration, and co-evolution.
Science & Engineering Practice:
Constructing Explanations and
Designing Solutions
Construct an explanation
based on valid and reliable
evidence obtained from a
variety of sources (including
students’ own investigations,
models, theories,
simulations, peer review)
and the assumption that
theories and laws that
describe the natural world
operate today as they did in
the past and will continue to
do so in the future.
Disciplinary Core Idea:
LS4.B: Natural Selection
Natural selection occurs
only if there is both (1)
variation in the genetic
information between
organisms in a population
and (2) variation in the
expression of that genetic
information—that is, trait
variation—that leads to
differences in
performance among
individuals.
Crosscutting Concept:
Cause and Effect
Empirical evidence
is required to
differentiate
between cause and
correlation and make
claims about specific
causes and effects.
In Lay Terms:
Students should be able to construct and defend explanations using evidence to show how genetic
variation leads to differences in the survival and reproduction success of individuals having different
traits within populations. This phenomenon is driven by the degree of genetic variation present, the
reproductive capacity of the species, competition for resources, and the favorability of particular traits for
individuals.
Cluster Clarifications:
Avoid using artificial selection examples.

Page 131
Cluster Stimulus Attributes:
Typical stimulus elements:
mathematical models, including distribution graphs/models of population density (various
distribution patterns)
numerical data as a basis for proportional reasoning
text scenarios of natural selection examples, including factors and survival/reproduction
outcomes
Possible contexts:
research/investigations about natural selection as an explanation for biological diversity
heritable genetic variation of individuals in a species due to mutation and sexual reproduction as
an explanation for biological diversity
research/investigations bout competition as an explanation for biological diversity
research/investigations about proliferation of the organisms that are better suited to survive and
reproduce as an explanation for biological diversity
Content and evidence to be included: text, models, tables, and graphical representations as evidence for
patterns of traits within populations or differential survival due to specific traits leading to increased
biological diversity
Types of student responses that need to be supported: explaining the factors that influence biological
diversity (i.e., natural selection), including analysis and evaluation of results and observations
Allowable Item Types:
MC
TEI

Page 132
Model Item Descriptions for HS-LS4-2:
# Item
Type DOK
Model Stem
(Items ask students to...) Response Characteristics*
1 MC 2 Based on evidence, explain how/why
individuals that have a competitive
advantage can survive and reproduce at a
higher rate.
[Based on the data in the table, why does
the percentage of green speckles increase
in the sunfish population?]
Key may focus on numerical data on survival or
population increases to support a trait that
conveys a competitive advantage.
Distractors may include explanations that
include misconceptions or errors regarding the
connection between competitive advantage and
increased survival or reproduction.
2 MC 1 or 2 per
evidence/
explanation
complexity
Identify evidence that supports an
explanation that DNA, mutations, or amino
acid sequences result in a physiological
difference that affects an organism’s
survival.
[Which data show that the mutation
provided future generations of bees a
survival advantage?]
Key may focus on a cause-effect relationship
between the specified trait and survival.
Distractors may include identification of
evidence that doesn’t support the survival
advantage or the trait as the cause.
3 MC 2 Use evidence to construct an explanation
that differential survival and reproduction
can lead to natural selection over time.
[Which statement best explains why the
small key deer body size resulted from
natural selection?]
Key may focus on examples of subspecies,
speciation, or redistribution of traits in a
population.
Distractors may include explanations without
data support or explanations that include
misconceptions about how differential survival
enables natural selection.
4 MC 2 Determine which explanation for why/
how genetic variation is necessary for
biological diversity to increase is supported
by the data.
[Based on the cheetah population and
genetic data, which statement about future
diversity in the African cheetah population
is best supported?]
Key may focus on data examples of a genetic
diversity decrease in isolated or diminished
populations, or on the inability of populations
with limited diversity to increase in diversity
despite population growth.
Distractors may include explanations that are
not supported by the data or that contain
misconceptions about variation and diversity.
5 MC 2 Determine whether data support or reject
an explanation for how/why mutation/
sexual reproduction impacts diversity.
[Which data best rejects the student’s
explanation about how the plant’s method
of reproduction influences the variety of
flower types?]
Key may focus on data that support or refute the
explanation based on the variation caused by
mutation/sexual reproduction.
Distractors may include inaccurate
support/refutation statements or statements that
neither support nor refute the explanation.

Page 133
6 MC 2 Identify the data support for an explanation
of diversity due to competition for
resources.
[Which data support the explanation about
how competition affects the diversity of
the ant population?]
Key may focus on data that show a relationship
between competition and diversity.
Distractors may include identification of
extraneous data or data that do not adequately
support the explanation.
7 MC 1 or 2 per
depth of
explanation
Identify appropriate explanations of cause-
effect relationships between genetic
variation, opportunity and ability of a
species to proliferate, and diversity.
[Which statement best explains the
relationship between the reproductive rate
of African elephants and the genetic
diversity shown in the data?]
Key may focus on relationships linking the
genetic or environmental cause to the diversity
effect.
Distractors may include statements that do not
sufficiently explain, statements that explain
alternate phenomena, or statements lacking
critical conceptual connections.
8 MC 2 or 3 per
complexity
of example
Use evidence to explain which diversity
mechanism(s) (reproductive capacity,
degree of variation, competition, or
favorability of traits) applies to the
situation cited in an example.
[Based on the data, which effect most
contributed to the increased variation in
guppy body coloration in the experiment?]
Key may focus on the mechanism(s) that most
significantly impacted a change in diversity
(greater or lesser).
Distractors may include explanations not
supported by the data or relating to a
mechanism without a significant effect.
9 MC 2 Identify evidence that supports a student
explanation for the favorability of a trait
leading to an increase in diversity.
[What evidence supports the students’
explanation for how crows that use traffic
nut-cracking techniques became more
common in urban areas?]
Key may focus on data evidence of increasing
diversity due to favorability of a trait.
Distractors may include data that do not provide
sufficient/valid evidence or data related to other
diversity factors.
10 MC 2 or 3 per
complexity
Provide additional clarification to improve
an explanation for a change in diversity
due to genetic or environmental factors.
[Which additional statement/clarification
will best improve the explanation for why
thicker fur was an advantage for the foxes
living in extreme climates?]
Key may focus on statements linking the factor
that influenced the change in diversity to the
increase or decrease in diversity, according to
the data evidence.
Distractors may include information/data/
statements that do not provide an improved
explanation.

Page 134
11 TEI 2 Construct a model of biodiversity by
placing the explanations for significant
influences appropriately in a flow chart
model.
[Using the provided statements, create a
flow chart model to explain which factors
influence biodiversity of this species.]
Drag-drop interaction.
Statements would relate to the factors listed in
the performance expectation (e.g., sexual
reproduction yields genetic variation,
competition allows the most fit individuals to
survive, faster reproduction rates encourage
variation).
Correct responses show a complete, accurate
model as explanation.
Partial credit would be awarded for a subset of
correct responses.
12 TEI 3 Construct an explanation for genetic
variation contributing to diversity by
providing a description, evidence, and
reasoning based on experimental data.
[Using the provided statements, construct
an explanation for the process by which
diversity in wild sunflowers may change.]
Drag-drop interaction.
Statement options would include descriptions,
evidence, and reasoning to be selected and
placed in cells of a table or flow chart.
Item can ask for multiple scenarios (e.g., two
different organisms, two different types of
change, etc.)
Correct responses show an accurate explanation
with all required components.
Partial credit would be awarded for a subset of
correct responses.
*Response options can make use of Student Misconceptions (examples of scientifically incorrect
assumptions) related to this performance expectation; references to misconceptions are listed in
the links below:
From
http://www.montana.edu/kalinowski/KalinowskiReprints/2011_Andrews_et_al_AreHumandEvolving_EvoEduO
utreach.pdf:
Students believe change happens as a result of need or desire.
Students believe change has always occurred and always will occur.
Students believe traits that are used are retained and those traits that are not used are lost.
Students believe selection only occurs when organisms die.
Students believe all organisms in a species are essentially alike.
Students believe evolution equals speciation.

Page 135
Biological Unity and Diversity: HS-LS4-3 back to Item Specifications list
HS-LS4-3. Apply concepts of statistics and probability to support explanations that organisms with an
advantageous heritable trait tend to increase in proportion to organisms lacking this trait.
OASS Clarification Statement:
Emphasis is on analyzing shifts in numerical distribution of traits and using these shifts as evidence to
support explanations for adaptations.
OASS Assessment Boundary:
The assessment should provide evidence of students’ abilities to analyze shifts in numerical distribution
of traits as evidence to support explanations. Analysis is limited to basic statistical and graphical analysis,
not gene frequency calculations.
Science & Engineering
Practice:
Analyzing and
Interpreting Data
Apply concepts of
statistics and
probability
(including
determining function
fits to data, slope,
intercept, and
correlation
coefficient for linear
fits) to scientific and
engineering
questions and
problems, using
digital tools when
feasible.
Disciplinary Core Idea:
LS4.B: Natural Selection
Natural selection occurs only if there is both
(1) variation in the genetic information
between organisms in a population and (2)
variation in the expression of that genetic
information—that is, trait variation—that leads
to differences in performance among
individuals.
The traits that positively affect survival are
more likely to be reproduced, and thus are
more common in the population.
LS4.C: Adaptation
Natural selection leads to adaptation, that is, to
a population dominated by organisms that are
anatomically, behaviorally, and physiologically
well suited to survive and reproduce in a
specific environment. That is, the differential
survival and reproduction of organisms in a
population that have an advantageous heritable
trait leads to an increase in the proportion of
individuals in future generations that have the
trait and to a decrease in the proportion of
individuals that do not.
Adaptation also means that the distribution of
traits in a population can change when
conditions change.
Crosscutting Concept:
Patterns
Different patterns
may be observed
at each of the
scales at which a
system is studied
and can provide
evidence for
causality in
explanations and
phenomena.

Page 136
In Lay Terms:
Students should be able to use analyze data to show/verify increased frequency of traits that favor
survival in populations. Because these traits favor the survival of individuals, these surviving individuals
are more likely to reproduce than individuals without the traits, leading to more offspring that have these
traits in the next generation. Successive accumulation of such traits in populations can lead to adaptation
of a species in response to changes in environmental conditions.
Cluster Clarifications: (none)
Cluster Stimulus Attributes:
Typical stimulus elements:
summaries of research evidence
tables, graphs, and models
Possible contexts:
genetic/fossil/comparative anatomy statistical studies examining genetic drift, geographic
isolation, adaptive radiation, natural selection, adaptation, or extinction events (though the terms
for these mechanisms should be avoided or de-emphasized)
comparisons of proportions within species data to analyze shifts in numerical distribution of traits
within a population (without calculating Hardy-Weinburg)
investigations comparing/contrasting events that cause changes of genetic frequencies
Content and evidence to be included: quantitative and supporting data/information showing proportional
changes and shifts in traits within populations
Types of student responses that need to be supported: analyzing data to describe trends or probabilities;
describing and explaining data as evidence to support explanations and predictions
Allowable Item Types:
MC
TEI

Page 137
Model Item Descriptions for HS-LS4-3:
# Item
Type DOK
Model Stem
(Items ask students to...) Response Characteristics*
1 MC 1 or 2 per
complexity
Analyze information from data tables and
graphs to state results of shifts in the
numerical distribution of favorable/
unfavorable traits within a population.
[Which result of periodic drought on the
mosquito traits is supported by the data?]
Key may focus on an increase in frequency
for a favorable trait or a decrease in
frequency for an unfavorable trait. The
function of traits should be clearly described
in text accompanying the numerical data.
Distractors may include data for traits that
are not based on favorability or that are
unrelated to the population/factors.
2 MC 2 Use statistical data evidence to support
explanations about the influence of traits
that directly influence survival on the
frequency of that trait in a population or
gene pool.
Key may focus on a trend in the data
showing a prevalence of the trait in a later
generation.
Distractors may include evidence that does
not support the explanation or
misconceptions about the cause of the data
trend.
3 MC 2 or 3 per
complexity
of data and
stimulus
Analyze trends in population data to
describes/explain how adaptation occurs
when continual selection favors survival
or reproduction of individuals with a
specific trait.
Key may focus on an adaptation in a stable
population due to favorable selection.
Distractors may include analyses of trends
that are not related to the cause-effect
scenario or data that do not show trends.
4 MC 1 or 2 per
data
complexity
Make conclusions about trends involving
trait frequency in a population or species
as shown by the data/graphs from an
investigation.
[Which conclusion is best supported by
the graphs of bass body length versus
flow rate of rivers?]
[What trend is shown in the frequency of
the late-emerging nymphs in the
dragonfly populations among the five
study sites?]
Key may focus on increases or decreases in
abundance or frequency of traits due to an
observed pattern in an influencing
environmental factor.
Distractors may include conclusions that are
unrelated to or not supported by the variable
relationships in the data.

Page 138
5 MC 1 or 2 per
factor
analysis
depth
Use empirical data to make a conclusion
about cause-effect relationships affecting
adaptation in a species.
[Which environmental factor most likely
caused the polar bear adaptations?]
[Which statement best describes the
relationship between habitat type and
color variation in the screech owl
population?]
Key may focus on descriptions of the cause
and/or effect illustrated between
independent and dependent variables.
Distractors may include environmental
factors that do not influence adaptation or
factors that are not distinctly environmental.
6 MC 2 or 3 per
number of
relevant
factors
Use empirical data to make a conclusion/
claim about the degree of change in
variation or distribution of traits.
[Which conclusion about the frequency
of deer with small antlers is supported by
the data?]
Key should involve some level of data
inference or analysis to distinguish it from
model stem #1.
Distractors may include
conclusions/statements unsupported by the
evidence.
7 MC 3 Compare or contrast data for a stabilized
trait to data for a trait being selected in a
population to describe the effect of the
selection pressure on the population.
[Based on the data, which of the
following best describes the influence of
drought on meadowlark nesting
behavior?]
Key may focus on identifying the causative
factor and describing the effect on the
subject population in terms of which trait is
affected and how the population will be
affected.
Distractors may include descriptions of
effects that do not change expression of the
trait or of effects changing the expression of
the trait in other ways.
8 MC 3 Use population/trait distribution data
tables, models, or graphs to show that
organisms with advantageous traits appear
more frequently over time following an
environmental change.
[Which graph best represents the traits
that appeared over time following the
change to the environment?]
Key should focus on representing the trait
shift, based on data/evidence and DCI
knowledge of selection for advantageous
traits.
Distractors may include representations
based on misconception or other
representations not supported by the data or
valid concept reasoning.

Page 139
9 MC 2 or 3 per
data
complexity
Relate the validity or accuracy of
statistical data to the reliability of an
explanation/conclusion about which traits
are being favored and/or why they are
favored in a population.
[How is the scientist’s claim about
mortality in the frog population affected
by the lack of data from 1984 to 2002?]
Key may focus on data measurement or
reporting that demonstrates either
accuracy/validity or the lack thereof in
relation to the claim/conclusion
being made.
Distractors may include characteristics of
the data that do not affect reliability or that
affect the reliability of a different claim.
10 MC 2 Explain the cause or basis of absence/
rarity of a trait in a population based on
the data.
[Based on the data, why is the dark color
phase of the goose so rare?]
Key may focus on unfavorable traits that are
selected against/not favored, based on the
data.
Distractors may include genetic or
environmental factors, or combinations
thereof, that would not support the evident
pattern in the data.
11 MC 2 Represent or reorganize empirical data in
a different form to show trend, frequency,
distribution, etc. based on the variables of
the investigation.
[Which graph illustrates the frequency
distribution pattern of the trait shown in
the data table?]
Key may focus on converting the table data
to graphs or map data to tables/
charts/graphs to illustrate selection trends of
traits.
Distractors may include trends, frequencies,
or distribution patterns of other data, or may
show incorrect patterns or trends based on
misconceptions.
12 TEI 2 Represent or reorganize empirical data in
a different form to show trend, frequency,
distribution, etc. based on the variables of
the investigation.
[Show the correct frequency distribution
graphs for the trait and the explanation for
each pattern in the correct places on the
data chart for both species.]
Drag-drop interaction.
Match interaction might alternately be used
in some cases.
Correct responses show
selection/identification/association of
correct data representations or
transformations.
Partial credit would be awarded for a subset
of correct responses.

Page 140
13 MC 2 or 3 per
required data
manipulation
Calculate relevant averages, changes,
percentage, ratio, etc. to analyze and
apply the data from an investigation to a
question or problem involving trait
favorability.
[Based on the data, which statement best
describes how much the distribution of
the traits in the sparrow population
changed over the time of the study?]
Key may focus on calculating averages,
percentages, or ratios to determine
frequency or distribution patterns of traits in
a population.
Distractors may include ratios, percentages,
comparative values based on common
misconceptions, or common application
errors.
*Response options can make use of Student Misconceptions (examples of scientifically incorrect
assumptions) related to this performance expectation; references to misconceptions are listed in the
links below:
From
http://www.montana.edu/kalinowski/KalinowskiReprints/2011_Andrews_et_al_AreHumandEvolving_EvoEduO
utreach.pdf:
Students believe change happens as a result of need or desire.
Students believe change has always occurred and always will occur.
Students believe traits that are used are retained and those traits that are not used are lost.
Students believe selection only occurs when organisms die.
Students believe all organisms in a species are essentially alike.
Students believe evolution equals speciation.

Page 141
Biological Unity and Diversity: HS-LS4-4 back to Item Specifications list
HS-LS4-4. Construct an explanation based on evidence for how natural selection leads to adaptation of
populations.
OASS Clarification Statement:
Emphasis is on using data to provide evidence for how specific biotic and abiotic differences in
ecosystems (such as ranges of seasonal temperature, long-term climate change, acidity, light, geographic
barriers, or adaptation of other organisms) contribute to a change in gene frequency over time, leading to
adaptation of populations. One example could be that as climate became more arid, grasses replaced
forests, which led to adaptation in mammals over time (e.g., increase tooth enamel and size of teeth in
herbivores).
OASS Assessment Boundary:
The assessment should measure students’ abilities to differentiate types of evidence used in explanations.
Science & Engineering
Practice:
Constructing
Explanations and
Designing Solutions
Construct an
explanation based
on valid and
reliable evidence
obtained from a
variety of sources
(including
students’ own
investigations,
models, theories,
simulations, peer
review) and the
assumption that
theories and laws
that describe the
natural world
operate today as
they did in the
past and will
continue to do so
in the future.
Disciplinary Core Idea:
LS4.C: Adaptation
Natural selection leads to adaptation;
that is, to a population dominated by
organisms that are anatomically,
behaviorally, and physiologically
well suited to survive and reproduce
in a specific environment.
That is, the differential survival and
reproduction of organisms in a
population that have an
advantageous heritable trait leads to
an increase in the proportion of
individuals in future generations that
have the trait and to a decrease in the
proportion of individuals that do not.
Changes in the physical
environment, whether naturally
occurring or human induced, have
thus contributed to the expansion of
some species, the emergence of new
distinct species as populations
diverge under different conditions,
and the decline—and sometimes the
extinction—of some species.
Crosscutting Concept:
Cause and Effect
Empirical evidence is
required to differentiate
between cause and
correlation and make
claims about specific
causes and effects.

Page 142
In Lay Terms:
Students should be able to construct and defend explanations using evidence for how the process of
natural selection acts on populations to shape the adaptation of species. Selection pressure in the form of
environmental limits and conditions determines the distribution and prevalence of genetic traits within a
population. This can lead to the redistribution and change in abundance of species, emergence of new
species, or the extinction of species.
Cluster Clarifications: (none)
Cluster Stimulus Attributes:
Typical stimulus elements:
text scenarios
data tables and graphs of specific biotic and abiotic factors over time
information (text or graphical) about the distribution of traits or subgroups with similar traits
Possible contexts:
examples of the roles of various biotic and abiotic factors in natural selection
effects of natural selection on redistribution of traits within populations or redistribution of
populations within a global/continental/regional range
numeric data showing shifts in gene frequencies associated with specific selection pressures
Content and evidence to be included: text, models, tables, and graphical representations as evidence of
abiotic and biotic factors and their effects on population/trait distribution shifts
Types of student responses that need to be supported: analyzing data to support and form explanations of
natural selection
Allowable Item Types:
MC
TEI

Page 143
Model Item Descriptions for HS-LS4-4:
# Item
Type DOK
Model Stem
(Items ask students to...) Response Characteristics*
1 MC 1 or 2 per
rigor of
evidence
Identify the evidence that supports the
explanation of a shift in genetic
frequency/trait for a population.
[Which data from the table support the
students’ explanation for the distribution
of the gray color phase in the owl
population?]
Key may focus on data that illustrate the
causative link between a selection pressure and
its effect on a variation in a population.
Distractors may include data that do not
support the explanation or only support it
partially.
2 MC 2 or 3 per
evidence/
prediction
complexity
Explain why a given result (adaptation)
under a particular biotic or abiotic change
would be expected, based on evidence
and content knowledge.
[Why would scientists expect the snail
population to adapt by producing thicker
shells over time in this environment?]
Distractors may include misconceptions or
invalid reasoning.
3 MC 2 Based on evidence, construct an
explanation for why the physical
environment contributes to the expansion
of some species and decline of others.
[Based on the climatic data after the last
ice age, why did the wooly mammoth
become extinct while the coyote became
more widespread in North America?]
Key may focus on a specific expansion/
decline or may contrast a decline in one species
with an expansion of another due to the same
causative factor.
Distractors may include explanations
unsupported by evidence or based on
misconceptions about species.
4 MC 2 or 3 per
evidence/
prediction
complexity
Explain why proliferation or survival of a
species subject to a particular biotic or
abiotic change in the environment would
be expected, based on evidence and
content knowledge.
[Based on the data, why is the harvest
mouse population expected to increase
over time?]
Key may focus on data links between a
causative factor and a direct change in
population size, reproductive efficiency, or
survival rate.
Distractors may include misconceptions or
explanations not supported by the data or
underlying concept.

Page 144
5 MC 2 Based on evidence, explain how/why a
population subject to selective pressure
will result in a new trait or population
distribution.
[Based on the data in the table, why will
the rise in average temperatures likely
cause a change in the range of caribou in
North America?]
Key may focus on data for a specific pressure
as a cause of a new trait frequency, trait or
population distribution pattern, or change in
total population.
Distractors may include explanations that
include misconceptions or errors regarding the
connection between pressure and the frequency
of the trait or change in population.
6 MC 2 Identify evidence that supports an
explanation that natural selection for a
favorable trait may lead to adaptation.
[Which data show that natural selection
has caused all moose to be better adapted
to living in snowy environments?]
Key may focus on data showing a cause-effect
relationship between the selection pressure and
adaptation of a species.
Distractors may include identification of
evidence that does not support the selection
pressure or the resulting adaptation.
7 MC 2 Use evidence to explain why natural
selection can lead to new subspecies or
species.
[Which statement best explains why the
mouse subspecies likely resulted from
natural selection?]
Key may focus on explaining the mechanism
for natural selection as the cause of speciation
(or subspeciation).
Distractors may include explanations without
data support or explanations that include
misconceptions about the mechanism of
natural selection or speciation.
8 MC 2 Determine which explanation for why/
how natural selection drives the frequency
of a trait within a gene pool or population
is best supported by the data.
[Based on the climate and bloom date
data, which statement about the bloom
date trait in willow trees is best
supported?]
Key may focus on data examples of trait
frequency redistribution within a geographic
range or population.
Distractors may include explanations that are
not supported by the data or that contain
misconceptions about the natural selection
mechanism, gene frequency, or the
advantage/disadvantage conferred by the
specified trait.
9 MC 2 Determine whether data do or do not
support an explanation for how/why
natural selection impacts the range of a
species.
[Which data best support the student’s
explanation for why the range of red
juniper has increased in Oklahoma since
1930?]
Key may focus on data that support or refute
the explanation based on changes in range
distribution patterns from maps.
Distractors may include inaccurate support/
refutation statements or statements that neither
support nor refute the explanation.
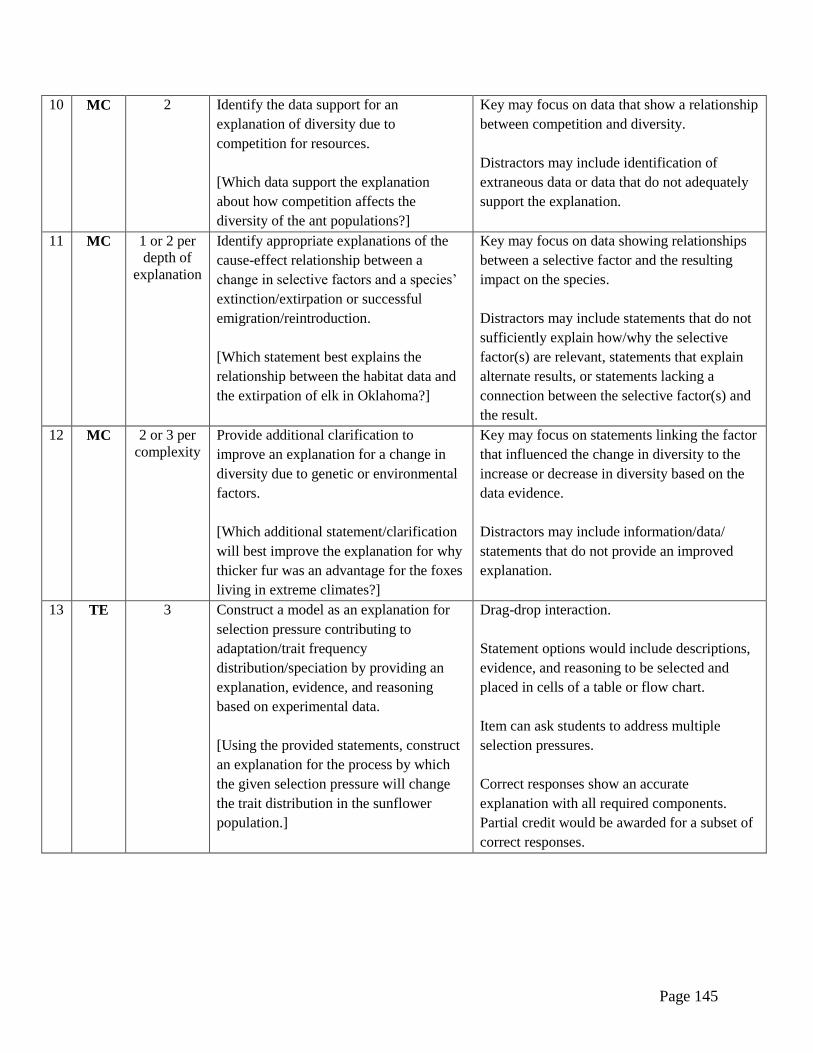
Page 145
10 MC 2 Identify the data support for an
explanation of diversity due to
competition for resources.
[Which data support the explanation
about how competition affects the
diversity of the ant populations?]
Key may focus on data that show a relationship
between competition and diversity.
Distractors may include identification of
extraneous data or data that do not adequately
support the explanation.
11 MC 1 or 2 per
depth of
explanation
Identify appropriate explanations of the
cause-effect relationship between a
change in selective factors and a species’
extinction/extirpation or successful
emigration/reintroduction.
[Which statement best explains the
relationship between the habitat data and
the extirpation of elk in Oklahoma?]
Key may focus on data showing relationships
between a selective factor and the resulting
impact on the species.
Distractors may include statements that do not
sufficiently explain how/why the selective
factor(s) are relevant, statements that explain
alternate results, or statements lacking a
connection between the selective factor(s) and
the result.
12 MC 2 or 3 per
complexity
Provide additional clarification to
improve an explanation for a change in
diversity due to genetic or environmental
factors.
[Which additional statement/clarification
will best improve the explanation for why
thicker fur was an advantage for the foxes
living in extreme climates?]
Key may focus on statements linking the factor
that influenced the change in diversity to the
increase or decrease in diversity based on the
data evidence.
Distractors may include information/data/
statements that do not provide an improved
explanation.
13 TE 3 Construct a model as an explanation for
selection pressure contributing to
adaptation/trait frequency
distribution/speciation by providing an
explanation, evidence, and reasoning
based on experimental data.
[Using the provided statements, construct
an explanation for the process by which
the given selection pressure will change
the trait distribution in the sunflower
population.]
Drag-drop interaction.
Statement options would include descriptions,
evidence, and reasoning to be selected and
placed in cells of a table or flow chart.
Item can ask students to address multiple
selection pressures.
Correct responses show an accurate
explanation with all required components.
Partial credit would be awarded for a subset of
correct responses.

Page 146
*Response options can make use of Student Misconceptions (examples of scientifically incorrect
assumptions) related to this performance expectation; references to misconceptions are listed in
the links below:
From http://www.tandfonline.com/doi/abs/10.1080/00958964.1994.9941962#.VPpv-uEpvm4:
Adaptations occur due to individual needs.
In all selection fitness is a function of the bigger and stronger organisms.
All members of a species are very similar, and there is little variation within species or populations.
From http://life.bio.sunysb.edu/~spgp/2004_02_10/Alters_and_Nelson_2002.pdf:
Students misunderstand the meaning of the terms “adapt” and “fitness.”
Students do not see the link between genetic variation and adaptation.
Students do not understand the amount or cause of genetic variation among organisms.

Page 147
Biological Unity and Diversity: HS-LS4-5 back to Item Specifications list
HS-LS4-5. Synthesize, communicate, and evaluate the information that describes how changes in
environmental conditions can affect the distribution of traits in a population causing: 1) increases in the
number of individuals of some species, 2) the emergence of new species over time, and 3) the extinction
of other species.
OASS Clarification Statement:
Emphasis is on determining cause and effect relationships for how changes to the environment such as
deforestation, fishing, application of fertilizers, drought, flood, and the rate of change of the environment
affect distribution or disappearance of traits in species.
OASS Assessment Boundary:
The assessment should provide evidence of students’ abilities to explain the cause and effect for how
changes to the environment affect distribution or disappearance of traits in species.
Science & Engineering
Practice:
Engaging in Argument from
Evidence
Evaluate the
evidence behind
currently accepted
explanations or
solutions to
determine the merits
of arguments.
Disciplinary Core Idea:
LS4.C: Adaptation
Changes in the physical
environment, whether naturally
occurring or human induced,
have thus contributed to the
expansion of some species, the
emergence of new distinct species
as populations diverge under
different conditions, and the
decline–and sometimes the
extinction–of some species.
Species become extinct because
they can no longer survive and
reproduce in their altered
environment. If members cannot
adjust to change that is too fast or
drastic, the opportunity for the
species’ adaptation over time is
lost.
Crosscutting Concept:
Cause and Effect
Empirical evidence
is required to
differentiate
between cause and
correlation and make
claims about specific
causes and effects.
In Lay Terms:
Students should be able to identify explanations and claims about the ways environmental changes affect
species and, more so, to evaluate the strength of the evidence and reasoning for those explanations and
claims. Species may be affected in terms of traits, survival, distribution, speciation, and extinction based
on the ability or inability to adapt.

Page 148
Cluster Clarifications:
Focus is on examining explanations or claims about how environmental conditions require
adaptation and affect survival and, subsequently, how this then causes species to expand, diverge
(speciation), decline, or go extinct.
Environmental changes can be human-induced or natural; examples include human development/
habitat destruction, invasive species, deforestation, fishing, application of fertilizers, drought,
flood, and fire.
Students can be asked to summarize/identify the explanation or claim (of cause and effect) in
some items, but most items should focus on evaluating the sufficiency and quality of evidence for
the explanation or claim.
The CCC—cause and effect—must be included and emphasized in the items (e.g., vocabulary of
“causes,” “affects,” “influences,” “impacts,” “results in,” “leads to,” “relationship between”).
Cluster Stimulus Attributes:
Typical stimulus elements:
text scenarios, graphs, and tables
stated explanations or claims
Possible contexts:
graphical representations and tables of population change (increase or decrease) as a result of
changes in the environment
adaptation examples with graphical representations of shifts in trait distributions in populations
due to selection pressure/environmental change
data from simulations of populations of organisms as they are affected by changes in the
environment
research/studies of historical context of organisms affected by changes in the environment
(biodiversity changes, population size changes, speciation, extinction)
Content and evidence to be included: graphs, tables, and textual descriptions related to environment, trait,
and/or population changes; complete or partial explanations or claims
Types of student responses that need to be supported: identifying explanations or claims; evaluating the
evidence and reasoning for given explanations and claims
Allowable Item Types:
MC
TEI

Page 149
Model Item Descriptions for HS-LS4-5:
# Item
Type DOK
Model Stem
(Items ask students to...) Response Characteristics*
1 MC 1 or 2 per
complexity
of stimulus
Identify the explanation or claim that is
expressed or should be inferred about how
environmental changes affect species traits
and adaptation.
[Based on the data, which statement
summarizes the cause-effect relationship
between the size of predator populations
and the body size distribution in the insect
population?]
Key must focus on cause-effect explanation
or claim.
Distractors may include misinterpretation of
the presented data and evidence or
misconceptions about mechanisms for
adaptation.
2 MC 1 or 2 per
complexity
of stimulus
Identify the explanation or claim that is
expressed or to be inferred about how
environmental changes, selection pressure,
and/or adaptations affect species survival,
speciation, or extinction (i.e., biodiversity).
[Which explanation of how deforestation
has affected the biodiversity of the
ecosystem is supported by the data?]
Key must focus on cause-effect explanation
or claim.
Distractors may include misinterpretation of
the presented data and evidence or
misconceptions about mechanisms for
biodiversity and species change.
3 MC 1 or 2 per
complexity
of stimulus
Identify the specific change in
environmental conditions that causes the
observed changes in species’ traits,
survival, distribution, speciation, and
extinction.
[Which change in environmental
conditions most likely caused the declines
in the monarch butterfly populations?]
Distractors may include irrelevant factors
and conditions, particularly those based on
misconceptions or confusion of causation
versus correlation.
4 MC 2 or 3 per
complexity
of claims
Compare multiple explanations or claims
about the influence of environmental
changes on species (traits, distribution,
survival or population size, speciation,
extinction) to evaluate their relative
accuracy, evidence, and reasoning.
[Which of the explanations for the cause of
the animals’ extinction is better supported
by the data and why?]
When justifications are required, key may
focus on merit due to most relevant
evidence, sufficient amounts of evidence,
and logical reasoning.
Distractors may include identifications and
justifications that are incorrect or
inconsistent with the scenario and evidence
presented.

Page 150
5 MC 1 or 2 per
context and
complexity
Identify evidence that supports (or rejects)
the explanation or claim about the effect(s)
of environmental factors/changes on
species.
[Which evidence best supports the
explanation for the shark populations’
decline due to habitat destruction?]
Distractors may include incorrect,
insignificant, or irrelevant data.
6 MC 2 or 3 per
complexity
Identify or describe the reasoning for the
explanation or claim about species changes
based on the evidence.
[Which reasoning best supports the
explanation for the observed changes in
seed size over time?]
[How does the evidence support the
explanation for the appearance of the new
salamander species?]
Distractors may include invalid or
unsupported reasoning, particularly based
on misconceptions.
7 MC 3 Evaluate the quality of the data, evidence,
and/or reasoning for the explanation or
claim about the cause of the changes in
traits or biodiversity (i.e., do—and/or how
do—the data, evidence, or reasoning
support the explanation or claim?).
[Which statement best evaluates whether
the given evidence supports the
explanation for the decrease in the number
of frog species in the ponds?]
Key may focus on the relevance, accuracy,
and/or sufficiency of the data/evidence.
Distractors may include misunderstanding
of quality evidence, illogical connections,
and/or misapplication of the data/evidence
based on misconceptions.
8 MC 2 or 3 per
complexity
Explain whether the given explanation or
claim about the cause of the changes in
traits or biodiversity is supported or d
rejected by the observations/data/evidence
(i.e., merit of the explanation or claim).
[Which statement explains whether the
explanation for the cause of the changes in
shell coloration over time is supported by
the data?]
Distractors may include misinterpretation of
data and evidence or may draw from
misconceptions or unrelated cause-effect
observations.

Page 151
9 MC 2 Identify additional evidence that would
support the explanation or claim about how
environmental changes affect species traits
and biodiversity.
[Which additional evidence would support
the explanation for how changes in water
pH have caused the decreases in
biodiversity in the lake?]
Key may focus generally on the type of
evidence needed (e.g., “data about the pH
range within which each fish species can
survive”) or identify specific data (e.g.,
“the pH decreased from 7.4 in 1980, to 6.5
in 1990, to 5.2 in 2000”).
Distractors may include incorrect or
irrelevant data, particularly based on
misconceptions.
10 MC 3 Differentiate between cause and correlation
based on the given evidence about the
changes in environment and species.
[Which statement explains whether the
changes in average fish body size were
caused by changes in gill net size or were
only correlated with changes in gill net
size?]
Distractors may include incorrect
classifications based on misconceptions
and incorrect reasoning around causation
versus correlation.
11 TEI 2 or 3 per
complexity
and
reasoning
required
Distinguish evidence that supports from
evidence that does not support an
explanation and provide reasoning for the
distinction.
[Sort the evidence statements into those that
support the explanation for the changes in
the species and those that do not.]
Drag-drop interaction.
Some items may require students to
associate reasoning with their responses.
Correct responses show proper sorting of
evidence that does and does not support the
explanation.
Partial credit would be awarded for a
subset of correct responses.
*Response options can make use of Student Misconceptions (examples of scientifically incorrect
assumptions) related to this performance expectation; references to misconceptions are listed in
the links below:
From http://www.tandfonline.com/doi/abs/10.1080/00958964.1994.9941962#.VPpv-uEpvm4:
Adaptations occur due to individual needs.
In all selection fitness is a function of the bigger and stronger organisms.
All members of a species are very similar, and there is little variation within species or populations.
From http://life.bio.sunysb.edu/~spgp/2004_02_10/Alters_and_Nelson_2002.pdf:
Students misunderstand the meaning of the terms “adapt” and “fitness.”
Students do not see the link between genetic variation and adaptation.
Students do not understand the amount or cause of genetic variation among organisms.