Embed Size (px)
Citation preview
A publication of the Office of the State Treasurer • Treasurer Ken Miller, Ph.D.
Economic Report TM
Oklahoma
News and analysis of Oklahoma’s economy
Inside
• Treasurer’s commentary: Improving personal finance
• Teaching dollars and sense
• General Revenue Fund exceeds estimate through March
• March Gross Receipts to the Treasury drop below prior year collections
• State sheds jobs in March, but jobless rate unchanged
Contributor
Regina Birchum, Deputy Treasurer for Policy
Editor
Tim Allen, Deputy Treasurer for Communications
State Capitol Building, Room 217 • Oklahoma City, OK 73105 • (405) 521-3191 • www.treasurer.ok.gov
Volume 5, Issue 4 • April 30, 2015
SEE RAINY PAGE 3
Oklahoma is not the only state facing a budget shortfall this year, but it is better equipped than most to weather the storm due to fiscal tools like requiring a five-percent budget cushion and having a well-constructed emergency fund.
Oklahoma’s rainy day fund currently holds $535.2 million, with the maximum available to this year’s Legislature $325.7 million: $191.9 million to replace the difference between revenue projections and actual collections and an additional $133.8 million, upon declaration of an emergency.
In comparison, Kansas, one of just
four states without a formal budget stabilization or “rainy day” fund, has limited options for mitigating current and projected budget shortfalls. For FY-14, Kansas drew down its general fund bank account to close a $330 million budget gap. To address the next year’s budget shortfall the state used the remainder of this “cushion” fund – which receives annual deposits of 7.5 percent of prior year appropriations – but also had to resort to diverting money from other accounts, like its highway fund, and deferring payments to its public pensions.
While Kansas is using all available
resources, Alaska is anticipating worse days ahead and has thus far resisted touching two reserve funds totaling more than $11 billion to solve its current shortfall. Oil revenue accounts for 89 percent of Alaska’s general operating funds and the full impact of the drop in prices and production is still to come. However, the state may not be able to avoid tapping the fund much longer. The Legislature was recently called into special session after passing a budget that does not fund the full fiscal year.
It is expected that Alaska will need to use approximately $3 billion of its
Rainy days ahead
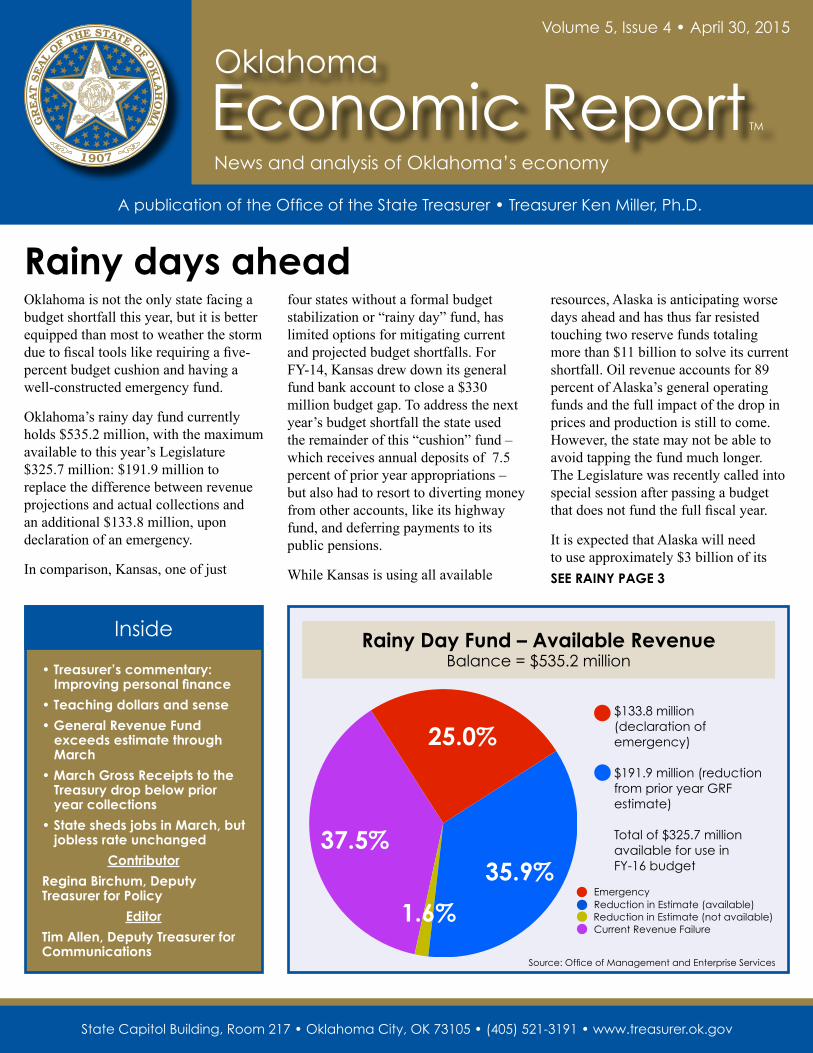
Rainy Day Fund – Available RevenueBalance = $535.2 million
37.5%
1.6%
35.9%
25.0%
EmergencyReduction in Estimate (available)Reduction in Estimate (not available)Current Revenue Failure
$133.8 million (declaration of emergency)
$191.9 million (reduction from prior year GRF estimate)
Total of $325.7 million available for use in FY-16 budget
Source: Office of Management and Enterprise Services
Oklahoma Economic Report TM April 30, 2015
www.treasurer.ok.gov • Page 2
Oklahoma and the United States have a big problem with huge consequences: too many people giving too little thought to their finances and their future.
April is Financial Literacy Month, a time to call attention to the need for individuals to understand sound financial practices and to promote available educational tools and resources.
In good times and bad, financial capability is an important key to strengthening the prosperity of American families and our communities. Recent statistics make apparent that we must work harder to communicate this message.
More than two-thirds of recent graduates left college with student loan debt. Nationwide, there is more than $1.2 trillion in outstanding student loan debt. Included in that figure is half a million Oklahomans who owe almost $12.5 billion, or more than $24,000 each, in student loans.
Consumers hold more student loan debt than they owe on credit cards and the impact is substantial. A study last year by the Pew Research Center found that among college graduates 40 years and younger, those with
no student loan debt have seven times the net worth as those with outstanding loans, in spite of nearly identical household incomes.
When students take out loans, they’re most often not thinking about life after college. After graduation, the more income that must be used to pay off student loans, the more likely it is that they will delay other major financial milestones – such as buying a home or saving for retirement. Delaying such investments has the potential to create economic ripple effects.
It’s important to remember that higher education is a good investment. On average, college graduates earn more than $1 million more in their lifetimes that those with only a high school education. But we need to do a better job of teaching students how to responsibly manage their finances now and after graduation,
and of being financially aware of the consequences and obligations of debt.
For those without student loans, there are other problems; too few are saving, and many who are aren’t saving enough.
The personal savings rate – the percentage of income set aside – was 5.8 percent in February, according to the U.S. Bureau of Economic Analysis.
A 2014 Retirement Confidence Survey showed that 64 percent of workers have saved for retirement, but most said they have less than $25,000 in total savings and investments. More than one-third have less than $1,000 in savings, and two-thirds of workers have not calculated how much they need to save to retire comfortably.
The result is that more than half of American households are at risk of
“Financial capability is an important key to strengthening the prosperity of American families and our communities.”
SEE COMMENTARY PAGE 3
Improving personal finance
Treasurer’s CommentaryBy Ken Miller, Ph.D.
www.treasurer.ok.gov • Page 3
Oklahoma Economic Report TM April 30, 2015
Opinions and positions cited in the Oklahoma Economic ReportTM are not necessarily those of Oklahoma State Treasurer Ken Miller or his staff, with the exception of the Treasurer’s Commentary, which of course, is the viewpoint of the treasurer.
CommentaryFROM PAGE 2
being unable to maintain their pre-retirement standard of living once they quit working.
But it’s not too late. If there is a silver lining in these findings, it is that when people become educated and engaged about their finances, they begin to take action.
For example, the retirement survey found that those workers who assessed their retirement needs had higher levels of savings.
The key to better financial management starts with education, and for many, it can be life changing. This is something I have personally seen in my role as chairman of the Oklahoma College Savings Plan board of trustees, and it is uplifting
to see real families achieving financial goals through discipline and determination.
Through the Oklahoma 529 plan, families are encouraged to save for college expenses to reduce the need for student loans. Regardless of income level, the plan is an excellent tool that includes nine investment options and a tax deduction to encourage savings.
Recently, my office partnered with Visa to provide a fun learning tool, the Financial Football video game, to every public middle school and high school in the state. We’ve also joined with the Oklahoma Council on Economic Education and Ever-Fi, a cutting-edge education technology company, to bring financial literacy information to Oklahoma’s students.
I’m honored to serve as chairman of the educational foundation of the National Association of State Treasurers, among whose goals are to build partnerships for financial education programs.
This summer, the NAST Foundation will re-launch the National Institute of Public Finance to offer intensive public finance curriculum to help the nation’s public officials develop the skills required for the future.
We in the Oklahoma Treasury are committed to making a difference in financial education.
The goal is to ensure that all Oklahomans, from schoolchildren to seniors, have access to information and tools to help them successfully manage their money and reach their financial goals.
Constitutional Reserve Fund in order to balance the FY-16 budget.
Texas also has largely maintained its sizeable reserve fund, which was established in the late 1980’s to protect against the volatility of the energy industry. The fund’s balance is capped at 10 percent of general revenue funds from the prior biennium, excluding investment or interest earnings. The Texas Legislature is currently considering a proposal to dedicate any funds in excess of the 10 percent limit toward the repayment of state debt.
Whether from a recession or a specific industry downturn, states will undoubtedly experience unexpected fiscal challenges. As many states have learned, a strong emergency reserve fund and fiscal discipline can make those dips less painful.
The Pew Charitable Trusts examined states’ rainy day funds in 2014 and found that while nearly all states had some sort of fund to offset swings in their budgets, many were not as effective as they could be. “States often fail to tie deposits to observed patterns of volatility, mistake one-time windfalls for long-term growth, set fund caps that provide inadequate protection against
downturns, and make saving for the future a low priority within the budget process.”
Most states have fund limits equal to between 5 and 10 percent of spending levels. The Pew report notes that states that depend on more volatile revenue, such as Alaska, need to have reserves that represent a greater percentage of their expenditures. The report recommends that states routinely evaluate whether the size of their emergency fund matches their experience with volatility.
Oklahoma’s Constitutional Reserve, or
FROM PAGE 1
Rainy
SEE RAINY PAGE 4

www.treasurer.ok.gov • Page 4
Oklahoma Economic Report TM April 30, 2015
“rainy day” fund, was created in 1985 in response to the oil bust that wrecked the state budget. It wasn’t until 1988 that the fund would get its first deposit from tax collections that exceeded estimated receipts. Originally designed so that half the funds could be used for emergencies and the other half to replace budget shortfalls, it was routinely used to enhance spending and fund special projects, even during periods of economic growth.
In the first 19 years after its creation, the emergency fund was used, among other things, for upgrades to state agency computer systems, on improvements to state parks and golf courses, to attract federal matching funds for water resources, for “weather modification,” and to supplement funding to transportation and education.
In 1992, Governor Walters and the Legislature declared a state financial emergency in order to use nearly $62
FROM PAGE 3
Rainy million of the fund to provide additional money for education and to serve as a stopgap measure for the Department of Human Services to pay for the Medicaid program through the end of the year.
By the next year, Walter’s tune had changed. In his State of the State address, he recommended that no funds from the account be used in the state budget, noting that, “Our unusually large dependence last year on rainy day funds for annual operating expense is partially responsible for this year’s budget shortfall.” However, on the last day of session, three-fourths of the Legislature thought differently, voting to use nearly $44 million from the fund.
The budget for FY-99 included $154.4 million in rainy day funds, of which $80 million went to roads, $24 million to higher education for ongoing needs, $16 million to common education for technology needs, and $6 million for costs associated with the Murrah bombing memorial and legal defense.The balance of the fund was nearly depleted by 2003, leaving just $136,000
in the account. That same year, legislators sent voters a state question to restrict use of the state’s emergency account.
In 2004 voters overwhelmingly approved a constitutional change to tighten controls over the account, enabling the state to build a record fund balance in time to help it manage through the Great Recession. That period made it apparent that the state needed a larger reserve for future downturns. In 2010, voters again approved a change to the constitution, this time raising the fund’s cap from 10 percent to 15 percent of the prior year’s general revenue collections.
The changes in the past decade to preserve and grow the state’s emergency account have put Oklahoma in position to weather yet another storm. Policymakers may determine more adjustments are needed, but they only need to look at other states to be reminded of the importance of continuing to guard and judiciously use the fund.
$0
$600.00
1989 1990 1991 1992 1993 1994 1995 1996 1997 1998 1999 2000 2001 2002 2003 2004 2005 2006 2007 2008 2009 2010 2011 2012 2013 2014 2015
Oklahoma Constitutional Reserve (Rainy Day) Fund History
Fund is created by voter approval of SQ 587. Funded by collections in excess of 100% of certified estimate. Half of balance available for use in revenue failure, half upon emergency declaration.
Voters approve SQ 708 modifying allowable use of fund, with 3/8 of balance for current fiscal year revenue failure, 3/8 for reduction in estimate for subsequent year, and 1/4 for emergencies.
Peak balance: $597 million.
1985 20042010
20112006
Current balance: $535.2 million.
Voters approve SQ 757 raising the maximum balance of the fund to 15% of prior year certified General Revenue Fund estimate. Previous cap was 10%.
Balance drops to $2.03.
Voters approve SQ 725 making up to $10 million available for at-risk manufacturers.
2009
Source: Secretary of State, Office of Management and Enterprise Services
2015
First deposit: $78 million.
1988

www.treasurer.ok.gov • Page 5
Oklahoma Economic Report TM April 30, 2015
Teaching dollars and sense
Through the first nine months of FY-15, allocations to the General Revenue Fund (GRF) exceed the estimate by $82.6 million, or two percent, according to the
Office of Management and Enterprise Services.
Two of the four major sources of
General Revenue Fund exceeds estimate through March
FY-15 General Revenue Fund Estimate-to-Actual July-Mar
Source: Office of Management and Enterprise Services
$0
$1,250
$2,500
$3,750
$5,000
Total GR Net Income Gross Prod Sales Motor Veh Other
+2.0%
+6.9%
-10.4%
+1.3%
-5.7%
-0.9%
EstimateActual
(in m
illio
ns)
Fiscal Year-to-Date Estimate: $4.03 billionFiscal Year-to-Date Allocations: $4.12 billion
revenue, net income tax and sales tax, are running ahead of the estimate. Gross production taxes on oil and natural gas production and motor vehicle taxes are below the estimate.
Gross production taxes are below the estimate by $21.2 million, or 10.4 percent. Motor vehicle allocations are $8.7 million, or 5.7 percent, less than the estimate.
Net income tax, a combination of personal and corporate income taxes, are up by $110.2 million, or 6.9 percent. Sales taxes top the estimate by $19.6 million, or 1.3 percent.
Other miscellaneous sources are off the estimate by $6.1 million, or 2.5 percent.
Officials say they anticipate GRF allocations will be sufficient to meet appropriations through the end of the fiscal year, though low oil prices are expected to reduce the margin by year’s end.
April is national Financial Literacy Month, so named to draw attention to the knowledge and skills needed to establish and maintain healthy financial habits.
To help address the need, Treasurer Ken Miller recently announced a partnership with EverFi, an education technology company, and the Oklahoma Council on Economic Education (OCEE) to bring an innovative, web-based financial education program to Oklahoma high school students across the state.
The partnership is seeking support from
businesses and financial institutions to help bring the program to students at no cost to schools or taxpayers.
A February 2015 study funded by the Financial Industry Regulatory Authority found that students who received rigorous financial education in high school saw increased credit scores and decreased chance of credit delinquency as young adults, compared to their peers who did not receive financial education.
National data collected from nearly 90,000 high school students who completed a financial education
curriculum in the 2014-2015 academic year revealed that 62 percent of students felt prepared to check and understand their credit scores, an increase of 132 percent from pre-course levels.
OCEE will deliver financial literacy professional development for teachers, including training on implementing the EverFi software and reinforcing concepts demonstrated in the program in classroom activities.
Those interested in offering support should contact the treasurer’s office at (405) 522-4205.

www.treasurer.ok.gov • Page 6
Oklahoma Economic Report TM April 30, 2015
The Treasurer’s April 6 Gross Receipts to the Treasury report and the Office of Management and Enterprise Services’ April 14 General Revenue Fund (GRF) report contain several differences.
March gross receipts totaled $957.3 million, while the GRF received $424.4 million or 44.3% of the total.
The GRF received between 35.7% and 54.5% of monthly gross receipts during the past 12 months.
From March gross receipts, the GRF received:
• Personal income tax: 40.7%
• Corporate income tax: 68.5%
• Sales tax: 44.9%
• Gross production-Gas: None
• Gross production-Oil: 52%
• Motor vehicle tax: 25.1%
• Other sources: 47.1%
March GRF allocations were above the estimate by $11.1 million or 2.7%. Year-to-date revenue exceeds the estimate by $82.6 million or 2%.
For March, insurance premium taxes totaled $25.44 million.
Tribal gaming fees generated $10.18 million during the month.
Gross Receipts & General Revenue
compared
March Gross Receipts to the Treasury drop below prior year collectionsLow oil prices are a significant drag on the latest monthly revenue collections, State Treasurer Ken Miller said today as he released the March Gross Receipts to the Treasury Report.
Total March collections were almost $28 million less than in March of last year, and were pushed downward primarily by a 48 percent drop in oil and natural gas gross production receipts.
“The news isn’t exactly good this month, but it’s also not unexpected,” Miller said. “The low gross production collections are from January oilfield activity, when rates were at their lowest. Prices have rebounded slightly since then.”
In January, benchmark West Texas Intermediate crude oil sold for an average price of $47.66 per barrel. March gross production collections of
$39.6 million are the lowest since September 2002, when $32.5 million was reported.
March sales tax collections also fell below the prior year,
down by 2.3 percent. This marks the first time in two years that monthly sales tax receipts have not shown growth over the prior year. However, tax commission officials explained that sales tax collections last March were abnormally high due to two large audit payments and receipt of a one-time payment.
SEE REVENUE PAGE 7
“The news isn’t exactly good this month, but it’s also not unexpected.”
Source: Office of the State Treasurer
Monthly Gross Receipts vs. Prior Year
Percentage change from prior year
8.2%
-2.8%
-3%
-1%
1%
4%
6%
8%
10%
Apr-14
May-14Jun-14
Jul-14Aug-14
Sep-14Oct-1
4Nov-14
Dec-14Jan-15
Feb-15Mar-15
Income TaxSales TaxGross ProductionMotor VehicleOther
www.treasurer.ok.gov • Page 7
Oklahoma Economic Report TM April 30, 2015
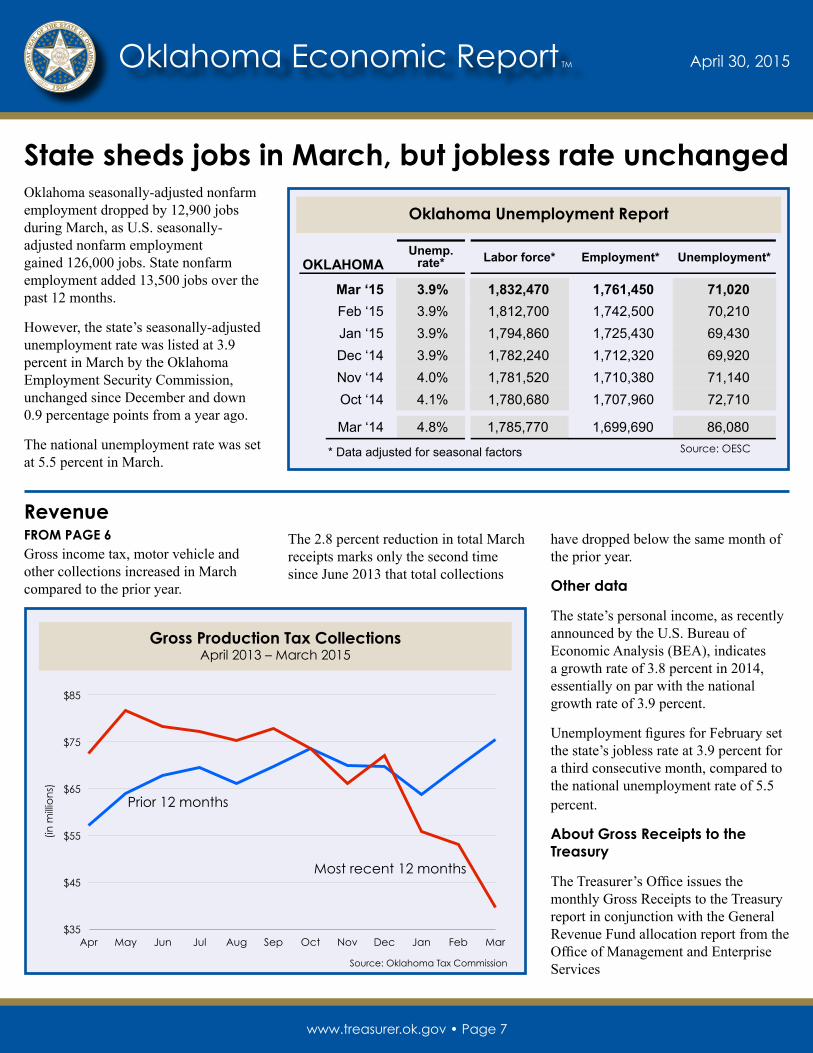
RevenueFROM PAGE 6Gross income tax, motor vehicle and other collections increased in March compared to the prior year.
The 2.8 percent reduction in total March receipts marks only the second time since June 2013 that total collections
have dropped below the same month of the prior year.
Other data
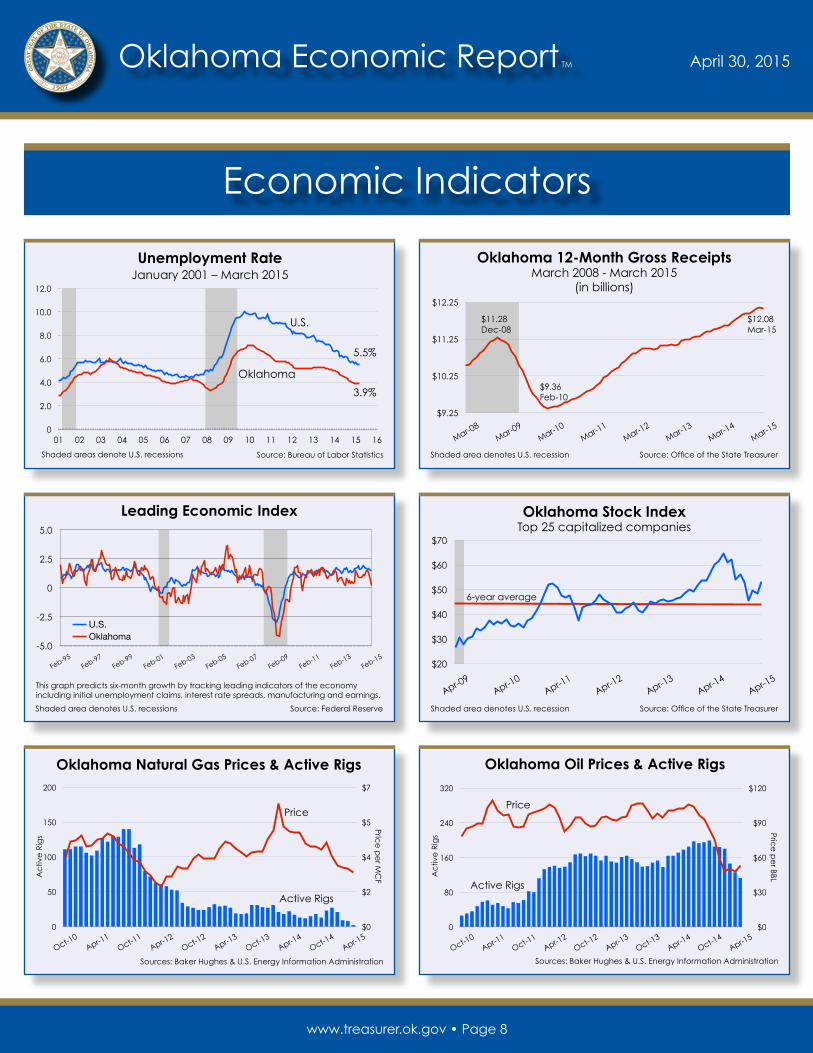
The state’s personal income, as recently announced by the U.S. Bureau of Economic Analysis (BEA), indicates a growth rate of 3.8 percent in 2014, essentially on par with the national growth rate of 3.9 percent.
Unemployment figures for February set the state’s jobless rate at 3.9 percent for a third consecutive month, compared to the national unemployment rate of 5.5 percent.
About Gross Receipts to the Treasury
The Treasurer’s Office issues the monthly Gross Receipts to the Treasury report in conjunction with the General Revenue Fund allocation report from the Office of Management and Enterprise Services
Oklahoma seasonally-adjusted nonfarm employment dropped by 12,900 jobs during March, as U.S. seasonally-adjusted nonfarm employment gained 126,000 jobs. State nonfarm employment added 13,500 jobs over the past 12 months.
However, the state’s seasonally-adjusted unemployment rate was listed at 3.9 percent in March by the Oklahoma Employment Security Commission, unchanged since December and down 0.9 percentage points from a year ago.
The national unemployment rate was set at 5.5 percent in March.
State sheds jobs in March, but jobless rate unchanged
Source: OESC
Oklahoma Unemployment Report
O K L A H O M A E M P L O Y M E N T S E C U R I T Y C O M M I S S I O N
Economic Research & Analysis …Bringing Oklahoma’s Labor Market to Life!
This publication is produced by the Economic Research & Analysis (ER&A) division of the Oklahoma Employment Security Commission as a no cost service. All information contained within this document is available free of charge on the OESC website (www.ok.gov/oesc_web/Services/Find_Labor_Market_Statistics/index.html) and through labor market information (LMI) publications developed by the ER&A division. All statistics are preliminary and have been adjusted for seasonal factors. Beginning in January 2010, seasonally adjusted LAUS estimates are calculated using a new methodology designed to reduce estimation volatility. More information on this change can be found at www.bls.gov/lau/lassaqa.htm. All data is collected under strict guidelines provided by the Bureau of Labor Statistics. Although a large amount of data has been presented, this in no way suggests that all data has been included. Due to space restrictions, only relevant industries and sectors are included. Unless otherwise noted, data is rounded to the nearest 10.
FOR RELEASE: April 21, 2015
OKLAHOMA EMPLOYMENT REPORT – March 2015 State unemployment rate unchanged for month
Oklahoma’s seasonally adjusted unemployment rate remained at 3.9 percent in March. The U.S.unemployment rate also held steady at 5.5 percent for the month. Over the year, the state’s seasonally adjusted unemployment rate improved by 0.9 percentage points.
MARCH 2015Unemp.
rate* Labor force* Employment* Unemployment*
Oklahoma 3.9% 1,832,470 1,761,450 71,020 United States 5.5% 156,906,000 148,331,000 8,575,000
* Data adjusted for seasonal factors
OKLAHOMAUnemp.
rate* Labor force* Employment* Unemployment*
Mar ‘15 3.9% 1,832,470 1,761,450 71,020 Feb ‘15 3.9% 1,812,700 1,742,500 70,210 Jan ‘15 3.9% 1,794,860 1,725,430 69,430 Dec ‘14 3.9% 1,782,240 1,712,320 69,920 Nov ‘14 4.0% 1,781,520 1,710,380 71,140 Oct ‘14 4.1% 1,780,680 1,707,960 72,710
Mar ‘14 4.8% 1,785,770 1,699,690 86,080
* Data adjusted for seasonal factors
Statewide seasonally adjusted employment grew by 18,950 persons in March, and unemploymentexpanded by 820 persons. Over the year, seasonally adjusted unemployment declined by 15,060 persons (-17.5 percent).
Monthly change* Annual change* MARCH 2015 Number Percent Number Percent
Labor force +19,760 +1.1% +46,690 +2.6% Employment +18,950 +1.1% +61,750 +3.6%
Unemployment +820 +1.2% -15,060 -17.5%
* Data adjusted for seasonal factors
Source: Oklahoma Tax Commission
Gross Production Tax CollectionsApril 2013 – March 2015
$35
$45
$55
$65
$75
$85
Apr May Jun Jul Aug Sep Oct Nov Dec Jan Feb Mar
Prior 12 months
Most recent 12 months
(in m
illio
ns)
www.treasurer.ok.gov • Page 8
Oklahoma Economic Report TM
Economic Indicators
April 30, 2015
Oklahoma 12-Month Gross ReceiptsMarch 2008 - March 2015
(in billions)
Shaded area denotes U.S. recession Source: Office of the State Treasurer
$9.25
$10.25
$11.25
$12.25
Mar-08
Mar-09
Mar-10
Mar-11
Mar-12
Mar-13
Mar-14
Mar-15
$11.28Dec-08
$9.36Feb-10
$12.08Mar-15
Source: Bureau of Labor Statistics
Unemployment RateJanuary 2001 – March 2015
Shaded areas denote U.S. recessions
3.9%
5.5%
0
2.0
4.0
6.0
8.0
10.0
12.0
01 02 03 04 05 06 07 08 09 10 11 12 13 14 15 16
U.S.
Oklahoma
Leading Economic Index
Source: Federal ReserveShaded area denotes U.S. recessions
This graph predicts six-month growth by tracking leading indicators of the economy including initial unemployment claims, interest rate spreads, manufacturing and earnings.
-5.0
-2.5
0
2.5
5.0
Feb-95
Feb-97
Feb-99
Feb-01
Feb-03
Feb-05
Feb-07
Feb-09
Feb-11
Feb-13
Feb-15
U.S.Oklahoma
Oklahoma Stock IndexTop 25 capitalized companies
Shaded area denotes U.S. recession Source: Office of the State Treasurer
$20
$30
$40
$50
$60
$70
Apr-09Apr-10
Apr-11Apr-12
Apr-13Apr-14
Apr-15
6-year average
Sources: Baker Hughes & U.S. Energy Information Administration
Oklahoma Natural Gas Prices & Active Rigs
0
50
100
150
200
Oct-10
Apr-11Oct-1
1Apr-12
Oct-12
Apr-13Oct-1
3Apr-14
Oct-14
Apr-15$0
$2
$4
$5
$7
Active Rigs
Price
Price
pe
r MC
FAc
tive
Rig
s
Oklahoma Oil Prices & Active Rigs
Sources: Baker Hughes & U.S. Energy Information Administration
0
80
160
240
320
Oct-10
Apr-11Oct-1
1Apr-12
Oct-12
Apr-13Oct-1
3Apr-14
Oct-14
Apr-15$0
$30
$60
$90
$120
Active Rigs
Price
Price
pe
r BBLAc
tive
Rig
s