Embed Size (px)
Citation preview
Joint Transportation Committee PRIORITIZATION OF PROMINENT ROAD-RAIL CONFLICTS IN WASHINGTON STATEJanuary 2017
Prepared by:
in partnership with:
www.transpogroup.com©2017 Transpo Group
CONTACTS
Jon Pascal, PEProject Manager, Transpo Group USA12131 113th Avenue NESuite 203Kirkland, WA 98034(360) [email protected]
Beth RedfieldProject Manager, Joint Transportation CommitteeWashington State Legislature606 Columbia Street NWSuite 105PO Box 40937Olympia, WA 98504-0937(360) [email protected]
TABLE OF CONTENTSExecutive Summary ......................................................................................................................... i
1 Introduction ....................................................................................................................................11.1 Background.................................................................................................................................11.2 Policy Interests ............................................................................................................................51.3 Recent Studies ............................................................................................................................61.4 Study Objectives ........................................................................................................................81.5 Study Approach ..........................................................................................................................9
2 Prioritization Process .................................................................................................................122.1 Crossings, Corridors, and Projects ...........................................................................................122.2 Three Categories of Criteria ......................................................................................................132.3 Prioritization Approach ..............................................................................................................162.4 Preliminary Screening Process ..................................................................................................162.5 Step 1 Filtering ..........................................................................................................................172.6 Step 2 Scoring and Weighting ...................................................................................................19
3 Prioritization Results ..................................................................................................................253.1 Prominent Crossings: Step 1 Results ........................................................................................253.2 Top Priority Crossings: Step 2 Results ......................................................................................273.3 Corridor-Based Evaluation ........................................................................................................32
4 Data and Tool Overview .............................................................................................................374.1 Database Development .............................................................................................................374.2 Data Assembly and Sources .....................................................................................................384.3 Data Quality and Limitations .....................................................................................................414.4 Online Tool ................................................................................................................................444.5 Using the Prioritization Tool ......................................................................................................454.6 Future Data and Tool Enhancements ........................................................................................46
5 Tool Sustainability .......................................................................................................................505.1 Discussion ................................................................................................................................505.2 Tool Maintenance and Updating ...............................................................................................505.3 Governance and Policy Guidance .............................................................................................52
6 Findings and Recommendations ..............................................................................................55
FIGURESFIGURE E-1. Overview of the Prioritization Approach ........................................................................ iiiFIGURE E-2. Key Findings from the Step 2 Prioritization Effort ......................................................... ivFIGURE 1. Illustration of the Study Approach .....................................................................................9FIGURE 2. Three Common Categories Used to Evaluate Crossings .................................................13FIGURE 3. Overview of the Prioritization Steps .................................................................................16FIGURE 4. Locations of All 4,171 Railroad Crossings in Washington State ......................................17FIGURE 5. Filtering and Sorting Processes .......................................................................................18FIGURE 6. Step 1 Selection Process ................................................................................................19FIGURE 7. Crossings Selected for Step 2 Evaluation........................................................................25FIGURE 8. Crossings Summarized by Priority Groups ......................................................................28FIGURE 9. Key Findings from the Step 2 Prioritization Effort ............................................................30FIGURE 10. Crossings by Rail Corridors ...........................................................................................33FIGURE 11. Crossings by RTPO Corridors .......................................................................................34FIGURE 12. Example Database Structure .........................................................................................38FIGURE 13. Data Challenges Associated with the Evaluation Criteria ..............................................42FIGURE 14. Online Tool Interface ......................................................................................................44
TABLESTABLE 1. Step 1 Thresholds by Criteria ............................................................................................18TABLE 2. Step 2 Evaluation Criteria and Sources .............................................................................20TABLE 3. Step 2 Categories, Sub-Categories, and Evaluation Criteria Points ..................................22TABLE 4. List of the Top 50 Crossings from the Step 2 Prioritization Results ...................................28TABLE 5. Small Corridor Groups Within Top 50 That Have a Project Identified ................................35TABLE 6. Summary of Data Sources .................................................................................................40TABLE 7. Data Additions or Enhancements for Consideration ..........................................................47
APPENDICESAPPENDIX A Data Dictionary and DefinitionsAPPENDIX B Step 1 Report CardAPPENDIX C Full Prioritization List of CrossingsAPPENDIX D Online Tool Guide
DEFINITIONSAWC Association of Washington Cities
DOE Washington Department of Ecology
DOH Department of Health
EPA Environmental Protection Agency
FAST Act Fixing America’s Surface Transportation Act
FRA Federal Railroad Administration
FMSIB Freight Mobility Strategic Investment Board
HSIP Highway Safety Improvement Program
JTC Joint Transportation Committee
Marine Cargo Forecast Pacific Northwest Marine Cargo Forecast and Rail Utilization Report
MPO Metropolitan Planning Organization
PSRC Puget Sound Regional Council
RTPO Regional Transportation Planning Organization
UTC Washington Utilities and Transportation Commission
WPPA Washington Public Ports Association
WSAC Washington State Association of Counties
WSDOT Washington State Department of Transportation
JTC Prioritization of Prominent Road-Rail Conflicts | Transpo Group |
iExecutive Summary
EXECUTIVE SUMMARYThe Legislature directed the Joint Transportation Committee to conduct a study evaluating the impacts of prominent road-rail conflicts and develop a corridor-based prioritization process for addressing the impacts on a statewide level (Second Engrossed Substitute House Bill 1299 (2015),Section 204(3)). At-grade railroad crossings, where roads cross railroad tracks at the same level, can typically function adequately while population and traffic levels remain low. As both rail and road traffic increases, and trains get longer, at-grade crossings become more problematic, impacting communities in a variety of ways. The phrase “road-rail conflict” is used to describe potentially problematic at-grade crossings. Examples of potential conflicts include the following:
► Long and unpredictable travel delays for both the general public and freight users
► Collisions between trains and vehicles or pedestrians ► Temporary increase of emergency response times
With the growth of the state’s population and increasing road and rail traffic, communities throughout the state are concerned about the reliable and safe movement of rail and truck freight, general traffic, and emergency vehicles across more than 2,180 public, active at-grade railroad crossings.
The specific legislation calling for the study is as follows:
Second Engrossed Substitute House Bill 1299 (2015), Section 204: 3) $250,000 of the motor vehicle account—state appropriation, from the cities’ statewide fuel tax distributions under RCW 46.68.110(2), is for a study to be conducted in 2016 to identify prominent road-rail conflicts, recommend a corridor-based prioritization process for addressing the impacts of projected increases in rail traffic, and identify areas of state public policy interest, such as the critical role of freight movement to the Washington economy and the state’s competitiveness in world trade. The study must consider the results of the updated marine cargo forecast due to be delivered to the joint transportation committee on December 1, 2015. In conducting the study, the joint transportation committee must consult with the department of transportation, the freight mobility strategic investment board, the utilities and transportation commission, local governments, and other relevant stakeholders. The joint transportation committee must issue a report of its recommendations and findings by January 9, 2016. (Due date amended by Engrossed Substitute House Bill 2524, 2017 Supplemental Transportation Budget.)
| Transpo Group | JTC Prioritization of Prominent Road-Rail Conflicts
ii
STUDY OBJECTIVES The following objectives guided this study.
► An understanding of the current and future mobility, community impacts, and safety problems occuring at-grade crossings in the state;
► An understanding of state, local, and private entity policy interests in improving at-grade crossings;
► Consideration of how a data-driven analysis of crossing impacts can be used in a corridor-based project prioritization process, and
► A criteria-based decision-making process for prioritizing statewide investments in at-grade crossing solutions.
This study developed a process for prioritizing at-grade crossings based on specific evaluation criteria that considered local, regional, and statewide policy interests.
STUDY APPROACHThe study developed and incorporated a data-driven approach to evaluate and prioritize crossings throughout the state. It started with collecting and reviewing available data for crossings. Data gaps and inconsistencies were identified, such as where no data existed or where data quality was in question. A prioritization framework was then prepared to analyze and test various evaluation criteria and scoring methodologies to understand the magnitude of crossing
needs. To assist in the overall prioritization process, a crossing database was created along with an online mapping tool to store and display the results of the prioritization effort.
OVERSIGHT AND DIRECTIONThe study was guided by an Advisory Panel that met four times throughout the study and provided policy and technical guidance on the identification of the evaluation criteria used to determine crossing priorities, development of the database and the prioritization process, and potential findings and recommendations from the study. Additional support and direction was provided by a Staff Work Group made up of legislative staff and staff of the Advisory Panel members. While these groups provided valuable input to the consultants, the findings and recommendations are those of the consultants.
Products of this study:
► Database of at-grade crossings
► Online mapping tool
JTC Prioritization of Prominent Road-Rail Conflicts | Transpo Group |
iiiExecutive Summary
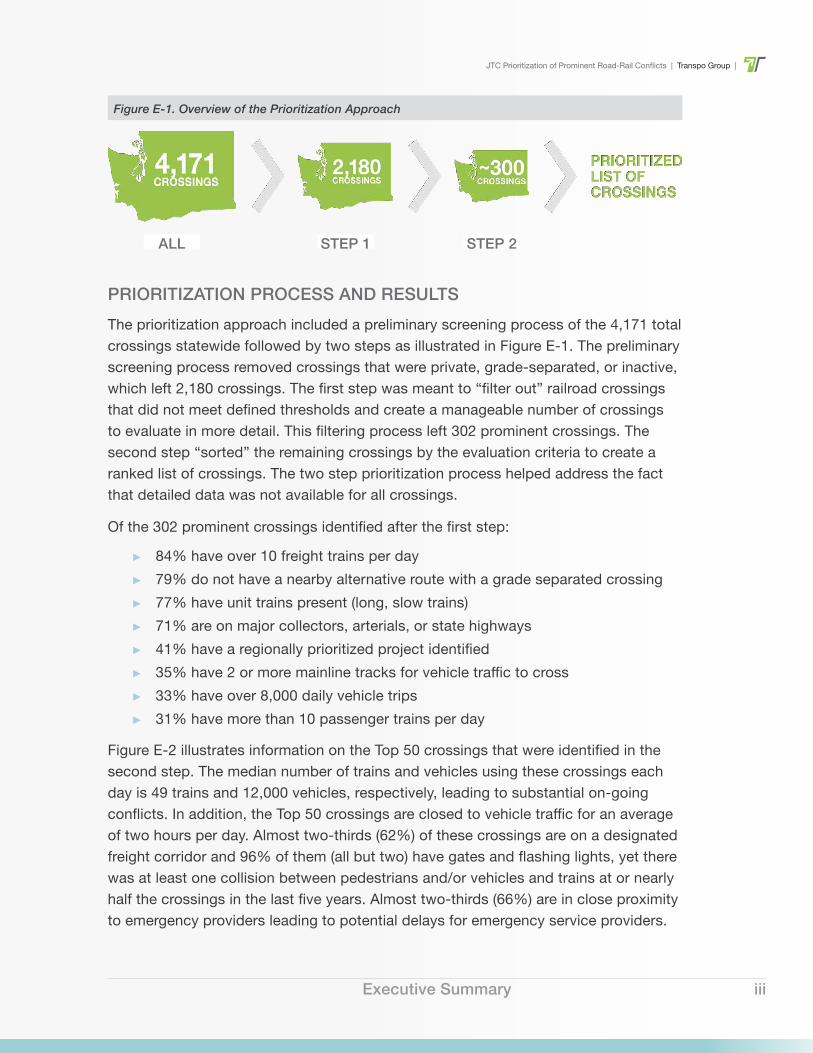
PRIORITIZATION PROCESS AND RESULTSThe prioritization approach included a preliminary screening process of the 4,171 total crossings statewide followed by two steps as illustrated in Figure E-1. The preliminary screening process removed crossings that were private, grade-separated, or inactive, which left 2,180 crossings. The first step was meant to “filter out” railroad crossings that did not meet defined thresholds and create a manageable number of crossings to evaluate in more detail. This filtering process left 302 prominent crossings. The second step “sorted” the remaining crossings by the evaluation criteria to create a ranked list of crossings. The two step prioritization process helped address the fact that detailed data was not available for all crossings.
Of the 302 prominent crossings identified after the first step:
► 84% have over 10 freight trains per day ► 79% do not have a nearby alternative route with a grade separated crossing ► 77% have unit trains present (long, slow trains) ► 71% are on major collectors, arterials, or state highways ► 41% have a regionally prioritized project identified ► 35% have 2 or more mainline tracks for vehicle traffic to cross ► 33% have over 8,000 daily vehicle trips ► 31% have more than 10 passenger trains per day
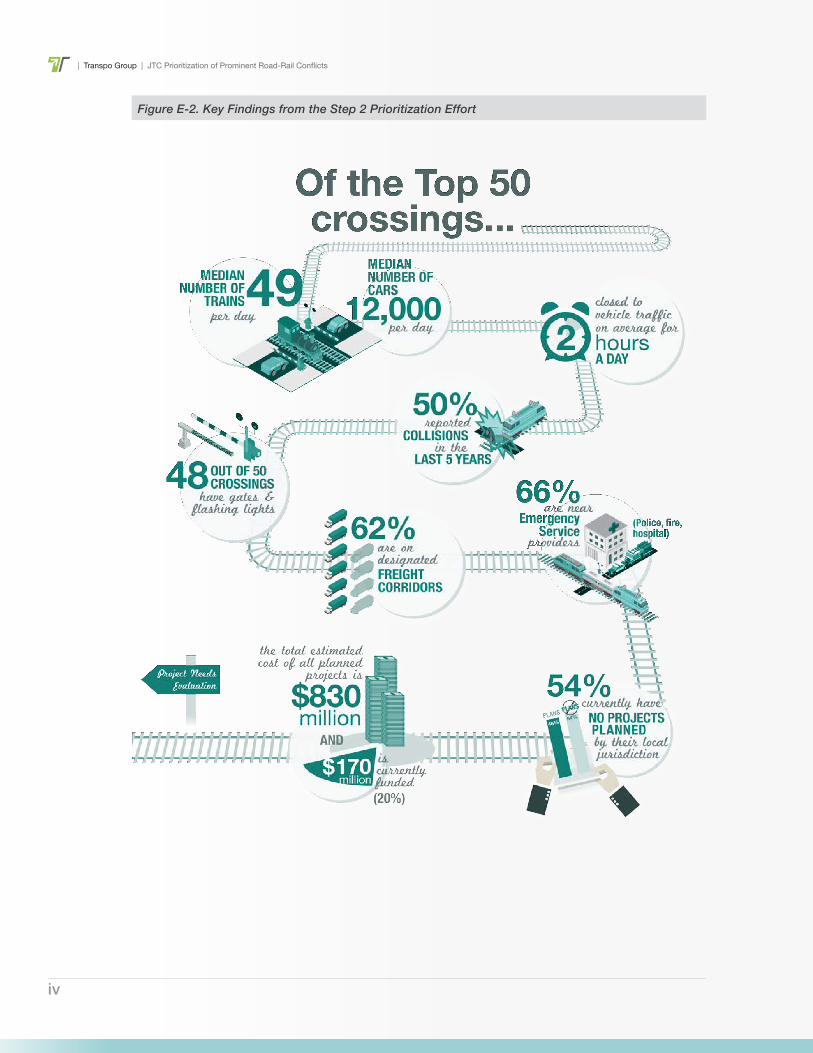
Figure E-2 illustrates information on the Top 50 crossings that were identified in the second step. The median number of trains and vehicles using these crossings each day is 49 trains and 12,000 vehicles, respectively, leading to substantial on-going conflicts. In addition, the Top 50 crossings are closed to vehicle traffic for an average of two hours per day. Almost two-thirds (62%) of these crossings are on a designated freight corridor and 96% of them (all but two) have gates and flashing lights, yet there was at least one collision between pedestrians and/or vehicles and trains at or nearly half the crossings in the last five years. Almost two-thirds (66%) are in close proximity to emergency providers leading to potential delays for emergency service providers.
Figure E-1. Overview of the Prioritization Approach
ALL STEP 1 STEP 2
| Transpo Group | JTC Prioritization of Prominent Road-Rail Conflicts
iv
Figure E-2. Key Findings from the Step 2 Prioritization Effort
JTC Prioritization of Prominent Road-Rail Conflicts | Transpo Group |
vExecutive Summary
The resulting list of crossing priorities is not a definitive list of needs, but is meant as a first step to assist policy makers, state agencies, RTPOs and local jurisdictions to understand crossing impacts, leading to the next step of project identification and evaluation of corridor-based solutions.
SCORING AND WEIGHTINGThe database contains detailed characteristics, or information, about each of the 2,180 public, active, at-grade crossings in the state. A select number of the characteristics that describe each crossing are used as evaluation criteria to analyze crossings. Evaluation criteria were grouped into three categories: mobility, safety, and community. The three common categories represent shared values in the transportation industry, and have been regularly applied in other funding or prioritization processes.
The scoring of crossings is also grouped by categories: mobility scores, safety scores, and community scores. Points are allocated to the criteria used in the first and second steps. The resulting scores are then weighted to achieve an overall score for the crossing.
Three different weighting strategies were tested and evaluated, with guidance from the Advisory Panel, to understand impacts to Step 2 rankings. One strategy was to weight mobility, safety, and community equally. Another strategy was to focus exclusively on the mobility criteria and ignore the safety and community criteria. The final weighting strategy is meant to put more focus on mobility, but still incorporate the elements of safety and community. In the end, after much discussion with the Advisory Panel, the recommended final score for each crossing reflects weighting mobility at 50%, safety at 25%, and community at 25%.
CORRIDOR EVALUATIONThe focus of the study was the evaluation of individual “crossings,” however “corridors” and “projects” are also discussed to understand how they could be considered in the prioritization process. Each term is distinctly different as a corridor could contain multiple crossings, and one crossing could contain multiple projects. Developing solutions to road-rail conflicts would lead to identification of a project. A corridor strategy could identify one or more projects to improve traffic flow at multiple crossings, or could result in closing one major crossing, alleviating the need to address multiple, adjacent crossings within the same corridor.
Corridor evaluation and prioritization is most useful when defining and ranking solutions which address crossing impacts, rather than identifying crossing issues. The objective of this study, the ranking of high-impact crossings, is less suited to a
| Transpo Group | JTC Prioritization of Prominent Road-Rail Conflicts
vi
corridor approach. This conclusion is based on consideration of a variety of corridors, such as crossings along a rail corridor or within RTPO boundaries. A finer geographic focus on the transportation system is likely necessary to maximize the benefits of a corridor approach.
In addition, corridor-based prioritization requires more specific context about potential community needs and solutions, such as type of crossing improvement or surrounding development patterns. The database and prioritization tool would still serve as a key input into a corridor-based project prioritization, but the corridors will need to be determined by users of the database with guidance from policy makers.
DATA AND TOOL OVERVIEWThe database development focused on locations rather than projects. The assembled data described location-specific characteristics for all public, active at-grade crossings in the state, such as traffic volumes, collision history, and train counts, rather than project-specific conditions, such as type of improvement, feasibility, and cost. The database was created by assembling readily available data from a variety of sources, including the UTC, WSDOT, the Federal Railroad Administration (FRA), and the Washington Department of Ecology (DOE). A project prioritization effort, in contrast, would include more contextual information for each location and would be guided by specific objectives developed by the funding entity.
The database and prioritization tool can be used as a starting point for state, regional, and local jurisdictions to understand the magnitude of needs, and how a specific crossing would compare against other locations on a statewide or regional basis. The tool can also be used to assist in future planning efforts and serve as an indicator of the need for more detailed analysis of individual crossings. An online tool was developed as part of this study to allow agencies and the public to review and analyze the database in a user-friendly format.
TOOL SUSTAINABILITYTo remain useful in the future, the tool will need to be maintained and updated as new or improved data is available and crossing projects are completed. In addition to simply keeping the tool up and running, questions remain as to how the tool might assist with existing and future funding programs, how to ensure data consistency and ability to benchmark crossings, and others related to tool use and application.
One of the benefits of the tool is the ability to have a statewide view of rail crossings. To ensure that this benefit continues and to provide a decision-making body for questions related to data updates or new data, a multi-stakeholder committee with similar membership to the Advisory Panel (e.g. WSAC, UTC, AWC, FMSIB, WSDOT,
JTC Prioritization of Prominent Road-Rail Conflicts | Transpo Group |
viiExecutive Summary
RTPO/MPOs) should be created. This committee could help ensure continued data integrity and facilitate tool sustainability by providing a decision-making body for data or evaluation questions and stewardship over the data. This committee could also work to address many of the questions raised by this study.
FINDINGS AND RECOMMENDATIONS The following are the findings and recommendations from the study effort.
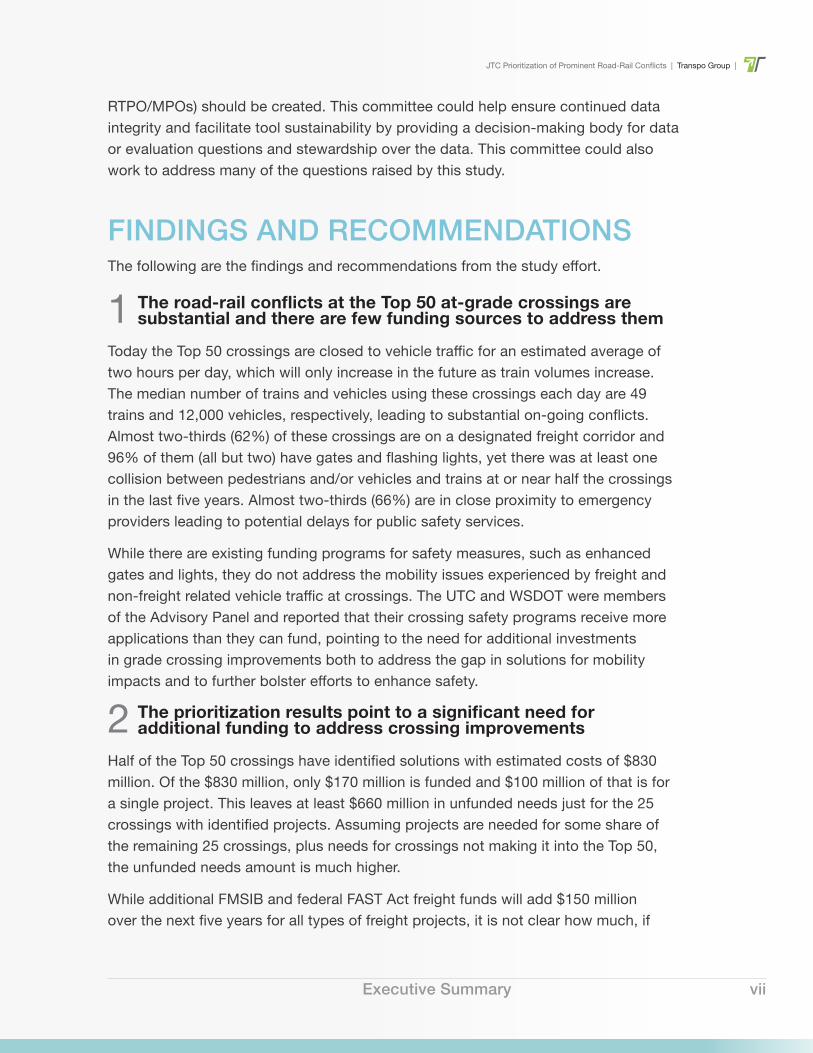
1 The road-rail conflicts at the Top 50 at-grade crossings are substantial and there are few funding sources to address them
Today the Top 50 crossings are closed to vehicle traffic for an estimated average of two hours per day, which will only increase in the future as train volumes increase. The median number of trains and vehicles using these crossings each day are 49 trains and 12,000 vehicles, respectively, leading to substantial on-going conflicts. Almost two-thirds (62%) of these crossings are on a designated freight corridor and 96% of them (all but two) have gates and flashing lights, yet there was at least one collision between pedestrians and/or vehicles and trains at or near half the crossings in the last five years. Almost two-thirds (66%) are in close proximity to emergency providers leading to potential delays for public safety services.
While there are existing funding programs for safety measures, such as enhanced gates and lights, they do not address the mobility issues experienced by freight and non-freight related vehicle traffic at crossings. The UTC and WSDOT were members of the Advisory Panel and reported that their crossing safety programs receive more applications than they can fund, pointing to the need for additional investments in grade crossing improvements both to address the gap in solutions for mobility impacts and to further bolster efforts to enhance safety.
2 The prioritization results point to a significant need for additional funding to address crossing improvements
Half of the Top 50 crossings have identified solutions with estimated costs of $830 million. Of the $830 million, only $170 million is funded and $100 million of that is for a single project. This leaves at least $660 million in unfunded needs just for the 25 crossings with identified projects. Assuming projects are needed for some share of the remaining 25 crossings, plus needs for crossings not making it into the Top 50, the unfunded needs amount is much higher.
While additional FMSIB and federal FAST Act freight funds will add $150 million over the next five years for all types of freight projects, it is not clear how much, if
| Transpo Group | JTC Prioritization of Prominent Road-Rail Conflicts
viii
any, will be available to address the Top 50 road-rail conflicts identified in this study. Each funding program has specific eligibility criteria, and these crossings may or may not meet that criteria, or rank well when compared to other freight infrastructure investments. Further, the first call for projects has already been prioritized by WSDOT and the Freight Advisory Committee and only two projects address impacts at the Top 50 crossings.
RECOMMENDATIONS i. Establish a dedicated funding source to address mobility impacts not covered under
the current crossing safety programs.ii. Secure additional funds for the safety programs. iii. Further analyze Top ranked crossings to identify potential solutions individually and
at the corridor level (see Finding 8).
3 The database and prioritization process provide a mechanism to compare and understand the magnitude of crossing improvement needs on a statewide basis
The database of crossings in its current form is a valuable tool for agencies throughout the state to evaluate and compare the needs of at-grade crossings. It is the only unified, statewide resource for detailed information about crossings and is a flexible tool that can be used in a variety of ways by state, regional, and local jurisdictions or other organizations. Some examples include:
► Describe the importance of a crossing (or a series of crossings) on state or federal grant applications.
► Assist in future planning efforts for local and regional jurisdictions. ► Provide a starting point for identifying locations
to develop specific project proposals.
For the tool to remain useful at the statewide level, standards will need to be implemented and maintained to ensure consistency. Decisions will also need to be made on questions related to new data releases, changing the weighting of criteria, or other data to better align with a funding program, or other changes.
In order to maintain the relevance and usefulness of the tool, funding should be provided to update and maintain it and host it at an agency. This same agency could serve as the coordinator for a multi-stakeholder committee with similar membership to the Advisory Panel for this study (e.g. WSAC, AWC, FMSIB, WSDOT, UTC, RTPO/MPOs) to help with decision-making and continued data integrity. This committee could also work to address many of the questions raised by this study.
JTC Prioritization of Prominent Road-Rail Conflicts | Transpo Group |
ixExecutive Summary
RECOMMENDATIONSiv. Establish a multi-stakeholder committee to create database and tool standards,
make decisions about future data enhancement or other changes, and address the outstanding questions raised by this study.
v. Identify an agency to maintain the database and tool and serve as the coordinator for the multi-stakeholder committee.
4 In some cases, projects prioritized locally did not rank high when evaluated on a statewide basis
Several crossing locations with planned projects did not make it into the Top 100 crossings statewide. Low ranking project locations were generally at crossings with lower train and traffic volumes, and in non-urban areas. Although proposed projects may not rank high on a statewide basis, the tool is not meant to discount legitimate congestion issues or mobility needs due to planned economic development projects or other site specific issues. There is no existing program specifically focused on mobility at rail crossings, but there are significant needs in large and small communities.
RECOMMENDATION vi. Identify specific policy objectives to guide investments in crossings on a statewide
basis. This may necessitate a separate program targeted at smaller communities similar to the Transportation Improvement Board’s Small Cities Program to ensure their needs can be addressed and that state funding programs balance investments between Puget Sound, Western Washington, and Eastern Washington communities.
5 Safety data serves as a contributor towards mobility impacts, but further analysis is needed to confirm specific safety needs
High-level safety data, where available, were incorporated into the prioritization process to assist in ranking the crossings. Safety data in the tool is related to collisions between trains and pedestrians, bicycles, or vehicles. Half of the Top 50 crossings had a reported collision at or near a crossing in the last five years. The Advisory Panel agreed that the data was not specific or detailed enough to provide a safety assessment beyond an indicator of potential problems.
In addition, there was discussion around the safety specific grant programs administered by UTC and WSDOT that focus on evaluating collisions and funding lower-cost crossing improvements. Funding sources such as the federal Railway-Highways Crossing (Section 130) Program focus on safety and evaluate crossings on a case-by-case basis given a set of uniform criteria. Evaluation of collisions requires
| Transpo Group | JTC Prioritization of Prominent Road-Rail Conflicts
x
more information than a crossing database can provide, such as site visits, predictive analysis, and review of specific causes.
The federal Section 130 Program and the UTC’s Grade Crossing Protective Fund Grant Program have a finite amount of money and are unable to address all the identified needs related to crossing safety. The combined funding from both programs is approximately $5 million per year in 2016, with funding levels set to decline by 2020.
While the crossing database cannot provide an authoritative safety analysis, it can supplement safety programs by identifying indicators of safety and mobility problems. Many mobility problems have implications for safety, such as gate down times that stop emergency response vehicles moving across town and cause drivers to take risks to beat safety gates at crossings. However, solutions to address mobility problems may be ineligible for funding under the current safety programs, highlighting the need for a funding source to address mobility impacts.
RECOMMENDATIONS vii. Coordinate efforts with the WSDOT and UTC safety programs to continue focusing
on reducing collisions at crossings and ensure funding levels are adequate.viii. Separately address mobility and safety impacts at crossings.
6 The database and prioritization tool would benefit from future enhancements
Determining how the database and online tool will be used will determine how it will be updated and maintained in the future. For example, existing or new funding programs may emphasize certain criteria, resulting in other criteria not being necessary to collect or maintain. Further, if funding is provided to address crossing improvements, local jurisdictions will have a strong incentive to improve the data and plan for projects.
Future enhancements should be considered by the multi-stakeholder committee to improve the results and usefulness of the prioritization process. For example, the screening method could be modified to remove crossings with low train and vehicle counts and additional safety data could be incorporated. The soon to be released Marine Cargo Forecast will provide projections of train traffic through 2035 and could also be incorporated into the database.
JTC Prioritization of Prominent Road-Rail Conflicts | Transpo Group |
xiExecutive Summary
RECOMMENDATIONS ix. Provide the agency hosting the tool with additional resources to maintain, update
and enhance the database and prioritization tool.x. Incorporate data from the Marine Cargo Forecast once it is complete.
7 Corridor evaluation and prioritization are most useful when defining projects to address crossing impacts
One of the objectives of the study was to consider a corridor-based prioritization process. A variety of corridors were considered, such as crossings along a rail corridor or within RTPO boundaries, but a finer geographic focus on the transportation system is likely necessary to maximize benefits of a corridor approach. In addition, corridor-based prioritization requires more specific context about potential community needs and solutions, such as type of crossing improvement or surrounding development patterns. The ranking of high-impact crossing locations on a statewide basis is less suited to a corridor approach. However, the database and prioritization tool would still serve as a key input and a common set of data when identifying a corridor-based project prioritization strategy.
A corridor-based strategy could help evaluate projects at a single crossing that would address multiple crossings, or evaluate a suite of projects at multiple crossings to help traffic move through a larger corridor. Corridor evaluation could be useful in identifying or evaluating specific project proposals and addressing regional or rural needs.
RECOMMENDATION xi. Utilize a corridor-based prioritization strategy to assist in developing solutions and
prioritizing investments
8 Some jurisdictions have not yet identified and prioritized needed crossing improvements
While most large jurisdictions have tried to address crossing impacts, a lack of dedicated funding sources for crossing improvements creates a disincentive for smaller jurisdictions to plan for and implement crossing improvements. Some communities may not know the range of possible solutions for crossings, or groups of crossings, and default to expensive grade-separation projects for all.
| Transpo Group | JTC Prioritization of Prominent Road-Rail Conflicts
xii
When crossing improvements compete with other local funding priorities, they often rank lower than other priorities. This is partially due to information about train activity and crossing impacts not being easily accessible (until the development of this database).
RECOMMENDATION xii. Ensure that local jurisdictions, state agencies, and other organizations, including
Regional Transportation Planning Organizations and Metropolitan Planning Organizations, are aware of the tool and the data it contains and how they might use it to assist with planning or funding decisions.
JTC Prioritization of Prominent Road-Rail Conflicts | Transpo Group |
1
“Road-rail conflict” is used to describe potentially problematic at-grade crossings.
Chapter 1
1 INTRODUCTIONWith the growth of the state’s population and increasing road and rail traffic, communities throughout the state are concerned about the reliable and safe movement of rail and truck freight, general traffic, and emergency vehicles across more than 2,180 public, active at-grade railroad crossings. In response to this concern, the Washington State Legislature in 2015 appropriated funds to the Joint Transportation Committee (JTC) to evaluate the impacts of prominent road-rail conflicts and develop a corridor-based prioritization process for addressing the impacts on a statewide level.
Funding for this study was provided by Washington cities from their share of the gas tax, due to concerns about increasing congestion and safety issues resulting from road-rail conflicts.
This study developed a prioritization process for at-grade crossings based on specific evaluation criteria that considered local, regional, and statewide policy interests. It is the first study of its kind, utilizing a data-driven approach to perform a comprehensive evaluation of at-grade crossings on a statewide basis.
1.1 BACKGROUNDAt-grade railroad crossings, where roads cross railroad tracks at the same level, can typically function adequately while population and traffic levels remain low. As both rail and road traffic increases, and trains get longer, these at-grade crossings become more problematic, impacting communities in a variety of ways. The phrase “road-rail conflict” is used to describe potentially problematic at-grade crossings. Examples of potential conflicts include the following:
► Long and unpredictable travel delays for both the motorists and freight carriers
► Collisions between trains and vehicles or pedestrians ► Temporary increases of emergency response times
The specific legislative direction calling for this study is as follows:
| Transpo Group | JTC Prioritization of Prominent Road-Rail Conflicts
2
Second Engrossed Substitute House Bill 1299 (2015), Section 204: 3) $250,000 of the motor vehicle account—state appropriation, from the cities’ statewide fuel tax distributions under RCW 46.68.110(2), is for a study to be conducted in 2016 to identify prominent road-rail conflicts, recommend a corridor-based prioritization process for addressing the impacts of projected increases in rail traffic, and identify areas of state public policy interest, such as the critical role of freight movement to the Washington economy and the state’s competitiveness in world trade. The study must consider the results of the updated marine cargo forecast due to be delivered to the joint transportation committee on December 1, 2015. In conducting the study, the joint transportation committee must consult with the department of transportation, the freight mobility strategic investment board, the utilities and transportation commission, local governments, and other relevant stakeholders. The joint transportation committee must issue a report of its recommendations and findings by January 9, 2017. (Due date amended by Engrossed Substitute House Bill 2524, 2016 Supplemental Transportation Budget.)
RAIL AND ROAD ACTIVITY EXPECTED TO GROWThe study arose partly due to concerns raised by cities related to increases in the frequency and length of freight trains, and the growth of roadway traffic volumes. Even without proposed export terminals for coal or oil, freight train traffic is expected to grow substantially. The State Rail Plan (December 2013) projects that statewide freight rail volumes will grow by 130% to 268 million tons of freight by 2035. The projected increase in rail freight volume will result in increases in freight train movements in the state. At a minimum, daily freight trains between Seattle and Spokane are projected to increase by 27 trains or 163% of current levels, and between Seattle and Portland, by 17 trains or 128% of current levels.
Roadway volumes are also expected to increase over time to serve the additional travel demand, especially in growing regions of the state, such as the Puget Sound and Spokane Metropolitan Areas. While the Washington Transportation Plan indicates vehicle miles traveled may decline per capita, vehicle volumes along many roadways are still expected to increase. Furthermore, it is expected that auto occupancy and truck freight volumes will increase due to more emphasis on buses, carpooling, and urban freight deliveries fueled from online retail sales. This means that while vehicle volumes are not expected to increase as substantially as train movements, more people will be traveling in the vehicles and more freight deliveries will be using the crossings to reach their destination.
JTC Prioritization of Prominent Road-Rail Conflicts | Transpo Group |
3Chapter 1
MORE TRAINS AND VEHICLES EQUAL MORE MOBILITY IMPACTSMore and longer trains, coupled with an increase in roadway volumes, will result in additional traffic delays for people and freight at many at-grade crossings. The Puget Sound Regional Council’s (PSRC) evaluation in July 2014 of the regional impacts of increased train traffic found that “gate-down” time, the time which the crossing gates are down and traffic is stopped, would more than double to about 30 minutes in some locations and nearly 3 hours in others. For some jurisdictions, crossing closures can have a ripple effect on the transportation network, causing adjoining intersections and corridors to gridlock and resulting in an extended period for the network to return to normal operations after the crossing gates have opened. These traffic delay impacts result from increasing freight and passenger train traffic, but also from increased passenger vehicle and truck freight volumes.
The Freight Mobility Strategic Investment Board (FMSIB) and the Washington Public Ports Association (WPPA) have partnered to prepare an update to the Marine Cargo Forecast. The forecast will compare the projected level of rail traffic with the capacity of the major railroad segments in the region, and identify the anticipated capacity constraints. Information from the Marine Cargo Forecast was not available to be incorporated into this study, but when available, will enhance the data utilized and help in prioritizing crossings expected to see a large increase in rail volumes.
GRADE SEPARATION PROJECTS ARE NOT ALWAYS FEASIBLEThere is a perception that grade separation projects are the only solution to road-rail conflicts. An average grade separation project can cost a minimum of $20 to $30 million, with a few projects costing more than $100 million. The City of Seattle is currently moving forward with an approximately $140 million grade separation project on Lander Street. Given that many local jurisdictions have multiple crossings within their boundaries, and a backlog of other infrastructure needs, this cost is often more than a jurisdiction can finance on its own. Furthermore, the cost of making all of these improvements statewide would be prohibitive.
A grade separation project may not be the only or best solution for every corridor with road-rail conflicts. Alternative at-grade crossing investments could be considered that improve network traffic flow, such as inter-connected signal equipment, or additional signing and lighting at the crossing resulting in improved operations and safety. Other technology could be considered that would provide dynamic traffic signage, predictive crossing closure times, or real-time data on mobile devices so motorists
| Transpo Group | JTC Prioritization of Prominent Road-Rail Conflicts
4
can find alternative routes. In cities or regions with multiple crossings, a combination of complementary investments may make the most sense given the need and financial capabilities of local jurisdictions, and the unpredictable nature of future train activity.
For situations where a grade crossing improvement is selected, an evaluation should be completed to determine if the project removes the need to invest in one or more adjacent at-grade crossings.
EXISTING FUNDING FOR CROSSING IMPROVEMENTS IS FOCUSED ON SAFETYWashington State has two funding programs exclusively focused on improving safety at crossings. Because grade crossing improvements do not generally compete well against other transportation improvements, these programs ensure funding for grade crossing projects because these projects only need to compete against each other. However, the funding for these programs is limited to small scale improvements.
The Washington Utilities and Transportation Commission (UTC) operates the Grade Crossing Protection program for which funding has been limited to $500,000 per biennium. Typical projects are focused on installation of protective devices such as gates and warning signals. In the 2016 Supplemental Transportation Budget, the program was increased by an additional $1.1 million to address safety issues at crossings with high volumes of oil train traffic.
WSDOT administers the federal Highway Safety Improvement Program (HSIP) funded as part of the Fixing America’s Surface Transportation (FAST) Act, which includes the Railway-Highways Crossing (Section 130) Program that funds projects at public at-grade crossings. The funds are apportioned to each state, with Washington receiving approximately $4.2 million per year through 2020.
Of the $16 billion Connecting Washington spending plan, as much as $245 million will be spent on projects which include improvements to at-grade crossings.
PLANNING FOR CROSSING IMPROVEMENTSCrossing improvements are not always included in the normal Metropolitan Planning Organization (MPO) or Regional Transportation Planning Organization (RTPO) planning process. Many jurisdictions overlook crossing improvements due to potential project costs, few outside funding sources, and lack of understanding of other lower-cost solutions. As part of this study, JTC staff surveyed RTPOs asking about at-grade
JTC Prioritization of Prominent Road-Rail Conflicts | Transpo Group |
5
crossing projects, but only eight of 14 RTPOs responded with information. Of those eight, some often addressed at-grade crossings as part of larger highway projects or as part of a focus on a single corridor. Some agencies, such as WSDOT and PSRC, are focusing on corridor improvement strategies, recognizing that one or multiple improvements in a corridor can improve mobility for the overall transportation system. Crossing improvements can be part of the strategies that are considered when identifying corridor solutions to improve traffic flow.
1.2 POLICY INTERESTSA key objective of the study is to identify the local, regional, and statewide policy interests of road-rail conflicts. The jurisdictions and stakeholders with an interest in addressing the impacts of road-rail conflicts include:
► The federal government, with the most recent Surface Transportation Act reauthorization including new funding for freight mobility;
► Washington State, as represented by WSDOT, UTC, and FMSIB; ► Local jurisdictions, as represented by cities,
counties, ports, and MPOs and RTPOs; ► Railroads, represented by BNSF, UP and short lines; and ► The trucking industry.
The federal and state governments are primarily interested in high level goals of congestion relief and safety for both general and freight traffic, and freight mobility as an important contributor to economic vitality. National and state funding programs tend to prioritize improvements to the national and state highway systems over funding local road systems.
Local governments and the local road system experience the most immediate impacts of road-rail conflicts, including but not limited to traffic back-ups, collisions at crossings, unreliable access to emergency services, and unsafe connections for pedestrians and bicycles. Air quality, noise, and general quality of life impacts are also of concern to some communities.
Ports experience the immediate impacts of constrained freight mobility. Terminal and inland rail connections can be a major constraint to their ability to efficiently handle marine cargo and landside rail traffic. Grade crossings are only one piece of the freight system, however, last-mile connections to ports frequently include road-rail intersections.
Chapter 1
| Transpo Group | JTC Prioritization of Prominent Road-Rail Conflicts
6
Railroads also seek to eliminate constraints to cargo through-put. In some rail segments, grade separation projects in a corridor only improve speed and volumes if accompanied by closures of nearby crossings.
A significant amount of freight is moved by trucks on state and local roads. The trucking industry experiences all aspects of road-rail conflicts, from traffic back-ups, reduced access to first- and last-mile connections, and exposure to safety risks.
1.3 RECENT STUDIESA number of recent studies analyzed road-rail conflicts in Washington State and identified impact mitigation opportunities. These studies were reviewed to understand items to consider when evaluating road-rail conflicts on a statewide basis. Each of the studies prioritized crossings or crossing improvement projects in order to identify funding needs.
WASHINGTON STATE FREIGHT ADVISORY COMMITTEE, “WASHINGTON STATE FREIGHT TRENDS & POLICY RECOMMENDATIONS”In 2013, FMSIB convened the Washington State Freight Advisory Committee (WSFAC) made up of public and private freight stakeholders. The WSFAC’s report discusses trends, challenges, and recommendations for each freight sector. In addition, the WSFAC compiled an inventory of grade separation projects, which improve “first priority” and “emerging” at-grade rail crossings. The inventoried projects were submitted by MPOs and RTPOs based on their regional prioritization processes. Only crossings of mainline railroads within city limits and on streets identified as part of the Freight and Goods Transportation System were considered.
The prioritized projects submitted by MPOs and RTPOs were grouped into two categories. The “first priority” crossing category included only projects addressing crossings of heavily-used roadways and were limited to near-term projects with at least some funding. The “emerging” at-grade rail crossing inventory included crossings with expected growth in truck traffic and projects in earlier stages of development (likely to proceed after 2020).
The inventory included $1.1 billion in projects prioritized by MPOs and RTPOs, with many projects not yet costed out. A few of these projects were funded by the 2015 Connecting Washington Act. This study is notable for its linkage of projects and
JTC Prioritization of Prominent Road-Rail Conflicts | Transpo Group |
7
crossings and the overwhelming cost of inventoried projects, demonstrating the need for a prioritized approach to funding.
In 2016, the WSFAC reconvened, staffed by WSDOT in collaboration with FMSIB to prioritize freight projects. For this process, the two agencies initiated a call for projects from cities, counties, ports, and tribes. The projects were screened and prioritized based on regional support, funding eligibility, remaining funding gap, and scheduled year for project start. Of the $6.3 billion in eligible projects submitted, only ten projects included elements addressing road-rail conflicts.
PSRC GATEWAY PACIFIC TERMINAL STUDYGrade crossings have received increased attention in the last few years due to proposals for oil and coal terminals served by rail. In 2014, the PSRC commissioned a study of the impacts of the increased train traffic serving a proposed SSA Marine coal terminal at Cherry Point in Whatcom County. The study found that the 18 new trains per day passing through the four county region would have both benefits and costs. Benefits would include upgrades in rail capacity that would help the Port of Seattle and provide additional in jobs. Costs would result from increased traffic delays and declines in property value.
The PSRC study focused on 70 crossings of the BNSF mainline which would serve Cherry Point. The two-step process first conducted a city-by-city analysis and narrowed the list to 34 crossings, or “mitigation opportunities,” based on two criteria: traffic delay due to crossing gate-down time and the impact of increased freight traffic on property values.
The second step collected data on the 34 crossings based on a broader set of criteria (truck volumes, rail freight class/volumes, impacts to emergency services, annual accidents, impacts to environmental justice, and pedestrian activity). Most of these 34 crossings receive a high priority ranking using at least one criteria.
This study is notable for demonstrating the importance of choosing a limited set of criteria to narrow a list of potential investments, the analysis of individual cities, and measurement of traffic delay by calculating gate-down time.
SKAGIT COUNCIL OF GOVERNMENTS RAIL CROSSING STUDYIn January 2016, the Skagit Council of Governments released the Rail Crossing Study, which evaluated all 56 at-grade crossings in the county. The study evaluated the impacts to local roads from increased future train traffic at all at-grade crossings. It
Chapter 1
| Transpo Group | JTC Prioritization of Prominent Road-Rail Conflicts
8
included data on existing and future train and traffic volumes, the crossings, vehicle queueing, impacts to emergency services, and safety. A list of priority projects was developed based on impacts to traffic delay, freight delay, and safety, among other concerns.
Similar to this study, the Rail Crossing Study assembled data from various sources for each at-grade crossing to identify potential impacts from existing and future train traffic. The study provided potential solutions to address those impacts, including localized solutions for each crossing as well as more network-based mitigation measures, such as Intelligent Transportation Systems (ITS).
WASHINGTON UTILITIES AND TRANSPORTATION COMMISSION, AT-RISK CROSSINGS, OIL BY RAIL LEGISLATIVE STUDYIn 2014, theUTC undertook a study of public railroad-highway grade crossings along oil routes. The 2015 summary of the study describes a process which narrowed a list of 347 crossings on oil routes to 14 crossings that are under-protected and would benefit from additional investments in protections, separation or closure. This study is notable for the UTC’s on-site, in-depth analysis of safety issues at individual grade crossings.
FMSIB AND WPPA, 2016 UPDATE TO THE MARINE CARGO FORECASTThe Legislature required the JTC study of road-rail conflicts to consider the results of the updated Marine Cargo Forecast being jointly conducted by FMSIB and the WPPA. The 2016 forecast update is expected to include information about rail capacity needs to accommodate forecasted increases in freight rail traffic. The forecast update is expected to be completed by the end of 2016, so information was unable to be included in the study. However, the information may be useful to include at a later time, depending on the next steps beyond this study effort.
1.4 STUDY OBJECTIVES The purpose of evaluating prominent road-rail conflicts and developing a prioritization process was to identify at-grade crossing locations that impact the movement of people, goods, and services. Through feedback from key stakeholders and the legislative direction, the following objectives guided this study.
JTC Prioritization of Prominent Road-Rail Conflicts | Transpo Group |
9
► An understanding of the current and future mobility, community impacts, and safety problems at-grade crossings in the state;
► An understanding of state, local, and private entity policy interests in improving at-grade crossings;
► Consideration of how a data-driven analysis of crossing impacts can be used in a corridor-based project prioritization process; and
► A criteria-based decision-making process for prioritizing statewide investments in at-grade crossing solutions.
These objectives helped frame each of the study tasks. For example, compiling an inventory of statewide crossing data improved understanding of the extent of current and future problems at crossings. The prioritization process included criteria that reflect state, local, and private policy interests, and acknowledged the importance of freight movement, emergency response routes, and the general mobility of goods and people. The analysis of crossing impacts included an evaluation of corridor strategies that could help address impacts at a single crossing or potentially help address impacts at multiple crossings. Finally, the resulting list of prioritized crossings used criteria to assist policymakers in understanding the magnitude of needs and potential priorities when considering crossing investments on a statewide basis.
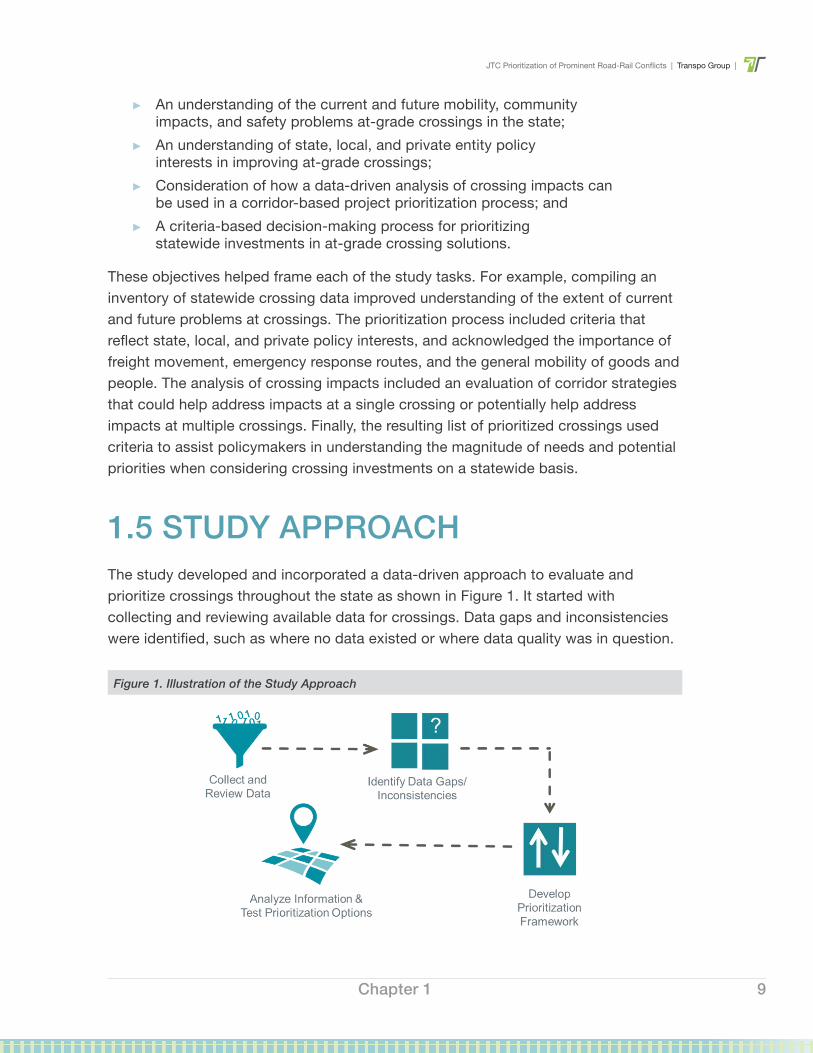
1.5 STUDY APPROACHThe study developed and incorporated a data-driven approach to evaluate and prioritize crossings throughout the state as shown in Figure 1. It started with collecting and reviewing available data for crossings. Data gaps and inconsistencies were identified, such as where no data existed or where data quality was in question.
Figure 1. Illustration of the Study Approach
Chapter 1
| Transpo Group | JTC Prioritization of Prominent Road-Rail Conflicts
10
A prioritization framework was then prepared to analyze and test various evaluation criteria and scoring methodologies to understand the magnitude of crossing needs. To assist in the overall prioritization process, a crossing database was created along with an online mapping tool to store and display the results of the prioritization effort.
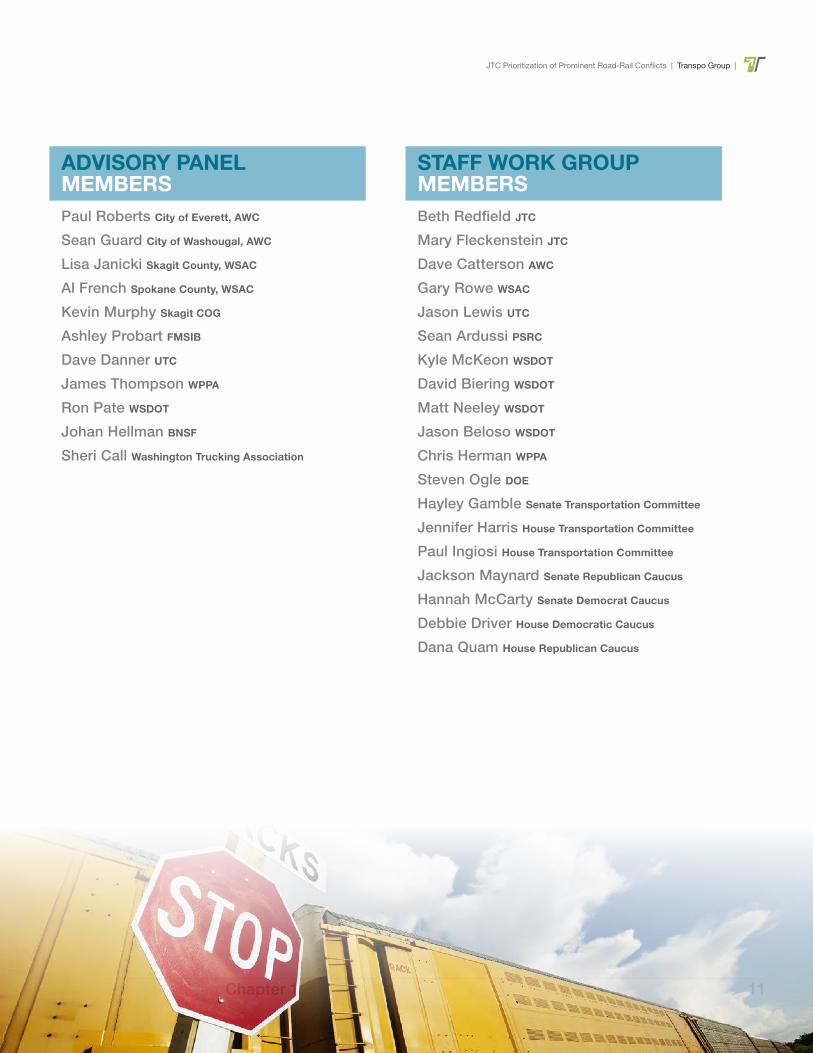
The work was guided by an eleven-member Advisory Panel made up of representatives of agencies and organizations across the state. The Advisory Panel met four times throughout the study – in May, August, September and November – and provided policy and
technical guidance on the identification of the evaluation criteria used to determine crossing priorities, development of the database and the prioritization process, how to maintain a statewide perspective, how the tool developed in the study might best be used and maintained in the future, and potential findings and recommendations from the study.
Additional support and direction was provided by a Staff Work Group made up of legislative staff and staff of the Advisory Panel members. While these groups provided valuable input to the consultants, the findings and recommendations are those of the consultant team.
Products of this study:- Database of at-grade crossings- Online mapping tool
JTC Prioritization of Prominent Road-Rail Conflicts | Transpo Group |
11Chapter 1
STAFF WORK GROUP MEMBERSBeth Redfield JTC
Mary Fleckenstein JTC
Dave Catterson AWC
Gary Rowe WSAC
Jason Lewis UTC
Sean Ardussi PSRC
Kyle McKeon WSDOT
David Biering WSDOT
Matt Neeley WSDOT
Jason Beloso WSDOT
Chris Herman WPPA
Steven Ogle DOE
Hayley Gamble Senate Transportation Committee
Jennifer Harris House Transportation Committee
Paul Ingiosi House Transportation Committee
Jackson Maynard Senate Republican Caucus
Hannah McCarty Senate Democrat Caucus
Debbie Driver House Democratic Caucus
Dana Quam House Republican Caucus
ADVISORY PANEL MEMBERSPaul Roberts City of Everett, AWC
Sean Guard City of Washougal, AWC
Lisa Janicki Skagit County, WSAC
Al French Spokane County, WSAC
Kevin Murphy Skagit COG
Ashley Probart FMSIB
Dave Danner UTC
James Thompson WPPA
Ron Pate WSDOT
Johan Hellman BNSF
Sheri Call Washington Trucking Association
| Transpo Group | JTC Prioritization of Prominent Road-Rail Conflicts
12
2 PRIORITIZATION PROCESSThe prioritization process utilized a wide range of criteria to create a data-driven approach to evaluating crossing locations. Evaluation criteria were critical to understanding the differences between crossings, and to rank the Top 300 crossings in the state. This chapter outlines the specific details regarding the prioritization process used in this study.
2.1 CROSSINGS, CORRIDORS, AND PROJECTSThe focus of the study was the evaluation of individual “crossings,” however “corridors” and “projects” are also discussed to understand how they could be considered in the prioritization process. Each term is distinctly different as a corridor could contain multiple crossings, and one crossing could contain multiple projects. Developing solutions to road-rail conflicts would lead to an identification of a project. A corridor strategy could identify one or more projects to improve traffic flow at multiple crossings. The following defines each term and confirms how each relates to one another.
Crossings are the intersection of roads and rail lines. The prioritization process is a data-driven approach, and the data sets used in the prioritization process are linked to discrete geographic points located at these road-rail crossings. In other words, a crossing database becomes the location where the data is stored to evaluate road-rail conflicts. Each crossing has its own characteristics that can have various levels of impact on the full transportation system.
Corridors represent groupings of crossings, often along the same rail line or multiple parallel lines with a common road crossing. Crossings on the same rail line will also have the same level of train activity, leading to interrelated impacts along multiple crossings. Corridor-based metrics are not intended to evaluate mobility of trains along the rail corridor, but rather how train movements impact the surrounding roadway transportation system, and the movement of people and goods through the roadway corridors in each community.
Projects that address road-rail conflicts typically are roadway improvements and can be implemented at individual crossings or at a corridor level. The needs of individual
JTC Prioritization of Prominent Road-Rail Conflicts | Transpo Group |
13
crossings can be determined by looking at specific crossing criteria. Identifying solutions takes a broader view of the corridor. For example, a grade-separation project could shift roadway traffic away from several other crossings and so this type of project is a corridor-based solution addressing the needs of several crossings.
One of the original objectives of the study was to consider a corridor-based prioritization process. However, to introduce a corridor-based prioritization without exploring solutions, identifying specific projects, engaging project teams from multiple juristictions and engineering disciplines, or knowing funding parameters, was challenging and potentially premature. This study compiles the database of crossings and ranks them according to needs. The database and crossing prioritization tool helps policy makers, state agencies, RTPOs and local jurisdictions to understand crossing impacts, leading to the next step of project identification and corridor-based solutions.
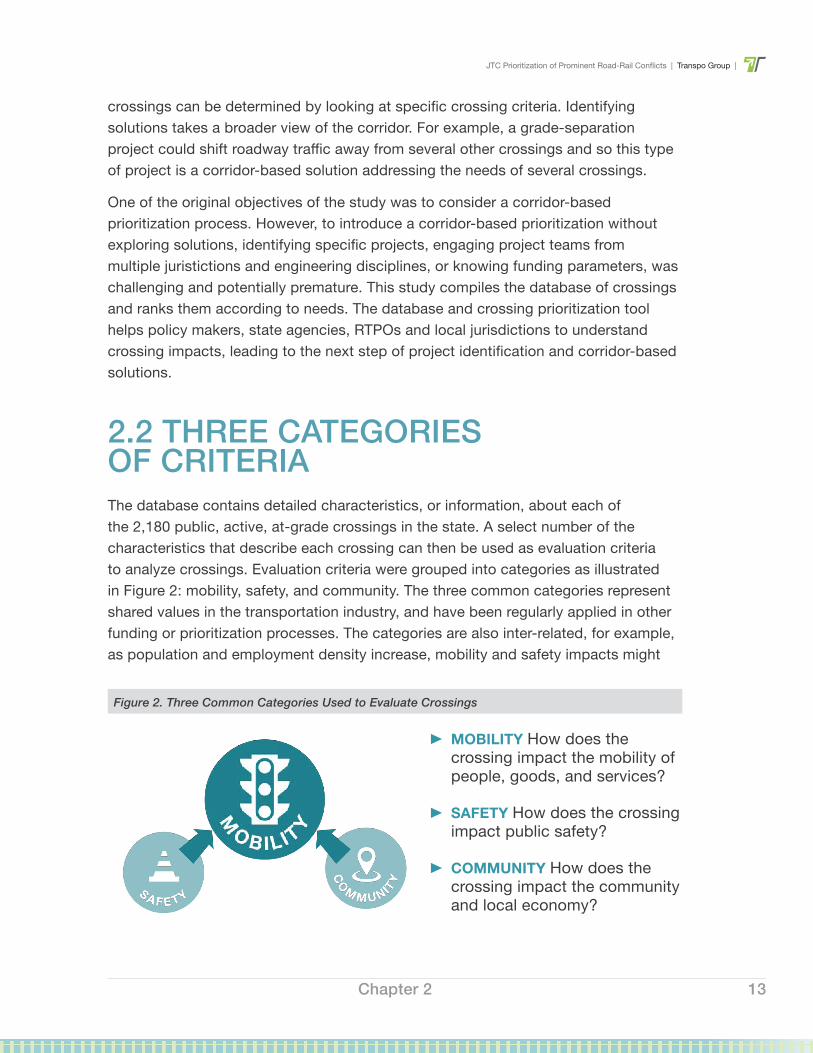
2.2 THREE CATEGORIES OF CRITERIAThe database contains detailed characteristics, or information, about each of the 2,180 public, active, at-grade crossings in the state. A select number of the characteristics that describe each crossing can then be used as evaluation criteria to analyze crossings. Evaluation criteria were grouped into categories as illustrated in Figure 2: mobility, safety, and community. The three common categories represent shared values in the transportation industry, and have been regularly applied in other funding or prioritization processes. The categories are also inter-related, for example, as population and employment density increase, mobility and safety impacts might
2 PRIORITIZATION PROCESSThe prioritization process utilized a wide range of criteria to create a data-driven approach to evaluating crossing locations. Evaluation criteria were critical to understanding the differences between crossings, and to rank the Top 300 crossings in the state. This chapter outlines the specific details regarding the prioritization process used in this study.
2.1 CROSSINGS, CORRIDORS, AND PROJECTSThe focus of the study was the evaluation of individual “crossings,” however “corridors” and “projects” are also discussed to understand how they could be considered in the prioritization process. Each term is distinctly different as a corridor could contain multiple crossings, and one crossing could contain multiple projects. Developing solutions to road-rail conflicts would lead to an identification of a project. A corridor strategy could identify one or more projects to improve traffic flow at multiple crossings. The following defines each term and confirms how each relates to one another.
Crossings are the intersection of roads and rail lines. The prioritization process is a data-driven approach, and the data sets used in the prioritization process are linked to discrete geographic points located at these road-rail crossings. In other words, a crossing database becomes the location where the data is stored to evaluate road-rail conflicts. Each crossing has its own characteristics that can have various levels of impact on the full transportation system.
Corridors represent groupings of crossings, often along the same rail line or multiple parallel lines with a common road crossing. Crossings on the same rail line will also have the same level of train activity, leading to interrelated impacts along multiple crossings. Corridor-based metrics are not intended to evaluate mobility of trains along the rail corridor, but rather how train movements impact the surrounding roadway transportation system, and the movement of people and goods through the roadway corridors in each community.
Projects that address road-rail conflicts typically are roadway improvements and can be implemented at individual crossings or at a corridor level. The needs of individual
Figure 2. Three Common Categories Used to Evaluate Crossings
Ҙ MOBILITY How does the crossing impact the mobility of people, goods, and services?
Ҙ SAFETY How does the crossing impact public safety?
Ҙ COMMUNITY How does the crossing impact the community and local economy?
Chapter 2
| Transpo Group | JTC Prioritization of Prominent Road-Rail Conflicts
14
be more pronounced. For purposes of this prioritization process, mobility criteria are weighted more heavily at 50% of the final score, with safety and community receiving weightings of 25% each. As will be discussed later in section 2.6, the weighting is designed to focus the prioritization results on mobility impacts, while still recognizing the importance of safety and community needs.
RELATIONSHIP WITH OTHER PROGRAMSThe three evaluation categories of mobility, safety and community reflect shared values in the state and national transportation industry. Many policies and programs at state and federal agencies, as well as transportation-related professional organizations are centered around these three categories. For example, mobility, safety, and economic vitality are three of the six Washington State Transportation System Policy Goals. Listed below are other groups, guidelines, and programs that list these categories as top criteria:
► Washington State Freight Mobility Strategic Investment Board ► Washington State Transportation Improvement Board ► California Public Utilities Commission for Rail Crossings Prioritization ► FHWA Railroad-Highway Grade Crossing Handbook ► USDOT TIGER Program
MOBILITY EVALUATIONBased on the study objectives and feedback from the Advisory Committee, the central focus of the study and prioritization effort was on mobility. This was not intended to diminish the importance of the other two evaluations (safety and community). The crossing’s impact on mobility of people, goods, and services was considered the driving force to address road-rail crossing impacts. In many ways, the different metrics within the crossing database were either directly or indirectly related to mobility metrics. Greater roadway traffic volumes (a mobility-related metric) would increase collision risks at crossings (a safety-related metric) and increase impacts to air pollution (a community-related metric). Furthermore, the level of detail of mobility metrics found in the database of crossings matches the intended use of a statewide tool. As discussed below, a primary focus on improving safety-related and community-related impacts would require site specific analyses not possible for a database of 2,180 at-grade crossings.
Local planning organizations can use this tool to evaluate solutions to road-rail conflicts on a corridor basis.
JTC Prioritization of Prominent Road-Rail Conflicts | Transpo Group |
15
SAFETY EVALUATIONHigh-level safety data, such as historical collisions, type of safety equipment present, and proximity to emergency service providers, were incorporated into the evaluation to assist in prioritizing the crossings. This safety data, in combination with the other criteria, is meant to highlight comprehensive crossing impacts. The inclusion of indicators of safety impacts strengthens the mobility-focused methodology. The combined strength of these categories recognizes that traffic volumes alone do not adequately represent a crossing’s impact on the public.
The safety data may be considered “indicator data” pointing to locations requiring further safety analysis, but cannot be used on their own to diagnose safety-related problems.
Detailed safety data for individual crossings is very limited. WSDOT and UTC have funding programs and processes in place to investigate, evaluate, and implement improvements primarily focused on locations with past collisions or where crossing geometrics do not meet existing standards. The crossing database and prioritization tool in this study is intended to complement rather than replace these existing safety programs and processes.
COMMUNITY EVALUATIONHigh-level human health and economic metrics such as population and employment densities, socio-economic indicators, emissions, and noise, were also incorporated in the prioritization process. The combined strength of these categories recognizes that traffic volumes alone do not adequately represent a crossing’s comprehensive impact on the local community. Like safety data, these community metrics were considered “indicator data” related to health and the economy, and the quality of life impacts at congested at-grade intersections.
Community impacts are important and hard to quantify. For example, the crossing may be considered critical to the development potential of specific areas, or it may be near care facilities whose patrons are especially sensitive to air pollution. The ranking of projects is intended to highlight crossings with the greatest overall impacts from a high-level statewide comparison. Local communities and MPOs will need to develop project solutions to address specific community-related needs of the area.
The prioritization tool is meant to compliment existing safety programs.
Chapter 2
| Transpo Group | JTC Prioritization of Prominent Road-Rail Conflicts
16
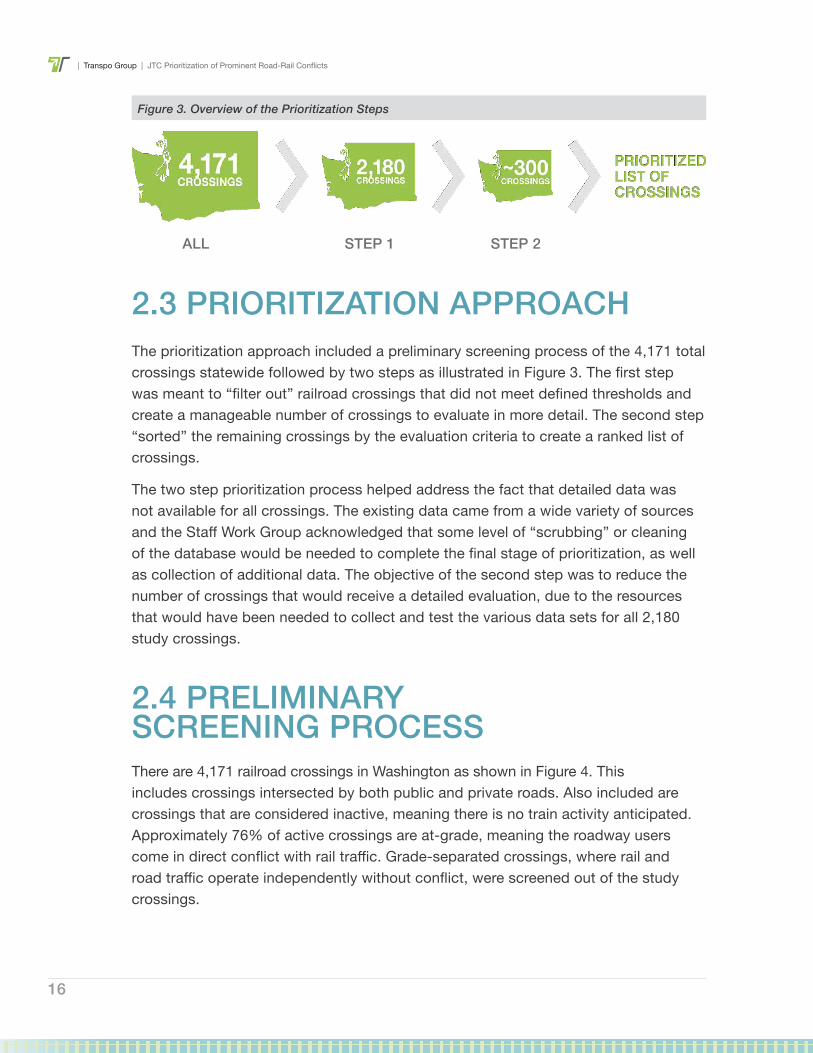
2.3 PRIORITIZATION APPROACHThe prioritization approach included a preliminary screening process of the 4,171 total crossings statewide followed by two steps as illustrated in Figure 3. The first step was meant to “filter out” railroad crossings that did not meet defined thresholds and create a manageable number of crossings to evaluate in more detail. The second step “sorted” the remaining crossings by the evaluation criteria to create a ranked list of crossings.
The two step prioritization process helped address the fact that detailed data was not available for all crossings. The existing data came from a wide variety of sources and the Staff Work Group acknowledged that some level of “scrubbing” or cleaning of the database would be needed to complete the final stage of prioritization, as well as collection of additional data. The objective of the second step was to reduce the number of crossings that would receive a detailed evaluation, due to the resources that would have been needed to collect and test the various data sets for all 2,180 study crossings.
2.4 PRELIMINARY SCREENING PROCESSThere are 4,171 railroad crossings in Washington as shown in Figure 4. This includes crossings intersected by both public and private roads. Also included are crossings that are considered inactive, meaning there is no train activity anticipated. Approximately 76% of active crossings are at-grade, meaning the roadway users come in direct conflict with rail traffic. Grade-separated crossings, where rail and road traffic operate independently without conflict, were screened out of the study crossings.
Figure 3. Overview of the Prioritization Steps
ALL STEP 1 STEP 2
JTC Prioritization of Prominent Road-Rail Conflicts | Transpo Group |
17
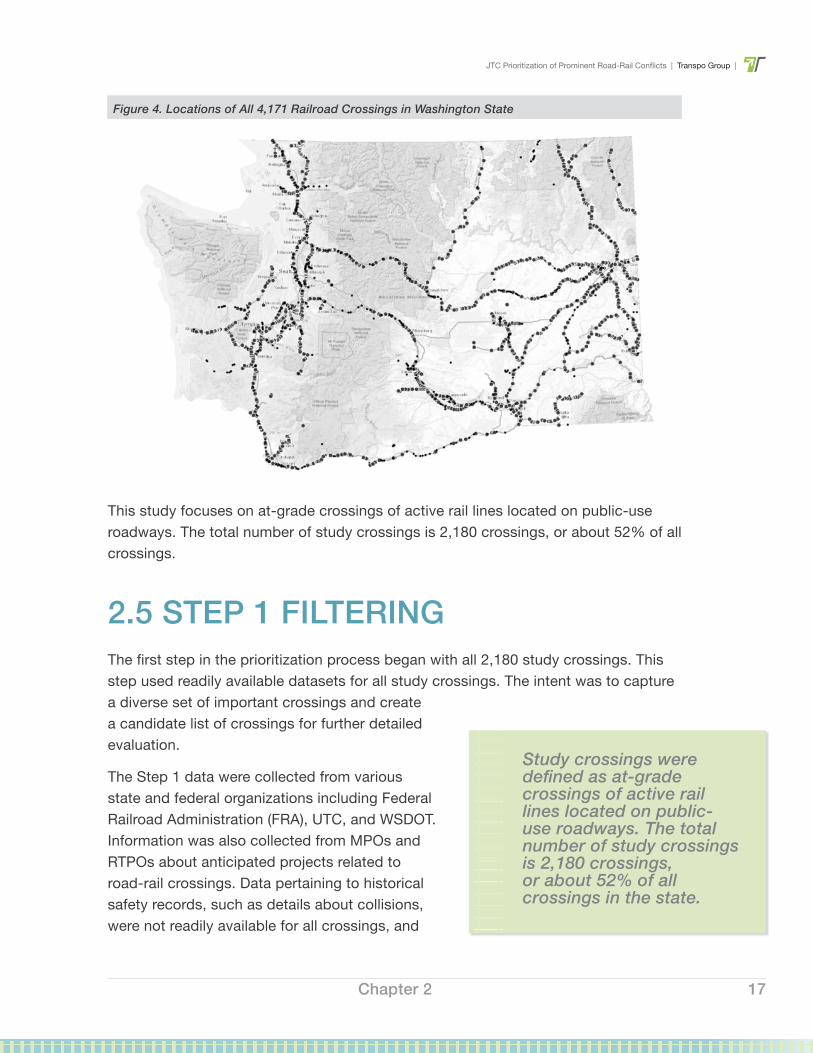
This study focuses on at-grade crossings of active rail lines located on public-use roadways. The total number of study crossings is 2,180 crossings, or about 52% of all crossings.
2.5 STEP 1 FILTERINGThe first step in the prioritization process began with all 2,180 study crossings. This step used readily available datasets for all study crossings. The intent was to capture a diverse set of important crossings and create a candidate list of crossings for further detailed evaluation.
The Step 1 data were collected from various state and federal organizations including Federal Railroad Administration (FRA), UTC, and WSDOT. Information was also collected from MPOs and RTPOs about anticipated projects related to road-rail crossings. Data pertaining to historical safety records, such as details about collisions, were not readily available for all crossings, and
Study crossings were defined as at-grade crossings of active rail lines located on public-use roadways. The total number of study crossings is 2,180 crossings, or about 52% of all crossings in the state.
Figure 4. Locations of All 4,171 Railroad Crossings in Washington State
Chapter 2
| Transpo Group | JTC Prioritization of Prominent Road-Rail Conflicts
18
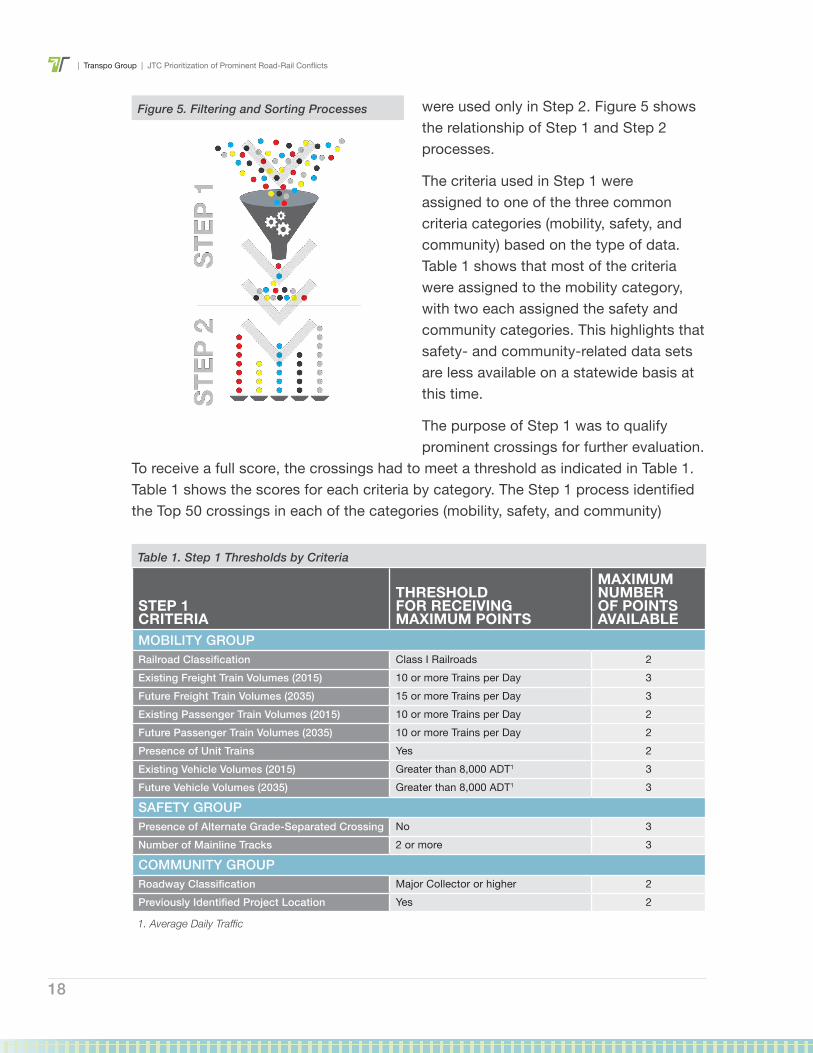
were used only in Step 2. Figure 5 shows the relationship of Step 1 and Step 2 processes.
The criteria used in Step 1 were assigned to one of the three common criteria categories (mobility, safety, and community) based on the type of data. Table 1 shows that most of the criteria were assigned to the mobility category, with two each assigned the safety and community categories. This highlights that safety- and community-related data sets are less available on a statewide basis at this time.
The purpose of Step 1 was to qualify prominent crossings for further evaluation.
To receive a full score, the crossings had to meet a threshold as indicated in Table 1. Table 1 shows the scores for each criteria by category. The Step 1 process identified the Top 50 crossings in each of the categories (mobility, safety, and community)
Table 1. Step 1 Thresholds by Criteria
STEP 1 CRITERIA
THRESHOLD FOR RECEIVING MAXIMUM POINTS
MAXIMUM NUMBER OF POINTS AVAILABLE
MOBILITY GROUPRailroad Classification Class I Railroads 2Existing Freight Train Volumes (2015) 10 or more Trains per Day 3Future Freight Train Volumes (2035) 15 or more Trains per Day 3Existing Passenger Train Volumes (2015) 10 or more Trains per Day 2Future Passenger Train Volumes (2035) 10 or more Trains per Day 2Presence of Unit Trains Yes 2Existing Vehicle Volumes (2015) Greater than 8,000 ADT1 3Future Vehicle Volumes (2035) Greater than 8,000 ADT1 3
SAFETY GROUPPresence of Alternate Grade-Separated Crossing No 3Number of Mainline Tracks 2 or more 3
COMMUNITY GROUPRoadway Classification Major Collector or higher 2Previously Identified Project Location Yes 2
1. Average Daily Traffic
Figure 5. Filtering and Sorting Processes
JTC Prioritization of Prominent Road-Rail Conflicts | Transpo Group |
19
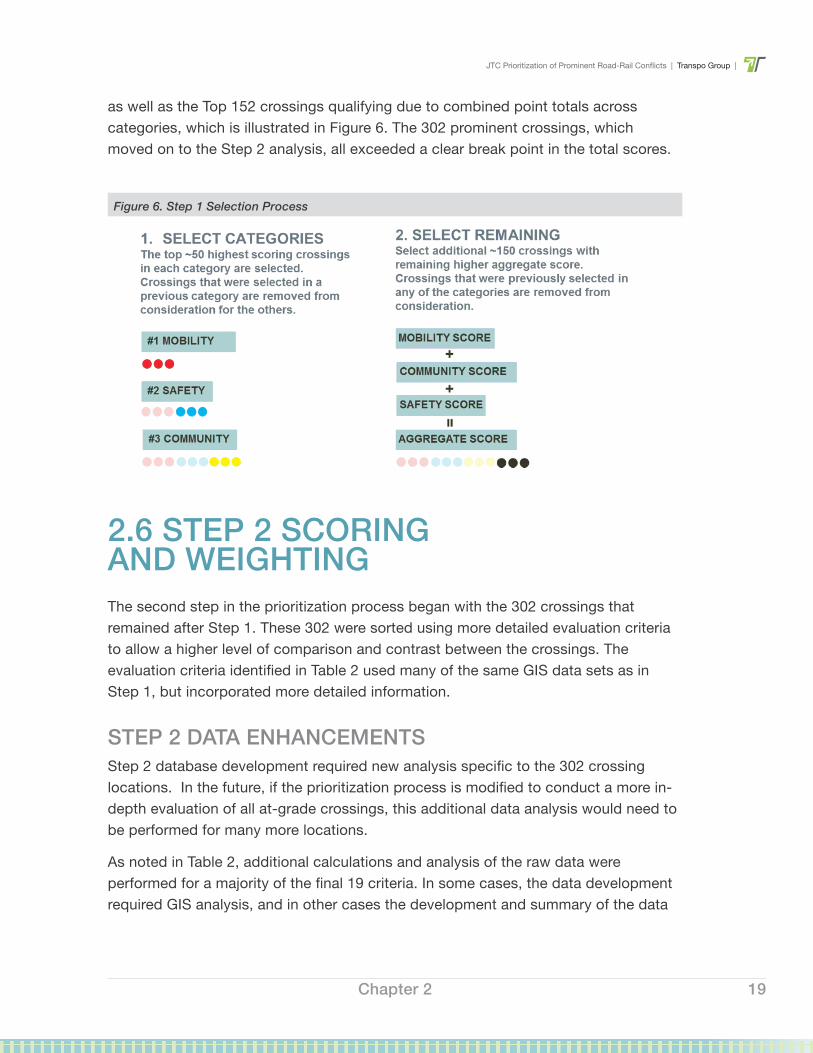
as well as the Top 152 crossings qualifying due to combined point totals across categories, which is illustrated in Figure 6. The 302 prominent crossings, which moved on to the Step 2 analysis, all exceeded a clear break point in the total scores.
2.6 STEP 2 SCORING AND WEIGHTINGThe second step in the prioritization process began with the 302 crossings that remained after Step 1. These 302 were sorted using more detailed evaluation criteria to allow a higher level of comparison and contrast between the crossings. The evaluation criteria identified in Table 2 used many of the same GIS data sets as in Step 1, but incorporated more detailed information.
STEP 2 DATA ENHANCEMENTSStep 2 database development required new analysis specific to the 302 crossing locations. In the future, if the prioritization process is modified to conduct a more in-depth evaluation of all at-grade crossings, this additional data analysis would need to be performed for many more locations.
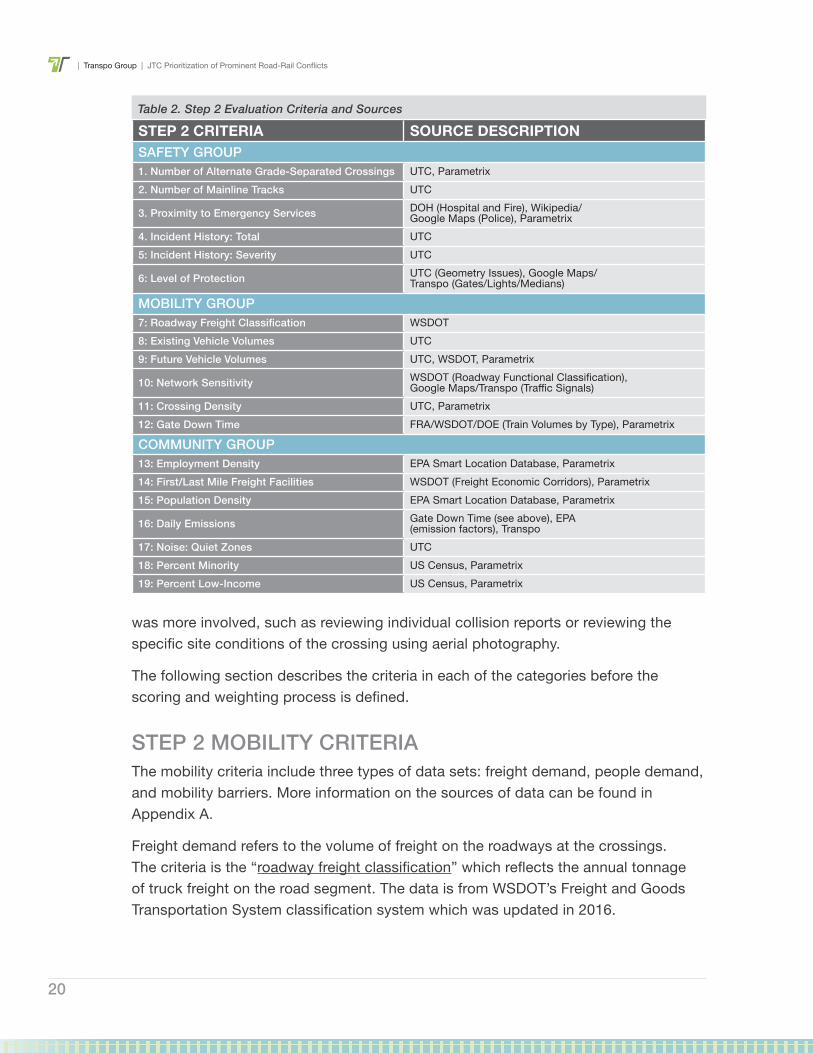
As noted in Table 2, additional calculations and analysis of the raw data were performed for a majority of the final 19 criteria. In some cases, the data development required GIS analysis, and in other cases the development and summary of the data
Figure 6. Step 1 Selection Process
Chapter 2
| Transpo Group | JTC Prioritization of Prominent Road-Rail Conflicts
20
was more involved, such as reviewing individual collision reports or reviewing the specific site conditions of the crossing using aerial photography.
The following section describes the criteria in each of the categories before the scoring and weighting process is defined.
STEP 2 MOBILITY CRITERIAThe mobility criteria include three types of data sets: freight demand, people demand, and mobility barriers. More information on the sources of data can be found in Appendix A.
Freight demand refers to the volume of freight on the roadways at the crossings. The criteria is the “roadway freight classification” which reflects the annual tonnage of truck freight on the road segment. The data is from WSDOT’s Freight and Goods Transportation System classification system which was updated in 2016.
Table 2. Step 2 Evaluation Criteria and Sources
STEP 2 CRITERIA SOURCE DESCRIPTIONSAFETY GROUP1. Number of Alternate Grade-Separated Crossings UTC, Parametrix2. Number of Mainline Tracks UTC
3. Proximity to Emergency Services DOH (Hospital and Fire), Wikipedia/Google Maps (Police), Parametrix
4. Incident History: Total UTC5: Incident History: Severity UTC
6: Level of Protection UTC (Geometry Issues), Google Maps/Transpo (Gates/Lights/Medians)
MOBILITY GROUP7: Roadway Freight Classification WSDOT8: Existing Vehicle Volumes UTC9: Future Vehicle Volumes UTC, WSDOT, Parametrix
10: Network Sensitivity WSDOT (Roadway Functional Classification), Google Maps/Transpo (Traffic Signals)
11: Crossing Density UTC, Parametrix12: Gate Down Time FRA/WSDOT/DOE (Train Volumes by Type), Parametrix
COMMUNITY GROUP13: Employment Density EPA Smart Location Database, Parametrix14: First/Last Mile Freight Facilities WSDOT (Freight Economic Corridors), Parametrix15: Population Density EPA Smart Location Database, Parametrix
16: Daily Emissions Gate Down Time (see above), EPA (emission factors), Transpo
17: Noise: Quiet Zones UTC18: Percent Minority US Census, Parametrix19: Percent Low-Income US Census, Parametrix
JTC Prioritization of Prominent Road-Rail Conflicts | Transpo Group |
21
People demand refers to the volume of vehicle traffic on the roadways at the crossings. The criteria are “existing vehicle volumes” and “future vehicle volumes” on the road segment.
Mobility barriers refers to the barriers that the crossing creates for overall vehicle mobility in the area. There are three criteria to reflect types of barriers. The crossing “gate down time” reflects the most basic barrier to mobility: the time vehicles must wait for a train to pass. The impacts of a crossing closure due to train activity is compounded with the two other barrier metrics. One is “network sensitivity,” which measures how close the crossing is to major intersections, traffic signals, and major urban roadway systems. Traffic at crossings close to major transportation facilities takes more time to clear after the crossing gates rise and is considered more sensitive to gate down time impacts. The other criteria, “crossing density,” reflects the fact that closely spaced at-grade crossings would all be closed at the same time due to one train. The higher the crossing density, the more overall mobility in the area is limited by a single train.
STEP 2 SAFETY CRITERIAThe safety criteria include three types of data sets: increase risks, safety record, and infrastructure status, as shown in Table 3.
Increase risks to safety refer to the type of conditions that increase the overall safety risk at the road-rail crossing intersection. There are three criteria used to account for risks. The first is “number of alternate grade-separated crossings.” Grade-separated crossings provide uninterrupted access across the corridor for emergency services or other vehicles. With fewer grade-separated crossing options, response times may increase for emergency providers and more vehicles will be concentrated at at-grade crossings, resulting in increased exposure risks. The second criteria is “number of mainline tracks.” Multiple tracks create an inherent safety risk as drivers may not expect a second train appearing on a different track and may choose to ignore safety warnings. The third criteria is “proximity to emergency services,” which reflects the fact that if a crossing is near an emergency facility, it has a higher risk of impacting emergency response times.
Safety record refers to the incident history at the crossing including vehicle, pedestrian, and bicycle collisions with trains. There are two criteria. The first criteria reflects “total incident history” meaning the total number of safety incidents. The second criteria, “incident history: severity,” adds weight to incident scoring based on the severity of the collision. For example, fatalities would be the most severe, followed by collisions resulting with an injury, then collisions only involving property damage.
Chapter 2
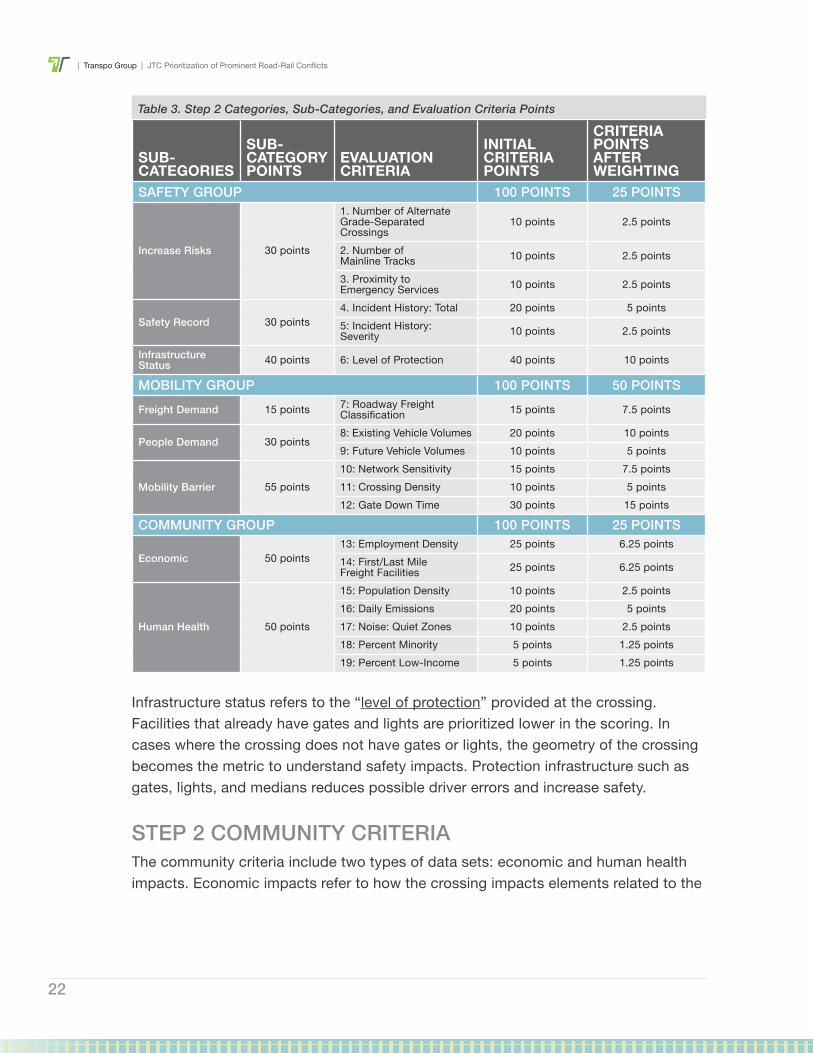
| Transpo Group | JTC Prioritization of Prominent Road-Rail Conflicts
22
Infrastructure status refers to the “level of protection” provided at the crossing. Facilities that already have gates and lights are prioritized lower in the scoring. In cases where the crossing does not have gates or lights, the geometry of the crossing becomes the metric to understand safety impacts. Protection infrastructure such as gates, lights, and medians reduces possible driver errors and increase safety.
STEP 2 COMMUNITY CRITERIAThe community criteria include two types of data sets: economic and human health impacts. Economic impacts refer to how the crossing impacts elements related to the
SUB-CATEGORIES
SUB-CATEGORY POINTS
EVALUATION CRITERIA
INITIAL CRITERIA POINTS
CRITERIA POINTS AFTER WEIGHTING
SAFETY GROUP 100 POINTS 25 POINTS
Increase Risks 30 points
1. Number of Alternate Grade-Separated Crossings
10 points 2.5 points
2. Number of Mainline Tracks 10 points 2.5 points
3. Proximity to Emergency Services 10 points 2.5 points
Safety Record 30 points4. Incident History: Total 20 points 5 points5: Incident History: Severity 10 points 2.5 points
Infrastructure Status 40 points 6: Level of Protection 40 points 10 points
MOBILITY GROUP 100 POINTS 50 POINTSFreight Demand 15 points 7: Roadway Freight
Classification 15 points 7.5 points
People Demand 30 points8: Existing Vehicle Volumes 20 points 10 points9: Future Vehicle Volumes 10 points 5 points
Mobility Barrier 55 points10: Network Sensitivity 15 points 7.5 points11: Crossing Density 10 points 5 points12: Gate Down Time 30 points 15 points
COMMUNITY GROUP 100 POINTS 25 POINTS
Economic 50 points13: Employment Density 25 points 6.25 points14: First/Last Mile Freight Facilities 25 points 6.25 points
Human Health 50 points
15: Population Density 10 points 2.5 points16: Daily Emissions 20 points 5 points17: Noise: Quiet Zones 10 points 2.5 points18: Percent Minority 5 points 1.25 points19: Percent Low-Income 5 points 1.25 points
Table 3. Step 2 Categories, Sub-Categories, and Evaluation Criteria Points
JTC Prioritization of Prominent Road-Rail Conflicts | Transpo Group |
23Chapter 2
community’s economy. The first criteria is “employment density,” meaning that if a crossing is located in an area with a large number of employees, then crossing issues could impact overall employment activities. The second is “first-and-last mile freight facilities,” meaning that if the crossing is near these key freight facilities, the crossing could impact freight-related businesses in the community.
Human health impacts refer to crossings that could impact the overall health of community residents. The five health related criteria include “population density” (more people produce more impacts), “noise” (quality of life issues), “daily emissions” (vehicle pollution due to idling cars and trucks), “percent minority,” (percent of population that is minority) and “percent low-income” (percent of population that is low-income). More detailed definitions are described in Chapter 4.
SCORING AND WEIGHTING THE CROSSINGSUnlike Step 1 scoring, the Step 2 process uses a sliding scale to assign points for each of the evaluation criteria. In other words, a crossing could get partial points depending on the value of the criteria. In most cases, the maximum points go to the 90th-percentile value, so that crossings with unusually high impacts do not skew the scale against which others are measured. That means about 30 of the 302 crossings would receive maximum points, with the remaining crossings receiving partial or no points. By using a sliding scale for points, the scoring is more sensitive to each metric and overall scores are less likely to result in a tie. This promotes a more robust way to prioritize and rank the final list of crossings.
The structure of scoring is based on a 100-point scale. Mobility scores, safety scores, and community scores each separately receive 100 points. Those points are sub-divided into the 19 criteria used in Step 2 as shown in Table 3.
These resulting scores are then weighted to achieve an overall score for the crossing which is also a 100-point scale. Three different weighting strategies were tested to understand impacts to rankings.
One strategy was to weight mobility, safety, and community equally. This strategy had the effect of increasing the rankings of crossings with relatively minor vehicle or train volumes, which are key contributors to road-rail conflicts.
Another strategy was to focus exclusively on the mobility criteria and ignore the safety and community criteria. The problem with a mobility-only weighting option was that safety and community factors still play an important role in ranking crossing impacts.
| Transpo Group | JTC Prioritization of Prominent Road-Rail Conflicts
24
The final weighting strategy is meant to put more focus on mobility, but still reflect the elements of safety and community. The final score for each crossing reflects weighting mobility at 50%, safety at 25%, and community at 25%. Table 3 shows what the relative criteria points become after the weighting is applied.
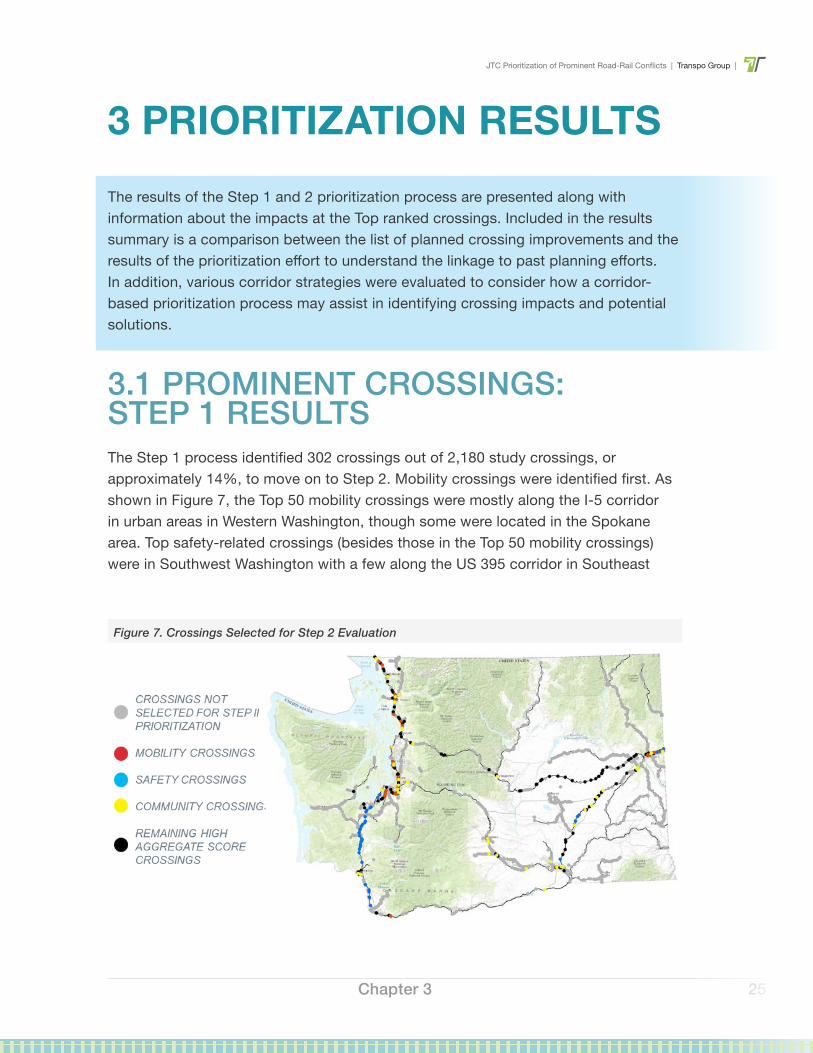
JTC Prioritization of Prominent Road-Rail Conflicts | Transpo Group |
25
3 PRIORITIZATION RESULTSThe results of the Step 1 and 2 prioritization process are presented along with information about the impacts at the Top ranked crossings. Included in the results summary is a comparison between the list of planned crossing improvements and the results of the prioritization effort to understand the linkage to past planning efforts. In addition, various corridor strategies were evaluated to consider how a corridor-based prioritization process may assist in identifying crossing impacts and potential solutions.
3.1 PROMINENT CROSSINGS: STEP 1 RESULTSThe Step 1 process identified 302 crossings out of 2,180 study crossings, or approximately 14%, to move on to Step 2. Mobility crossings were identified first. As shown in Figure 7, the Top 50 mobility crossings were mostly along the I-5 corridor in urban areas in Western Washington, though some were located in the Spokane area. Top safety-related crossings (besides those in the Top 50 mobility crossings) were in Southwest Washington with a few along the US 395 corridor in Southeast
Chapter 3
Figure 7. Crossings Selected for Step 2 Evaluation
| Transpo Group | JTC Prioritization of Prominent Road-Rail Conflicts
26
Washington. The community and remaining high aggregate score crossings were distributed throughout the state.
Step 1 methodology was purposely developed to identify a wide spectrum of crossings with different characteristics and also incorporate a range of crossings from all areas of the state. The goal was to include all important crossings, which is the subject of a more detailed analysis as part of Step 2.
FINDINGS: STATISTICS DESCRIBING THE AT-GRADE CROSSINGS SELECTEDThe data collected for this prioritization study may also serve as a means to understand the nature of the potential impacts experienced at at-grade crossings around the state.
Of the 302 prominent crossings:
► 84% have over 10 freight trains per day ► 79% do not have a nearby alternative route with a grade separated crossing ► 77% have unit trains present ► 71% are on major collectors, arterials, or state highways ► 41% have a regionally prioritized project identified ► 35% have 2 or more mainline tracks for vehicle traffic to cross ► 33% have over 8,000 daily vehicle trips ► 31% have more than 10 passenger trains per day
For more detail on these findings, please see the Step 1 Report Card in Appendix B.
DISCUSSION ON CROSSINGS NOT SELECTEDThe reduction in crossings to 302 created a more manageable data set to evaluate in a more detailed way, while moving as many crossings forward as possible. In some cases, crossings important to some communities did not make it through Step 1. The general reasons for crossings not moving to Step 2 are that they did not meet basic thresholds. Crossings that were not on rail mainlines, not on arterial roadways, or had low vehicle volumes did not score as high. Lack of previously defined project or the presence of a nearby grade-separated route also reduced scores.
For example, there are several crossings near the Port of Grays Harbor that did not advance to Step 2. These crossings did not score well in community metrics because
JTC Prioritization of Prominent Road-Rail Conflicts | Transpo Group |
27
of a lack of projects or low roadway classification (rail is adjacent to major roads, but rarely crosses major roads in the area). From a mobility perspective, train and vehicle volumes are lower, and the rail corridor is not considered a mainline route. From a safety perspective, it is mostly a single track with nearby grade-separated crossings.
Another example is the City of Sunnyside which is nearly encircled by rail lines, with over a dozen crossings located on three of the four sides of the city. The tracks are not a mainline, and volumes for trains and vehicles are lower. There are no defined projects. Based on the Step 1 criteria, none of the crossings were selected.
To capture crossings such as the ones near the Port of Grays Harbor or Sunnyside would likely require expanding Step 2 crossings to a larger number, leading to questions about manageability of the data sets. Alternatively, if train volumes and lengths were to increase substantially along the route, the crossings would likely rank higher on a statewide basis and make it into the Step 2 process. The Step 1 process can be updated in the future as data about each crossing changes to confirm that the Top crossings receive a more detailed evaluation as part of Step 2.
3.2 TOP PRIORITY CROSSINGS: STEP 2 RESULTSIn Step 2, the 302 prominent crossings which qualified for further analysis were ranked based on weighted scores as was discussed in Section 2.6. The crossing locations were sorted into three categories for purposes of reporting and summarizing. The categories included the Top 50 locations, the locations ranked from 51 to 100, and the remaining crossing locations between 101 and 302, as shown in Figure 8.
The Top 50 crossings are located throughout the state. They are typically located within an urban area, along a mainline railroad track, and on a major roadway corridor. Table 4 lists the Top 50 crossings in order from highest to lowest score. Any previously identified project that would impact the crossing is also listed in the table. A majority of the locations are within the Puget Sound region, but others are located north in Skagit and Whatcom Counties, south in Lewis County, and east in Yakima and Spokane Counties. It is important to note that if data improves, the relative rankings could change.
Chapter 3
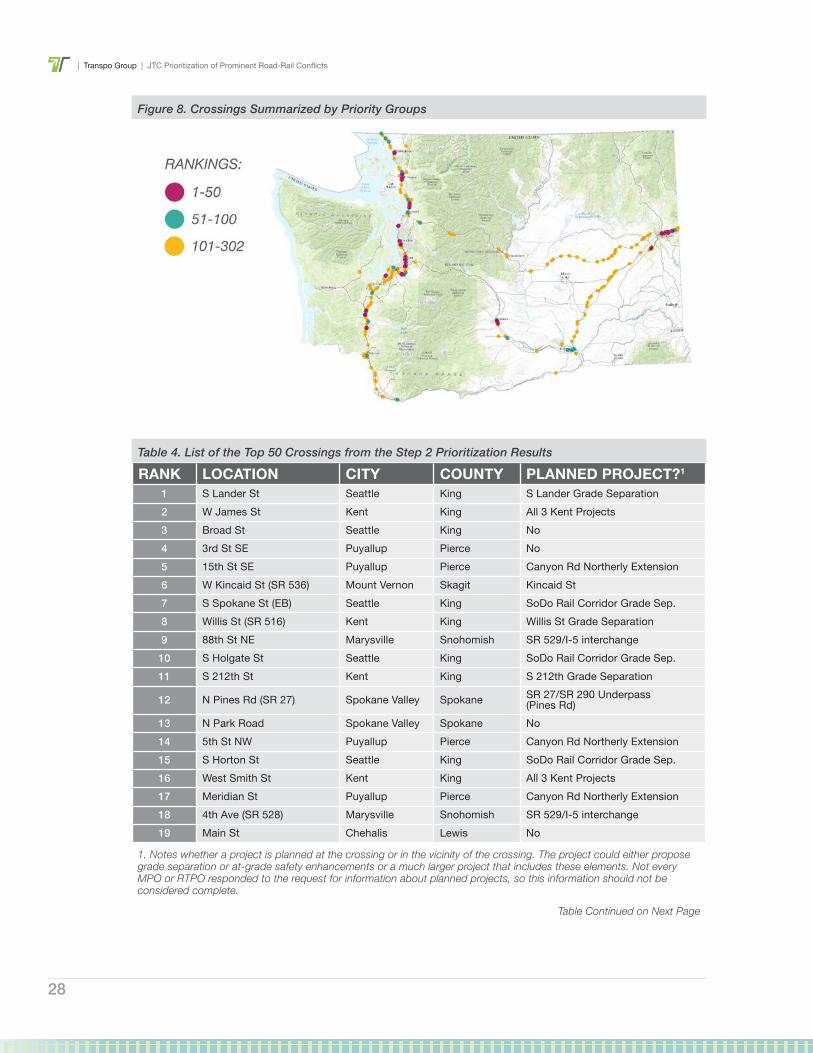
| Transpo Group | JTC Prioritization of Prominent Road-Rail Conflicts
28
RANK LOCATION CITY COUNTY PLANNED PROJECT?1
1 S Lander St Seattle King S Lander Grade Separation2 W James St Kent King All 3 Kent Projects3 Broad St Seattle King No4 3rd St SE Puyallup Pierce No5 15th St SE Puyallup Pierce Canyon Rd Northerly Extension6 W Kincaid St (SR 536) Mount Vernon Skagit Kincaid St7 S Spokane St (EB) Seattle King SoDo Rail Corridor Grade Sep.8 Willis St (SR 516) Kent King Willis St Grade Separation9 88th St NE Marysville Snohomish SR 529/I-5 interchange
10 S Holgate St Seattle King SoDo Rail Corridor Grade Sep.11 S 212th St Kent King S 212th Grade Separation
12 N Pines Rd (SR 27) Spokane Valley Spokane SR 27/SR 290 Underpass (Pines Rd)
13 N Park Road Spokane Valley Spokane No14 5th St NW Puyallup Pierce Canyon Rd Northerly Extension15 S Horton St Seattle King SoDo Rail Corridor Grade Sep.16 West Smith St Kent King All 3 Kent Projects17 Meridian St Puyallup Pierce Canyon Rd Northerly Extension18 4th Ave (SR 528) Marysville Snohomish SR 529/I-5 interchange19 Main St Chehalis Lewis No
1. Notes whether a project is planned at the crossing or in the vicinity of the crossing. The project could either propose grade separation or at-grade safety enhancements or a much larger project that includes these elements. Not every MPO or RTPO responded to the request for information about planned projects, so this information should not be considered complete.
Table Continued on Next Page
Table 4. List of the Top 50 Crossings from the Step 2 Prioritization Results
Figure 8. Crossings Summarized by Priority Groups
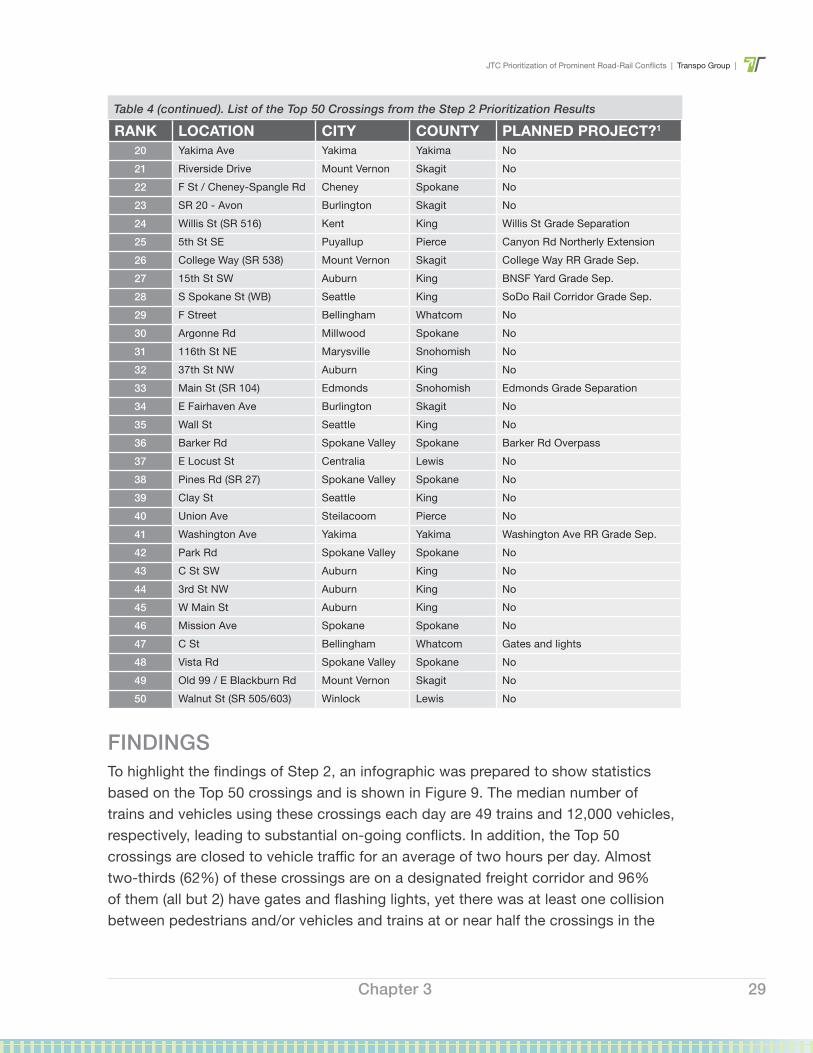
JTC Prioritization of Prominent Road-Rail Conflicts | Transpo Group |
29
FINDINGSTo highlight the findings of Step 2, an infographic was prepared to show statistics based on the Top 50 crossings and is shown in Figure 9. The median number of trains and vehicles using these crossings each day are 49 trains and 12,000 vehicles, respectively, leading to substantial on-going conflicts. In addition, the Top 50 crossings are closed to vehicle traffic for an average of two hours per day. Almost two-thirds (62%) of these crossings are on a designated freight corridor and 96% of them (all but 2) have gates and flashing lights, yet there was at least one collision between pedestrians and/or vehicles and trains at or near half the crossings in the
Chapter 3
RANK LOCATION CITY COUNTY PLANNED PROJECT?1
20 Yakima Ave Yakima Yakima No21 Riverside Drive Mount Vernon Skagit No22 F St / Cheney-Spangle Rd Cheney Spokane No23 SR 20 - Avon Burlington Skagit No24 Willis St (SR 516) Kent King Willis St Grade Separation25 5th St SE Puyallup Pierce Canyon Rd Northerly Extension26 College Way (SR 538) Mount Vernon Skagit College Way RR Grade Sep.27 15th St SW Auburn King BNSF Yard Grade Sep.28 S Spokane St (WB) Seattle King SoDo Rail Corridor Grade Sep.29 F Street Bellingham Whatcom No30 Argonne Rd Millwood Spokane No31 116th St NE Marysville Snohomish No32 37th St NW Auburn King No33 Main St (SR 104) Edmonds Snohomish Edmonds Grade Separation34 E Fairhaven Ave Burlington Skagit No35 Wall St Seattle King No36 Barker Rd Spokane Valley Spokane Barker Rd Overpass37 E Locust St Centralia Lewis No38 Pines Rd (SR 27) Spokane Valley Spokane No39 Clay St Seattle King No40 Union Ave Steilacoom Pierce No41 Washington Ave Yakima Yakima Washington Ave RR Grade Sep.42 Park Rd Spokane Valley Spokane No43 C St SW Auburn King No44 3rd St NW Auburn King No45 W Main St Auburn King No46 Mission Ave Spokane Spokane No47 C St Bellingham Whatcom Gates and lights48 Vista Rd Spokane Valley Spokane No49 Old 99 / E Blackburn Rd Mount Vernon Skagit No50 Walnut St (SR 505/603) Winlock Lewis No
Table 4 (continued). List of the Top 50 Crossings from the Step 2 Prioritization Results
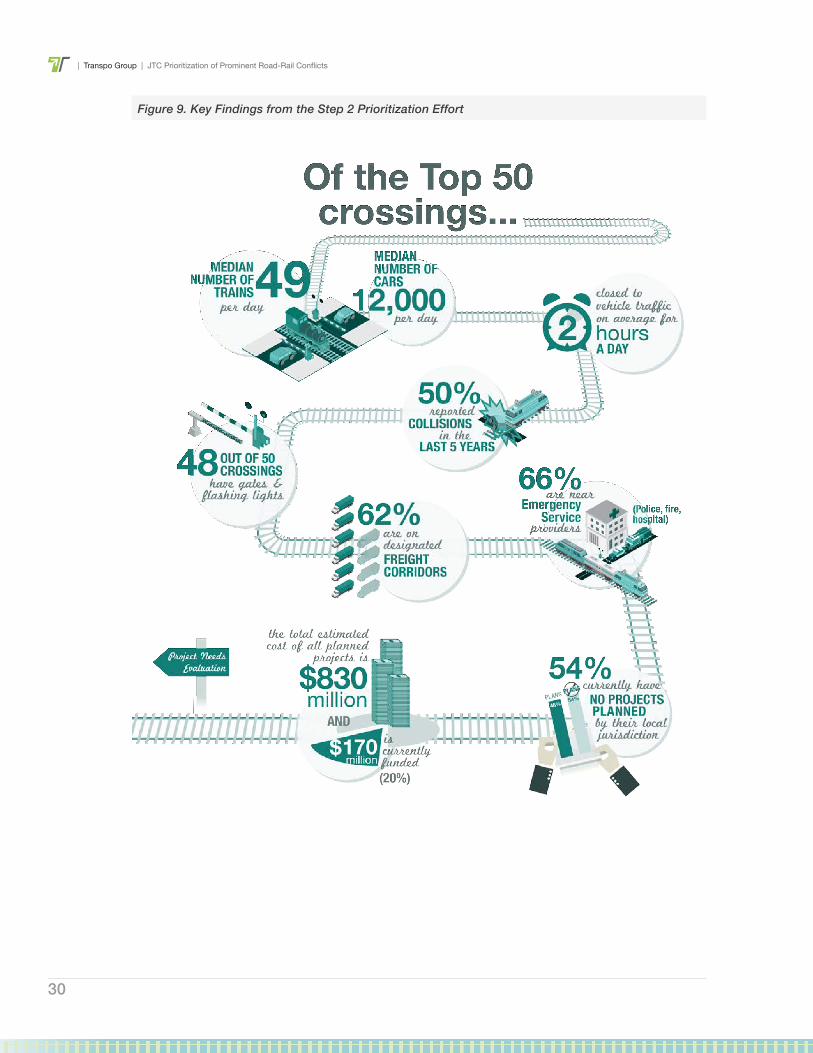
| Transpo Group | JTC Prioritization of Prominent Road-Rail Conflicts
30
Figure 9. Key Findings from the Step 2 Prioritization Effort
JTC Prioritization of Prominent Road-Rail Conflicts | Transpo Group |
31
last five years. Almost two-thirds (66%) are in close proximity to emergency providers leading to potential delays for public safety services.
Figure 9 highlights that the Top 50 crossings have substantial road-rail conflicts, but these crossings already have gates and flashing lights. Furthermore, some local agencies have taken the initiative to identify projects to address the mobility needs at crossings. While there are existing state and federal funding programs for safety measures, such as gates and lights, they do not address the mobility issues experienced by freight and non-freight related vehicle traffic at crossings. In other words, there are limited statewide programs to address the broader context of road-rail conflicts, even as more narrowly-focused existing programs have been largely successful.
DISCUSSION OF RELATIONSHIP WITH IDENTIFIED PLANNED PROJECTS Table 4 shows that 23 of the Top 50 projects, or less than half, have an associated project. The estimated costs of these projects is $830 million, of which only about $170 million is funded.1 The UTC and WSDOT were members of the Advisory Panel and reported that their crossing safety programs receive more applications than they can fund, pointing to the need for additional investments in grade crossings to improve mobility and further bolster efforts to enhance safety. It is worth noting that not every MPO or RTPO responded to the request for information about planned projects, this information should not be considered complete.
While not all crossings in the Top 50 may need an associated project, some jurisdictions may have not yet identified and prioritized needed crossing improvements. It is likely that when crossing improvements compete with other local funding priorities including funding for preliminary design, they often rank lower than other priorities. This may be due to information found in this crossing database not being compiled or as accessible in the past to local agencies.
However, there are cases where a crossing is a high priority for a community as indicated by a planned project, but does not rank near the Top when compared to crossings across the state. Low ranking crossing locations with projects were generally at crossings with lower train and traffic volumes, and in non-urban areas. Although crossings with proposed projects may not rank high on a statewide basis, site-specific congestion issues or mobility needs due to planned economic development or unique situations may still justify the need for the projects. This
1. Funding includes Connecting WA, FMSIB, federal and local funds as follows: $55 million for SR 529/I-5 in Marysville; $18 million for S 228th in Kent; and $100 million for Lander in Seattle.
Chapter 3
| Transpo Group | JTC Prioritization of Prominent Road-Rail Conflicts
32
highlights that a statewide database such as this is a key tool in identifying the magnitude of crossing needs, but policies around site-specific solutions may also be needed in ranking future projects (not crossings) on a statewide basis.
It is important to highlight that a single project may be listed as a solution for multiple crossings listed in Table 4. This reinforces the idea of using corridors to help identify solutions for road-rail conflicts. Many RTPOs have already identified planning solutions at the corridor level, based on the needs of individual crossings.
3.3 CORRIDOR-BASED EVALUATIONOne of the study objectives was to consider a “corridor-based prioritization process” as part of the analysis. When evaluating corridors (a group of crossings), information about each individual crossing within a corridor would be critical to understanding impacts to the corridor and potential solutions to improve network traffic flow within the corridor. Therefore, the database of individual at-grade crossings is a key foundation for any type of corridor-based evaluation.
To consider how a possible corridor-based evaluation process could work, the crossings were summarized by three geographical groupings: major rail corridors, rail corridors by RTPO boundaries, and smaller distinct rail corridors (by cities) where transportation projects were already identified.
Given that 70% of the 302 prominent crossings are inside city limits, and conversely only 30% are outside city limits, a corridor-based approach might seek to address non-urban crossings separately from those within city limits. Another interpretation of the corridor approach could involve ranking crossings within a designated corridor as an alternative to the statewide ranking. This would mean that places with relatively low traffic (road or rail) would rank higher in their own region.
CROSSINGS BY RAIL CORRIDORCrossings were summarized by six major Washington State rail corridors. These are the same six corridors used in the Marine Cargo Forecast. Figure 10 shows the location and name of each of the corridors.
The Bellingham and Seattle corridors are north-south corridors within western Washington generally following the I-5 corridor. The Lakeside corridor in eastern Washington connects Spokane to the Tri-Cities area. The other three corridors are east-west corridors connecting between western and eastern Washington. Stevens
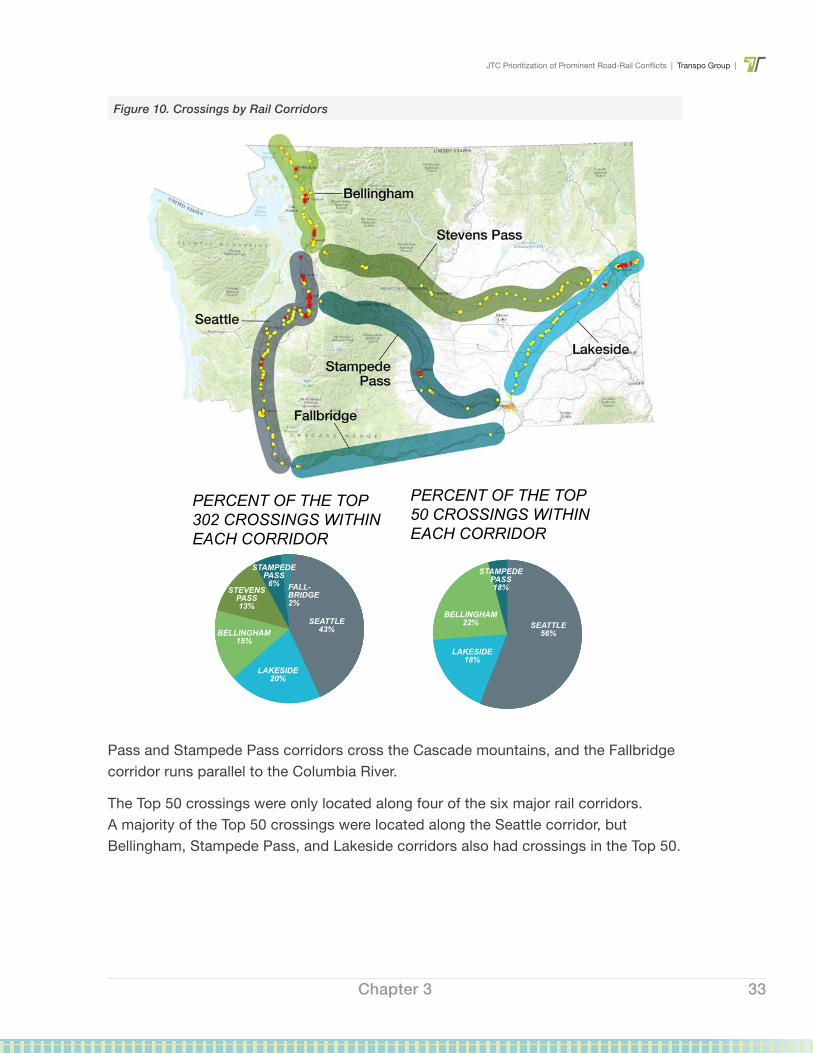
JTC Prioritization of Prominent Road-Rail Conflicts | Transpo Group |
33
Pass and Stampede Pass corridors cross the Cascade mountains, and the Fallbridge corridor runs parallel to the Columbia River.
The Top 50 crossings were only located along four of the six major rail corridors. A majority of the Top 50 crossings were located along the Seattle corridor, but Bellingham, Stampede Pass, and Lakeside corridors also had crossings in the Top 50.
Chapter 3
Figure 10. Crossings by Rail Corridors
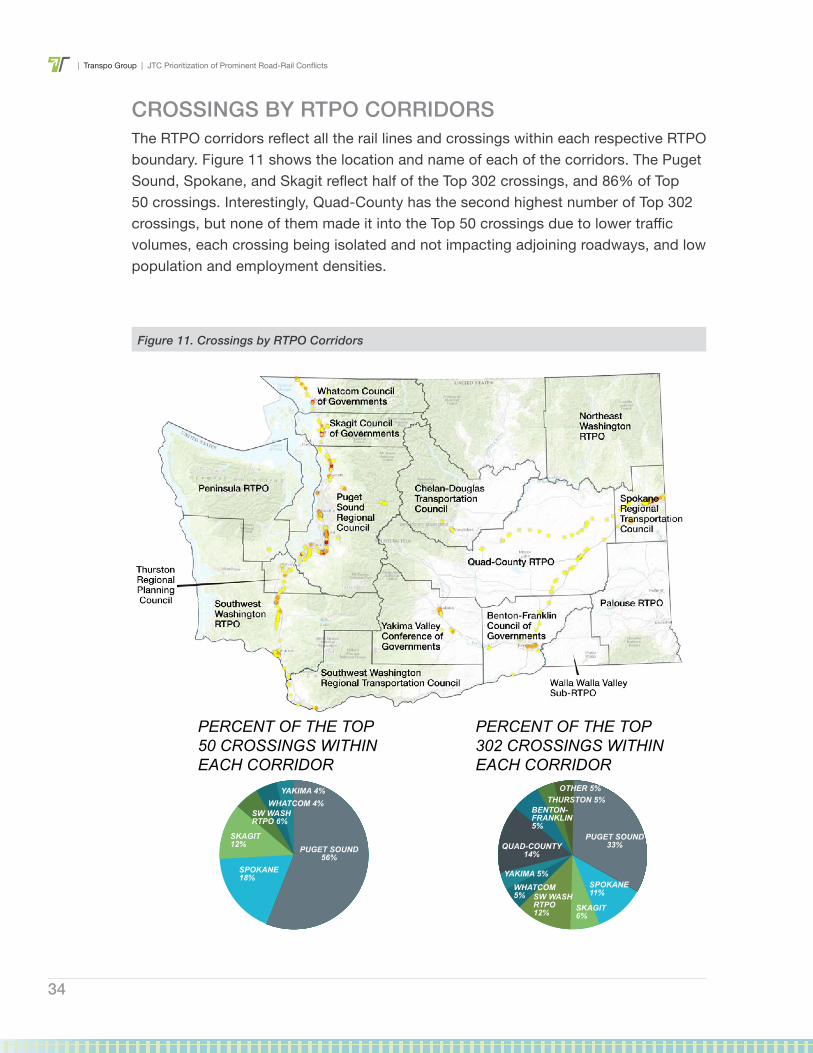
| Transpo Group | JTC Prioritization of Prominent Road-Rail Conflicts
34
CROSSINGS BY RTPO CORRIDORSThe RTPO corridors reflect all the rail lines and crossings within each respective RTPO boundary. Figure 11 shows the location and name of each of the corridors. The Puget Sound, Spokane, and Skagit reflect half of the Top 302 crossings, and 86% of Top 50 crossings. Interestingly, Quad-County has the second highest number of Top 302 crossings, but none of them made it into the Top 50 crossings due to lower traffic volumes, each crossing being isolated and not impacting adjoining roadways, and low population and employment densities.
Figure 11. Crossings by RTPO Corridors
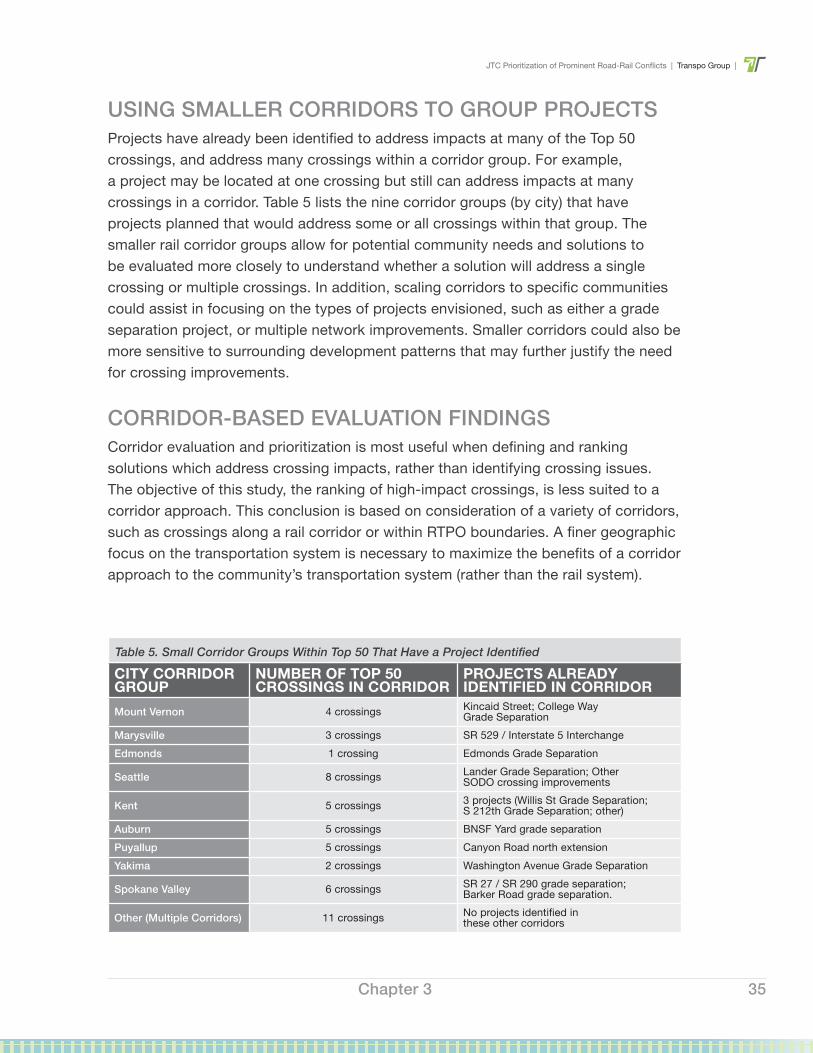
JTC Prioritization of Prominent Road-Rail Conflicts | Transpo Group |
35
USING SMALLER CORRIDORS TO GROUP PROJECTSProjects have already been identified to address impacts at many of the Top 50 crossings, and address many crossings within a corridor group. For example, a project may be located at one crossing but still can address impacts at many crossings in a corridor. Table 5 lists the nine corridor groups (by city) that have projects planned that would address some or all crossings within that group. The smaller rail corridor groups allow for potential community needs and solutions to be evaluated more closely to understand whether a solution will address a single crossing or multiple crossings. In addition, scaling corridors to specific communities could assist in focusing on the types of projects envisioned, such as either a grade separation project, or multiple network improvements. Smaller corridors could also be more sensitive to surrounding development patterns that may further justify the need for crossing improvements.
CORRIDOR-BASED EVALUATION FINDINGSCorridor evaluation and prioritization is most useful when defining and ranking solutions which address crossing impacts, rather than identifying crossing issues. The objective of this study, the ranking of high-impact crossings, is less suited to a corridor approach. This conclusion is based on consideration of a variety of corridors, such as crossings along a rail corridor or within RTPO boundaries. A finer geographic focus on the transportation system is necessary to maximize the benefits of a corridor approach to the community’s transportation system (rather than the rail system).
CITY CORRIDOR GROUP
NUMBER OF TOP 50 CROSSINGS IN CORRIDOR
PROJECTS ALREADY IDENTIFIED IN CORRIDOR
Mount Vernon 4 crossings Kincaid Street; College Way Grade Separation
Marysville 3 crossings SR 529 / Interstate 5 InterchangeEdmonds 1 crossing Edmonds Grade Separation
Seattle 8 crossings Lander Grade Separation; Other SODO crossing improvements
Kent 5 crossings 3 projects (Willis St Grade Separation; S 212th Grade Separation; other)
Auburn 5 crossings BNSF Yard grade separationPuyallup 5 crossings Canyon Road north extensionYakima 2 crossings Washington Avenue Grade Separation
Spokane Valley 6 crossings SR 27 / SR 290 grade separation; Barker Road grade separation.
Other (Multiple Corridors) 11 crossings No projects identified in these other corridors
Table 5. Small Corridor Groups Within Top 50 That Have a Project Identified
Chapter 3
| Transpo Group | JTC Prioritization of Prominent Road-Rail Conflicts
36
In addition, corridor-based prioritization requires more specific context about potential community needs and solutions, such as type of crossing improvement or surrounding development patterns.
A corridor-based strategy could help evaluate solutions at a single crossing that would address multiple crossings, or evaluate a suite of solutions at multiple crossings to help traffic move through a larger corridor. In other situations, a project could result in closing one major crossing, thereby alleviating the need to address multiple, adjacent crossings within the same corridor. Corridor evaluation could be useful in identifying or evaluating specific project proposals and addressing regional or rural needs. The database and prioritization tool would still serve as a key input into a corridor-based project prioritization, but the corridors will need to be determined by users of the database with guidance from policy makers.
JTC Prioritization of Prominent Road-Rail Conflicts | Transpo Group |
37
4 DATA AND TOOL OVERVIEWThe database development focused on locations rather than projects. The assembled data described location-specific characteristics for the 2,180 public, active, at-grade crossings in the state, such as traffic volumes, collision history, and train counts, rather than project-specific conditions, such as type of improvement, feasibility, and cost. A project prioritization effort, in contrast, would include more contextual information for each location and would be guided by specific objectives developed by the funding entity. The database can be used as a starting point for state, regional, and local jurisdictions to understand the magnitude of needs, and how a specific crossing would compare against other locations on a statewide or regional basis. The prioritization tool can also be used to assist in future planning efforts and serve as an indicator of the need for more detailed analysis of individual crossings.
A detailed description of the prioritization tool, its development, and the data is included in Appendix A.
4.1 DATABASE DEVELOPMENTIn order to evaluate and prioritize at-grade crossings, a database was created that assembled common data and criteria for all crossings in the state. In the context of the study, a database is a structured set of data maintained in Microsoft Excel and ESRI GIS formats. See Figure 12 for a visual representation of the database structure.
The database only included data for crossings that are publicly accessible, at-grade, and located on active rail lines. Over- and under-crossings were considered to be functioning well and were not evaluated as part of the study. The database included both general attributes and evaluation criteria for each crossing that were assembled from a number of different
Chapter 4
The database is organized by columns that contain attributes/criteria and rows that contain each at-grade crossing location.
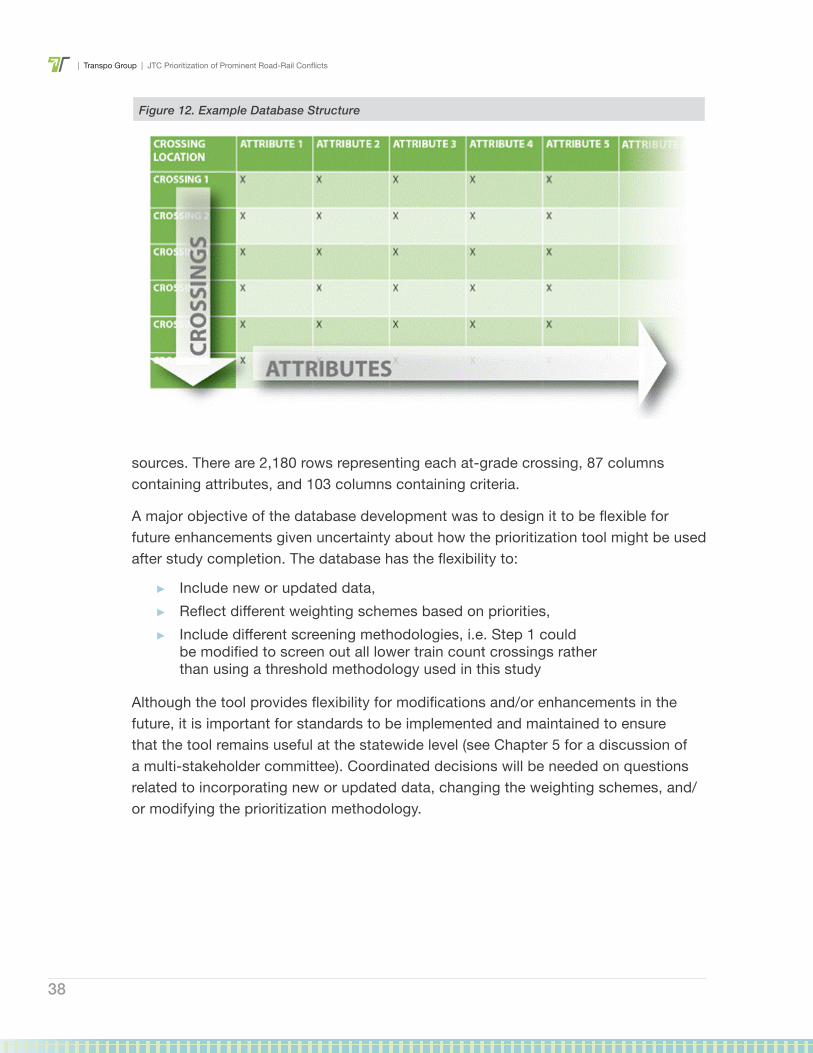
| Transpo Group | JTC Prioritization of Prominent Road-Rail Conflicts
38
sources. There are 2,180 rows representing each at-grade crossing, 87 columns containing attributes, and 103 columns containing criteria.
A major objective of the database development was to design it to be flexible for future enhancements given uncertainty about how the prioritization tool might be used after study completion. The database has the flexibility to:
► Include new or updated data, ► Reflect different weighting schemes based on priorities, ► Include different screening methodologies, i.e. Step 1 could
be modified to screen out all lower train count crossings rather than using a threshold methodology used in this study
Although the tool provides flexibility for modifications and/or enhancements in the future, it is important for standards to be implemented and maintained to ensure that the tool remains useful at the statewide level (see Chapter 5 for a discussion of a multi-stakeholder committee). Coordinated decisions will be needed on questions related to incorporating new or updated data, changing the weighting schemes, and/or modifying the prioritization methodology.
Figure 12. Example Database Structure
JTC Prioritization of Prominent Road-Rail Conflicts | Transpo Group |
39
4.2 DATA ASSEMBLY AND SOURCESThe database was created by assembling readily available data from a variety of sources, including the UTC, WSDOT, the FRA, and the DOE. Table 6 summarizes the data that was assembled or developed for evaluating at-grade crossings in the state.
DATA FROM UTCUTC operates a Rail Safety Program that focuses on reducing deaths, injuries, and property damage on or around railroads. As part of this program, UTC maintains and regularly updates an official inventory of all private and public railroad crossings in the state. It includes a variety of data including general locational information, crossing infrastructure, and operational conditions. This inventory was used as the beginning organizational structure for the database. UTC also maintains historical incident data and produces reports that analyze rail safety.
DATA FROM WSDOTWSDOT develops and maintains the State Rail Plan that serves as a strategic blueprint for future public investment in the state’s rail transportation system. The Plan includes data on train counts for passenger and freight rail. Train count data was included in the prioritization tool for all mainlines for the existing and future years. The train count data included in the State Rail Plan is estimated using Freight Analysis Framework data and provides an order of magnitude estimate of train projections. WSDOT also provides a variety of transportation and environmental data for public download that was used in this study. This includes information on roadway and freight classification and important freight economic corridors.
DATA FROM FRAThe FRA is part of the USDOT and oversees freight and passenger rail. The FRA maintains information on the rail network, crossings and rail safety. Railroad classification data was assembled from FRA and used in the prioritization tool.
Chapter 4
The database was designed to be flexible for future modifications after completion of the study. It has the flexibility to include new or updated data, different weighting schemes, and/or different screening methodologies.
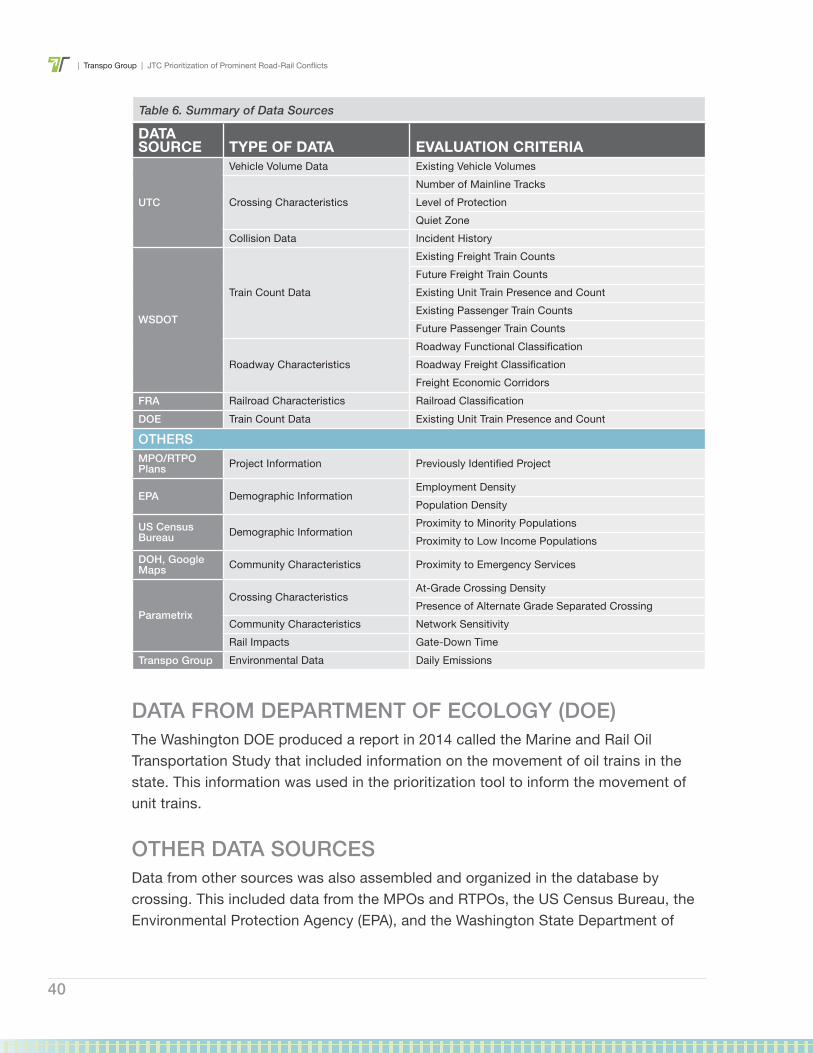
| Transpo Group | JTC Prioritization of Prominent Road-Rail Conflicts
40
DATA FROM DEPARTMENT OF ECOLOGY (DOE)The Washington DOE produced a report in 2014 called the Marine and Rail Oil Transportation Study that included information on the movement of oil trains in the state. This information was used in the prioritization tool to inform the movement of unit trains.
OTHER DATA SOURCESData from other sources was also assembled and organized in the database by crossing. This included data from the MPOs and RTPOs, the US Census Bureau, the Environmental Protection Agency (EPA), and the Washington State Department of
DATA SOURCE TYPE OF DATA EVALUATION CRITERIA
UTC
Vehicle Volume Data Existing Vehicle Volumes
Crossing CharacteristicsNumber of Mainline TracksLevel of ProtectionQuiet Zone
Collision Data Incident History
WSDOT
Train Count Data
Existing Freight Train CountsFuture Freight Train CountsExisting Unit Train Presence and CountExisting Passenger Train CountsFuture Passenger Train Counts
Roadway CharacteristicsRoadway Functional ClassificationRoadway Freight ClassificationFreight Economic Corridors
FRA Railroad Characteristics Railroad ClassificationDOE Train Count Data Existing Unit Train Presence and Count
OTHERSMPO/RTPO Plans Project Information Previously Identified Project
EPA Demographic InformationEmployment DensityPopulation Density
US Census Bureau Demographic Information
Proximity to Minority PopulationsProximity to Low Income Populations
DOH, Google Maps Community Characteristics Proximity to Emergency Services
ParametrixCrossing Characteristics
At-Grade Crossing DensityPresence of Alternate Grade Separated Crossing
Community Characteristics Network SensitivityRail Impacts Gate-Down Time
Transpo Group Environmental Data Daily Emissions
Table 6. Summary of Data Sources
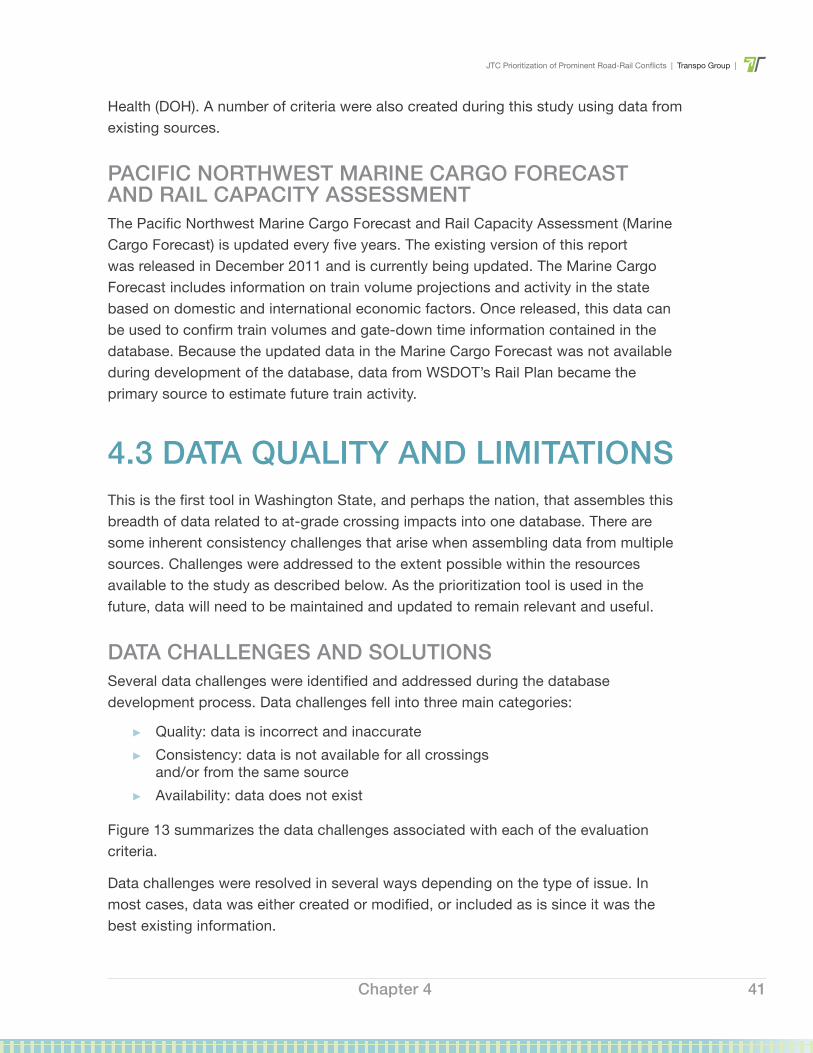
JTC Prioritization of Prominent Road-Rail Conflicts | Transpo Group |
41
Health (DOH). A number of criteria were also created during this study using data from existing sources.
PACIFIC NORTHWEST MARINE CARGO FORECAST AND RAIL CAPACITY ASSESSMENT The Pacific Northwest Marine Cargo Forecast and Rail Capacity Assessment (Marine Cargo Forecast) is updated every five years. The existing version of this report was released in December 2011 and is currently being updated. The Marine Cargo Forecast includes information on train volume projections and activity in the state based on domestic and international economic factors. Once released, this data can be used to confirm train volumes and gate-down time information contained in the database. Because the updated data in the Marine Cargo Forecast was not available during development of the database, data from WSDOT’s Rail Plan became the primary source to estimate future train activity.
4.3 DATA QUALITY AND LIMITATIONSThis is the first tool in Washington State, and perhaps the nation, that assembles this breadth of data related to at-grade crossing impacts into one database. There are some inherent consistency challenges that arise when assembling data from multiple sources. Challenges were addressed to the extent possible within the resources available to the study as described below. As the prioritization tool is used in the future, data will need to be maintained and updated to remain relevant and useful.
DATA CHALLENGES AND SOLUTIONSSeveral data challenges were identified and addressed during the database development process. Data challenges fell into three main categories:
► Quality: data is incorrect and inaccurate ► Consistency: data is not available for all crossings
and/or from the same source ► Availability: data does not exist
Figure 13 summarizes the data challenges associated with each of the evaluation criteria.
Data challenges were resolved in several ways depending on the type of issue. In most cases, data was either created or modified, or included as is since it was the best existing information.
Chapter 4
| Transpo Group | JTC Prioritization of Prominent Road-Rail Conflicts
42
For availability concerns, it was possible to estimate some data using recognized industry methodologies; it was also possible to create some data that was otherwise unavailable, using GIS functions and other readily available information (e.g. crossing density was created using GIS to calculate how many nearby at-grade crossings were on the same rail line within a half mile).
Quality concerns were addressed by reviewing the specific quality issue and either removing or replacing that data. In some cases, the quality concerns were minor and the data was included in the database.
Consistency concerns were addressed by manually updating the data for some crossings with secondary information. The level of effort required to address data challenges was also considered. At times, the processing required to improve or replace the data would be substantial, making it unfeasible to include the data as part of this study (i.e. a criteria measuring sight distance concerns was not included because existing data would require a large amount of processing in order to provide this information).
The purpose of the tool was to allow state, regional, and local agencies to understand the overall magnitude of impacts at at-grade rail crossings on a statewide basis. Consistency of the level of detail and quality of the data across all crossing locations is critical for understanding how crossings compare across the state. It is likely that as the database is introduced to and used by agencies across the state, higher quality data will be developed and incorporated into the database. Users of the tool will have an interest in providing better data and a process to allow data to be updated efficiently could be designed.
Figure 13. Data Challenges Associated with the Evaluation Criteria
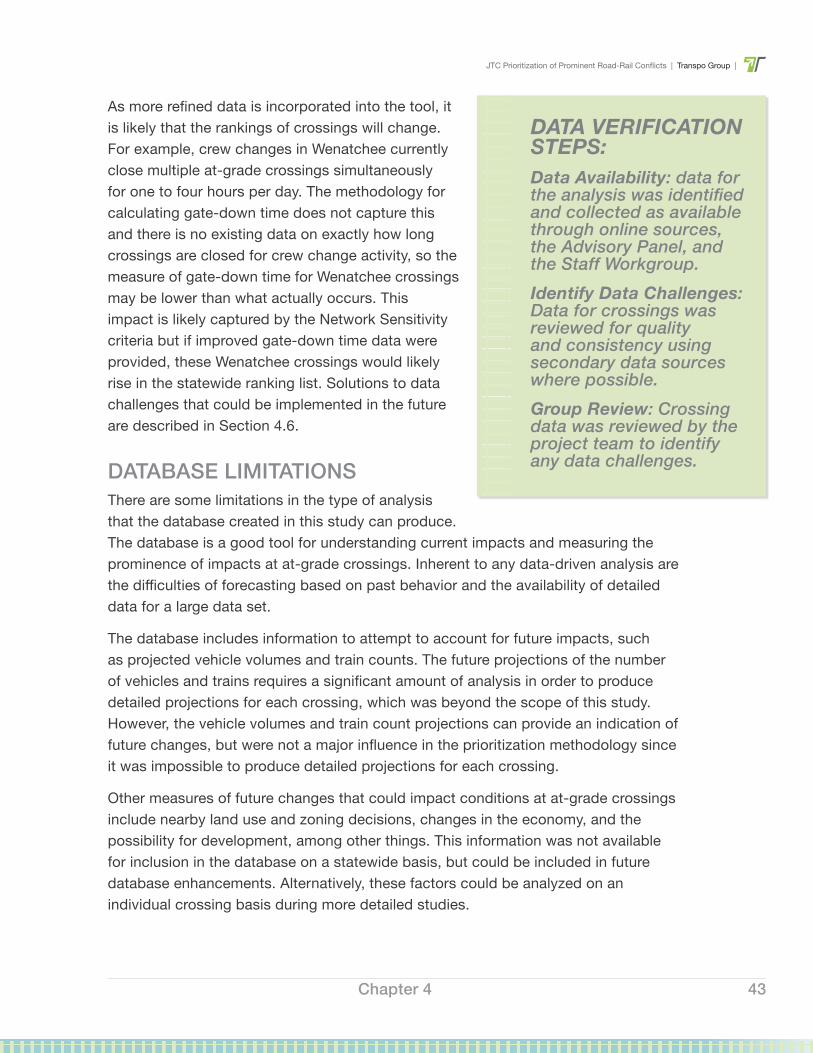
JTC Prioritization of Prominent Road-Rail Conflicts | Transpo Group |
43
As more refined data is incorporated into the tool, it is likely that the rankings of crossings will change. For example, crew changes in Wenatchee currently close multiple at-grade crossings simultaneously for one to four hours per day. The methodology for calculating gate-down time does not capture this and there is no existing data on exactly how long crossings are closed for crew change activity, so the measure of gate-down time for Wenatchee crossings may be lower than what actually occurs. This impact is likely captured by the Network Sensitivity criteria but if improved gate-down time data were provided, these Wenatchee crossings would likely rise in the statewide ranking list. Solutions to data challenges that could be implemented in the future are described in Section 4.6.
DATABASE LIMITATIONS There are some limitations in the type of analysis that the database created in this study can produce. The database is a good tool for understanding current impacts and measuring the prominence of impacts at at-grade crossings. Inherent to any data-driven analysis are the difficulties of forecasting based on past behavior and the availability of detailed data for a large data set.
The database includes information to attempt to account for future impacts, such as projected vehicle volumes and train counts. The future projections of the number of vehicles and trains requires a significant amount of analysis in order to produce detailed projections for each crossing, which was beyond the scope of this study. However, the vehicle volumes and train count projections can provide an indication of future changes, but were not a major influence in the prioritization methodology since it was impossible to produce detailed projections for each crossing.
Other measures of future changes that could impact conditions at at-grade crossings include nearby land use and zoning decisions, changes in the economy, and the possibility for development, among other things. This information was not available for inclusion in the database on a statewide basis, but could be included in future database enhancements. Alternatively, these factors could be analyzed on an individual crossing basis during more detailed studies.
Chapter 4
DATA VERIFICATION STEPS:Data Availability: data for the analysis was identified and collected as available through online sources, the Advisory Panel, and the Staff Workgroup.Identify Data Challenges: Data for crossings was reviewed for quality and consistency using secondary data sources where possible.Group Review: Crossing data was reviewed by the project team to identify any data challenges.
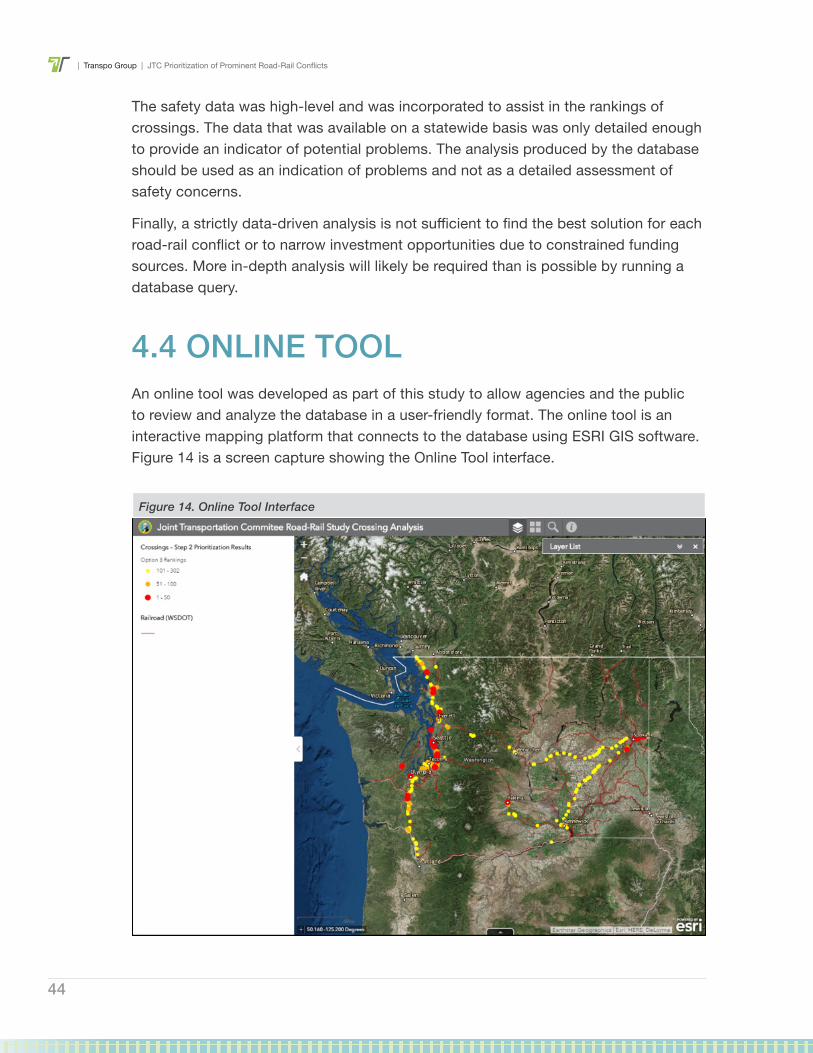
| Transpo Group | JTC Prioritization of Prominent Road-Rail Conflicts
44
The safety data was high-level and was incorporated to assist in the rankings of crossings. The data that was available on a statewide basis was only detailed enough to provide an indicator of potential problems. The analysis produced by the database should be used as an indication of problems and not as a detailed assessment of safety concerns.
Finally, a strictly data-driven analysis is not sufficient to find the best solution for each road-rail conflict or to narrow investment opportunities due to constrained funding sources. More in-depth analysis will likely be required than is possible by running a database query.
4.4 ONLINE TOOLAn online tool was developed as part of this study to allow agencies and the public to review and analyze the database in a user-friendly format. The online tool is an interactive mapping platform that connects to the database using ESRI GIS software. Figure 14 is a screen capture showing the Online Tool interface.
Figure 14. Online Tool Interface
JTC Prioritization of Prominent Road-Rail Conflicts | Transpo Group |
45
The online tool allows users to view the data associated with each crossing. Users are able to turn data layers on and off, search for crossings based on city or crossing ID, and select a crossing location and review the data associated with that location. The online tool is useful for quickly locating and digesting information associated with crossings that are of interest to the user. It is also useful for understanding patterns across the state.
The online tool is the best way to understand the data due to the amount of data that is included in the database. This is the first online mapping tool for at-grade crossings on a statewide basis. Due to its usefulness and effectiveness in communicating the information, the tool is likely just as important as the data behind it.
4.5 USING THE PRIORITIZATION TOOLThe tool is the only unified, statewide resource for information about crossings and is designed to be used by state, regional, and local jurisdictions in a variety of ways. Some examples of how the tool could be used include the following:
► Describe the importance of a crossing (or a series of crossings) on state or federal grant applications
► Assist in future planning efforts for local and regional jurisdictions ► Provide a starting point for identifying locations
to develop specific project proposals
As mentioned in Section 4.3, some of the data is not fine-grained enough to serve as the only analysis for identifying crossings of concern for potential funding. The safety data included in the tool is high-level. Evaluation of safety impacts requires more information than a database can provide, such as site visits, predictive analysis, and review of specific causes of collisions.
The safety criteria in the database can indicate the presence of potential safety concerns, allowing the tool to be used as a supplement to the more robust and detailed safety evaluations conducted through UTC’s and FHWA’s programs. Many mobility problems also have implications for safety, such as gate down times that stop emergency response vehicles moving across town or cause frustrated drivers to take risks to beat safety gates at crossings. The database can be used to identify potential problematic crossings, which can then be further evaluated through other existing processes and programs.
Chapter 4
| Transpo Group | JTC Prioritization of Prominent Road-Rail Conflicts
46
Similarly, the criteria included for mobility and community are not intended to provide a prescriptive analysis of potential issues at a crossing. Like the safety criteria, the community and mobility data are indicators of potential impacts. The prioritization tool should be used to inform more detailed study of individual crossings that are problematic.
4.6 FUTURE DATA AND TOOL ENHANCEMENTSThere are several enhancements that could be made to the database and the online tool after completion of this study. The level of effort and time needed to accomplish both the data and online tool enhancements would vary. There may also be other database or tool functionality improvements that could arise once agencies begin using them. Future improvements of the database and tool could improve its usefulness as a means for identifying problematic at-grade crossings in Washington State. It is important to note that data enhancements may also change how crossings rank against each other.
DATA ENHANCEMENTS As described earlier, some data enhancement opportunities were identified during the study. Future enhancements of the database could improve or resolve these concerns:
► New data could be created to replace data that had consistency, availability, or quality concerns, such as existing vehicle volumes and gate-down time.
► Data that was not readily or publicly available could be assembled, such as near-miss data and regional growth projections.
► Data included in the database could be updated more regularly during future iterations of the tool.
If this tool is used as an input into a project prioritization process, it will be important to ensure that data is up to-date and accurate so that the prioritization results could be updated.
A number of the criteria currently have good accuracy and would not require extensive enhancements, including railroad classification, passenger train counts, roadway functional classification, proximity to emergency services, roadway freight classification, and first/last mile roadway crossing. Actual data collection at the at-grade crossing location could improve accuracy for existing vehicle volumes,
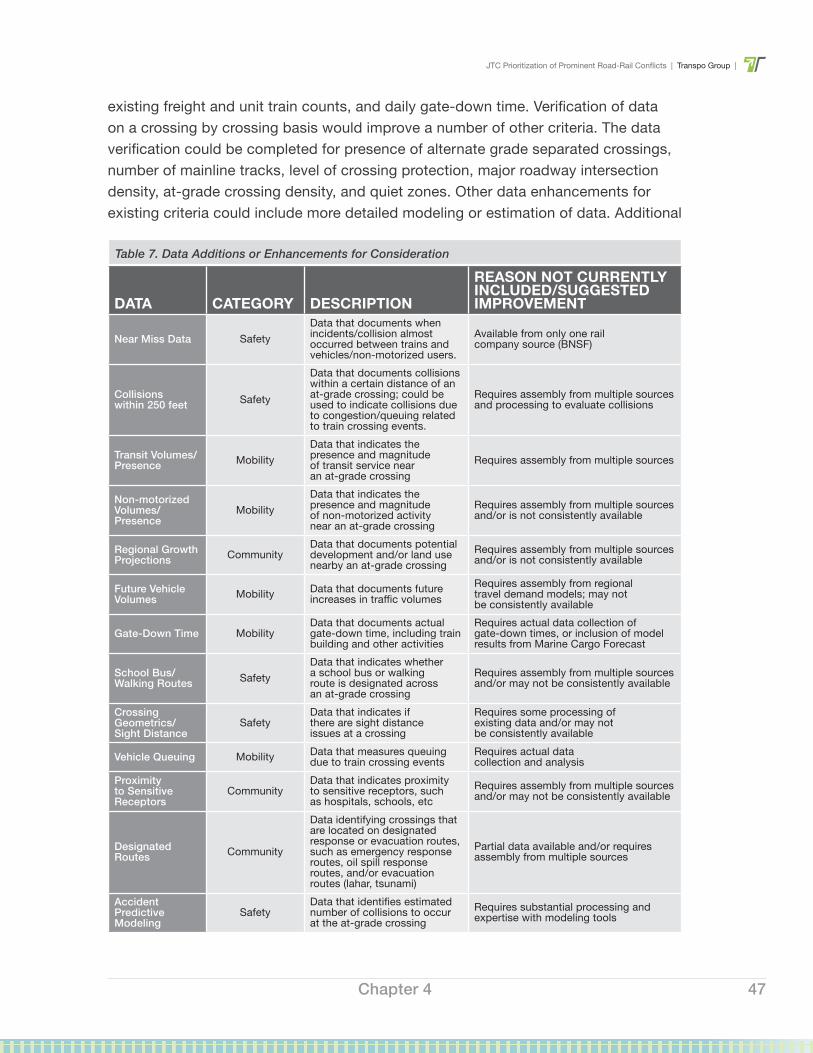
JTC Prioritization of Prominent Road-Rail Conflicts | Transpo Group |
47
existing freight and unit train counts, and daily gate-down time. Verification of data on a crossing by crossing basis would improve a number of other criteria. The data verification could be completed for presence of alternate grade separated crossings, number of mainline tracks, level of crossing protection, major roadway intersection density, at-grade crossing density, and quiet zones. Other data enhancements for existing criteria could include more detailed modeling or estimation of data. Additional
Chapter 4
DATA CATEGORY DESCRIPTION
REASON NOT CURRENTLY INCLUDED/SUGGESTED IMPROVEMENT
Near Miss Data SafetyData that documents when incidents/collision almost occurred between trains and vehicles/non-motorized users.
Available from only one rail company source (BNSF)
Collisions within 250 feet Safety
Data that documents collisions within a certain distance of an at-grade crossing; could be used to indicate collisions due to congestion/queuing related to train crossing events.
Requires assembly from multiple sources and processing to evaluate collisions
Transit Volumes/Presence Mobility
Data that indicates the presence and magnitude of transit service near an at-grade crossing
Requires assembly from multiple sources
Non-motorized Volumes/Presence
MobilityData that indicates the presence and magnitude of non-motorized activity near an at-grade crossing
Requires assembly from multiple sources and/or is not consistently available
Regional Growth Projections Community
Data that documents potential development and/or land use nearby an at-grade crossing
Requires assembly from multiple sources and/or is not consistently available
Future Vehicle Volumes Mobility Data that documents future
increases in traffic volumesRequires assembly from regional travel demand models; may not be consistently available
Gate-Down Time MobilityData that documents actual gate-down time, including train building and other activities
Requires actual data collection of gate-down times, or inclusion of model results from Marine Cargo Forecast
School Bus/Walking Routes Safety
Data that indicates whether a school bus or walking route is designated across an at-grade crossing
Requires assembly from multiple sources and/or may not be consistently available
Crossing Geometrics/Sight Distance
SafetyData that indicates if there are sight distance issues at a crossing
Requires some processing of existing data and/or may not be consistently available
Vehicle Queuing Mobility Data that measures queuing due to train crossing events
Requires actual data collection and analysis
Proximity to Sensitive Receptors
Community Data that indicates proximity to sensitive receptors, such as hospitals, schools, etc
Requires assembly from multiple sources and/or may not be consistently available
Designated Routes Community
Data identifying crossings that are located on designated response or evacuation routes, such as emergency response routes, oil spill response routes, and/or evacuation routes (lahar, tsunami)
Partial data available and/or requires assembly from multiple sources
Accident Predictive Modeling
SafetyData that identifies estimated number of collisions to occur at the at-grade crossing
Requires substantial processing and expertise with modeling tools
Table 7. Data Additions or Enhancements for Consideration
| Transpo Group | JTC Prioritization of Prominent Road-Rail Conflicts
48
analysis would benefit future vehicle volumes, future freight and unit train counts, gate-down time, and daily emissions.
Table 7 summarizes the data that could be included in the database in the future. This includes information that could be created, such as vehicle queuing, as well as existing data that could be incorporated from other sources, such as near miss data and/or data from the Marine Cargo Forecast. Future data additions or incorporations could be guided by existing or new funding programs that focus on certain criteria. Alternatively, some criteria could become unnecessary to collect or maintain depending on how the prioritization tool is used in the future.
For the tool to remain useful, the data should be updated and maintained over time. Depending on the nature of what is being measured in each criteria, the timing for when data should be updated or replaced varies. Much of the data will not change drastically between update cycles and could be replaced only as changes happen. For example, railroad classification does not change frequently and could be updated only when there is a known update to a classification. Also, updates to the overall list of at-grade crossings could be modified when projects are completed or changes occur, as this would not be expected to occur often.
Vehicle volumes change more frequently depending on local factors such as development, population or employment growth, and the economy. More regular updates to this information would ensure the tool remains useful. As mentioned in Section 4.2.6, the Marine Cargo Forecast is updated every five years. Data updates to the prioritization tool could be aligned with the update cycle of the Marine Cargo Forecast. The following criteria would benefit from a five-year update cycle. The remaining criteria listed below would not be expected to change frequently.
► Existing Vehicle Volumes (AADT) ► Future Vehicle Volumes (AADT) ► Gate-down Time ► Collision History ► Daily Emissions ► Existing Freight Train
Volumes (daily average)
► Future Freight Train Volumes (daily average)
► Existing Unit Train Presence and Count
► Existing Passenger Train Volumes ► Future Passenger Train Volumes ► Previously Identified Project
► Level of Crossing Protection
There are varying degrees of processing and expertise required to maintain the criteria. Although all of the criteria requires review before inclusion into the database, some of the criteria require calculations in order to update. The majority of the criteria can be incorporated with minimal processing. Criteria that require calculations include future vehicle volumes, average daily gate-down time, and daily emissions. Other
JTC Prioritization of Prominent Road-Rail Conflicts | Transpo Group |
49
criteria will require some GIS processing before they can be updated, including employment density, population density, proximity to low-income populations, and proximity to minority populations.
ONLINE TOOL ENHANCEMENTSThe purpose of the online tool is to communicate what the data means in a way that is accessible to all users and to allow users to visualize the geography of crossing impacts. Improvements to the tool should focus on allowing people to easily interpret the data and share results. Other enhancements could improve functionality. As described in Section 4.4, the amount of data in the database can make it difficult to interpret. The online tool allows users to efficiently understand the data on either the local, regional, or state level, making the tool as important to maintain as the data behind it. Improved functionality of the tool will likely influence the usefulness of the prioritization process to agencies. The tool could be improved to allow users to:
► Symbolize and create additional maps based on the user’s preference. This would allow the user to more easily understand different patterns associated with the data.
► Select and compare individual crossings so that users could review a select grouping of crossings of interest.
A major theme that was voiced throughout the study was that agencies and users of the tool should be able to understand groupings of crossings and how they relate to each other, which could be improved through future modifications, such as allowing the tool to query a grouping of crossings. There may also be improvements currently unavailable that become possible to incorporate through technology advancements.
Chapter 4
| Transpo Group | JTC Prioritization of Prominent Road-Rail Conflicts
50
5 TOOL SUSTAINABILITYWith the database and online tool developed, there are several possibilities and questions related to next steps. This chapter outlines key questions and considerations related to tool sustainability.
5.1 DISCUSSIONTo remain useful in the future, the tool will need to be maintained and updated as new or improved data is available and crossing projects are completed. The term sustainability is used in this section to describe the ownership, maintenance, and updating of the tool itself (both the database and the online mapping components). This has staffing and other resource implications.
In addition to simply keeping the tool up and running, questions remain as to how the tool might assist with existing and future funding programs, how to ensure data consistency and ability to benchmark crossings, and others related to tool use and application. One of the benefits of the tool for federal, state, and local decision makers is the ability to have a statewide view of rail crossings. To ensure that this benefit continues and to provide a decision-making body for questions related to data updates or new data, a multi-stakeholder committee with similar membership to the Advisory Panel for this study (e.g. WSAC, AWC, FMSIB, WSDOT, RTPO/MPOs) should be created. This committee could help ensure continued data integrity and facilitate tool sustainability by providing a decision-making body for data or evaluation questions and stewardship over the data. This committee could also work to address many of the questions raised by this study.
5.2 TOOL MAINTENANCE AND UPDATINGThere are two likely scenarios related to the ownership and ongoing maintenance of the tool depending on whether or not funding is available.
JTC Prioritization of Prominent Road-Rail Conflicts | Transpo Group |
51
Scenario 1: No Funding If no additional funds are secured, the tool produced for this study will become a one-time exercise with no future updates of the statewide data. A copy of the original Excel workbook produced for this study would be housed at the Association of Washington Cities and the JTC as the study sponsor and study lead respectively, who could make it available to anyone who requests it. The online mapping function could be taken over by AWC if they can maintain it within existing resources. An alternative is that an agency like WSDOT or PSRC might step forward and take on tool maintenance and online mapping support using existing resources or contingent on securing funding to cover it.
Scenario 2: With FundingIf funds are secured to maintain and update the data and online mapping functions, then questions need to be answered around which organization is best suited to own and maintain the tool and coordinate the multi-stakeholder committee.
With both Scenario 1 and 2, the tool could still be used by various local and regional transportation organizations to help with planning and preparation of various funding applications as the information will remain current enough for the next three to five years.
OWNERSHIP RESPONSIBILITIESIf Scenario 2 is realized, an organization must be identified and agree to take on the ownership and maintenance of the tool. In thinking about candidate organizations and how much funding would be needed to realize Scenario 2, several considerations were identified.
Given the data sources (outlined in Chapter 4), it is assumed that updates would need to occur on five-year intervals depending on the source, but could occur more frequently, if necessary. Major tool-related tasks are likely to include:
► Ongoing maintenance, including troubleshooting issues with the online mapping platform, quarterly data back-ups, and periodic software and data updates.
► Updates as new data is released, including completed crossing projects. ► Incorporating new or modified data sources (see Section 4.6). ► Coordinating multi-stakeholder committee (does not have to be
the same person, but ideally is at the same organization).
Chapter 5
| Transpo Group | JTC Prioritization of Prominent Road-Rail Conflicts
52
Infrastructure Costs ► Annual license for ArcGIS Online ($2,500 - $17,500
depending on number of users) ► Data storage/hosting ► Future enhancements outlined in Section 4.6
StaffingThis is not a full time position and could be absorbed by an existing staff person or team. The staff member(s) responsible for the tool would need strong capabilities in Excel and ArcGIS. Familiarity with the data and its limitations are also needed to enable a review for any anomalies before the tool is updated with new information. This staff member or team would also need to be available to instruct others on the use of the tool and the data fields. This could include organized trainings or responding to phone calls and emails.
CANDIDATE ORGANIZATIONSThroughout the course of the study several participant organizations, including WSDOT and AWC communicated a willingness to house the tool, provided adequate resources to pay for staffing and infrastructure costs were appropriated.
5.3 GOVERNANCE AND POLICY GUIDANCEThe Advisory Committee noted that a statewide perspective is critical to ensure alignment with other goals and funding programs. Whether governance beyond the multi-stakeholder committee is needed and what form it takes depend on whether statewide funding for crossing improvement projects are enhanced or a new funding source is established. However, it is clear that specific policy objectives to guide crossing investments on a statewide basis will be needed.
There is no existing program specifically focused on mobility at rail crossings, but there are significant needs in large and small communities. Some projects are funded through existing programs at UTC, WSDOT, and FMSIB, but additional investments are critical. To the extent that a statewide ranking based on high magnitude impacts does not address geographic or other needs, the policy or geographic objectives guiding the prioritization process will need to be clarified by the Legislature or the governing board.
JTC Prioritization of Prominent Road-Rail Conflicts | Transpo Group |
53
GOVERNANCE SCENARIOSIn the event that a program is established to fund crossing improvements, and a governing or review board is determined necessary, the policy objectives should help determine potential candidate organizations based on mission alignment and grant review and award experience. Three scenarios were discussed with the Advisory Panel, all of which assume a program is established and funded with clear objectives and parameters.
Scenario 1: Decision-making by New Board or Committee ► This could be an ad hoc or new board depending
on program purpose and objectives. ► The Board would develop grant funding criteria based on the enabling
legislation and a scoring system and then review and score applications. Recommendations would be approved by the Legislature or the Board itself depending on program structure and/or authorization.
► Experience reviewing and administering grants is recommended. ► Mission alignment between the Board and the program purpose
and policy objectives would be important if the Board is to be seen as fair and objective, especially as funding is involved.
Scenario 2: Incorporated into Existing Agency or Program ► Grant funding criteria and scoring are developed. This could
come from legislative direction and/or public comment and/or significant stakeholder involvement.
► Applications are reviewed and scored by an existing granting agency (e.g. WSDOT Local Programs, FMSIB or TIB) and funding recommendations go to the Legislature.
Scenario 3: Funds are Allocated to Regional Transportation Planning Organizations
► Available funding would be allocated to RTPOs (presumably using a population based allocation).
► RTPOs would decide which crossing projects to fund and coordinate among themselves to identify corridors with more than one project due to overlapping boundaries.
► The final project list could be submitted to the Legislature for final appropriation or the funds could simply be distributed to the regions.
WHAT ARE THE IMPLICATIONS?The price tag for currently identified grade separation projects exceed state or federal funding program available at this time. If this problem is to be addressed, a statewide
Chapter 5
| Transpo Group | JTC Prioritization of Prominent Road-Rail Conflicts
54
prioritization process should consider how to partner effectively with existing regional prioritization efforts.
This study has pointed to a significant shortfall to implement crossing solutions and raised the question of whether a new statewide prioritization process needs to be accompanied by new funding or whether the database will become a tool for use by applicants and funders of related funding programs and for planning purposes.
JTC Prioritization of Prominent Road-Rail Conflicts | Transpo Group |
55
6 FINDINGS AND RECOMMENDATIONSThe study effort is one of the first in the nation to systematically evaluate potential road-rail conflicts at at-grade crossings on a statewide basis, and attempt to prioritize the magnitude of needs. Such an effort is of critical importance as vehicle and train volumes continue to grow, increasing the potential for road-rail conflicts in the future.
During the course of the study several findings emerged related to the need for additional crossing investments, the usefulness of the tool, how safety needs should be addressed, and what may need to be improved. Recommendations related to several findings are also discussed.
1 The road-rail conflicts at the Top 50 at-grade crossings are substantial and there are few funding sources to address them
Today the Top 50 crossings are closed to vehicle traffic for an estimated average of two hours per day, which will only increase in the future as train volumes increase. The median number of trains and vehicles using these crossings each day are 49 trains and 12,000 vehicles, respectively, leading to substantial on-going conflicts. Almost two-thirds (62%) of these crossings are on a designated freight corridor and 96% of them (all but two) have gates and flashing lights, yet there was at least one collision between pedestrians and/or vehicles and trains at or near half the crossings in the last five years. Almost two-thirds (66%) are in close proximity to emergency providers leading to potential delays for public safety services.
While there are existing funding programs for safety measures, such as enhanced gates and lights, they do not address the mobility issues experienced by freight and non-freight related vehicle traffic at crossings. The UTC and WSDOT were members of the Advisory Panel and reported that their crossing safety programs receive more applications than they can fund, pointing to the need for additional investments in grade crossing improvements both to address the gap in solutions for mobility impacts and to further bolster efforts to enhance safety.
Chapter 6
| Transpo Group | JTC Prioritization of Prominent Road-Rail Conflicts
56
2 The prioritization results point to a significant need for additional funding to address crossing improvements
Half of the Top 50 crossings have identified solutions with estimated costs of $830 million. Of the $830 million, only $170 million is funded and $100 million of that is for a single project. This leaves at least $660 million in unfunded needs just for the 25 crossings with identified projects. Assuming projects are needed for some share of the remaining 25 crossings, plus needs for crossings not making it into the Top 50, the unfunded needs amount is much higher.
While additional FMSIB and federal FAST Act freight funds will add $150 million over the next five years for all types of freight projects, it is not clear how much, if any, will be available to address the Top 50 road-rail conflicts identified in this study. Each funding program has specific eligibility criteria, and these crossings may or may not meet that criteria, or rank well when compared to other freight infrastructure investments. Further, the first call for projects has already been prioritized by WSDOT and the Freight Advisory Committee and only two projects address impacts at the Top 50 crossings.
RECOMMENDATIONS i. Establish a dedicated funding source to address mobility impacts not covered under
the current crossing safety programs.ii. Secure additional funds for the safety programs. iii. Further analyze Top ranked crossings to identify potential solutions individually and
at the corridor level (see Finding 8).
3 The database and prioritization process provide a mechanism to compare and understand the magnitude of crossing improvement needs on a statewide basis
The database of crossings in its current form is a valuable tool for agencies throughout the state to evaluate and compare the needs of at-grade crossings. It is the only unified, statewide resource for detailed information about crossings and is a flexible tool that can be used in a variety of ways by state, regional, and local jurisdictions or other organizations. Some examples include:
► Describe the importance of a crossing (or a series of crossings) on state or federal grant applications.
► Assist in future planning efforts for local and regional jurisdictions. ► Provide a starting point for identifying locations
to develop specific project proposals.
JTC Prioritization of Prominent Road-Rail Conflicts | Transpo Group |
57
For the tool to remain useful at the statewide level, standards will need to be implemented and maintained to ensure consistency. Decisions will also need to be made on questions related to new data releases, changing the weighting of criteria, or other data to better align with a funding program, or other changes.
In order to maintain the relevance and usefulness of the tool, funding should be provided to update and maintain it and host it at an agency. This same agency could serve as the coordinator for a multi-stakeholder committee with similar membership to the Advisory Panel for this study (e.g. WSAC, AWC, FMSIB, WSDOT, UTC, RTPO/MPOs) to help with decision-making and continued data integrity. This committee could also work to address many of the questions raised by this study.
RECOMMENDATIONSiv. Establish a multi-stakeholder committee to create database and tool standards,
make decisions about future data enhancement or other changes, and address the outstanding questions raised by this study.
v. Identify an agency to maintain the database and tool and serve as the coordinator for the multi-stakeholder committee.
4 In some cases, projects prioritized locally did not rank high when evaluated on a statewide basis
Several crossing locations with planned projects did not make it into the Top 100 crossings statewide. Low ranking project locations were generally at crossings with lower train and traffic volumes, and in non-urban areas. Although proposed projects may not rank high on a statewide basis, the tool is not meant to discount legitimate congestion issues or mobility needs due to planned economic development projects or other site specific issues. There is no existing program specifically focused on mobility at rail crossings, but there are significant needs in large and small communities.
RECOMMENDATION vi. Identify specific policy objectives to guide investments in crossings on a statewide
basis. This may necessitate a separate program targeted at smaller communities similar to the Transportation Improvement Board’s Small Cities Program to ensure their needs can be addressed and that state funding programs balance investments between Puget Sound, Western Washington, and Eastern Washington communities.
Chapter 6
| Transpo Group | JTC Prioritization of Prominent Road-Rail Conflicts
58
5 Safety data serves as a contributor towards mobility impacts, but further analysis is needed to confirm specific safety needs
High-level safety data, where available, were incorporated into the prioritization process to assist in ranking the crossings. Safety data in the tool is related to collisions between trains and pedestrians, bicycles, or vehicles. Half of the Top 50 crossings had a reported collision at or near a crossing in the last five years. The Advisory Panel agreed that the data was not specific or detailed enough to provide a safety assessment beyond an indicator of potential problems.
In addition, there was discussion around the safety specific grant programs administered by UTC and WSDOT that focus on evaluating collisions and funding lower-cost crossing improvements. Funding sources such as the federal Railway-Highways Crossing (Section 130) Program focus on safety and evaluate crossings on a case-by-case basis given a set of uniform criteria. Evaluation of collisions requires more information than a crossing database can provide, such as site visits, predictive analysis, and review of specific causes.
The federal Section 130 Program and the UTC’s Grade Crossing Protective Fund Grant Program have a finite amount of money and are unable to address all the identified needs related to crossing safety. The combined funding from both programs is approximately $5 million per year in 2016, with funding levels set to decline by 2020.
While the crossing database cannot provide an authoritative safety analysis, it can supplement safety programs by identifying indicators of safety and mobility problems. Many mobility problems have implications for safety, such as gate down times that stop emergency response vehicles moving across town and cause drivers to take risks to beat safety gates at crossings. However, solutions to address mobility problems may be ineligible for funding under the current safety programs, highlighting the need for a funding source to address mobility impacts.
RECOMMENDATIONS vii. Coordinate efforts with the WSDOT and UTC safety programs to continue focusing
on reducing collisions at crossings and ensure funding levels are adequate.viii. Separately address mobility and safety impacts at crossings.
6 The database and prioritization tool would benefit from future enhancements
Determining how the database and online tool will be used will determine how it will be updated and maintained in the future. For example, existing or new funding
JTC Prioritization of Prominent Road-Rail Conflicts | Transpo Group |
59
programs may emphasize certain criteria, resulting in other criteria not being necessary to collect or maintain. Further, if funding is provided to address crossing improvements, local jurisdictions will have a strong incentive to improve the data and plan for projects.
Future enhancements should be considered by the multi-stakeholder committee to improve the results and usefulness of the prioritization process. For example, the screening method could be modified to remove crossings with low train and vehicle counts and additional safety data could be incorporated. The soon to be released Marine Cargo Forecast will provide projections of train traffic through 2035 and could also be incorporated into the database.
RECOMMENDATIONS ix. Provide the agency hosting the tool with additional resources to maintain, update
and enhance the database and prioritization tool.x. Incorporate data from the Marine Cargo Forecast once it is complete.
7 Corridor evaluation and prioritization are most useful when defining projects to address crossing impacts
One of the objectives of the study was to consider a corridor-based prioritization process. A variety of corridors were considered, such as crossings along a rail corridor or within RTPO boundaries, but a finer geographic focus on the transportation system is likely necessary to maximize benefits of a corridor approach. In addition, corridor-based prioritization requires more specific context about potential community needs and solutions, such as type of crossing improvement or surrounding development patterns. The ranking of high-impact crossing locations on a statewide basis is less suited to a corridor approach. However, the database and prioritization tool would still serve as a key input and a common set of data when identifying a corridor-based project prioritization strategy.
A corridor-based strategy could help evaluate projects at a single crossing that would address multiple crossings, or evaluate a suite of projects at multiple crossings to help traffic move through a larger corridor. Corridor evaluation could be useful in identifying or evaluating specific project proposals and addressing regional or rural needs.
RECOMMENDATION xi. Utilize a corridor-based prioritization strategy to assist in developing solutions and
prioritizing investments
Chapter 6
| Transpo Group | JTC Prioritization of Prominent Road-Rail Conflicts
60
8 Some jurisdictions have not yet identified and prioritized needed crossing improvements
While most large jurisdictions have tried to address crossing impacts, a lack of dedicated funding sources for crossing improvements creates a disincentive for smaller jurisdictions to plan for and implement crossing improvements. Some communities may not know the range of possible solutions for crossings, or groups of crossings, and default to expensive grade-separation projects for all.
When crossing improvements compete with other local funding priorities, they often rank lower than other priorities. This is partially due to information about train activity and crossing impacts not being easily accessible (until the development of this database).
RECOMMENDATION xii. Ensure that local jurisdictions, state agencies, and other organizations, including
Regional Transportation Planning Organizations and Metropolitan Planning Organizations, are aware of the tool and the data it contains and how they might use it to assist with planning or funding decisions.
JTC Prioritization of Prominent Road-Rail Conflicts | Transpo Group |
61Chapter 6

| Transpo Group | JTC Prioritization of Prominent Road-Rail Conflicts
62

Appendix AData Dictionary and Definitions

(This Page is Intentionally Blank)
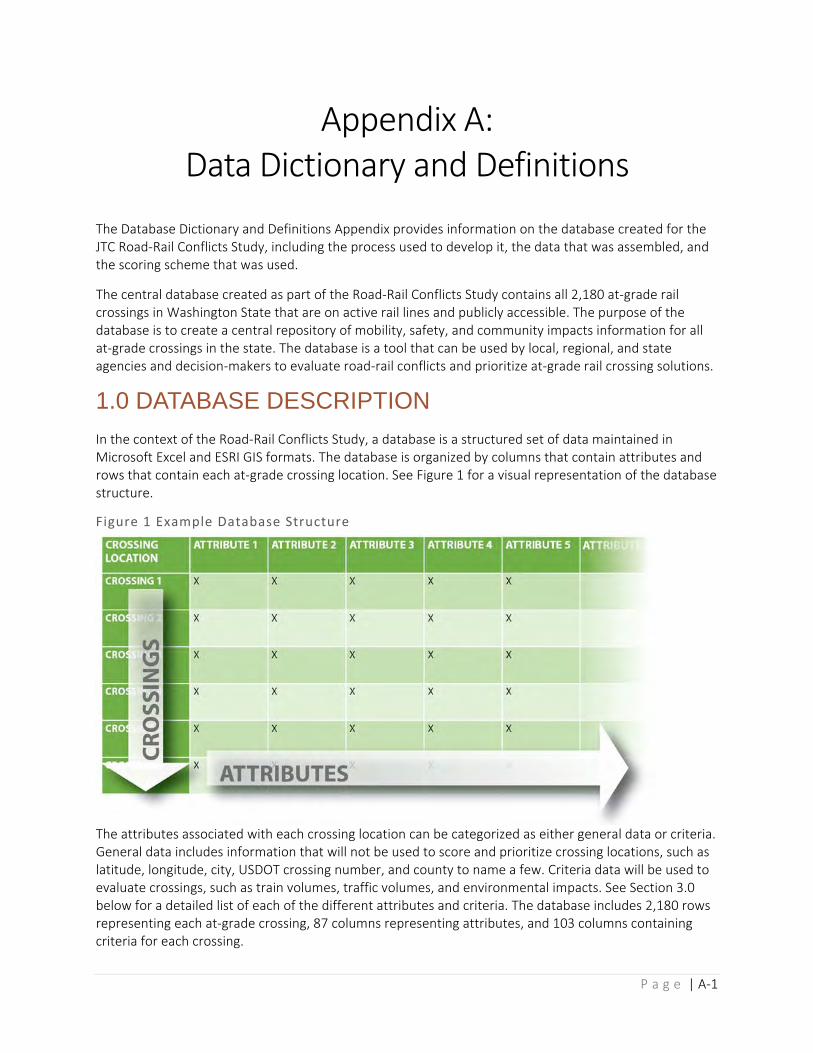
P a g e | A‐1
Appendix A: Data Dictionary and Definitions
The Database Dictionary and Definitions Appendix provides information on the database created for the JTC Road‐Rail Conflicts Study, including the process used to develop it, the data that was assembled, and the scoring scheme that was used.
The central database created as part of the Road‐Rail Conflicts Study contains all 2,180 at‐grade rail crossings in Washington State that are on active rail lines and publicly accessible. The purpose of the database is to create a central repository of mobility, safety, and community impacts information for all at‐grade crossings in the state. The database is a tool that can be used by local, regional, and state agencies and decision‐makers to evaluate road‐rail conflicts and prioritize at‐grade rail crossing solutions.
1.0 DATABASE DESCRIPTION
In the context of the Road‐Rail Conflicts Study, a database is a structured set of data maintained in Microsoft Excel and ESRI GIS formats. The database is organized by columns that contain attributes and rows that contain each at‐grade crossing location. See Figure 1 for a visual representation of the database structure.
Figure 1 Example Database Structure
The attributes associated with each crossing location can be categorized as either general data or criteria. General data includes information that will not be used to score and prioritize crossing locations, such as latitude, longitude, city, USDOT crossing number, and county to name a few. Criteria data will be used to evaluate crossings, such as train volumes, traffic volumes, and environmental impacts. See Section 3.0 below for a detailed list of each of the different attributes and criteria. The database includes 2,180 rows representing each at‐grade crossing, 87 columns representing attributes, and 103 columns containing criteria for each crossing.
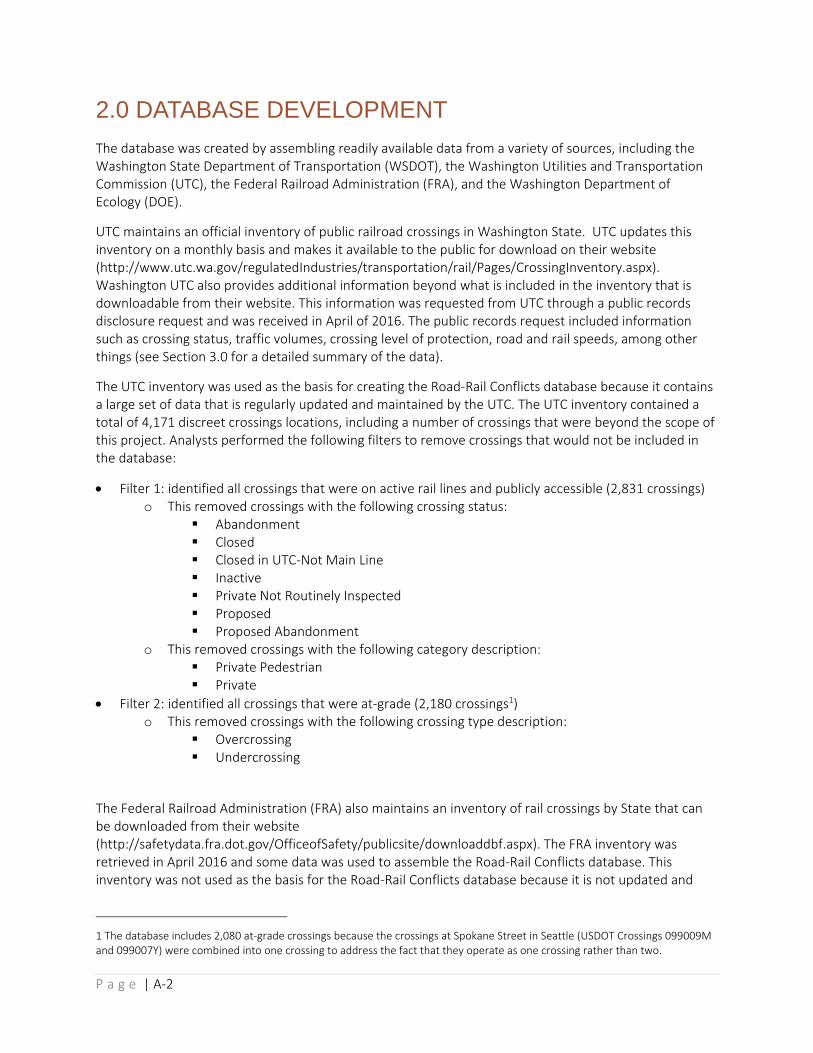
P a g e | A‐2
2.0 DATABASE DEVELOPMENT
The database was created by assembling readily available data from a variety of sources, including the Washington State Department of Transportation (WSDOT), the Washington Utilities and Transportation Commission (UTC), the Federal Railroad Administration (FRA), and the Washington Department of Ecology (DOE).
UTC maintains an official inventory of public railroad crossings in Washington State. UTC updates this inventory on a monthly basis and makes it available to the public for download on their website (http://www.utc.wa.gov/regulatedIndustries/transportation/rail/Pages/CrossingInventory.aspx). Washington UTC also provides additional information beyond what is included in the inventory that is downloadable from their website. This information was requested from UTC through a public records disclosure request and was received in April of 2016. The public records request included information such as crossing status, traffic volumes, crossing level of protection, road and rail speeds, among other things (see Section 3.0 for a detailed summary of the data).
The UTC inventory was used as the basis for creating the Road‐Rail Conflicts database because it contains a large set of data that is regularly updated and maintained by the UTC. The UTC inventory contained a total of 4,171 discreet crossings locations, including a number of crossings that were beyond the scope of this project. Analysts performed the following filters to remove crossings that would not be included in the database:
Filter 1: identified all crossings that were on active rail lines and publicly accessible (2,831 crossings) o This removed crossings with the following crossing status:
Abandonment Closed Closed in UTC‐Not Main Line Inactive Private Not Routinely Inspected Proposed Proposed Abandonment
o This removed crossings with the following category description: Private Pedestrian Private
Filter 2: identified all crossings that were at‐grade (2,180 crossings1) o This removed crossings with the following crossing type description:
Overcrossing Undercrossing
The Federal Railroad Administration (FRA) also maintains an inventory of rail crossings by State that can be downloaded from their website (http://safetydata.fra.dot.gov/OfficeofSafety/publicsite/downloaddbf.aspx). The FRA inventory was retrieved in April 2016 and some data was used to assemble the Road‐Rail Conflicts database. This inventory was not used as the basis for the Road‐Rail Conflicts database because it is not updated and
1 The database includes 2,080 at‐grade crossings because the crossings at Spokane Street in Seattle (USDOT Crossings 099009M and 099007Y) were combined into one crossing to address the fact that they operate as one crossing rather than two.
P a g e | A‐3
maintained as routinely as the UTC inventory. Of the 2,180 crossing from the UTC inventory that met the crossing status, category, and grade requirements described above, a total of 2,140 (~98%) had matching records in the FRA inventory.
Data from the abovementioned sources were retrieved in Microsoft Excel format. To prepare the data for ESRI GIS, analysts performed the following steps:
Convert Data: Before crossings could be spatially located into ESRI GIS software, the dataset was converted from a Microsoft Excel file into an ESRI compliant file geodatabase table.
o Locate Data: Using the latitude and longitude values that were included in the database, the crossings were spatially located and the ensuing points were added as a feature class to the geodatabase described above.
o Filter Data: Using the crossing status, category, and crossing type variables listed above, the initial 4,171 crossings included in the UTC database were reduced to 2,180 publicly accessible, at‐grade crossings for either cars or pedestrians and cyclists.
o Populate Data and Criteria: After locating and filtering the crossings to include only publicly accessible at‐grade crossings, individual criteria and data were added.
Once the data was incorporated into ESRI GIS, analysts verified the data to ensure accuracy and identify any data challenges using the following steps:
o Review Spatial Accuracy: 10% or 218 records from the 2,180 eligible crossings were randomly selected and visually reviewed in GIS to confirm the point location matched the street description provided.
o Review Data Accuracy: Prior to adding specific attributes, the existing information for crossings (FRA and WSDOT) was reviewed for consistency and accuracy through a series of summaries. Whenever possible crossing data values were reviewed against a secondary data source to ensure accuracy. Visual reviews and a histogram of each project criteria were also completed using GIS. Visual reviews included displaying individual data sets on maps to confirm the data was consistent with the primary data source and consistent across rail lines. Histograms were used as a secondary quality control measure to review consistency and completeness and identify outliers.
o Group Review: Points representing each of the 2,180 crossings as well as thematic map layers representing each criteria were loaded to a web map and made available to the project team for review.
3.0 DATA SOURCES
The Road‐Rail Conflicts Database was developed by assembling readily available data from a variety of sources. This section lists and sources the data that is included in the database, as shown in Table 1. Limitations or issues with the data are also summarized.
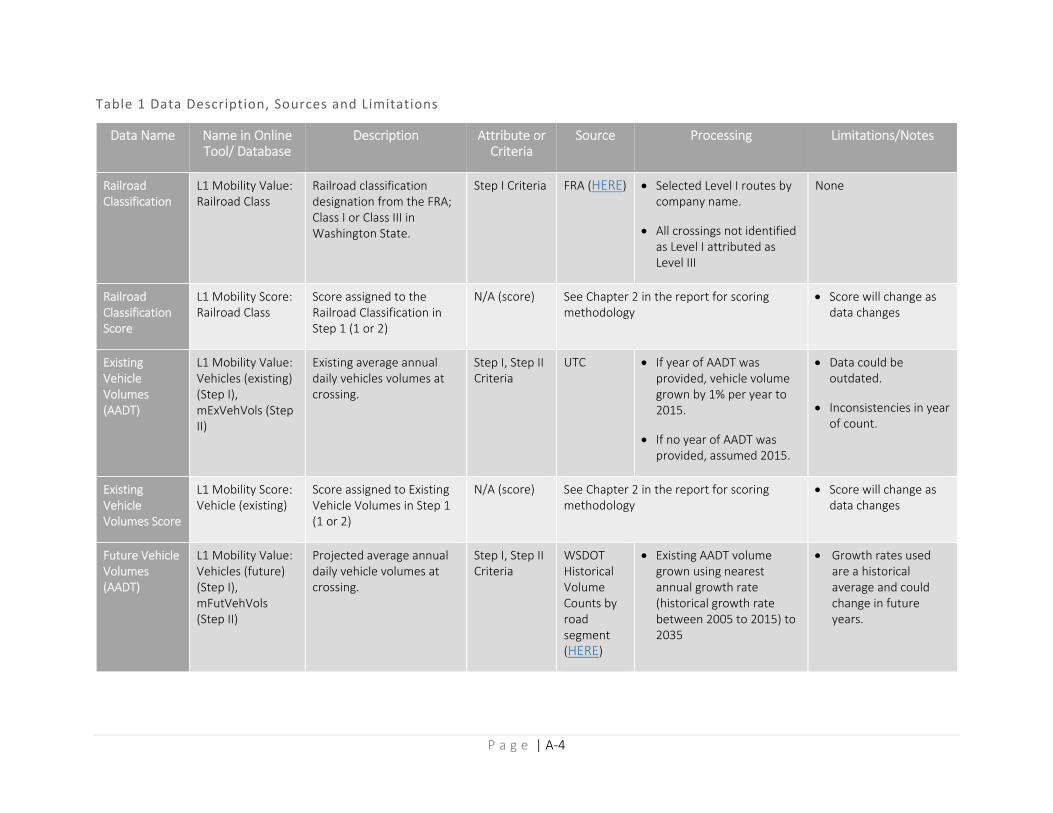
P a g e | A‐4
Table 1 Data Description, Sources and Limitations
Data Name Name in Online Tool/ Database
Description Attribute or Criteria
Source Processing Limitations/Notes
Railroad Classification
L1 Mobility Value: Railroad Class
Railroad classification designation from the FRA; Class I or Class III in Washington State.
Step I Criteria FRA (HERE)
Selected Level I routes by company name.
All crossings not identified as Level I attributed as Level III
None
Railroad Classification Score
L1 Mobility Score: Railroad Class
Score assigned to the Railroad Classification in Step 1 (1 or 2)
N/A (score) See Chapter 2 in the report for scoring methodology
Score will change as data changes
Existing Vehicle Volumes (AADT)
L1 Mobility Value: Vehicles (existing) (Step I), mExVehVols (Step II)
Existing average annual daily vehicles volumes at crossing.
Step I, Step II Criteria
UTC If year of AADT was provided, vehicle volume grown by 1% per year to 2015.
If no year of AADT was provided, assumed 2015.
Data could be outdated.
Inconsistencies in year of count.
Existing Vehicle Volumes Score
L1 Mobility Score: Vehicle (existing)
Score assigned to Existing Vehicle Volumes in Step 1 (1 or 2)
N/A (score) See Chapter 2 in the report for scoring methodology
Score will change as data changes
Future Vehicle Volumes (AADT)
L1 Mobility Value: Vehicles (future) (Step I), mFutVehVols (Step II)
Projected average annual daily vehicle volumes at crossing.
Step I, Step II Criteria
WSDOT Historical Volume Counts by road segment (HERE)
Existing AADT volume grown using nearest annual growth rate (historical growth rate between 2005 to 2015) to 2035
Growth rates used are a historical average and could change in future years.
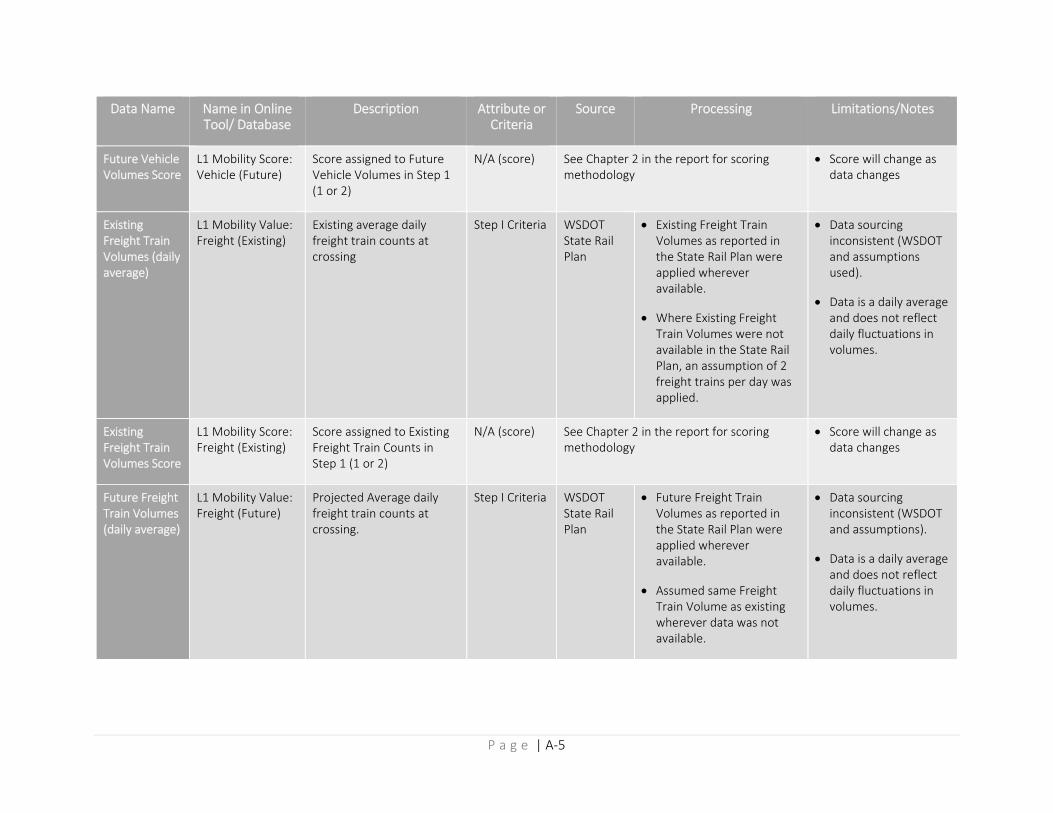
P a g e | A‐5
Data Name Name in Online Tool/ Database
Description Attribute or Criteria
Source Processing Limitations/Notes
Future Vehicle Volumes Score
L1 Mobility Score: Vehicle (Future)
Score assigned to Future Vehicle Volumes in Step 1 (1 or 2)
N/A (score) See Chapter 2 in the report for scoring methodology
Score will change as data changes
Existing Freight Train Volumes (daily average)
L1 Mobility Value: Freight (Existing)
Existing average daily freight train counts at crossing
Step I Criteria WSDOT State Rail Plan
Existing Freight Train Volumes as reported in the State Rail Plan were applied wherever available.
Where Existing Freight Train Volumes were not available in the State Rail Plan, an assumption of 2 freight trains per day was applied.
Data sourcing inconsistent (WSDOT and assumptions used).
Data is a daily average and does not reflect daily fluctuations in volumes.
Existing Freight Train Volumes Score
L1 Mobility Score: Freight (Existing)
Score assigned to Existing Freight Train Counts in Step 1 (1 or 2)
N/A (score) See Chapter 2 in the report for scoring methodology
Score will change as data changes
Future Freight Train Volumes (daily average)
L1 Mobility Value: Freight (Future)
Projected Average daily freight train counts at crossing.
Step I Criteria WSDOT State Rail Plan
Future Freight Train Volumes as reported in the State Rail Plan were applied wherever available.
Assumed same Freight Train Volume as existing wherever data was not available.
Data sourcing inconsistent (WSDOT and assumptions).
Data is a daily average and does not reflect daily fluctuations in volumes.
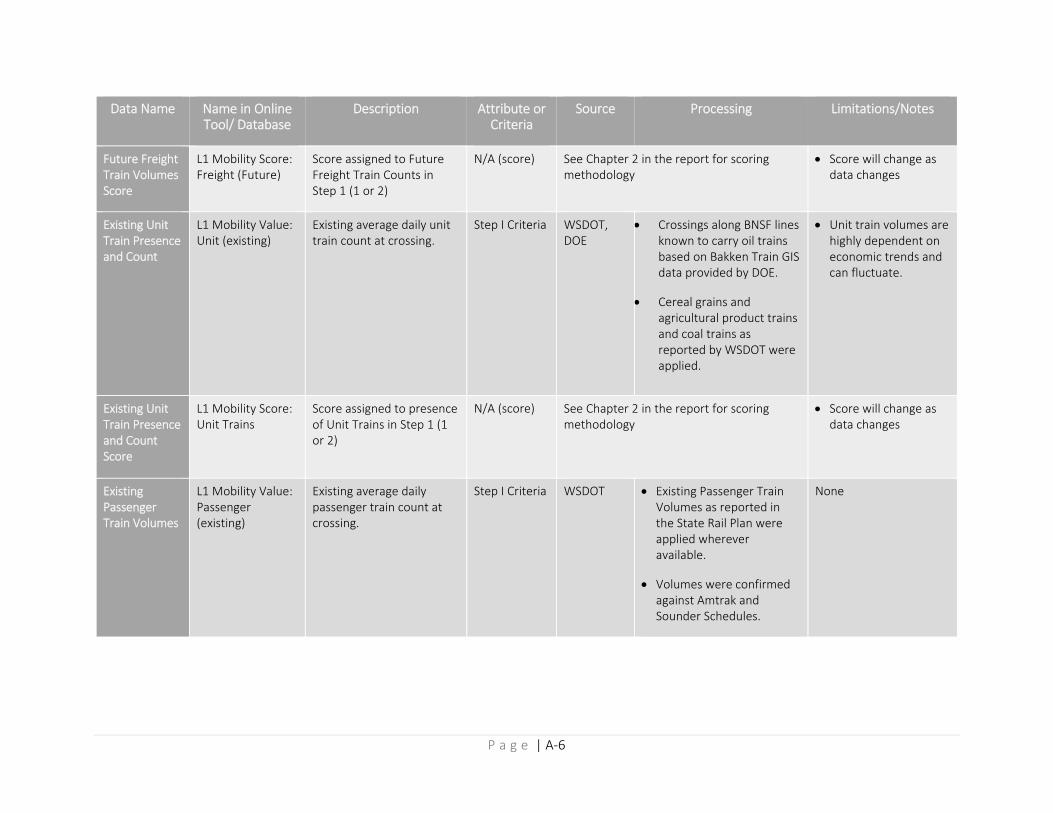
P a g e | A‐6
Data Name Name in Online Tool/ Database
Description Attribute or Criteria
Source Processing Limitations/Notes
Future Freight Train Volumes Score
L1 Mobility Score: Freight (Future)
Score assigned to Future Freight Train Counts in Step 1 (1 or 2)
N/A (score) See Chapter 2 in the report for scoring methodology
Score will change as data changes
Existing Unit Train Presence and Count
L1 Mobility Value: Unit (existing)
Existing average daily unit train count at crossing.
Step I Criteria WSDOT, DOE
Crossings along BNSF lines known to carry oil trains based on Bakken Train GIS data provided by DOE.
Cereal grains and agricultural product trains and coal trains as reported by WSDOT were applied.
Unit train volumes are highly dependent on economic trends and can fluctuate.
Existing Unit Train Presence and Count Score
L1 Mobility Score: Unit Trains
Score assigned to presence of Unit Trains in Step 1 (1 or 2)
N/A (score) See Chapter 2 in the report for scoring methodology
Score will change as data changes
Existing Passenger Train Volumes
L1 Mobility Value: Passenger (existing)
Existing average daily passenger train count at crossing.
Step I Criteria WSDOT Existing Passenger Train Volumes as reported in the State Rail Plan were applied wherever available.
Volumes were confirmed against Amtrak and Sounder Schedules.
None
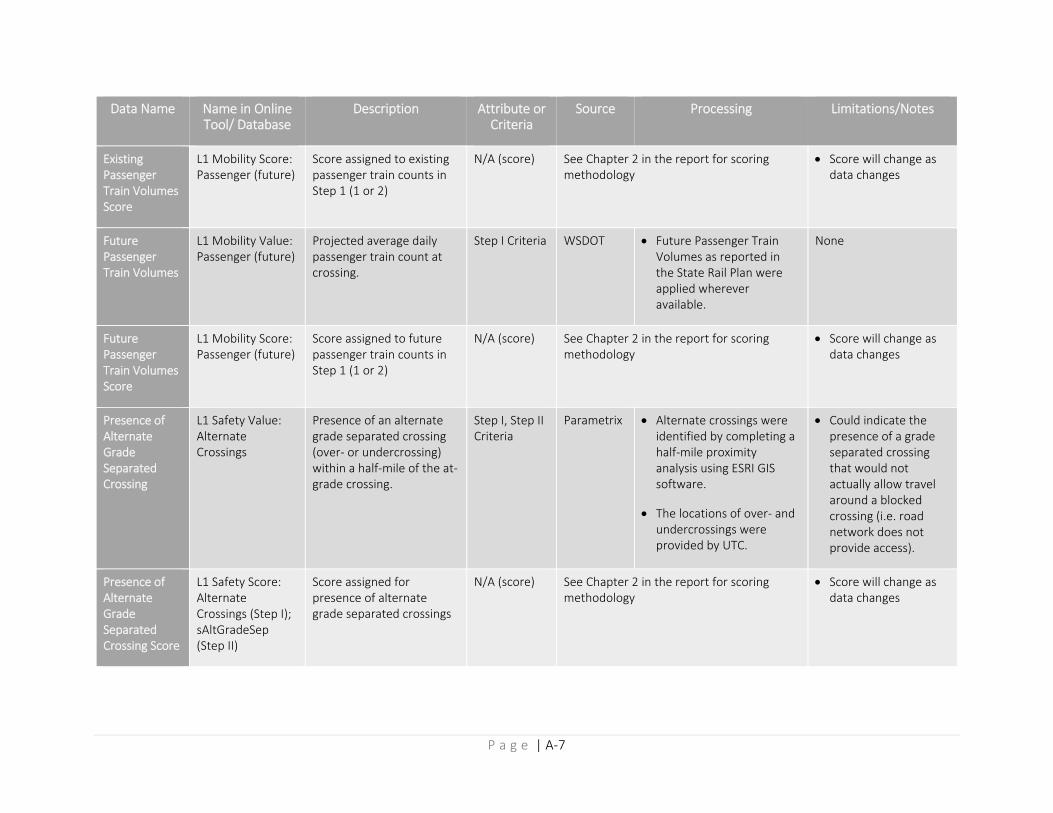
P a g e | A‐7
Data Name Name in Online Tool/ Database
Description Attribute or Criteria
Source Processing Limitations/Notes
Existing Passenger Train Volumes Score
L1 Mobility Score: Passenger (future)
Score assigned to existing passenger train counts in Step 1 (1 or 2)
N/A (score) See Chapter 2 in the report for scoring methodology
Score will change as data changes
Future Passenger Train Volumes
L1 Mobility Value: Passenger (future)
Projected average daily passenger train count at crossing.
Step I Criteria WSDOT Future Passenger Train Volumes as reported in the State Rail Plan were applied wherever available.
None
Future Passenger Train Volumes Score
L1 Mobility Score: Passenger (future)
Score assigned to future passenger train counts in Step 1 (1 or 2)
N/A (score) See Chapter 2 in the report for scoring methodology
Score will change as data changes
Presence of Alternate Grade Separated Crossing
L1 Safety Value: Alternate Crossings
Presence of an alternate grade separated crossing (over‐ or undercrossing) within a half‐mile of the at‐grade crossing.
Step I, Step II Criteria
Parametrix Alternate crossings were identified by completing a half‐mile proximity analysis using ESRI GIS software.
The locations of over‐ and undercrossings were provided by UTC.
Could indicate the presence of a grade separated crossing that would not actually allow travel around a blocked crossing (i.e. road network does not provide access).
Presence of Alternate Grade Separated Crossing Score
L1 Safety Score: Alternate Crossings (Step I); sAltGradeSep (Step II)
Score assigned for presence of alternate grade separated crossings
N/A (score) See Chapter 2 in the report for scoring methodology
Score will change as data changes
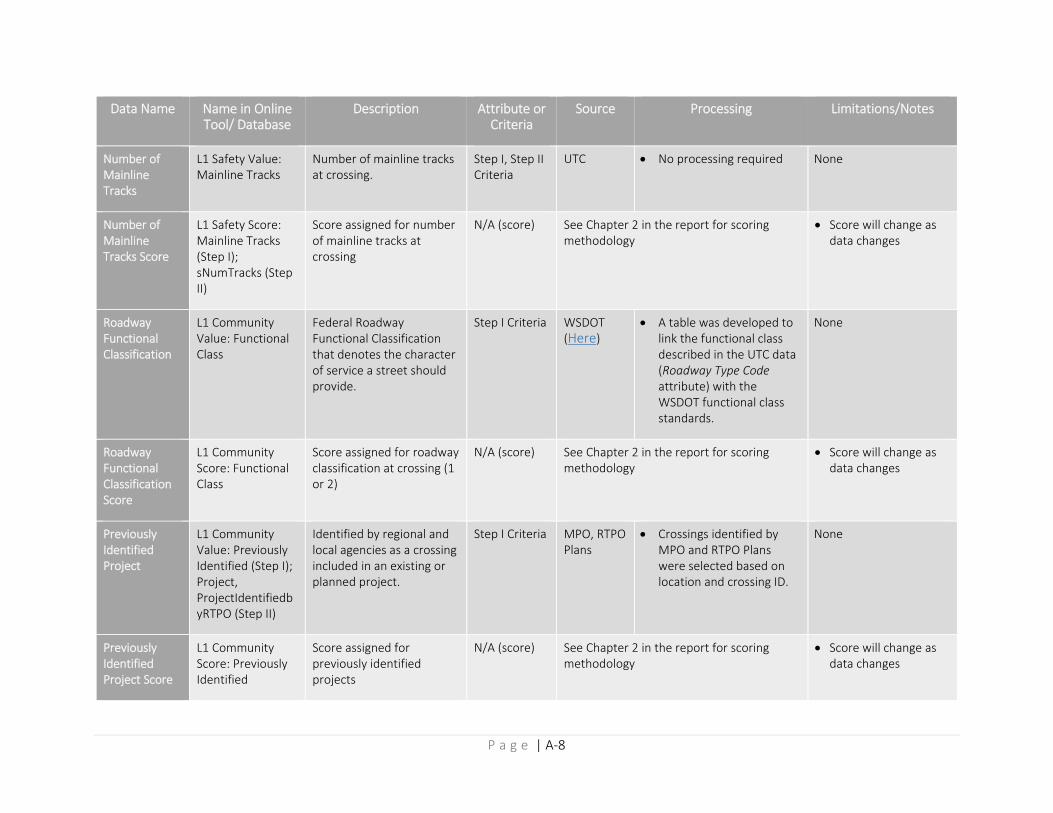
P a g e | A‐8
Data Name Name in Online Tool/ Database
Description Attribute or Criteria
Source Processing Limitations/Notes
Number of Mainline Tracks
L1 Safety Value: Mainline Tracks
Number of mainline tracks at crossing.
Step I, Step II Criteria
UTC No processing required None
Number of Mainline Tracks Score
L1 Safety Score: Mainline Tracks (Step I); sNumTracks (Step II)
Score assigned for number of mainline tracks at crossing
N/A (score) See Chapter 2 in the report for scoring methodology
Score will change as data changes
Roadway Functional Classification
L1 Community Value: Functional Class
Federal Roadway Functional Classification that denotes the character of service a street should provide.
Step I Criteria WSDOT (Here)
A table was developed to link the functional class described in the UTC data (Roadway Type Code attribute) with the WSDOT functional class standards.
None
Roadway Functional Classification Score
L1 Community Score: Functional Class
Score assigned for roadway classification at crossing (1 or 2)
N/A (score) See Chapter 2 in the report for scoring methodology
Score will change as data changes
Previously Identified Project
L1 Community Value: Previously Identified (Step I); Project, ProjectIdentifiedbyRTPO (Step II)
Identified by regional and local agencies as a crossing included in an existing or planned project.
Step I Criteria MPO, RTPO Plans
Crossings identified by MPO and RTPO Plans were selected based on location and crossing ID.
None
Previously Identified Project Score
L1 Community Score: Previously Identified
Score assigned for previously identified projects
N/A (score) See Chapter 2 in the report for scoring methodology
Score will change as data changes
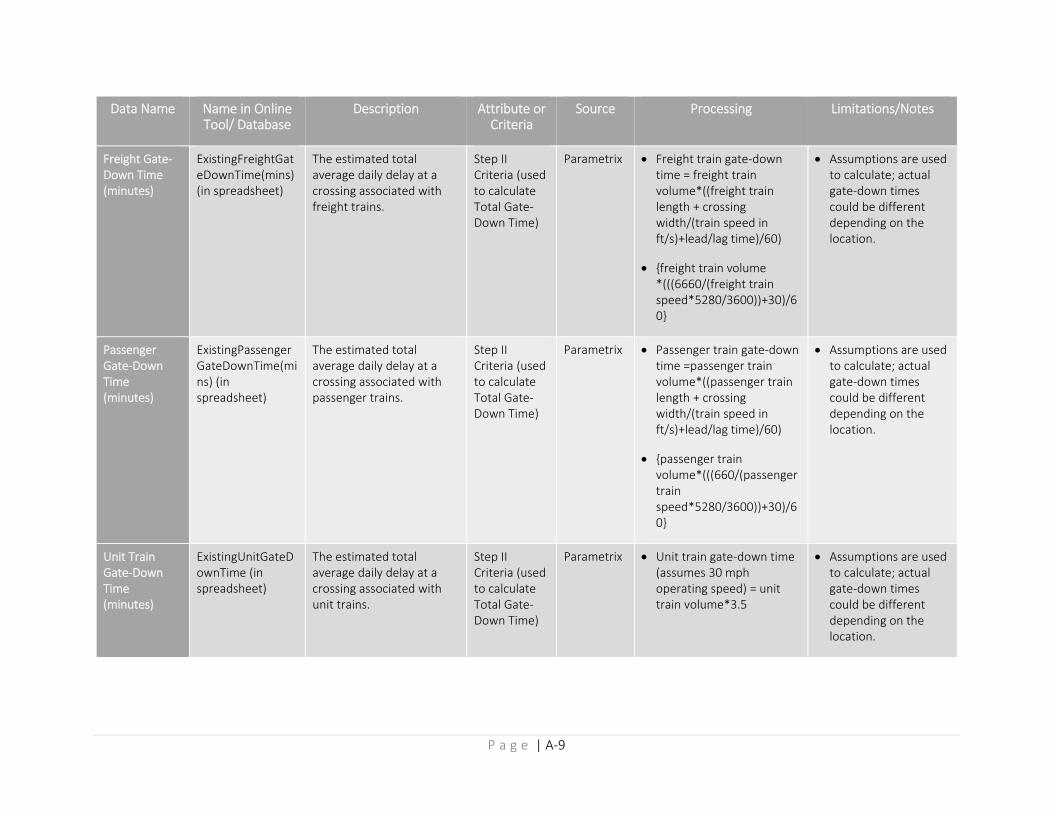
P a g e | A‐9
Data Name Name in Online Tool/ Database
Description Attribute or Criteria
Source Processing Limitations/Notes
Freight Gate‐Down Time (minutes)
ExistingFreightGateDownTime(mins) (in spreadsheet)
The estimated total average daily delay at a crossing associated with freight trains.
Step II Criteria (used to calculate Total Gate‐Down Time)
Parametrix Freight train gate‐down time = freight train volume*((freight train length + crossing width/(train speed in ft/s)+lead/lag time)/60)
{freight train volume *(((6660/(freight train speed*5280/3600))+30)/60}
Assumptions are used to calculate; actual gate‐down times could be different depending on the location.
Passenger Gate‐Down Time (minutes)
ExistingPassengerGateDownTime(mins) (in spreadsheet)
The estimated total average daily delay at a crossing associated with passenger trains.
Step II Criteria (used to calculate Total Gate‐Down Time)
Parametrix Passenger train gate‐down time =passenger train volume*((passenger train length + crossing width/(train speed in ft/s)+lead/lag time)/60)
{passenger train volume*(((660/(passenger train speed*5280/3600))+30)/60}
Assumptions are used to calculate; actual gate‐down times could be different depending on the location.
Unit Train Gate‐Down Time (minutes)
ExistingUnitGateDownTime (in spreadsheet)
The estimated total average daily delay at a crossing associated with unit trains.
Step II Criteria (used to calculate Total Gate‐Down Time)
Parametrix Unit train gate‐down time (assumes 30 mph operating speed) = unit train volume*3.5
Assumptions are used to calculate; actual gate‐down times could be different depending on the location.
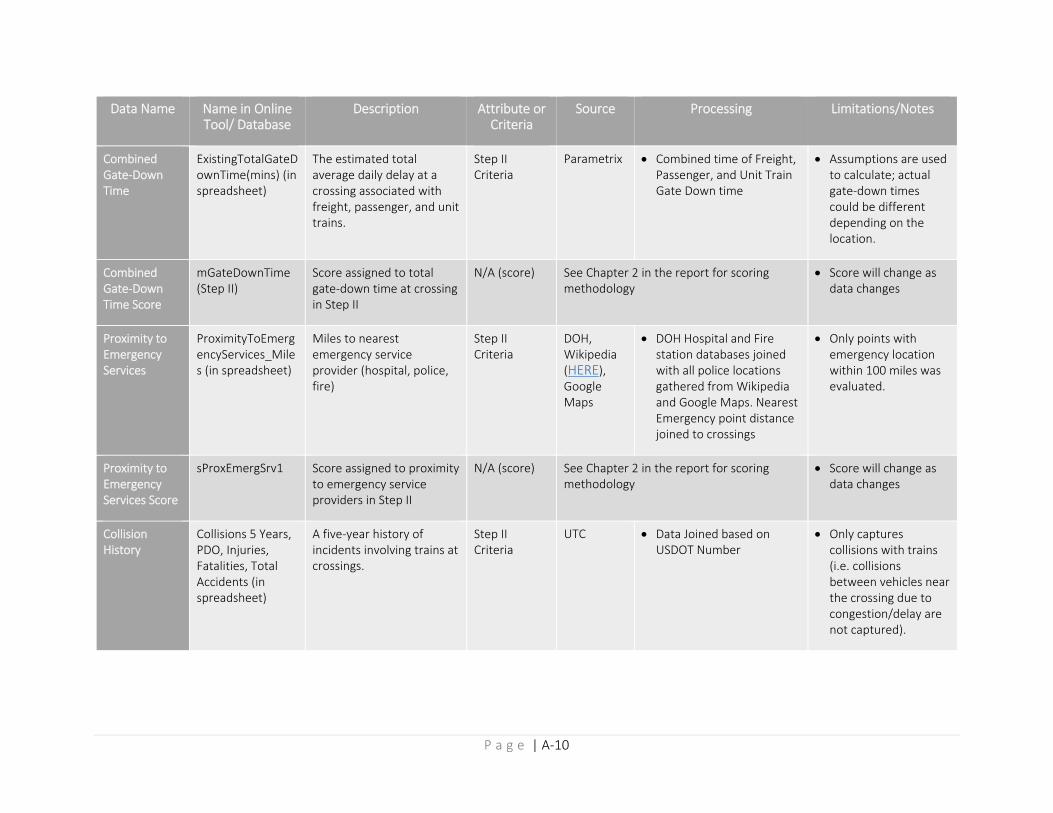
P a g e | A‐10
Data Name Name in Online Tool/ Database
Description Attribute or Criteria
Source Processing Limitations/Notes
Combined Gate‐Down Time
ExistingTotalGateDownTime(mins) (in spreadsheet)
The estimated total average daily delay at a crossing associated with freight, passenger, and unit trains.
Step II Criteria
Parametrix Combined time of Freight, Passenger, and Unit Train Gate Down time
Assumptions are used to calculate; actual gate‐down times could be different depending on the location.
Combined Gate‐Down Time Score
mGateDownTime (Step II)
Score assigned to total gate‐down time at crossing in Step II
N/A (score) See Chapter 2 in the report for scoring methodology
Score will change as data changes
Proximity to Emergency Services
ProximityToEmergencyServices_Miles (in spreadsheet)
Miles to nearest emergency service provider (hospital, police, fire)
Step II Criteria
DOH, Wikipedia (HERE), Google Maps
DOH Hospital and Fire station databases joined with all police locations gathered from Wikipedia and Google Maps. Nearest Emergency point distance joined to crossings
Only points with emergency location within 100 miles was evaluated.
Proximity to Emergency Services Score
sProxEmergSrv1 Score assigned to proximity to emergency service providers in Step II
N/A (score) See Chapter 2 in the report for scoring methodology
Score will change as data changes
Collision History
Collisions 5 Years, PDO, Injuries, Fatalities, Total Accidents (in spreadsheet)
A five‐year history of incidents involving trains at crossings.
Step II Criteria
UTC Data Joined based on USDOT Number
Only captures collisions with trains (i.e. collisions between vehicles near the crossing due to congestion/delay are not captured).
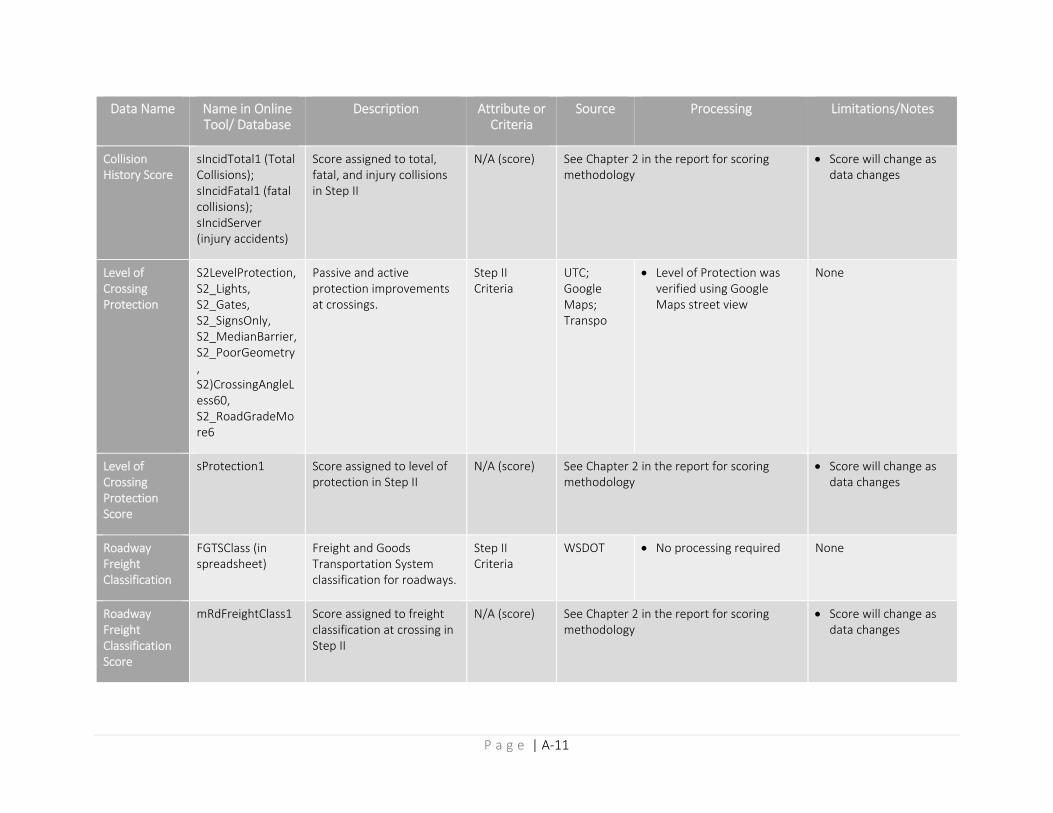
P a g e | A‐11
Data Name Name in Online Tool/ Database
Description Attribute or Criteria
Source Processing Limitations/Notes
Collision History Score
sIncidTotal1 (Total Collisions); sIncidFatal1 (fatal collisions); sIncidServer (injury accidents)
Score assigned to total, fatal, and injury collisions in Step II
N/A (score) See Chapter 2 in the report for scoring methodology
Score will change as data changes
Level of Crossing Protection
S2LevelProtection, S2_Lights, S2_Gates, S2_SignsOnly, S2_MedianBarrier, S2_PoorGeometry, S2)CrossingAngleLess60, S2_RoadGradeMore6
Passive and active protection improvements at crossings.
Step II Criteria
UTC; Google Maps; Transpo
Level of Protection was verified using Google Maps street view
None
Level of Crossing Protection Score
sProtection1 Score assigned to level of protection in Step II
N/A (score) See Chapter 2 in the report for scoring methodology
Score will change as data changes
Roadway Freight Classification
FGTSClass (in spreadsheet)
Freight and Goods Transportation System classification for roadways.
Step II Criteria
WSDOT No processing required None
Roadway Freight Classification Score
mRdFreightClass1 Score assigned to freight classification at crossing in Step II
N/A (score) See Chapter 2 in the report for scoring methodology
Score will change as data changes
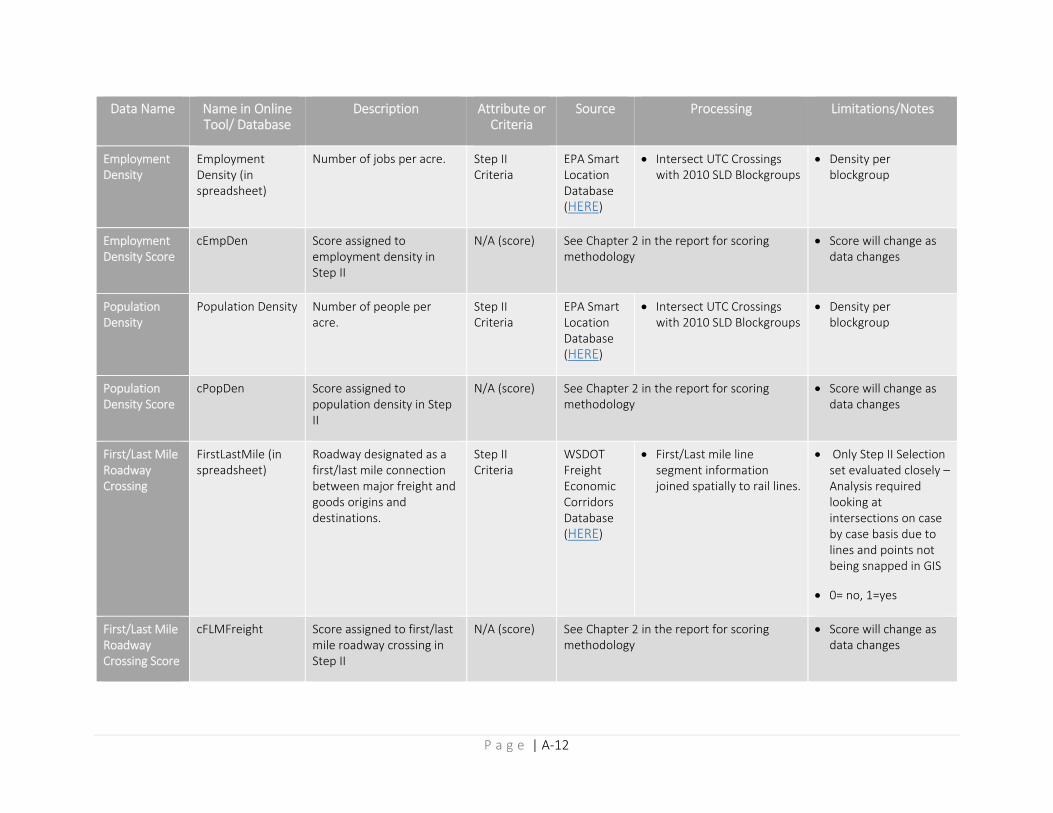
P a g e | A‐12
Data Name Name in Online Tool/ Database
Description Attribute or Criteria
Source Processing Limitations/Notes
Employment Density
Employment Density (in spreadsheet)
Number of jobs per acre. Step II Criteria
EPA Smart Location Database (HERE)
Intersect UTC Crossings with 2010 SLD Blockgroups
Density per blockgroup
Employment Density Score
cEmpDen Score assigned to employment density in Step II
N/A (score) See Chapter 2 in the report for scoring methodology
Score will change as data changes
Population Density
Population Density Number of people per acre.
Step II Criteria
EPA Smart Location Database (HERE)
Intersect UTC Crossings with 2010 SLD Blockgroups
Density per blockgroup
Population Density Score
cPopDen Score assigned to population density in Step II
N/A (score) See Chapter 2 in the report for scoring methodology
Score will change as data changes
First/Last Mile Roadway Crossing
FirstLastMile (in spreadsheet)
Roadway designated as a first/last mile connection between major freight and goods origins and destinations.
Step II Criteria
WSDOT Freight Economic Corridors Database (HERE)
First/Last mile line segment information joined spatially to rail lines.
Only Step II Selection set evaluated closely – Analysis required looking at intersections on case by case basis due to lines and points not being snapped in GIS
0= no, 1=yes
First/Last Mile Roadway Crossing Score
cFLMFreight Score assigned to first/last mile roadway crossing in Step II
N/A (score) See Chapter 2 in the report for scoring methodology
Score will change as data changes
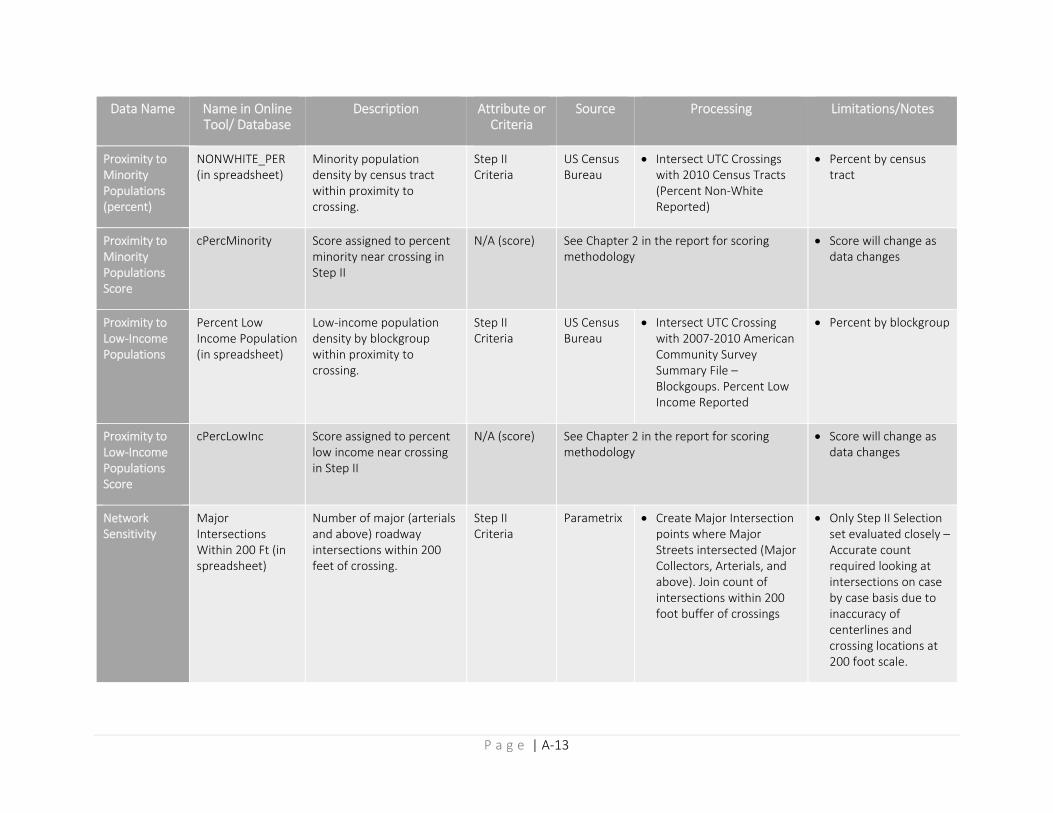
P a g e | A‐13
Data Name Name in Online Tool/ Database
Description Attribute or Criteria
Source Processing Limitations/Notes
Proximity to Minority Populations (percent)
NONWHITE_PER (in spreadsheet)
Minority population density by census tract within proximity to crossing.
Step II Criteria
US Census Bureau
Intersect UTC Crossings with 2010 Census Tracts (Percent Non‐White Reported)
Percent by census tract
Proximity to Minority Populations Score
cPercMinority Score assigned to percent minority near crossing in Step II
N/A (score) See Chapter 2 in the report for scoring methodology
Score will change as data changes
Proximity to Low‐Income Populations
Percent Low Income Population (in spreadsheet)
Low‐income population density by blockgroup within proximity to crossing.
Step II Criteria
US Census Bureau
Intersect UTC Crossing with 2007‐2010 American Community Survey Summary File – Blockgoups. Percent Low Income Reported
Percent by blockgroup
Proximity to Low‐Income Populations Score
cPercLowInc Score assigned to percent low income near crossing in Step II
N/A (score) See Chapter 2 in the report for scoring methodology
Score will change as data changes
Network Sensitivity
Major Intersections Within 200 Ft (in spreadsheet)
Number of major (arterials and above) roadway intersections within 200 feet of crossing.
Step II Criteria
Parametrix Create Major Intersection points where Major Streets intersected (Major Collectors, Arterials, and above). Join count of intersections within 200 foot buffer of crossings
Only Step II Selection set evaluated closely – Accurate count required looking at intersections on case by case basis due to inaccuracy of centerlines and crossing locations at 200 foot scale.
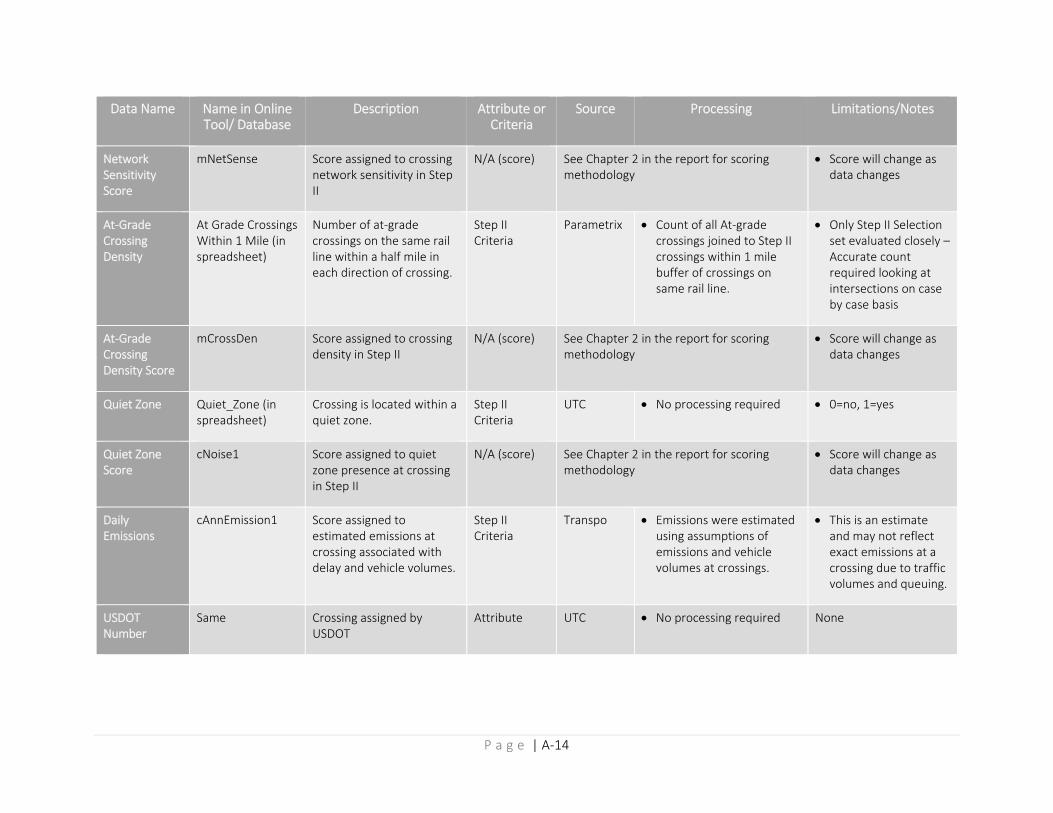
P a g e | A‐14
Data Name Name in Online Tool/ Database
Description Attribute or Criteria
Source Processing Limitations/Notes
Network Sensitivity Score
mNetSense Score assigned to crossing network sensitivity in Step II
N/A (score) See Chapter 2 in the report for scoring methodology
Score will change as data changes
At‐Grade Crossing Density
At Grade Crossings Within 1 Mile (in spreadsheet)
Number of at‐grade crossings on the same rail line within a half mile in each direction of crossing.
Step II Criteria
Parametrix Count of all At‐grade crossings joined to Step II crossings within 1 mile buffer of crossings on same rail line.
Only Step II Selection set evaluated closely – Accurate count required looking at intersections on case by case basis
At‐Grade Crossing Density Score
mCrossDen Score assigned to crossing density in Step II
N/A (score) See Chapter 2 in the report for scoring methodology
Score will change as data changes
Quiet Zone Quiet_Zone (in spreadsheet)
Crossing is located within a quiet zone.
Step II Criteria
UTC No processing required 0=no, 1=yes
Quiet Zone Score
cNoise1 Score assigned to quiet zone presence at crossing in Step II
N/A (score) See Chapter 2 in the report for scoring methodology
Score will change as data changes
Daily Emissions
cAnnEmission1 Score assigned to estimated emissions at crossing associated with delay and vehicle volumes.
Step II Criteria
Transpo Emissions were estimated using assumptions of emissions and vehicle volumes at crossings.
This is an estimate and may not reflect exact emissions at a crossing due to traffic volumes and queuing.
USDOT Number
Same Crossing assigned by USDOT
Attribute UTC No processing required None
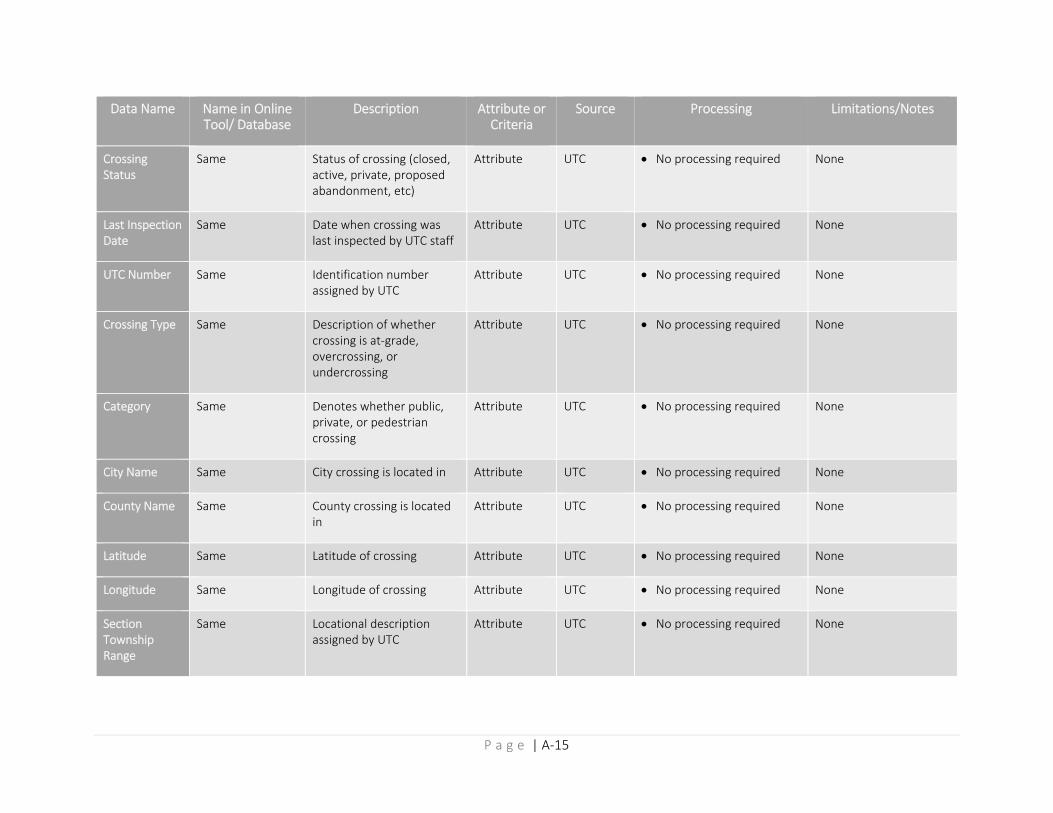
P a g e | A‐15
Data Name Name in Online Tool/ Database
Description Attribute or Criteria
Source Processing Limitations/Notes
Crossing Status
Same Status of crossing (closed, active, private, proposed abandonment, etc)
Attribute UTC No processing required None
Last Inspection Date
Same Date when crossing was last inspected by UTC staff
Attribute UTC No processing required None
UTC Number Same Identification number assigned by UTC
Attribute UTC No processing required None
Crossing Type Same Description of whether crossing is at‐grade, overcrossing, or undercrossing
Attribute UTC No processing required None
Category Same Denotes whether public, private, or pedestrian crossing
Attribute UTC No processing required None
City Name Same City crossing is located in Attribute UTC No processing required None
County Name Same County crossing is located in
Attribute UTC No processing required None
Latitude Same Latitude of crossing Attribute UTC No processing required None
Longitude Same Longitude of crossing Attribute UTC No processing required None
Section Township Range
Same Locational description assigned by UTC
Attribute UTC No processing required None
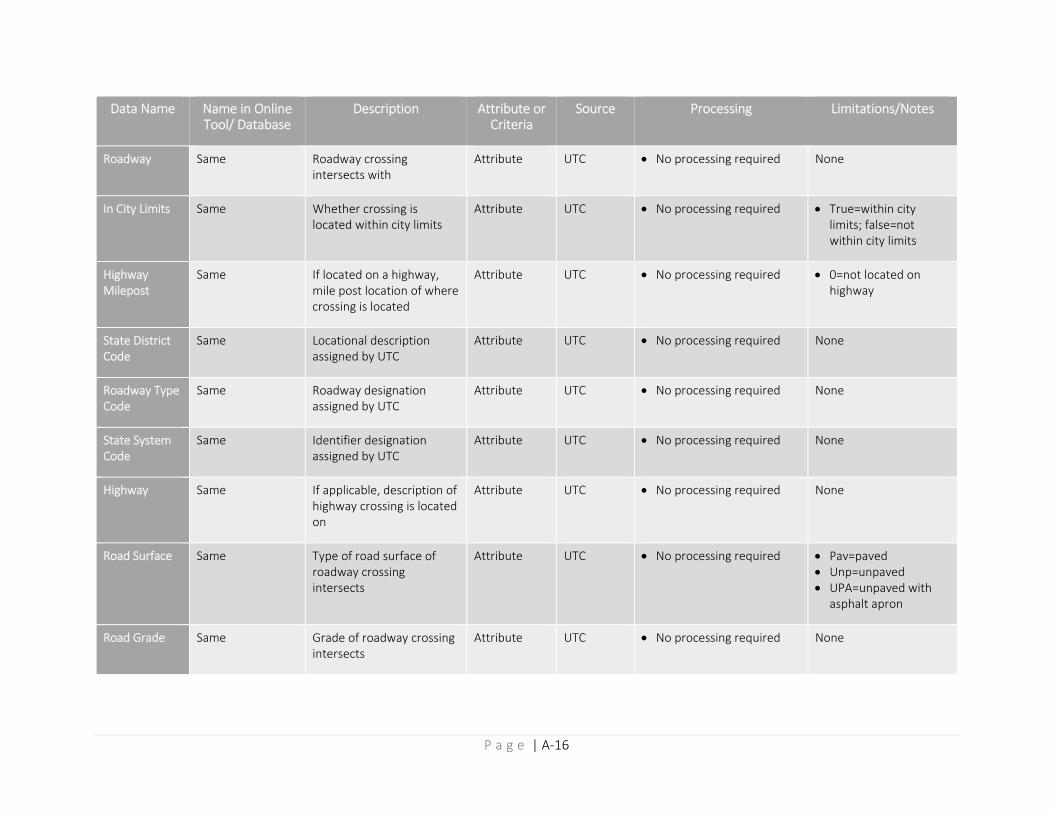
P a g e | A‐16
Data Name Name in Online Tool/ Database
Description Attribute or Criteria
Source Processing Limitations/Notes
Roadway Same Roadway crossing intersects with
Attribute UTC No processing required None
In City Limits Same Whether crossing is located within city limits
Attribute UTC No processing required True=within city limits; false=not within city limits
Highway Milepost
Same If located on a highway, mile post location of where crossing is located
Attribute UTC No processing required 0=not located on highway
State District Code
Same Locational description assigned by UTC
Attribute UTC No processing required None
Roadway Type Code
Same Roadway designation assigned by UTC
Attribute UTC No processing required None
State System Code
Same Identifier designation assigned by UTC
Attribute UTC No processing required None
Highway Same If applicable, description of highway crossing is located on
Attribute UTC No processing required None
Road Surface Same Type of road surface of roadway crossing intersects
Attribute UTC No processing required Pav=paved Unp=unpaved UPA=unpaved with
asphalt apron
Road Grade Same Grade of roadway crossing intersects
Attribute UTC No processing required None
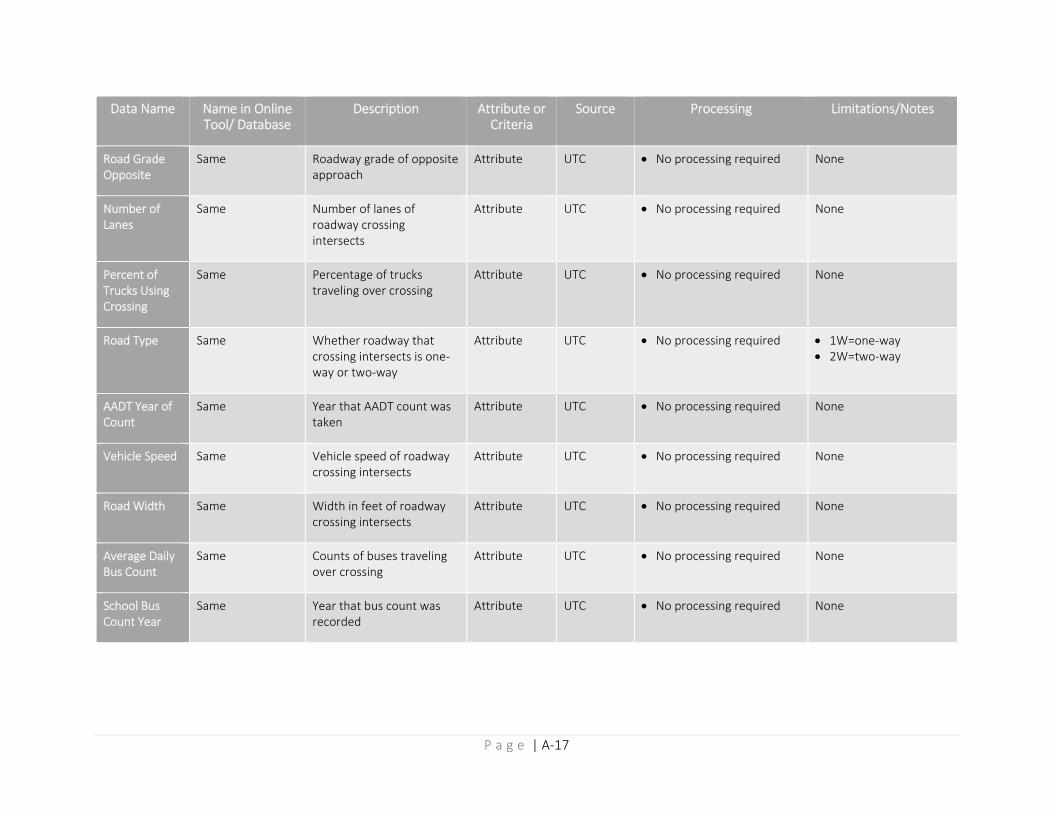
P a g e | A‐17
Data Name Name in Online Tool/ Database
Description Attribute or Criteria
Source Processing Limitations/Notes
Road Grade Opposite
Same Roadway grade of opposite approach
Attribute UTC No processing required None
Number of Lanes
Same Number of lanes of roadway crossing intersects
Attribute UTC No processing required None
Percent of Trucks Using Crossing
Same Percentage of trucks traveling over crossing
Attribute UTC No processing required None
Road Type Same Whether roadway that crossing intersects is one‐way or two‐way
Attribute UTC No processing required 1W=one‐way 2W=two‐way
AADT Year of Count
Same Year that AADT count was taken
Attribute UTC No processing required None
Vehicle Speed Same Vehicle speed of roadway crossing intersects
Attribute UTC No processing required None
Road Width Same Width in feet of roadway crossing intersects
Attribute UTC No processing required None
Average Daily Bus Count
Same Counts of buses traveling over crossing
Attribute UTC No processing required None
School Bus Count Year
Same Year that bus count was recorded
Attribute UTC No processing required None
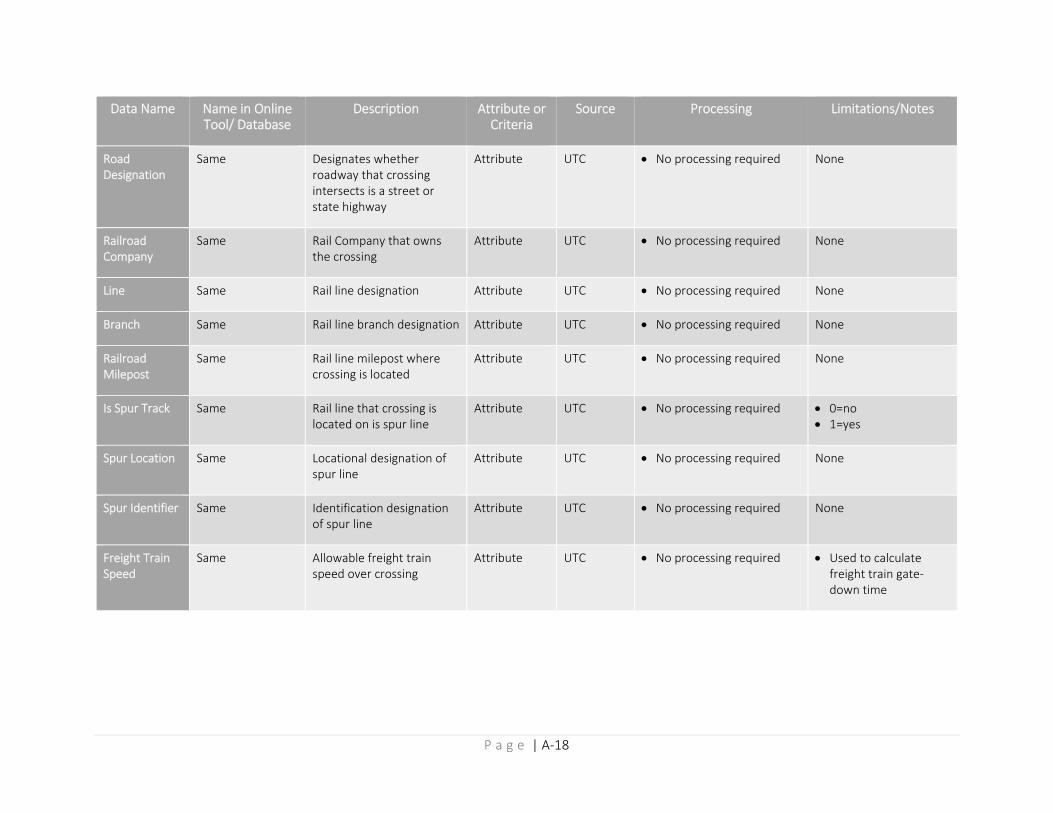
P a g e | A‐18
Data Name Name in Online Tool/ Database
Description Attribute or Criteria
Source Processing Limitations/Notes
Road Designation
Same Designates whether roadway that crossing intersects is a street or state highway
Attribute UTC No processing required None
Railroad Company
Same Rail Company that owns the crossing
Attribute UTC No processing required None
Line Same Rail line designation Attribute UTC No processing required None
Branch Same Rail line branch designation Attribute UTC No processing required None
Railroad Milepost
Same Rail line milepost where crossing is located
Attribute UTC No processing required None
Is Spur Track Same Rail line that crossing is located on is spur line
Attribute UTC No processing required 0=no 1=yes
Spur Location Same Locational designation of spur line
Attribute UTC No processing required None
Spur Identifier Same Identification designation of spur line
Attribute UTC No processing required None
Freight Train Speed
Same Allowable freight train speed over crossing
Attribute UTC No processing required Used to calculate freight train gate‐down time
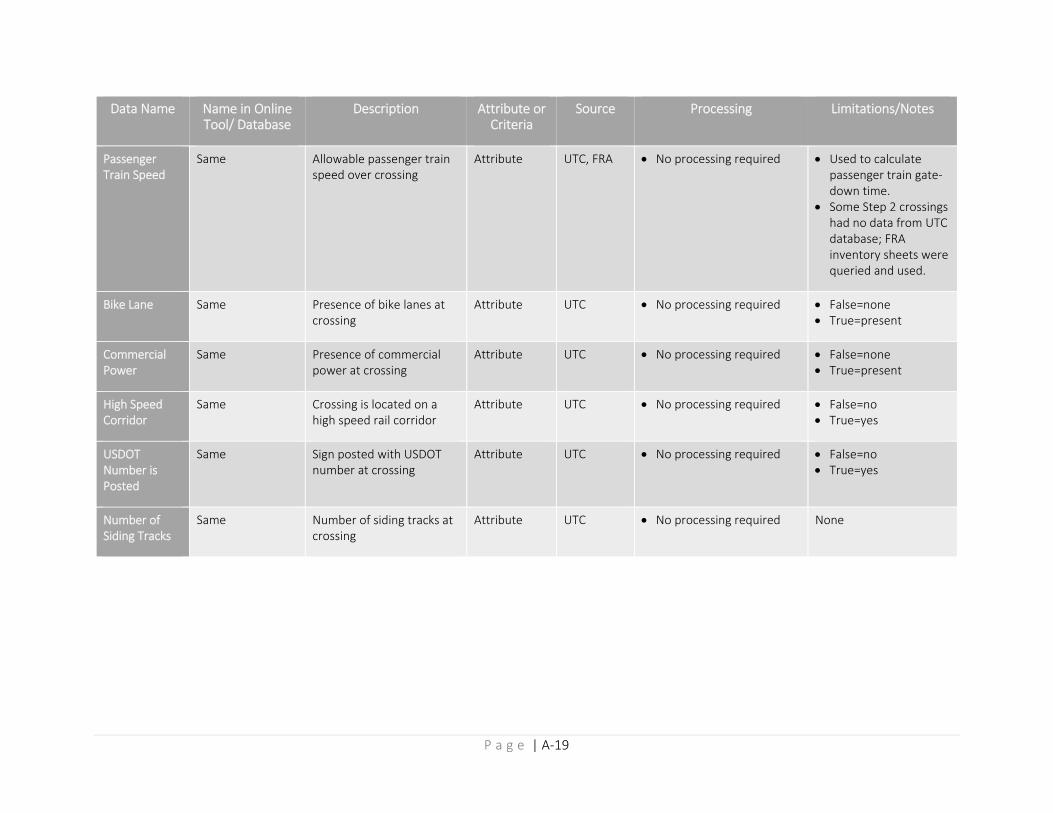
P a g e | A‐19
Data Name Name in Online Tool/ Database
Description Attribute or Criteria
Source Processing Limitations/Notes
Passenger Train Speed
Same Allowable passenger train speed over crossing
Attribute UTC, FRA No processing required Used to calculate passenger train gate‐down time.
Some Step 2 crossings had no data from UTC database; FRA inventory sheets were queried and used.
Bike Lane Same Presence of bike lanes at crossing
Attribute UTC No processing required False=none True=present
Commercial Power
Same Presence of commercial power at crossing
Attribute UTC No processing required False=none True=present
High Speed Corridor
Same Crossing is located on a high speed rail corridor
Attribute UTC No processing required False=no True=yes
USDOT Number is Posted
Same Sign posted with USDOT number at crossing
Attribute UTC No processing required False=no True=yes
Number of Siding Tracks
Same Number of siding tracks at crossing
Attribute UTC No processing required None
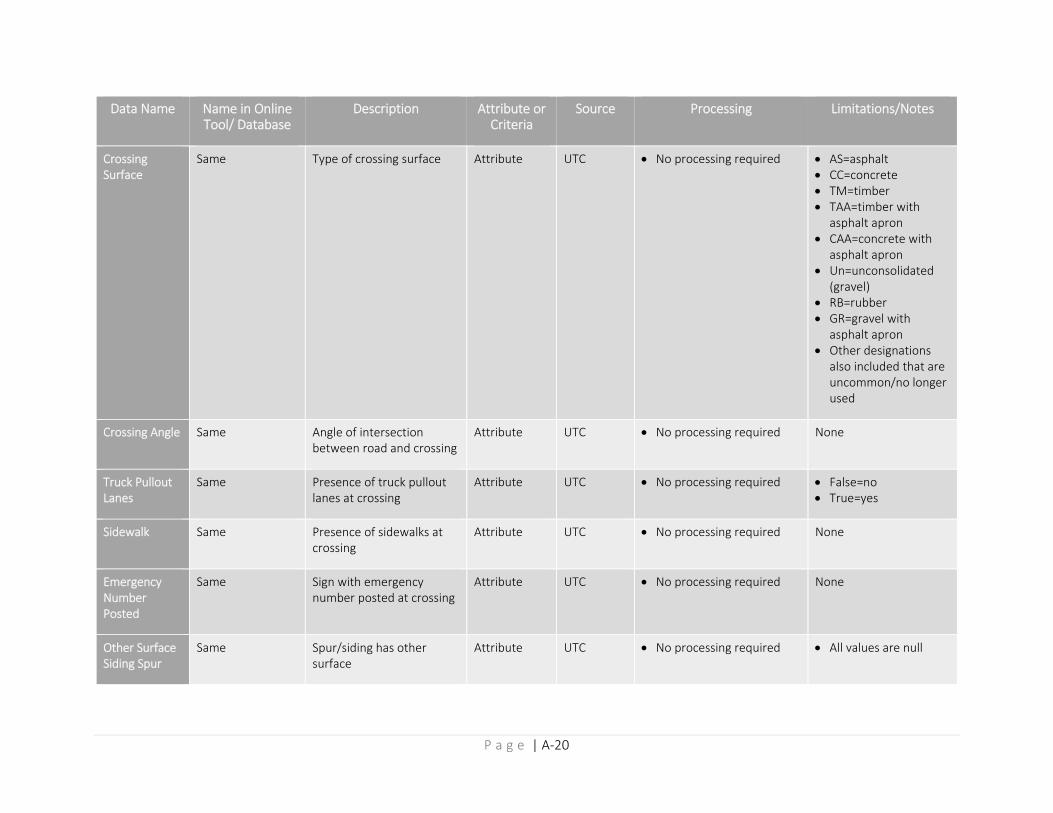
P a g e | A‐20
Data Name Name in Online Tool/ Database
Description Attribute or Criteria
Source Processing Limitations/Notes
Crossing Surface
Same Type of crossing surface Attribute UTC No processing required AS=asphalt CC=concrete TM=timber TAA=timber with
asphalt apron CAA=concrete with
asphalt apron Un=unconsolidated
(gravel) RB=rubber GR=gravel with
asphalt apron Other designations
also included that are uncommon/no longer used
Crossing Angle Same Angle of intersection between road and crossing
Attribute UTC No processing required None
Truck Pullout Lanes
Same Presence of truck pullout lanes at crossing
Attribute UTC No processing required False=no True=yes
Sidewalk Same Presence of sidewalks at crossing
Attribute UTC No processing required None
Emergency Number Posted
Same Sign with emergency number posted at crossing
Attribute UTC No processing required None
Other Surface Siding Spur
Same Spur/siding has other surface
Attribute UTC No processing required All values are null
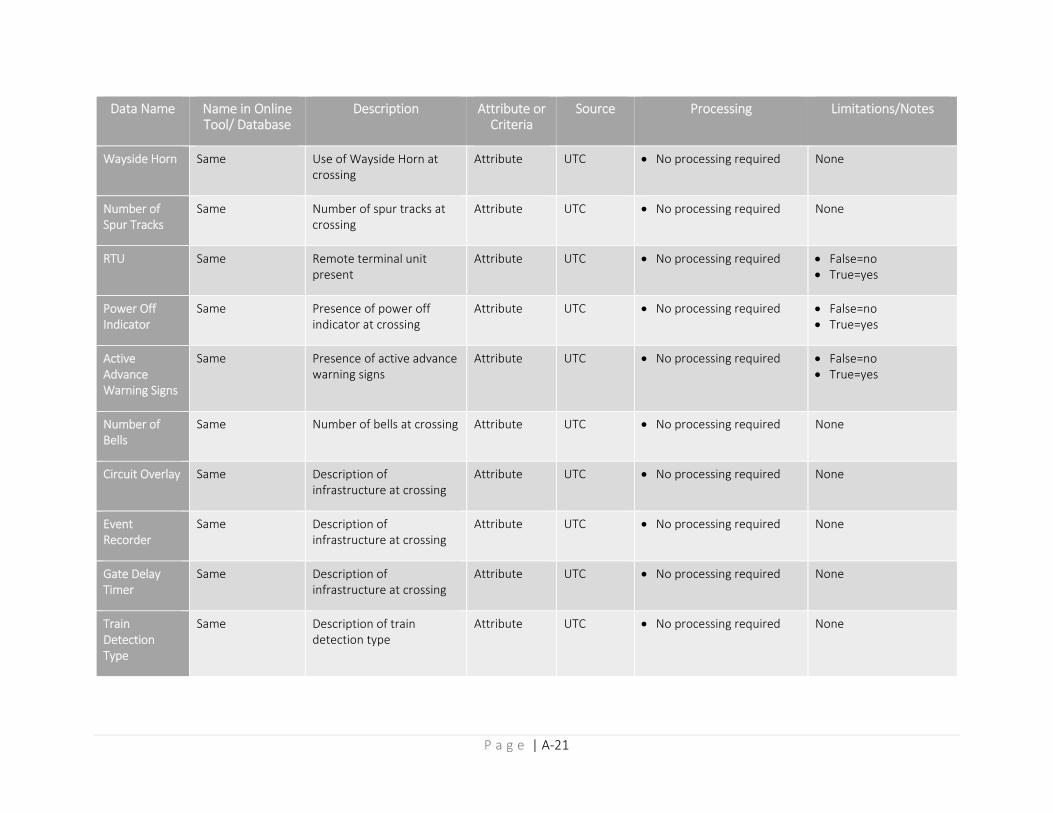
P a g e | A‐21
Data Name Name in Online Tool/ Database
Description Attribute or Criteria
Source Processing Limitations/Notes
Wayside Horn Same Use of Wayside Horn at crossing
Attribute UTC No processing required None
Number of Spur Tracks
Same Number of spur tracks at crossing
Attribute UTC No processing required None
RTU Same Remote terminal unit present
Attribute UTC No processing required False=no True=yes
Power Off Indicator
Same Presence of power off indicator at crossing
Attribute UTC No processing required False=no True=yes
Active Advance Warning Signs
Same Presence of active advance warning signs
Attribute UTC No processing required False=no True=yes
Number of Bells
Same Number of bells at crossing Attribute UTC No processing required None
Circuit Overlay Same Description of infrastructure at crossing
Attribute UTC No processing required None
Event Recorder
Same Description of infrastructure at crossing
Attribute UTC No processing required None
Gate Delay Timer
Same Description of infrastructure at crossing
Attribute UTC No processing required None
Train Detection Type
Same Description of train detection type
Attribute UTC No processing required None
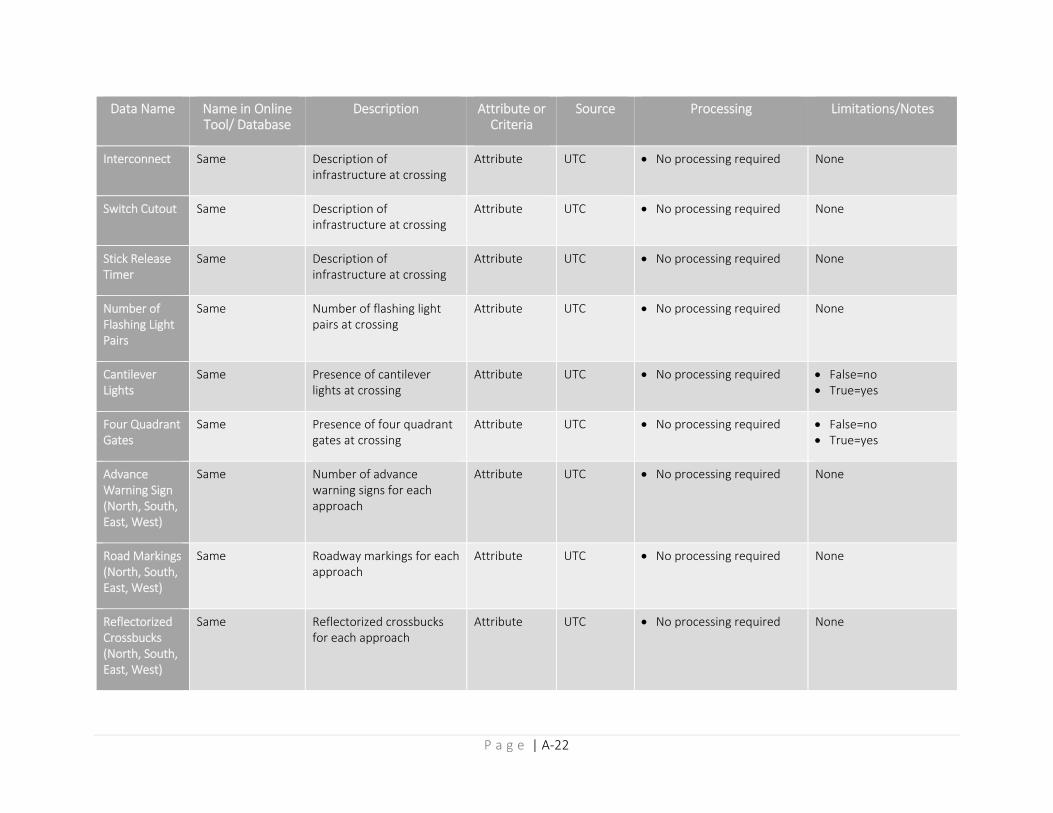
P a g e | A‐22
Data Name Name in Online Tool/ Database
Description Attribute or Criteria
Source Processing Limitations/Notes
Interconnect Same Description of infrastructure at crossing
Attribute UTC No processing required None
Switch Cutout Same Description of infrastructure at crossing
Attribute UTC No processing required None
Stick Release Timer
Same Description of infrastructure at crossing
Attribute UTC No processing required None
Number of Flashing Light Pairs
Same Number of flashing light pairs at crossing
Attribute UTC No processing required None
Cantilever Lights
Same Presence of cantilever lights at crossing
Attribute UTC No processing required False=no True=yes
Four Quadrant Gates
Same Presence of four quadrant gates at crossing
Attribute UTC No processing required False=no True=yes
Advance Warning Sign (North, South, East, West)
Same Number of advance warning signs for each approach
Attribute UTC No processing required None
Road Markings (North, South, East, West)
Same Roadway markings for each approach
Attribute UTC No processing required None
Reflectorized Crossbucks (North, South, East, West)
Same Reflectorized crossbucks for each approach
Attribute UTC No processing required None
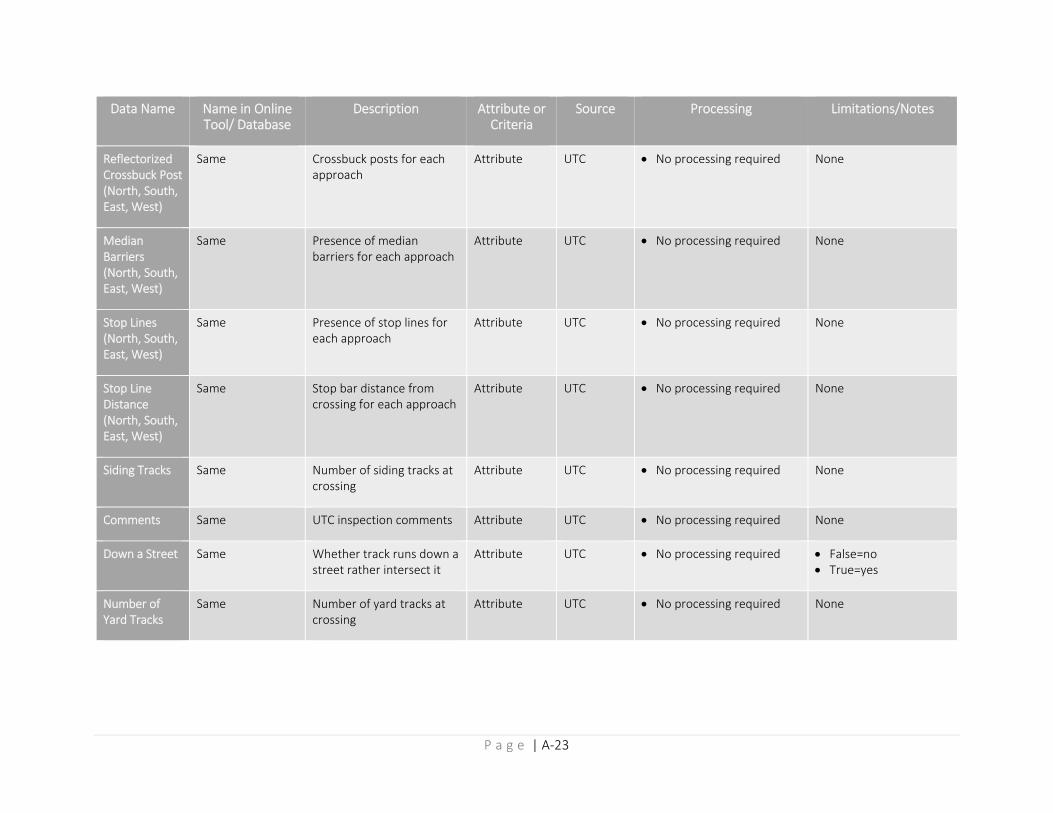
P a g e | A‐23
Data Name Name in Online Tool/ Database
Description Attribute or Criteria
Source Processing Limitations/Notes
Reflectorized Crossbuck Post (North, South, East, West)
Same Crossbuck posts for each approach
Attribute UTC No processing required None
Median Barriers (North, South, East, West)
Same Presence of median barriers for each approach
Attribute UTC No processing required None
Stop Lines (North, South, East, West)
Same Presence of stop lines for each approach
Attribute UTC No processing required None
Stop Line Distance (North, South, East, West)
Same Stop bar distance from crossing for each approach
Attribute UTC No processing required None
Siding Tracks Same Number of siding tracks at crossing
Attribute UTC No processing required None
Comments Same UTC inspection comments Attribute UTC No processing required None
Down a Street Same Whether track runs down a street rather intersect it
Attribute UTC No processing required False=no True=yes
Number of Yard Tracks
Same Number of yard tracks at crossing
Attribute UTC No processing required None
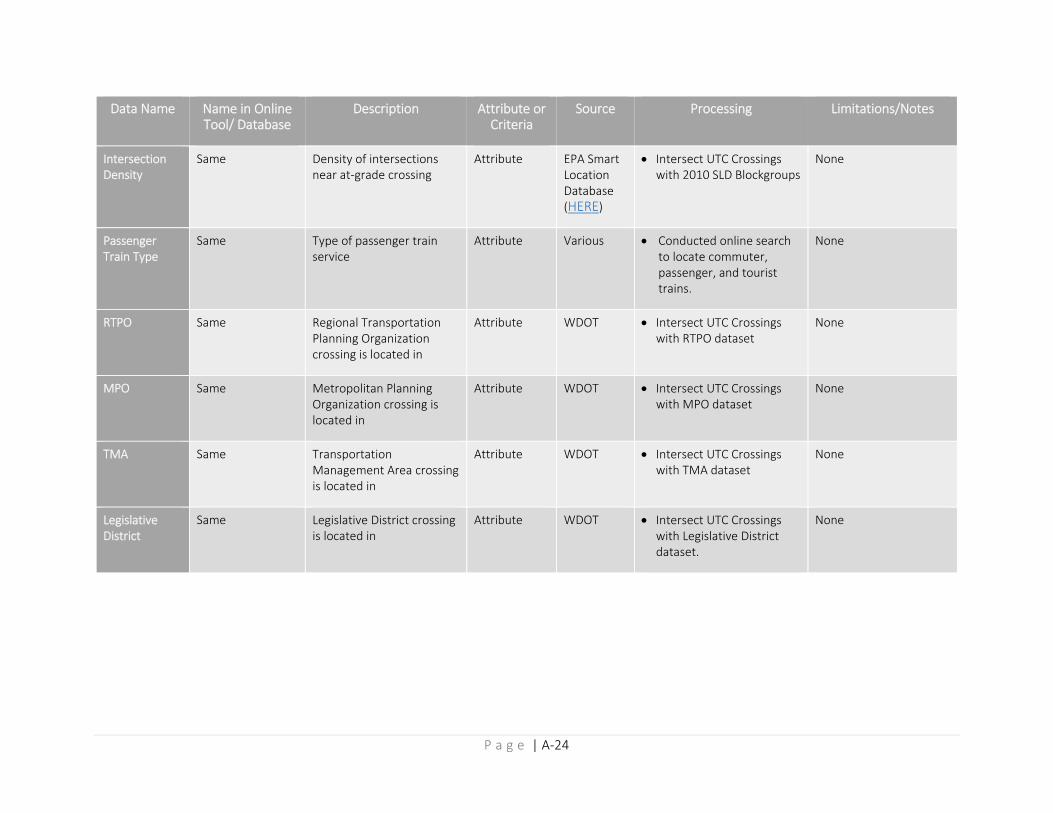
P a g e | A‐24
Data Name Name in Online Tool/ Database
Description Attribute or Criteria
Source Processing Limitations/Notes
Intersection Density
Same Density of intersections near at‐grade crossing
Attribute EPA Smart Location Database (HERE)
Intersect UTC Crossings with 2010 SLD Blockgroups
None
Passenger Train Type
Same Type of passenger train service
Attribute Various Conducted online search to locate commuter, passenger, and tourist trains.
None
RTPO Same Regional Transportation Planning Organization crossing is located in
Attribute WDOT Intersect UTC Crossings with RTPO dataset
None
MPO Same Metropolitan Planning Organization crossing is located in
Attribute WDOT Intersect UTC Crossings with MPO dataset
None
TMA Same Transportation Management Area crossing is located in
Attribute WDOT Intersect UTC Crossings with TMA dataset
None
Legislative District
Same Legislative District crossing is located in
Attribute WDOT Intersect UTC Crossings with Legislative District dataset.
None
P a g e | A‐25
3.1 Methodologies for Created Data Some data included in the database was created using other existing data and GIS mapping functions. This allowed analysts to address data gaps and evaluate certain criteria that were not readily available. Table 2 in Section 3.2 describes in additional detail why it was necessary to create each of the data described below.
Presence of Alternate Grade Separated Crossings
This criteria was developed for all 2,180 at‐grade crossings before completing Step I of the prioritization process. Analysts were able to identify whether there were grade separated crossings within a half‐mile of an at‐grade crossing by using a network proximity function and the locations of over‐ and undercrossings (retrieved from the UTC database). This function populated the criteria for each at at‐grade crossing with the number of grade‐separated crossings were located within a half‐mile on the road network.
Gate‐Down Time
This criteria was estimated for the 302 at‐grade crossing included in Step II using the train count by type (freight, passenger, unit), the allowable freight and passenger train speeds (UTC database), and some assumptions regarding train lengths. Gate‐down time was calculated for each type of train and then summed to develop the total amount of estimated daily gate‐down time. The following equations were used to calculate gate‐down time:
Freight trains: freight train volume*((freight train length + crossing width/(train speed in ft/s)+lead/lag time)/60)
o freight train volume *(((6660/(freight train speed*5280/3600))+30)/60)
Passenger trains: passenger train volume*((passenger train length + crossing width/(train speed in ft/s)+lead/lag time)/60)
o passenger train volume*(((660/(passenger train speed*5280/3600))+30)/60)
Unit trains: unit train volume*3.5
The following assumptions were used to calculate gate‐down time:
Average train lengths were assumed for freight and passenger trains to calculate gate‐down time. Freight train lengths were determined by multiplying the average dimension of BNSF rail equipment (http://www.bnsf.com/customers/equipment) by the average number of cars for trains on Western Class I railroads (Cambridge Systematics, Inc., National Rail Freight Infrastructure Capacity and Investment Study, 2007). Passenger train lengths were calculated based on equipment dimensions (Amtrak, Amtrak Station Program and Planning Guide, 2013) and the average number of cars used on the Amtrak Cascades route as reported by WSDOT (http://www.wsdot.wa.gov/Rail/TrainEquipment.htm):
o Freight trains: 1.25 miles long
o Passenger train: 600 feet
Unit trains were assumed to close a crossing for 3.5 minutes each. This was based on the assumption that unit trains are traveling at approximately 30 mph. Unit train lengths were consistent with train lengths reported in recent unit train studies for Washington State (Washington Department of Ecology, Washington State 2014 Marine and Rail Oil Transportation Study, 2014; Pacific International Terminals, Inc., Project Information Document, 2011).
P a g e | A‐26
It was assumed that gates would close approximately 20 seconds before a train reached the crossing and would remain closed an additional 10 seconds after the train cleared the crossing for a total of 30 seconds of lead/lag time.
It was assumed that crossings were approximately 60 feet wide. The width of the crossings was added to the train length in the gate‐down time calculation.
At‐Grade Crossing Density
This criteria was developed for the 302 crossings that were included in Step II of the prioritization process using a network proximity buffer of a half‐mile. Analysts used this function to identify to the number of at‐grade crossings were located within the half‐mile distance on the same rail line of an at‐grade crossing.
Proximity to Emergency Services
This criteria was completed only for the 302 crossings that were included in Step II of the prioritization process using a network proximity buffer of a half‐mile. Similarly to other criteria, the Proximity to Emergency Services populated the criteria for each crossing with the distance to the nearest emergency service provider, including fire, hospital, and police.
Daily Emissions
This criteria was completed only for the 302 crossings that were included in Step II of the prioritization process based on daily traffic volumes and gate down time. The emissions are for VOC (volatile organic compounds), THC (total hydrocarbons), CO (carbon monoxide), and NOx (nitrogen oxides) for a vehicle fleet that is 95 percent cars (gasoline) and 5 percent trucks (diesel). The formula used was:
Grams of emissions per day = (Delay/(60*16))*AADT*(84.7049/60)
Where:
o “Delay” is gate down time in minutes
o “60*16” is a unit conversion factor based on a 16‐hour travel day (most daily vehicle travel occurs in a 16‐hour window).
o “AADT” is the daily traffic volume
o “84.7049/60” is grams per minute of emissions
Network Sensitivity
This criteria was completed only for the 302 crossings that were included in Step II of the prioritization process. This metric is supposed to highlight the sensitivity the local network to trains blocking the crossing. If the crossings in blocked, and that crossing is within 200 feet of a major traffic signal (or signal corridor), the local network could have major delays even for vehicles not using the crossing. The following datasets were gathered:
Functional classification (WSDOT)
Traffic Signal, or Signal System (Google Maps).
Based on the characteristics above, the crossing received a Network Sensitivity score. For example, a crossing within 200 feet of a traffic signal that was on a state highway got a higher score than a crossing with a nearby traffic signal on a local street.
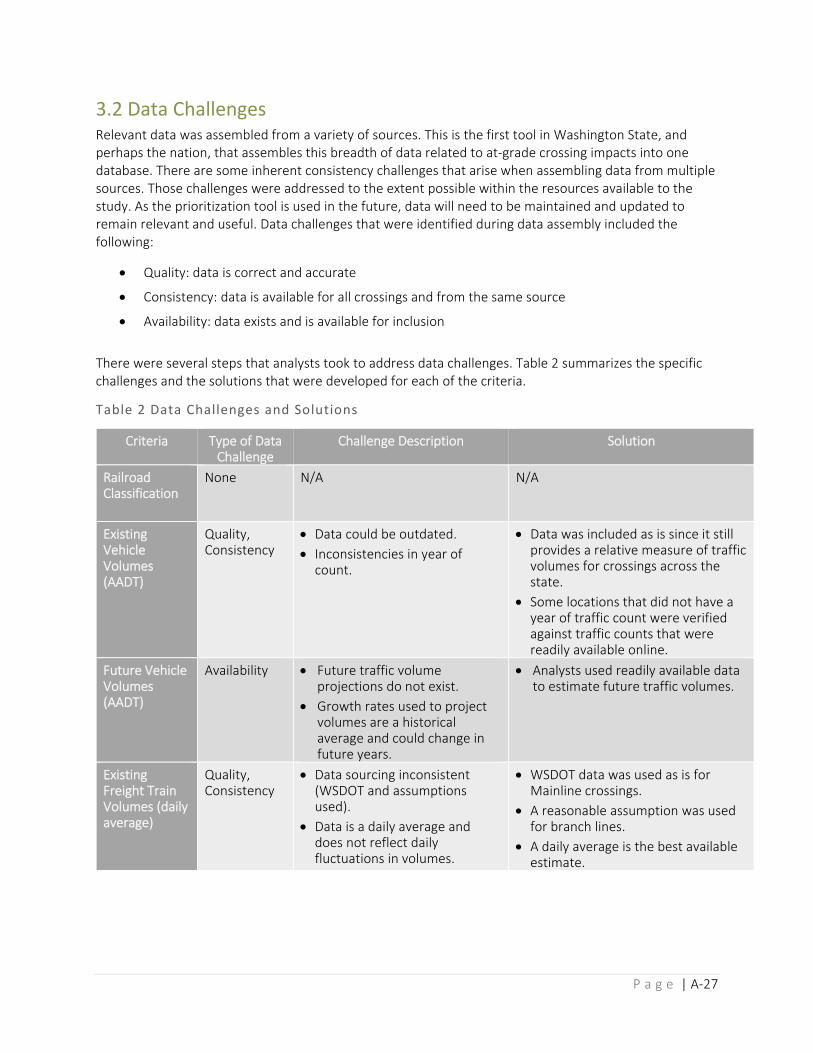
P a g e | A‐27
3.2 Data Challenges Relevant data was assembled from a variety of sources. This is the first tool in Washington State, and perhaps the nation, that assembles this breadth of data related to at‐grade crossing impacts into one database. There are some inherent consistency challenges that arise when assembling data from multiple sources. Those challenges were addressed to the extent possible within the resources available to the study. As the prioritization tool is used in the future, data will need to be maintained and updated to remain relevant and useful. Data challenges that were identified during data assembly included the following:
Quality: data is correct and accurate
Consistency: data is available for all crossings and from the same source
Availability: data exists and is available for inclusion
There were several steps that analysts took to address data challenges. Table 2 summarizes the specific challenges and the solutions that were developed for each of the criteria.
Table 2 Data Challenges and Solutions
Criteria Type of Data Challenge
Challenge Description Solution
Railroad Classification
None N/A N/A
Existing Vehicle Volumes (AADT)
Quality, Consistency
Data could be outdated. Inconsistencies in year of count.
Data was included as is since it still provides a relative measure of traffic volumes for crossings across the state.
Some locations that did not have a year of traffic count were verified against traffic counts that were readily available online.
Future Vehicle Volumes (AADT)
Availability Future traffic volume projections do not exist.
Growth rates used to project volumes are a historical average and could change in future years.
Analysts used readily available data to estimate future traffic volumes.
Existing Freight Train Volumes (daily average)
Quality, Consistency
Data sourcing inconsistent (WSDOT and assumptions used).
Data is a daily average and does not reflect daily fluctuations in volumes.
WSDOT data was used as is for Mainline crossings.
A reasonable assumption was used for branch lines.
A daily average is the best available estimate.
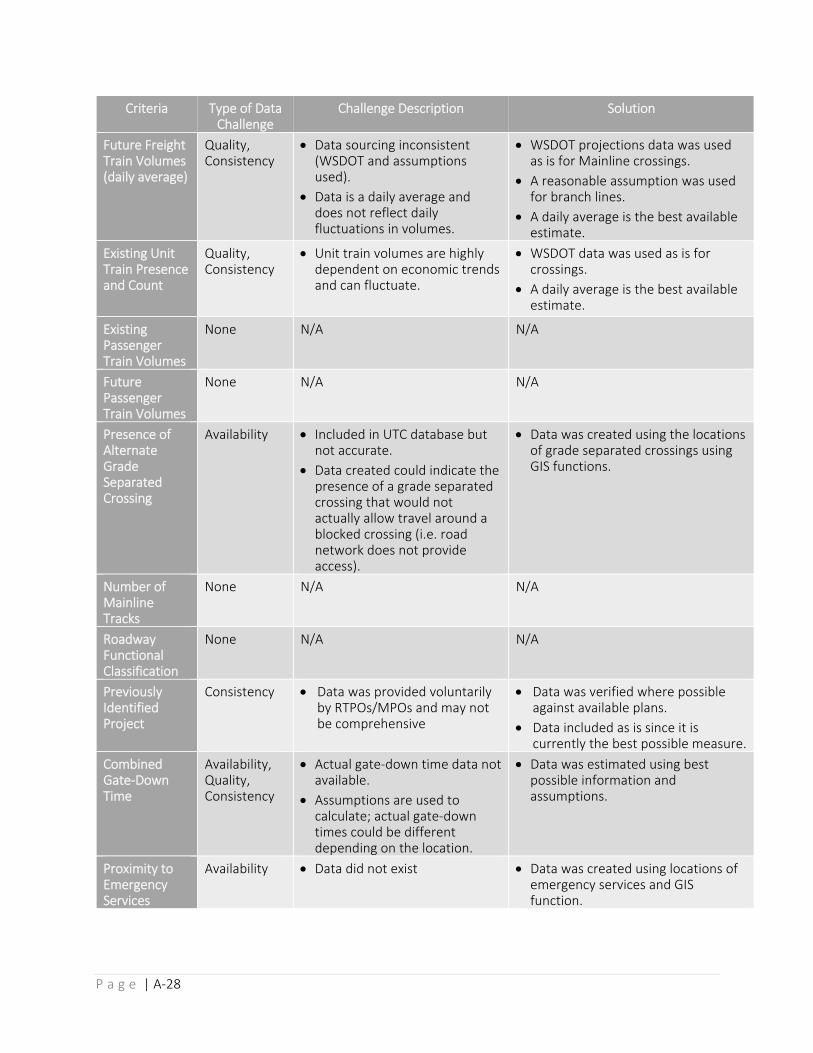
P a g e | A‐28
Criteria Type of Data Challenge
Challenge Description Solution
Future Freight Train Volumes (daily average)
Quality, Consistency
Data sourcing inconsistent (WSDOT and assumptions used).
Data is a daily average and does not reflect daily fluctuations in volumes.
WSDOT projections data was used as is for Mainline crossings.
A reasonable assumption was used for branch lines.
A daily average is the best available estimate.
Existing Unit Train Presence and Count
Quality, Consistency
Unit train volumes are highly dependent on economic trends and can fluctuate.
WSDOT data was used as is for crossings.
A daily average is the best available estimate.
Existing Passenger Train Volumes
None N/A N/A
Future Passenger Train Volumes
None N/A N/A
Presence of Alternate Grade Separated Crossing
Availability Included in UTC database but not accurate.
Data created could indicate the presence of a grade separated crossing that would not actually allow travel around a blocked crossing (i.e. road network does not provide access).
Data was created using the locations of grade separated crossings using GIS functions.
Number of Mainline Tracks
None N/A N/A
Roadway Functional Classification
None N/A N/A
Previously Identified Project
Consistency Data was provided voluntarily by RTPOs/MPOs and may not be comprehensive
Data was verified where possible against available plans.
Data included as is since it is currently the best possible measure.
Combined Gate‐Down Time
Availability, Quality, Consistency
Actual gate‐down time data not available.
Assumptions are used to calculate; actual gate‐down times could be different depending on the location.
Data was estimated using best possible information and assumptions.
Proximity to Emergency Services
Availability Data did not exist Data was created using locations of emergency services and GIS function.
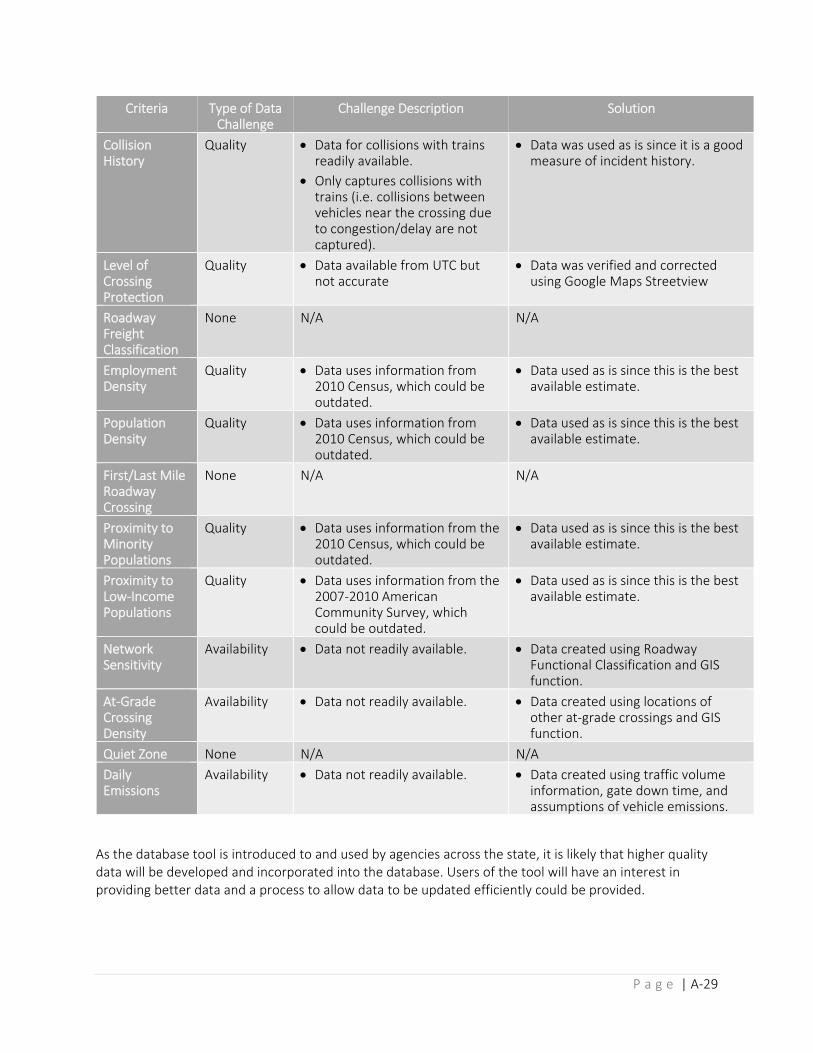
P a g e | A‐29
Criteria Type of Data Challenge
Challenge Description Solution
Collision History
Quality Data for collisions with trains readily available.
Only captures collisions with trains (i.e. collisions between vehicles near the crossing due to congestion/delay are not captured).
Data was used as is since it is a good measure of incident history.
Level of Crossing Protection
Quality Data available from UTC but not accurate
Data was verified and corrected using Google Maps Streetview
Roadway Freight Classification
None N/A N/A
Employment Density
Quality Data uses information from 2010 Census, which could be outdated.
Data used as is since this is the best available estimate.
Population Density
Quality Data uses information from 2010 Census, which could be outdated.
Data used as is since this is the best available estimate.
First/Last Mile Roadway Crossing
None N/A N/A
Proximity to Minority Populations
Quality Data uses information from the 2010 Census, which could be outdated.
Data used as is since this is the best available estimate.
Proximity to Low‐Income Populations
Quality Data uses information from the 2007‐2010 American Community Survey, which could be outdated.
Data used as is since this is the best available estimate.
Network Sensitivity
Availability Data not readily available. Data created using Roadway Functional Classification and GIS function.
At‐Grade Crossing Density
Availability Data not readily available. Data created using locations of other at‐grade crossings and GIS function.
Quiet Zone None N/A N/A
Daily Emissions
Availability Data not readily available. Data created using traffic volume information, gate down time, and assumptions of vehicle emissions.
As the database tool is introduced to and used by agencies across the state, it is likely that higher quality data will be developed and incorporated into the database. Users of the tool will have an interest in providing better data and a process to allow data to be updated efficiently could be provided.
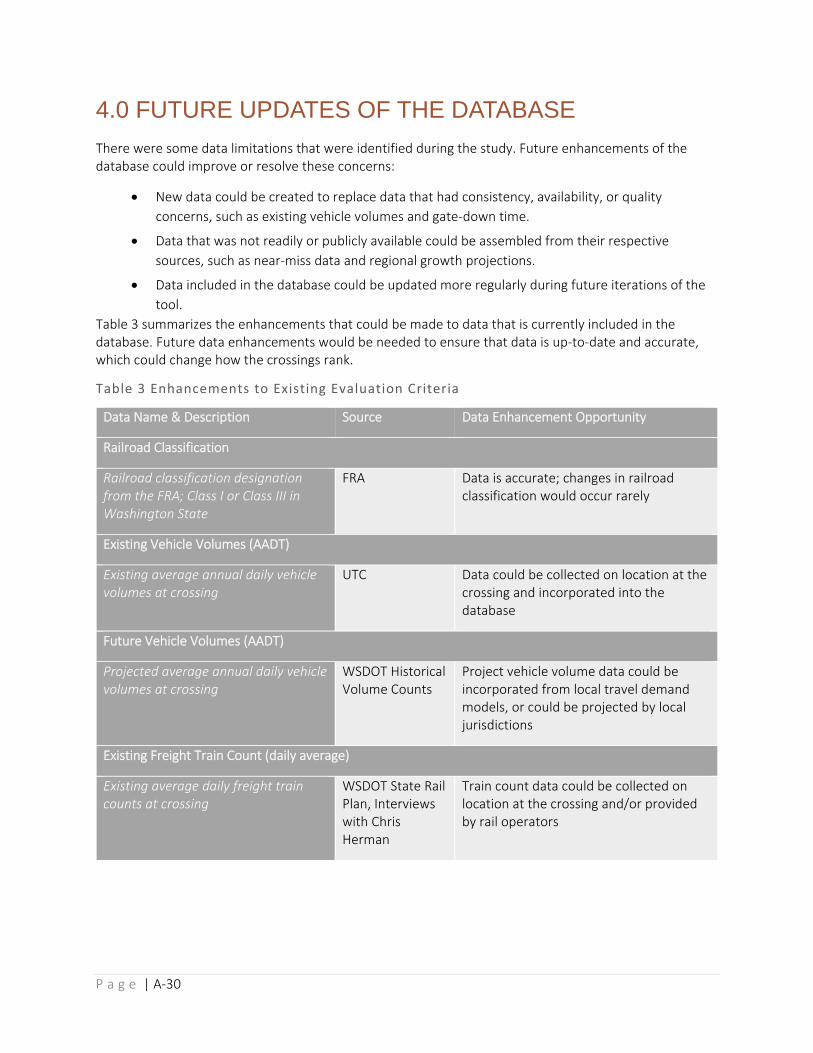
P a g e | A‐30
4.0 FUTURE UPDATES OF THE DATABASE
There were some data limitations that were identified during the study. Future enhancements of the database could improve or resolve these concerns:
New data could be created to replace data that had consistency, availability, or quality
concerns, such as existing vehicle volumes and gate‐down time.
Data that was not readily or publicly available could be assembled from their respective
sources, such as near‐miss data and regional growth projections.
Data included in the database could be updated more regularly during future iterations of the
tool.
Table 3 summarizes the enhancements that could be made to data that is currently included in the database. Future data enhancements would be needed to ensure that data is up‐to‐date and accurate, which could change how the crossings rank.
Table 3 Enhancements to Existing Evaluation Criteria
Data Name & Description Source Data Enhancement Opportunity
Railroad Classification
Railroad classification designation from the FRA; Class I or Class III in Washington State
FRA Data is accurate; changes in railroad classification would occur rarely
Existing Vehicle Volumes (AADT)
Existing average annual daily vehicle volumes at crossing
UTC Data could be collected on location at the crossing and incorporated into the database
Future Vehicle Volumes (AADT)
Projected average annual daily vehicle volumes at crossing
WSDOT Historical Volume Counts
Project vehicle volume data could be incorporated from local travel demand models, or could be projected by local jurisdictions
Existing Freight Train Count (daily average)
Existing average daily freight train counts at crossing
WSDOT State Rail Plan, Interviews with Chris Herman
Train count data could be collected on location at the crossing and/or provided by rail operators
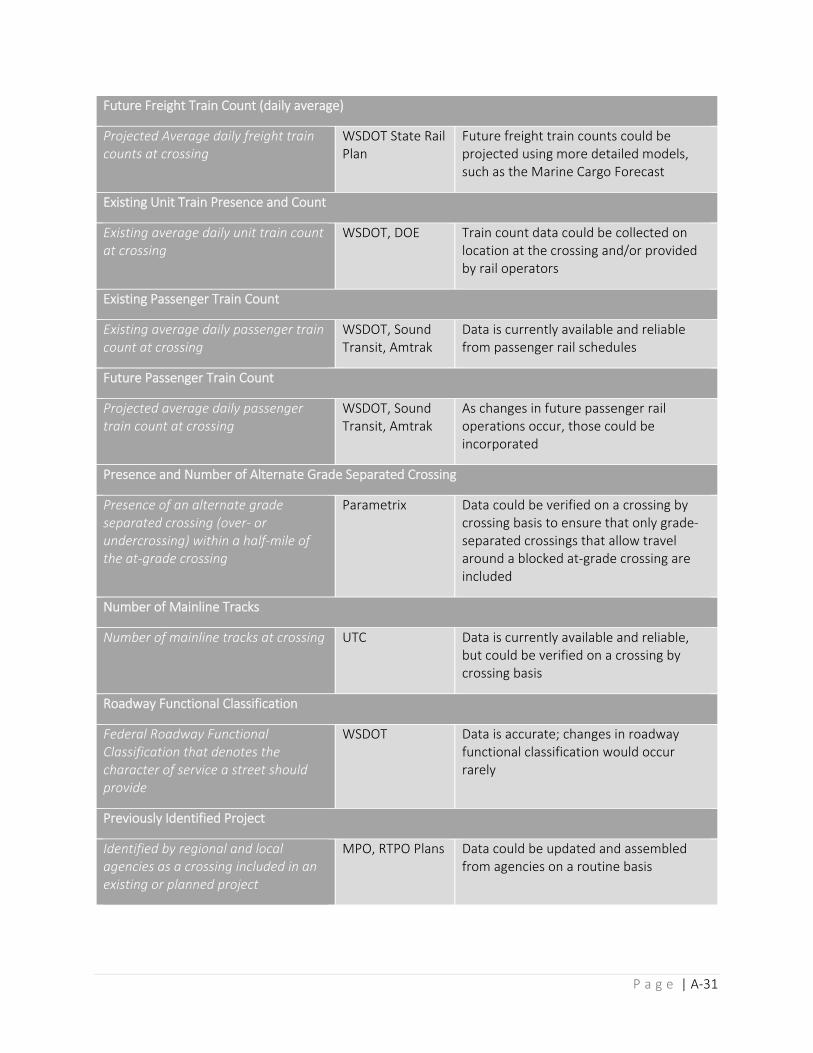
P a g e | A‐31
Future Freight Train Count (daily average)
Projected Average daily freight train counts at crossing
WSDOT State Rail Plan
Future freight train counts could be projected using more detailed models, such as the Marine Cargo Forecast
Existing Unit Train Presence and Count
Existing average daily unit train count at crossing
WSDOT, DOE Train count data could be collected on location at the crossing and/or provided by rail operators
Existing Passenger Train Count
Existing average daily passenger train count at crossing
WSDOT, Sound Transit, Amtrak
Data is currently available and reliable from passenger rail schedules
Future Passenger Train Count
Projected average daily passenger train count at crossing
WSDOT, Sound Transit, Amtrak
As changes in future passenger rail operations occur, those could be incorporated
Presence and Number of Alternate Grade Separated Crossing
Presence of an alternate grade separated crossing (over‐ or undercrossing) within a half‐mile of the at‐grade crossing
Parametrix Data could be verified on a crossing by crossing basis to ensure that only grade‐separated crossings that allow travel around a blocked at‐grade crossing are included
Number of Mainline Tracks
Number of mainline tracks at crossing UTC Data is currently available and reliable, but could be verified on a crossing by crossing basis
Roadway Functional Classification
Federal Roadway Functional Classification that denotes the character of service a street should provide
WSDOT Data is accurate; changes in roadway functional classification would occur rarely
Previously Identified Project
Identified by regional and local agencies as a crossing included in an existing or planned project
MPO, RTPO Plans Data could be updated and assembled from agencies on a routine basis
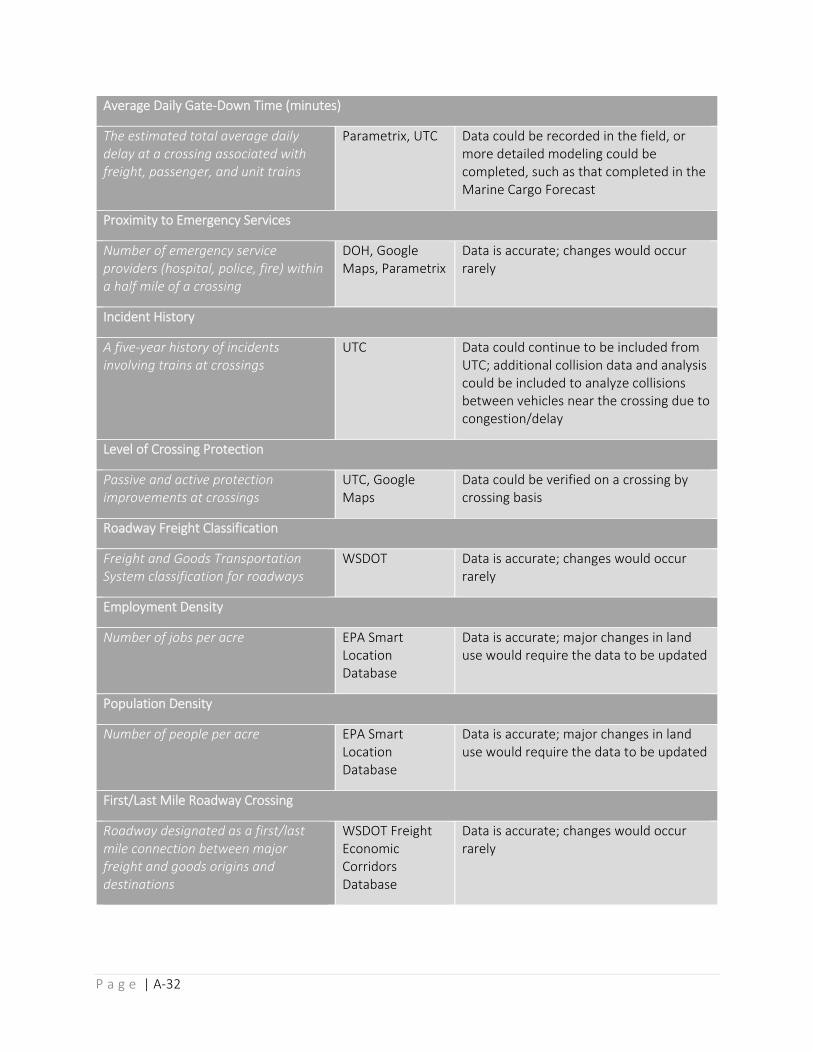
P a g e | A‐32
Average Daily Gate‐Down Time (minutes)
The estimated total average daily delay at a crossing associated with freight, passenger, and unit trains
Parametrix, UTC Data could be recorded in the field, or more detailed modeling could be completed, such as that completed in the Marine Cargo Forecast
Proximity to Emergency Services
Number of emergency service providers (hospital, police, fire) within a half mile of a crossing
DOH, Google Maps, Parametrix
Data is accurate; changes would occur rarely
Incident History
A five‐year history of incidents involving trains at crossings
UTC Data could continue to be included from UTC; additional collision data and analysis could be included to analyze collisions between vehicles near the crossing due to congestion/delay
Level of Crossing Protection
Passive and active protection improvements at crossings
UTC, Google Maps
Data could be verified on a crossing by crossing basis
Roadway Freight Classification
Freight and Goods Transportation System classification for roadways
WSDOT Data is accurate; changes would occur rarely
Employment Density
Number of jobs per acre EPA Smart Location Database
Data is accurate; major changes in land use would require the data to be updated
Population Density
Number of people per acre EPA Smart Location Database
Data is accurate; major changes in land use would require the data to be updated
First/Last Mile Roadway Crossing
Roadway designated as a first/last mile connection between major freight and goods origins and destinations
WSDOT Freight Economic Corridors Database
Data is accurate; changes would occur rarely
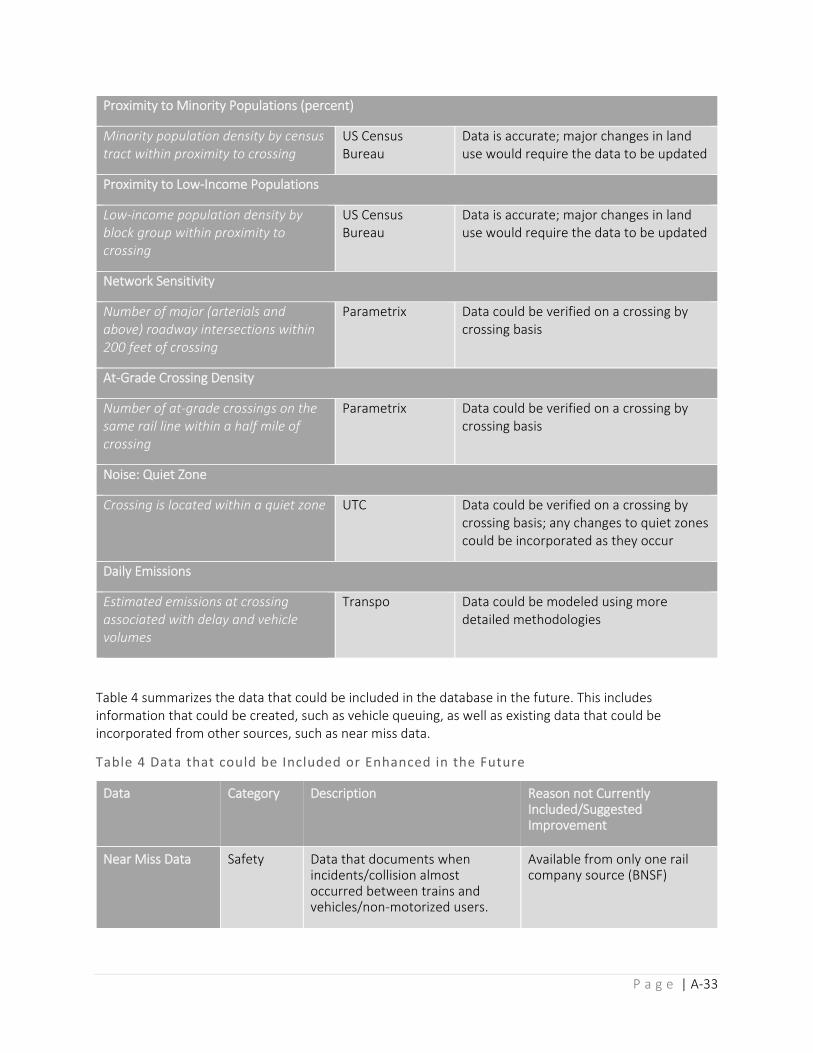
P a g e | A‐33
Proximity to Minority Populations (percent)
Minority population density by census tract within proximity to crossing
US Census Bureau
Data is accurate; major changes in land use would require the data to be updated
Proximity to Low‐Income Populations
Low‐income population density by block group within proximity to crossing
US Census Bureau
Data is accurate; major changes in land use would require the data to be updated
Network Sensitivity
Number of major (arterials and above) roadway intersections within 200 feet of crossing
Parametrix Data could be verified on a crossing by crossing basis
At‐Grade Crossing Density
Number of at‐grade crossings on the same rail line within a half mile of crossing
Parametrix Data could be verified on a crossing by crossing basis
Noise: Quiet Zone
Crossing is located within a quiet zone UTC Data could be verified on a crossing by crossing basis; any changes to quiet zones could be incorporated as they occur
Daily Emissions
Estimated emissions at crossing associated with delay and vehicle volumes
Transpo Data could be modeled using more detailed methodologies
Table 4 summarizes the data that could be included in the database in the future. This includes information that could be created, such as vehicle queuing, as well as existing data that could be incorporated from other sources, such as near miss data.
Table 4 Data that could be Included or Enhanced in the Future
Data
Category Description Reason not Currently Included/Suggested Improvement
Near Miss Data Safety Data that documents when incidents/collision almost occurred between trains and vehicles/non‐motorized users.
Available from only one rail company source (BNSF)

P a g e | A‐34
Data
Category Description Reason not Currently Included/Suggested Improvement
Collisions within 250 feet
Safety Data that documents collisions within a certain distance of an at‐grade crossing; could be used to indicate collisions due to congestion/queuing related to train crossing events.
Requires assembly from multiple sources and processing to evaluate collisions
Transit Volumes/Presence
Mobility Data that indicates the presence and magnitude of transit service near an at‐grade crossing
Requires assembly from multiple sources
Non‐motorized Volumes/Presence
Mobility Data that indicates the presence and magnitude of non‐motorized activity near an at‐grade crossing
Requires assembly from multiple sources and/or is not consistently available
Regional Growth Projections
Community Data that documents potential development and/or land use nearby an at‐grade crossing
Requires assembly from multiple sources and/or is not consistently available
Future Vehicle Volumes
Mobility Data that documents future increases in traffic volumes
Requires assembly from regional travel demand models; may not be consistently available
Gate‐Down Time Mobility Data that documents actual gate‐down time, including train building and other activities
Requires actual data collection of gate‐down times, or inclusion of model results from Marine Cargo Forecast
School Bus/Walking Routes
Safety Data that indicates whether a school bus or walking route is designated across an at‐grade crossing
Requires assembly from multiple sources and/or may not be consistently available
Crossing Geometrics/Sight Distance
Safety Data that indicates if there are sight distance issues at a crossing
Requires some processing of existing data and/or may not be consistently available
Vehicle Queuing Mobility Data that measures queuing due to train crossing events
Requires actual data collection and analysis
Proximity to Sensitive Receptors
Community Data that indicates proximity to sensitive receptors, such as hospitals, schools, etc
Requires assembly from multiple sources and/or may not be consistently available
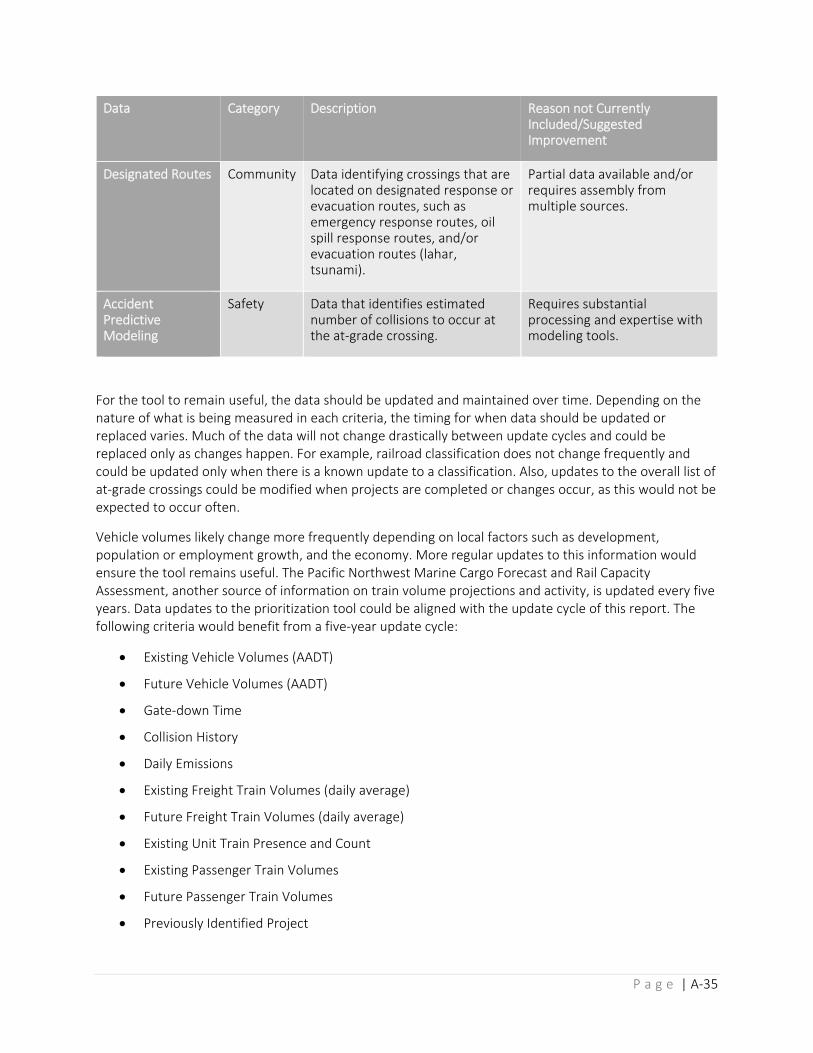
P a g e | A‐35
Data
Category Description Reason not Currently Included/Suggested Improvement
Designated Routes Community Data identifying crossings that are located on designated response or evacuation routes, such as emergency response routes, oil spill response routes, and/or evacuation routes (lahar, tsunami).
Partial data available and/or requires assembly from multiple sources.
Accident Predictive Modeling
Safety Data that identifies estimated number of collisions to occur at the at‐grade crossing.
Requires substantial processing and expertise with modeling tools.
For the tool to remain useful, the data should be updated and maintained over time. Depending on the nature of what is being measured in each criteria, the timing for when data should be updated or replaced varies. Much of the data will not change drastically between update cycles and could be replaced only as changes happen. For example, railroad classification does not change frequently and could be updated only when there is a known update to a classification. Also, updates to the overall list of at‐grade crossings could be modified when projects are completed or changes occur, as this would not be expected to occur often.
Vehicle volumes likely change more frequently depending on local factors such as development, population or employment growth, and the economy. More regular updates to this information would ensure the tool remains useful. The Pacific Northwest Marine Cargo Forecast and Rail Capacity Assessment, another source of information on train volume projections and activity, is updated every five years. Data updates to the prioritization tool could be aligned with the update cycle of this report. The following criteria would benefit from a five‐year update cycle:
Existing Vehicle Volumes (AADT)
Future Vehicle Volumes (AADT)
Gate‐down Time
Collision History
Daily Emissions
Existing Freight Train Volumes (daily average)
Future Freight Train Volumes (daily average)
Existing Unit Train Presence and Count
Existing Passenger Train Volumes
Future Passenger Train Volumes
Previously Identified Project
P a g e | A‐36
Level of Crossing Protection
The remaining criteria would not be expected to change frequently. It’s important to note that there are varying degrees of processing and expertise required to maintain the criteria. Although all of the criteria at minimum will require review before inclusion, some of the criteria require calculations in order to update. The majority of the criteria can be incorporated with minimal processing. Criteria that require calculations include future vehicle volumes, average daily gate‐down time, and daily emissions. Other criteria will require some GIS processing before they can be updated, including employment density, population density, proximity to low‐income populations, and proximity to minority populations. Refer back to Section 3.0 for descriptions of processing required for the different criteria.

Appendix BStep 1 Report Card

(This Page is Intentionally Blank)
APPENDIX BJoint Transportation CommitteePRIORITIZATION OF PROMINENT ROAD-RAIL CONFLICTS IN WASHINGTON STATE
DATABASE REPORT CARD STEP 1 SCREENING PROCESS
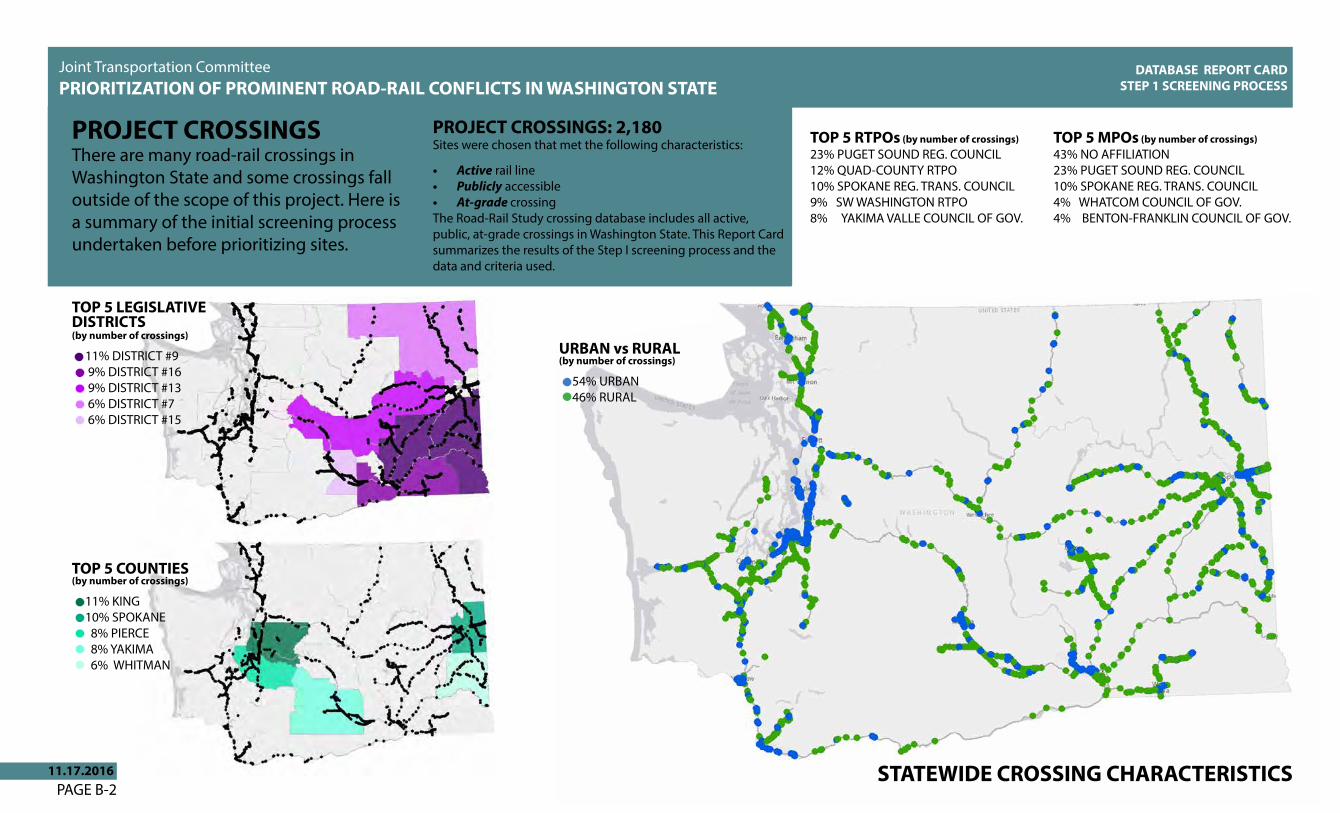
Joint Transportation CommitteePRIORITIZATION OF PROMINENT ROAD-RAIL CONFLICTS IN WASHINGTON STATE
DATABASE REPORT CARD STEP 1 SCREENING PROCESS
URBAN vs RURAL (by number of crossings)
54% URBAN46% RURAL
TOP 5 LEGISLATIVE DISTRICTS(by number of crossings)
11% DISTRICT #9 9% DISTRICT #16 9% DISTRICT #13 6% DISTRICT #7 6% DISTRICT #15
TOP 5 COUNTIES (by number of crossings)
11% KING10% SPOKANE 8% PIERCE 8% YAKIMA 6% WHITMAN
TOP 5 RTPOs (by number of crossings)23% PUGET SOUND REG. COUNCIL12% QUAD-COUNTY RTPO10% SPOKANE REG. TRANS. COUNCIL9% SW WASHINGTON RTPO8% YAKIMA VALLE COUNCIL OF GOV.
TOP 5 MPOs (by number of crossings)43% NO AFFILIATION23% PUGET SOUND REG. COUNCIL10% SPOKANE REG. TRANS. COUNCIL4% WHATCOM COUNCIL OF GOV.4% BENTON-FRANKLIN COUNCIL OF GOV.
STATEWIDE CROSSING CHARACTERISTICS
PROJECT CROSSINGS: 2,180Sites were chosen that met the following characteristics:
• Active rail line• Publicly accessible• At-grade crossingThe Road-Rail Study crossing database includes all active, public, at-grade crossings in Washington State. This Report Card summarizes the results of the Step I screening process and the data and criteria used.
PROJECT CROSSINGSThere are many road-rail crossings in Washington State and some crossings fall outside of the scope of this project. Here is a summary of the initial screening process undertaken before prioritizing sites.
PAGE B-211.17.2016
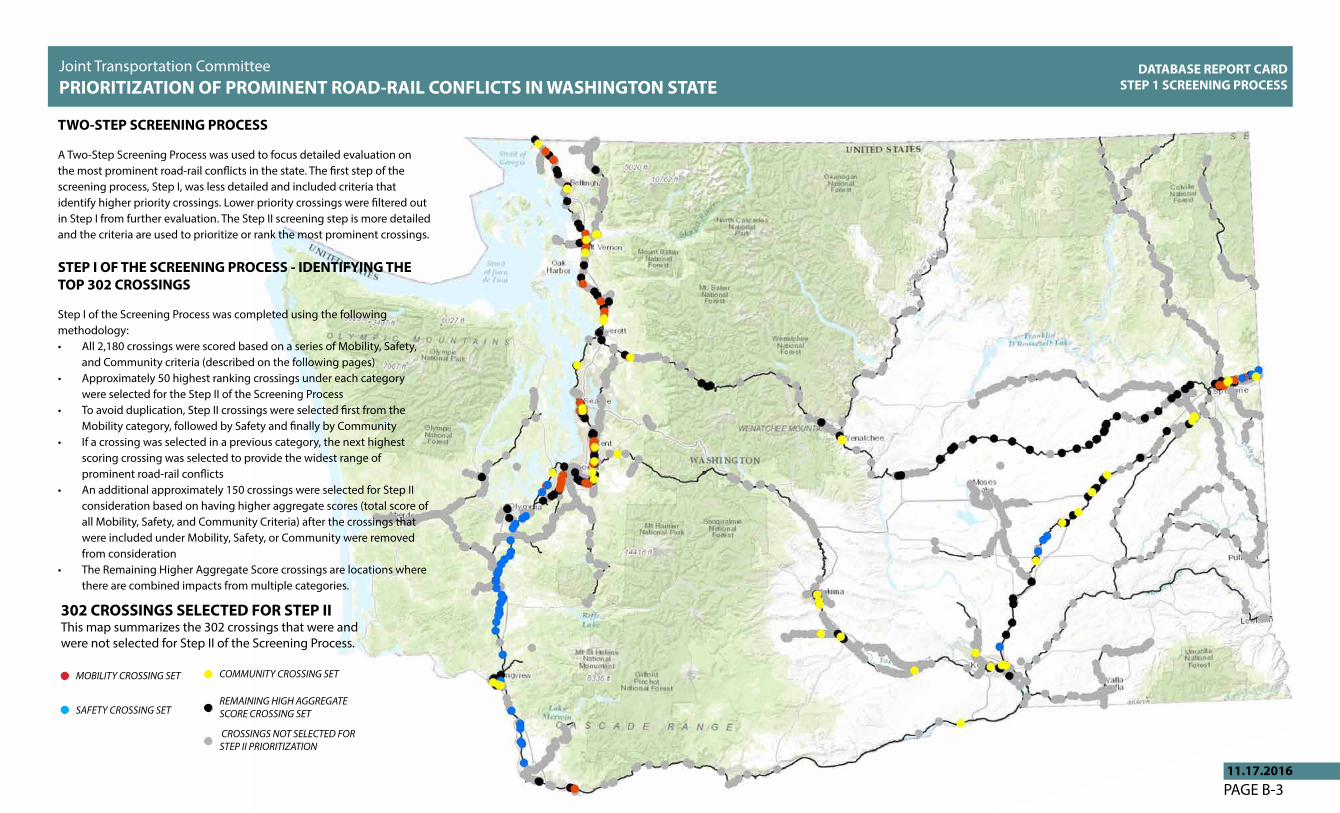
Joint Transportation CommitteePRIORITIZATION OF PROMINENT ROAD-RAIL CONFLICTS IN WASHINGTON STATE
DATABASE REPORT CARD STEP 1 SCREENING PROCESS
Joint Transportation CommitteePRIORITIZATION OF PROMINENT ROAD-RAIL CONFLICTS IN WASHINGTON STATE
CROSSINGS NOT SELECTED FOR STEP II PRIORITIZATION
MOBILITY CROSSING SET
SAFETY CROSSING SET
COMMUNITY CROSSING SET
REMAINING HIGH AGGREGATE SCORE CROSSING SET
TWO-STEP SCREENING PROCESS
A Two-Step Screening Process was used to focus detailed evaluation on the most prominent road-rail conflicts in the state. The first step of the screening process, Step I, was less detailed and included criteria that identify higher priority crossings. Lower priority crossings were filtered out in Step I from further evaluation. The Step II screening step is more detailed and the criteria are used to prioritize or rank the most prominent crossings.
STEP I OF THE SCREENING PROCESS - IDENTIFYING THE TOP 302 CROSSINGS
Step I of the Screening Process was completed using the following methodology:• All 2,180 crossings were scored based on a series of Mobility, Safety,
and Community criteria (described on the following pages)• Approximately 50 highest ranking crossings under each category
were selected for the Step II of the Screening Process• To avoid duplication, Step II crossings were selected first from the
Mobility category, followed by Safety and finally by Community• If a crossing was selected in a previous category, the next highest
scoring crossing was selected to provide the widest range of prominent road-rail conflicts
• An additional approximately 150 crossings were selected for Step II consideration based on having higher aggregate scores (total score of all Mobility, Safety, and Community Criteria) after the crossings that were included under Mobility, Safety, or Community were removed from consideration
• The Remaining Higher Aggregate Score crossings are locations where there are combined impacts from multiple categories.
302 CROSSINGS SELECTED FOR STEP IIThis map summarizes the 302 crossings that were and were not selected for Step II of the Screening Process.
PAGE B-311.17.2016
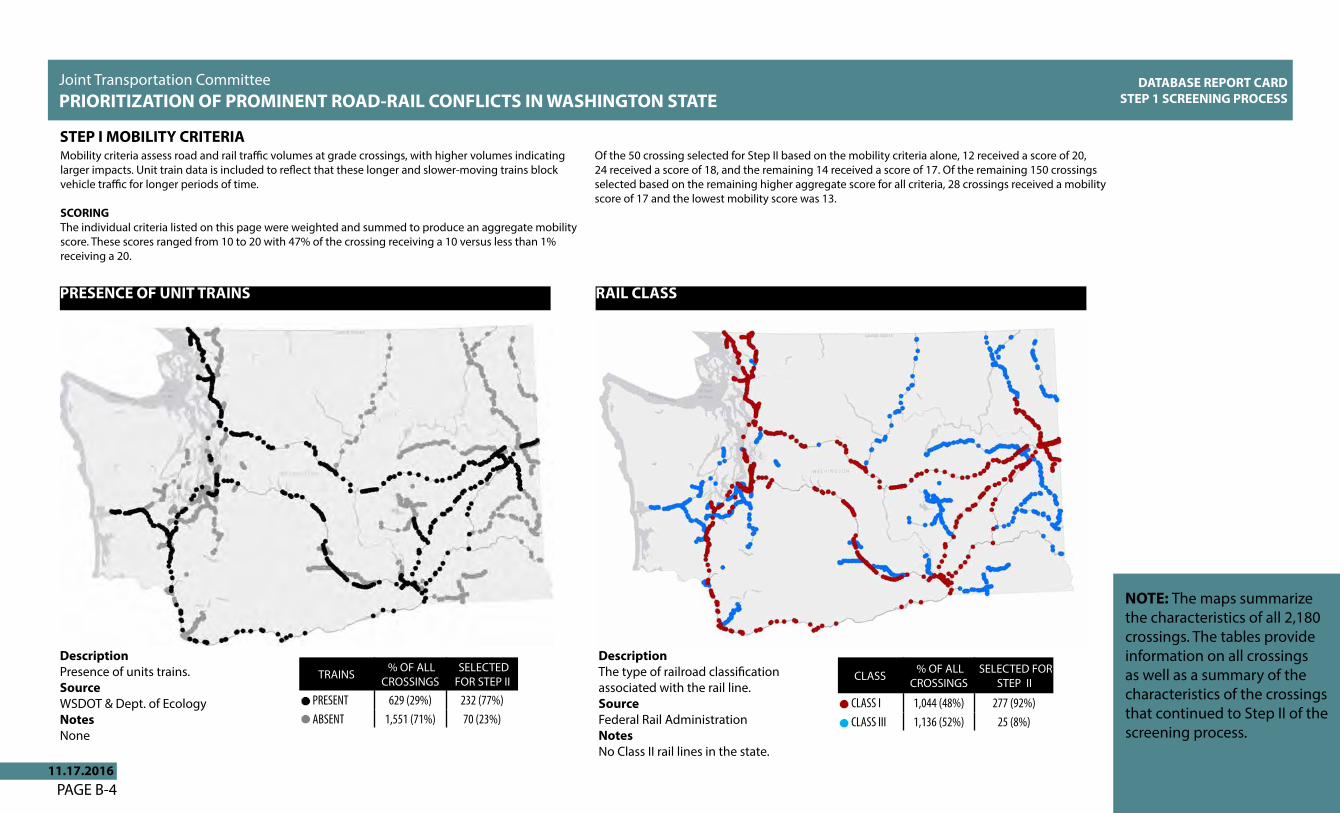
Joint Transportation CommitteePRIORITIZATION OF PROMINENT ROAD-RAIL CONFLICTS IN WASHINGTON STATE
DATABASE REPORT CARD STEP 1 SCREENING PROCESS
PAGE B-4
Mobility criteria assess road and rail traffic volumes at grade crossings, with higher volumes indicating larger impacts. Unit train data is included to reflect that these longer and slower-moving trains block vehicle traffic for longer periods of time.
SCORINGThe individual criteria listed on this page were weighted and summed to produce an aggregate mobility score. These scores ranged from 10 to 20 with 47% of the crossing receiving a 10 versus less than 1% receiving a 20.
Of the 50 crossing selected for Step II based on the mobility criteria alone, 12 received a score of 20, 24 received a score of 18, and the remaining 14 received a score of 17. Of the remaining 150 crossings selected based on the remaining higher aggregate score for all criteria, 28 crossings received a mobility score of 17 and the lowest mobility score was 13.
STEP I MOBILITY CRITERIA
CLASS % OF ALL CROSSINGS
SELECTED FOR STEP II
CLASS I 1,044 (48%) 277 (92%)CLASS III 1,136 (52%) 25 (8%)
RAIL CLASSPRESENCE OF UNIT TRAINS
TRAINS % OF ALL CROSSINGS
SELECTED FOR STEP II
PRESENT 629 (29%) 232 (77%)ABSENT 1,551 (71%) 70 (23%)
DescriptionThe type of railroad classification associated with the rail line.SourceFederal Rail AdministrationNotesNo Class II rail lines in the state.
DescriptionPresence of units trains.SourceWSDOT & Dept. of EcologyNotesNone
11.17.2016
NOTE: The maps summarize the characteristics of all 2,180 crossings. The tables provide information on all crossings as well as a summary of the characteristics of the crossings that continued to Step II of the screening process.
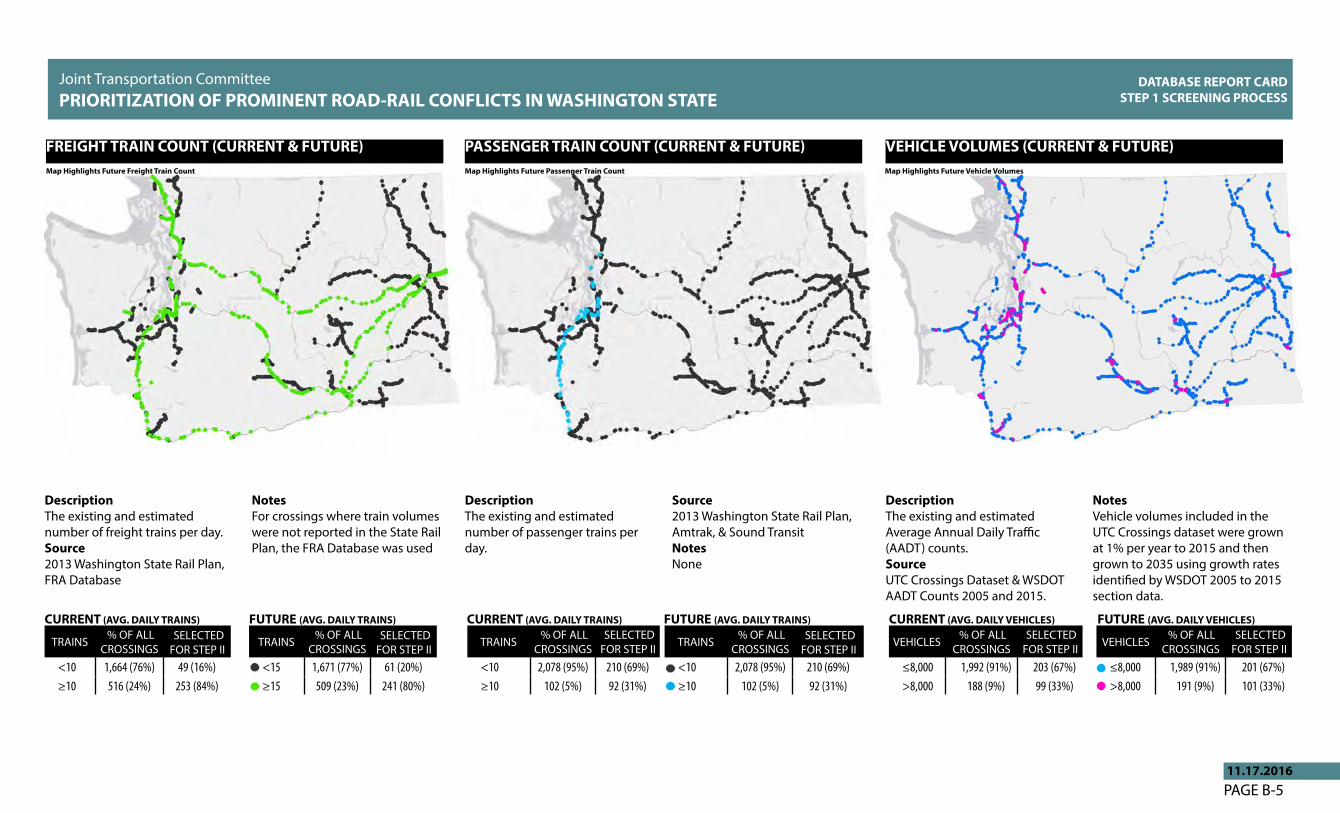
Joint Transportation CommitteePRIORITIZATION OF PROMINENT ROAD-RAIL CONFLICTS IN WASHINGTON STATE
DATABASE REPORT CARD STEP 1 SCREENING PROCESS
PAGE B-5
FREIGHT TRAIN COUNT (CURRENT & FUTURE))
TRAINS % OF ALL CROSSINGS
SELECTED FOR STEP II
<10 1,664 (76%) 49 (16%)≥10 516 (24%) 253 (84%)
CURRENT (AVG. DAILY TRAINS)
PASSENGER TRAIN COUNT (CURRENT & FUTURE)
TRAINS % OF ALL CROSSINGS
SELECTED FOR STEP II
<10 2,078 (95%) 210 (69%)≥10 102 (5%) 92 (31%)
FUTURE (AVG. DAILY TRAINS)
TRAINS % OF ALL CROSSINGS
SELECTED FOR STEP II
<10 2,078 (95%) 210 (69%)≥10 102 (5%) 92 (31%)
DescriptionThe existing and estimated Average Annual Daily Traffic (AADT) counts. SourceUTC Crossings Dataset & WSDOT AADT Counts 2005 and 2015.
NotesVehicle volumes included in the UTC Crossings dataset were grown at 1% per year to 2015 and then grown to 2035 using growth rates identified by WSDOT 2005 to 2015 section data.
VEHICLE VOLUMES (CURRENT & FUTURE)
VEHICLES % OF ALL CROSSINGS
SELECTED FOR STEP II
≤8,000 1,992 (91%) 203 (67%)>8,000 188 (9%) 99 (33%)
CURRENT (AVG. DAILY VEHICLES)
VEHICLES % OF ALL CROSSINGS
SELECTED FOR STEP II
≤8,000 1,989 (91%) 201 (67%)>8,000 191 (9%) 101 (33%)
FUTURE (AVG. DAILY VEHICLES)
DescriptionThe existing and estimated number of freight trains per day.Source2013 Washington State Rail Plan, FRA Database
NotesFor crossings where train volumes were not reported in the State Rail Plan, the FRA Database was used
DescriptionThe existing and estimated number of passenger trains per day.
Source2013 Washington State Rail Plan, Amtrak, & Sound TransitNotesNone
Map Highlights Future Freight Train Count Map Highlights Future Passenger Train Count Map Highlights Future Vehicle Volumes
CURRENT (AVG. DAILY TRAINS) FUTURE (AVG. DAILY TRAINS)
TRAINS % OF ALL CROSSINGS
SELECTED FOR STEP II
<15 1,671 (77%) 61 (20%)≥15 509 (23%) 241 (80%)
11.17.2016
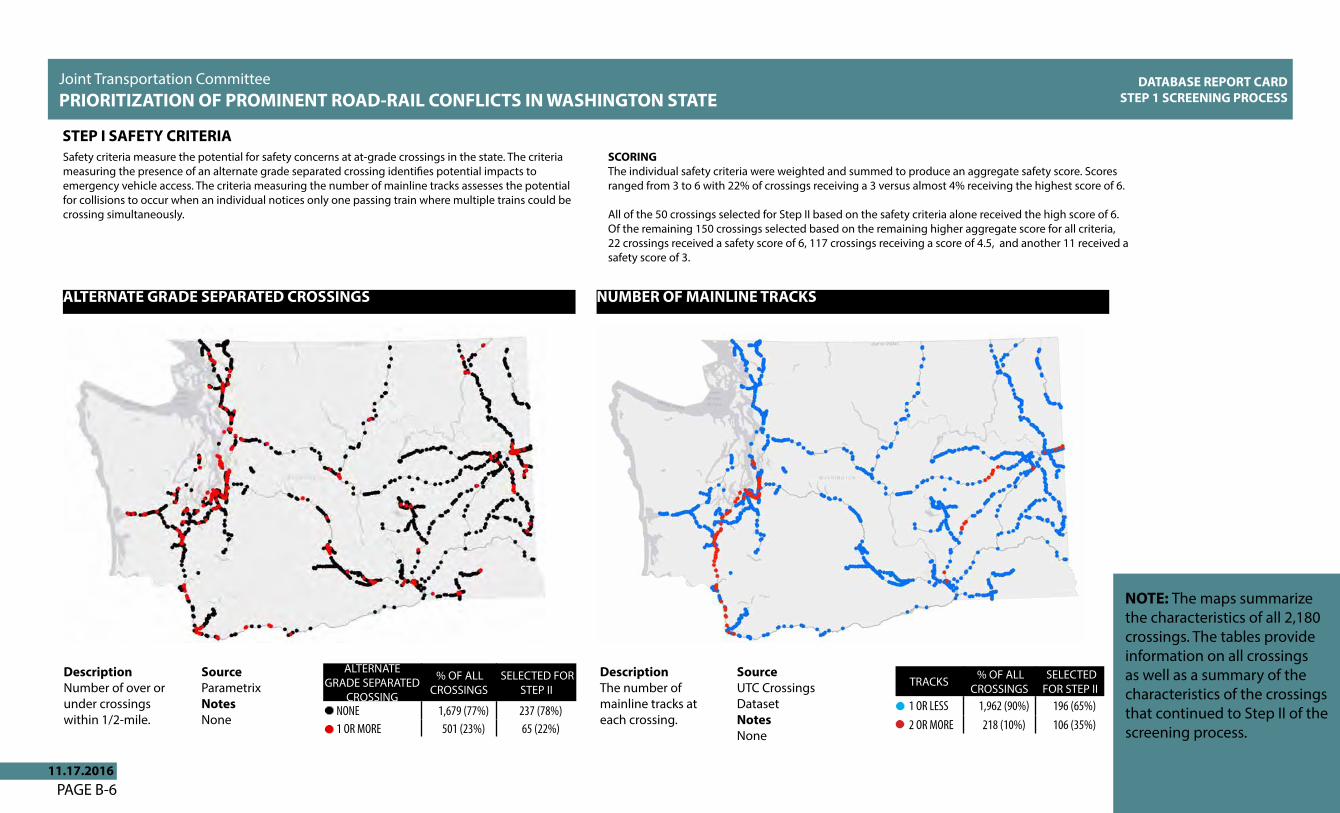
Joint Transportation CommitteePRIORITIZATION OF PROMINENT ROAD-RAIL CONFLICTS IN WASHINGTON STATE
DATABASE REPORT CARD STEP 1 SCREENING PROCESS
PAGE B-611.17.2016
ALTERNATEGRADE SEPARATED
CROSSING
% OF ALL CROSSINGS
SELECTED FOR STEP II
NONE 1,679 (77%) 237 (78%)1 OR MORE 501 (23%) 65 (22%)
STEP I SAFETY CRITERIA
DescriptionNumber of over or under crossings within 1/2-mile.
SourceParametrixNotesNone
DescriptionThe number of mainline tracks at each crossing.
SourceUTC Crossings DatasetNotesNone
TRACKS % OF ALL CROSSINGS
SELECTED FOR STEP II
1 OR LESS 1,962 (90%) 196 (65%)2 OR MORE 218 (10%) 106 (35%)
ALTERNATE GRADE SEPARATED CROSSINGS NUMBER OF MAINLINE TRACKS
Safety criteria measure the potential for safety concerns at at-grade crossings in the state. The criteria measuring the presence of an alternate grade separated crossing identifies potential impacts to emergency vehicle access. The criteria measuring the number of mainline tracks assesses the potential for collisions to occur when an individual notices only one passing train where multiple trains could be crossing simultaneously.
SCORINGThe individual safety criteria were weighted and summed to produce an aggregate safety score. Scores ranged from 3 to 6 with 22% of crossings receiving a 3 versus almost 4% receiving the highest score of 6.
All of the 50 crossings selected for Step II based on the safety criteria alone received the high score of 6. Of the remaining 150 crossings selected based on the remaining higher aggregate score for all criteria, 22 crossings received a safety score of 6, 117 crossings receiving a score of 4.5, and another 11 received a safety score of 3.
NOTE: The maps summarize the characteristics of all 2,180 crossings. The tables provide information on all crossings as well as a summary of the characteristics of the crossings that continued to Step II of the screening process.
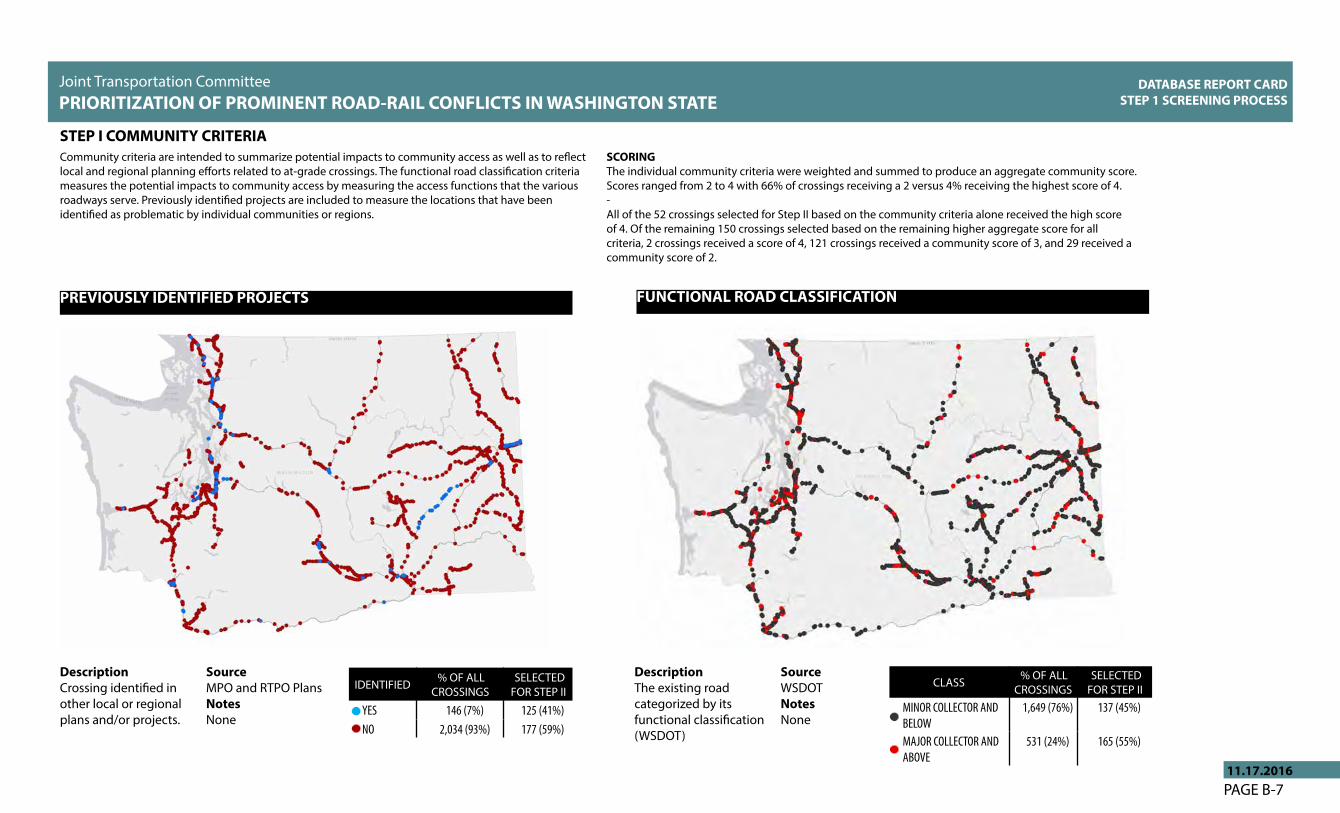
Joint Transportation CommitteePRIORITIZATION OF PROMINENT ROAD-RAIL CONFLICTS IN WASHINGTON STATE
DATABASE REPORT CARD STEP 1 SCREENING PROCESS
PAGE B-711.17.2016
FUNCTIONAL ROAD CLASSIFICATION
DescriptionThe existing road categorized by its functional classification (WSDOT)
SourceWSDOTNotesNone
CLASS % OF ALL CROSSINGS
SELECTED FOR STEP II
MINOR COLLECTOR AND BELOW
1,649 (76%) 137 (45%)
MAJOR COLLECTOR AND ABOVE
531 (24%) 165 (55%)
STEP I COMMUNITY CRITERIACommunity criteria are intended to summarize potential impacts to community access as well as to reflect local and regional planning efforts related to at-grade crossings. The functional road classification criteria measures the potential impacts to community access by measuring the access functions that the various roadways serve. Previously identified projects are included to measure the locations that have been identified as problematic by individual communities or regions.
SCORINGThe individual community criteria were weighted and summed to produce an aggregate community score. Scores ranged from 2 to 4 with 66% of crossings receiving a 2 versus 4% receiving the highest score of 4.-All of the 52 crossings selected for Step II based on the community criteria alone received the high score of 4. Of the remaining 150 crossings selected based on the remaining higher aggregate score for all criteria, 2 crossings received a score of 4, 121 crossings received a community score of 3, and 29 received a community score of 2.
PREVIOUSLY IDENTIFIED PROJECTS
DescriptionCrossing identified in other local or regional plans and/or projects.
SourceMPO and RTPO PlansNotesNone
IDENTIFIED % OF ALL CROSSINGS
SELECTED FOR STEP II
YES 146 (7%) 125 (41%)NO 2,034 (93%) 177 (59%)

(This Page is Intentionally Blank)

Appendix CFull Prioritization List of Crossings

(This Page is Intentionally Blank)
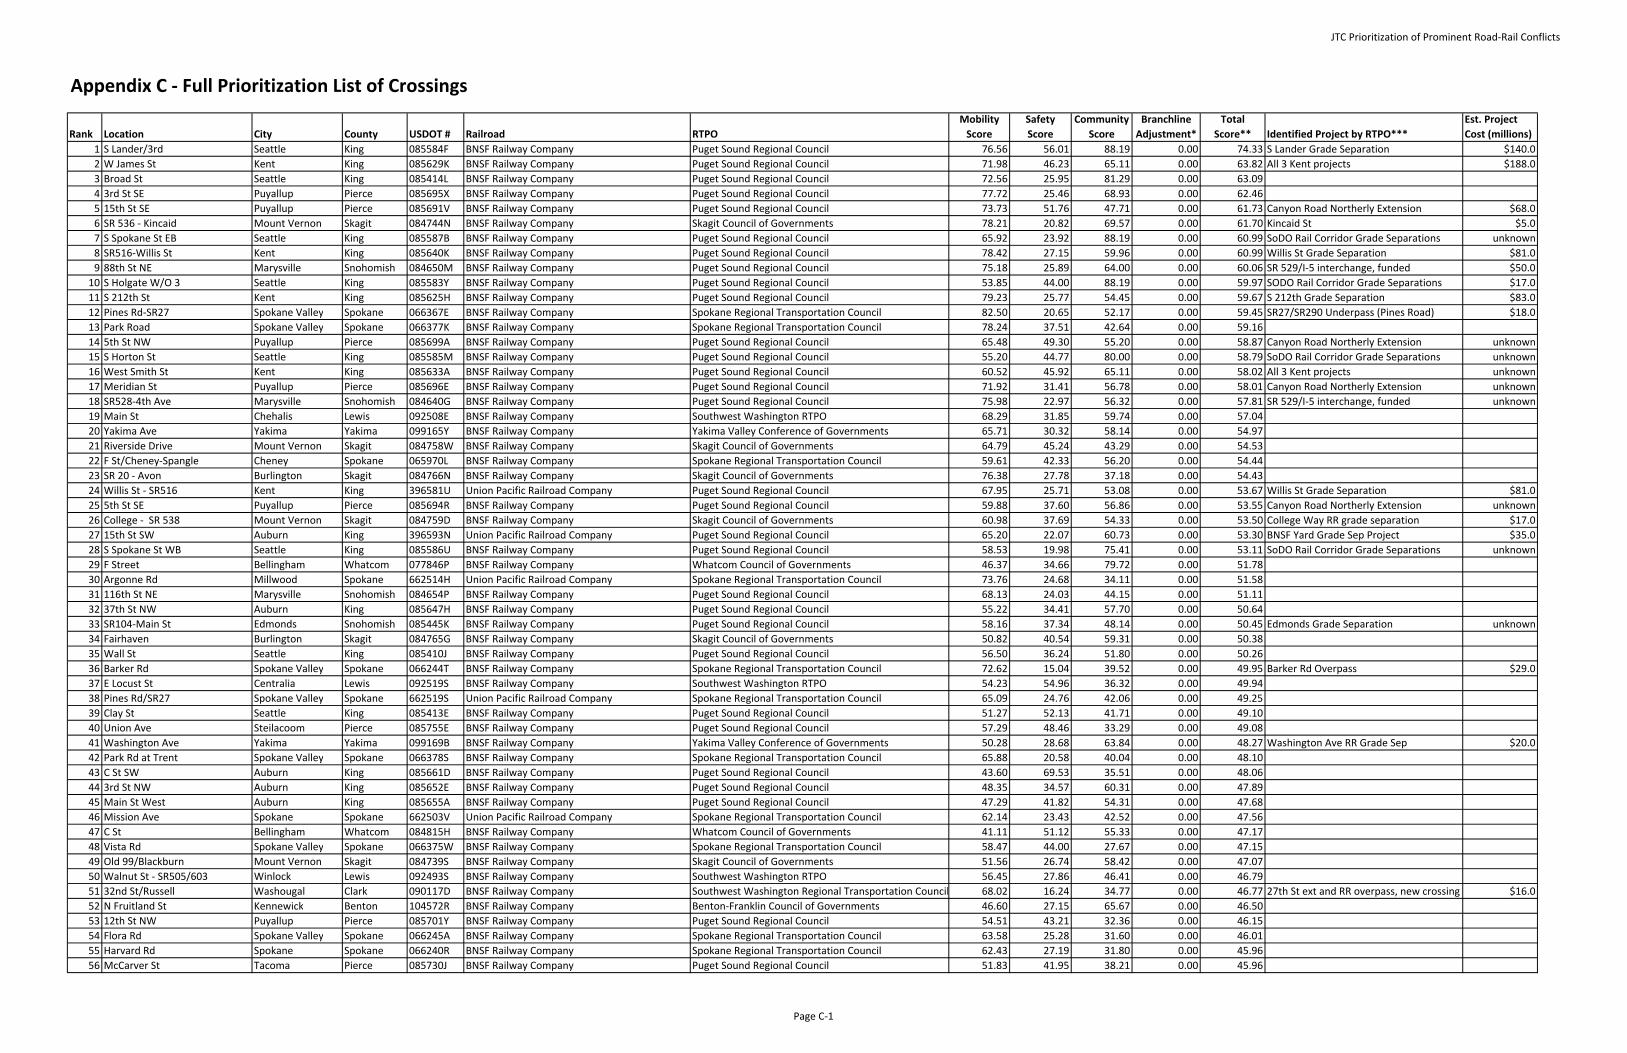
JTC Prioritization of Prominent Road‐Rail Conflicts
Appendix C ‐ Full Prioritization List of Crossings
Rank Location City County USDOT # Railroad RTPOMobility Score
SafetyScore
Community Score
Branchline Adjustment*
TotalScore** Identified Project by RTPO***
Est. Project Cost (millions)
1 S Lander/3rd Seattle King 085584F BNSF Railway Company Puget Sound Regional Council 76.56 56.01 88.19 0.00 74.33 S Lander Grade Separation $140.0
2 W James St Kent King 085629K BNSF Railway Company Puget Sound Regional Council 71.98 46.23 65.11 0.00 63.82 All 3 Kent projects $188.0
3 Broad St Seattle King 085414L BNSF Railway Company Puget Sound Regional Council 72.56 25.95 81.29 0.00 63.09
4 3rd St SE Puyallup Pierce 085695X BNSF Railway Company Puget Sound Regional Council 77.72 25.46 68.93 0.00 62.46
5 15th St SE Puyallup Pierce 085691V BNSF Railway Company Puget Sound Regional Council 73.73 51.76 47.71 0.00 61.73 Canyon Road Northerly Extension $68.0
6 SR 536 ‐ Kincaid Mount Vernon Skagit 084744N BNSF Railway Company Skagit Council of Governments 78.21 20.82 69.57 0.00 61.70 Kincaid St $5.0
7 S Spokane St EB Seattle King 085587B BNSF Railway Company Puget Sound Regional Council 65.92 23.92 88.19 0.00 60.99 SoDO Rail Corridor Grade Separations unknown
8 SR516‐Willis St Kent King 085640K BNSF Railway Company Puget Sound Regional Council 78.42 27.15 59.96 0.00 60.99 Willis St Grade Separation $81.0
9 88th St NE Marysville Snohomish 084650M BNSF Railway Company Puget Sound Regional Council 75.18 25.89 64.00 0.00 60.06 SR 529/I‐5 interchange, funded $50.0
10 S Holgate W/O 3 Seattle King 085583Y BNSF Railway Company Puget Sound Regional Council 53.85 44.00 88.19 0.00 59.97 SODO Rail Corridor Grade Separations $17.0
11 S 212th St Kent King 085625H BNSF Railway Company Puget Sound Regional Council 79.23 25.77 54.45 0.00 59.67 S 212th Grade Separation $83.0
12 Pines Rd‐SR27 Spokane Valley Spokane 066367E BNSF Railway Company Spokane Regional Transportation Council 82.50 20.65 52.17 0.00 59.45 SR27/SR290 Underpass (Pines Road) $18.0
13 Park Road Spokane Valley Spokane 066377K BNSF Railway Company Spokane Regional Transportation Council 78.24 37.51 42.64 0.00 59.16
14 5th St NW Puyallup Pierce 085699A BNSF Railway Company Puget Sound Regional Council 65.48 49.30 55.20 0.00 58.87 Canyon Road Northerly Extension unknown
15 S Horton St Seattle King 085585M BNSF Railway Company Puget Sound Regional Council 55.20 44.77 80.00 0.00 58.79 SoDO Rail Corridor Grade Separations unknown
16 West Smith St Kent King 085633A BNSF Railway Company Puget Sound Regional Council 60.52 45.92 65.11 0.00 58.02 All 3 Kent projects unknown
17 Meridian St Puyallup Pierce 085696E BNSF Railway Company Puget Sound Regional Council 71.92 31.41 56.78 0.00 58.01 Canyon Road Northerly Extension unknown
18 SR528‐4th Ave Marysville Snohomish 084640G BNSF Railway Company Puget Sound Regional Council 75.98 22.97 56.32 0.00 57.81 SR 529/I‐5 interchange, funded unknown
19 Main St Chehalis Lewis 092508E BNSF Railway Company Southwest Washington RTPO 68.29 31.85 59.74 0.00 57.04
20 Yakima Ave Yakima Yakima 099165Y BNSF Railway Company Yakima Valley Conference of Governments 65.71 30.32 58.14 0.00 54.97
21 Riverside Drive Mount Vernon Skagit 084758W BNSF Railway Company Skagit Council of Governments 64.79 45.24 43.29 0.00 54.53
22 F St/Cheney‐Spangle Cheney Spokane 065970L BNSF Railway Company Spokane Regional Transportation Council 59.61 42.33 56.20 0.00 54.44
23 SR 20 ‐ Avon Burlington Skagit 084766N BNSF Railway Company Skagit Council of Governments 76.38 27.78 37.18 0.00 54.43
24 Willis St ‐ SR516 Kent King 396581U Union Pacific Railroad Company Puget Sound Regional Council 67.95 25.71 53.08 0.00 53.67 Willis St Grade Separation $81.0
25 5th St SE Puyallup Pierce 085694R BNSF Railway Company Puget Sound Regional Council 59.88 37.60 56.86 0.00 53.55 Canyon Road Northerly Extension unknown
26 College ‐ SR 538 Mount Vernon Skagit 084759D BNSF Railway Company Skagit Council of Governments 60.98 37.69 54.33 0.00 53.50 College Way RR grade separation $17.0
27 15th St SW Auburn King 396593N Union Pacific Railroad Company Puget Sound Regional Council 65.20 22.07 60.73 0.00 53.30 BNSF Yard Grade Sep Project $35.0
28 S Spokane St WB Seattle King 085586U BNSF Railway Company Puget Sound Regional Council 58.53 19.98 75.41 0.00 53.11 SoDO Rail Corridor Grade Separations unknown
29 F Street Bellingham Whatcom 077846P BNSF Railway Company Whatcom Council of Governments 46.37 34.66 79.72 0.00 51.78
30 Argonne Rd Millwood Spokane 662514H Union Pacific Railroad Company Spokane Regional Transportation Council 73.76 24.68 34.11 0.00 51.58
31 116th St NE Marysville Snohomish 084654P BNSF Railway Company Puget Sound Regional Council 68.13 24.03 44.15 0.00 51.11
32 37th St NW Auburn King 085647H BNSF Railway Company Puget Sound Regional Council 55.22 34.41 57.70 0.00 50.64
33 SR104‐Main St Edmonds Snohomish 085445K BNSF Railway Company Puget Sound Regional Council 58.16 37.34 48.14 0.00 50.45 Edmonds Grade Separation unknown
34 Fairhaven Burlington Skagit 084765G BNSF Railway Company Skagit Council of Governments 50.82 40.54 59.31 0.00 50.38
35 Wall St Seattle King 085410J BNSF Railway Company Puget Sound Regional Council 56.50 36.24 51.80 0.00 50.26
36 Barker Rd Spokane Valley Spokane 066244T BNSF Railway Company Spokane Regional Transportation Council 72.62 15.04 39.52 0.00 49.95 Barker Rd Overpass $29.0
37 E Locust St Centralia Lewis 092519S BNSF Railway Company Southwest Washington RTPO 54.23 54.96 36.32 0.00 49.94
38 Pines Rd/SR27 Spokane Valley Spokane 662519S Union Pacific Railroad Company Spokane Regional Transportation Council 65.09 24.76 42.06 0.00 49.25
39 Clay St Seattle King 085413E BNSF Railway Company Puget Sound Regional Council 51.27 52.13 41.71 0.00 49.10
40 Union Ave Steilacoom Pierce 085755E BNSF Railway Company Puget Sound Regional Council 57.29 48.46 33.29 0.00 49.08
41 Washington Ave Yakima Yakima 099169B BNSF Railway Company Yakima Valley Conference of Governments 50.28 28.68 63.84 0.00 48.27 Washington Ave RR Grade Sep $20.0
42 Park Rd at Trent Spokane Valley Spokane 066378S BNSF Railway Company Spokane Regional Transportation Council 65.88 20.58 40.04 0.00 48.10
43 C St SW Auburn King 085661D BNSF Railway Company Puget Sound Regional Council 43.60 69.53 35.51 0.00 48.06
44 3rd St NW Auburn King 085652E BNSF Railway Company Puget Sound Regional Council 48.35 34.57 60.31 0.00 47.89
45 Main St West Auburn King 085655A BNSF Railway Company Puget Sound Regional Council 47.29 41.82 54.31 0.00 47.68
46 Mission Ave Spokane Spokane 662503V Union Pacific Railroad Company Spokane Regional Transportation Council 62.14 23.43 42.52 0.00 47.56
47 C St Bellingham Whatcom 084815H BNSF Railway Company Whatcom Council of Governments 41.11 51.12 55.33 0.00 47.17
48 Vista Rd Spokane Valley Spokane 066375W BNSF Railway Company Spokane Regional Transportation Council 58.47 44.00 27.67 0.00 47.15
49 Old 99/Blackburn Mount Vernon Skagit 084739S BNSF Railway Company Skagit Council of Governments 51.56 26.74 58.42 0.00 47.07
50 Walnut St ‐ SR505/603 Winlock Lewis 092493S BNSF Railway Company Southwest Washington RTPO 56.45 27.86 46.41 0.00 46.79
51 32nd St/Russell Washougal Clark 090117D BNSF Railway Company Southwest Washington Regional Transportation Council 68.02 16.24 34.77 0.00 46.77 27th St ext and RR overpass, new crossing $16.0
52 N Fruitland St Kennewick Benton 104572R BNSF Railway Company Benton‐Franklin Council of Governments 46.60 27.15 65.67 0.00 46.50
53 12th St NW Puyallup Pierce 085701Y BNSF Railway Company Puget Sound Regional Council 54.51 43.21 32.36 0.00 46.15
54 Flora Rd Spokane Valley Spokane 066245A BNSF Railway Company Spokane Regional Transportation Council 63.58 25.28 31.60 0.00 46.01
55 Harvard Rd Spokane Spokane 066240R BNSF Railway Company Spokane Regional Transportation Council 62.43 27.19 31.80 0.00 45.96
56 McCarver St Tacoma Pierce 085730J BNSF Railway Company Puget Sound Regional Council 51.83 41.95 38.21 0.00 45.96
Page C‐1
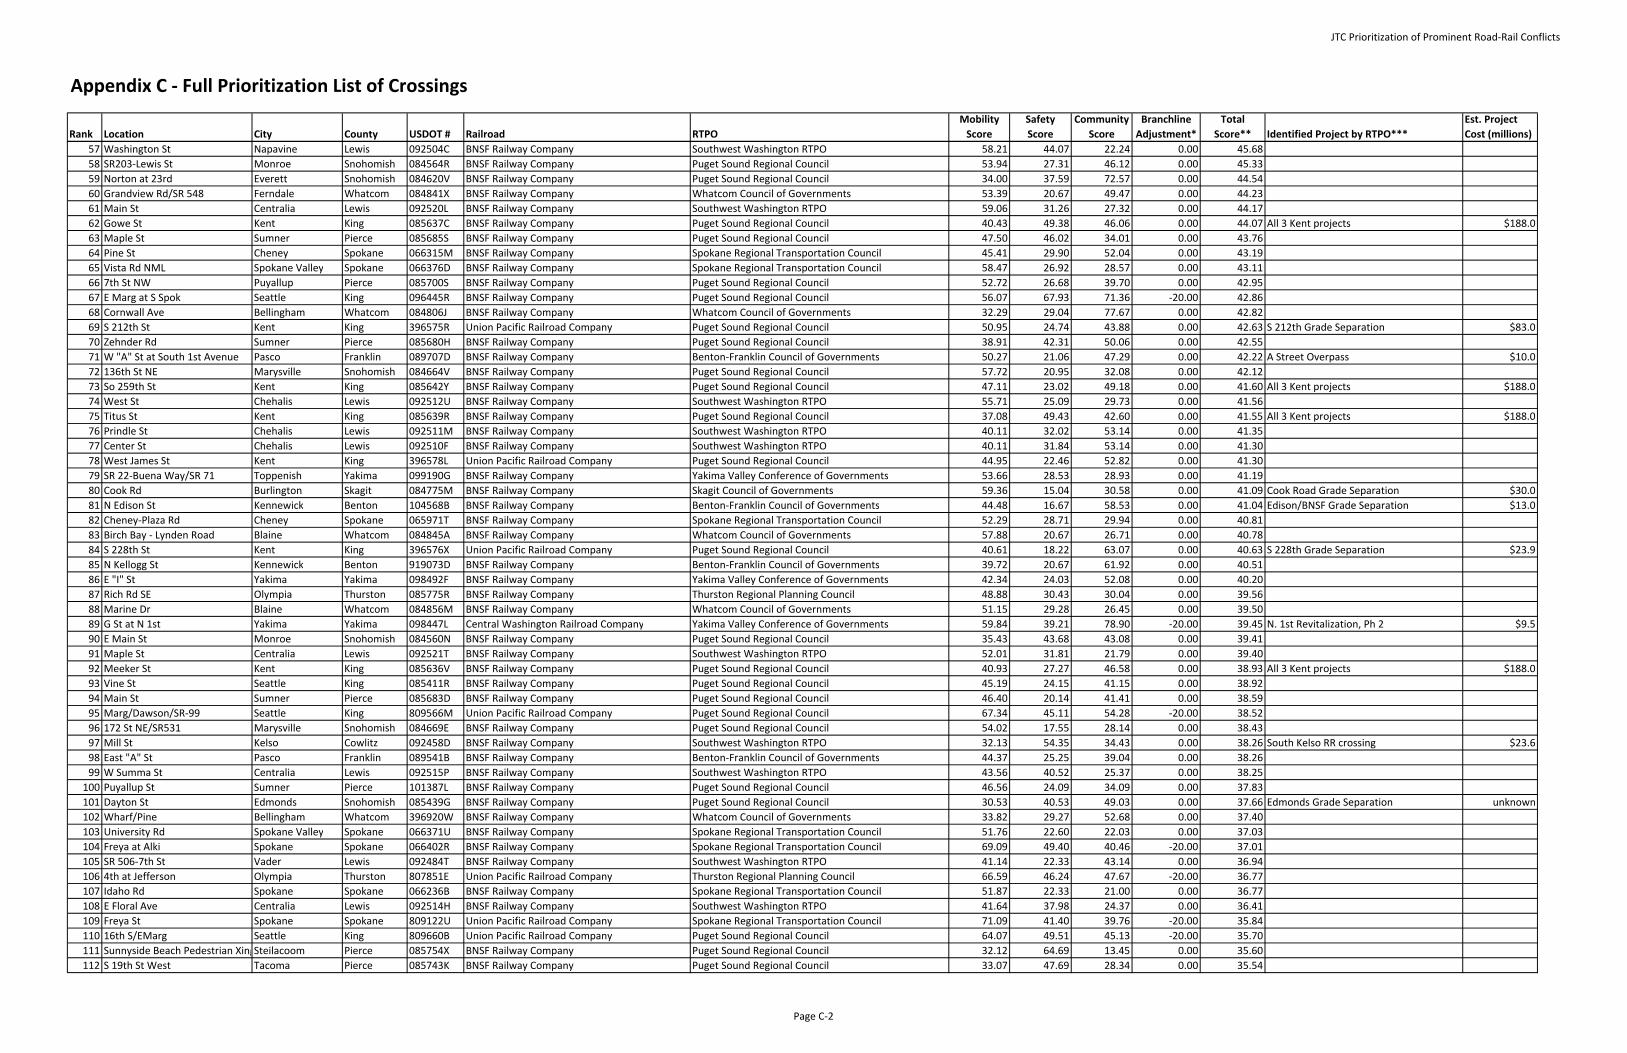
JTC Prioritization of Prominent Road‐Rail Conflicts
Appendix C ‐ Full Prioritization List of Crossings
Rank Location City County USDOT # Railroad RTPOMobility Score
SafetyScore
Community Score
Branchline Adjustment*
TotalScore** Identified Project by RTPO***
Est. Project Cost (millions)
57 Washington St Napavine Lewis 092504C BNSF Railway Company Southwest Washington RTPO 58.21 44.07 22.24 0.00 45.68
58 SR203‐Lewis St Monroe Snohomish 084564R BNSF Railway Company Puget Sound Regional Council 53.94 27.31 46.12 0.00 45.33
59 Norton at 23rd Everett Snohomish 084620V BNSF Railway Company Puget Sound Regional Council 34.00 37.59 72.57 0.00 44.54
60 Grandview Rd/SR 548 Ferndale Whatcom 084841X BNSF Railway Company Whatcom Council of Governments 53.39 20.67 49.47 0.00 44.23
61 Main St Centralia Lewis 092520L BNSF Railway Company Southwest Washington RTPO 59.06 31.26 27.32 0.00 44.17
62 Gowe St Kent King 085637C BNSF Railway Company Puget Sound Regional Council 40.43 49.38 46.06 0.00 44.07 All 3 Kent projects $188.0
63 Maple St Sumner Pierce 085685S BNSF Railway Company Puget Sound Regional Council 47.50 46.02 34.01 0.00 43.76
64 Pine St Cheney Spokane 066315M BNSF Railway Company Spokane Regional Transportation Council 45.41 29.90 52.04 0.00 43.19
65 Vista Rd NML Spokane Valley Spokane 066376D BNSF Railway Company Spokane Regional Transportation Council 58.47 26.92 28.57 0.00 43.11
66 7th St NW Puyallup Pierce 085700S BNSF Railway Company Puget Sound Regional Council 52.72 26.68 39.70 0.00 42.95
67 E Marg at S Spok Seattle King 096445R BNSF Railway Company Puget Sound Regional Council 56.07 67.93 71.36 ‐20.00 42.86
68 Cornwall Ave Bellingham Whatcom 084806J BNSF Railway Company Whatcom Council of Governments 32.29 29.04 77.67 0.00 42.82
69 S 212th St Kent King 396575R Union Pacific Railroad Company Puget Sound Regional Council 50.95 24.74 43.88 0.00 42.63 S 212th Grade Separation $83.0
70 Zehnder Rd Sumner Pierce 085680H BNSF Railway Company Puget Sound Regional Council 38.91 42.31 50.06 0.00 42.55
71 W "A" St at South 1st Avenue Pasco Franklin 089707D BNSF Railway Company Benton‐Franklin Council of Governments 50.27 21.06 47.29 0.00 42.22 A Street Overpass $10.0
72 136th St NE Marysville Snohomish 084664V BNSF Railway Company Puget Sound Regional Council 57.72 20.95 32.08 0.00 42.12
73 So 259th St Kent King 085642Y BNSF Railway Company Puget Sound Regional Council 47.11 23.02 49.18 0.00 41.60 All 3 Kent projects $188.0
74 West St Chehalis Lewis 092512U BNSF Railway Company Southwest Washington RTPO 55.71 25.09 29.73 0.00 41.56
75 Titus St Kent King 085639R BNSF Railway Company Puget Sound Regional Council 37.08 49.43 42.60 0.00 41.55 All 3 Kent projects $188.0
76 Prindle St Chehalis Lewis 092511M BNSF Railway Company Southwest Washington RTPO 40.11 32.02 53.14 0.00 41.35
77 Center St Chehalis Lewis 092510F BNSF Railway Company Southwest Washington RTPO 40.11 31.84 53.14 0.00 41.30
78 West James St Kent King 396578L Union Pacific Railroad Company Puget Sound Regional Council 44.95 22.46 52.82 0.00 41.30
79 SR 22‐Buena Way/SR 71 Toppenish Yakima 099190G BNSF Railway Company Yakima Valley Conference of Governments 53.66 28.53 28.93 0.00 41.19
80 Cook Rd Burlington Skagit 084775M BNSF Railway Company Skagit Council of Governments 59.36 15.04 30.58 0.00 41.09 Cook Road Grade Separation $30.0
81 N Edison St Kennewick Benton 104568B BNSF Railway Company Benton‐Franklin Council of Governments 44.48 16.67 58.53 0.00 41.04 Edison/BNSF Grade Separation $13.0
82 Cheney‐Plaza Rd Cheney Spokane 065971T BNSF Railway Company Spokane Regional Transportation Council 52.29 28.71 29.94 0.00 40.81
83 Birch Bay ‐ Lynden Road Blaine Whatcom 084845A BNSF Railway Company Whatcom Council of Governments 57.88 20.67 26.71 0.00 40.78
84 S 228th St Kent King 396576X Union Pacific Railroad Company Puget Sound Regional Council 40.61 18.22 63.07 0.00 40.63 S 228th Grade Separation $23.9
85 N Kellogg St Kennewick Benton 919073D BNSF Railway Company Benton‐Franklin Council of Governments 39.72 20.67 61.92 0.00 40.51
86 E "I" St Yakima Yakima 098492F BNSF Railway Company Yakima Valley Conference of Governments 42.34 24.03 52.08 0.00 40.20
87 Rich Rd SE Olympia Thurston 085775R BNSF Railway Company Thurston Regional Planning Council 48.88 30.43 30.04 0.00 39.56
88 Marine Dr Blaine Whatcom 084856M BNSF Railway Company Whatcom Council of Governments 51.15 29.28 26.45 0.00 39.50
89 G St at N 1st Yakima Yakima 098447L Central Washington Railroad Company Yakima Valley Conference of Governments 59.84 39.21 78.90 ‐20.00 39.45 N. 1st Revitalization, Ph 2 $9.5
90 E Main St Monroe Snohomish 084560N BNSF Railway Company Puget Sound Regional Council 35.43 43.68 43.08 0.00 39.41
91 Maple St Centralia Lewis 092521T BNSF Railway Company Southwest Washington RTPO 52.01 31.81 21.79 0.00 39.40
92 Meeker St Kent King 085636V BNSF Railway Company Puget Sound Regional Council 40.93 27.27 46.58 0.00 38.93 All 3 Kent projects $188.0
93 Vine St Seattle King 085411R BNSF Railway Company Puget Sound Regional Council 45.19 24.15 41.15 0.00 38.92
94 Main St Sumner Pierce 085683D BNSF Railway Company Puget Sound Regional Council 46.40 20.14 41.41 0.00 38.59
95 Marg/Dawson/SR‐99 Seattle King 809566M Union Pacific Railroad Company Puget Sound Regional Council 67.34 45.11 54.28 ‐20.00 38.52
96 172 St NE/SR531 Marysville Snohomish 084669E BNSF Railway Company Puget Sound Regional Council 54.02 17.55 28.14 0.00 38.43
97 Mill St Kelso Cowlitz 092458D BNSF Railway Company Southwest Washington RTPO 32.13 54.35 34.43 0.00 38.26 South Kelso RR crossing $23.6
98 East "A" St Pasco Franklin 089541B BNSF Railway Company Benton‐Franklin Council of Governments 44.37 25.25 39.04 0.00 38.26
99 W Summa St Centralia Lewis 092515P BNSF Railway Company Southwest Washington RTPO 43.56 40.52 25.37 0.00 38.25
100 Puyallup St Sumner Pierce 101387L BNSF Railway Company Puget Sound Regional Council 46.56 24.09 34.09 0.00 37.83
101 Dayton St Edmonds Snohomish 085439G BNSF Railway Company Puget Sound Regional Council 30.53 40.53 49.03 0.00 37.66 Edmonds Grade Separation unknown
102 Wharf/Pine Bellingham Whatcom 396920W BNSF Railway Company Whatcom Council of Governments 33.82 29.27 52.68 0.00 37.40
103 University Rd Spokane Valley Spokane 066371U BNSF Railway Company Spokane Regional Transportation Council 51.76 22.60 22.03 0.00 37.03
104 Freya at Alki Spokane Spokane 066402R BNSF Railway Company Spokane Regional Transportation Council 69.09 49.40 40.46 ‐20.00 37.01
105 SR 506‐7th St Vader Lewis 092484T BNSF Railway Company Southwest Washington RTPO 41.14 22.33 43.14 0.00 36.94
106 4th at Jefferson Olympia Thurston 807851E Union Pacific Railroad Company Thurston Regional Planning Council 66.59 46.24 47.67 ‐20.00 36.77
107 Idaho Rd Spokane Spokane 066236B BNSF Railway Company Spokane Regional Transportation Council 51.87 22.33 21.00 0.00 36.77
108 E Floral Ave Centralia Lewis 092514H BNSF Railway Company Southwest Washington RTPO 41.64 37.98 24.37 0.00 36.41
109 Freya St Spokane Spokane 809122U Union Pacific Railroad Company Spokane Regional Transportation Council 71.09 41.40 39.76 ‐20.00 35.84
110 16th S/EMarg Seattle King 809660B Union Pacific Railroad Company Puget Sound Regional Council 64.07 49.51 45.13 ‐20.00 35.70
111 Sunnyside Beach Pedestrian XingSteilacoom Pierce 085754X BNSF Railway Company Puget Sound Regional Council 32.12 64.69 13.45 0.00 35.60
112 S 19th St West Tacoma Pierce 085743K BNSF Railway Company Puget Sound Regional Council 33.07 47.69 28.34 0.00 35.54
Page C‐2
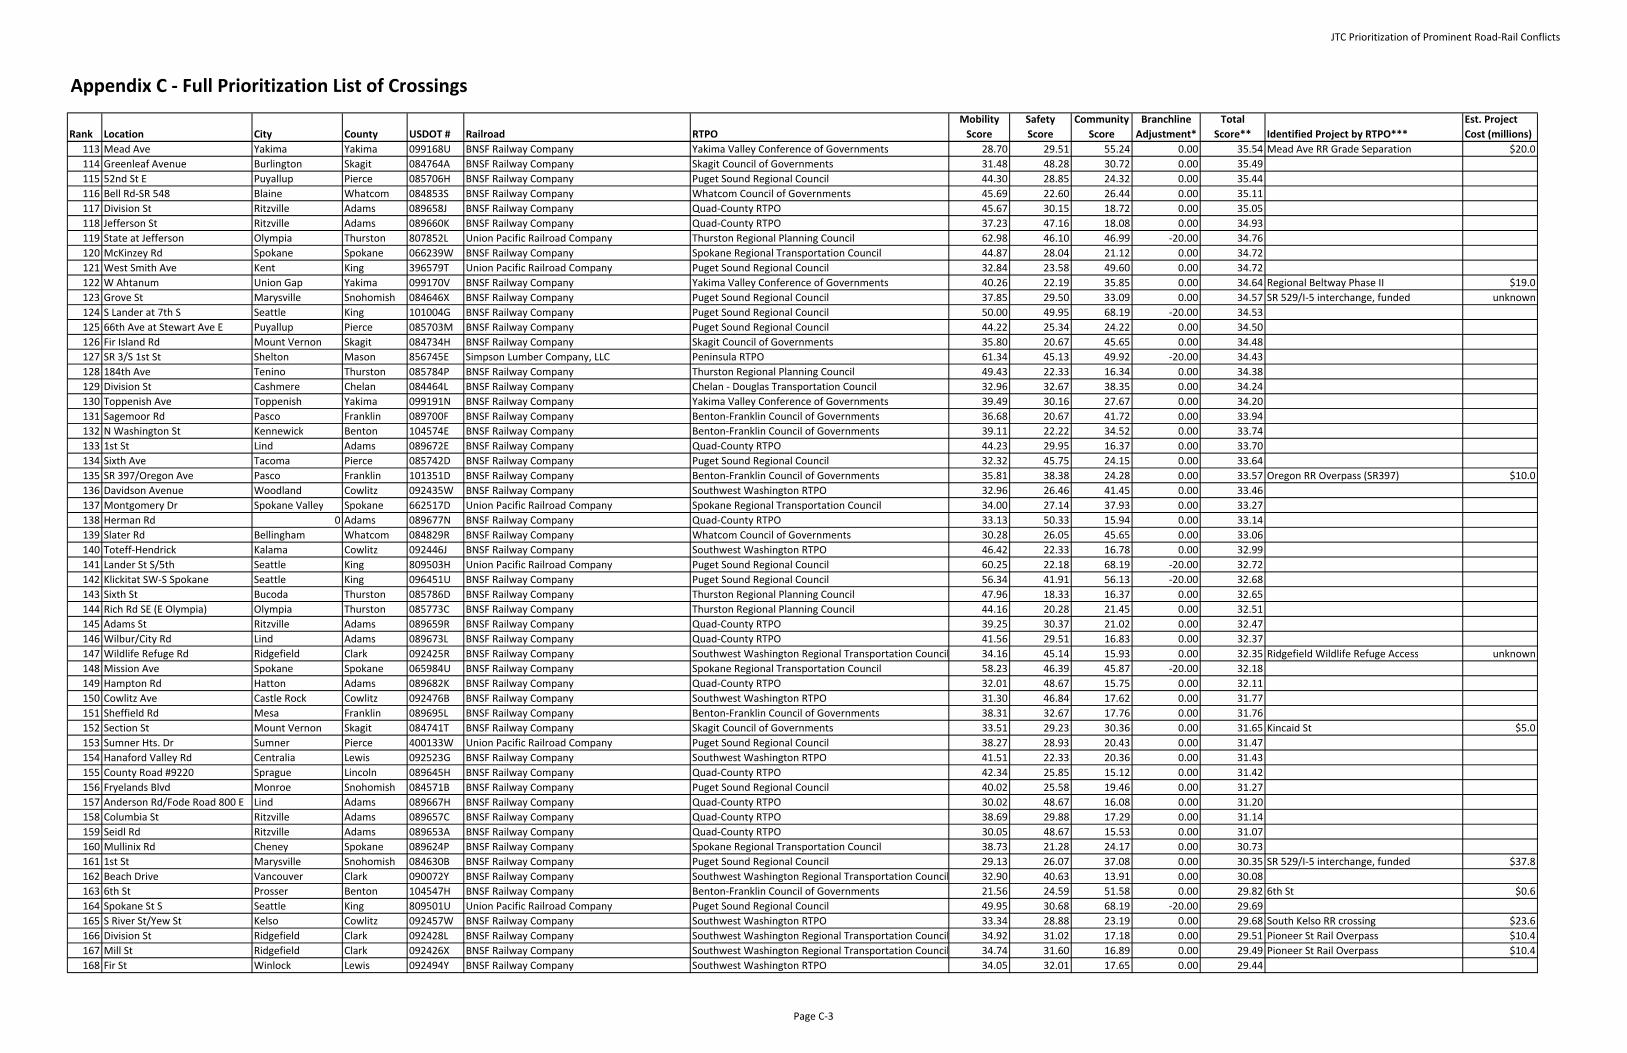
JTC Prioritization of Prominent Road‐Rail Conflicts
Appendix C ‐ Full Prioritization List of Crossings
Rank Location City County USDOT # Railroad RTPOMobility Score
SafetyScore
Community Score
Branchline Adjustment*
TotalScore** Identified Project by RTPO***
Est. Project Cost (millions)
113 Mead Ave Yakima Yakima 099168U BNSF Railway Company Yakima Valley Conference of Governments 28.70 29.51 55.24 0.00 35.54 Mead Ave RR Grade Separation $20.0
114 Greenleaf Avenue Burlington Skagit 084764A BNSF Railway Company Skagit Council of Governments 31.48 48.28 30.72 0.00 35.49
115 52nd St E Puyallup Pierce 085706H BNSF Railway Company Puget Sound Regional Council 44.30 28.85 24.32 0.00 35.44
116 Bell Rd‐SR 548 Blaine Whatcom 084853S BNSF Railway Company Whatcom Council of Governments 45.69 22.60 26.44 0.00 35.11
117 Division St Ritzville Adams 089658J BNSF Railway Company Quad‐County RTPO 45.67 30.15 18.72 0.00 35.05
118 Jefferson St Ritzville Adams 089660K BNSF Railway Company Quad‐County RTPO 37.23 47.16 18.08 0.00 34.93
119 State at Jefferson Olympia Thurston 807852L Union Pacific Railroad Company Thurston Regional Planning Council 62.98 46.10 46.99 ‐20.00 34.76
120 McKinzey Rd Spokane Spokane 066239W BNSF Railway Company Spokane Regional Transportation Council 44.87 28.04 21.12 0.00 34.72
121 West Smith Ave Kent King 396579T Union Pacific Railroad Company Puget Sound Regional Council 32.84 23.58 49.60 0.00 34.72
122 W Ahtanum Union Gap Yakima 099170V BNSF Railway Company Yakima Valley Conference of Governments 40.26 22.19 35.85 0.00 34.64 Regional Beltway Phase II $19.0
123 Grove St Marysville Snohomish 084646X BNSF Railway Company Puget Sound Regional Council 37.85 29.50 33.09 0.00 34.57 SR 529/I‐5 interchange, funded unknown
124 S Lander at 7th S Seattle King 101004G BNSF Railway Company Puget Sound Regional Council 50.00 49.95 68.19 ‐20.00 34.53
125 66th Ave at Stewart Ave E Puyallup Pierce 085703M BNSF Railway Company Puget Sound Regional Council 44.22 25.34 24.22 0.00 34.50
126 Fir Island Rd Mount Vernon Skagit 084734H BNSF Railway Company Skagit Council of Governments 35.80 20.67 45.65 0.00 34.48
127 SR 3/S 1st St Shelton Mason 856745E Simpson Lumber Company, LLC Peninsula RTPO 61.34 45.13 49.92 ‐20.00 34.43
128 184th Ave Tenino Thurston 085784P BNSF Railway Company Thurston Regional Planning Council 49.43 22.33 16.34 0.00 34.38
129 Division St Cashmere Chelan 084464L BNSF Railway Company Chelan ‐ Douglas Transportation Council 32.96 32.67 38.35 0.00 34.24
130 Toppenish Ave Toppenish Yakima 099191N BNSF Railway Company Yakima Valley Conference of Governments 39.49 30.16 27.67 0.00 34.20
131 Sagemoor Rd Pasco Franklin 089700F BNSF Railway Company Benton‐Franklin Council of Governments 36.68 20.67 41.72 0.00 33.94
132 N Washington St Kennewick Benton 104574E BNSF Railway Company Benton‐Franklin Council of Governments 39.11 22.22 34.52 0.00 33.74
133 1st St Lind Adams 089672E BNSF Railway Company Quad‐County RTPO 44.23 29.95 16.37 0.00 33.70
134 Sixth Ave Tacoma Pierce 085742D BNSF Railway Company Puget Sound Regional Council 32.32 45.75 24.15 0.00 33.64
135 SR 397/Oregon Ave Pasco Franklin 101351D BNSF Railway Company Benton‐Franklin Council of Governments 35.81 38.38 24.28 0.00 33.57 Oregon RR Overpass (SR397) $10.0
136 Davidson Avenue Woodland Cowlitz 092435W BNSF Railway Company Southwest Washington RTPO 32.96 26.46 41.45 0.00 33.46
137 Montgomery Dr Spokane Valley Spokane 662517D Union Pacific Railroad Company Spokane Regional Transportation Council 34.00 27.14 37.93 0.00 33.27
138 Herman Rd 0 Adams 089677N BNSF Railway Company Quad‐County RTPO 33.13 50.33 15.94 0.00 33.14
139 Slater Rd Bellingham Whatcom 084829R BNSF Railway Company Whatcom Council of Governments 30.28 26.05 45.65 0.00 33.06
140 Toteff‐Hendrick Kalama Cowlitz 092446J BNSF Railway Company Southwest Washington RTPO 46.42 22.33 16.78 0.00 32.99
141 Lander St S/5th Seattle King 809503H Union Pacific Railroad Company Puget Sound Regional Council 60.25 22.18 68.19 ‐20.00 32.72
142 Klickitat SW‐S Spokane Seattle King 096451U BNSF Railway Company Puget Sound Regional Council 56.34 41.91 56.13 ‐20.00 32.68
143 Sixth St Bucoda Thurston 085786D BNSF Railway Company Thurston Regional Planning Council 47.96 18.33 16.37 0.00 32.65
144 Rich Rd SE (E Olympia) Olympia Thurston 085773C BNSF Railway Company Thurston Regional Planning Council 44.16 20.28 21.45 0.00 32.51
145 Adams St Ritzville Adams 089659R BNSF Railway Company Quad‐County RTPO 39.25 30.37 21.02 0.00 32.47
146 Wilbur/City Rd Lind Adams 089673L BNSF Railway Company Quad‐County RTPO 41.56 29.51 16.83 0.00 32.37
147 Wildlife Refuge Rd Ridgefield Clark 092425R BNSF Railway Company Southwest Washington Regional Transportation Council 34.16 45.14 15.93 0.00 32.35 Ridgefield Wildlife Refuge Access unknown
148 Mission Ave Spokane Spokane 065984U BNSF Railway Company Spokane Regional Transportation Council 58.23 46.39 45.87 ‐20.00 32.18
149 Hampton Rd Hatton Adams 089682K BNSF Railway Company Quad‐County RTPO 32.01 48.67 15.75 0.00 32.11
150 Cowlitz Ave Castle Rock Cowlitz 092476B BNSF Railway Company Southwest Washington RTPO 31.30 46.84 17.62 0.00 31.77
151 Sheffield Rd Mesa Franklin 089695L BNSF Railway Company Benton‐Franklin Council of Governments 38.31 32.67 17.76 0.00 31.76
152 Section St Mount Vernon Skagit 084741T BNSF Railway Company Skagit Council of Governments 33.51 29.23 30.36 0.00 31.65 Kincaid St $5.0
153 Sumner Hts. Dr Sumner Pierce 400133W Union Pacific Railroad Company Puget Sound Regional Council 38.27 28.93 20.43 0.00 31.47
154 Hanaford Valley Rd Centralia Lewis 092523G BNSF Railway Company Southwest Washington RTPO 41.51 22.33 20.36 0.00 31.43
155 County Road #9220 Sprague Lincoln 089645H BNSF Railway Company Quad‐County RTPO 42.34 25.85 15.12 0.00 31.42
156 Fryelands Blvd Monroe Snohomish 084571B BNSF Railway Company Puget Sound Regional Council 40.02 25.58 19.46 0.00 31.27
157 Anderson Rd/Fode Road 800 E Lind Adams 089667H BNSF Railway Company Quad‐County RTPO 30.02 48.67 16.08 0.00 31.20
158 Columbia St Ritzville Adams 089657C BNSF Railway Company Quad‐County RTPO 38.69 29.88 17.29 0.00 31.14
159 Seidl Rd Ritzville Adams 089653A BNSF Railway Company Quad‐County RTPO 30.05 48.67 15.53 0.00 31.07
160 Mullinix Rd Cheney Spokane 089624P BNSF Railway Company Spokane Regional Transportation Council 38.73 21.28 24.17 0.00 30.73
161 1st St Marysville Snohomish 084630B BNSF Railway Company Puget Sound Regional Council 29.13 26.07 37.08 0.00 30.35 SR 529/I‐5 interchange, funded $37.8
162 Beach Drive Vancouver Clark 090072Y BNSF Railway Company Southwest Washington Regional Transportation Council 32.90 40.63 13.91 0.00 30.08
163 6th St Prosser Benton 104547H BNSF Railway Company Benton‐Franklin Council of Governments 21.56 24.59 51.58 0.00 29.82 6th St $0.6
164 Spokane St S Seattle King 809501U Union Pacific Railroad Company Puget Sound Regional Council 49.95 30.68 68.19 ‐20.00 29.69
165 S River St/Yew St Kelso Cowlitz 092457W BNSF Railway Company Southwest Washington RTPO 33.34 28.88 23.19 0.00 29.68 South Kelso RR crossing $23.6
166 Division St Ridgefield Clark 092428L BNSF Railway Company Southwest Washington Regional Transportation Council 34.92 31.02 17.18 0.00 29.51 Pioneer St Rail Overpass $10.4
167 Mill St Ridgefield Clark 092426X BNSF Railway Company Southwest Washington Regional Transportation Council 34.74 31.60 16.89 0.00 29.49 Pioneer St Rail Overpass $10.4
168 Fir St Winlock Lewis 092494Y BNSF Railway Company Southwest Washington RTPO 34.05 32.01 17.65 0.00 29.44
Page C‐3
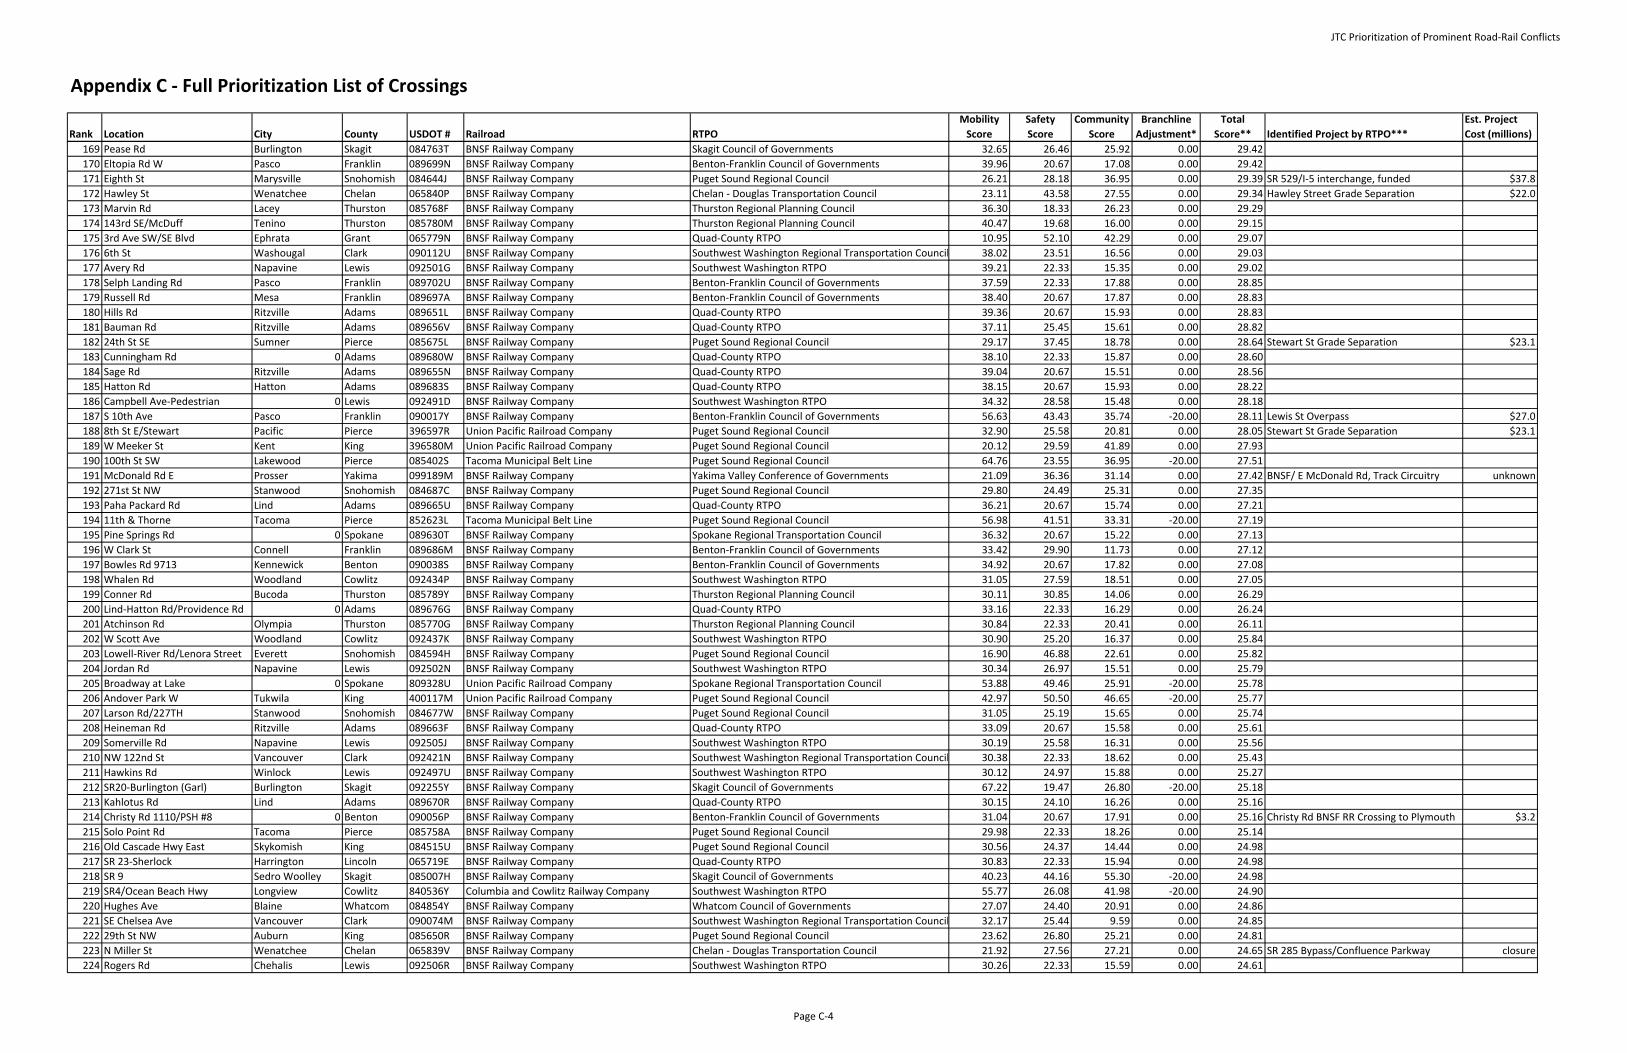
JTC Prioritization of Prominent Road‐Rail Conflicts
Appendix C ‐ Full Prioritization List of Crossings
Rank Location City County USDOT # Railroad RTPOMobility Score
SafetyScore
Community Score
Branchline Adjustment*
TotalScore** Identified Project by RTPO***
Est. Project Cost (millions)
169 Pease Rd Burlington Skagit 084763T BNSF Railway Company Skagit Council of Governments 32.65 26.46 25.92 0.00 29.42
170 Eltopia Rd W Pasco Franklin 089699N BNSF Railway Company Benton‐Franklin Council of Governments 39.96 20.67 17.08 0.00 29.42
171 Eighth St Marysville Snohomish 084644J BNSF Railway Company Puget Sound Regional Council 26.21 28.18 36.95 0.00 29.39 SR 529/I‐5 interchange, funded $37.8
172 Hawley St Wenatchee Chelan 065840P BNSF Railway Company Chelan ‐ Douglas Transportation Council 23.11 43.58 27.55 0.00 29.34 Hawley Street Grade Separation $22.0
173 Marvin Rd Lacey Thurston 085768F BNSF Railway Company Thurston Regional Planning Council 36.30 18.33 26.23 0.00 29.29
174 143rd SE/McDuff Tenino Thurston 085780M BNSF Railway Company Thurston Regional Planning Council 40.47 19.68 16.00 0.00 29.15
175 3rd Ave SW/SE Blvd Ephrata Grant 065779N BNSF Railway Company Quad‐County RTPO 10.95 52.10 42.29 0.00 29.07
176 6th St Washougal Clark 090112U BNSF Railway Company Southwest Washington Regional Transportation Council 38.02 23.51 16.56 0.00 29.03
177 Avery Rd Napavine Lewis 092501G BNSF Railway Company Southwest Washington RTPO 39.21 22.33 15.35 0.00 29.02
178 Selph Landing Rd Pasco Franklin 089702U BNSF Railway Company Benton‐Franklin Council of Governments 37.59 22.33 17.88 0.00 28.85
179 Russell Rd Mesa Franklin 089697A BNSF Railway Company Benton‐Franklin Council of Governments 38.40 20.67 17.87 0.00 28.83
180 Hills Rd Ritzville Adams 089651L BNSF Railway Company Quad‐County RTPO 39.36 20.67 15.93 0.00 28.83
181 Bauman Rd Ritzville Adams 089656V BNSF Railway Company Quad‐County RTPO 37.11 25.45 15.61 0.00 28.82
182 24th St SE Sumner Pierce 085675L BNSF Railway Company Puget Sound Regional Council 29.17 37.45 18.78 0.00 28.64 Stewart St Grade Separation $23.1
183 Cunningham Rd 0 Adams 089680W BNSF Railway Company Quad‐County RTPO 38.10 22.33 15.87 0.00 28.60
184 Sage Rd Ritzville Adams 089655N BNSF Railway Company Quad‐County RTPO 39.04 20.67 15.51 0.00 28.56
185 Hatton Rd Hatton Adams 089683S BNSF Railway Company Quad‐County RTPO 38.15 20.67 15.93 0.00 28.22
186 Campbell Ave‐Pedestrian 0 Lewis 092491D BNSF Railway Company Southwest Washington RTPO 34.32 28.58 15.48 0.00 28.18
187 S 10th Ave Pasco Franklin 090017Y BNSF Railway Company Benton‐Franklin Council of Governments 56.63 43.43 35.74 ‐20.00 28.11 Lewis St Overpass $27.0
188 8th St E/Stewart Pacific Pierce 396597R Union Pacific Railroad Company Puget Sound Regional Council 32.90 25.58 20.81 0.00 28.05 Stewart St Grade Separation $23.1
189 W Meeker St Kent King 396580M Union Pacific Railroad Company Puget Sound Regional Council 20.12 29.59 41.89 0.00 27.93
190 100th St SW Lakewood Pierce 085402S Tacoma Municipal Belt Line Puget Sound Regional Council 64.76 23.55 36.95 ‐20.00 27.51
191 McDonald Rd E Prosser Yakima 099189M BNSF Railway Company Yakima Valley Conference of Governments 21.09 36.36 31.14 0.00 27.42 BNSF/ E McDonald Rd, Track Circuitry unknown
192 271st St NW Stanwood Snohomish 084687C BNSF Railway Company Puget Sound Regional Council 29.80 24.49 25.31 0.00 27.35
193 Paha Packard Rd Lind Adams 089665U BNSF Railway Company Quad‐County RTPO 36.21 20.67 15.74 0.00 27.21
194 11th & Thorne Tacoma Pierce 852623L Tacoma Municipal Belt Line Puget Sound Regional Council 56.98 41.51 33.31 ‐20.00 27.19
195 Pine Springs Rd 0 Spokane 089630T BNSF Railway Company Spokane Regional Transportation Council 36.32 20.67 15.22 0.00 27.13
196 W Clark St Connell Franklin 089686M BNSF Railway Company Benton‐Franklin Council of Governments 33.42 29.90 11.73 0.00 27.12
197 Bowles Rd 9713 Kennewick Benton 090038S BNSF Railway Company Benton‐Franklin Council of Governments 34.92 20.67 17.82 0.00 27.08
198 Whalen Rd Woodland Cowlitz 092434P BNSF Railway Company Southwest Washington RTPO 31.05 27.59 18.51 0.00 27.05
199 Conner Rd Bucoda Thurston 085789Y BNSF Railway Company Thurston Regional Planning Council 30.11 30.85 14.06 0.00 26.29
200 Lind‐Hatton Rd/Providence Rd 0 Adams 089676G BNSF Railway Company Quad‐County RTPO 33.16 22.33 16.29 0.00 26.24
201 Atchinson Rd Olympia Thurston 085770G BNSF Railway Company Thurston Regional Planning Council 30.84 22.33 20.41 0.00 26.11
202 W Scott Ave Woodland Cowlitz 092437K BNSF Railway Company Southwest Washington RTPO 30.90 25.20 16.37 0.00 25.84
203 Lowell‐River Rd/Lenora Street Everett Snohomish 084594H BNSF Railway Company Puget Sound Regional Council 16.90 46.88 22.61 0.00 25.82
204 Jordan Rd Napavine Lewis 092502N BNSF Railway Company Southwest Washington RTPO 30.34 26.97 15.51 0.00 25.79
205 Broadway at Lake 0 Spokane 809328U Union Pacific Railroad Company Spokane Regional Transportation Council 53.88 49.46 25.91 ‐20.00 25.78
206 Andover Park W Tukwila King 400117M Union Pacific Railroad Company Puget Sound Regional Council 42.97 50.50 46.65 ‐20.00 25.77
207 Larson Rd/227TH Stanwood Snohomish 084677W BNSF Railway Company Puget Sound Regional Council 31.05 25.19 15.65 0.00 25.74
208 Heineman Rd Ritzville Adams 089663F BNSF Railway Company Quad‐County RTPO 33.09 20.67 15.58 0.00 25.61
209 Somerville Rd Napavine Lewis 092505J BNSF Railway Company Southwest Washington RTPO 30.19 25.58 16.31 0.00 25.56
210 NW 122nd St Vancouver Clark 092421N BNSF Railway Company Southwest Washington Regional Transportation Council 30.38 22.33 18.62 0.00 25.43
211 Hawkins Rd Winlock Lewis 092497U BNSF Railway Company Southwest Washington RTPO 30.12 24.97 15.88 0.00 25.27
212 SR20‐Burlington (Garl) Burlington Skagit 092255Y BNSF Railway Company Skagit Council of Governments 67.22 19.47 26.80 ‐20.00 25.18
213 Kahlotus Rd Lind Adams 089670R BNSF Railway Company Quad‐County RTPO 30.15 24.10 16.26 0.00 25.16
214 Christy Rd 1110/PSH #8 0 Benton 090056P BNSF Railway Company Benton‐Franklin Council of Governments 31.04 20.67 17.91 0.00 25.16 Christy Rd BNSF RR Crossing to Plymouth $3.2
215 Solo Point Rd Tacoma Pierce 085758A BNSF Railway Company Puget Sound Regional Council 29.98 22.33 18.26 0.00 25.14
216 Old Cascade Hwy East Skykomish King 084515U BNSF Railway Company Puget Sound Regional Council 30.56 24.37 14.44 0.00 24.98
217 SR 23‐Sherlock Harrington Lincoln 065719E BNSF Railway Company Quad‐County RTPO 30.83 22.33 15.94 0.00 24.98
218 SR 9 Sedro Woolley Skagit 085007H BNSF Railway Company Skagit Council of Governments 40.23 44.16 55.30 ‐20.00 24.98
219 SR4/Ocean Beach Hwy Longview Cowlitz 840536Y Columbia and Cowlitz Railway Company Southwest Washington RTPO 55.77 26.08 41.98 ‐20.00 24.90
220 Hughes Ave Blaine Whatcom 084854Y BNSF Railway Company Whatcom Council of Governments 27.07 24.40 20.91 0.00 24.86
221 SE Chelsea Ave Vancouver Clark 090074M BNSF Railway Company Southwest Washington Regional Transportation Council 32.17 25.44 9.59 0.00 24.85
222 29th St NW Auburn King 085650R BNSF Railway Company Puget Sound Regional Council 23.62 26.80 25.21 0.00 24.81
223 N Miller St Wenatchee Chelan 065839V BNSF Railway Company Chelan ‐ Douglas Transportation Council 21.92 27.56 27.21 0.00 24.65 SR 285 Bypass/Confluence Parkway closure
224 Rogers Rd Chehalis Lewis 092506R BNSF Railway Company Southwest Washington RTPO 30.26 22.33 15.59 0.00 24.61
Page C‐4
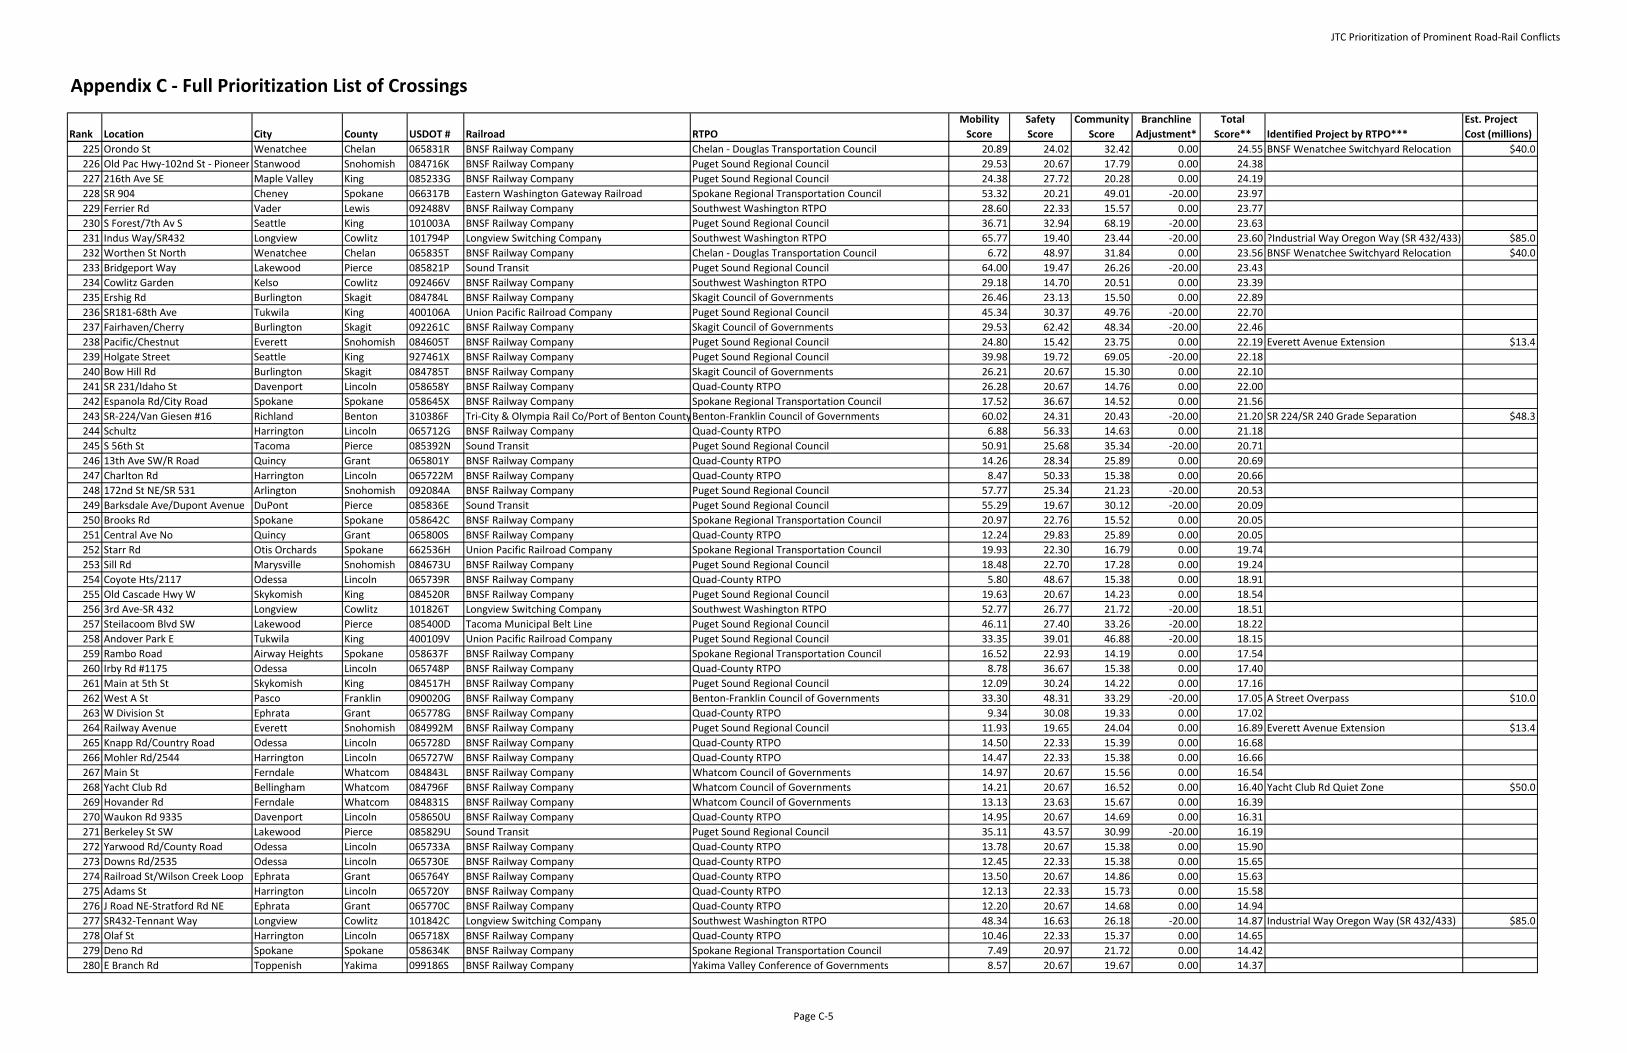
JTC Prioritization of Prominent Road‐Rail Conflicts
Appendix C ‐ Full Prioritization List of Crossings
Rank Location City County USDOT # Railroad RTPOMobility Score
SafetyScore
Community Score
Branchline Adjustment*
TotalScore** Identified Project by RTPO***
Est. Project Cost (millions)
225 Orondo St Wenatchee Chelan 065831R BNSF Railway Company Chelan ‐ Douglas Transportation Council 20.89 24.02 32.42 0.00 24.55 BNSF Wenatchee Switchyard Relocation $40.0
226 Old Pac Hwy‐102nd St ‐ Pioneer Stanwood Snohomish 084716K BNSF Railway Company Puget Sound Regional Council 29.53 20.67 17.79 0.00 24.38
227 216th Ave SE Maple Valley King 085233G BNSF Railway Company Puget Sound Regional Council 24.38 27.72 20.28 0.00 24.19
228 SR 904 Cheney Spokane 066317B Eastern Washington Gateway Railroad Spokane Regional Transportation Council 53.32 20.21 49.01 ‐20.00 23.97
229 Ferrier Rd Vader Lewis 092488V BNSF Railway Company Southwest Washington RTPO 28.60 22.33 15.57 0.00 23.77
230 S Forest/7th Av S Seattle King 101003A BNSF Railway Company Puget Sound Regional Council 36.71 32.94 68.19 ‐20.00 23.63
231 Indus Way/SR432 Longview Cowlitz 101794P Longview Switching Company Southwest Washington RTPO 65.77 19.40 23.44 ‐20.00 23.60 ?Industrial Way Oregon Way (SR 432/433) $85.0
232 Worthen St North Wenatchee Chelan 065835T BNSF Railway Company Chelan ‐ Douglas Transportation Council 6.72 48.97 31.84 0.00 23.56 BNSF Wenatchee Switchyard Relocation $40.0
233 Bridgeport Way Lakewood Pierce 085821P Sound Transit Puget Sound Regional Council 64.00 19.47 26.26 ‐20.00 23.43
234 Cowlitz Garden Kelso Cowlitz 092466V BNSF Railway Company Southwest Washington RTPO 29.18 14.70 20.51 0.00 23.39
235 Ershig Rd Burlington Skagit 084784L BNSF Railway Company Skagit Council of Governments 26.46 23.13 15.50 0.00 22.89
236 SR181‐68th Ave Tukwila King 400106A Union Pacific Railroad Company Puget Sound Regional Council 45.34 30.37 49.76 ‐20.00 22.70
237 Fairhaven/Cherry Burlington Skagit 092261C BNSF Railway Company Skagit Council of Governments 29.53 62.42 48.34 ‐20.00 22.46
238 Pacific/Chestnut Everett Snohomish 084605T BNSF Railway Company Puget Sound Regional Council 24.80 15.42 23.75 0.00 22.19 Everett Avenue Extension $13.4
239 Holgate Street Seattle King 927461X BNSF Railway Company Puget Sound Regional Council 39.98 19.72 69.05 ‐20.00 22.18
240 Bow Hill Rd Burlington Skagit 084785T BNSF Railway Company Skagit Council of Governments 26.21 20.67 15.30 0.00 22.10
241 SR 231/Idaho St Davenport Lincoln 058658Y BNSF Railway Company Quad‐County RTPO 26.28 20.67 14.76 0.00 22.00
242 Espanola Rd/City Road Spokane Spokane 058645X BNSF Railway Company Spokane Regional Transportation Council 17.52 36.67 14.52 0.00 21.56
243 SR‐224/Van Giesen #16 Richland Benton 310386F Tri‐City & Olympia Rail Co/Port of Benton CountyBenton‐Franklin Council of Governments 60.02 24.31 20.43 ‐20.00 21.20 SR 224/SR 240 Grade Separation $48.3
244 Schultz Harrington Lincoln 065712G BNSF Railway Company Quad‐County RTPO 6.88 56.33 14.63 0.00 21.18
245 S 56th St Tacoma Pierce 085392N Sound Transit Puget Sound Regional Council 50.91 25.68 35.34 ‐20.00 20.71
246 13th Ave SW/R Road Quincy Grant 065801Y BNSF Railway Company Quad‐County RTPO 14.26 28.34 25.89 0.00 20.69
247 Charlton Rd Harrington Lincoln 065722M BNSF Railway Company Quad‐County RTPO 8.47 50.33 15.38 0.00 20.66
248 172nd St NE/SR 531 Arlington Snohomish 092084A BNSF Railway Company Puget Sound Regional Council 57.77 25.34 21.23 ‐20.00 20.53
249 Barksdale Ave/Dupont Avenue DuPont Pierce 085836E Sound Transit Puget Sound Regional Council 55.29 19.67 30.12 ‐20.00 20.09
250 Brooks Rd Spokane Spokane 058642C BNSF Railway Company Spokane Regional Transportation Council 20.97 22.76 15.52 0.00 20.05
251 Central Ave No Quincy Grant 065800S BNSF Railway Company Quad‐County RTPO 12.24 29.83 25.89 0.00 20.05
252 Starr Rd Otis Orchards Spokane 662536H Union Pacific Railroad Company Spokane Regional Transportation Council 19.93 22.30 16.79 0.00 19.74
253 Sill Rd Marysville Snohomish 084673U BNSF Railway Company Puget Sound Regional Council 18.48 22.70 17.28 0.00 19.24
254 Coyote Hts/2117 Odessa Lincoln 065739R BNSF Railway Company Quad‐County RTPO 5.80 48.67 15.38 0.00 18.91
255 Old Cascade Hwy W Skykomish King 084520R BNSF Railway Company Puget Sound Regional Council 19.63 20.67 14.23 0.00 18.54
256 3rd Ave‐SR 432 Longview Cowlitz 101826T Longview Switching Company Southwest Washington RTPO 52.77 26.77 21.72 ‐20.00 18.51
257 Steilacoom Blvd SW Lakewood Pierce 085400D Tacoma Municipal Belt Line Puget Sound Regional Council 46.11 27.40 33.26 ‐20.00 18.22
258 Andover Park E Tukwila King 400109V Union Pacific Railroad Company Puget Sound Regional Council 33.35 39.01 46.88 ‐20.00 18.15
259 Rambo Road Airway Heights Spokane 058637F BNSF Railway Company Spokane Regional Transportation Council 16.52 22.93 14.19 0.00 17.54
260 Irby Rd #1175 Odessa Lincoln 065748P BNSF Railway Company Quad‐County RTPO 8.78 36.67 15.38 0.00 17.40
261 Main at 5th St Skykomish King 084517H BNSF Railway Company Puget Sound Regional Council 12.09 30.24 14.22 0.00 17.16
262 West A St Pasco Franklin 090020G BNSF Railway Company Benton‐Franklin Council of Governments 33.30 48.31 33.29 ‐20.00 17.05 A Street Overpass $10.0
263 W Division St Ephrata Grant 065778G BNSF Railway Company Quad‐County RTPO 9.34 30.08 19.33 0.00 17.02
264 Railway Avenue Everett Snohomish 084992M BNSF Railway Company Puget Sound Regional Council 11.93 19.65 24.04 0.00 16.89 Everett Avenue Extension $13.4
265 Knapp Rd/Country Road Odessa Lincoln 065728D BNSF Railway Company Quad‐County RTPO 14.50 22.33 15.39 0.00 16.68
266 Mohler Rd/2544 Harrington Lincoln 065727W BNSF Railway Company Quad‐County RTPO 14.47 22.33 15.38 0.00 16.66
267 Main St Ferndale Whatcom 084843L BNSF Railway Company Whatcom Council of Governments 14.97 20.67 15.56 0.00 16.54
268 Yacht Club Rd Bellingham Whatcom 084796F BNSF Railway Company Whatcom Council of Governments 14.21 20.67 16.52 0.00 16.40 Yacht Club Rd Quiet Zone $50.0
269 Hovander Rd Ferndale Whatcom 084831S BNSF Railway Company Whatcom Council of Governments 13.13 23.63 15.67 0.00 16.39
270 Waukon Rd 9335 Davenport Lincoln 058650U BNSF Railway Company Quad‐County RTPO 14.95 20.67 14.69 0.00 16.31
271 Berkeley St SW Lakewood Pierce 085829U Sound Transit Puget Sound Regional Council 35.11 43.57 30.99 ‐20.00 16.19
272 Yarwood Rd/County Road Odessa Lincoln 065733A BNSF Railway Company Quad‐County RTPO 13.78 20.67 15.38 0.00 15.90
273 Downs Rd/2535 Odessa Lincoln 065730E BNSF Railway Company Quad‐County RTPO 12.45 22.33 15.38 0.00 15.65
274 Railroad St/Wilson Creek Loop Ephrata Grant 065764Y BNSF Railway Company Quad‐County RTPO 13.50 20.67 14.86 0.00 15.63
275 Adams St Harrington Lincoln 065720Y BNSF Railway Company Quad‐County RTPO 12.13 22.33 15.73 0.00 15.58
276 J Road NE‐Stratford Rd NE Ephrata Grant 065770C BNSF Railway Company Quad‐County RTPO 12.20 20.67 14.68 0.00 14.94
277 SR432‐Tennant Way Longview Cowlitz 101842C Longview Switching Company Southwest Washington RTPO 48.34 16.63 26.18 ‐20.00 14.87 Industrial Way Oregon Way (SR 432/433) $85.0
278 Olaf St Harrington Lincoln 065718X BNSF Railway Company Quad‐County RTPO 10.46 22.33 15.37 0.00 14.65
279 Deno Rd Spokane Spokane 058634K BNSF Railway Company Spokane Regional Transportation Council 7.49 20.97 21.72 0.00 14.42
280 E Branch Rd Toppenish Yakima 099186S BNSF Railway Company Yakima Valley Conference of Governments 8.57 20.67 19.67 0.00 14.37
Page C‐5
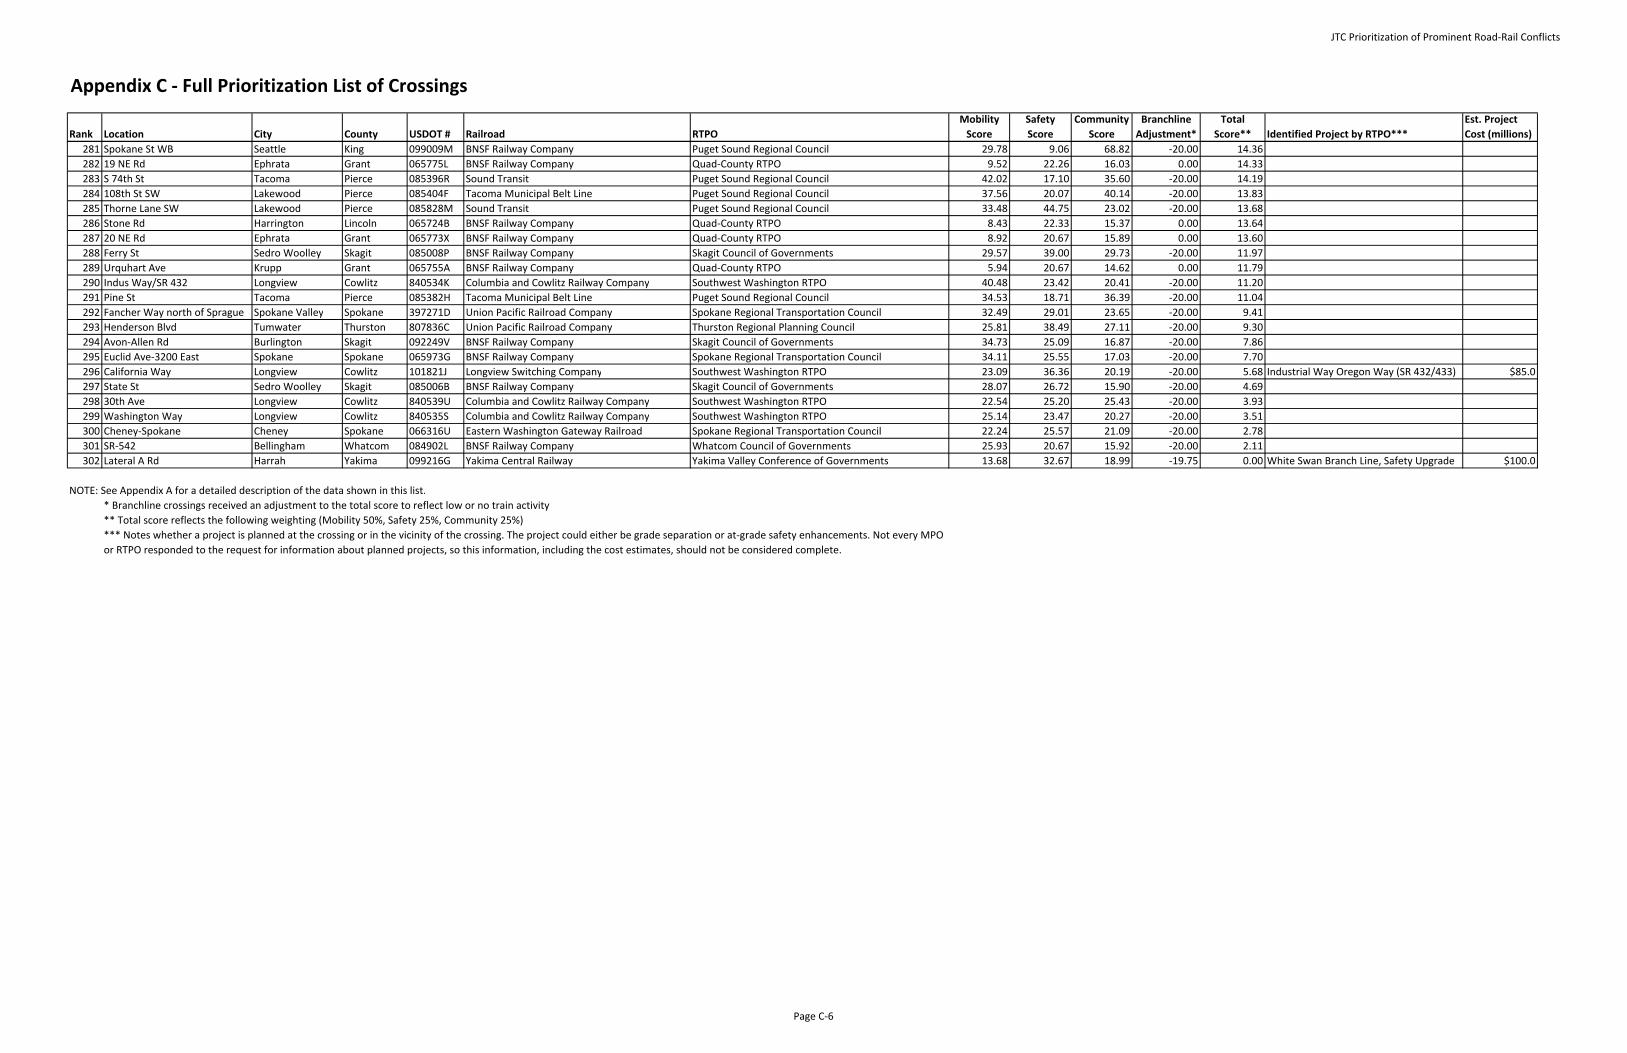
JTC Prioritization of Prominent Road‐Rail Conflicts
Appendix C ‐ Full Prioritization List of Crossings
Rank Location City County USDOT # Railroad RTPOMobility Score
SafetyScore
Community Score
Branchline Adjustment*
TotalScore** Identified Project by RTPO***
Est. Project Cost (millions)
281 Spokane St WB Seattle King 099009M BNSF Railway Company Puget Sound Regional Council 29.78 9.06 68.82 ‐20.00 14.36
282 19 NE Rd Ephrata Grant 065775L BNSF Railway Company Quad‐County RTPO 9.52 22.26 16.03 0.00 14.33
283 S 74th St Tacoma Pierce 085396R Sound Transit Puget Sound Regional Council 42.02 17.10 35.60 ‐20.00 14.19
284 108th St SW Lakewood Pierce 085404F Tacoma Municipal Belt Line Puget Sound Regional Council 37.56 20.07 40.14 ‐20.00 13.83
285 Thorne Lane SW Lakewood Pierce 085828M Sound Transit Puget Sound Regional Council 33.48 44.75 23.02 ‐20.00 13.68
286 Stone Rd Harrington Lincoln 065724B BNSF Railway Company Quad‐County RTPO 8.43 22.33 15.37 0.00 13.64
287 20 NE Rd Ephrata Grant 065773X BNSF Railway Company Quad‐County RTPO 8.92 20.67 15.89 0.00 13.60
288 Ferry St Sedro Woolley Skagit 085008P BNSF Railway Company Skagit Council of Governments 29.57 39.00 29.73 ‐20.00 11.97
289 Urquhart Ave Krupp Grant 065755A BNSF Railway Company Quad‐County RTPO 5.94 20.67 14.62 0.00 11.79
290 Indus Way/SR 432 Longview Cowlitz 840534K Columbia and Cowlitz Railway Company Southwest Washington RTPO 40.48 23.42 20.41 ‐20.00 11.20
291 Pine St Tacoma Pierce 085382H Tacoma Municipal Belt Line Puget Sound Regional Council 34.53 18.71 36.39 ‐20.00 11.04
292 Fancher Way north of Sprague Spokane Valley Spokane 397271D Union Pacific Railroad Company Spokane Regional Transportation Council 32.49 29.01 23.65 ‐20.00 9.41
293 Henderson Blvd Tumwater Thurston 807836C Union Pacific Railroad Company Thurston Regional Planning Council 25.81 38.49 27.11 ‐20.00 9.30
294 Avon‐Allen Rd Burlington Skagit 092249V BNSF Railway Company Skagit Council of Governments 34.73 25.09 16.87 ‐20.00 7.86
295 Euclid Ave‐3200 East Spokane Spokane 065973G BNSF Railway Company Spokane Regional Transportation Council 34.11 25.55 17.03 ‐20.00 7.70
296 California Way Longview Cowlitz 101821J Longview Switching Company Southwest Washington RTPO 23.09 36.36 20.19 ‐20.00 5.68 Industrial Way Oregon Way (SR 432/433) $85.0
297 State St Sedro Woolley Skagit 085006B BNSF Railway Company Skagit Council of Governments 28.07 26.72 15.90 ‐20.00 4.69
298 30th Ave Longview Cowlitz 840539U Columbia and Cowlitz Railway Company Southwest Washington RTPO 22.54 25.20 25.43 ‐20.00 3.93
299 Washington Way Longview Cowlitz 840535S Columbia and Cowlitz Railway Company Southwest Washington RTPO 25.14 23.47 20.27 ‐20.00 3.51
300 Cheney‐Spokane Cheney Spokane 066316U Eastern Washington Gateway Railroad Spokane Regional Transportation Council 22.24 25.57 21.09 ‐20.00 2.78
301 SR‐542 Bellingham Whatcom 084902L BNSF Railway Company Whatcom Council of Governments 25.93 20.67 15.92 ‐20.00 2.11
302 Lateral A Rd Harrah Yakima 099216G Yakima Central Railway Yakima Valley Conference of Governments 13.68 32.67 18.99 ‐19.75 0.00 White Swan Branch Line, Safety Upgrade $100.0
NOTE: See Appendix A for a detailed description of the data shown in this list.
** Total score reflects the following weighting (Mobility 50%, Safety 25%, Community 25%)
*** Notes whether a project is planned at the crossing or in the vicinity of the crossing. The project could either be grade separation or at‐grade safety enhancements. Not every MPO
or RTPO responded to the request for information about planned projects, so this information, including the cost estimates, should not be considered complete.
* Branchline crossings received an adjustment to the total score to reflect low or no train activity
Page C‐6

Appendix DOnline Tool Guide

(This Page is Intentionally Blank)
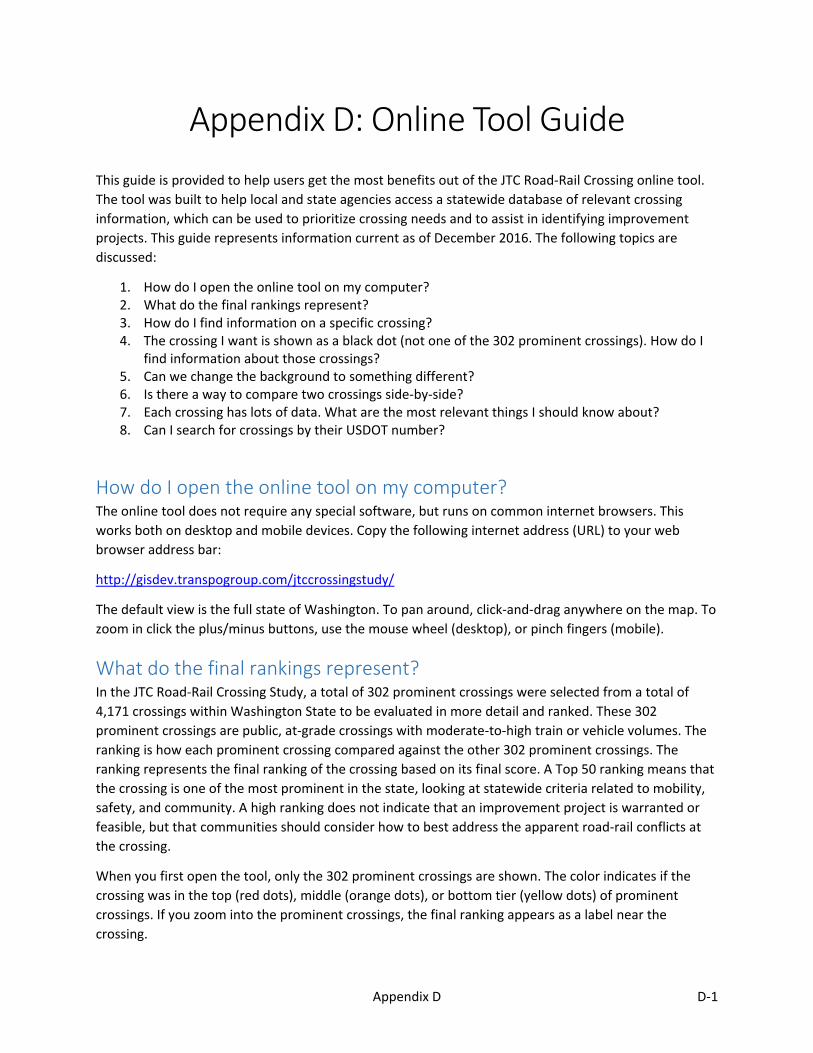
Appendix D D‐1
Appendix D: Online Tool Guide
This guide is provided to help users get the most benefits out of the JTC Road‐Rail Crossing online tool.
The tool was built to help local and state agencies access a statewide database of relevant crossing
information, which can be used to prioritize crossing needs and to assist in identifying improvement
projects. This guide represents information current as of December 2016. The following topics are
discussed:
1. How do I open the online tool on my computer? 2. What do the final rankings represent? 3. How do I find information on a specific crossing? 4. The crossing I want is shown as a black dot (not one of the 302 prominent crossings). How do I
find information about those crossings? 5. Can we change the background to something different? 6. Is there a way to compare two crossings side‐by‐side? 7. Each crossing has lots of data. What are the most relevant things I should know about? 8. Can I search for crossings by their USDOT number?
How do I open the online tool on my computer? The online tool does not require any special software, but runs on common internet browsers. This
works both on desktop and mobile devices. Copy the following internet address (URL) to your web
browser address bar:
http://gisdev.transpogroup.com/jtccrossingstudy/
The default view is the full state of Washington. To pan around, click‐and‐drag anywhere on the map. To
zoom in click the plus/minus buttons, use the mouse wheel (desktop), or pinch fingers (mobile).
What do the final rankings represent? In the JTC Road‐Rail Crossing Study, a total of 302 prominent crossings were selected from a total of
4,171 crossings within Washington State to be evaluated in more detail and ranked. These 302
prominent crossings are public, at‐grade crossings with moderate‐to‐high train or vehicle volumes. The
ranking is how each prominent crossing compared against the other 302 prominent crossings. The
ranking represents the final ranking of the crossing based on its final score. A Top 50 ranking means that
the crossing is one of the most prominent in the state, looking at statewide criteria related to mobility,
safety, and community. A high ranking does not indicate that an improvement project is warranted or
feasible, but that communities should consider how to best address the apparent road‐rail conflicts at
the crossing.
When you first open the tool, only the 302 prominent crossings are shown. The color indicates if the
crossing was in the top (red dots), middle (orange dots), or bottom tier (yellow dots) of prominent
crossings. If you zoom into the prominent crossings, the final ranking appears as a label near the
crossing.
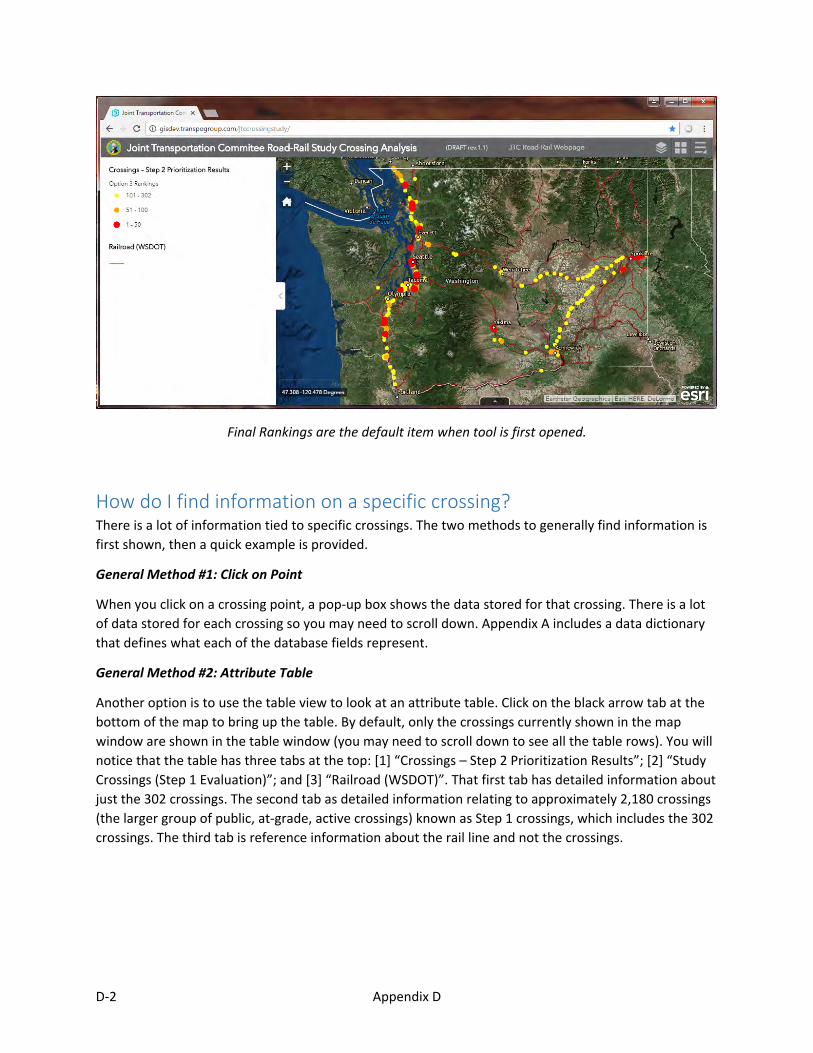
D‐2 Appendix D
Final Rankings are the default item when tool is first opened.
How do I find information on a specific crossing? There is a lot of information tied to specific crossings. The two methods to generally find information is
first shown, then a quick example is provided.
General Method #1: Click on Point
When you click on a crossing point, a pop‐up box shows the data stored for that crossing. There is a lot
of data stored for each crossing so you may need to scroll down. Appendix A includes a data dictionary
that defines what each of the database fields represent.
General Method #2: Attribute Table
Another option is to use the table view to look at an attribute table. Click on the black arrow tab at the
bottom of the map to bring up the table. By default, only the crossings currently shown in the map
window are shown in the table window (you may need to scroll down to see all the table rows). You will
notice that the table has three tabs at the top: [1] “Crossings – Step 2 Prioritization Results”; [2] “Study
Crossings (Step 1 Evaluation)”; and [3] “Railroad (WSDOT)”. That first tab has detailed information about
just the 302 crossings. The second tab as detailed information relating to approximately 2,180 crossings
(the larger group of public, at‐grade, active crossings) known as Step 1 crossings, which includes the 302
crossings. The third tab is reference information about the rail line and not the crossings.
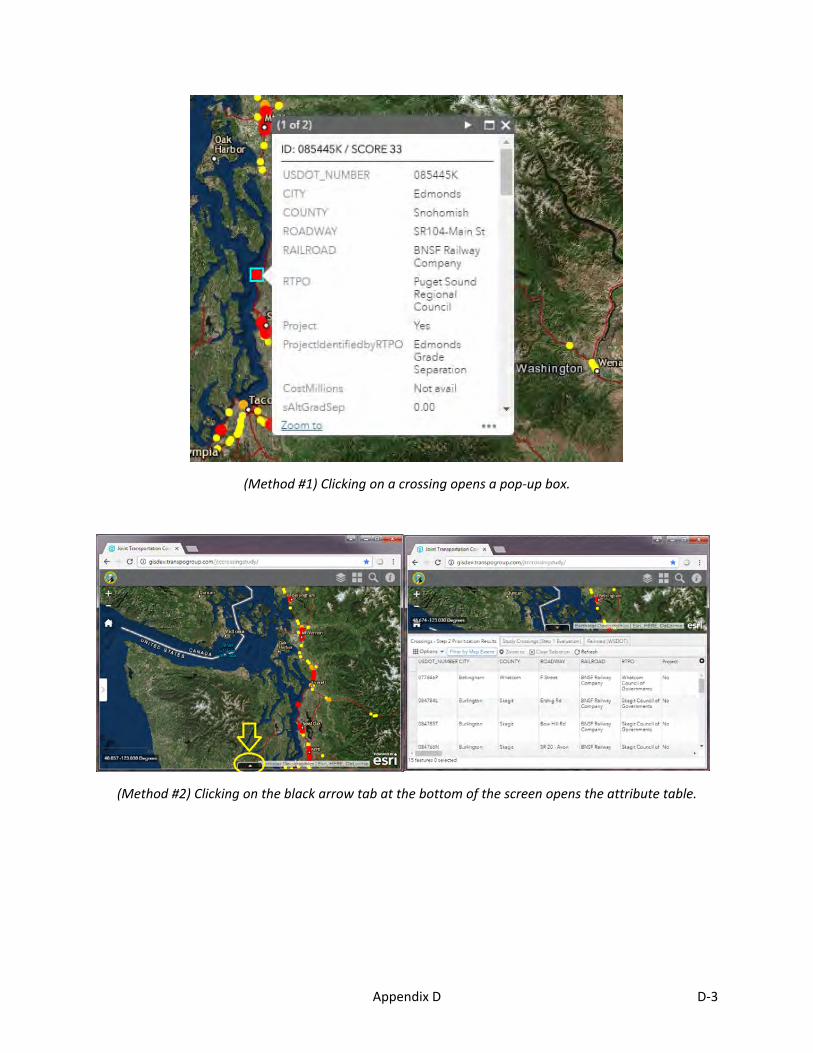
Appendix D D‐3
(Method #1) Clicking on a crossing opens a pop‐up box.
(Method #2) Clicking on the black arrow tab at the bottom of the screen opens the attribute table.
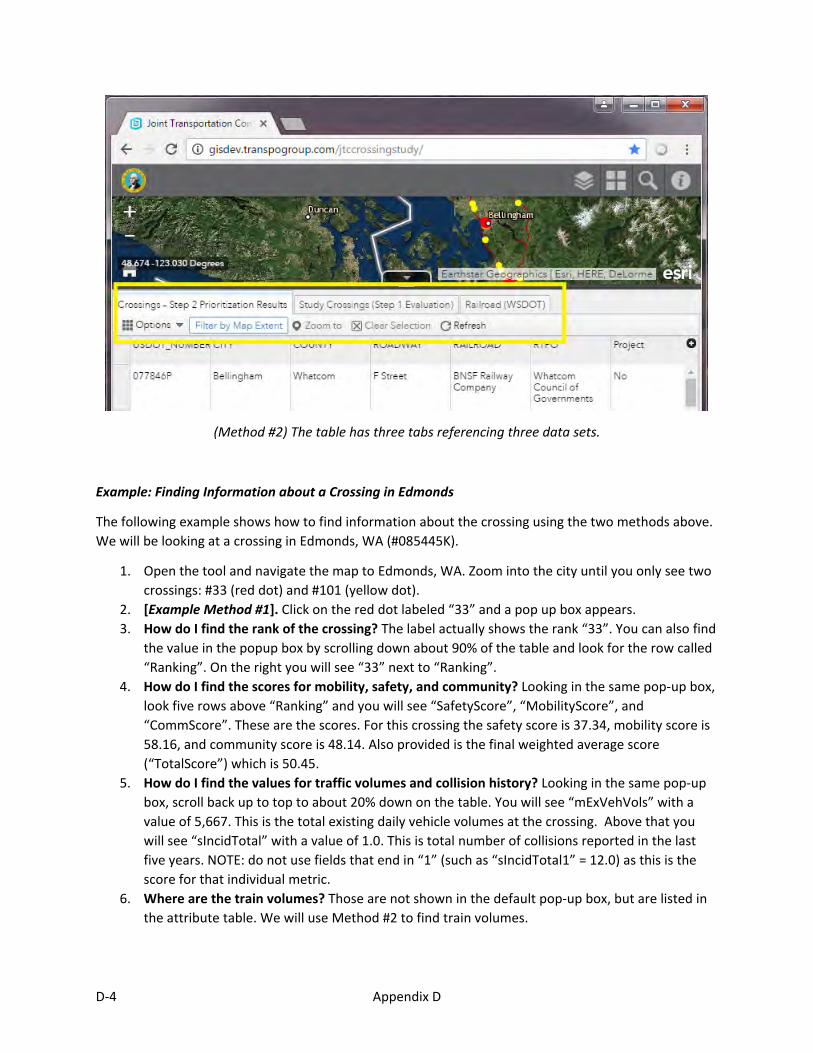
D‐4 Appendix D
(Method #2) The table has three tabs referencing three data sets.
Example: Finding Information about a Crossing in Edmonds
The following example shows how to find information about the crossing using the two methods above.
We will be looking at a crossing in Edmonds, WA (#085445K).
1. Open the tool and navigate the map to Edmonds, WA. Zoom into the city until you only see two
crossings: #33 (red dot) and #101 (yellow dot).
2. [Example Method #1]. Click on the red dot labeled “33” and a pop up box appears. 3. How do I find the rank of the crossing? The label actually shows the rank “33”. You can also find
the value in the popup box by scrolling down about 90% of the table and look for the row called
“Ranking”. On the right you will see “33” next to “Ranking”.
4. How do I find the scores for mobility, safety, and community? Looking in the same pop‐up box,
look five rows above “Ranking” and you will see “SafetyScore”, “MobilityScore”, and
“CommScore”. These are the scores. For this crossing the safety score is 37.34, mobility score is
58.16, and community score is 48.14. Also provided is the final weighted average score
(“TotalScore”) which is 50.45.
5. How do I find the values for traffic volumes and collision history? Looking in the same pop‐up
box, scroll back up to top to about 20% down on the table. You will see “mExVehVols” with a
value of 5,667. This is the total existing daily vehicle volumes at the crossing. Above that you
will see “sIncidTotal” with a value of 1.0. This is total number of collisions reported in the last
five years. NOTE: do not use fields that end in “1” (such as “sIncidTotal1” = 12.0) as this is the
score for that individual metric.
6. Where are the train volumes? Those are not shown in the default pop‐up box, but are listed in the attribute table. We will use Method #2 to find train volumes.
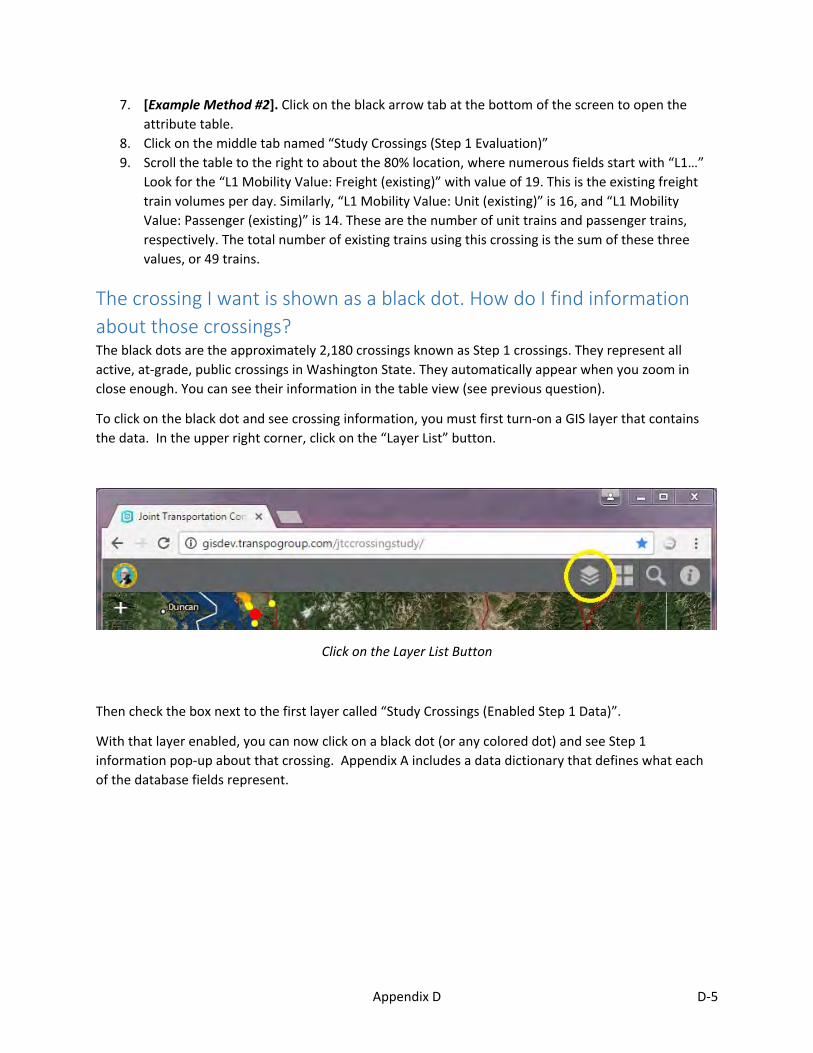
Appendix D D‐5
7. [Example Method #2]. Click on the black arrow tab at the bottom of the screen to open the
attribute table.
8. Click on the middle tab named “Study Crossings (Step 1 Evaluation)”
9. Scroll the table to the right to about the 80% location, where numerous fields start with “L1…”
Look for the “L1 Mobility Value: Freight (existing)” with value of 19. This is the existing freight
train volumes per day. Similarly, “L1 Mobility Value: Unit (existing)” is 16, and “L1 Mobility
Value: Passenger (existing)” is 14. These are the number of unit trains and passenger trains,
respectively. The total number of existing trains using this crossing is the sum of these three
values, or 49 trains.
The crossing I want is shown as a black dot. How do I find information
about those crossings? The black dots are the approximately 2,180 crossings known as Step 1 crossings. They represent all
active, at‐grade, public crossings in Washington State. They automatically appear when you zoom in
close enough. You can see their information in the table view (see previous question).
To click on the black dot and see crossing information, you must first turn‐on a GIS layer that contains
the data. In the upper right corner, click on the “Layer List” button.
Click on the Layer List Button
Then check the box next to the first layer called “Study Crossings (Enabled Step 1 Data)”.
With that layer enabled, you can now click on a black dot (or any colored dot) and see Step 1
information pop‐up about that crossing. Appendix A includes a data dictionary that defines what each
of the database fields represent.
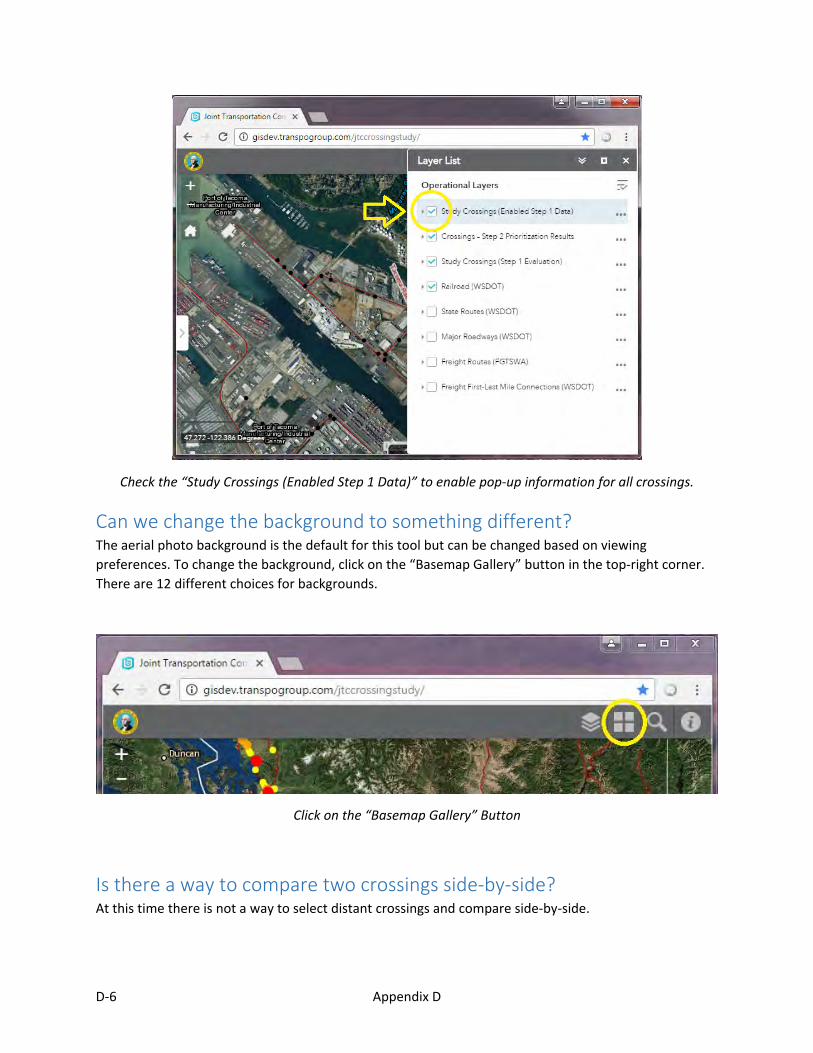
D‐6 Appendix D
Check the “Study Crossings (Enabled Step 1 Data)” to enable pop‐up information for all crossings.
Can we change the background to something different? The aerial photo background is the default for this tool but can be changed based on viewing
preferences. To change the background, click on the “Basemap Gallery” button in the top‐right corner.
There are 12 different choices for backgrounds.
Click on the “Basemap Gallery” Button
Is there a way to compare two crossings side‐by‐side? At this time there is not a way to select distant crossings and compare side‐by‐side.
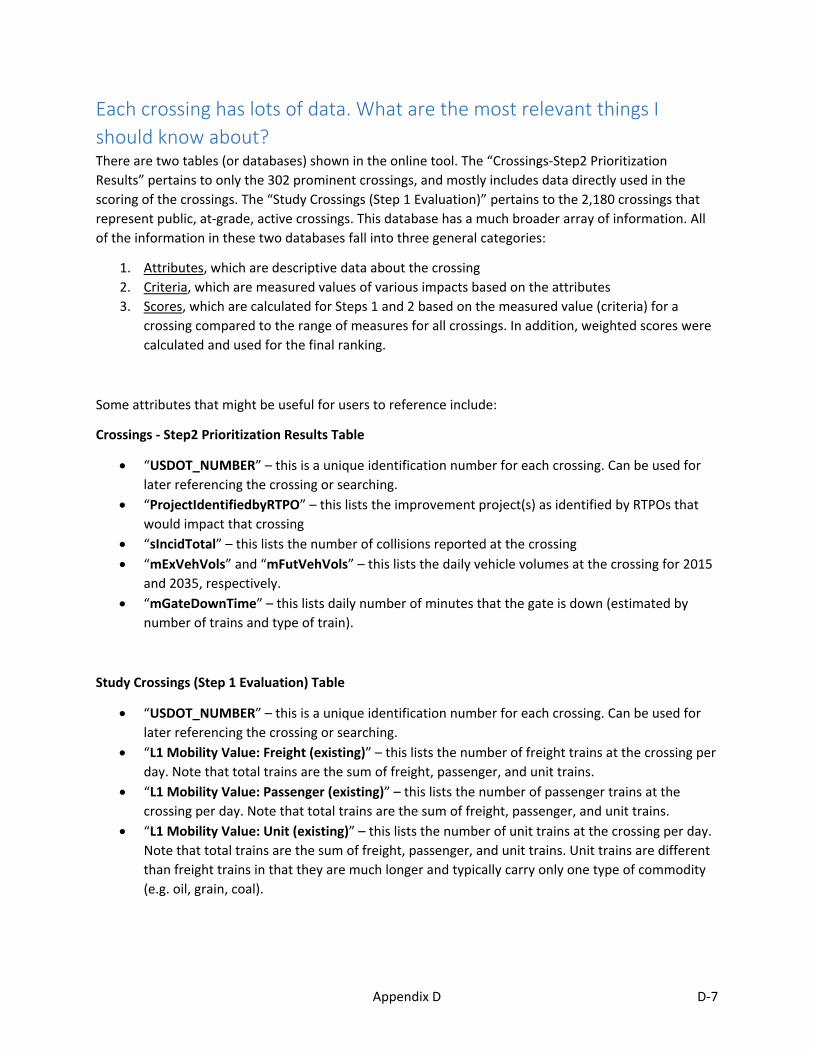
Appendix D D‐7
Each crossing has lots of data. What are the most relevant things I
should know about? There are two tables (or databases) shown in the online tool. The “Crossings‐Step2 Prioritization
Results” pertains to only the 302 prominent crossings, and mostly includes data directly used in the
scoring of the crossings. The “Study Crossings (Step 1 Evaluation)” pertains to the 2,180 crossings that
represent public, at‐grade, active crossings. This database has a much broader array of information. All
of the information in these two databases fall into three general categories:
1. Attributes, which are descriptive data about the crossing
2. Criteria, which are measured values of various impacts based on the attributes
3. Scores, which are calculated for Steps 1 and 2 based on the measured value (criteria) for a
crossing compared to the range of measures for all crossings. In addition, weighted scores were
calculated and used for the final ranking.
Some attributes that might be useful for users to reference include:
Crossings ‐ Step2 Prioritization Results Table
“USDOT_NUMBER” – this is a unique identification number for each crossing. Can be used for
later referencing the crossing or searching.
“ProjectIdentifiedbyRTPO” – this lists the improvement project(s) as identified by RTPOs that
would impact that crossing
“sIncidTotal” – this lists the number of collisions reported at the crossing
“mExVehVols” and “mFutVehVols” – this lists the daily vehicle volumes at the crossing for 2015
and 2035, respectively.
“mGateDownTime” – this lists daily number of minutes that the gate is down (estimated by
number of trains and type of train).
Study Crossings (Step 1 Evaluation) Table
“USDOT_NUMBER” – this is a unique identification number for each crossing. Can be used for
later referencing the crossing or searching.
“L1 Mobility Value: Freight (existing)” – this lists the number of freight trains at the crossing per
day. Note that total trains are the sum of freight, passenger, and unit trains.
“L1 Mobility Value: Passenger (existing)” – this lists the number of passenger trains at the
crossing per day. Note that total trains are the sum of freight, passenger, and unit trains.
“L1 Mobility Value: Unit (existing)” – this lists the number of unit trains at the crossing per day.
Note that total trains are the sum of freight, passenger, and unit trains. Unit trains are different
than freight trains in that they are much longer and typically carry only one type of commodity
(e.g. oil, grain, coal).
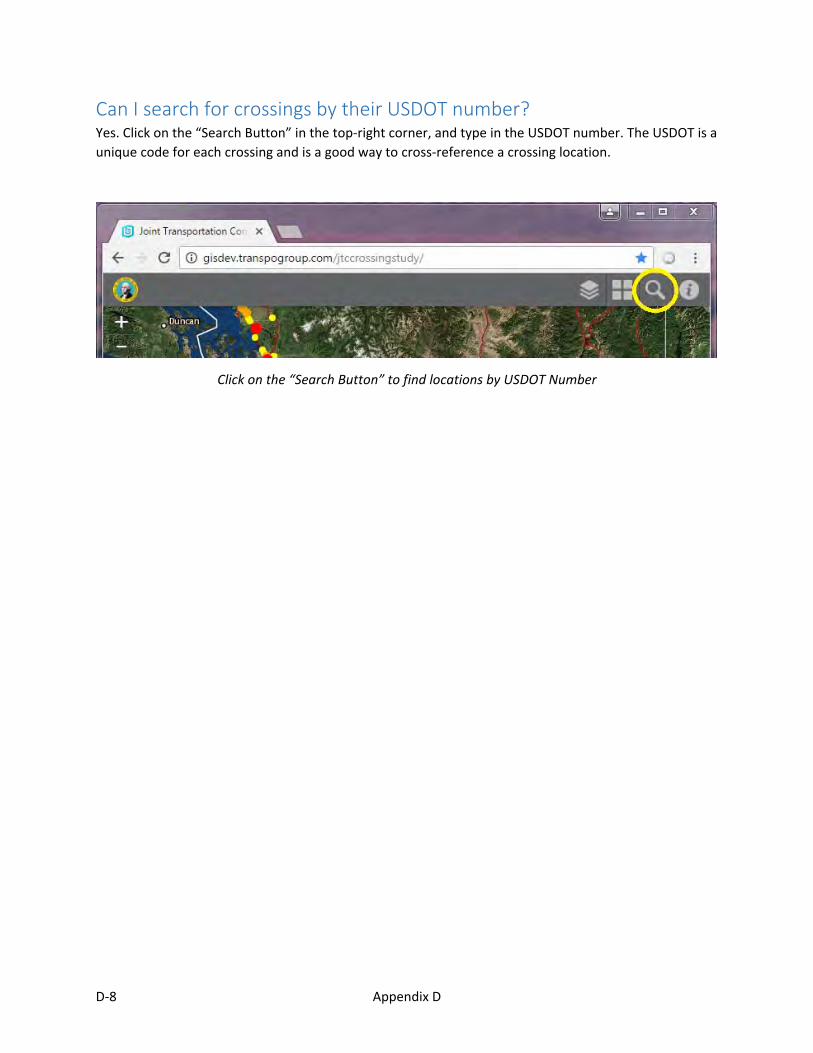
D‐8 Appendix D
Can I search for crossings by their USDOT number? Yes. Click on the “Search Button” in the top‐right corner, and type in the USDOT number. The USDOT is a
unique code for each crossing and is a good way to cross‐reference a crossing location.
Click on the “Search Button” to find locations by USDOT Number


![P oint-to- P oint T unneling P rotocol [PPTP]](https://img.pdfslide.us/doc/110x75/568145f9550346895db3036c/p-oint-to-p-oint-t-unneling-p-rotocol-pptp.jpg)