Embed Size (px)
Citation preview

Oil & Tanker Trades OutlookVolume 22, No. 12 ISSN: 1363-9617
Tanker Supply and Demand (2017f)Crude Tanker Dwt Demand Growth 5.1% Crude Tanker Fleet Growth 5.7%
Product Tanker Dwt Demand Growth 3.6% Product Tanker Fleet Growth 4.3%
1
Tanker Market Indicators (Nov-17)VLCC Newbuild Price VLCC Average 1 year TC
MR Newbuild Price MR Average 1 year TC
$81.0m
December-2017
Average Tanker Earnings Index
$27,750/day
$13,750/day$33.5m
CONTENTS
Industry News p2
Market Outlook p3
VLCC Market p4-5
Suezmax Market p6-7
Aframax Market p8-9
Product Tanker Market p10-11
Timecharter Market p12
Tanker Fleet & Orderbook pi-xii
Sale & Purchase Market p13
Crude Oil Transport Costs p14
Economic & Financial Indicators p15
Global Oil Supply p16
Global Oil Demand p17
Seaborne Crude Imports p18
Seaborne Crude Exports p19
Seaborne Products Imports p20
Seaborne Products Exports p21
Refinery Capacity p22
Tanker Safety & Oil Spills p23
Tanker Outlook p24
0
5,000
10,000
15,000
20,000
25,000
30,000
35,000
40,000
45,000
Nov
11
Nov
12
Nov
13
Nov
14
Nov
15
Nov
16
Nov
17
$/day
Rio De Janeiro
New York
Novorossiysk
Singapore
Fujairah
Philadelphia
Seria
Los Angeles
Mongstad
Fos
Primorsk
Rotterdam
Skikda
Jakarta
Augusta Agioi Theodoroi
Ras TanuraJamnagar
Lome
Sidi Kerir
Bonny Offshore
Ain SukhnaYanbu
Selection of major tanker ports
Sullom Voe
Houston
LOOP
St Eustatius
Quintero
Bonaire
Trieste
Curacao
Puerto La Cruz
San Lorenzo
Cap Limbe
Antwerp
Jeddah
Mina Al Ahmadi
Bombay
Dar Es Salaam
New York
Huizhou
Singapore
Fujairah
Philadelphia
Seria
Los AngelesChiba
Sydney
Jakarta
NingboJamnagar Kaohsiung
Kozmino
Houston
LOOP
St Eustatius
Quintero
Bonaire
Ulsan
Selection of major tanker ports
Curacao
Puerto La Cruz
San Lorenzo
Bombay
Rio De Janeiro
Clarksons Research is respected worldwide as the most authoritative provider of intelligence for the global shipping industry. Clarksons Research is part of the Clarksons group, the world’s largest provider of shipbroking and integrated shipping services. For more detail about the Clarksons group visit www.clarksons.com.
The leading online ship tracking systemTo find out more about the power of SeaNet, arrange a free trial or to subscribe, please visit www.clarksons.net/seanet
Lice
nsed
to C
lark
sons
Res
earc
h S
ampl
e. D
istr
ibut
ion
is r
estr
icte
d; p
leas
e re
mem
ber
to a
ckno
wle
dge
the
sour
ce. O
il an
d T
anke
r T
rade
Out
look
, Vol
ume
22 N
o 12
Licensed to Clarksons R
esearch Sam
ple. Distribution is restricted; please rem
ember to acknow
ledge the source. Oil and T
anker Trade O
utlook, Volum
e 22 No 12
Industry News
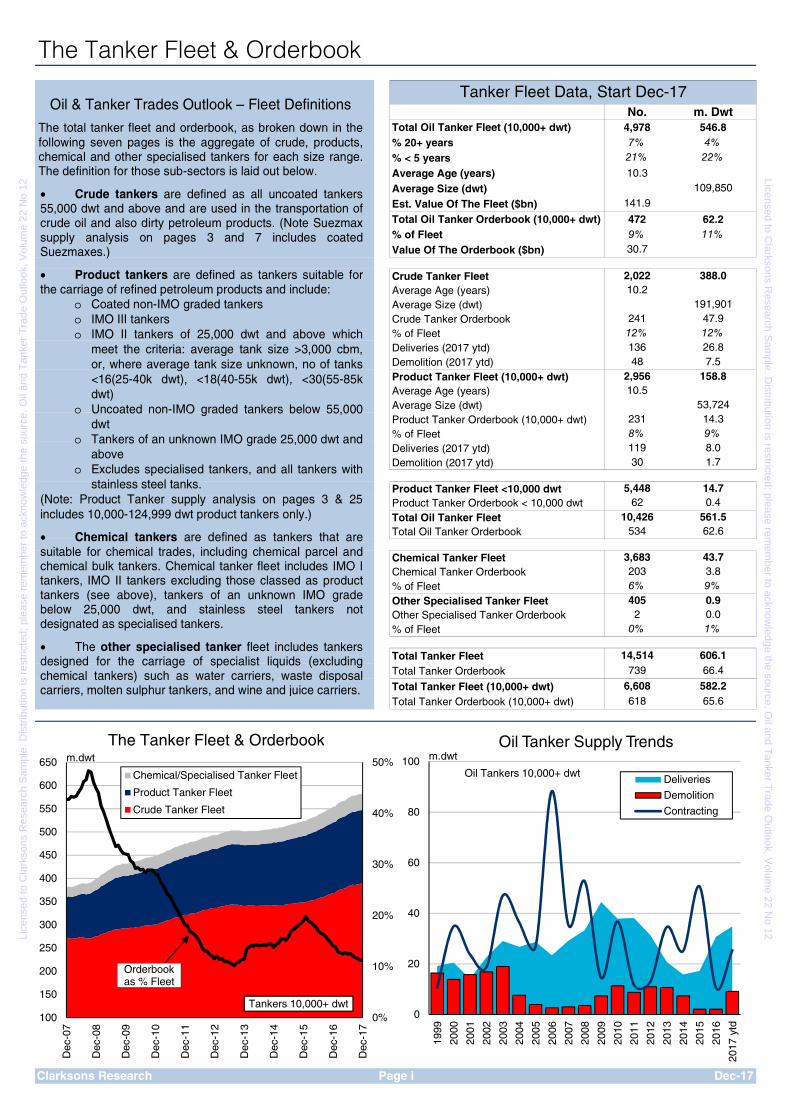
Nov-16 Nov-17Brent Blend 44.1 62.5
Short-Term 2017 2018EIA Short Term 53.9 57.3
Average F'cast* 53.6 56.9
Long-Term #IEA Current Pol. 136 2040IEA New Pol. 111 2040IEA Sus. Dev. 64 2040EIA Base Case 109 2040
Clarksons Research Page 2 Dec-17
Oil Price Trends & ForecastAverage Price, $/bbl
# IEA: November 2017, EIA: January 2017
* Average level of forecasts reported in Nov 2017.
Global oil demand growth is currently projected to have held steady at 1.6% for the second consecutive year in 2017, underpinned by grow-ing oil demand in non-OECD Asia, most notably in India and China. Oil demand growth is provisionally ex-pected to ease to 1.2% in 2018 as a result of the anticipated higher oil price environment dampening de-mand, although there is uncertainty regarding this outlook, resting heavily on the success of the OPEC-led deal to cut crude supply which has been extended until end 2018. In full year 2017, global oil supply is projected to have remained relatively steady at 96m bpd, with growth largely prevented by the OPEC-led deal to cut oil production. Following the announcement that the deal is to be extended from its original March 2018 deadline until the end of the year, supply growth is also expected to be limited in 2018, although signif-icant uncertainties remain. Neverthe-less, the expectation that the deal will be successful in its aim to buoy up oil prices is projected to result in US production rising 7% y-o-y, contrib-uting to projected growth of 2% in supply in 2018. The price of Brent crude averaged $60.3/bbl in November 2017. Prices peaked at over $64/bbl in early No-vember following a rally beginning at the start of October amidst bullish speculation that the OPEC-led supply cut deal would be extended. As this expectation was largely already fac-tored into the price of Brent, following the confirmation of the extension on the 30th November no significant fur-ther price rises were seen.
34
36
38
40
42
Jan-
13Ju
l-13
Jan-
14Ju
l-14
Jan-
15Ju
l-15
Jan-
16Ju
l-16
Jan-
17Ju
l-17
Source: OPEC
m bpd
Total OPEC Crude OutputJan 2013 - Oct 2017
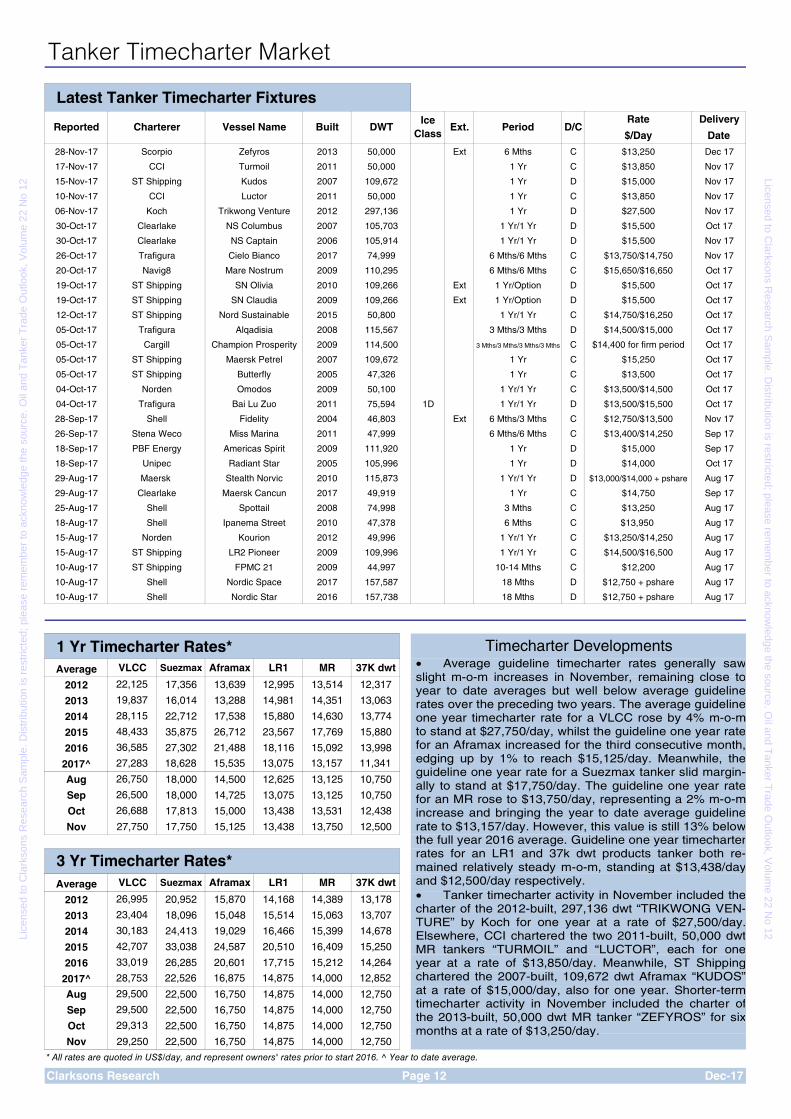
Following a meeting between OPEC and non-OPEC producers involved in the pact to cut global oil supply in Vienna on November 30th, it was announced that the group had agreed to extend the deal until the end of 2018, as had been widely anticipated prior to the official deci-sion. The group agreed to an option of reviewing the extension in June
2018, although it was reported that Saudi Arabia views the extension of the deal for the full year as being vital to rebalance the oil market. Nigeria, initially exempt from the cuts in order to allow them to regain market share lost after a series of militant attacks in 2016, agreed to cap output at 1.8m bpd. Meanwhile, Libya announced it believes it has the right to pursue its pre-revolution target of 1.6m bpd, and therefore should remain exempt from cutting its output. OPEC oil output fell to the lowest level since May in November, falling by 300,000 bpd m-o-m and bringing the group’s overall compliance to their pact to cut production to 112% for the month, an improvement on the 92% compliance seen in October. Angola saw the largest monthly drop in output of any OPEC member, with the country’s production dropping by 100,000 bpd to a 13-month low as a result of field maintenance.
2.0
2.5
3.0
3.5
4.0
4.5
Jan-
14
Jul-1
4
Jan-
15
Jul-1
5
Jan-
16
Jul-1
6
Jan-
17
Jul-1
7
Source: Iraqi Ministry Of Oil
m bpd
Total Iraqi Crude ExportsJan 2014 - Nov 2017
Iraq’s crude exports rose to over 3.8m bpd in November, their highest level in five months, despite disrup-tions to exports from the northern Kirkuk region which Iraqi forces seized from the autonomous Kurdi-stan Regional Government following a disputed independence referendum in October. Baghdad ramped up out-put at its southern fields to offset the reduction in northern exports, with shipments from southern ports aver-aging 3.5m bpd in November, 7% higher than the year to date average. Chinese commercial crude invento-ries saw their biggest drop in nearly eight years in October, with stocks falling by 669,000 bpd m-o-m to stand at 197.6m bpd. Following the draw in stocks over the month, inven-tories were left at their lowest level in over seven years. Kinder Morgan Canada’s appeal to the country’s energy regulator look-ing to sidestep some municipal per-mits required for their Trans Moun-tain pipeline expansion was granted on the 7th December, a decision
which the company hopes will help to offset construction delays the project has faced. Opposition to the expan-sion, which aims to triple the capacity of the pipeline running from Alberta to its terminus in Burnaby, B.C., to 890,000 bpd, led to its expected start-up date being pushed back from December 2019 to September 2020. At the start of December, benchmark European oil refinery margins fell to a 15 month low on the back of weak demand for European gasoline from the US, where high stocks and lower winter demand have reduced the need for imports. However, with global refinery maintenance antici-pated to increase over the next few months, traders expect a recovery in refinery margins in Q1 2018. In November, 11 tankers (>10,000 dwt) totalling 1.2m dwt were reported recycled, bringing the combined total in the year to date to 9.2m dwt. This is already more than triple the amount of tonnage sold for scrap in 2016, and is the highest value since 2013 when 10.7m dwt was scrapped.
0
20
40
60
80
100
120
Jan-
13
Jan-
14
Jan-
15
Jan-
16
Jan-
17Source: Clarksons Research
m dwt
Oil Tanker 10k+ dwt Orderbook 2013-2017 ytd
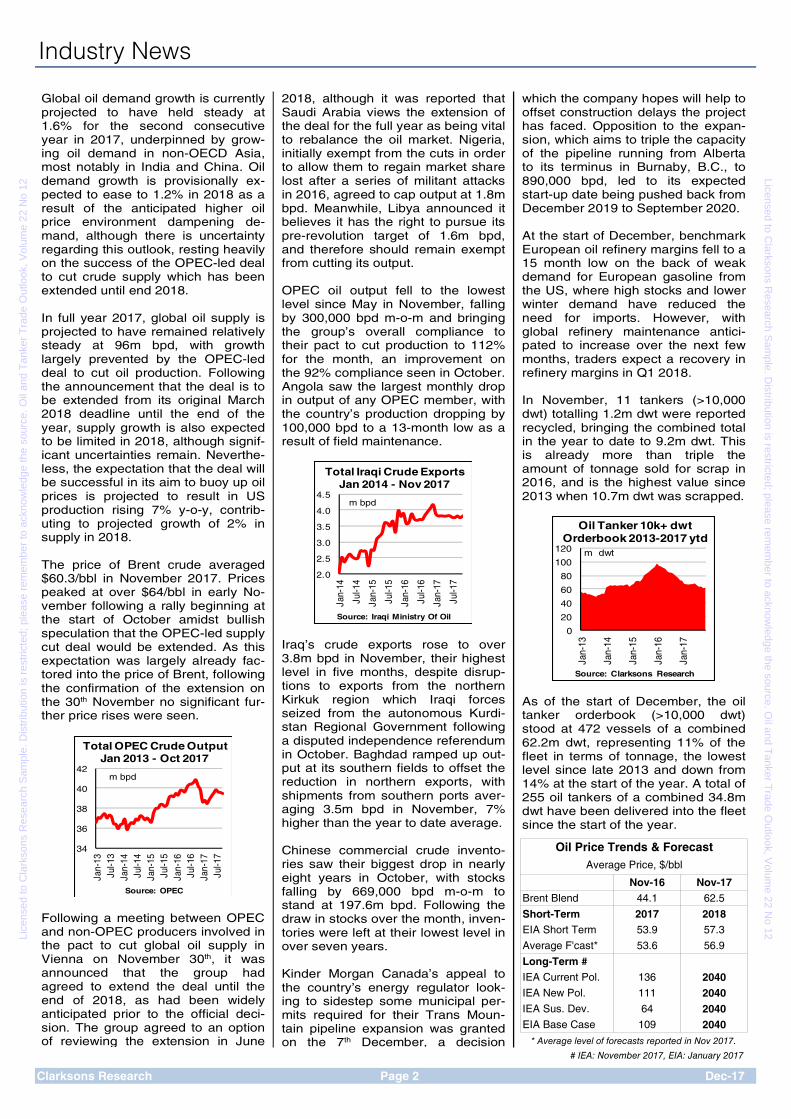
As of the start of December, the oil tanker orderbook (>10,000 dwt) stood at 472 vessels of a combined 62.2m dwt, representing 11% of the fleet in terms of tonnage, the lowest level since late 2013 and down from 14% at the start of the year. A total of 255 oil tankers of a combined 34.8m dwt have been delivered into the fleet since the start of the year.
Lice
nsed
to C
lark
sons
Res
earc
h S
ampl
e. D
istr
ibut
ion
is r
estr
icte
d; p
leas
e re
mem
ber
to a
ckno
wle
dge
the
sour
ce. O
il an
d T
anke
r T
rade
Out
look
, Vol
ume
22 N
o 12
Licensed to Clarksons R
esearch Sam
ple. Distribution is restricted; please rem
ember to acknow
ledge the source. Oil and T
anker Trade O
utlook, Volum
e 22 No 12

Market OutlookSupply-Demand Dynamics: Crude Tankers Supply-Demand Dynamics: Product Tankers
Crude Tanker Million Dwt Tanker Supply & Demand HighlightsDemand 2014 2015 2016 2017 2018
VLCC 163.1 166.4 176.2 185.0 194.8 FIRM.... 5.3%
Suezmax 52.6 54.6 56.8 60.7 63.7 FIRM.... 4.9%
Aframax 54.6 55.1 55.8 57.0 59.3 FIRM.... 3.9%
Panamax 3.5 3.4 3.1 3.1 3.1 STEADY... 0.0%
TOTAL 274.4 280.3 293.0 307.8 323.3 FIRM.... 5.0%% Change y-o-y -0.4% 2.2% 4.5% 5.1% 5.0%Demand derived from crude and DPP trade. Total includes Handysize dwt demand.
Product Tanker Million Dwt
Demand 2014 2015 2016 2017 2018
85-124,999 Dwt (LR2) 24.1 27.5 29.9 31.7 32.9 FIRM.... 3.7%
55-84,999 Dwt (LR1) 18.2 19.0 19.9 20.8 21.8 FIRM.... 4.6%
10-54,999 Dwt 69.5 73.9 75.6 77.5 80.1 FIRM.... 3.4%
TOTAL 111.8 120.3 125.4 130.0 134.7 FIRM.... 3.7%% Change y-o-y 1.5% 7.7% 4.2% 3.6% 3.7%Includes demand derived from DPP, CPP and veg oil trade.
Crude Fleet Million Dwt
Growth 2014 2015 2016 2017 2018
VLCC 189.8 192.8 207.3 220.3 229.4 FIRM.... 4.1%
Suezmax 69.2 70.6 74.1 80.4 83.8 FIRM.... 4.2%
Aframax 65.5 65.2 66.6 67.5 69.8 FIRM.... 3.5%
Panamax 6.0 5.5 5.6 5.5 5.3 SOFTER -5.2%
TOTAL 330.5 334.1 353.7 373.7 388.3 FIRM.... 3.9%% Change y-o-y 0.7% 1.1% 5.8% 5.7% 3.9%
Product Fleet Million Dwt
Growth 2014 2015 2016 2017 2018
85-124,999 Dwt (LR2) 28.1 31.0 34.4 37.4 38.1 STEADY... 2.0%
55-84,999 Dwt (LR1) 24.2 24.3 25.5 26.7 27.8 FIRM.... 4.4%
10-54,999 Dwt 81.2 86.1 90.3 92.6 94.1 STEADY... 1.6%
TOTAL 133.6 141.3 150.2 156.7 160.1 STEADY... 2.2%% Change y-o-y 3.9% 5.8% 6.3% 4.3% 2.2%
Tanker Million Dwt
Balance 2014 2015 2016 2017 2018
Total Demand 0% 4% 4% 5% 5%Total Supply 2% 2% 6% 5% 3%Note: Demand basis full year, fleet development basis end year. Product fleet definition as detailed on page 23.
Clarksons Research Page 3 Dec-17
Year-on-Year% Change
Supply/Demand
OutlookSTEADY...STEADY...
Year-on-Year% Change
Year-on-Year% Change
Year-on-Year% Change
• Despite firm tanker demand growth in the year to date, market conditions have worsened notably so far in 2017 due to rapid fleet expansion, with earnings falling y-o-y across all tanker sectors. VLCC spot earnings averaged $18,957/day in the first eleven months of the year, down 54% compared to full year 2016. Whilst a sea-sonal improvement in tanker market condi-tions is often seen in Q4, a significant pick-up in tanker earnings in the final quarter of 2017 does not appear to have material-ised, with VLCC spot earnings falling back below $10,000/day in early December. • In full year 2017, crude tanker dwt de-mand is expected to have risen by a firm 5.1%, largely supported by increased long-haul crude trade between the Atlantic Ba-sin and Asia. With OPEC’s decision in No-vember to extend their supply cut deal until end 2018, growing crude trade on long haul routes, particularly from the US, is expected to continue to support firm crude tanker dwt demand growth of 5% in 2018. • The crude tanker fleet is projected to have grown by 5.7% in full year 2017, weighing heavily on the market despite healthy demand growth. Fleet expansion is expected to slow to 3.9% in 2018, which has the potential to support a gradual im-provement in the market balance. • Product tanker dwt demand is currently expected to have expanded by 3.6% in full year 2017, supported by growing intra-Asian products trade and US products ex-ports. These factors are expected to con-tinue to drive products trade growth in 2018, with product tanker dwt demand ex-pected to grow by 3.7%. • The product tanker fleet is currently ex-pected to have expanded by a firm 4.3% in full year 2017, exerting further supply-side pressure. Fleet growth is expected to ease to 2.2% in 2018, which could start to help rebalance fundamentals.
-8%
-6%
-4%
-2%
0%
2%
4%
6%
8%
10%
12%
2008
2009
2010
2011
2012
2013
2014
2015
2016
e
2017
f
2018
f
Demand Growth
Supply Growth
-6%
-4%
-2%
0%
2%
4%
6%
8%
10%
12%
14%
16%
2008
2009
2010
2011
2012
2013
2014
2015
2016
e
2017
f
2018
f
Demand Growth
Supply Growth
Lice
nsed
to C
lark
sons
Res
earc
h S
ampl
e. D
istr
ibut
ion
is r
estr
icte
d; p
leas
e re
mem
ber
to a
ckno
wle
dge
the
sour
ce. O
il an
d T
anke
r T
rade
Out
look
, Vol
ume
22 N
o 12
Licensed to Clarksons R
esearch Sam
ple. Distribution is restricted; please rem
ember to acknow
ledge the source. Oil and T
anker Trade O
utlook, Volum
e 22 No 12

VLCC Market TrendsVLCC Market Long-Term VLCC Trends
VLCC Spot VLCC Market
Rates 2015 2016 2017^ Jun Jul Aug Sep Oct Nov This Month
280K Gulf - Europe 38 37 32 29 27 25 24 31 29 -6%270K Gulf - India 84 72 70 62 63 54 53 78 79 2%265K Gulf - S.Korea 61 57 56 49 49 39 42 64 64 -1%265K Gulf - Japan 63 59 59 51 52 42 44 67 67 -1%270K Gulf - Singapore 65 61 60 52 53 43 45 70 69 -1%280K Gulf - US Gulf 37 35 30 27 25 23 22 29 26 -9%260K WAF - India^ 5.11 3.76 2.87 2.62 2.68 2.25 2.37 3.20 3.06 -4%260K WAF - US Gulf 72 69 67 60 60 56 59 69 59 -14%260K WAF - East 64 62 62 56 55 50 52 67 70 4%275K Caribs - Singapore^ 6.85 4.73 4.00 3.37 3.16 3.20 3.66 4.15 4.45 7%^ Lump sum in million dollars
VLCC VLCC Market
Earnings* 2015 2016 2017^ Jun Jul Aug Sep Oct Nov This Month
Average Spot Earnings 64,846 41,488 18,957 15,330 13,909 8,741 8,120 21,430 18,686 -13%Spot Earnings Index 166 106 49 39 36 22 21 55 48 -13%1 Year T/C Rate (Modern)" 48,433 36,585 27,283 26,700 26,500 26,750 26,500 26,688 27,750 4%3 Year T/C Rate (Modern)" 42,707 33,019 28,753 29,275 29,500 29,500 29,500 29,313 29,250 0%
VLCC Spot VLCC Spot Demand
Demand** 2015 2016 2017^ Jun Jul Aug Sep Oct Nov This Month
MEG - China, Korea, Japan 53 52 47 53 43 38 53 62 34 -45%
MEG - Other Asia Pacific 25 23 21 24 27 15 20 21 15 -29%
MEG - India 12 14 19 17 24 25 25 14 25 79%
MEG - N. America 15 16 11 10 7 9 4 12 13 8%
Caribs - East/India 19 20 21 27 17 19 19 28 13 -54%
WAF - East 18 20 25 30 24 25 23 22 26 18%
WAF - India 9 7 6 7 6 4 7 7 4 -43%
UKC - East 3 7 7 8 6 4 5 5 6 20%
Others 16 16 18 12 17 14 17 24 18 -25%
Total Nos. 169 175 175 188 171 153 173 195 154 -21%
Total m. dwt 50.3 50.8 50.1 52.5 49.3 44.6 50.7 54.0 44.0
Clarksons Research Page 4
Average WS Average WS
SOFTER...STEADY...STEADY...
SOFTER...WEAKER...STEADY...STEADY...
WEAKER...FIRM....FIRM....
Average $/day Average $/day
WEAKER...WEAKER...FIRM....STEADY...
No of Fixtures, Avg. No of Fixtures
WEAKER!!...
FIRMER...
FIRMER...
WEAKER!!...
WEAKER!!...
WEAKER!!...
FIRMER...
^ Year to date. * Average Earnings are calculated as described in 'SIW Sources and Methods', which can be found on SIN. ** Spot demand is the average number of reported fixtures per month. "Timecharter rates represent owners' rates prior to start 2016.
Dec-17
FIRMER...
WEAKER...
WEAKER...
0
40
80
120
160
200
240
280
0
20
40
60
80
100
120
140
Nov
-15
Jan-
16
Mar
-16
May
-16
Jul-1
6
Sep
-16
Nov
-16
Jan-
17
Mar
-17
May
-17
Jul-1
7
Sep
-17
Nov
-17
US$,000/day
No. of Spot Fixtures (RHS)
VLCC Average Spot Earnings (LHS)
0
20
40
60
80
100
120
140
160
180
200
0
10
20
30
40
50
60
70
80
90
100
Nov
-07
Nov
-08
Nov
-09
Nov
-10
Nov
-11
Nov
-12
Nov
-13
Nov
-14
Nov
-15
Nov
-16
Nov
-17
US$,000/day
VLCC 1 Yr Timecharter Rate
(LHS)
N/B VLCC Price (RHS)
US$ m
5 Yr Old VLCC Price (RHS)
Lice
nsed
to C
lark
sons
Res
earc
h S
ampl
e. D
istr
ibut
ion
is r
estr
icte
d; p
leas
e re
mem
ber
to a
ckno
wle
dge
the
sour
ce. O
il an
d T
anke
r T
rade
Out
look
, Vol
ume
22 N
o 12
Licensed to Clarksons R
esearch Sam
ple. Distribution is restricted; please rem
ember to acknow
ledge the source. Oil and T
anker Trade O
utlook, Volum
e 22 No 12

VLCC Market Trends
VLCC
Balance 2014 2015 2016 2017 2018 %
DemandMEG-China, Japan, Korea 7.8 8.1 8.6 8.5 8.7 3%MEG-Other Asia/Pacific" 3.3 3.5 3.8 3.6 3.8 4%MEG-N.America 1.9 1.6 1.8 1.8 1.9 3%Caribs-China/India 1.3 1.4 1.6 1.7 1.8 7%WAF-Far East 1.2 1.2 1.3 1.5 1.7 10%WAF-India 0.4 0.5 0.5 0.4 0.4 4%Other 1.2 1.6 1.6 1.9 2.0 7%
Total, m bpd # 17.1 18.0 19.0 19.4 20.3 4%Total, m dwt ~ # 163.1 166.4 176.2 185.0 194.8 5%% growth 0.9% 2.0% 5.9% 5.0% 5.3%~Derived from crude trade above and DPP trade. "South East Asia + India.
Supply*200,000-299,999 dwt # 61.6 62.2 69.4 0.0300,000-319,999 dwt # 117.7 122.7 130.2 0.0320,000 dwt & above # 14.7 15.0 15.0 0.0
Total # 193.9 199.9 214.7 226.0 235.1 4%Combos in Oil # 1.6 1.0 0.3 0.0 0.0 #DIV/0!Laid-up # 1.5 0.6 0.3 0.3 0.3 0%Long-term Storage # 4.2 7.5 7.3 5.4 5.4 0%Active Fleet # 189.8 192.8 207.3 220.3 229.4 4%% growth 2.2% 1.6% 7.5% 6.3% 4.1%
BalanceDemand Growth 1% 2% 6% 5% 5%
Supply Growth 2% 2% 8% 6% 4%
Balance -1% 0% -2% -1% 1%"Laid-up" includes vessels reported and confirmed to be in lay-up, remaining out of service for an extended period.
VLCC S&P 3 Month
Market # 2014 2015 2016 2017^ Jun Jul Sep Oct Nov
Newbuild Prices320k newbuild ($m) # 97.0 93.5 84.5 81.0 81.0 81.0 81.0 81.0 81.0 SAME... 0%
No. of Contracts Placed 32 69 14 45 1 4 9 0 4 FIRMER... 160%Est. Investment Value ($bn) 3.1 6.6 1.2 3.7 0.1 0.3 0.7 0.0 0.4 FIRMER... 173%
Secondhand Prices310k 5yo ($m) 77.0 80.0 60.0 63.0 65.0 64.0 61.0 63.0 63.0 WEAK... -3%
300k 10yo ($m) 52.0 55.0 40.0 38.0 41.0 40.0 37.0 38.0 38.0 WEAKER... -6%
265k 15yo ($m) 29.0 38.0 24.0 22.0 22.5 22.5 21.0 22.0 22.0 WEAK... -2%
No. of Sales 80 38 22 41 2 2 1 2 4 FIRMER... 40%5 Year Old/NB Price Ratio 79% 86% 71% 78% 80% 79% 75% 78% 78% WEAK... -3%
Demolition$/ldt 450 290 300 415 360 365 410 380 415 FIRMER... 7%
VLCC Scrap Value ($m) 19.1 12.2 12.6 17.4 15.1 15.3 17.1 15.9 17.4 FIRMER... 7%
No. Scrapped 8 2 2 11 0 2 3 0 1 WEAKER!!... -33%
Fleet
Profile 2014 2015 2016 2017^ Jun Jul Sep Oct Nov 2017 2018
Fleet Total 193.9 199.9 214.7 226.0 223.5 224.7 224.8 225.7 226.0 226.0 235.1Deliveries 7.6 6.2 14.3 14.6 1.2 1.8 1.5 0.9 0.9 14.9 13.0Scrapping 2.4 0.5 0.6 3.3 0.0 0.6 0.9 0.0 0.3 3.6 3.9Contracting 9.8 21.2 4.4 14.1 0.3 1.3 2.7 0.0 1.3
Orderbook 25.7 40.7 29.5 28.7 29.5 28.6 29.2 28.3 28.7
Clarksons Research Page 5 Dec-17
*End of year figure. ^Year to date/latest price. Fleet totals in metric tonnes, net of est. conversions and misc. changes, accounting for historical and expected delivery performance.
M. Bpd / M. Dwt Forecast
Number & Value Number & Value
Aug Trend
81.0
00.0
63.0
39.0
21.5
178%
405
4
M. Dwt M. Dwt, month end
16.9
0.0
28.0
Forecast*Aug
224.1
0.6
1.2
• The VLCC market weakened in November after firming considerably in October, although earnings remained elevated relative to the period between May and September this year. Average VLCC spot earnings fell by 13% m-o-m to $18,686/day in November, bringing average spot earnings in the first eleven months of the year to $18,957/day. This value represents a 54% decline in average earnings relative to full year 2016. • In full year 2017, VLCC dwt demand is pro-jected to have grown by a robust 5.0%. De-spite an expected decline in crude trade on ex-MEG routes due to the OPEC-led supply cuts, increased long-haul crude trade between the Atlantic basin and China is expected to lend support to VLCC dwt demand growth. In 2018, VLCC dwt demand growth is projected to remain relatively firm at around 5.3%. In spite of the decision by OPEC to extend their supply cut deal until end 2018, crude trade on VLCCs in 2018 is expected to grow fairly firm-ly, with dwt demand expected to continue to be supported by rising US exports and in-creased VLCC loading capability at some US ports, alongside continued overall growth in long-haul trade between the Atlantic basin and Asia. • In full year 2017, a total of 14.9m dwt is expected to be delivered into the VLCC fleet, contributing to projected active fleet growth of 6.3%. Active VLCC fleet growth is expected to slow to 4.1% in 2018, slightly slower than pro-jected growth in VLCC demand.
Lice
nsed
to C
lark
sons
Res
earc
h S
ampl
e. D
istr
ibut
ion
is r
estr
icte
d; p
leas
e re
mem
ber
to a
ckno
wle
dge
the
sour
ce. O
il an
d T
anke
r T
rade
Out
look
, Vol
ume
22 N
o 12
Licensed to Clarksons R
esearch Sam
ple. Distribution is restricted; please rem
ember to acknow
ledge the source. Oil and T
anker Trade O
utlook, Volum
e 22 No 12

Suezmax Market TrendsSuezmax Market Long-Term Suezmax Trends
Suezmax Spot Suezmax Market
Rates 2015 2016 2017^ Jun Jul Aug Sep Oct Nov This Month
130K WAF - USAC 82 72 75 64 63 61 70 81 81 1%
130K WAF - Med 83 75 78 66 65 64 72 84 83 -2%
130K Med - Med 89 81 81 68 69 74 76 91 86 -5%
140K Black Sea - Med 90 84 86 73 73 76 83 96 91 -5%
130K Caribs - US Gulf 98 74 79 73 73 68 81 83 86 5%
130K Gulf - WC India 91 79 81 73 70 70 70 89 96 7%
130K Gulf - China 83 78 79 68 69 69 73 82 87 6%
130K Gulf - Med. 48 44 36 28 28 26 31 39 41 6%
Suezmax Suezmax Market
Earnings* 2015 2016 2017^ Jun Jul Aug Sep Oct Nov This Month
Average Spot Earnings 46,713 27,567 15,774 10,498 10,322 10,722 11,990 18,748 16,759 -11%
1 Year T/C Rate (Modern)" 35,875 27,302 18,628 18,000 18,000 18,000 18,000 17,813 17,750 0%
3 Year T/C Rate (Modern)" 33,038 26,285 22,526 22,500 22,500 22,500 22,500 22,500 22,500 0%
Suezmax Spot Suezmax Spot Demand
Demand** 2015 2016 2017^ Jun Jul Aug Sep Oct Nov This Month
WAF - Med/UKC 45 29 28 36 24 25 33 24 22 -8%WAF - N. America 7 13 13 18 14 12 18 14 16 14%WAF - East 5 7 9 11 13 9 7 10 14 40%WAF - India 5 5 4 6 7 1 4 3 0 -100%MEG - Med 28 22 23 27 36 27 36 35 33 -6%
MEG - India 11 24 33 23 24 20 31 21 26 24%
MEG - East 5 8 11 12 18 9 14 11 10 -9%
Med/Black Sea - Med 28 28 30 28 33 40 30 31 27 -13%
Caribs - N. America 14 9 11 20 12 13 21 7 16 129%
Caribs - Med 9 8 9 6 12 6 9 9 9 0%
Others 78 78 95 100 103 101 99 100 81 -19%
Total Nos. 236 230 265 287 296 263 302 265 254 -4%
Total m. dwt 35.2 33.5 39.1 41.6 44.1 39.1 41.7 40.5 36.9 -9%
Clarksons Research Page 6
Average WS Average WS
STEADY...
STEADY...
SOFTER...
SOFTER...
No of Fixtures, Avg. No of Fixtures
WEAKER...
FIRMER...
FIRM....
FIRM....
FIRM....
Average $/day Average $/day
WEAKER...
STEADY...
WEAKER...
SOFTER...
WEAKER...
STEADY...
STEADY...
FIRMER...
^ Year to date. * Average Earnings are calculated as described in 'SIW Sources and Methods', which can be found on SIN. ** Spot demand is the average number of reported fixtures per month. "Timecharter rates represent owners' rates prior to start 2016.
Dec-17
FIRM....
FIRMER...FIRMER...WEAKER!!SOFTER...
WEAKER...
WEAKER...
0
25
50
75
100
125
150
175
200
225
250
275
300
325
0
5
10
15
20
25
30
35
40
45
50
55
60
Nov
-15
Jan-
16
Mar
-16
May
-16
Jul-1
6
Sep
-16
Nov
-16
Jan-
17
Mar
-17
May
-17
Jul-1
7
Sep
-17
Nov
-17
No of Spot Fixtures (RHS)
Suezmax Average Spot Earnings (LHS)
US$,000/day
0
20
40
60
80
100
120
0
10
20
30
40
50
60
Nov
-07
Nov
-08
Nov
-09
Nov
-10
Nov
-11
Nov
-12
Nov
-13
Nov
-14
Nov
-15
Nov
-16
Nov
-17
US$,000/day
Suezmax 1 Yr Timecharter Rate
(LHS)
N/B Suezmax Price (RHS)
US$ m
5 Yr Old Suezmax Price (RHS)
Lice
nsed
to C
lark
sons
Res
earc
h S
ampl
e. D
istr
ibut
ion
is r
estr
icte
d; p
leas
e re
mem
ber
to a
ckno
wle
dge
the
sour
ce. O
il an
d T
anke
r T
rade
Out
look
, Vol
ume
22 N
o 12
Licensed to Clarksons R
esearch Sam
ple. Distribution is restricted; please rem
ember to acknow
ledge the source. Oil and T
anker Trade O
utlook, Volum
e 22 No 12

Suezmax Market Trends
Suezmax
Balance 2014 2015 2016 2017 2018 %
DemandWAF-N America 0.3 0.3 0.4 0.4 0.4 0%MEG-Med 1.0 1.1 1.4 1.4 1.5 4%Caribs-N America 0.7 0.8 0.7 0.7 0.7 1%WAF-Med/UKC 1.1 1.3 0.9 0.9 0.9 4%MEG-India 0.8 0.8 0.9 0.9 1.0 6%Med/UKC- N America 0.2 0.2 0.3 0.3 0.3 0%Med/Black Sea-UKC 0.3 0.3 0.2 0.3 0.3 -3%Med/Black Sea-Med 0.8 0.9 0.9 0.9 0.9 -2%Others 2.7 2.8 2.9 3.0 2.9 -3%
Total, m bpd # 7.7 8.3 8.6 8.8 8.9 1%Total, m dwt ~ # 52.6 54.6 56.8 60.7 63.7 5%% growth 1.2% 3.9% 4.1% 6.8% 4.9%~Derived from crude trade above and DPP trade.
Supply*125,000-159,999 dwt # 62.6 64.2 68.1 0.0160,000-199,999 dwt # 11.7 11.7 11.9 0.0
Total # 74.4 75.9 80.0 86.9 90.3 4%Combos in Oil # 0.4 0.2 0.1 0.1 0.1 0%Laid-up & Long-term Storage # 0.1 0.0 0.3 0.1 0.1 0%Shuttle # 5.4 5.5 5.7 6.5 6.5 14%Active Fleet # 69.2 70.6 74.1 80.4 83.8 4%% growth 0.7% 2.0% 5.0% 8.4% 4.2%Fleet includes coated Suezmax tankers.
BalanceDemand Growth 1% 4% 4% 7% 5%
Supply Growth 1% 2% 5% 8% 4%
Balance 1% 2% -1% -2% 1%"Laid-up" includes vessels reported and confirmed to be in lay-up, remaining out of service for an extended period.
Suezmax S&P 3 Month
Market # 2014 2015 2016 2017^ Jun Jul Sep Oct Nov
Newbuild Prices156-158K newbuild ($m) # 65.0 63.0 54.5 54.5 54.0 54.0 54.0 54.0 54.5 FIRM... 0%
No. of Contracts Placed 44 59 19 21 14 0 0 0 5 WEAKER!! -69%Est. Investment Value ($bn) 3.0 4.0 1.1 1.7 0.9 0.0 0.0 0.0 0.4 WEAKER!! -63%
Secondhand Prices160k 5yo ($m) 57.0 60.0 40.0 40.0 44.0 41.0 39.0 40.0 40.0 WEAK... -5%
150k 10yo ($m) 37.0 42.0 27.5 25.0 29.0 26.5 24.0 25.0 25.0 WEAKER... -8%
No. of Sales 35 39 17 25 4 1 0 2 4 SAME... 0%5 Year Old/NB Price Ratio 88% 95% 73% 73% 81% 76% 72% 74% 73% WEAKER... -5%
Demolition$/ldt 455 295 295 415 365 385 415 385 415 FIRM... 4%
Suezmax Scrap Value ($m) 10.0 6.5 6.7 9.5 8.2 8.3 9.4 8.7 9.5 FIRMER... 7%
No. Scrapped 7 0 1 11 1 2 1 0 2 WEAKER!! -50%
Fleet
Profile 2014 2015 2016 2017^ Jun Jul Sep Oct Nov 2017 2018
Fleet Total 74.4 75.9 80.0 87.0 85.1 85.5 86.5 87.0 87.0 86.9 90.3Deliveries 1.3 1.6 4.2 8.6 1.1 0.8 0.9 0.5 0.3 8.8 5.4Scrapping 1.1 0.0 0.1 1.7 0.1 0.3 0.1 0.0 0.3 1.9 2.1Contracting 6.9 9.3 3.0 3.1 2.1 0.0 0.0 0.0 0.7
Orderbook 11.1 18.2 15.1 9.6 11.7 11.0 9.7 9.2 9.6
Clarksons Research Page 7 Dec-17
2
415
*End of year figure. ^Year to date/latest price. Fleet totals in metric tonnes, net of est. conversions and misc. changes, accounting for historical and expected delivery performance.
M. Bpd / M. Dwt Forecast
Number & Value Number & Value
Aug Trend
54.0
Forecast*
Aug
85.7
0.6
0.5
0.3
40.0
25.0
1
10.6
74%
0.3
3
M. Dwt M. Dwt, month end
9.3
• After rising notably in October, average Suezmax spot earnings softened by 11% m-o-m in November to $16,759/day. Average Suezmax spot earnings in the first eleven months of the year stood at $15,774/day, down by 42% relative to the full year 2016 average, highlighting the difficult market conditions that have been prevalent in the year to date, largely as a result of robust fleet growth. • Suezmax dwt demand is currently expected to have expanded by a robust 6.8% in full year 2017, heavily supported by rising long-haul crude trade between the Atlantic Basin and Asia on the back of rising US and Brazilian output, alongside a recovery in Libyan output bolstering trade on ex-Med routes. In 2018, Suezmax dwt demand is still projected to grow firmly by 4.9%. Whilst the decision to extend the OPEC-led supply cuts until end 2018 could continue to limit Middle Eastern exports next year, growth in Suezmax dwt demand is expected to be supported by strong expansion in US exports to long-haul destinations such as China. • In full year 2017 the active Suezmax fleet is projected to have grown by a rapid 8.4% due to a record of 8.8m dwt expected to have been delivered into the fleet. In 2018, growth in the active Suezmax fleet is expected to slow to 4.2% as a result of an anticipated slowdown in deliveries to a more moderate total of 5.4m dwt.
Lice
nsed
to C
lark
sons
Res
earc
h S
ampl
e. D
istr
ibut
ion
is r
estr
icte
d; p
leas
e re
mem
ber
to a
ckno
wle
dge
the
sour
ce. O
il an
d T
anke
r T
rade
Out
look
, Vol
ume
22 N
o 12
Licensed to Clarksons R
esearch Sam
ple. Distribution is restricted; please rem
ember to acknow
ledge the source. Oil and T
anker Trade O
utlook, Volum
e 22 No 12

Aframax Market TrendsAframax Market Long-Term Aframax Trends
Aframax Spot Aframax Market
Rates 2015 2016 2017^ Jun Jul Aug Sep Oct Nov This Month
100K Baltic - UKC 93 82 83 71 63 60 77 96 77 -20%
100K Far East Russia - Korea~ 0.70 0.48 0.37 0.34 0.33 0.32 0.37 0.43 0.42 -3%
80K Med - Med 108 98 108 89 84 78 103 146 109 -25%
80K Med - Singapore~ 2.93 2.38 2.32 2.17 2.10 2.10 2.20 2.38 2.40 1%
80K UKC - UKC 111 106 104 100 98 90 106 120 101 -16%
80K Indonesia - Japan 113 102 102 97 86 83 102 109 113 3%
80K SE Asia - Australia 111 98 105 103 89 85 104 116 118 2%
80K Black Sea - Med 110 99 110 92 83 79 104 146 119 -18%
80K Gulf - Singapore 111 100 108 99 92 86 100 123 121 -2%
70K Caribs - US Gulf 133 107 118 95 89 96 149 128 110 -14%~ Lump sum in million dollars
Aframax Aframax Market
Earnings* 2015 2016 2017^ Jun Jul Aug Sep Oct Nov This Month
Average Spot Earnings 37,977 22,965 14,133 10,481 7,963 5,778 13,025 19,614 12,065 -38%
1 Year T/C Rate (Modern)" 26,712 21,488 15,535 15,000 14,625 14,500 14,725 15,000 15,125 1%3 Year T/C Rate (Modern)" 24,587 20,601 16,875 16,750 16,750 16,750 16,750 16,750 16,750 0%
Aframax Spot Aframax Spot Demand
Demand** 2015 2016 2017^ Jun Jul Aug Sep Oct Nov This Month
Intra Asia 64 66 61 52 73 61 59 58 39 -33%
Baltic - UKC 39 41 46 53 40 46 43 46 41 -11%
Caribs - N America 41 40 26 22 42 20 35 49 29 -41%
Med - Med 38 25 42 35 46 44 38 60 59 -2%
Black Sea - Med 23 23 29 28 29 25 23 24 30 25%
Black Sea/Med - UKC 3 3 6 5 3 8 4 3 3 0%
UKC - UKC 20 18 29 31 27 23 33 31 38 23%
MEG - East/India 10 11 15 15 7 17 11 12 6 -50%
Others 54 59 67 82 85 71 97 92 63 -32%
Total Nos. 293 285 321 323 352 315 343 375 308 -18%
Total m. dwt 29.7 28.8 32.3 33.8 35.2 30.6 34.7 36.7 29.3 -20%
Clarksons Research Page 8
Average WS Average WS
WEAKER...
WEAKER!!
WEAKER...
FIRM....
SOFTER….
STEADY...
WEAKER...
STEADY...
WEAKER...
Average $/day Average $/day
WEAKER!!STEADY...STEADY...
No of Fixtures, Avg. No of Fixtures
WEAKER!!
FIRMER...
WEAKER...
WEAKER!!
STEADY...
FIRMER...
^ Year to date. * Average Earnings are calculated as described in 'SIW Sources and Methods', which can be found on SIN. ** Spot demand is the average number of reported fixtures per month. Note: Fixtures refer to crude fixtures only. "Timecharter rates represent owners' rates prior to start 2016.
STEADY...
Dec-17
WEAKER!!
STEADY...
WEAKER!!
WEAKER...
WEAKER...
0
50
100
150
200
250
300
350
400
450
500
0
5
10
15
20
25
30
35
40
45
50
Nov
-15
Jan-
16
Mar
-16
May
-16
Jul-1
6
Sep
-16
Nov
-16
Jan-
17
Mar
-17
May
-17
Jul-1
7
Sep
-17
Nov
-17
US$,000/day
Aframax Average Spot Earnings (LHS)
No of Spot Fixtures (RHS)
0
10
20
30
40
50
60
70
80
90
0
10
20
30
40
50
60
Nov
-07
Nov
-08
Nov
-09
Nov
-10
Nov
-11
Nov
-12
Nov
-13
Nov
-14
Nov
-15
Nov
-16
Nov
-17
US$,000/day
Aframax 1 Yr Timecharter Rate
(LHS)
N/B Aframax Price (RHS)
US$ m
5 Yr Old Aframax Price (RHS)
Lice
nsed
to C
lark
sons
Res
earc
h S
ampl
e. D
istr
ibut
ion
is r
estr
icte
d; p
leas
e re
mem
ber
to a
ckno
wle
dge
the
sour
ce. O
il an
d T
anke
r T
rade
Out
look
, Vol
ume
22 N
o 12
Licensed to Clarksons R
esearch Sam
ple. Distribution is restricted; please rem
ember to acknow
ledge the source. Oil and T
anker Trade O
utlook, Volum
e 22 No 12

Aframax Market Trends
Aframax
Balance 2014 2015 2016 2017 2018 %
Crude DemandBaltic - UKC 1.3 1.4 1.5 1.6 1.6 1%UKC - UKC 2.2 2.1 2.3 2.3 2.3 0%Black Sea/Med-Med/UKC 1.5 1.5 1.3 1.5 1.5 1%Intra Asia 1.3 1.7 1.7 1.8 2.1 12%
Caribs - N America 1.5 1.4 1.4 1.2 1.1 -3%MEG - Asia/Australia 0.3 0.4 0.5 0.5 0.5 0%Others 2.4 2.2 2.3 2.3 2.2 -4%
Total, m bpd # 10.6 10.8 11.0 11.2 11.3 1%Total, m dwt ~ # 54.6 55.1 55.8 57.0 59.3 4%% growth -1.7% 0.9% 1.3% 2.2% 3.9%~Demand derived from crude trade above and DPP trade.
Supply*85,000-99,999 dwt # 8.4 8.1 7.9 0.0100,000-109,999 dwt # 55.0 57.1 60.7 0.0110,000-124,999 dwt # 33.5 34.4 36.2 0.0
Total # 96.9 99.6 104.9 108.7 111.8 3%Combos in Oil # 0.7 0.8 0.3 0.2 0.2 0%Laid-up & Long-term Storage # 0.5 0.7 0.8 0.8 0.8 0%Shuttle Tankers # 3.5 3.4 3.3 3.3 3.3 0%Products Tankers # 28.1 31.0 34.4 37.4 38.1 2%Active Crude Fleet # 65.5 65.2 66.6 67.5 69.8 3%% growth -2.6% -0.4% 2.1% 1.3% 3.5%
BalanceDemand Growth -2% 1% 1% 2% 4%Supply Growth -3% 0% 2% 1% 3%
Balance 1% 1% -1% 1% 0%
Aframax S&P 3 Month
Market # 2014 2015 2016 2017^ Jun Jul Sep Oct Nov
Newbuild Prices113-115K newbuild ($m) # 54.0 52.0 44.5 44.0 43.0 43.0 43.0 43.0 44.0 FIRM... 1%
No. of Contracts Placed 28 104 18 49 14 4 5 0 2 WEAKER!! -61%Est. Investment Value ($bn) 1.5 5.5 0.9 2.2 0.6 0.2 0.2 0.0 0.1 WEAKER!! -61%
Secondhand Prices105K 5yo, d/h ($m) 42.0 46.0 29.0 30.0 31.0 31.0 30.0 30.0 30.0 WEAK... -2%
105K 10yo, d/h ($m) 27.0 31.0 18.0 18.0 20.0 20.0 20.0 20.0 18.0 WEAK... -3%
95-97k 15 year old ($m) 14.0 18.0 13.0 10.0 12.0 12.0 10.0 10.0 10.0 WEAKER!! -17%
No. of Sales 72 46 37 35 3 2 2 3 3 WEAKER!! -11%5 Year Old/NB Price Ratio 78% 88% 65% 68% 72% 72% 70% 70% 68% WEAK... -3%
Demolition$/ldt 455 295 295 415 365 385 415 385 415 FIRM... 4%
Aframax Scrap Value ($m) 7.5 5.0 4.9 7.1 6.2 6.6 7.1 6.6 7.1 FIRM... 4%
No. Scrapped 22 3 6 29 3 4 3 4 5 WEAKER... -8%
Fleet
Profile 2014 2015 2016 2017^ Jun Jul Sep Oct Nov 2017 2018
Fleet Total 96.9 99.6 104.9 108.7 108.1 108.6 109.1 108.9 108.7 108.7 111.8Deliveries 1.9 3.6 5.9 7.1 0.7 0.9 0.9 0.2 0.3 7.5 6.5Scrapping 2.1 0.3 0.6 3.0 0.3 0.4 0.3 0.4 0.5 3.4 3.5Contracting 3.1 11.7 2.1 5.6 1.6 0.5 0.6 0.0 0.2
Orderbook 12.6 20.6 16.1 14.4 16.5 16.0 14.8 14.6 14.4
Clarksons Research Page 9 Dec-17
*End of year figure. ^Year to date/latest price. Fleet totals in metric tonnes, net of est. conversions and misc. changes, accounting for historical and expected delivery performance.
M. Bpd / M. Dwt Forecast
Number & Value Number & Value
Aug Trend
43.0
0
"Laid-up" includes vessels reported and confirmed to be in lay-up, remaining out of service for an extended period.
Forecast*
15.3
0.0
30.0
20.0
12.0
4
415
0.0
108.5
0.7
0.6
M. Dwt M. Dwt, month end
70%
7.1
6
Aug
• In November, average Aframax spot earnings fell by 38% m-o-m to stand at $12,065/day. Although this value still represents an improvement relative to mid- 2017 when earnings dipped below $6,000/day, average Aframax spot earnings in the first eleven months of the year stood at $14,133/day, remaining relatively suppressed historically. • Crude Aframax dwt demand is currently expected to have grown by 2.2% in full year 2017, supported by expansion in intra-Asian and cross-Med crude trade. However, Aframax dwt demand growth is expected to be limited by declining trade on the Caribs-North America route as a result of lower Venezuelan exports. Caribs-North American crude trade is anticipated to decline further in 2018, although growing US crude exports alongside another year of firm intra-Asian crude trade growth, partly on the back of rising Chinese imports of Russian crude, is projected to support relatively healthy Aframax dwt demand growth of 3.9%. • In full year 2017, 3.7m dwt of crude Aframax tonnage is expected to have been delivered into the fleet, the highest volume for six years. However, projected scrapping totalling a relatively firm 2.6m dwt is expected to limit growth in the active crude Aframax fleet to 1.3%. In 2018, growth in the active crude Aframax fleet is expected to reach 3.5%.
Lice
nsed
to C
lark
sons
Res
earc
h S
ampl
e. D
istr
ibut
ion
is r
estr
icte
d; p
leas
e re
mem
ber
to a
ckno
wle
dge
the
sour
ce. O
il an
d T
anke
r T
rade
Out
look
, Vol
ume
22 N
o 12
Licensed to Clarksons R
esearch Sam
ple. Distribution is restricted; please rem
ember to acknow
ledge the source. Oil and T
anker Trade O
utlook, Volum
e 22 No 12

Product Tanker Market TrendsProducts Tanker Market Long-Term Product Tanker Trends
Clean Spot Clean Market
Rates 2015 2016 2017^ Jun Jul Aug Sep Oct Nov This Month
LR2 Gulf - Japan 75K 106 92 105 88 101 117 118 121 119 -2%LR1 Gulf - Japan 55K 118 100 119 109 115 127 137 121 125 4%MR USG - UKC 38K 101 83 103 122 96 109 85 76 130 70%MR UKC - USAC 37K 140 105 137 137 123 117 146 109 118 8%MR WC India - Japan 35K 124 107 145 130 135 146 164 164 173 5%Handy Med - Med 30K 163 135 153 138 129 118 159 154 143 -7%Dirty Med - USG 55K 124 103 118 115 106 108 114 111 116 4%
Product Average $/day Product Market
Earnings* 2015 2016 2017^ Jun Jul Aug Sep Oct Nov This Month
Clean 'MR' Spot Earnings 21,444 12,124 10,008 9,895 8,980 9,652 10,998 8,924 10,113 13%Clean 'Handy' Spot Earnings 22,094 8,962 6,730 4,596 3,325 1,223 6,681 6,201 4,094 -34%Dirty Ave. Spot Earnings 26,548 15,388 9,865 9,562 7,902 7,143 8,293 7,612 7,190 -6%LR1 74,000 dwt 1 Yr T/C" 23,567 18,116 13,075 13,250 13,000 12,625 13,075 13,438 13,438 0%MR 47-48,000 dwt 1 Yr T/C" 17,769 15,092 13,157 13,275 13,250 13,125 13,125 13,531 13,750 2%
Product Spot Product Spot Demand
Demand** 2015 2016 2017^ Jun Jul Aug Sep Oct Nov This Month
Intra - Asia 174 169 127 54 163 114 69 150 228 52%
MEG - East 67 79 83 90 96 73 65 78 72 -8%
Intra - MEG 48 54 53 51 46 58 55 53 50 -6%
Transatlantic 56 76 79 96 106 121 60 54 62 15%
Med - Med 66 74 110 109 116 89 119 105 109 4%
USG - S. America 43 57 58 82 50 55 38 56 64 14%
Baltic - UKC 39 45 53 49 43 48 58 46 46 0%
India - East 25 36 48 44 48 55 58 53 44 -17%
Black Sea - Med 24 33 43 47 40 34 50 39 51 31%
UKC - WAF 20 23 31 39 24 25 18 22 21 -5%
Others 292 346 361 339 359 390 343 371 364 -2%
Total Nos. 854 992 1047 1000 1091 1062 933 1027 1111 8%
Total m. dwt 49.1 55.9 58.1 55.1 60.8 59.9 52.3 56.9 62.0 9%
Clarksons Research Page 10
FIRMER...
^ Year to date. * Average Earnings are calculated as described in 'SIW Sources and Methods', which can be found on the Shipping Intelligence Network. ** Spot demand is the average number of reported clean products fixtures per month. "Timecharter rates represent owners' rates prior to start 2016.
Dec-17
STEADY...
FIRMER...
FIRMER...
No of Fixtures, Avg. No of Fixtures
SOFTER...
SOFTER...
SOFTER...
WEAKER...
FIRM....
STEADY...
FIRMER...
FIRMER...
FIRMER...WEAKER!!
STEADY...
FIRM....
SOFTER...
STEADY...
FIRMER...
Average WS Average WS
STEADY...FIRM....FIRMER...FIRMER...FIRM....SOFTER...
Average $/day
250
500
750
1000
1250
1500
1750
2000
0
5
10
15
20
25
30
35
Nov
-15
Jan-
16
Mar
-16
May
-16
Jul-1
6
Sep
-16
Nov
-16
Jan-
17
Mar
-17
May
-17
Jul-1
7
Sep
-17
Nov
-17
US$,000/day
Clean MR Spot Earnings (LHS)
No of Clean & Dirty Spot Fixtures (RHS)
Dirty Average Spot Earnings (LHS)
0
10
20
30
40
50
60
0
10
20
30
40
50
60
Nov
-07
Nov
-08
Nov
-09
Nov
-10
Nov
-11
Nov
-12
Nov
-13
Nov
-14
Nov
-15
Nov
-16
Nov
-17
US$,000/day
N/B MR Price (RHS)
5 Yr Old MR Price (RHS)
LR1 1 Yr Timecharter Rate
(LHS)MR 1 Yr Timecharter Rate
(LHS)
US$ m
Lice
nsed
to C
lark
sons
Res
earc
h S
ampl
e. D
istr
ibut
ion
is r
estr
icte
d; p
leas
e re
mem
ber
to a
ckno
wle
dge
the
sour
ce. O
il an
d T
anke
r T
rade
Out
look
, Vol
ume
22 N
o 12
Licensed to Clarksons R
esearch Sam
ple. Distribution is restricted; please rem
ember to acknow
ledge the source. Oil and T
anker Trade O
utlook, Volum
e 22 No 12

Product Tanker Market Trends
Products
Balance 2014 2015 2016 2017 2018 %
DemandIntra Asia" 3.5 3.7 4.0 4.2 4.3 3%Intra Europe/Baltic/Med 5.2 5.4 5.3 5.3 5.4 2%USG-S America 1.8 2.0 2.2 2.4 2.6 6%Transatlantic^ 1.7 1.7 1.7 1.6 1.6 1%Other 8.5 9.4 10.0 10.3 10.6 3%
Total, m bpd ~ 20.7 22.1 23.1 23.8 24.5 3%Total, m dwt ** # 111.8 120.3 125.4 130.0 134.7 4%% growth 1.5% 7.7% 4.2% 3.6% 3.7%"Includes Japan, Korea, Australia, India, China and other non-OECD Asian countries. ^both directions.
Supply* 10,000-54,999 dwt # 81.2 86.1 90.3 92.6 94.1 2%55,000-84,999 dwt # 24.2 24.3 25.5 26.7 27.8 4% 84,000-124,999 dwt # 28.1 31.0 34.4 37.4 38.1 2%
Total # 133.6 141.3 150.2 156.7 160.1 2%Combos in Oil # 0.0 0.0 0.0 0.0 0.0 0%Laid-up # 0.7 0.6 0.3 0.3 0.3 -4%Long-term Storage # 0.0 0.3 0.4 0.4 0.4 0%Active Fleet # 132.9 140.5 149.6 156.0 159.4 2%% growth 4.0% 5.8% 6.5% 4.3% 2.2%
BalanceDemand Growth 2% 8% 4% 4% 4%
Supply Growth 4% 6% 6% 4% 2%
Balance -2% 2% -2% -1% 1%
Products S&P
Market # 2014 2015 2016 2017^ Jun Jul Aug Sep Oct Nov
Newbuild Prices47-51K newbuild ($m) # 36.8 35.5 32.5 33.5 33.5 33.5 33.5 33.5 33.5 SAME... 0%
No. of Contracts Placed 120 189 32 84 20 20 3 0 1 WEAKER!! -91%Est. Investment Value ($bn) 4.3 6.8 1.1 2.8 0.7 0.7 0.1 0.0 0.0 WEAKER!! -91%
Secondhand Prices47K 5yo ($m) 25.0 29.0 22.0 24.0 25.0 24.0 24.0 24.0 24.0 WEAK... -1%
45K 10yo ($m) 16.0 19.5 15.5 16.3 16.0 16.0 16.3 16.3 16.3 FIRM... 2%
45K 15yo ($m) 10.0 12.0 10.0 9.0 9.0 9.0 9.0 9.0 9.0 SAME... 0%
No. of Sales 137 117 84 93 9 5 6 8 6 WEAKER!! -20%5 Year Old/NB Price Ratio 68% 82% 68% 72% 75% 72% 72% 72% 72% WEAK... -1%
Demolition$/ldt 455 295 295 415 365 385 415 385 415 FIRM... 4%
MR Scrap Value ($m) 4.2 2.9 2.8 3.9 3.4 3.6 3.9 3.6 3.9 FIRM... 4%
No. Scrapped 39 27 20 30 4 1 2 3 6 WEAKER!! -15%
Fleet
Profile# 2014 2015 2016 2017^ Jun Jul Aug Sep Oct Nov 2017 2018
Fleet Total 133.6 141.3 150.1 156.3 154.1 155.1 156.1 156.3 156.3 156.7 160.1Deliveries 6.5 8.8 9.9 8.0 0.8 1.0 0.8 0.4 0.6 8.6 5.7Scrapping 1.4 0.8 0.8 1.7 0.2 0.0 0.1 0.2 0.4 2.1 2.3Contracting 7.0 12.0 2.1 5.8 1.8 1.2 0.1 0.0 0.1
Orderbook 24.2 25.9 16.9 14.3 16.6 16.8 15.3 14.9 14.3
Clarksons Research Page 11 Dec-17
*End of year figure. ^ Year to date/latest price. Fleet totals in metric tonnes, net of est. conversions, and misc. changes, accounting for historical and expected delivery performance. #The product tanker fleet, as shown on this page and on page 3, includes some IMO II graded tankers as well as all IMO III graded vessels and all coated tankers; for full specification of the product tanker fleet see page 23.
M. Dwt M. Dwt, month end Forecast*
415
8
0.8
0.5
0.1
16.1
0.1
23.5
155.4
16.0
9.0
11
3.9
70%
Trend
33.5
3
M. Bpd / M. Dwt Forecast
Number & Value Number & Value 3 Month
**Product tanker demand derived from DPP, CPP and veg oil trade. ~ Includes all oil petroleum products trade. "Laid-up" includes vessels reported and confirmed to be in lay-up, remaining out of service for an extended period.
• Average clean MR spot earnings increased by 13% m-o-m in November to reach $10,113/day. This represents the highest level since April, with the exception of September when Hurricane Harvey led to a temporarily much tighter MR market. Overall, average clean MR earnings in the first eleven months of the year remained suppressed relative to the previous four years, standing at $10,008/day. • In full year 2017, product tanker dwt demand is projected to have grown by 3.6%, supported by growing products trade on intra-Asian and ex-USG routes. Products exports out of the USG are also expected to expand firmly in 2018 as US refinery capacity grows, with continued firm trade growth expected on routes to Latin America as refinery sectors in some countries in the region continue to struggle, supporting projected product tanker dwt demand growth of 3.7%. Products imports are also expected to grow into other developing regions including non-OECD Asia, the Middle East and Africa. • In full year 2017, the active product tanker fleet is expected to have expanded by a firm 4.3%, with 8.6m dwt projected to be delivered. Supply side pressure could potentially start to ease in 2018, with product tanker fleet growth expected to slow to 2.2%.
Lice
nsed
to C
lark
sons
Res
earc
h S
ampl
e. D
istr
ibut
ion
is r
estr
icte
d; p
leas
e re
mem
ber
to a
ckno
wle
dge
the
sour
ce. O
il an
d T
anke
r T
rade
Out
look
, Vol
ume
22 N
o 12
Licensed to Clarksons R
esearch Sam
ple. Distribution is restricted; please rem
ember to acknow
ledge the source. Oil and T
anker Trade O
utlook, Volum
e 22 No 12
Tanker Timecharter Market
Latest Tanker Timecharter FixturesRate Delivery
$/Day Date
28-Nov-17 2013 Ext 6 Mths C $13,250 Dec 17
17-Nov-17 2011 1 Yr C $13,850 Nov 17
15-Nov-17 2007 1 Yr D $15,000 Nov 17
10-Nov-17 2011 1 Yr C $13,850 Nov 17
06-Nov-17 2012 1 Yr D $27,500 Nov 17
30-Oct-17 2007 1 Yr/1 Yr D $15,500 Oct 17
30-Oct-17 2006 1 Yr/1 Yr D $15,500 Nov 17
26-Oct-17 2017 6 Mths/6 Mths C $13,750/$14,750 Nov 17
20-Oct-17 2009 6 Mths/6 Mths C $15,650/$16,650 Oct 17
19-Oct-17 2010 Ext 1 Yr/Option D $15,500 Oct 17
19-Oct-17 2009 Ext 1 Yr/Option D $15,500 Oct 17
12-Oct-17 2015 1 Yr/1 Yr C $14,750/$16,250 Oct 17
05-Oct-17 2008 3 Mths/3 Mths D $14,500/$15,000 Oct 17
05-Oct-17 2009 3 Mths/3 Mths/3 Mths/3 Mths C $14,400 for firm period Oct 17
05-Oct-17 2007 1 Yr C $15,250 Oct 17
05-Oct-17 2005 1 Yr C $13,500 Oct 17
04-Oct-17 2009 1 Yr/1 Yr C $13,500/$14,500 Oct 17
04-Oct-17 2011 1 Yr/1 Yr D $13,500/$15,500 Oct 17
28-Sep-17 2004 Ext 6 Mths/3 Mths C $12,750/$13,500 Nov 17
26-Sep-17 2011 6 Mths/6 Mths C $13,400/$14,250 Sep 17
18-Sep-17 2009 1 Yr D $15,000 Sep 17
18-Sep-17 2005 1 Yr D $14,000 Oct 17
29-Aug-17 2010 1 Yr/1 Yr D $13,000/$14,000 + pshare Aug 17
29-Aug-17 2017 1 Yr C $14,750 Sep 17
25-Aug-17 2008 3 Mths C $13,250 Aug 17
18-Aug-17 2010 6 Mths C $13,950 Aug 17
15-Aug-17 2012 1 Yr/1 Yr C $13,250/$14,250 Aug 17
15-Aug-17 2009 1 Yr/1 Yr C $14,500/$16,500 Aug 17
10-Aug-17 2009 10-14 Mths C $12,200 Aug 17
10-Aug-17 2017 18 Mths D $12,750 + pshare Aug 17
10-Aug-17 2016 18 Mths D $12,750 + pshare Aug 17
1 Yr Timecharter Rates*Average VLCC Suezmax Aframax LR1 MR 37K dwt
2012 22,125 17,356 13,639 12,995 13,514 12,317
2013 19,837 16,014 13,288 14,981 14,351 13,063
2014 28,115 22,712 17,538 15,880 14,630 13,774
2015 48,433 35,875 26,712 23,567 17,769 15,880
2016 36,585 27,302 21,488 18,116 15,092 13,998
2017^ 27,283 18,628 15,535 13,075 13,157 11,341
Aug 26,750 18,000 14,500 12,625 13,125 10,750
Sep 26,500 18,000 14,725 13,075 13,125 10,750
Oct 26,688 17,813 15,000 13,438 13,531 12,438
Nov 27,750 17,750 15,125 13,438 13,750 12,500
Average VLCC Suezmax Aframax LR1 MR 37K dwt
2012 26,995 20,952 15,870 14,168 14,389 13,178
2013 23,404 18,096 15,048 15,514 15,063 13,707
2014 30,183 24,413 19,029 16,466 15,399 14,678
2015 42,707 33,038 24,587 20,510 16,409 15,250
2016 33,019 26,285 20,601 17,715 15,212 14,264
2017^ 28,753 22,526 16,875 14,875 14,000 12,852
Aug 29,500 22,500 16,750 14,875 14,000 12,750
Sep 29,500 22,500 16,750 14,875 14,000 12,750
Oct 29,313 22,500 16,750 14,875 14,000 12,750
Nov 29,250 22,500 16,750 14,875 14,000 12,750
* All rates are quoted in US$/day, and represent owners' rates prior to start 2016. ^ Year to date average.
Clarksons Research Page 12
Timecharter Developments
3 Yr Timecharter Rates*
Dec-17
Shell Nordic Space 157,587
Shell Nordic Star 157,738
ST Shipping LR2 Pioneer 109,996
ST Shipping FPMC 21 44,997
Shell Ipanema Street 47,378
Norden Kourion 49,996
Clearlake Maersk Cancun 49,919
Shell Spottail 74,998
Unipec Radiant Star 105,996
Maersk Stealth Norvic 115,873
Stena Weco Miss Marina 47,999
PBF Energy Americas Spirit 111,920
Trafigura Bai Lu Zuo 75,594 1D
Shell Fidelity 46,803
ST Shipping Butterfly 47,326
Norden Omodos 50,100
Cargill Champion Prosperity 114,500
ST Shipping Maersk Petrel 109,672
ST Shipping Nord Sustainable 50,800
Trafigura Alqadisia 115,567
ST Shipping SN Olivia 109,266
ST Shipping SN Claudia 109,266
Trafigura Cielo Bianco 74,999
Navig8 Mare Nostrum 110,295
Clearlake NS Columbus 105,703
Clearlake NS Captain 105,914
CCI Luctor 50,000
Koch Trikwong Venture 297,136
CCI Turmoil 50,000
ST Shipping Kudos 109,672
Ext. Period D/C
Scorpio Zefyros 50,000
Reported Charterer Vessel Name Built DWTIce
Class
• Average guideline timecharter rates generally sawslight m-o-m increases in November, remaining close toyear to date averages but well below average guidelinerates over the preceding two years. The average guidelineone year timecharter rate for a VLCC rose by 4% m-o-mto stand at $27,750/day, whilst the guideline one year ratefor an Aframax increased for the third consecutive month,edging up by 1% to reach $15,125/day. Meanwhile, theguideline one year rate for a Suezmax tanker slid margin-ally to stand at $17,750/day. The guideline one year ratefor an MR rose to $13,750/day, representing a 2% m-o-mincrease and bringing the year to date average guidelinerate to $13,157/day. However, this value is still 13% belowthe full year 2016 average. Guideline one year timecharterrates for an LR1 and 37k dwt products tanker both re-mained relatively steady m-o-m, standing at $13,438/dayand $12,500/day respectively. • Tanker timecharter activity in November included thecharter of the 2012-built, 297,136 dwt “TRIKWONG VEN-TURE” by Koch for one year at a rate of $27,500/day.Elsewhere, CCI chartered the two 2011-built, 50,000 dwtMR tankers “TURMOIL” and “LUCTOR”, each for oneyear at a rate of $13,850/day. Meanwhile, ST Shippingchartered the 2007-built, 109,672 dwt Aframax “KUDOS”at a rate of $15,000/day, also for one year. Shorter-termtimecharter activity in November included the charter ofthe 2013-built, 50,000 dwt MR tanker “ZEFYROS” for sixmonths at a rate of $13,250/day.
Lice
nsed
to C
lark
sons
Res
earc
h S
ampl
e. D
istr
ibut
ion
is r
estr
icte
d; p
leas
e re
mem
ber
to a
ckno
wle
dge
the
sour
ce. O
il an
d T
anke
r T
rade
Out
look
, Vol
ume
22 N
o 12
Licensed to Clarksons R
esearch Sam
ple. Distribution is restricted; please rem
ember to acknow
ledge the source. Oil and T
anker Trade O
utlook, Volum
e 22 No 12
The Tanker Fleet & Orderbook
No. m. Dwt Total Oil Tanker Fleet (10,000+ dwt) 4,978 546.8 % 20+ years 7% 4% % < 5 years Average Age (years) 10.3
Average Size (dwt) Est. Value Of The Fleet ($bn) Total Oil Tanker Orderbook (10,000+ dwt) 472 62.2
% of Fleet 9% 11% Value Of The Orderbook ($bn)
Crude Tanker Fleet Average Age (years)
Average Size (dwt) Crude Tanker Orderbook % of Fleet
Deliveries (2017 ytd) Demolition (2017 ytd)
Product Tanker Fleet (10,000+ dwt)Average Age (years)Average Size (dwt)Product Tanker Orderbook (10,000+ dwt)% of FleetDeliveries (2017 ytd)Demolition (2017 ytd)
Product Tanker Fleet <10,000 dwtProduct Tanker Orderbook < 10,000 dwtTotal Oil Tanker FleetTotal Oil Tanker Orderbook
Chemical Tanker FleetChemical Tanker Orderbook
% of Fleet Other Specialised Tanker Fleet
Other Specialised Tanker Orderbook% of Fleet
Total Tanker FleetTotal Tanker Orderbook
Total Tanker Fleet (10,000+ dwt)Total Tanker Orderbook (10,000+ dwt)
Clarksons Research
65.6
62.6
618
0.4
6% 9%0.9
606.1739
6,608
Tanker Fleet Data, Start Dec-17
21% 22%
109,850
582.2
12%
2,022 388.010.2
66.4
26.8
2,956 158.8
191,901241 47.912%
7.5136
53,724231 14.38% 9%
30 1.7119 8.0
5,448 14.7
3,683 43.7
6210,426 561.5
534
0.00% 1%
203 3.8
405
141.9
30.7
10.5
2
48
14,514
Page i Dec-17
0%
10%
20%
30%
40%
50%
100
150
200
250
300
350
400
450
500
550
600
650
Dec
-07
Dec
-08
Dec
-09
Dec
-10
Dec
-11
Dec
-12
Dec
-13
Dec
-14
Dec
-15
Dec
-16
Dec
-17
m.dwt
Chemical/Specialised Tanker Fleet
Product Tanker Fleet
Crude Tanker Fleet
Tankers 10,000+ dwt
The Tanker Fleet & Orderbook
Orderbook as % Fleet
Oil & Tanker Trades Outlook – Fleet Definitions
The total tanker fleet and orderbook, as broken down in the following seven pages is the aggregate of crude, products, chemical and other specialised tankers for each size range. The definition for those sub-sectors is laid out below.
• Crude tankers are defined as all uncoated tankers 55,000 dwt and above and are used in the transportation of crude oil and also dirty petroleum products. (Note Suezmax supply analysis on pages 3 and 7 includes coated Suezmaxes.)
• Product tankers are defined as tankers suitable for the carriage of refined petroleum products and include:
o Coated non-IMO graded tankers o IMO III tankers o IMO II tankers of 25,000 dwt and above which
meet the criteria: average tank size >3,000 cbm, or, where average tank size unknown, no of tanks <16(25-40k dwt), <18(40-55k dwt), <30(55-85k dwt)
o Uncoated non-IMO graded tankers below 55,000 dwt
o Tankers of an unknown IMO grade 25,000 dwt and above
o Excludes specialised tankers, and all tankers with stainless steel tanks.
(Note: Product Tanker supply analysis on pages 3 & 25 includes 10,000-124,999 dwt product tankers only.)
• Chemical tankers are defined as tankers that are suitable for chemical trades, including chemical parcel and chemical bulk tankers. Chemical tanker fleet includes IMO I tankers, IMO II tankers excluding those classed as product tankers (see above), tankers of an unknown IMO grade below 25,000 dwt, and stainless steel tankers not designated as specialised tankers.
• The other specialised tanker fleet includes tankers designed for the carriage of specialist liquids (excluding chemical tankers) such as water carriers, waste disposal carriers, molten sulphur tankers, and wine and juice carriers.
0
20
40
60
80
100
1999
2000
2001
2002
2003
2004
2005
2006
2007
2008
2009
2010
2011
2012
2013
2014
2015
2016
2017
ytd
m.dwtOil Tanker Supply Trends
Deliveries
Demolition
Contracting
Oil Tankers 10,000+ dwt
Lice
nsed
to C
lark
sons
Res
earc
h S
ampl
e. D
istr
ibut
ion
is r
estr
icte
d; p
leas
e re
mem
ber
to a
ckno
wle
dge
the
sour
ce. O
il an
d T
anke
r T
rade
Out
look
, Vol
ume
22 N
o 12
Licensed to Clarksons R
esearch Sam
ple. Distribution is restricted; please rem
ember to acknow
ledge the source. Oil and T
anker Trade O
utlook, Volum
e 22 No 12

Tanker Fleet By Size (Numbers)Crude Tanker No. vessels, end: Fleet Growth %
Fleet (by dwt sector) 2014 2015 2016 Jun Jul Aug Sep Oct Nov Dec Year on Year
55,000/69,999 49 42 44 45 45 46 46 46 45 45 FIRM.... 4.7%70,000/84,999 44 45 45 44 44 44 44 44 44 44 STEADY... -2.2%Total Panamax 93 87 89 89 89 90 90 90 89 89 STEADY... 1.1%85,000/99,999 62 59 57 55 53 51 50 49 47 45 WEAKER... -21.1%100,000/109,999 362 362 369 367 367 365 361 360 358 358 SOFTER... -3.2%110,000/124,999 213 214 225 239 242 246 248 252 253 254 FIRMER... 13.4%Total Aframax 637 635 651 661 662 662 659 661 658 657 STEADY... 0.9%125,000/149,999 106 108 111 113 113 112 113 112 114 113 STEADY... 0.9%150,000/159,999 292 300 320 344 350 354 354 360 361 361 FIRMER... 12.8%160,000/199,999 66 66 67 67 67 67 67 67 67 67 STEADY... 1.5%Total Suezmax 464 474 498 524 530 533 534 539 542 541 FIRMER... 8.6%200,000/299,999 209 210 234 247 250 253 249 248 250 249 FIRM.... 6.4%300,000/309,999 175 178 187 194 194 194 194 197 198 198 FIRM.... 5.9%310,000/319,999 202 216 231 236 237 238 240 240 240 242 FIRM.... 5.7%320,000+ 45 46 46 46 46 46 46 46 46 46 STEADY...Total VL/ULCC 631 650 698 723 727 731 729 731 734 735 FIRM.... 5.6%
Total Crude Tanker Fleet 1,825 1,846 1,936 1,997 2,008 2,016 2,012 2,021 2,023 2,022 FIRM.... 4.6%% change year-on-year -1.1% 1.2% 4.9% 6.3% 6.5% 6.4% 5.7% 5.5% 5.3% 4.6%
Product Tanker No. vessels, end: Fleet Growth %
Fleet (by dwt sector) 2014 2015 2016 Jun Jul Aug Sep Oct Nov Dec Year on Year
Total < 10,000 5,301 5,353 5,411 5,431 5,438 5,441 5,438 5,448 5,450 5,448 STEADY... 0.8%Total 10-24,999 273 270 271 276 276 276 275 276 277 277 STEADY... 2.2%25,000/34,999 121 115 112 111 111 111 111 111 111 112 STEADY... -1.8%35,000/39,999 334 340 348 350 350 350 350 350 350 349 STEADY... 0.6%Total Handy (25,000-39,999) 455 455 460 461 461 461 461 461 461 461 STEADY...40,000/49,999 961 1,036 1,099 1,120 1,123 1,127 1,126 1,126 1,125 1,125 STEADY... 2.5%50,000/54,999 321 343 360 364 367 367 369 372 374 375 FIRM.... 4.2%Total MR (40,000-54,999) 1,282 1,379 1,459 1,484 1,490 1,494 1,495 1,498 1,499 1,500 STEADY... 2.9%55,000/69,999 37 35 34 34 34 34 34 34 33 33 STEADY... -2.9%70,000/84,999 294 296 312 319 319 323 324 326 327 327 FIRM.... 4.8%Total LR1 331 331 346 353 353 357 358 360 360 360 FIRM.... 4.0%85,000/109,999 180 199 225 238 240 241 241 243 243 241 FIRM.... 7.6%110,000/124,999 79 86 91 93 93 96 98 99 100 101 FIRMER... 12.2%Total LR2 259 285 316 331 333 337 339 342 343 342 FIRMER... 8.9%125,000/159,999 8 8 10 10 10 10 10 10 10 11 FIRMER... 22.2%160,000/199,999 5 5 5 5 5 5 5 5 5 5 STEADY...Total Coated Suezmax 13 13 15 15 15 15 15 15 15 16 FIRMER... 14.3%
Total Product Tanker Fleet 7,914 8,086 8,278 8,351 8,366 8,381 8,381 8,400 8,405 8,404 STEADY... 1.6%Total Product Fleet 10,000+ 2,613 2,733 2,867 2,920 2,928 2,940 2,943 2,952 2,955 2,956 FIRM.... 3.2%% change year-on-year 3.4% 4.6% 4.9% 4.4% 4.3% 4.2% 3.9% 3.9% 3.7% 3.2%
TOTAL OIL TANKER FLEET 9,739 9,932 10,214 10,348 10,374 10,397 10,393 10,421 10,428 10,426 STEADY... 2.2%TOTAL OIL TANKER FLEET 10,000+ 4,438 4,579 4,803 4,917 4,936 4,956 4,955 4,973 4,978 4,978 FIRM.... 3.8%% change year-on-year 1.5% 3.2% 4.9% 5.2% 5.2% 5.1% 4.6% 4.5% 4.3% 3.8%
Chemical Tanker No. vessels, end: Fleet Growth %
Fleet (by dwt sector) 2014 2015 2016 Jun Jul Aug Sep Oct Nov Dec Year on Year
< 10,000 1,985 2,009 2,040 2,052 2,054 2,059 2,059 2,063 2,065 2,068 STEADY... 1.2%10,000+ 1,431 1,485 1,557 1,585 1,592 1,598 1,605 1,609 1,611 1,615 FIRM.... 3.1%Total Chemical Tanker Fleet 3,416 3,494 3,597 3,637 3,646 3,657 3,664 3,672 3,676 3,683 STEADY... 2.1%
Specialised Tanker No. vessels, end: Fleet Growth %
Fleet (by dwt sector) 2014 2015 2016 Jun Jul Aug Sep Oct Nov Dec Year on Year
< 10,000 382 382 389 390 388 389 389 390 390 390 STEADY...10,000+ 17 16 15 15 15 15 15 15 15 15 STEADY...Total Specialised Tanker Fleet 399 398 404 405 403 404 404 405 405 405 STEADY...
Total Tanker Fleet 13,554 13,824 14,215 14,390 14,423 14,458 14,461 14,498 14,509 14,514 STEADY... 2.2%Total Tanker Fleet 10,000+ 5,886 6,080 6,375 6,517 6,543 6,569 6,575 6,597 6,604 6,608 FIRM.... 3.8%% change year-on-year 1.3% 3.3% 4.9% 5.0% 5.0% 4.9% 4.6% 4.5% 4.2% 3.8%
Clarksons Research The Total Oil Tanker Fleet includes crude and products tankers. The Total Tanker Fleet includes crude, products, chemical and specialised tankers 100+ Gt.
No. vessels, start:
No. vessels, start:
No. vessels, start:
No. vessels, start:
Dec-17Page ii
Lice
nsed
to C
lark
sons
Res
earc
h S
ampl
e. D
istr
ibut
ion
is r
estr
icte
d; p
leas
e re
mem
ber
to a
ckno
wle
dge
the
sour
ce. O
il an
d T
anke
r T
rade
Out
look
, Vol
ume
22 N
o 12
Licensed to Clarksons R
esearch Sam
ple. Distribution is restricted; please rem
ember to acknow
ledge the source. Oil and T
anker Trade O
utlook, Volum
e 22 No 12

Tanker Fleet By Size (Dwt)Crude Tanker Million Dwt, end: Fleet Growth %
Fleet (by dwt sector) 2014 2015 2016 Jun Jul Aug Sep Oct Nov Dec Year on Year
55,000/69,999 3.2 2.8 2.9 3.0 3.0 3.0 3.0 3.0 3.0 3.0 FIRM.... 4.9%70,000/84,999 3.3 3.3 3.3 3.3 3.3 3.3 3.3 3.3 3.3 3.3 STEADY... -2.2%Total Panamax 6.5 6.1 6.2 6.2 6.2 6.3 6.3 6.3 6.2 6.2 STEADY... 1.1%85,000/99,999 6.0 5.7 5.5 5.3 5.1 4.9 4.8 4.7 4.5 4.3 WEAKER... -21.0%100,000/109,999 38.3 38.3 39.1 38.9 38.9 38.7 38.3 38.2 38.0 38.0 SOFTER... -3.2%110,000/124,999 24.4 24.5 25.8 27.4 27.7 28.2 28.4 28.9 29.0 29.1 FIRMER... 13.2%Total Aframax 68.8 68.6 70.4 71.6 71.7 71.8 71.5 71.8 71.5 71.4 STEADY... 1.4%125,000/149,999 15.5 15.8 16.2 16.5 16.5 16.4 16.5 16.4 16.7 16.5 STEADY... 1.0%150,000/159,999 45.9 47.2 50.3 54.1 55.1 55.7 55.7 56.6 56.8 56.8 FIRMER... 12.8%160,000/199,999 10.9 10.9 11.1 11.1 11.1 11.1 11.1 11.1 11.1 11.1 STEADY... 1.5%Total Suezmax 72.3 73.9 77.6 81.7 82.7 83.2 83.3 84.1 84.6 84.4 FIRMER... 8.8%200,000/299,999 61.9 62.2 69.4 73.3 74.2 75.1 73.9 73.6 74.2 74.0 FIRM.... 6.5%300,000/309,999 53.3 54.3 57.0 59.1 59.1 59.1 59.1 60.0 60.3 60.3 FIRM.... 5.9%310,000/319,999 64.0 68.5 73.2 74.8 75.1 75.4 76.1 76.1 76.1 76.7 FIRM.... 5.7%320,000+ 14.7 15.0 15.0 15.0 15.0 15.0 15.0 15.0 15.0 15.0 STEADY...Total VL/ULCC 193.9 199.9 214.7 222.3 223.5 224.7 224.1 224.8 225.7 226.0 FIRM.... 5.6%
Total Crude Tanker Fleet 341.5 348.5 368.9 381.8 384.1 385.9 385.2 386.9 387.9 388.0 FIRM.... 5.4%% change year-on-year 0.2% 2.1% 5.9% 7.1% 7.2% 7.4% 6.5% 6.3% 6.1% 5.4%
Product Tanker Million Dwt, end: Fleet Growth %
Fleet (by dwt sector) 2014 2015 2016 Jun Jul Aug Sep Oct Nov Dec Year on Year
Total < 10,000 14.2 14.3 14.5 14.6 14.6 14.6 14.6 14.7 14.7 14.7 STEADY... 1.4%Total 10-24,999 4.0 4.0 4.0 4.1 4.1 4.1 4.1 4.1 4.1 4.1 STEADY... 2.4%25,000/34,999 3.8 3.6 3.5 3.5 3.5 3.5 3.5 3.5 3.5 3.5 STEADY... -1.5%35,000/39,999 12.6 12.8 13.1 13.2 13.2 13.2 13.2 13.2 13.2 13.2 STEADY... 0.6%Total Handy (25,000-39,999) 16.3 16.4 16.6 16.7 16.7 16.7 16.7 16.7 16.7 16.7 STEADY... 0.2%40,000/49,999 44.4 48.2 51.3 52.3 52.4 52.6 52.6 52.6 52.6 52.6 STEADY... 2.6%50,000/54,999 16.4 17.5 18.4 18.6 18.7 18.7 18.8 19.0 19.1 19.1 FIRM.... 4.1%Total MR (40,000-54,999) 60.8 65.7 69.6 70.9 71.2 71.4 71.4 71.6 71.6 71.7 FIRM.... 3.0%55,000/69,999 2.4 2.3 2.2 2.2 2.2 2.2 2.2 2.2 2.2 2.2 SOFTER... -3.1%70,000/84,999 21.8 21.9 23.1 23.7 23.7 24.0 24.0 24.2 24.2 24.2 FIRM.... 4.8%Total LR1 24.2 24.3 25.4 25.9 25.9 26.2 26.3 26.4 26.4 26.4 FIRM.... 4.1%85,000/109,999 19.1 21.1 24.0 25.4 25.7 25.8 25.8 26.0 26.0 25.8 FIRM.... 7.9%110,000/124,999 9.1 9.9 10.4 10.7 10.7 11.0 11.2 11.3 11.5 11.6 FIRMER... 12.0%Total LR2 28.1 31.0 34.4 36.1 36.3 36.8 37.0 37.3 37.4 37.4 FIRMER... 9.2%125,000/159,999 1.3 1.3 1.6 1.6 1.6 1.6 1.6 1.6 1.6 1.7 FIRMER... 22.4%160,000/199,999 0.8 0.8 0.8 0.8 0.8 0.8 0.8 0.8 0.8 0.8 STEADY...Total Coated Suezmax 2.1 2.1 2.4 2.4 2.4 2.4 2.4 2.4 2.4 2.5 FIRMER... 14.3%
Total Product Tanker Fleet 149.8 157.7 167.0 170.6 171.2 172.1 172.5 173.2 173.4 173.5 FIRM.... 4.2%Total Product Fleet 10,000+ 135.6 143.4 152.5 156.0 156.5 157.5 157.8 158.5 158.7 158.8 FIRM.... 4.4%% change year-on-year 3.9% 5.7% 6.3% 5.7% 5.5% 5.6% 5.3% 5.2% 5.0% 4.4%
TOTAL OIL TANKER FLEET 491.3 506.2 535.9 552.4 555.3 558.1 557.7 560.1 561.3 561.5 FIRM.... 5.0%TOTAL OIL TANKER FLEET 10,000+ 477.1 491.9 521.4 537.8 540.6 543.4 543.1 545.4 546.6 546.8 FIRM.... 5.1%% change year-on-year 1.3% 3.1% 6.0% 6.7% 6.7% 6.9% 6.1% 5.9% 5.8% 5.1%
Chemical Tanker Million Dwt, end: Fleet Growth %
Fleet (by dwt sector) 2014 2015 2016 Jun Jul Aug Sep Oct Nov Dec Year on Year
< 10,000 8.3 8.4 8.5 8.6 8.6 8.6 8.6 8.7 8.7 8.7 STEADY... 2.0%10,000+ 29.9 31.6 33.4 34.2 34.4 34.5 34.7 34.8 34.9 35.0 FIRM.... 5.2%Total Chemical Tanker Fleet 38.2 40.0 42.0 42.8 43.0 43.2 43.3 43.5 43.5 43.7 FIRM.... 4.6%
Specialised Tanker Million Dwt, end: Fleet Growth %
Fleet (by dwt sector) 2014 2015 2016 Jun Jul Aug Sep Oct Nov Dec Year on Year
< 10,000 0.5 0.5 0.5 0.5 0.5 0.5 0.5 0.5 0.5 0.5 STEADY... 0.6%10,000+ 0.4 0.4 0.4 0.4 0.4 0.4 0.4 0.4 0.4 0.4 STEADY...Total Specialised Tanker Fleet 0.9 0.9 0.9 0.9 0.9 0.9 0.9 0.9 0.9 0.9 STEADY... 0.4%
Total Tanker Fleet 530.4 547.0 578.8 596.1 599.1 602.1 601.9 604.5 605.7 606.1 FIRM.... 5.0%Total Tanker Fleet 10,000+ 507.4 523.8 555.2 572.4 575.4 578.3 578.1 580.6 581.9 582.2 FIRM.... 5.1%% change year-on-year 1.3% 3.2% 6.0% 6.6% 6.6% 6.8% 6.1% 5.9% 5.7% 5.1%
Clarksons Research
Million Dwt, start:
Million Dwt, start:
Million Dwt, start:
Million Dwt, start:
The Total Oil Tanker Fleet includes crude and products tankers. The Total Tanker Fleet includes crude, products, chemical and specialised tankers 100+ Gt.
Dec-17Page iii
Lice
nsed
to C
lark
sons
Res
earc
h S
ampl
e. D
istr
ibut
ion
is r
estr
icte
d; p
leas
e re
mem
ber
to a
ckno
wle
dge
the
sour
ce. O
il an
d T
anke
r T
rade
Out
look
, Vol
ume
22 N
o 12
Licensed to Clarksons R
esearch Sam
ple. Distribution is restricted; please rem
ember to acknow
ledge the source. Oil and T
anker Trade O
utlook, Volum
e 22 No 12

Tanker Fleet By Age (Numbers)
Crude Tanker Age Profile (years) No. vessels Fleet Ratios
Fleet (by dwt sector) 20 + 15-19 10-14 5-9 0-4 20 + 15-19 10-14 5-9 0-4 Dec15yrs+ /Fleet
O'bk /15yrs+
55,000/69,999 11% 27% 47% 4% 11% 5 12 21 2 5 45 38%70,000/84,999 23% 59% 14% 5% 10 26 6 2 44 23% 30%Total Panamax 6% 25% 53% 9% 8% 5 22 47 8 7 89 30% 11%85,000/99,999 62% 24% 2% 11% 28 11 1 5 45 87%100,000/109,999 3% 21% 42% 30% 5% 10 74 149 108 17 358 23% 11%110,000/124,999 0% 6% 36% 36% 22% 1 14 91 91 57 254 6% 520%Total Aframax 6% 15% 37% 31% 11% 39 99 241 204 74 657 21% 63%125,000/149,999 19% 28% 20% 19% 13% 21 32 23 22 15 113 47% 11%150,000/159,999 1% 14% 18% 37% 30% 4 52 65 133 107 361 16% 88%160,000/199,999 12% 43% 42% 3% 8 29 28 2 67 12% 50%Total Suezmax 5% 17% 22% 34% 23% 25 92 117 183 124 541 22% 50%200,000/299,999 4% 24% 17% 33% 22% 11 59 42 81 56 249 28% 14%300,000/309,999 8% 28% 28% 22% 15% 15 55 56 43 29 198 35% 27%310,000/319,999 6% 17% 47% 30% 14 42 113 73 242 6% 350%320,000+ 2% 13% 57% 28% 1 6 26 13 46 2% 1400%Total VL/ULCC 4% 18% 20% 36% 23% 26 129 146 263 171 735 21% 59%
Total Crude Tanker Fleet 5% 17% 27% 33% 19% 95 342 551 658 376 2,022 22% 55%
Product Tanker Age Profile (years) No. vessels Fleet Ratios
Fleet (by dwt sector) 20 + 15-19 10-14 5-9 0-4 20 + 15-19 10-14 5-9 0-4 Dec15yrs+ /Fleet
O'bk /15yrs+
Total < 10,000 66% 5% 7% 13% 10% 3,581 255 379 707 526 5,448 70% 2%Total 10-24,999 34% 10% 17% 24% 16% 93 27 46 67 44 277 43% 17%25,000/34,999 31% 25% 24% 12% 8% 35 28 27 13 9 112 56% 10%35,000/39,999 6% 17% 42% 22% 13% 21 58 148 77 45 349 23% 9%
Total Handy (25,000-39,999) 12% 19% 38% 20% 12% 56 86 175 90 54 461 31% 9%40,000/49,999 8% 10% 29% 26% 27% 91 118 326 290 300 1,125 19% 25%50,000/54,999 19% 53% 27% 72 200 103 375
Total MR (40,000-54,999) 6% 8% 27% 33% 27% 91 118 398 490 403 1,500 14% 59%55,000/69,999 6% 15% 39% 36% 3% 2 5 13 12 1 33 21%70,000/84,999 1% 3% 39% 43% 14% 2 11 127 140 47 327 4% 246%
Total LR1 1% 4% 39% 42% 13% 4 16 140 152 48 360 6% 160%85,000/109,999 4% 11% 21% 32% 32% 10 27 50 76 78 241 15% 3%110,000/124,999 1% 10% 55% 34% 1 10 56 34 101 1% 3900%
Total LR2 3% 8% 18% 39% 33% 11 27 60 132 112 342 11% 105%125,000/159,999 55% 9% 36% 6 1 4 11160,000/199,999 20% 80% 1 4 5 20%
Total Coated Suezmax 6% 63% 6% 25% 1 10 1 4 16 6% 300%
Total Product Tanker Fleet 46% 6% 14% 20% 14% 3,836 530 1,208 1,639 1,191 8,404 52% 7%Total Product Fleet 10,000+ 9% 9% 28% 32% 22% 255 275 829 932 665 2,956 18% 44%
TOTAL OIL TANKER FLEET 38% 8% 17% 22% 15% 3,931 872 1,759 2,297 1,567 10,426 46% 11%TOTAL OIL TANKER FLEET 10,000+ 7% 12% 28% 32% 21% 350 617 1,380 1,590 1,041 4,978 19% 49%
Chemical Tanker Age Profile (years) No. vessels Fleet Ratios
Fleet (by dwt sector) 20 + 15-19 10-14 5-9 0-4 20 + 15-19 10-14 5-9 0-4 Dec15yrs+ /Fleet
O'bk /15yrs+
< 10,000 39% 9% 18% 25% 9% 806 182 382 515 183 2,068 48% 6%10,000+ 8% 12% 24% 40% 16% 136 193 386 642 258 1,615 20% 44%
Total Chemical Tanker Fleet 26% 10% 21% 31% 12% 942 375 768 1,157 441 3,683 36% 15%
Specialised Tanker Age Profile (years) No. vessels Fleet Ratios
Fleet (by dwt sector) 20 + 15-19 10-14 5-9 0-4 20 + 15-19 10-14 5-9 0-4 Dec15yrs+ /Fleet
O'bk /15yrs+
< 10,000 81% 3% 2% 6% 9% 314 12 6 22 36 390 84% 1%10,000+ 33% 20% 20% 13% 13% 5 3 3 2 2 15 53%
Total Specialised Tanker Fleet 79% 4% 2% 6% 9% 319 15 9 24 38 405 82% 1%
Total Tanker Fleet 36% 9% 17% 24% 14% 5,192 1,262 2,536 3,478 2,046 14,514 44% 11%Total Tanker Fleet 10,000+ 7% 12% 27% 34% 20% 491 813 1,769 2,234 1,301 6,608 20% 47%
Clarksons Research Page iv
The Total Oil Tanker Fleet includes crude and products tankers. The Total Tanker Fleet includes crude, products, chemical and specialised tankers 100+ Gt.
Age Profile (years) % Fleet
Age Profile (years) % Fleet
Age Profile (years) % Fleet
Age Profile (years) % Fleet
Dec-17
Lice
nsed
to C
lark
sons
Res
earc
h S
ampl
e. D
istr
ibut
ion
is r
estr
icte
d; p
leas
e re
mem
ber
to a
ckno
wle
dge
the
sour
ce. O
il an
d T
anke
r T
rade
Out
look
, Vol
ume
22 N
o 12
Licensed to Clarksons R
esearch Sam
ple. Distribution is restricted; please rem
ember to acknow
ledge the source. Oil and T
anker Trade O
utlook, Volum
e 22 No 12

Tanker Fleet By Age (Dwt)
Crude Tanker Age Profile (years) Million Dwt Fleet Ratios
Fleet (by dwt sector) 20 + 15-19 10-14 5-9 0-4 20 + 15-19 10-14 5-9 0-4 Dec15yrs+ /Fleet
O'bk /15yrs+
55,000/69,999 10% 27% 47% 3% 10% 0.3 0.8 1.4 0.1 0.3 3.0 37%70,000/84,999 0% 24% 58% 12% 3% 0.0 0.8 1.9 0.4 0.1 3.3 24% 27%Total Panamax 5% 26% 53% 10% 8% 0.3 1.6 3.3 0.6 0.5 6.2 31% 12%85,000/99,999 63% 26% 2% 12% 0% 2.7 1.1 0.1 0.5 0.0 4.3 88%100,000/109,999 3% 21% 41% 30% 5% 1.1 7.8 15.7 11.5 1.8 38.0 23% 11%110,000/124,999 0% 5% 36% 36% 22% 0.1 1.6 10.4 10.4 6.5 29.1 6% 523%Total Aframax 5% 15% 37% 31% 12% 3.9 10.5 26.2 22.4 8.4 71.4 20% 68%125,000/149,999 18% 28% 21% 20% 13% 3.0 4.6 3.4 3.3 2.2 16.5 46% 10%150,000/159,999 1% 14% 18% 37% 30% 0.6 8.1 10.2 21.0 16.8 56.8 15% 89%160,000/199,999 0% 12% 44% 41% 3% 0.0 1.3 4.9 4.6 0.3 11.1 12% 49%Total Suezmax 4% 17% 22% 34% 23% 3.6 14.0 18.5 28.9 19.4 84.4 21% 52%200,000/299,999 4% 23% 17% 33% 23% 3.2 17.3 12.6 24.1 16.8 74.0 28% 15%300,000/309,999 7% 28% 28% 22% 15% 4.5 16.8 17.1 13.1 8.8 60.3 35% 27%310,000/319,999 0% 6% 17% 47% 30% 0.0 4.4 13.3 35.9 23.1 76.7 6% 351%320,000+ 0% 3% 13% 55% 28% 0.0 0.4 2.0 8.3 4.2 15.0 3% 1120%Total VL/ULCC 3% 17% 20% 36% 23% 7.7 38.9 45.0 81.4 52.9 226.0 21% 62%
Total Crude Tanker Fleet 4% 17% 24% 34% 21% 15.6 65.0 93.0 133.3 81.1 388.0 21% 59%
Product Tanker Age Profile (years) Million Dwt Fleet Ratios
Fleet Profile 20 + 15-19 10-14 5-9 0-4 20 + 15-19 10-14 5-9 0-4 Dec15yrs+ /Fleet
O'bk /15yrs+
Total < 10,000 50% 5% 10% 22% 12% 7.4 0.8 1.5 3.2 1.7 14.7 56% 4%Total 10-24,999 34% 12% 15% 24% 17% 1.4 0.5 0.6 1.0 0.7 4.1 46% 18%25,000/34,999 31% 26% 26% 11% 9% 1.1 0.9 0.9 0.4 0.3 3.5 57% 10%35,000/39,999 6% 16% 42% 22% 13% 0.8 2.1 5.6 2.9 1.7 13.2 22% 9%
Total Handy (25,000-39,999) 11% 18% 39% 20% 12% 1.8 3.0 6.5 3.3 2.0 16.7 29% 10%40,000/49,999 8% 10% 28% 26% 28% 4.1 5.4 14.9 13.5 14.7 52.6 18% 27%50,000/54,999 0% 0% 19% 53% 27% 0.0 0.0 3.7 10.2 5.2 19.1 0%
Total MR (40,000-54,999) 6% 8% 26% 33% 28% 4.1 5.4 18.6 23.7 19.9 71.7 13% 64%55,000/69,999 5% 14% 41% 36% 5% 0.1 0.3 0.9 0.8 0.1 2.2 18%70,000/84,999 1% 3% 38% 43% 14% 0.2 0.8 9.3 10.4 3.5 24.2 4% 240%
Total LR1 1% 5% 39% 42% 14% 0.3 1.2 10.2 11.2 3.6 26.4 6% 160%85,000/109,999 4% 11% 21% 31% 33% 1.0 2.8 5.3 8.1 8.5 25.8 15% 3%110,000/124,999 1% 0% 10% 55% 34% 0.1 0.0 1.2 6.4 3.9 11.6 1% 4479%
Total LR2 3% 7% 17% 39% 33% 1.1 2.8 6.5 14.5 12.4 37.4 10% 118%125,000/159,999 0% 0% 59% 12% 35% 0.0 0.0 1.0 0.2 0.6 1.7 0%160,000/199,999 0% 25% 75% 0% 0% 0.0 0.2 0.6 0.0 0.0 0.8 25%
Total Coated Suezmax 0% 8% 64% 8% 24% 0.0 0.2 1.6 0.2 0.6 2.5 8% 238%
Total Product Tanker Fleet 9% 8% 26% 33% 24% 16.1 13.8 45.5 57.1 41.0 173.5 17% 49%Total Product Fleet 10,000+ 5% 8% 28% 34% 25% 8.7 13.0 44.0 53.8 39.3 158.8 14% 66%
TOTAL OIL TANKER FLEET 6% 14% 25% 34% 22% 31.7 78.9 138.5 190.4 122.1 561.5 20% 57%TOTAL OIL TANKER FLEET 10,000+ 4% 14% 25% 34% 22% 24.3 78.1 137.0 187.1 120.4 546.8 19% 61%
Chemical Tanker Age Profile (years) Million Dwt Fleet Ratios
Fleet Profile 20 + 15-19 10-14 5-9 0-4 20 + 15-19 10-14 5-9 0-4 Dec15yrs+ /Fleet
O'bk /15yrs+
< 10,000 24% 10% 22% 33% 9% 2.1 0.9 1.9 2.9 0.8 8.7 34% 12%10,000+ 8% 12% 23% 36% 21% 2.9 4.2 7.9 12.6 7.4 35.0 20% 48%
Total Chemical Tanker Fleet 12% 12% 22% 35% 19% 5.1 5.2 9.8 15.5 8.2 43.7 24% 37%
Specialised Tanker Age Profile (years) Million Dwt Fleet Ratios
Fleet Profile 20 + 15-19 10-14 5-9 0-4 20 + 15-19 10-14 5-9 0-4 Dec15yrs+ /Fleet
O'bk /15yrs+
< 10,000 60% 0% 0% 20% 20% 0.3 0.0 0.0 0.1 0.1 0.5 60% 2%10,000+ 25% 25% 25% 0% 0% 0.1 0.1 0.1 0.0 0.0 0.4 50%
Total Specialised Tanker Fleet 44% 11% 11% 11% 11% 0.4 0.1 0.1 0.1 0.1 0.9 56% 1%
Total Tanker Fleet 6% 14% 24% 34% 22% 37.1 84.2 148.4 206.0 130.5 606.1 20% 55%Total Tanker Fleet 10,000+ 5% 14% 25% 34% 22% 27.3 82.4 145.0 199.7 127.8 582.2 19% 60%
Clarksons Research Page v
Age Profile (years) % Fleet
Age Profile (years) % Fleet
Age Profile (years) % Fleet
Age Profile (years) % Fleet
The Total Oil Tanker Fleet includes crude and products tankers. The Total Tanker Fleet includes crude, products, chemical and specialised tankers 100+ Gt.
Dec-17
Lice
nsed
to C
lark
sons
Res
earc
h S
ampl
e. D
istr
ibut
ion
is r
estr
icte
d; p
leas
e re
mem
ber
to a
ckno
wle
dge
the
sour
ce. O
il an
d T
anke
r T
rade
Out
look
, Vol
ume
22 N
o 12
Licensed to Clarksons R
esearch Sam
ple. Distribution is restricted; please rem
ember to acknow
ledge the source. Oil and T
anker Trade O
utlook, Volum
e 22 No 12

Tanker Fleet Characteristics
Crude Tanker
Fleet Details (by dwt sector) Dwt Years Knots t/day LOA Beam Draft '000 bbls Heated
55,000/69,999 65,705 13.5 14.6 39.2 223.0 32.5 13.0 453 56%70,000/84,999 73,989 12.5 15.1 40.8 231.6 33.5 13.7 509 82%Total Panamax 69,800 13.0 14.8 39.6 227.2 33.0 13.4 481 69%85,000/99,999 96,480 19.9 14.6 51.3 243.9 42.6 13.7 684 93%100,000/109,999 106,009 12.1 14.9 48.2 241.8 42.1 14.8 724 92%110,000/124,999 114,539 8.4 15.0 50.6 249.4 43.7 14.9 779 91%Total Aframax 108,654 11.2 14.9 49.6 244.9 42.8 14.8 742 92%125,000/149,999 146,367 13.3 15.0 63.2 272.9 47.2 16.4 1,012 81%150,000/159,999 157,345 8.2 15.2 63.7 274.7 48.0 17.0 1,060 85%160,000/199,999 165,489 10.5 15.3 65.8 275.5 49.5 17.1 1,101 87%Total Suezmax 156,061 9.6 15.2 64.0 274.4 48.0 16.8 1,055 84%200,000/299,999 297,006 9.9 15.6 88.3 331.8 59.7 21.2 2,059 6%300,000/309,999 304,689 11.6 15.8 91.5 333.0 59.1 21.6 2,098 1%310,000/319,999 316,991 7.4 15.9 101.0 333.5 60.0 22.0 2,129 11%320,000+ 326,153 7.0 16.3 111.4 334.7 60.3 22.4 2,187 11%Total VL/ULCC 307,480 9.4 15.8 94.5 332.9 59.7 21.7 2,100 7%
Total Crude Tanker Fleet 191,901 10.2 15.3 70.3 284.0 49.9 17.8 1,306 58%
Product Tanker
Fleet Details (by dwt sector) Dwt Years Knots t/day LOA Beam Draft '000 bbls IMO III
Total < 10,000 5,873 17.6 12.2 10.7 106.5 16.4 6.1 40 18%Total 10-24,999 14,850 16.5 13.0 18.5 143.7 22.0 8.1 108 15%25,000/34,999 31,475 17.1 14.5 27.0 174.4 27.6 10.6 230 33%35,000/39,999 37,691 11.9 14.5 29.0 182.1 28.2 11.3 260 65%
Total Handy (25,000-39,999) 36,181 13.1 14.5 28.3 180.2 28.1 11.1 253 57%40,000/49,999 46,731 10.1 14.7 31.0 182.9 32.1 12.3 321 49%50,000/54,999 50,998 7.2 14.8 31.4 183.9 32.2 13.0 331 69%
Total MR (40,000-54,999) 47,798 9.3 14.7 31.1 183.2 32.1 12.5 323 54%55,000/69,999 66,004 11.8 14.8 40.9 213.4 34.8 12.7 552 12%70,000/84,999 74,153 9.1 14.9 41.8 227.7 32.8 14.2 510 8%
Total LR1 73,406 9.4 14.9 41.7 226.4 33.0 14.1 514 8%85,000/109,999 107,006 8.7 14.8 45.4 246.0 42.6 14.8 752 2%110,000/124,999 114,513 6.2 15.1 51.2 249.7 44.0 14.9 929
Total LR2 109,223 7.9 14.9 46.5 247.1 43.0 14.8 804 1%125,000/159,999 157,324 8.3 15.4 74.0 274.1 48.4 16.9 1,061160,000/199,999 161,717 12.0 14.8 279.9 50.6 16.3 1,095
Total Coated Suezmax 158,697 9.4 15.2 74.0 275.9 49.1 16.7 1,072
Total Product Tanker Fleet 39,249 12.6 13.9 26.7 166.5 27.3 10.5 293 33%Total Product Fleet 10,000+ 53,724 10.5 14.6 32.4 192.2 32.0 12.3 380 39%
TOTAL OIL TANKER FLEET 88,556 11.8 14.4 40.9 204.5 34.6 12.8 634 22%TOTAL OIL TANKER FLEET 10,000+ 109,850 10.3 14.9 47.4 229.5 39.3 14.6 756 23%
Chemical Tanker
Fleet Details (by dwt sector) Dwt Years Knots t/day LOA Beam Draft '000 bbls Stainless
< 10,000 5,050 15.2 12.7 11.5 98.1 15.2 6.0 36 33%10,000+ 21,672 10.5 14.4 22.4 149.0 24.0 9.6 149 42%
Total Chemical Tanker Fleet 13,207 12.9 13.6 17.0 123.6 19.6 7.8 95 38%
Specialised Tanker
Fleet Details (by dwt sector) Dwt Years Knots t/day LOA Beam Draft '000 bbls Coated
< 10,000 3,365 22.0 12.0 7.8 87.1 13.6 5.1 30 61%10,000+ 25,411 15.3 16.7 26.2 168.8 27.1 9.8 121 73%
Total Specialised Tanker Fleet 7,081 20.9 12.8 10.0 101.2 15.9 6.0 47 63%
Total Tanker Fleet 62,081 12.3 14.1 32.2 176.3 29.4 11.1 447 74%Total Tanker Fleet 10,000+ 88,108 10.4 14.7 41.0 209.7 35.5 13.3 606 68%
Clarksons Research Page vi Dec-17
Avg. Size/Age Speed/Cons Hull/Tanks Dimensions (m.)
Hull/Tanks Dimensions (m.)Speed/ConsAvg. Size/Age
The Total Oil Tanker Fleet includes crude and products tankers. The Total Tanker Fleet includes crude, products, chemical and specialised tankers 100+ Gt.
Avg. Size/Age Speed/Cons Dimensions (m.) Hull/Tanks
Avg. Size/Age Speed/Cons Dimensions (m.) Hull/Tanks
Lice
nsed
to C
lark
sons
Res
earc
h S
ampl
e. D
istr
ibut
ion
is r
estr
icte
d; p
leas
e re
mem
ber
to a
ckno
wle
dge
the
sour
ce. O
il an
d T
anke
r T
rade
Out
look
, Vol
ume
22 N
o 12
Licensed to Clarksons R
esearch Sam
ple. Distribution is restricted; please rem
ember to acknow
ledge the source. Oil and T
anker Trade O
utlook, Volum
e 22 No 12

Top Owners By Vessel TypeTop Crude Fleet Fleet Orderbook Delivery Schedule
Tanker Owners Dec-17 Dec-17
(by dwt capacity) No. m dwt No. m dwt No. m dwt No. m dwt %Flt 2017 2018 2019+1 China COSCO Shipping 52 11.57 55 12.04 64 14.08 11 2.98 21% 1.23 1.752 China Merchants Grp 42 11.25 45 12.62 49 13.90 10 3.10 22% 2.79 0.313 NIOC 51 13.43 54 14.31 52 13.714 Bahri 32 10.04 36 11.31 41 12.80 5 1.49 12% 1.495 Euronav NV 47 11.62 48 12.21 49 12.49 4 0.64 5% 0.646 Angelicoussis Group 34 9.29 39 10.88 46 12.19 9 2.86 23% 1.59 1.277 Teekay Corporation 96 13.55 87 11.82 82 11.21 5 0.67 6% 0.16 0.528 Mitsui O.S.K. Lines 37 10.56 37 10.56 35 10.149 Petronas 56 8.53 62 9.22 61 9.51 8 1.02 11% 0.77 0.25
10 Fredriksen Group 36 8.31 36 8.16 40 8.94 4 1.26 14% 0.62 0.6411 Dynacom Tankers Mngt 40 7.59 41 7.75 45 8.32 4 0.63 8% 0.6312 SCF Group 66 8.13 66 8.13 67 8.28 4 0.46 6% 0.34 0.1113 DHT Holdings 19 5.22 21 6.10 28 8.23 4 1.27 15% 1.2714 Gener8 Maritime 25 5.23 37 8.94 29 7.6515 Tsakos Group 26 3.96 32 4.87 40 5.8316 Nippon Yusen Kaisha 21 6.35 19 5.78 19 5.78 4 1.24 21% 1.2417 SK Holdings 18 5.63 18 5.63 18 5.6318 Minerva Marine 29 4.21 30 4.53 36 5.46 6 0.73 13% 0.7319 Olympic Shpg & Mngt 13 3.09 16 4.05 21 5.2720 Ocean Tankers 17 5.00 17 5.00 17 5.00
Top 20 Total 757 162.6 796 173.9 839 184.4 78 18.4 10% 12.3 6.1Others 1,141 197.5 1,140 195.0 1,183 203.6 163 29.5 14% 0.8 16.0 12.7Total 1,846 348.5 1,936 368.9 2,022 388.0 241 47.9 12% 0.8 28.3 18.8
Top Product Fleet Fleet Orderbook Delivery Schedule
Tanker Owners Dec-17 Dec-17
(by dwt capacity) No. m dwt No. m dwt No. m dwt No. m dwt %Flt 2017 2018 2019+1 Scorpio Group 79 4.93 76 4.92 106 7.48 2 0.10 1% 0.102 TORM A/S 65 3.57 65 3.57 75 4.17 8 0.66 16% 0.12 0.35 0.203 SCF Group 48 3.24 59 3.93 59 3.93 1 0.04 1% 0.044 China COSCO Shipping 71 3.23 71 3.23 78 3.63 9 0.39 11% 0.07 0.325 A.P. Moller 52 2.91 57 3.19 61 3.42 19 1.60 47% 0.05 0.35 1.206 Sinokor Merchant 39 2.18 49 2.78 51 2.96 3 0.22 7% 0.07 0.157 Ocean Tankers 78 2.95 75 2.91 76 2.918 BW Group 36 2.24 37 2.24 41 2.54 6 0.69 27% 0.699 Mitsui O.S.K. Lines 57 2.49 58 2.57 58 2.47 3 0.15 6% 0.05 0.05 0.05
10 Fredriksen Group 10 0.74 11 1.22 19 2.11 3 0.34 16% 0.3411 Tsakos Group 30 1.80 33 1.99 34 2.0312 China Merchants Grp 53 1.98 50 1.96 49 1.96 4 0.20 10% 0.05 0.1513 Hafnia Tankers 30 1.53 34 1.72 37 1.8714 K. G. Jebsen (KGJS) 14 1.83 14 1.83 14 1.8315 Navios Group 36 1.82 35 1.77 35 1.7716 Diamond S Shipping 33 1.60 33 1.60 33 1.6017 Minerva Marine 24 1.52 25 1.56 25 1.5618 Prime Marine Mngt 22 1.66 20 1.48 21 1.5519 D'Amico Soc di Nav 28 1.31 32 1.50 31 1.48 5 0.37 25% 0.07 0.22 0.0720 Interorient Nav 40 1.70 39 1.64 34 1.45
Top 20 Total 845 45.2 873 47.6 937 52.7 63 4.8 9% 0.5 2.0 2.3Others 7,312 115.7 7,405 119.4 7,467 120.8 230 9.9 8% 0.5 5.4 4.1Total 8,086 157.7 8,278 167.0 8,404 173.5 293 14.7 8% 1.0 7.4 6.4
Top Chemical Fleet Fleet Orderbook Delivery Schedule
Tanker Owners* Dec-17 Dec-17
(by dwt capacity) No. m dwt No. m dwt No. m dwt No. m dwt %Flt 2017 2018 2019+1 Stolt-Nielsen 79 1.87 86 2.17 90 2.33 2 0.07 3% 0.03 0.042 Odfjell ASA 44 1.47 42 1.46 44 1.54 9 0.35 23% 0.08 0.273 Mitsui O.S.K. Lines 55 1.17 54 1.16 55 1.26 9 0.27 21% 0.01 0.15 0.114 Bahri 26 1.20 26 1.20 26 1.205 Navig8 Group 17 0.65 24 0.88 28 0.97
Top 5 Total 221 6.4 232 6.9 243 7.3 20 0.7 9% 0.0 0.3 0.4Others 3,671 34.5 3,769 36.0 3,845 37.3 185 3.1 8% 0.2 2.0 1.0Total 3,892 40.9 4,001 42.9 4,088 44.6 205 3.8 8% 0.2 2.2 1.3
Data includes all tankers 100+ Gt. *Includes chemical and other specialised tankers. Data basis owner group.
Clarksons Research Page vii Dec-17
start'16 start'17 m dwt
start'16 start'17 m dwt
start'16 start'17 m dwt
Lice
nsed
to C
lark
sons
Res
earc
h S
ampl
e. D
istr
ibut
ion
is r
estr
icte
d; p
leas
e re
mem
ber
to a
ckno
wle
dge
the
sour
ce. O
il an
d T
anke
r T
rade
Out
look
, Vol
ume
22 N
o 12
Licensed to Clarksons R
esearch Sam
ple. Distribution is restricted; please rem
ember to acknow
ledge the source. Oil and T
anker Trade O
utlook, Volum
e 22 No 12
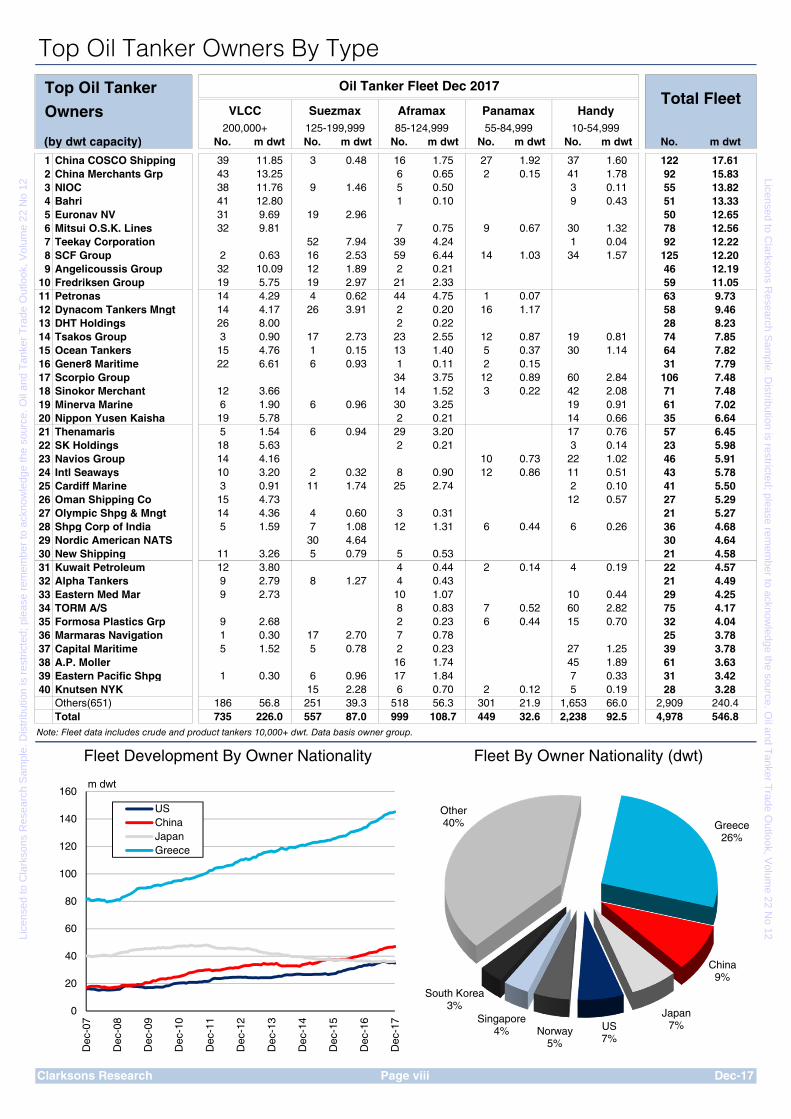
Top Oil Tanker Owners By TypeTop Oil Tanker
Owners
(by dwt capacity) No. m dwt No. m dwt No. m dwt No. m dwt No. m dwt No. m dwt
1 China COSCO Shipping 39 11.85 3 0.48 16 1.75 27 1.92 37 1.60 122 17.612 China Merchants Grp 43 13.25 6 0.65 2 0.15 41 1.78 92 15.833 NIOC 38 11.76 9 1.46 5 0.50 3 0.11 55 13.824 Bahri 41 12.80 1 0.10 9 0.43 51 13.335 Euronav NV 31 9.69 19 2.96 50 12.656 Mitsui O.S.K. Lines 32 9.81 7 0.75 9 0.67 30 1.32 78 12.567 Teekay Corporation 52 7.94 39 4.24 1 0.04 92 12.228 SCF Group 2 0.63 16 2.53 59 6.44 14 1.03 34 1.57 125 12.209 Angelicoussis Group 32 10.09 12 1.89 2 0.21 46 12.19
10 Fredriksen Group 19 5.75 19 2.97 21 2.33 59 11.0511 Petronas 14 4.29 4 0.62 44 4.75 1 0.07 63 9.7312 Dynacom Tankers Mngt 14 4.17 26 3.91 2 0.20 16 1.17 58 9.4613 DHT Holdings 26 8.00 2 0.22 28 8.2314 Tsakos Group 3 0.90 17 2.73 23 2.55 12 0.87 19 0.81 74 7.8515 Ocean Tankers 15 4.76 1 0.15 13 1.40 5 0.37 30 1.14 64 7.8216 Gener8 Maritime 22 6.61 6 0.93 1 0.11 2 0.15 31 7.7917 Scorpio Group 34 3.75 12 0.89 60 2.84 106 7.4818 Sinokor Merchant 12 3.66 14 1.52 3 0.22 42 2.08 71 7.4819 Minerva Marine 6 1.90 6 0.96 30 3.25 19 0.91 61 7.0220 Nippon Yusen Kaisha 19 5.78 2 0.21 14 0.66 35 6.6421 Thenamaris 5 1.54 6 0.94 29 3.20 17 0.76 57 6.4522 SK Holdings 18 5.63 2 0.21 3 0.14 23 5.9823 Navios Group 14 4.16 10 0.73 22 1.02 46 5.9124 Intl Seaways 10 3.20 2 0.32 8 0.90 12 0.86 11 0.51 43 5.7825 Cardiff Marine 3 0.91 11 1.74 25 2.74 2 0.10 41 5.5026 Oman Shipping Co 15 4.73 12 0.57 27 5.2927 Olympic Shpg & Mngt 14 4.36 4 0.60 3 0.31 21 5.2728 Shpg Corp of India 5 1.59 7 1.08 12 1.31 6 0.44 6 0.26 36 4.6829 Nordic American NATS 30 4.64 30 4.6430 New Shipping 11 3.26 5 0.79 5 0.53 21 4.5831 Kuwait Petroleum 12 3.80 4 0.44 2 0.14 4 0.19 22 4.5732 Alpha Tankers 9 2.79 8 1.27 4 0.43 21 4.4933 Eastern Med Mar 9 2.73 10 1.07 10 0.44 29 4.2534 TORM A/S 8 0.83 7 0.52 60 2.82 75 4.1735 Formosa Plastics Grp 9 2.68 2 0.23 6 0.44 15 0.70 32 4.0436 Marmaras Navigation 1 0.30 17 2.70 7 0.78 25 3.7837 Capital Maritime 5 1.52 5 0.78 2 0.23 27 1.25 39 3.7838 A.P. Moller 16 1.74 45 1.89 61 3.6339 Eastern Pacific Shpg 1 0.30 6 0.96 17 1.84 7 0.33 31 3.4240 Knutsen NYK 15 2.28 6 0.70 2 0.12 5 0.19 28 3.28
Others(651) 186 56.8 251 39.3 518 56.3 301 21.9 1,653 66.0 2,909 240.4Total 735 226.0 557 87.0 999 108.7 449 32.6 2,238 92.5 4,978 546.8
Note: Fleet data includes crude and product tankers 10,000+ dwt. Data basis owner group.
Clarksons Research
Fleet Development By Owner Nationality Fleet By Owner Nationality (dwt)
Page viii Dec-17
Oil Tanker Fleet Dec 2017Total Fleet
VLCC Suezmax Aframax Panamax Handy200,000+ 125-199,999 85-124,999 55-84,999 10-54,999
0
20
40
60
80
100
120
140
160
Dec
-07
Dec
-08
Dec
-09
Dec
-10
Dec
-11
Dec
-12
Dec
-13
Dec
-14
Dec
-15
Dec
-16
Dec
-17
m dwt
USChinaJapanGreece
Greece26%
China9%
Japan7%US
7%Norway
5%
Singapore4%
South Korea3%
Other40%
Lice
nsed
to C
lark
sons
Res
earc
h S
ampl
e. D
istr
ibut
ion
is r
estr
icte
d; p
leas
e re
mem
ber
to a
ckno
wle
dge
the
sour
ce. O
il an
d T
anke
r T
rade
Out
look
, Vol
ume
22 N
o 12
Licensed to Clarksons R
esearch Sam
ple. Distribution is restricted; please rem
ember to acknow
ledge the source. Oil and T
anker Trade O
utlook, Volum
e 22 No 12

Top Oil Tanker Owners
Top Oil Tanker Fleet Fleet Orderbook Delivery Schedule
Owners Dec-17 Dec-17
(by dwt capacity) No. m dwt No. m dwt No. m dwt No. m dwt %Flt 2017 2018 2019+
1 China COSCO Shipping 103 14.70 106 15.17 122 17.61 16 3.34 19% 0.07 1.52 1.752 China Merchants Grp 85 13.18 88 14.55 92 15.83 14 3.30 21% 0.05 2.94 0.313 NIOC 54 13.54 57 14.42 55 13.82 0 0.00 0% 0.00 0.00 0.004 Bahri 37 10.33 46 11.83 51 13.33 5 1.49 11% 0.00 1.49 0.005 Euronav NV 48 11.78 49 12.37 50 12.65 4 0.64 5% 0.00 0.64 0.006 Mitsui O.S.K. Lines 80 13.00 81 13.08 78 12.56 3 0.15 1% 0.05 0.05 0.057 Teekay Corporation 108 14.65 97 12.82 92 12.22 5 0.67 5% 0.00 0.16 0.528 SCF Group 113 11.36 124 12.05 125 12.20 5 0.50 4% 0.00 0.34 0.169 Angelicoussis Group 34 9.29 39 10.88 46 12.19 9 2.86 23% 0.00 1.59 1.27
10 Fredriksen Group 46 9.06 47 9.38 59 11.05 7 1.60 14% 0.00 0.96 0.6411 Petronas 56 8.53 62 9.22 63 9.73 8 1.02 10% 0.00 0.77 0.2512 Dynacom Tankers Mngt 53 8.73 54 8.89 58 9.46 6 0.72 8% 0.00 0.72 0.0013 DHT Holdings 19 5.22 21 6.10 28 8.23 4 1.27 15% 0.00 1.27 0.0014 Tsakos Group 56 5.76 65 6.86 74 7.85 0 0.00 0% 0.00 0.00 0.0015 Ocean Tankers 67 7.86 64 7.82 64 7.82 0 0.00 0% 0.00 0.00 0.0016 Gener8 Maritime 28 5.42 39 9.09 31 7.79 0 0.00 0% 0.00 0.00 0.0017 Scorpio Group 79 4.93 76 4.92 106 7.48 2 0.10 1% 0.00 0.10 0.0018 Sinokor Merchant 55 5.47 66 6.19 71 7.48 3 0.22 3% 0.07 0.15 0.0019 Minerva Marine 53 5.74 55 6.09 61 7.02 6 0.73 10% 0.00 0.73 0.0020 Nippon Yusen Kaisha 37 7.22 33 6.54 35 6.64 4 1.24 19% 0.00 0.00 1.2421 Thenamaris 51 5.31 49 5.17 57 6.45 5 0.65 10% 0.00 0.43 0.2222 SK Holdings 23 5.98 23 5.98 23 5.98 0 0.00 0% 0.00 0.00 0.0023 Navios Group 47 5.96 46 5.91 46 5.91 0 0.00 0% 0.00 0.00 0.0024 Intl Seaways 0 0.00 41 5.18 43 5.78 0 0.00 0% 0.00 0.00 0.0025 Cardiff Marine 32 4.39 34 4.49 41 5.50 11 2.12 39% 0.16 0.57 1.3926 Oman Shipping Co 19 4.92 27 5.29 27 5.29 0 0.00 0% 0.00 0.00 0.0027 Olympic Shpg & Mngt 13 3.09 16 4.05 21 5.27 0 0.00 0% 0.00 0.00 0.0028 Shpg Corp of India 35 4.52 35 4.52 36 4.68 0 0.00 0% 0.00 0.00 0.0029 Nordic American NATS 24 3.72 29 4.48 30 4.64 3 0.47 10% 0.00 0.47 0.0030 New Shipping 16 3.36 18 3.77 21 4.58 0 0.00 0% 0.00 0.00 0.0031 Kuwait Petroleum 24 4.81 23 4.69 22 4.57 0 0.00 0% 0.00 0.00 0.0032 Alpha Tankers 16 3.24 18 3.72 21 4.49 2 0.23 5% 0.00 0.23 0.0033 Eastern Med Mar 25 3.24 27 3.65 29 4.25 0 0.00 0% 0.00 0.00 0.0034 TORM A/S 65 3.57 65 3.57 75 4.17 8 0.66 16% 0.12 0.35 0.2035 Formosa Plastics Grp 33 4.35 33 4.35 32 4.04 3 0.15 4% 0.00 0.00 0.1536 Marmaras Navigation 25 3.78 25 3.78 25 3.78 0 0.00 0% 0.00 0.00 0.0037 Capital Maritime 31 3.02 37 3.82 39 3.78 0 0.00 0% 0.00 0.00 0.0038 A.P. Moller 52 3.11 57 3.39 61 3.63 19 1.60 44% 0.05 0.35 1.2039 Eastern Pacific Shpg 28 2.90 31 3.38 31 3.42 4 0.33 10% 0.00 0.28 0.0540 Knutsen NYK 25 2.75 25 2.80 28 3.28 0 0.00 0% 0.00 0.00 0.00
Others(651) 2,887 244.8 2,875 237.1 2,909 240.4 316 36.1 15% 1.1 19.3 15.8Total 4,579 491.9 4,803 521.4 4,978 546.8 472 62.2 11% 1.6 35.4 25.2
Note: Fleet data includes crude and product tankers 10,000+ dwt. Data basis owner group.
Clarksons Research Page ix Dec-17
start'16 start'17 m dwt
Orderbook Development By Owner Nationality Orderbook By Owner Nationality (dwt)
0
5
10
15
20
25
30
35
40
45
Dec
-07
Dec
-08
Dec
-09
Dec
-10
Dec
-11
Dec
-12
Dec
-13
Dec
-14
Dec
-15
Dec
-16
Dec
-17
m dwt
GreeceJapanChinaSingapore
Greece23%
Japan16%
China15%
Singapore6%
Norway4%
South Korea
4%
Denmark4%
Other28%
Lice
nsed
to C
lark
sons
Res
earc
h S
ampl
e. D
istr
ibut
ion
is r
estr
icte
d; p
leas
e re
mem
ber
to a
ckno
wle
dge
the
sour
ce. O
il an
d T
anke
r T
rade
Out
look
, Vol
ume
22 N
o 12
Licensed to Clarksons R
esearch Sam
ple. Distribution is restricted; please rem
ember to acknow
ledge the source. Oil and T
anker Trade O
utlook, Volum
e 22 No 12
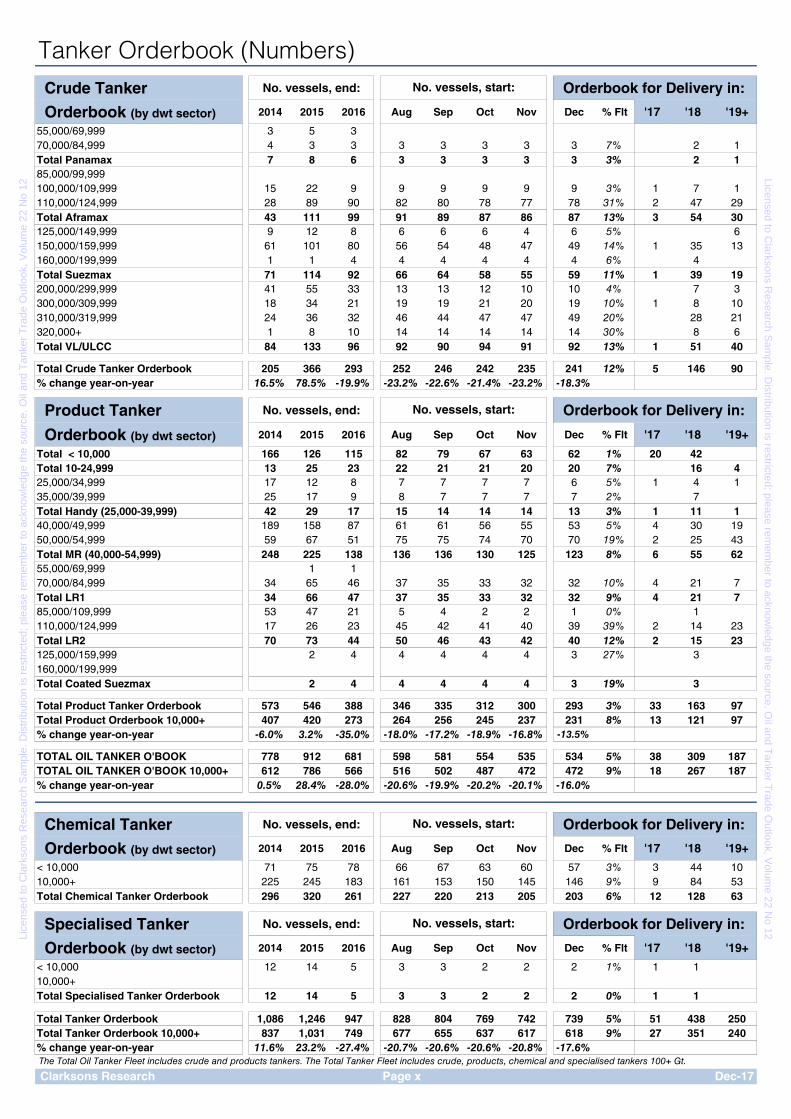
Tanker Orderbook (Numbers)Crude Tanker No. vessels, end: Orderbook for Delivery in:
Orderbook (by dwt sector) 2014 2015 2016 Aug Sep Oct Nov Dec % Flt '17 '18 '19+
55,000/69,999 3 5 370,000/84,999 4 3 3 3 3 3 3 3 7% 2 1Total Panamax 7 8 6 3 3 3 3 3 3% 2 185,000/99,999100,000/109,999 15 22 9 9 9 9 9 9 3% 1 7 1110,000/124,999 28 89 90 82 80 78 77 78 31% 2 47 29Total Aframax 43 111 99 91 89 87 86 87 13% 3 54 30125,000/149,999 9 12 8 6 6 6 4 6 5% 6150,000/159,999 61 101 80 56 54 48 47 49 14% 1 35 13160,000/199,999 1 1 4 4 4 4 4 4 6% 4Total Suezmax 71 114 92 66 64 58 55 59 11% 1 39 19200,000/299,999 41 55 33 13 13 12 10 10 4% 7 3300,000/309,999 18 34 21 19 19 21 20 19 10% 1 8 10310,000/319,999 24 36 32 46 44 47 47 49 20% 28 21320,000+ 1 8 10 14 14 14 14 14 30% 8 6Total VL/ULCC 84 133 96 92 90 94 91 92 13% 1 51 40
Total Crude Tanker Orderbook 205 366 293 252 246 242 235 241 12% 5 146 90% change year-on-year 16.5% 78.5% -19.9% -23.2% -22.6% -21.4% -23.2% -18.3%
Product Tanker No. vessels, end: Orderbook for Delivery in:
Orderbook (by dwt sector) 2014 2015 2016 Aug Sep Oct Nov Dec % Flt '17 '18 '19+
Total < 10,000 166 126 115 82 79 67 63 62 1% 20 42Total 10-24,999 13 25 23 22 21 21 20 20 7% 16 425,000/34,999 17 12 8 7 7 7 7 6 5% 1 4 135,000/39,999 25 17 9 8 7 7 7 7 2% 7Total Handy (25,000-39,999) 42 29 17 15 14 14 14 13 3% 1 11 140,000/49,999 189 158 87 61 61 56 55 53 5% 4 30 1950,000/54,999 59 67 51 75 75 74 70 70 19% 2 25 43Total MR (40,000-54,999) 248 225 138 136 136 130 125 123 8% 6 55 6255,000/69,999 1 170,000/84,999 34 65 46 37 35 33 32 32 10% 4 21 7Total LR1 34 66 47 37 35 33 32 32 9% 4 21 785,000/109,999 53 47 21 5 4 2 2 1 0% 1110,000/124,999 17 26 23 45 42 41 40 39 39% 2 14 23Total LR2 70 73 44 50 46 43 42 40 12% 2 15 23125,000/159,999 2 4 4 4 4 4 3 27% 3160,000/199,999Total Coated Suezmax 2 4 4 4 4 4 3 19% 3
Total Product Tanker Orderbook 573 546 388 346 335 312 300 293 3% 33 163 97Total Product Orderbook 10,000+ 407 420 273 264 256 245 237 231 8% 13 121 97% change year-on-year -6.0% 3.2% -35.0% -18.0% -17.2% -18.9% -16.8% -13.5%
TOTAL OIL TANKER O'BOOK 778 912 681 598 581 554 535 534 5% 38 309 187TOTAL OIL TANKER O'BOOK 10,000+ 612 786 566 516 502 487 472 472 9% 18 267 187% change year-on-year 0.5% 28.4% -28.0% -20.6% -19.9% -20.2% -20.1% -16.0%
Chemical Tanker No. vessels, end: Orderbook for Delivery in:
Orderbook (by dwt sector) 2014 2015 2016 Aug Sep Oct Nov Dec % Flt '17 '18 '19+
< 10,000 71 75 78 66 67 63 60 57 3% 3 44 1010,000+ 225 245 183 161 153 150 145 146 9% 9 84 53Total Chemical Tanker Orderbook 296 320 261 227 220 213 205 203 6% 12 128 63
Specialised Tanker No. vessels, end: Orderbook for Delivery in:
Orderbook (by dwt sector) 2014 2015 2016 Aug Sep Oct Nov Dec % Flt '17 '18 '19+
< 10,000 12 14 5 3 3 2 2 2 1% 1 110,000+Total Specialised Tanker Orderbook 12 14 5 3 3 2 2 2 0% 1 1
Total Tanker Orderbook 1,086 1,246 947 828 804 769 742 739 5% 51 438 250Total Tanker Orderbook 10,000+ 837 1,031 749 677 655 637 617 618 9% 27 351 240% change year-on-year 11.6% 23.2% -27.4% -20.7% -20.6% -20.6% -20.8% -17.6%
Clarksons Research The Total Oil Tanker Fleet includes crude and products tankers. The Total Tanker Fleet includes crude, products, chemical and specialised tankers 100+ Gt.
No. vessels, start:
No. vessels, start:
No. vessels, start:
No. vessels, start:
Dec-17Page x
Lice
nsed
to C
lark
sons
Res
earc
h S
ampl
e. D
istr
ibut
ion
is r
estr
icte
d; p
leas
e re
mem
ber
to a
ckno
wle
dge
the
sour
ce. O
il an
d T
anke
r T
rade
Out
look
, Vol
ume
22 N
o 12
Licensed to Clarksons R
esearch Sam
ple. Distribution is restricted; please rem
ember to acknow
ledge the source. Oil and T
anker Trade O
utlook, Volum
e 22 No 12

Tanker Orderbook (Dwt)Crude Tanker Million Dwt, end: Orderbook for Delivery in:
Orderbook (by dwt sector) 2014 2015 2016 Aug Sep Oct Nov Dec % Flt '17 '18 '19+
55,000/69,999 0.2 0.3 0.2 0.0 0.0 0.0 0.0 0.0 0% 0.0 0.0 0.070,000/84,999 0.3 0.2 0.2 0.2 0.2 0.2 0.2 0.2 7% 0.0 0.1 0.1Total Panamax 0.5 0.5 0.4 0.2 0.2 0.2 0.2 0.2 4% 0.0 0.1 0.185,000/99,999 0.0 0.0 0.0 0.0 0.0 0.0 0.0 0.0 0% 0.0 0.0 0.0100,000/109,999 1.6 2.4 1.0 1.0 1.0 1.0 1.0 1.0 3% 0.1 0.7 0.1110,000/124,999 3.2 10.1 10.2 9.4 9.1 8.9 8.8 8.9 31% 0.2 5.4 3.3Total Aframax 4.8 12.5 11.2 10.3 10.1 9.9 9.7 9.8 14% 0.3 6.1 3.4125,000/149,999 1.3 1.8 1.2 0.8 0.8 0.8 0.5 0.8 5% 0.0 0.0 0.8150,000/159,999 9.6 15.9 12.6 8.8 8.5 7.6 7.4 7.7 14% 0.2 5.5 2.1160,000/199,999 0.2 0.2 0.6 0.6 0.6 0.6 0.6 0.6 6% 0.0 0.6 0.0Total Suezmax 11.1 17.9 14.4 10.3 10.0 9.0 8.6 9.1 11% 0.2 6.2 2.8200,000/299,999 12.3 16.5 9.9 3.9 3.9 3.6 3.0 3.0 4% 0.0 2.1 0.9300,000/309,999 5.5 10.3 6.4 5.8 5.8 6.4 6.1 5.8 10% 0.3 2.4 3.0310,000/319,999 7.6 11.3 10.0 14.5 13.9 14.8 14.8 15.4 20% 0.0 8.8 6.6320,000+ 0.3 2.6 3.2 4.5 4.5 4.5 4.5 4.5 30% 0.0 2.6 1.9Total VL/ULCC 25.7 40.7 29.5 28.6 28.0 29.2 28.3 28.7 13% 0.3 15.9 12.5
Total Crude Tanker Orderbook 42.1 71.6 55.6 49.5 48.3 48.3 46.8 47.9 12% 0.8 28.3 18.8% change year-on-year 11.2% 70.1% -22.4% -22.0% -22.7% -19.7% -20.1% -14.4%
Product Tanker Million Dwt, end: Orderbook for Delivery in:
Orderbook (by dwt sector) 2014 2015 2016 Aug Sep Oct Nov Dec % Flt '17 '18 '19+
Total < 10,000 0.6 0.5 0.6 0.5 0.4 0.4 0.4 0.4 2% 0.1 0.3 0.0Total 10-24,999 0.2 0.4 0.4 0.4 0.3 0.3 0.3 0.3 8% 0.0 0.3 0.125,000/34,999 0.5 0.4 0.3 0.2 0.2 0.2 0.2 0.2 6% 0.0 0.1 0.035,000/39,999 1.0 0.7 0.3 0.3 0.3 0.3 0.3 0.3 2% 0.0 0.3 0.0Total Handy (25,000-39,999) 1.5 1.1 0.6 0.5 0.5 0.5 0.5 0.5 3% 0.0 0.4 0.040,000/49,999 9.2 7.7 4.2 3.0 3.0 2.7 2.7 2.6 5% 0.2 1.5 0.950,000/54,999 3.0 3.4 2.6 3.8 3.8 3.7 3.5 3.5 18% 0.1 1.3 2.2Total MR (40,000-54,999) 12.2 11.1 6.8 6.7 6.7 6.4 6.2 6.1 8% 0.3 2.7 3.155,000/69,999 0.0 0.1 0.1 0.0 0.0 0.0 0.0 0.0 0% 0.0 0.0 0.070,000/84,999 2.5 4.9 3.4 2.8 2.6 2.5 2.4 2.4 10% 0.3 1.6 0.5Total LR1 2.5 4.9 3.5 2.8 2.6 2.5 2.4 2.4 9% 0.3 1.6 0.585,000/109,999 5.8 5.2 2.3 0.5 0.4 0.2 0.2 0.1 0% 0.0 0.1 0.0110,000/124,999 1.9 3.0 2.6 5.2 4.8 4.7 4.6 4.5 39% 0.2 1.6 2.6Total LR2 7.8 8.1 4.9 5.7 5.3 4.9 4.8 4.6 12% 0.2 1.7 2.6125,000/159,999 0.0 0.3 0.6 0.6 0.6 0.6 0.6 0.5 27% 0.0 0.5 0.0160,000/199,999 0.0 0.0 0.0 0.0 0.0 0.0 0.0 0.0 0% 0.0 0.0 0.0Total Coated Suezmax 0.0 0.3 0.6 0.6 0.6 0.6 0.6 0.5 19% 0.0 0.5 0.0
Total Product Tanker Orderbook 24.7 26.4 17.5 17.2 16.5 15.7 15.2 14.7 8% 1.0 7.4 6.4Total Product Orderbook 10,000+ 24.2 25.9 16.9 16.8 16.1 15.3 14.9 14.3 9% 0.9 7.1 6.4% change year-on-year -3.8% 7.2% -34.9% -16.8% -16.9% -18.7% -16.8% -15.0%
TOTAL OIL TANKER O'BOOK 66.8 98.0 73.0 66.7 64.8 64.0 62.1 62.6 11% 1.8 35.7 25.2TOTAL OIL TANKER O'BOOK 10,000+ 66.3 97.5 72.5 66.3 64.4 63.6 61.7 62.2 11% 1.6 35.4 25.2% change year-on-year 5.2% 47.1% -25.7% -20.8% -21.3% -19.4% -19.4% -14.5%
Chemical Tanker Million Dwt, end: Orderbook for Delivery in:
Orderbook (by dwt sector) 2014 2015 2016 Aug Sep Oct Nov Dec % Flt '17 '18 '19+
< 10,000 0.3 0.4 0.5 0.4 0.4 0.4 0.4 0.4 4% 0.0 0.3 0.110,000+ 6.4 6.3 4.6 4.0 3.8 3.7 3.5 3.4 10% 0.2 2.0 1.3Total Chemical Tanker Orderbook 6.7 6.6 5.1 4.4 4.2 4.1 3.9 3.8 9% 0.2 2.2 1.3
Specialised Tanker Million Dwt, end: Orderbook for Delivery in:
Orderbook (by dwt sector) 2014 2015 2016 Aug Sep Oct Nov Dec % Flt '17 '18 '19+
< 10,000 0.03 0.04 0.02 0.01 0.01 0.01 0.01 0.01 1% 0.00 0.00 0.0010,000+ 0.00 0.00 0.00 0.00 0.00 0.00 0.00 0.00 0% 0.00 0.00 0.00Total Specialised Tanker Orderbook 0.03 0.04 0.02 0.01 0.01 0.01 0.01 0.01 1% 0.00 0.00 0.00
Total Tanker Orderbook 73.6 104.7 78.1 71.1 69.0 68.1 66.0 66.4 11% 2.0 37.9 26.5Total Tanker Orderbook 10,000+ 72.7 103.8 77.1 70.2 68.1 67.3 65.2 65.6 11% 1.8 37.4 26.4% change year-on-year 7.9% 42.8% -25.7% -20.8% -21.4% -19.6% -19.7% -15.4%
Clarksons Research
Million Dwt, start:
Million Dwt, start:
Million Dwt, start:
Million Dwt, start:
The Total Oil Tanker Fleet includes crude and products tankers. The Total Tanker Fleet includes crude, products, chemical and specialised tankers 100+ Gt.
Page xi Dec-17
Lice
nsed
to C
lark
sons
Res
earc
h S
ampl
e. D
istr
ibut
ion
is r
estr
icte
d; p
leas
e re
mem
ber
to a
ckno
wle
dge
the
sour
ce. O
il an
d T
anke
r T
rade
Out
look
, Vol
ume
22 N
o 12
Licensed to Clarksons R
esearch Sam
ple. Distribution is restricted; please rem
ember to acknow
ledge the source. Oil and T
anker Trade O
utlook, Volum
e 22 No 12

Top Oil Tanker BuildersOil Tanker Orderbook Dec 2017
0 0 0 0 0 0 0 0 0 ### ## ###Builders(by dwt on order) No. m dwt No. m dwt No. m dwt No. m dwt No. m dwt No. m dwt No. m dwt No. m dwt
Dalian Shipbuilding China 17 5.3 3 0.5 10 1.2 5 0.4 1 0.1 13 3.1 21 4.1 35 7.3Hyundai Samho HI S. Korea 10 3.0 13 2.1 5 0.6 0 0.0 0 0.0 23 4.6 5 1.0 28 5.7Daewoo (DSME) S. Korea 17 5.3 0 0.0 0 0.0 0 0.0 0 0.0 8 2.5 9 2.8 17 5.3Hyundai HI (Ulsan) S. Korea 9 2.8 10 1.6 0 0.0 1 0.1 0 0.0 14 2.9 6 1.6 20 4.5JMU Ariake Shipyard Japan 13 4.1 0 0.0 0 0.0 0 0.0 1 0.3 8 2.5 4 1.2 13 4.1Samsung HI S. Korea 4 1.3 11 1.5 6 0.7 1 0.0 0 0.0 13 2.1 9 1.4 22 3.5New Times SB China 0 0.0 10 1.6 9 1.0 4 0.2 0 0.0 8 1.2 15 1.6 23 2.8Namura Shipbuilding Japan 4 1.2 0 0.0 7 0.8 0 0.0 0 0.0 8 1.3 3 0.7 11 2.0HHIC-Phil (Subic SY) Phil. 5 1.6 0 0.0 2 0.2 0 0.0 0 0.0 3 0.5 4 1.3 7 1.8Daehan Shipbuilding S. Korea 0 0.0 0 0.0 14 1.6 0 0.0 1 0.1 7 0.8 6 0.7 14 1.6Hyundai Mipo S. Korea 0 0.0 0 0.0 0 0.0 31 1.6 1 0.0 22 1.1 8 0.4 31 1.6Tsuneishi Zosen Japan 0 0.0 0 0.0 14 1.6 0 0.0 1 0.1 5 0.5 8 0.9 14 1.6Hyundai Vinashin Vietnam 0 0.0 0 0.0 0 0.0 27 1.4 2 0.1 11 0.6 14 0.7 27 1.4Onomichi Dockyd Japan 0 0.0 0 0.0 1 0.1 23 1.3 0 0.0 7 0.3 17 1.0 24 1.4Sumitomo (Yokosuka) Japan 0 0.0 0 0.0 12 1.3 0 0.0 1 0.1 4 0.4 7 0.8 12 1.3Mitsui SB (Chiba) Japan 4 1.3 0 0.0 0 0.0 0 0.0 0 0.0 2 0.6 2 0.6 4 1.3GSI Nansha China 0 0.0 0 0.0 4 0.5 14 0.7 2 0.2 8 0.6 8 0.4 18 1.2Jinhai Heavy Ind China 4 1.2 0 0.0 0 0.0 0 0.0 0 0.0 1 0.3 3 0.9 4 1.2Shanghai Waigaoqiao China 0 0.0 3 0.5 4 0.5 0 0.0 1 0.2 6 0.8 0 0.0 7 0.9Nantong COSCO KHI China 3 0.9 0 0.0 0 0.0 0 0.0 0 0.0 3 0.9 0 0.0 3 0.9Sasebo HI Japan 0 0.0 0 0.0 8 0.9 0 0.0 0 0.0 7 0.8 1 0.1 8 0.9Jiangsu Hantong HI China 0 0.0 0 0.0 6 0.7 4 0.2 0 0.0 9 0.8 1 0.1 10 0.9CIC (Jiangsu) China 0 0.0 3 0.5 3 0.3 0 0.0 1 0.1 5 0.7 0 0.0 6 0.8Navantia Ferrol Spain 0 0.0 4 0.6 0 0.0 0 0.0 0 0.0 3 0.5 1 0.2 4 0.6Dalian COSCO KHI China 2 0.6 0 0.0 0 0.0 0 0.0 0 0.0 2 0.6 0 0.0 2 0.6Sungdong SB S. Korea 0 0.0 0 0.0 5 0.6 0 0.0 0 0.0 2 0.2 3 0.3 5 0.6Atlantico Sul Brazil 0 0.0 0 0.0 5 0.6 0 0.0 0 0.0 3 0.3 2 0.2 5 0.6Zvezda Shipbuilding Russia 0 0.0 0 0.0 5 0.6 0 0.0 0 0.0 0 0.0 5 0.6 5 0.6Shin Kurushima Japan 0 0.0 0 0.0 0 0.0 11 0.6 0 0.0 0 0.0 11 0.6 11 0.6JMU Tsu Shipyard Japan 0 0.0 3 0.5 0 0.0 0 0.0 0 0.0 2 0.3 1 0.2 3 0.5Samsung Ningbo China 0 0.0 0 0.0 0 0.0 9 0.4 1 0.0 7 0.3 1 0.0 9 0.4JMU Maizuru Shipyard Japan 0 0.0 0 0.0 0 0.0 8 0.4 0 0.0 4 0.2 4 0.2 8 0.4Jiangsu New Hantong China 0 0.0 0 0.0 0 0.0 5 0.4 1 0.1 4 0.3 0 0.0 5 0.4STX SB (Jinhae) S. Korea 0 0.0 0 0.0 0 0.0 4 0.3 1 0.1 3 0.2 0 0.0 4 0.3COSCO Dalian SY China 0 0.0 0 0.0 2 0.2 0 0.0 0 0.0 2 0.2 0 0.0 2 0.2COSCO Zhoushan China 0 0.0 0 0.0 2 0.2 0 0.0 0 0.0 2 0.2 0 0.0 2 0.2JMU Kure Shipyard Japan 0 0.0 1 0.2 0 0.0 0 0.0 0 0.0 1 0.2 0 0.0 1 0.2Jiangsu New YZJ China 0 0.0 1 0.2 0 0.0 0 0.0 0 0.0 1 0.2 0 0.0 1 0.2Tsuneishi Zhoushan China 0 0.0 0 0.0 0 0.0 2 0.2 0 0.0 1 0.1 1 0.1 2 0.2Minami Nippon Japan 0 0.0 0 0.0 0 0.0 3 0.2 1 0.1 1 0.1 1 0.1 3 0.2Others(27) 0 0.0 0 0.0 3 0.3 39 1.2 2 0.1 34 1.3 6 0.2 42 1.5Total 92 28.7 62 9.6 127 14.4 191 9.5 18 1.6 267 35.4 187 25.2 472 62.2
Note: Data includes crude and product tankers 10,000+ dwt. Aframax includes LR2.
Clarksons Research Page xii Dec-17
Top Oil Tanker Total On OrderVLCC Suezmax Aframax
10-84,999 dwt
2017 2018 2019+
Orderbook By Builder Country (dwt) Orderbook By Year Of Scheduled Delivery
South Korea37%
China31%
Japan23%
Philippines3%
Other6%
0
5
10
15
20
25
30
35
40
2017 2018 2019 2020+
VLCC
Suezmax
Aframax
10-84,999 dwt
Lice
nsed
to C
lark
sons
Res
earc
h S
ampl
e. D
istr
ibut
ion
is r
estr
icte
d; p
leas
e re
mem
ber
to a
ckno
wle
dge
the
sour
ce. O
il an
d T
anke
r T
rade
Out
look
, Vol
ume
22 N
o 12
Licensed to Clarksons R
esearch Sam
ple. Distribution is restricted; please rem
ember to acknow
ledge the source. Oil and T
anker Trade O
utlook, Volum
e 22 No 12

Tanker Sale & Purchase Market
Recently Reported Tanker SalesType Vessel Name Date Dwt Hull Builder Buyer
Product Orion Express Nov-17 35,407 IMO III 1999 Daewoo (DSME) Undisclosed interests
Crude Teide Spirit Nov-17 149,990 D/Hull 2004 Daewoo (DSME) Clients of Eurotankers
Product Caletta Nov-17 51,745 IMO III 2011 Hyundai Mipo Greek interests
Product Torm Rhone Nov-17 35,770 IMO III 2000 Daedong S.B. Clients of PT Waruna
Product Fidias Nov-17 49,999 IMO II/III 2007 STX SB (Jinhae) Clients of PCL Tankers
Crude Singapore Voyager Nov-17 105,850 D/Hull 2003 Namura Shipbuilding Clients of PrimeBulk
Crude Cap Georges Nov-17 147,444 D/Hull 1998 Samsung HI Indian interests
Product Hafnia Africa Nov-17 74,539 D/Hull 2010 STX SB (Jinhae) Japanese interests
Crude RS Aurora Nov-17 159,288 D/Hull 2018 Shanghai Waigaoqiao Greek interests
Crude RS Tara Nov-17 160,036 D/Hull 2016 Shanghai Waigaoqiao Greek interests
Crude RS Kaystros Oct-17 159,962 D/Hull 2018 Shanghai Waigaoqiao Clients of Polembros
Product LR Aldebaran Oct-17 109,672 D/Hull 2007 Dalian Shipbuilding Clients of NGM Energy
Product Sinar Jogya Oct-17 18,010 D/Hull 2001 Jiangdu Yahai Undisclosed interests
Crude Gener8 Zeus Oct-17 318,325 D/Hull 2010 Hyundai HI (Ulsan) Clients of International Seaways
Crude Fujikawa Oct-17 299,984 D/Hull 2004 Universal SB (Tsu) Greek interests
Crude Gener8 Argus Oct-17 159,901 D/Hull 2000 Hyundai HI (Ulsan) Clients of NGM Energy
Product High Prosperity Oct-17 48,711 D/Hull 2006 Iwagi Zosen Norwegian interests
Product Resolve Oct-17 46,048 D/Hull 2004 STX SB (Jinhae) Greek interests
Product Lady Venus Oct-17 13,904 D/Hull 2008 Nantong Tongshun Undisclosed interests
Volume 2012 2013 2014 2015 2016 2017*
Tanker Type:VLCC 20 29 80 38 22 41Suezmax 9 16 35 39 17 25Aframax 32 39 72 46 37 35Panamax 11 18 23 24 7 11Handy (10-54,999 dwt) 79 110 98 83 69 78
Tanker Total 151 212 308 230 152 190
5 Yr Old SH Nov
Prices $m 2012 2013 2014 2015 2016 2017
VLCC 310k dwt 57.0 60.0 77.0 80.0 60.0 63.0Suezmax 160k dwt 40.0 42.0 57.0 60.0 40.0 40.0Aframax 105k dwt 27.5 32.0 42.0 46.0 29.0 30.0Panamax 73k dwt 25.0 31.0 33.5 35.0 28.0 26.5Products 47k dwt 25.0 29.0 25.0 29.0 22.0 24.0Products 37k dwt 22.0 25.0 23.0 25.0 19.0 21.0SH Tanker Price Index 104.1 119.5 121.2 133.7 96.7 98.4
Clarksons Research Page 13 Dec-17
Built Price US$m
Secondhand Tanker Price Index
7.90
27.20
10.40
5.35
18.80
9.80
21.80
Number of Sales
11.30
Secondhand Sales Volume
Sale & Purchase Market News
14.24
Nov
15.80
16.00
Secondhand tanker sales include crude and product tankers over 10,000 dwt. Prices as at end period. *Total sales in year up to month end.
* En bloc sales. # En Bloc price shown under first ship of bloc.
49.00
11.00
End Year
53.00
Sales
• At the end of November, the secondhand tanker price indexstood at 98.4 points, holding relatively steady m-o-m. The indexhas remained below 100 points since June, holding at asuppressed level relative to recent years. All featuredsecondhand prices were unchanged m-o-m, with the guidelinefive year old secondhand price for a VLCC remaining at $63m. • In November, the 2004-built, 149,990 dwt “TEIDE SPIRIT”was sold to clients of Eurotankers for a price of $18.8m, withinterest reportedly attracted from a number of established players.Elsewhere, the 2003-built, 105,850 dwt “SINGAPOREVOYAGER” was sold to clients of PrimeBulk for a price of around$10.4m, which was reported to be a slight uptick when comparedto the two Japanese-controlled Aframax tankers sold inSeptember, both for a price in the region of $10m. In the producttanker sector, the 1999-built, Bangladeshi-controlled Handytanker “ORION EXPRESS” was sold for a price of $5.35m.
0
5
10
15
20
25
30
35
40
45
Nov
-14
Feb
-15
May
-15
Aug
-15
Nov
-15
Feb
-16
May
-16
Aug
-16
Nov
-16
Feb
-17
May
-17
Aug
-17
Nov
-17
Vessel no.
80
100
120
140
160
180
200
220
240
260
Nov
-05
Nov
-06
Nov
-07
Nov
-08
Nov
-09
Nov
-10
Nov
-11
Nov
-12
Nov
-13
Nov
-14
Nov
-15
Nov
-16
Nov
-17
Jan '00 = 100
Lice
nsed
to C
lark
sons
Res
earc
h S
ampl
e. D
istr
ibut
ion
is r
estr
icte
d; p
leas
e re
mem
ber
to a
ckno
wle
dge
the
sour
ce. O
il an
d T
anke
r T
rade
Out
look
, Vol
ume
22 N
o 12
Licensed to Clarksons R
esearch Sam
ple. Distribution is restricted; please rem
ember to acknow
ledge the source. Oil and T
anker Trade O
utlook, Volum
e 22 No 12

* Cost of moving 1,000 bbls of crude oil for 1 mile
VLCC VLCC Costs
Transport Costs Av. Av. Av. Av. Sep Oct Nov This Month
Total % freight 2014 2015 2016 2017* 2017 2017 2017
280,000t Gulf-US Gulf 62.93 1.4% 0.10 0.13 0.09 0.06 0.04 0.05 0.05 WEAKER!! -9%
265,000t Gulf-Japan 63.37 2.1% 0.13 0.17 0.12 0.09 0.07 0.10 0.10 SOFTER -1%
265,000t Gulf-S. Korea 63.18 1.8% 0.13 0.16 0.11 0.08 0.06 0.09 0.09 SOFTER -1%
270,000t Gulf-Singapore 62.83 1.3% 0.14 0.18 0.12 0.09 0.07 0.11 0.11 SOFTER -1%
260,000t WAF-China 65.16 3.1% 0.13 0.17 0.12 0.09 0.07 0.10 0.10 STEADY 1%
260,000t WAF-US Gulf 64.22 1.7% 0.16 0.19 0.14 0.10 0.09 0.11 0.09 WEAKER!! -14%
260,000t WAF- WC India 64.74 2.5% 0.14 0.19 0.14 0.11 0.09 0.12 0.11 WEAKER!! -4%
275,000t Caribs-Singapore 58.05 3.8% 0.17 0.23 0.16 0.14 0.12 0.14 0.15 HIGHER!! 7%
VLCC Transport Cost 0.14 0.18 0.12 0.09 0.08 0.10 0.10 SOFTER -2%
Suezmax Suezmax Costs
Transport Costs Av. Av. Av. Av. Sep Oct Nov This Month
Total % freight 2014 2015 2016 2017* 2017 2017 2017
130,000t WAF-USAC 64.49 2.1% 0.21 0.23 0.15 0.12 0.11 0.13 0.13 STEADY 1%
130,000t WAF-Med 64.30 1.8% 0.23 0.25 0.16 0.13 0.12 0.15 0.14 WEAKER -2%
130,000t Gulf-China 63.43 2.2% 0.22 0.23 0.16 0.12 0.11 0.13 0.13 HIGHER!! 6%
140,000t Med-Med 62.66 1.0% 0.34 0.37 0.25 0.21 0.19 0.23 0.22 WEAKER!! -5%
140,000t Black Sea- Med 63.04 1.3% 0.42 0.47 0.34 0.30 0.29 0.33 0.32 WEAKER!! -5%
130,000t Gulf-WC India 62.55 0.8% 0.30 0.34 0.22 0.18 0.16 0.20 0.21 HIGHER!! 7%
Suezmax Transport Cost 0.29 0.32 0.21 0.18 0.16 0.19 0.19 SOFTER -1%
Aframax Aframax Costs
Transport Costs Av. Av. Av. Av. Sep Oct Nov This Month
Total % freight 2014 2015 2016 2017* 2017 2017 2017
80,000t Med-USAC 64.18 2.4% 0.32 0.32 0.23 0.21 0.20 0.27 0.22 WEAKER!! -21%
80,000t Black Sea-Med 63.42 1.9% 0.49 0.51 0.35 0.33 0.31 0.44 0.36 WEAKER!! -18%
80,000t UKC-UKC 63.62 1.7% 0.96 0.98 0.85 0.93 0.94 1.07 0.90 WEAKER!! -16%
80,000t Sidi Kerir-Trieste 62.72 1.1% 0.45 0.47 0.32 0.28 0.27 0.38 0.29 WEAKER!! -25%
80,000t Gulf-East 63.41 2.2% 0.30 0.32 0.20 0.17 0.15 0.19 0.19 WEAKER -2%
80,000t Indo-Japan 56.49 2.4% 0.32 0.35 0.23 0.18 0.18 0.19 0.20 FIRMER 3%
70,000t Caribs-US Gulf 56.74 1.6% 0.43 0.46 0.30 0.26 0.33 0.28 0.24 WEAKER!! -14%
Aframax Transport Cost 0.47 0.49 0.35 0.34 0.34 0.40 0.34 WEAKER!! -15%Delivered cost= C&F price (sum of freight & cost of oil) prices avg. month. '%'= freight cost as % of Delivered Cost. Commodity costs based on following assumptions:
Clarksons Research
Oil prices based on Dubai-Fateh ex-MEG, Bonny Light-37 ex-WAF, Algerian Sahara Blend ex-Arzew, Dubai-Fateh ex-Sidi Kerir, Russian Urals ex-Black Sea, Brent Blend spot ex-UKC, Venezuela, Merey ex-Caribs and Indonesia, Minas ex-Indonesia. Oil prices sourced from various industry sources. *Indicates average of year to date.
Delivered Cost $/bbl
Delivered Cost $/bbl
Transport Cost ($ per '000bbl/m)
Page 14 Dec-17
Crude Oil Transport Costs
Transport Cost ($ per '000bbl/m)
Transport Cost ($ per '000bbl/m)
Delivered Cost $/bbl
Freight As % Of Delivered CostTransport Cost By Ship Size
0.0
0.2
0.4
0.6
0.8
Nov
-09
May
-10
Nov
-10
May
-11
Nov
-11
May
-12
Nov
-12
May
-13
Nov
-13
May
-14
Nov
-14
May
-15
Nov
-15
May
-16
Nov
-16
May
-17
Nov
-17
Cost in a VLCC
Cost in a Suezmax
Cost in an Aframax
$ per '000bbl/mile *
0%
1%
2%
3%
4%
5%
6%
7%
Nov
-09
May
-10
Nov
-10
May
-11
Nov
-11
May
-12
Nov
-12
May
-13
Nov
-13
May
-14
Nov
-14
May
-15
Nov
-15
May
-16
Nov
-16
May
-17
Nov
-17
VLCC, Gulf-Japan
Suezmax, WAF-Med
Aframax, Black Sea-Med
Lice
nsed
to C
lark
sons
Res
earc
h S
ampl
e. D
istr
ibut
ion
is r
estr
icte
d; p
leas
e re
mem
ber
to a
ckno
wle
dge
the
sour
ce. O
il an
d T
anke
r T
rade
Out
look
, Vol
ume
22 N
o 12
Licensed to Clarksons R
esearch Sam
ple. Distribution is restricted; please rem
ember to acknow
ledge the source. Oil and T
anker Trade O
utlook, Volum
e 22 No 12

Economic and Financial Indicators
Oil Prices
Rott. Sing. Fuj. Hou. Rott. Sing. Fuj.2011 110.9 95.1 114.1 106.2 108.9 617.9 646.9 652.9 625.7 944.5 940.9 1,022.12012 111.7 94.2 113.5 109.1 110.9 639.6 664.1 668.5 646.6 955.3 958.3 1,037.52013 108.7 97.9 111.1 105.6 108.5 594.8 615.9 616.8 602.7 903.8 927.3 1,001.92014 99.4 93.5 100.5 95.8 98.2 532.1 559.7 561.8 545.5 816.6 856.7 960.42015 52.4 48.8 53.4 52.2 51.8 264.1 291.6 292.0 271.0 479.6 498.2 692.32016 43.3 43.2 44.4 41.6 41.9 213.1 232.8 233.2 209.3 383.4 401.6 491.32017 53.3 50.2 54.0 52.1 52.2 303.1 326.6 322.1 300.3 470.6 490.1 564.1
Dec-16 52.0 51.3 53.0 52.0 51.2 296.5 329.3 322.8 295.4 459.2 485.9 535.3Jan-17 54.4 52.5 54.8 53.3 53.4 306.9 340.5 335.0 307.5 466.6 490.6 547.5Feb-17 54.8 53.4 55.7 54.2 53.7 302.5 328.4 325.9 297.0 473.1 499.0 553.8Mar-17 51.8 49.7 52.2 51.1 49.9 282.7 306.9 304.9 284.3 448.6 485.5 553.8Apr-17 52.4 51.2 52.1 49.9 50.7 293.1 315.0 312.3 284.3 463.4 489.4 557.5May-17 50.3 48.4 51.5 47.1 49.0 285.3 310.4 310.3 281.9 438.0 465.6 557.8Jun-17 46.6 45.6 47.4 46.1 45.9 276.8 297.2 297.5 267.6 423.5 438.0 544.8Jul-17 48.8 46.3 49.3 48.4 47.8 287.9 307.3 303.4 282.1 432.1 449.9 553.8Aug-17 51.8 48.5 52.4 51.2 51.3 295.5 313.3 307.3 292.3 459.8 471.3 542.9Sep-17 56.3 49.2 56.8 53.8 54.3 313.9 335.9 329.9 311.5 501.5 501.0 573.7Oct-17 56.9 51.3 58.1 56.5 56.5 319.5 343.0 338.3 311.3 502.6 517.8 579.4Nov-17 60.3 56.2 63.1 62.0 59.9 352.9 373.4 362.9 357.4 528.4 547.9 613.0y-o-y % 37% 23% 39% 40% 38% 40% 34% 31% 42% 30% 21% 17%
Oil prices quoted in USD/bbl. Sahara oil price refers to Algeria, Sahara Blend.
GDP Growth & Forecasts~
2012 2.2% 7.9% 1.5% 5.5% -0.9% 3.5% 11.7% 0.0% 1.5% -2.7% -2.6% -0.1%2013 1.7% 7.8% 2.0% 6.4% -0.2% 2.6% 9.7% -0.7% 0.4% -0.8% 1.2% 0.4%2014 2.6% 7.3% 0.3% 7.5% 1.3% 4.1% 8.3% 2.1% 1.2% 0.5% -3.1% 2.0%2015 2.9% 6.9% 1.1% 8.0% 2.0% 1.2% 6.1% -0.9% 3.3% 1.0% -8.5% 0.8%2016 1.5% 6.7% 1.0% 7.1% 1.8% -0.9% 6.0% -0.2% 0.3% 1.2% -6.7% 0.2%
2017 (f) 2.2% 6.8% 1.5% 6.7% 2.1% 2.2% 6.4% 4.7% 1.2% 3.2% 2.5% 3.1%2018 (f) 2.3% 6.5% 0.7% 7.4% 1.9% 1.5% 6.0% 5.3% 4.3% 3.4% 4.0% 3.0%Q1 2017 2.0% 6.9% 1.3% 6.1% 2.1% 1.6% 6.6% 2.6% 3.8% 3.1% 2.5% 2.5%Q2 2017 2.2% 6.9% 1.7% 6.0% 2.4% 2.9% 6.2% 5.9% 2.2% 3.9% 5.2% 3.9%Q3 2017 2.3% 6.8% 2.1% 6.1% 2.6% 0.0% 6.1% 0.0% 0.0% 0.0% 0.0% 0.0%
*Average of year to date data. Economic and oil price data from various industry sources. ~% change year-on-year. Source: IMF, OECD, The Economist.
Clarksons Research Page 15
MGO, US$/tonne
Bunker Prices
AverageVenez. Sahara
U.S.A China Japan IndiaEuro Area
42%
49.1
Average Dubai Urals380 Cst, US$/tonne
Brent WTI Bonny
55.9
3.6%
-3.8%-3.6%0.7%1.5%-0.5%
3.7%
OECD
2012111.9
0.8%1.4%
WorldBrazil
3.5%3.5%
54.951.2
51.051.0
Historical Oil Price Trends
U.S.A. China EuropeIndia
46.2
Dec-17
41.234.0
45.946.8
46.245.242.543.4
Average
111.9111.4109.286.8
47.044.1
45.4
46.9
50.7
0.5%3.0%1.9%
201320142015
Feb-17Mar-17Apr-17May-17Jun-17Jul-17Aug-17
55.9
111.4109.299.353.043.9
Sep-17Oct-17Nov-17y-o-y %
48.551.8
Jul
2015
BrazilJapan
57.162.639%
3.6%3.4%3.2%
AugSepOctNov
Industrial Production
Average
201220132014
2016
Jan-17Dec-1620172016
GDP figures sourced from the IMF/OECD
Quarterly GDP Growth Trends
2011
53.252.654.5
0
20
40
60
80
100
120
140
Nov
-08
May
-09
Nov
-09
May
-10
Nov
-10
May
-11
Nov
-11
May
-12
Nov
-12
May
-13
Nov
-13
May
-14
Nov
-14
May
-15
Nov
-15
May
-16
Nov
-16
May
-17
Nov
-17
US$/bbl
WTI
Brent
-10%
-5%
0%
5%
10%
15%
Q1
2007
Q3
2007
Q1
2008
Q3
2008
Q1
2009
Q3
2009
Q1
2010
Q3
2010
Q1
2011
Q3
2011
Q1
2012
Q3
2012
Q1
2013
Q3
2013
Q1
2014
Q3
2014
Q1
2015
Q3
2015
Q1
2016
Q3
2016
Q1
2017
Q3
2017
USChinaEuro AreaIndia
% y-o-y
Brent Blend, 06/12/2017 US$/bblSpot Price 61.2
Futures PriceMar-18 61.0Jun-18 60.7Sep-18 60.1
Lice
nsed
to C
lark
sons
Res
earc
h S
ampl
e. D
istr
ibut
ion
is r
estr
icte
d; p
leas
e re
mem
ber
to a
ckno
wle
dge
the
sour
ce. O
il an
d T
anke
r T
rade
Out
look
, Vol
ume
22 N
o 12
Licensed to Clarksons R
esearch Sam
ple. Distribution is restricted; please rem
ember to acknow
ledge the source. Oil and T
anker Trade O
utlook, Volum
e 22 No 12

Global Oil Supply
Middle Eastern Year-on-Year Trend &
Producers 2010 2011 2012 2013 2015 2016 2017 2018 OutlookSaudi Arabia 8.9 9.5 9.8 9.7 10.2 10.4 9.9 9.8 STEADY... -1%Iran 4.2 4.2 3.5 3.2 3.4 4.2 4.4 4.8 FIRMER... 9%UAE 2.4 2.7 2.8 2.8 3.0 3.1 3.0 3.0 STEADY... 2%Kuwait 2.0 2.2 2.5 2.6 2.8 2.9 2.8 2.7 STEADY... -2%Iraq 2.4 2.6 3.0 3.1 4.1 4.5 4.5 4.6 STEADY... 2%Others 5.8 6.1 6.1 6.1 5.9 5.9 5.7 5.8 STEADY... 2%Total 25.8 27.3 27.7 27.4 29.3 31.0 30.3 30.8 STEADY... 2%
N. & S. American Year-on-Year Trend &
Producers 2010 2011 2012 2013 2015 2016 2017 2018 OutlookUnited States 7.5 7.5 7.9 8.9 12.8 12.4 12.7 13.6 FIRM.... 7%Canada 2.7 2.7 2.9 3.1 3.7 3.7 4.0 4.2 FIRM.... 7%Mexico 3.0 3.0 2.9 2.9 2.6 2.5 2.3 2.2 SOFTER... -8%Total North America 13.8 13.8 14.3 15.6 19.7 19.3 19.7 20.8 FIRM.... 5%Venezuela 3.0 3.0 3.0 2.9 2.7 2.5 2.2 1.9 WEAKER... -11%Brazil 2.1 2.1 2.1 2.1 2.4 2.5 2.7 3.0 FIRMER... 9%Total Latin America 7.5 7.5 7.7 7.5 7.8 7.4 7.4 7.4 STEADY... 0%Total Americas 21.3 21.3 21.9 23.1 27.5 26.7 27.2 28.2 FIRM.... 4%
Other Major Year-on-Year Trend &
Producers 2010 2011 2012 2013 2015 2016 2017 2018 OutlookNigeria 2.5 2.5 2.5 2.5 2.1 1.6 1.7 1.8 FIRMER... 8%Libya 1.8 1.8 0.5 1.5 0.4 0.4 0.8 0.9 FIRMER... 11%Algeria 1.5 1.5 1.5 1.5 1.4 1.3 1.3 1.3 SOFTER... -3%Angola 1.9 1.9 1.8 1.8 1.8 1.8 1.7 1.8 FIRM.... 3%Total Africa 10.5 10.5 9.1 9.7 8.2 7.6 8.0 8.1 STEADY... 2%
Norway 1.9 1.9 1.8 1.6 1.6 1.7 1.6 1.7 FIRM.... 4%UK 1.2 1.2 1.0 0.9 0.9 0.9 0.9 1.0 FIRMER... 9%North Sea Total 3.4 3.4 3.0 2.7 2.8 2.8 2.7 2.8 FIRM.... 5%
Russia 10.5 10.5 10.7 10.7 11.1 11.3 11.2 11.3 STEADY... 1%Other FSU (excl. Russia) 3.1 3.1 3.1 3.0 3.0 3.0 3.0 3.1 FIRM.... 3%China 4.1 4.1 4.1 4.1 4.3 4.0 3.8 3.7 SOFTER... -3%Others 9.8 8.9 11.2 10.3 9.9 9.9 9.9 9.9 STEADY... 0%
Global Year-on-Year Trend &
Total 2010 2011 2012 2013 2015 2016 2017 2018 OutlookTotal # 88.4 89.0 90.7 91.0 96.0 96.2 96.0 98.0 STEADY... 2%% Change 3.4% 0.7% 1.9% 0.4% 2.7% 0.3% -0.2% 2.0%Note: Global total supply includes NGLs, lease condensates, refinery gains and other liquids, regional totals include crude, lease condensates and NGLs.
Clarksons Research Page 16 Dec-17
Global Oil Supply Growth Commentary
Million Barrels Per Day
2014
9.73.32.92.63.46.2
28.1
Million Barrels Per Day
2014
11.83.62.818.82.82.37.626.5
Million Barrels Per Day
2014
2.30.51.41.88.3
1.60.8
2014
93.42.6%
2.6
10.93.04.29.8
Million Barrels Per Day
1.8%
-0.9%
3.4%
0.7%
1.9%
0.4%
2.6% 2.7%
0.3%
-0.2%
2.0%
-3%
-2%
-1%
0%
1%
2%
3%
4%
2008
2009
2010
2011
2012
2013
2014
2015
2016
e
2017
f
2018
f
% growth Following the OPEC meeting on the 30th November, it wasannounced that the deal struck in November 2016 to cutoil production by a collective 1.7m bpd would be extendedfor a further nine months, until end 2018. However, therestill remains significant uncertainty over the effect of theextension upon the oil market and as a result, the global oilsupply/demand balance. Primarily, no exit strategy has yetbeen agreed upon, raising questions over certaincountries’ compliance levels (i.e. Russia’s) with the dealfor the full duration of the year. It is expected that SaudiArabian production will fall further in 2018, as output at theKingdom’s third largest oil field, Manifa, remains affectedby technical issues. It is thought that output will notnecessarily be raised elsewhere to compensate for Manifain line with Saudi Arabia’s apparent strategy in 2017 to cutdeeper than stipulated to offset weaker complianceelsewhere. Another source of uncertainty is US oilproduction growth. Providing that the OPEC-led deal issuccessful in buoying oil prices, US oil output is projectedto expand by a firm 7% to 13.6m bpd, boosting expectedglobal oil supply to 98.0m bpd in 2018, up 2% y-o-y.Finally, there also remain a number of political risk factorsto the outlook, including in Venezuela, Libya and Nigeria.
Lice
nsed
to C
lark
sons
Res
earc
h S
ampl
e. D
istr
ibut
ion
is r
estr
icte
d; p
leas
e re
mem
ber
to a
ckno
wle
dge
the
sour
ce. O
il an
d T
anke
r T
rade
Out
look
, Vol
ume
22 N
o 12
Licensed to Clarksons R
esearch Sam
ple. Distribution is restricted; please rem
ember to acknow
ledge the source. Oil and T
anker Trade O
utlook, Volum
e 22 No 12
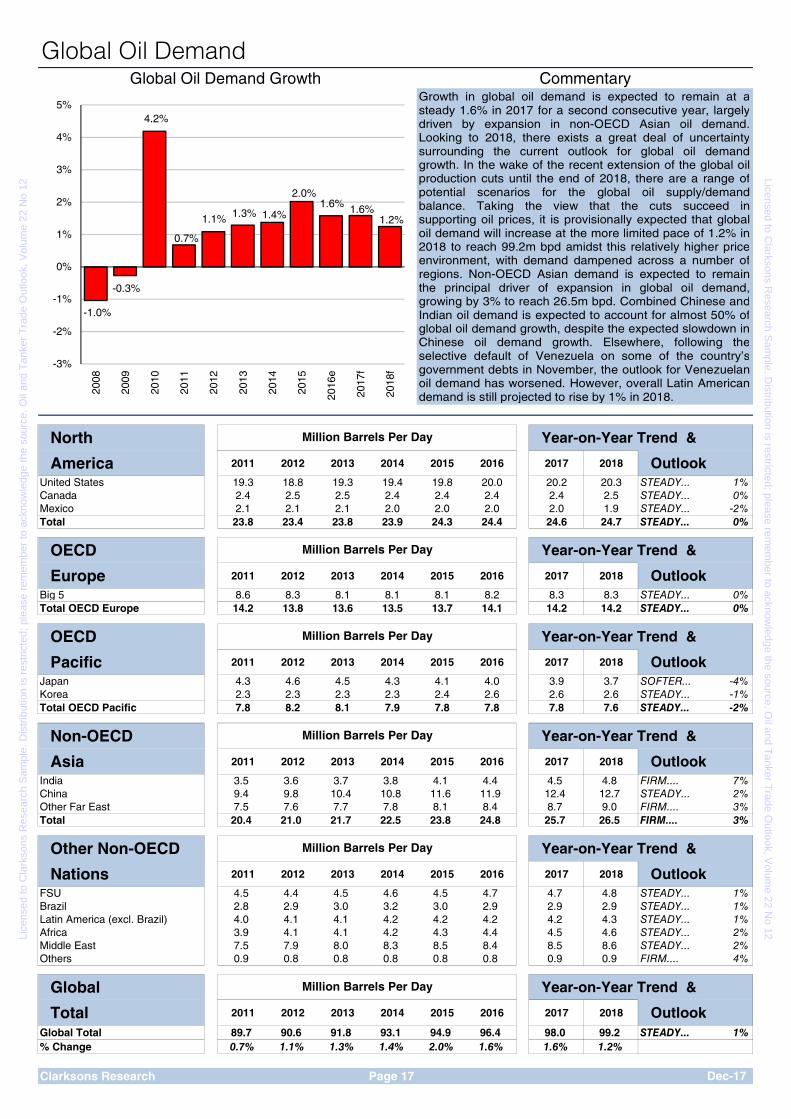
Global Oil DemandGlobal Oil Demand Growth Commentary
North Year-on-Year Trend &
America 2011 2012 2013 2014 2015 2016 2017 2018 OutlookUnited States 19.3 18.8 19.3 19.4 19.8 20.0 20.2 20.3 STEADY... 1%Canada 2.4 2.5 2.5 2.4 2.4 2.4 2.4 2.5 STEADY... 0%Mexico 2.1 2.1 2.1 2.0 2.0 2.0 2.0 1.9 STEADY... -2%Total 23.8 23.4 23.8 23.9 24.3 24.4 24.6 24.7 STEADY... 0%
OECD Year-on-Year Trend &
Europe 2011 2012 2013 2014 2015 2016 2017 2018 OutlookBig 5 8.6 8.3 8.1 8.1 8.1 8.2 8.3 8.3 STEADY... 0%Total OECD Europe 14.2 13.8 13.6 13.5 13.7 14.1 14.2 14.2 STEADY... 0%
OECD Year-on-Year Trend &
Pacific 2011 2012 2013 2014 2015 2016 2017 2018 OutlookJapan 4.3 4.6 4.5 4.3 4.1 4.0 3.9 3.7 SOFTER... -4%Korea 2.3 2.3 2.3 2.3 2.4 2.6 2.6 2.6 STEADY... -1%Total OECD Pacific 7.8 8.2 8.1 7.9 7.8 7.8 7.8 7.6 STEADY... -2%
Non-OECD Year-on-Year Trend &
Asia 2011 2012 2013 2014 2015 2016 2017 2018 OutlookIndia 3.5 3.6 3.7 3.8 4.1 4.4 4.5 4.8 FIRM.... 7%China 9.4 9.8 10.4 10.8 11.6 11.9 12.4 12.7 STEADY... 2%Other Far East 7.5 7.6 7.7 7.8 8.1 8.4 8.7 9.0 FIRM.... 3%Total 20.4 21.0 21.7 22.5 23.8 24.8 25.7 26.5 FIRM.... 3%
Other Non-OECD Year-on-Year Trend &
Nations 2011 2012 2013 2014 2015 2016 2017 2018 OutlookFSU 4.5 4.4 4.5 4.6 4.5 4.7 4.7 4.8 STEADY... 1%Brazil 2.8 2.9 3.0 3.2 3.0 2.9 2.9 2.9 STEADY... 1%Latin America (excl. Brazil) 4.0 4.1 4.1 4.2 4.2 4.2 4.2 4.3 STEADY... 1%Africa 3.9 4.1 4.1 4.2 4.3 4.4 4.5 4.6 STEADY... 2%Middle East 7.5 7.9 8.0 8.3 8.5 8.4 8.5 8.6 STEADY... 2%Others 0.9 0.8 0.8 0.8 0.8 0.8 0.9 0.9 FIRM.... 4%
Global Year-on-Year Trend &
Total 2011 2012 2013 2014 2015 2016 2017 2018 OutlookGlobal Total # 89.7 90.6 91.8 93.1 94.9 96.4 98.0 99.2 STEADY... 1%% Change 0.7% 1.1% 1.3% 1.4% 2.0% 1.6% 1.6% 1.2%
Clarksons Research Page 17 Dec-17
Million Barrels Per Day
Million Barrels Per Day
Million Barrels Per Day
Million Barrels Per Day
Million Barrels Per Day
Million Barrels Per Day
-1.0%
-0.3%
4.2%
0.7%
1.1% 1.3% 1.4%
2.0%1.6% 1.6%
1.2%
-3%
-2%
-1%
0%
1%
2%
3%
4%
5%20
08
2009
2010
2011
2012
2013
2014
2015
2016
e
2017
f
2018
f
Growth in global oil demand is expected to remain at asteady 1.6% in 2017 for a second consecutive year, largelydriven by expansion in non-OECD Asian oil demand.Looking to 2018, there exists a great deal of uncertaintysurrounding the current outlook for global oil demandgrowth. In the wake of the recent extension of the global oilproduction cuts until the end of 2018, there are a range ofpotential scenarios for the global oil supply/demandbalance. Taking the view that the cuts succeed insupporting oil prices, it is provisionally expected that globaloil demand will increase at the more limited pace of 1.2% in2018 to reach 99.2m bpd amidst this relatively higher priceenvironment, with demand dampened across a number ofregions. Non-OECD Asian demand is expected to remainthe principal driver of expansion in global oil demand,growing by 3% to reach 26.5m bpd. Combined Chinese andIndian oil demand is expected to account for almost 50% ofglobal oil demand growth, despite the expected slowdown inChinese oil demand growth. Elsewhere, following theselective default of Venezuela on some of the country’sgovernment debts in November, the outlook for Venezuelanoil demand has worsened. However, overall Latin Americandemand is still projected to rise by 1% in 2018.
Lice
nsed
to C
lark
sons
Res
earc
h S
ampl
e. D
istr
ibut
ion
is r
estr
icte
d; p
leas
e re
mem
ber
to a
ckno
wle
dge
the
sour
ce. O
il an
d T
anke
r T
rade
Out
look
, Vol
ume
22 N
o 12
Licensed to Clarksons R
esearch Sam
ple. Distribution is restricted; please rem
ember to acknow
ledge the source. Oil and T
anker Trade O
utlook, Volum
e 22 No 12

Seaborne Crude ImportsMajor Seaborne Crude Oil Importers Commentary
Imports to N. America 2013 2014 2015 2016 2017 2018
United States 5.1 4.5 4.2 4.6 4.6 4.6 STEADY... 0%Canada 0.6 0.5 0.6 0.5 0.5 0.5 SOFTER... -5%Total 5.8 4.9 4.8 5.1 5.1 5.1 STEADY... 0%
Imports to Asia 2013 2014 2015 2016 2017 2018
China 5.1 5.6 6.1 7.1 7.9 8.5 FIRMER... 8%Japan 3.6 3.4 3.4 3.3 3.2 3.1 STEADY... -2%Korea 2.5 2.5 2.8 2.9 3.0 3.1 STEADY... 2%India 3.8 3.8 3.9 4.3 4.3 4.6 FIRM.... 5%Singapore 1.1 1.1 1.1 1.2 1.3 1.4 FIRM.... 3%Thailand 0.9 0.8 0.9 0.9 0.9 0.9 FIRM.... 3%Other Asia 1.5 1.6 1.6 1.7 1.7 1.7 FIRM.... 4%Total 18.5 18.9 19.9 21.5 22.2 23.2 FIRM.... 5%
Imports to EU 2013 2014 2015 2016 2017 2018
Germany 1.5 1.4 1.5 1.5 1.4 1.4 STEADY... 0%France 1.1 1.0 1.1 1.1 1.2 1.2 STEADY... 0%Italy 1.2 1.1 1.2 1.2 1.3 1.3 STEADY... 0%Spain 1.2 1.2 1.4 1.3 1.4 1.4 STEADY... 0%Netherlands 1.6 1.6 1.7 1.8 1.9 1.9 STEADY... 1%Other 2.4 2.4 2.5 2.6 2.7 2.7 STEADY... 0%Total 9.0 8.8 9.4 9.5 9.8 9.9 STEADY... 0%
Imports toMajor Others 2013 2014 2015 2016 2017 2018
Brazil 0.4 0.3 0.3 0.2 0.1 0.1 WEAKER... -14%Africa 0.5 0.6 0.5 0.4 0.3 0.3 STEADY... 0%OECD Australasia 0.6 0.5 0.5 0.4 0.4 0.4 STEADY... 2%
Global Imports 2013 2014 2015 2016 2017 2018
Other Importers* 2.1 2.1 2.2 2.2 2.3 2.4 FIRM.... 6%Global Total 36.9 36.2 37.6 39.1 40.2 41.4 STEADY... 3%% change -3.7% -1.8% 3.8% 4.1% 2.8% 2.8%*Primarily other Latin American (0.34m bpd in 2016) and non-EU (0.56m bpd in 2016) importers.
Clarksons Research Page 18 Dec-17
Million Bpd
Million Bpd
Million Bpd
Million Bpd
Million Bpd
% Change
Year-on-Year
% Change
Year-on-Year
% Change
Year-on-Year
% Change
Year-on-Year
% Change
Year-on-Year
Growth in global seaborne crude trade is currently expectedto slow from 4.1% in 2016 to 2.8% in full year 2017, withtotal volumes projected to reach 40.2m bpd. On the importerside, expansion in Asian crude imports is still expected todrive global crude trade growth, with imports into Asiaexpected to rise by 4% to reach 22.2m bpd in the full year,equal to more than half of total global crude trade. This firmexpansion is underpinned by projected growth of 11% inChinese crude imports, partly on the back of increasingdemand from the country’s ‘teapot’ refineries. However,Asian crude imports are expected to be moderated slightlyby continued falling Japanese imports as refinery capacity inthe country is closed. In 2018, global seaborne crude tradeis expected to expand by a further 2.8% to reach totalvolumes of 41.4m bpd. As in 2017, Asian imports are againexpected to heavily support global crude trade growth, withgrowth in imports in the region projected to accelerate to 5%largely as a result of increased import volumes into India asthe country rebounds from its recent economic difficulties.Meanwhile, following an expected growth rate of 4% in fullyear 2017, EU crude imports are projected to flatten out in2018, partly due to the potential for the expected higher oilprice environment to limit refinery margins somewhat.
0
1
2
3
4
5
6
7
8
9
2008
2009
2010
2011
2012
2013
2014
2015
2016
2017
f
2018
f
m. bpd
Middle East
WAF
Others
Chinese Imports By Region
Latin America
0
2
4
6
8
10
12
2008
2009
2010
2011
2012
2013
2014
2015
2016
2017
f
2018
f
m. bpd
EU Imports By Region
Baltic/North Sea
Middle East
Black Sea/Med
Others
0
2
4
6
8
10
2008
2009
2010
2011
2012
2013
2014
2015
2016
e
2017
f
2018
f
m. bpdUS Imports By Region
N & W Africa
Caribs/L. America
Others
Middle East
0
1
2
3
4
5
6
7
8
9
10
11
12
2003
2004
2005
2006
2007
2008
2009
2010
2011
2012
2013
2014
2015
2016
2017
f
2018
f
m bpd
China
India
EU
North America
Other Asia
Lice
nsed
to C
lark
sons
Res
earc
h S
ampl
e. D
istr
ibut
ion
is r
estr
icte
d; p
leas
e re
mem
ber
to a
ckno
wle
dge
the
sour
ce. O
il an
d T
anke
r T
rade
Out
look
, Vol
ume
22 N
o 12
Licensed to Clarksons R
esearch Sam
ple. Distribution is restricted; please rem
ember to acknow
ledge the source. Oil and T
anker Trade O
utlook, Volum
e 22 No 12

Seaborne Crude ExportsSeaborne Crude Exports By Region Commentary
Exports from
Middle East 2013 2014 2015 2016 2017 2018
Saudi Arabia 7.6 7.2 7.4 7.6 7.1 7.1 STEADY... 0%Iran 1.1 1.1 1.1 1.9 2.3 2.5 FIRMER... 11%Iraq * 2.1 2.3 2.8 3.3 3.3 3.5 FIRM.... 7%UAE 2.7 2.5 2.4 2.4 2.4 2.4 STEADY... 1%Kuwait 2.1 2.0 2.0 2.1 2.0 2.0 SOFTER... -3%Oman 0.8 0.8 0.8 0.9 0.8 0.8 STEADY... -1%Total Middle East 17.6 17.0 17.1 18.8 18.4 18.9 FIRM.... 3%
Exports from
Other Regions 2013 2014 2015 2016 2017 2018
Norway 1.2 1.2 1.3 1.4 1.4 1.4 STEADY... 2%United Kingdom 0.7 0.6 0.7 0.7 0.8 0.9 FIRM.... 7%North Sea Total 1.9 1.9 1.9 2.1 2.2 2.3 FIRM.... 4%
Mexico 1.2 1.1 1.2 1.2 1.2 1.0 WEAKER... -10%Venezuela 1.7 1.6 1.6 1.6 1.4 1.1 WEAKER... -21%Brazil 0.4 0.6 0.8 0.9 1.2 1.4 FIRMER... 14%Colombia 0.8 0.7 0.7 0.6 0.6 0.6 SOFTER... -5%Ecuador 0.4 0.4 0.4 0.4 0.4 0.5 FIRM.... 8%Latin American Total 4.5 4.4 4.7 4.7 4.9 4.7 SOFTER... -5%
Nigeria 2.0 2.1 2.0 1.7 1.7 1.8 FIRM.... 3%Libya 0.7 0.3 0.3 0.2 0.7 0.8 FIRMER... 12%Algeria 0.6 0.5 0.5 0.5 0.5 0.4 WEAKER... -11%Angola 1.6 1.6 1.7 1.7 1.6 1.6 STEADY... 2%Gabon 0.2 0.2 0.2 0.2 0.2 0.2 SOFTER... -4%Others 1.4 1.4 1.4 1.2 1.2 1.2 SOFTER... -5%African Total 6.6 6.1 6.1 5.5 5.9 6.0 STEADY... 1%
Others &
Global Total 2013 2014 2015 2016 2017 2018
FSU (seaborne only) 4.8 4.7 5.1 5.5 5.8 5.9 STEADY... 2%United States 0.1 0.2 0.3 0.3 0.8 1.4 FIRMER... 75%Indonesia 0.3 0.3 0.4 0.4 0.3 0.3 SOFTER... -6%Other Exporters 1.2 1.6 1.9 1.8 1.9 1.9 STEADY... -2%Global Total 36.9 36.2 37.6 39.1 40.2 41.4 STEADY... 3%% Change -3.7% -1.8% 3.8% 4.1% 2.8% 2.8%
Clarksons Research Page 19 Dec-17
% Change
Year-on-Year
% Change
Year-on-Year
% Change
Million Bpd
Million Bpd
*Iraqi crude exports include shipments out of the AG and do not include exports from the Med.
Million Bpd Year-on-Year
0
5
10
15
20
25
30
35
40
45
2008
2009
2010
2011
2012
2013
2014
2015
2016
2017
f
2018
f
m bpd
Middle East
Africa
FSU
North SeaLatin America
Others
0
4
8
12
16
20
24
2008
2009
2010
2011
2012
2013
2014
2015
2016
2017
f
2018
f
m. bpd
Asia
Middle Eastern Exports By Region
N. AmericaIndia
EuropeOthers
0
1
2
3
4
5
6
2008
2009
2010
2011
2012
2013
2014
2015
2016
2017
f
2018
f
m. bpd
China
Other Asia
West African Exports By Region
India
N. AmericaEurope
S. America
1
2
3
4
5
6
2008
2009
2010
2011
2012
2013
2014
2015
2016
2017
f
2018
f
m. bpd
N. America
Latin American Exports By Region
China
MedIndia
Others
In 2017, global crude exports are expected to grow steadi-ly, despite the ongoing OPEC-led deal to cut oil production,resulting in a projected 2% fall in crude exports from theMiddle East. This decline is expected to be largely drivenby Saudi Arabia, with exports from the country expected tofall by 8% in the full year as the country pushes to re-balance the oil market ahead of the planned IPO of SaudiAramco. Meanwhile, US crude exports are expected tomore than double in the full year as shale oil output contin-ues to boom, allowing the country to fill some of the supplygap created by the OPEC-led cuts. Significant expansion inUS crude exports is expected to continue into 2018, withprojected growth in export volumes of 75%. The recent de-cision by OPEC to extend the supply cut deal until end2018 has the potential to provide positive impetus to UScrude export growth, if the pact succeeds in reducing globalinventories and maintaining a higher oil price. Meanwhile,Middle Eastern exports are projected to grow by 3%, de-spite the expectation that Saudi Arabian exports will holdsteady y-o-y. Elsewhere, Latin American crude exports areexpected to fall 5% in 2018, with Venezuelan exports ex-pected to decline most notably as PDVSA struggles to fundits operations amidst ongoing economic crisis.
Lice
nsed
to C
lark
sons
Res
earc
h S
ampl
e. D
istr
ibut
ion
is r
estr
icte
d; p
leas
e re
mem
ber
to a
ckno
wle
dge
the
sour
ce. O
il an
d T
anke
r T
rade
Out
look
, Vol
ume
22 N
o 12
Licensed to Clarksons R
esearch Sam
ple. Distribution is restricted; please rem
ember to acknow
ledge the source. Oil and T
anker Trade O
utlook, Volum
e 22 No 12

Seaborne Products ImportsMajor Seaborne Oil Products Importers Commentary
Imports to US Imports by Region
North America 2013 2014 2015 2016 2017 2018
United States 1.6 1.4 1.5 1.6 1.6 1.6 STEADY... 1%Canada 0.2 0.2 0.3 0.3 0.3 0.3 SOFTER... -6%Total 1.8 1.6 1.8 1.9 1.9 1.8 STEADY... 0%
Imports to
Asia 2013 2014 2015 2016 2017 2018
Japan 0.7 0.7 0.7 0.6 0.6 0.6 SOFTER... -5%Korea 0.7 0.8 0.7 0.7 0.7 0.7 STEADY... 2%China 0.8 0.6 0.6 0.6 0.6 0.6 STEADY... 0%India 0.2 0.3 0.4 0.5 0.5 0.6 FIRM.... 8%Australia 0.5 0.5 0.6 0.6 0.7 0.7 FIRM.... 3%Other Asia 4.8 4.9 5.3 5.6 5.9 6.1 FIRM.... 4%Total 7.7 7.8 8.4 8.6 9.0 9.3 STEADY... 3%
Imports to
Europe 2013 2014 2015 2016 2017 2018
Germany 0.7 0.6 0.7 0.7 0.7 0.7 STEADY... 2%France 0.6 0.6 0.6 0.6 0.6 0.6 STEADY... 2%United Kingdom 0.6 0.6 0.7 0.7 0.7 0.7 STEADY... 2%Netherlands 1.9 1.8 1.9 1.9 2.0 2.0 STEADY... 2%Belgium 0.8 0.7 0.7 0.7 0.7 0.7 STEADY... 1%Other 2.3 2.3 2.4 2.5 2.5 2.5 STEADY... 1%Total Europe 6.9 6.7 7.0 7.2 7.2 7.3 STEADY... 2%
Imports to
Major Others 2013 2014 2015 2016 2017 2018
Mexico 0.5 0.6 0.7 0.7 0.8 0.8 FIRM.... 5%Latin America 1.7 1.8 1.7 1.8 2.1 2.2 FIRM.... 7%Middle East 1.0 1.0 1.3 1.5 1.5 1.6 FIRM.... 7%Africa 1.0 1.0 1.2 1.2 1.3 1.4 FIRM.... 6%
Global
Imports 2013 2014 2015 2016 2017 2018
Global Others 0.1 0.1 0.1 0.1 0.1 0.1 FIRM.... 6%Global Total # 20.7 20.7 22.1 23.1 23.8 24.5 FIRM.... 3%% Change 4.3% 0.1% 6.8% 4.4% 2.9% 3.2%
Clarksons Research Page 20 Dec-17
Million Bpd Year-on-Year
Million Bpd Year-on-Year
% Change
Million Bpd Year-on-Year
% Change
% Change
Million Bpd Year-on-Year
% Change
European Imports by Region
Million Bpd Year-on-Year
% Change
Japanese Imports By Region
0.0
0.5
1.0
1.5
2.0
2.5
3.0
2008
2009
2010
2011
2012
2013
2014
2015
2016
2017
f
2018
f
m. bpd
Caribs/L. Am
Africa/Med Others
UKC
0.0
2.0
4.0
6.0
8.0
2008
2009
2010
2011
2012
2013
2014
2015
2016
2017
f
2018
f
m. bpd
Baltic/B. Sea
Med
NW EuropeMid East
OthersAmericas
0.0
0.1
0.2
0.3
0.4
0.5
0.6
0.7
0.8
2008
2009
2010
2011
2012
2013
2014
2015
2016
2017
f
2018
f
m. bpd
Middle East
Intra Asia
India
Others
In full year 2017, global seaborne products trade is currentlyexpected to grow by 2.9% to reach 23.8m bpd. Imports intoAsia are expected to account for around two thirds of thisgrowth, with Asian products imports projected to grow by5% in the full year, partly supported by strong demand inseveral South East Asian countries. Elsewhere, seaborneproducts imports into Latin America are expected to expandby 13% in 2017, with Brazilian products imports projected togrow by 30% on the back of supressed refinery throughputin the country. Looking to 2018, global seaborne productstrade is expected to grow by 3.2%, with total volumesreaching 24.5m bpd. Latin American products imports areexpected to grow by a firm 7% next year, accounting foraround a fifth of expected global imports growth. Asianseaborne products imports are also expected to expand in2018, with growth of 3% expected. This growth is expectedto be partly supported by an anticipated bounceback inIndian imports following the subdued growth in oil demandseen in 2017 due to economic disruptions following lastyear’s demonetisation policy and the introduction of theGoods and Services Tax in July. Elsewhere, Europeanseaborne products imports are expected to expand by 2% in2018 to reach 7.3m bpd.
0
1
2
3
4
5
6
7
8
2003
2004
2005
2006
2007
2008
2009
2010
2011
2012
2013
2014
2015
2016
2017
f
2018
f
m bpd
North America
China, Japan, Korea
Europe
Other Asia
Latin America
Lice
nsed
to C
lark
sons
Res
earc
h S
ampl
e. D
istr
ibut
ion
is r
estr
icte
d; p
leas
e re
mem
ber
to a
ckno
wle
dge
the
sour
ce. O
il an
d T
anke
r T
rade
Out
look
, Vol
ume
22 N
o 12
Licensed to Clarksons R
esearch Sam
ple. Distribution is restricted; please rem
ember to acknow
ledge the source. Oil and T
anker Trade O
utlook, Volum
e 22 No 12
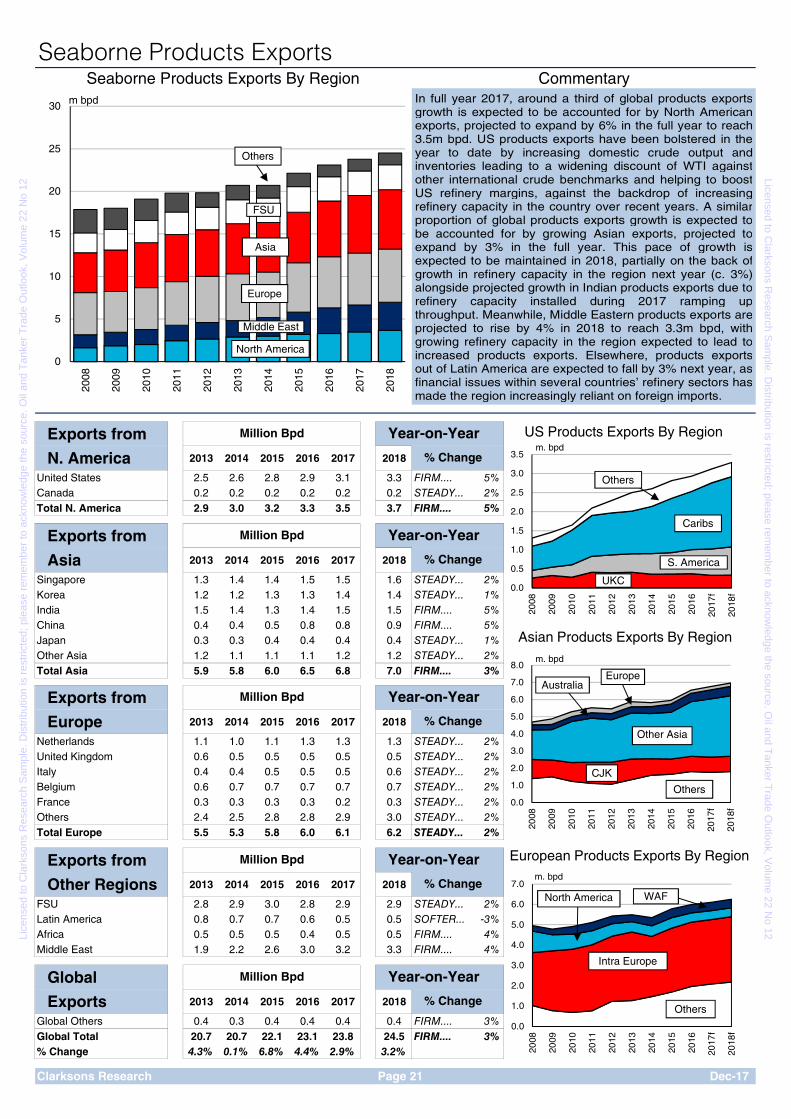
Seaborne Products ExportsSeaborne Products Exports By Region Commentary
Exports from
N. America 2013 2014 2015 2016 2017 2018
United States 2.5 2.6 2.8 2.9 3.1 3.3 FIRM.... 5%Canada 0.2 0.2 0.2 0.2 0.2 0.2 STEADY... 2%Total N. America 2.9 3.0 3.2 3.3 3.5 3.7 FIRM.... 5%
Exports from
Asia 2013 2014 2015 2016 2017 2018
Singapore 1.3 1.4 1.4 1.5 1.5 1.6 STEADY... 2%Korea 1.2 1.2 1.3 1.3 1.4 1.4 STEADY... 1%India 1.5 1.4 1.3 1.4 1.5 1.5 FIRM.... 5%China 0.4 0.4 0.5 0.8 0.8 0.9 FIRM.... 5%Japan 0.3 0.3 0.4 0.4 0.4 0.4 STEADY... 1%Other Asia 1.2 1.1 1.1 1.1 1.2 1.2 STEADY... 2%Total Asia 5.9 5.8 6.0 6.5 6.8 7.0 FIRM.... 3%
Exports from
Europe 2013 2014 2015 2016 2017 2018
Netherlands 1.1 1.0 1.1 1.3 1.3 1.3 STEADY... 2%United Kingdom 0.6 0.5 0.5 0.5 0.5 0.5 STEADY... 2%Italy 0.4 0.4 0.5 0.5 0.5 0.6 STEADY... 2%Belgium 0.6 0.7 0.7 0.7 0.7 0.7 STEADY... 2%France 0.3 0.3 0.3 0.3 0.2 0.3 STEADY... 2%Others 2.4 2.5 2.8 2.8 2.9 3.0 STEADY... 2%Total Europe 5.5 5.3 5.8 6.0 6.1 6.2 STEADY... 2%
Exports from
Other Regions 2013 2014 2015 2016 2017 2018
FSU 2.8 2.9 3.0 2.8 2.9 2.9 STEADY... 2%Latin America 0.8 0.7 0.7 0.6 0.5 0.5 SOFTER... -3%Africa 0.5 0.5 0.5 0.4 0.5 0.5 FIRM.... 4%Middle East 1.9 2.2 2.6 3.0 3.2 3.3 FIRM.... 4%
Global
Exports 2013 2014 2015 2016 2017 2018
Global Others 0.4 0.3 0.4 0.4 0.4 0.4 FIRM.... 3%Global Total # 20.7 20.7 22.1 23.1 23.8 24.5 FIRM.... 3%% Change 4.3% 0.1% 6.8% 4.4% 2.9% 3.2%
Clarksons Research Page 21 Dec-17
% Change
Million Bpd Year-on-Year
% Change
Million Bpd Year-on-Year
% Change
Million Bpd Year-on-Year
% Change
Million Bpd Year-on-Year
% Change
Million Bpd Year-on-Year
0
5
10
15
20
25
30
2008
2009
2010
2011
2012
2013
2014
2015
2016
2017
2018
FSU
Europe
Asia
North America
m bpd
Middle East
Others
In full year 2017, around a third of global products exportsgrowth is expected to be accounted for by North Americanexports, projected to expand by 6% in the full year to reach3.5m bpd. US products exports have been bolstered in theyear to date by increasing domestic crude output andinventories leading to a widening discount of WTI againstother international crude benchmarks and helping to boostUS refinery margins, against the backdrop of increasingrefinery capacity in the country over recent years. A similarproportion of global products exports growth is expected tobe accounted for by growing Asian exports, projected toexpand by 3% in the full year. This pace of growth isexpected to be maintained in 2018, partially on the back ofgrowth in refinery capacity in the region next year (c. 3%)alongside projected growth in Indian products exports due torefinery capacity installed during 2017 ramping upthroughput. Meanwhile, Middle Eastern products exports areprojected to rise by 4% in 2018 to reach 3.3m bpd, withgrowing refinery capacity in the region expected to lead toincreased products exports. Elsewhere, products exportsout of Latin America are expected to fall by 3% next year, asfinancial issues within several countries’ refinery sectors hasmade the region increasingly reliant on foreign imports.
0.0
0.5
1.0
1.5
2.0
2.5
3.0
3.5
2008
2009
2010
2011
2012
2013
2014
2015
2016
2017
f
2018
f
m. bpd
Caribs
S. America
UKC
Others
US Products Exports By Region
0.0
1.0
2.0
3.0
4.0
5.0
6.0
7.0
8.0
2008
2009
2010
2011
2012
2013
2014
2015
2016
2017
f
2018
f
m. bpd
Other Asia
Others
EuropeAustralia
Asian Products Exports By Region
CJK
0.0
1.0
2.0
3.0
4.0
5.0
6.0
7.0
2008
2009
2010
2011
2012
2013
2014
2015
2016
2017
f
2018
f
m. bpd
Intra Europe
Others
WAF
European Products Exports By Region
North America
Lice
nsed
to C
lark
sons
Res
earc
h S
ampl
e. D
istr
ibut
ion
is r
estr
icte
d; p
leas
e re
mem
ber
to a
ckno
wle
dge
the
sour
ce. O
il an
d T
anke
r T
rade
Out
look
, Vol
ume
22 N
o 12
Licensed to Clarksons R
esearch Sam
ple. Distribution is restricted; please rem
ember to acknow
ledge the source. Oil and T
anker Trade O
utlook, Volum
e 22 No 12

Refinery CapacityRegional Refinery Capacity Growth Commentary
North
America 2011 2012 2013 2014 2015 2017 2018 2019 2017 2018 2019
USA 17.2 18.1 18.1 18.0 18.1 18.5 18.6 18.6 0.3% 0.7% 0.0%Canada 1.9 1.9 2.0 2.0 2.0 2.1 2.1 2.1 0.0% 3.9% 0.0%Mexico 1.5 1.5 1.5 1.5 1.5 1.5 1.6 1.7 0.0% 5.6% 1.8%
E. & West
Europe 2011 2012 2013 2014 2015 2017 2018 2019 2017 2018 2019
OECD Europe 15.4 15.0 14.5 14.3 14.5 14.1 14.4 14.4 0.0% 2.2% 0.0%of which EU-4 8.2 7.9 7.4 7.0 7.1 6.8 6.8 6.8 0.0% 0.0% 0.0%Non-OECD Europe* 1.2 1.2 1.2 1.2 1.0 1.1 1.1 1.1 0.0% 0.0% 0.0%
Middle
East 2011 2012 2013 2014 2015 2017 2018 2019 2017 2018 2019
Saudi Arabia 2.1 2.1 2.5 2.9 2.9 2.9 2.9 3.3 -1.3% 0.0% 13.9%Kuwait 0.9 0.9 0.9 0.9 0.9 0.8 0.8 1.5 -19.9% 11.7% 73.4%Iran 1.5 1.5 1.2 1.2 2.0 2.2 2.2 2.3 5.9% 0.0% 5.6%U.A.E. 0.8 0.8 0.8 1.2 1.2 1.1 1.1 1.3 0.0% 0.0% 18.1%Others 1.5 1.5 1.5 1.5 1.7 1.8 1.8 2.0 4.7% 0.0% 8.2%Total 6.7 6.7 6.8 7.6 8.8 8.7 8.8 10.3 -0.3% 1.0% 16.9%
2011 2012 2013 2014 2015 2017 2018 2019 2017 2018 2019
China 12.3 13.0 13.6 14.5 14.3 14.7 15.5 16.5 4.0% 5.4% 6.1%Japan 4.7 4.8 4.4 4.2 3.9 3.6 3.6 3.6 -6.1% 0.0% 0.0%India 4.1 4.3 4.3 4.6 5.1 5.3 5.3 5.6 2.3% 0.0% 5.3%South Korea 2.8 3.0 3.0 3.0 3.0 3.1 3.1 3.1 3.4% 0.0% 0.0%Singapore 1.4 1.4 1.3 1.3 1.3 1.3 1.3 1.3 0.0% 0.0% 0.0%Others 4.3 4.3 4.3 4.3 4.6 4.6 4.8 5.3 6.8% 3.2% 11.7%Total 29.5 30.6 31.0 32.0 32.2 32.7 33.6 35.4 2.7% 2.9% 5.3%
Others &
Total 2011 2012 2013 2014 2015 2017 2018 2019 2017 2018 2019
FSU 4 8.3 8.4 8.4 8.4 8.0 7.9 8.0 8.1 3.2% 1.6% 0.9%Brazil 2 1.9 1.9 1.9 1.9 2.0 2.1 2.1 2.1 0.0% 0.0% 0.0%Others # 9.5 9.5 9.6 9.6 9.3 9.6 9.8 11.1 2.0% 2.3% 13.1%Global Total # 93.2 95.0 95.0 96.5 97.4 98.3 100.3 105.0 1.3% 2.0% 4.6%Growth Rate 0.0% 1.8% 0.1% 1.6% 0.9%*Excluding FSU.
Clarksons Research
Total Refinery Capacity (M Bpd) Projected Capacity Growth
2016
18.52.11.5
Total Refinery Capacity (M Bpd) Projected Capacity Growth
2016
14.16.81.1
Total Refinery Capacity (M Bpd) Projected Capacity Growth
2016
2.90.92.01.11.78.7
AsiaTotal Refinery Capacity (M Bpd) Projected Capacity Growth
2016
14.23.85.23.01.34.331.8
Total Refinery Capacity (M Bpd) Projected Capacity Growth
2016
7.62.19.497.0
-0.4%
Page 22 Dec-17
Global refinery capacity is currently projected to grow 1.3% in 2017 to reach 98.3m bpd, with over 60% of this expansion driven by an increase in Asian refinery capacity. However, the projected minor contraction in Middle Eastern refinerycapacity, which accounts for almost 10% of global refinerycapacity, is expected to limit the pace of growth this year.Some of this decline in capacity can be attributed to the clo-sure of Saudi Aramco’s ageing 88,000 bpd Jeddah refineryin November. This closure, along with the shutdown of the 0.2m bpd Shuaiba plant in Kuwait earlier this year, is ex-pected to offset the growth in refinery capacity in Iran and Oman this year. However, this y-o-y reduction in capacity in 2017 may not be fully reflected in throughput. Whilst the Iraqi refinery sector is not expected to expand in terms of name-plate capacity, there has recently been a great deal of in-vestment to repair Iraq’s northern refineries damaged during conflict with the IS. In recent months, a number of small facil-ities have been brought back online, including the 16,000 bpd Haditha refinery and 20,000 bpd of capacity at the Seni-yah and Qayara refineries. The Daura refinery is now run-ning at 140,000 bpd, up from just 80,000 bpd in October, and restoration work at the 310,000 bpd Baiji refinery and the 30,000 bpd Al-Bab refinery is currently underway.
-0.5
0.0
0.5
1.0
1.5
2.0
2014
2015
2016
2017
2018
2019
2014
2015
2016
2017
2018
2019
2014
2015
2016
2017
2018
2019
2014
2015
2016
2017
2018
2019
m. bpd
North America
Western Europe
Middle East
AsiaBars represent year-on-year capacity changes
Lice
nsed
to C
lark
sons
Res
earc
h S
ampl
e. D
istr
ibut
ion
is r
estr
icte
d; p
leas
e re
mem
ber
to a
ckno
wle
dge
the
sour
ce. O
il an
d T
anke
r T
rade
Out
look
, Vol
ume
22 N
o 12
Licensed to Clarksons R
esearch Sam
ple. Distribution is restricted; please rem
ember to acknow
ledge the source. Oil and T
anker Trade O
utlook, Volum
e 22 No 12

Tanker Safety & Oil Spills
Tanker
Incidents 2012 2013 2014 2015 2016 2017^
Collision 16 22 25 38 47 40
Contact 34 24 15 5 8 6
Fire / Explosion 15 11 11 11 17 14
Hull / Machinery Damage 54 55 22 36 38 30
Miscellaneous 212 119 147 191 111 51
Piracy Incidents 90 110 112 82 63 52
Grounded/Wrecked/Stranded 21 20 14 16 21 25
Total 442 361 346 382 306 219
Losses
At Sea 2012 2013 2014 2015 2016 2017
VLCC 200,000+ dwt
Suezmax 125-199,999 dwt
Aframax 85-124,999 dwt
Panamax 55-84,999 dwt
Handy 10-54,999 dwt 1
<10,000 dwt 10 6 3 4 1 4
Total 11 6 3 4 1 4
^Number of incidents/losses in year to date.
Clarksons Research Page 23 Dec-17
Number of Incidents
Number of Vessels Lost
0
100
200
300
400
500
600
700
2007
2008
2009
2010
2011
2012
2013
2014
2015
2016
2017
ytd
Reported Tanker Incidents By Type
OtherMiscellaneousCollisionHull/Machinery DamagePiracy Incidents
No.
0
2
4
6
8
10
12
1983
1985
1987
1989
1991
1993
1995
1997
1999
2001
2003
2005
2007
2009
2011
2013
2015
2017
ytd
Reported Losses At SeaNo.
Oil & Tanker Trades Outlook - Fleet & Deadweight Demand Definitions
Crude Tanker Fleet: - Uncoated tankers 55,000 dwt and above. Note: Suezmax supply analysis on pages 3 and 7 also includes coated Suezmax tankers.
Product Tanker Fleet: - Coated non-IMO graded tankers- IMO III tankers- IMO II tankers 25,000 dwt and above which meet criteria: average tank size >3,000 cbm, or, where average tank size unknown, no of tanks<16 (25-40k dwt), <18 (40-55k dwt), <30 (55-85k dwt)- Tankers of unknown IMO grade 25,000 dwt and above- Uncoated non-IMO graded tankers below 55,000 dwt- Excludes specialised tankers, and all tankers with stainless steel tanksNote: Product Tanker supply analysis on pages 3 and 25 includes 10k-125k dwt product tankers only.
Chemical Tanker Fleet: - IMO I tankers plus IMO II tankers not meeting product tanker criteria- Tankers of unknown IMO grade <25,000 dwt- Includes all stainless steel tankers not designated as specialised tankers- Excludes other specialised tankers
Other Specialised Tanker Fleet: - Tankers designed for the carriage of specialist liquids (excluding chemical tankers).
Total Tanker Fleet (see pages i to viii): - Crude, products, chemical and specialised tankers.
Crude Tanker Dwt Demand: - Dwt demand derived from underlying crude oil trade and DPP trade on uncoated tankers.
Product Tanker Dwt Demand: - Dwt demand derived from underlying DPP trade on coated tankers, CPP trade and veg oil trade.
Lice
nsed
to C
lark
sons
Res
earc
h S
ampl
e. D
istr
ibut
ion
is r
estr
icte
d; p
leas
e re
mem
ber
to a
ckno
wle
dge
the
sour
ce. O
il an
d T
anke
r T
rade
Out
look
, Vol
ume
22 N
o 12
Licensed to Clarksons R
esearch Sam
ple. Distribution is restricted; please rem
ember to acknow
ledge the source. Oil and T
anker Trade O
utlook, Volum
e 22 No 12

Tanker Outlook
In late 2016, the Tanker Outlook focussed on a slowdown in Latin American products imports growth, largely due to weak Brazilian demand. However, this trend appears to have reversed. Latin America is now expected to account for almost half of the expected increase in global products imports this year, despite representing only around 10% of total volumes.
Oil & Tanker Trades Outlook, December 17 Published by: Clarkson Research Services Limited Commodity Quay, St Katharine Docks, London, E1W 1BF, England. Tel: + (44) (0) 20 7334 3134 E-mail: [email protected] On-line Shop: www.crsl.com Website: www.clarksons.com/services/research Shipping Intelligence Network: www.clarksons.net World Fleet Register: www.clarksons.net/wfr Oil & Tanker Trades Outlook is published twelve times a year. It is available on subscription at a price of £795/£810 a year (within Europe/outside Europe) including postage.
Editorial Board: Managing Director Stephen Gordon Research Director Trevor Crowe Editor James Nevison Analyst Alexa Parker Publisher Rob Benson Production Sam Ingles Clarksons Platou Tanker Contacts: Crude R. Knight Products G. Preece Specialised R. Whittet Gas T. Baggio Hong Kong M. Rowe Singapore G. Lane
Demand Starts To Stall In 2005-12, Latin American products im-ports grew on average by 17% p.a. to reach 2.3m bpd, with Mexico and Brazil being the region’s two largest importers. However, in 2013, Mexican products im-ports fell by 14% on the back of waning oil demand, resulting in the first y-o-y drop in total Latin American import vol-umes since 2004. Then, in 2015, Brazil fell into a deep recession, resulting in a 20% y-o-y fall in its products imports. These factors caused the pace of growth in Latin American products imports to decelerate to an average of 1% p.a. in 2013-15, and with oil demand in the re-gion declining since 2014, it seemed that products imports would remain muted. However, this was not the case. Barriers In Brazil Following the launch of a state-level anti-corruption investigation in 2014 dubbed ‘Operation Car Wash’, state-owned oil company Petrobras (which controls the majority of the country’s refinery capacity) became increasingly implicated. Due to the resultant financial and operational turmoil facing the company, the Brazilian refinery sector began to suffer from lack of funding, and in 2016 refinery through-put fell 10%. To fill the oil supply shortfall, in the same year products imports rose by 15%, despite oil demand falling by 4%. This trend has accelerated in 2017 so far, with refinery throughput down by around 10% y-o-y in 1H 2017 amidst the ongoing fallout from the investigation. Consequently, Brazil’s products imports in January-October rose 35% y-o-y, with around 70% of growth accounted for by imports from the US, particularly diesel.
Malaise In Mexico Due to the prioritisation of drilling projects at the expense of refinery maintenance by state oil company Pemex, throughput at Mexican refineries has also been on the decline for several years, with Pemex refineries typically operating at little over 60% of capacity. In 2017, a fire in the country’s largest refinery in Salina Cruz alongside overdue maintenance at sever-al other refineries has worsened the situ-ation, with throughput in January-August this year reportedly down 15% y-o-y. The ailing state of the country’s refinery sector is highlighted by the fact that Mexico has been forced to export crude to US refiner-
ies in order to import the refined prod-ucts, with the country now accounting for around 60% of all US gasoline exports. As a result of these factors, Mexican products imports in January-August this year rose by 11% y-o-y to 0.8m bpd in order to meet domestic oil demand. So, after growth in Latin American prod-ucts imports slowed in 2012-15, volumes are again growing firmly, driven by weak refinery sectors in Brazil and Mexico. With product imports into the region pro-jected to have grown by 12% in full year 2017 to 2.8m bpd, Latin America appears to have re-emerged as a key driver of growth in seaborne products trade.
Graph of the Month On The Up: Latin American Products Imports By Country
The bars show total Latin Ameri-can products imports, divided into the main importer countries (LHS). The line shows the overall refinery throughput in the region according to JODI data (RHS). 2017 data is basis full year pro-jections for imports and estimat-ed 1H 2017 data for refinery throughput. A range of oil prod-ucts trade timeseries can be found on the Shipping Intelli-gence Network.
Source : Clarksons Research
Latin American Products Imports: Heating Up Again?
4.5
5.0
5.5
6.0
6.5
7.0
0.0
0.5
1.0
1.5
2.0
2.5
3.0
3.5
2007
2008
2009
2010
2011
2012
2013
2014
2015
2016
2017
p
m bpd
MexicoBrazilColombiaChileOther Latin AmericaRefinery Throughput (RHS)
m bpd
The material and the information contained herein are provided for general information purposes, and may not be reproduced without the written permission of Clarksons Research. To the maximum extent permitted by law, Clark-sons Research shall not be liable to the recipient or any third party for any loss, liability or damage, cost or expense including without limitation, direct, indirect, consequential loss or damage, any loss of profit, loss of use, loss of or interruption in business, loss of goodwill, loss of data aris-ing out of, or in connection with, the use of and the reliance on the information whether in contract, tort, negligence, bailment, breach of statutory duty or otherwise, even if foreseeable. This disclaimer shall be governed by and construed in accordance with English law.
Lice
nsed
to C
lark
sons
Res
earc
h S
ampl
e. D
istr
ibut
ion
is r
estr
icte
d; p
leas
e re
mem
ber
to a
ckno
wle
dge
the
sour
ce. O
il an
d T
anke
r T
rade
Out
look
, Vol
ume
22 N
o 12
Licensed to Clarksons R
esearch Sam
ple. Distribution is restricted; please rem
ember to acknow
ledge the source. Oil and T
anker Trade O
utlook, Volum
e 22 No 12