Embed Size (px)
Citation preview
1
OIL SPILL REMOTE SENSING
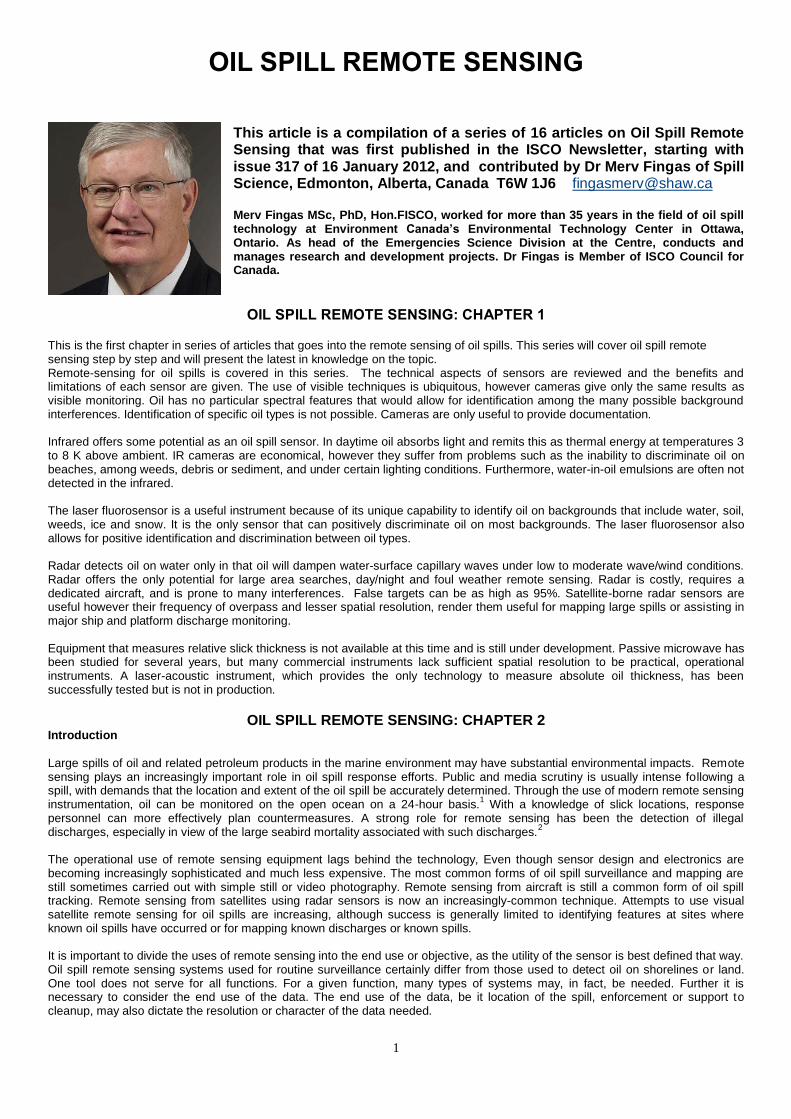
This article is a compilation of a series of 16 articles on Oil Spill Remote Sensing that was first published in the ISCO Newsletter, starting with issue 317 of 16 January 2012, and contributed by Dr Merv Fingas of Spill Science, Edmonton, Alberta, Canada T6W 1J6 [email protected] Merv Fingas MSc, PhD, Hon.FISCO, worked for more than 35 years in the field of oil spill technology at Environment Canada’s Environmental Technology Center in Ottawa, Ontario. As head of the Emergencies Science Division at the Centre, conducts and manages research and development projects. Dr Fingas is Member of ISCO Council for Canada.
OIL SPILL REMOTE SENSING: CHAPTER 1 This is the first chapter in series of articles that goes into the remote sensing of oil spills. This series will cover oil spill remote sensing step by step and will present the latest in knowledge on the topic. Remote-sensing for oil spills is covered in this series. The technical aspects of sensors are reviewed and the benefits and limitations of each sensor are given. The use of visible techniques is ubiquitous, however cameras give only the same results as visible monitoring. Oil has no particular spectral features that would allow for identification among the many possible background interferences. Identification of specific oil types is not possible. Cameras are only useful to provide documentation. Infrared offers some potential as an oil spill sensor. In daytime oil absorbs light and remits this as thermal energy at temperatures 3 to 8 K above ambient. IR cameras are economical, however they suffer from problems such as the inability to discriminate oil on beaches, among weeds, debris or sediment, and under certain lighting conditions. Furthermore, water-in-oil emulsions are often not detected in the infrared. The laser fluorosensor is a useful instrument because of its unique capability to identify oil on backgrounds that include water, soil, weeds, ice and snow. It is the only sensor that can positively discriminate oil on most backgrounds. The laser fluorosensor also allows for positive identification and discrimination between oil types. Radar detects oil on water only in that oil will dampen water-surface capillary waves under low to moderate wave/wind conditions. Radar offers the only potential for large area searches, day/night and foul weather remote sensing. Radar is costly, requires a dedicated aircraft, and is prone to many interferences. False targets can be as high as 95%. Satellite-borne radar sensors are useful however their frequency of overpass and lesser spatial resolution, render them useful for mapping large spills or assisting in major ship and platform discharge monitoring. Equipment that measures relative slick thickness is not available at this time and is still under development. Passive microwave has been studied for several years, but many commercial instruments lack sufficient spatial resolution to be practical, operational instruments. A laser-acoustic instrument, which provides the only technology to measure absolute oil thickness, has been successfully tested but is not in production.
OIL SPILL REMOTE SENSING: CHAPTER 2 Introduction
Large spills of oil and related petroleum products in the marine environment may have substantial environmental impacts. Remote sensing plays an increasingly important role in oil spill response efforts. Public and media scrutiny is usually intense following a spill, with demands that the location and extent of the oil spill be accurately determined. Through the use of modern remote sensing instrumentation, oil can be monitored on the open ocean on a 24-hour basis.
1 With a knowledge of slick locations, response
personnel can more effectively plan countermeasures. A strong role for remote sensing has been the detection of illegal discharges, especially in view of the large seabird mortality associated with such discharges.
2
The operational use of remote sensing equipment lags behind the technology, Even though sensor design and electronics are becoming increasingly sophisticated and much less expensive. The most common forms of oil spill surveillance and mapping are still sometimes carried out with simple still or video photography. Remote sensing from aircraft is still a common form of oil spill tracking. Remote sensing from satellites using radar sensors is now an increasingly-common technique. Attempts to use visual satellite remote sensing for oil spills are increasing, although success is generally limited to identifying features at sites where known oil spills have occurred or for mapping known discharges or known spills. It is important to divide the uses of remote sensing into the end use or objective, as the utility of the sensor is best defined that way. Oil spill remote sensing systems used for routine surveillance certainly differ from those used to detect oil on shorelines or land. One tool does not serve for all functions. For a given function, many types of systems may, in fact, be needed. Further it is necessary to consider the end use of the data. The end use of the data, be it location of the spill, enforcement or support to cleanup, may also dictate the resolution or character of the data needed.
2
There are several broad uses of remote sensing: 1. Enforcement of ship discharge laws, 2. Surveillance and general slick detection, 3. Provision of evidence for prosecution, 4. Mapping of spills for various reasons, 5. Direction of oil spill countermeasures, and 6. Determination of slick trajectories. There are several generic problems in oil spill remote sensing including: 1. There are no cheap, commercial off-the-shelf sensors that provide ready, remote sensing capability for oil, 2. Thickness information is not present in sensors currently used nor is useful information available in the visible. Only very thin slicks show a few visible indications of oil, but this is not useful, 3. Many of the sensors and senor outputs require extensive processing to make the data useful for the many purposes or use described above, and 4. All of the highly-useful sensors require extensive aircraft modifications which are both costly and time-consuming. Several general reviews of oil spill remote sensing have been published.
3 These reviews show that there is progress in oil spill
remote sensing, however that progress is not necessarily moving at the speed that technology itself moves. These reviews show that specialized sensors offer advantages compared to off-the-shelf sensors. References 1 Robbe, N., and T. Hengstermann, Remote Sensing of Marine Oil Spills from Airborne Platforms Using Multi-sensor Systems, Water
Pollution VIII: Modelling, Monitoring and Management, 347, 2006 2 Serra-Sogas, N., P. D. O’Hara, R. Canessa, P. Keller, and R. Pelot, Visualization of Spatial Patterns and Temporal Trends for Aeria l
Surveillance of Illegal Oil Discharges in Western Canadian Marine Waters, Mar. Pollut. Bull., 815, 2008 3 Fingas, M. and C.E. Brown, Oil Spill Remote Sensing: A Review, Chapter 6, in Oil Spill Sci. Techn., M. Fingas, Editor, Gulf Publishing Company, NY, NY, 111, 2011
OIL SPILL REMOTE SENSING: CHAPTER 3 Atmospheric properties
Figure 1
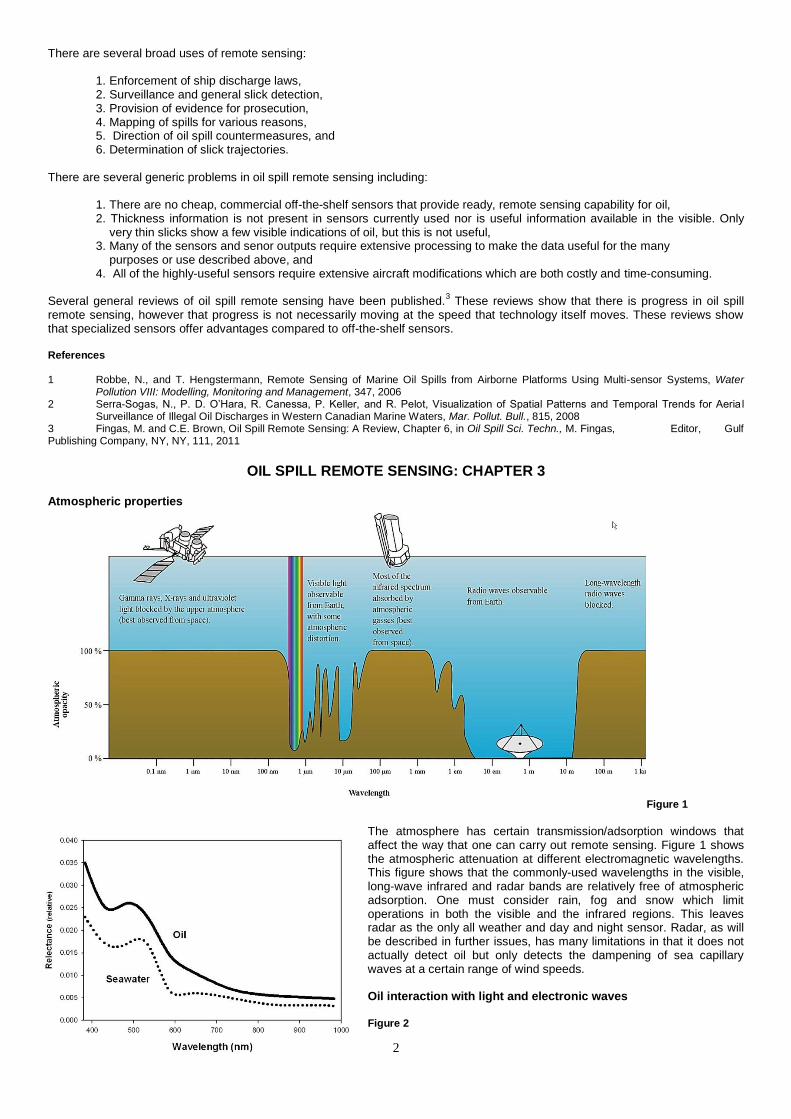
The atmosphere has certain transmission/adsorption windows that affect the way that one can carry out remote sensing. Figure 1 shows the atmospheric attenuation at different electromagnetic wavelengths. This figure shows that the commonly-used wavelengths in the visible, long-wave infrared and radar bands are relatively free of atmospheric adsorption. One must consider rain, fog and snow which limit operations in both the visible and the infrared regions. This leaves radar as the only all weather and day and night sensor. Radar, as will be described in further issues, has many limitations in that it does not actually detect oil but only detects the dampening of sea capillary waves at a certain range of wind speeds. Oil interaction with light and electronic waves Figure 2
3
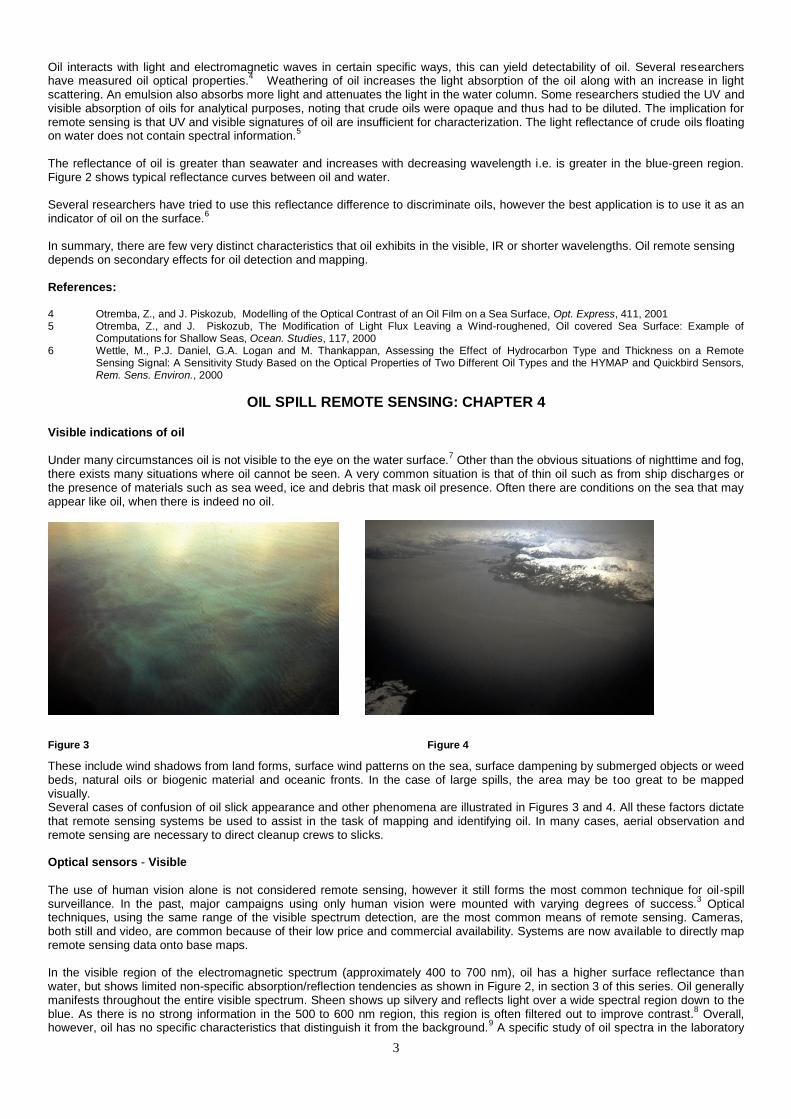
Oil interacts with light and electromagnetic waves in certain specific ways, this can yield detectability of oil. Several researchers have measured oil optical properties.
4 Weathering of oil increases the light absorption of the oil along with an increase in light
scattering. An emulsion also absorbs more light and attenuates the light in the water column. Some researchers studied the UV and visible absorption of oils for analytical purposes, noting that crude oils were opaque and thus had to be diluted. The implication for remote sensing is that UV and visible signatures of oil are insufficient for characterization. The light reflectance of crude oils floating on water does not contain spectral information.
5
The reflectance of oil is greater than seawater and increases with decreasing wavelength i.e. is greater in the blue-green region. Figure 2 shows typical reflectance curves between oil and water. Several researchers have tried to use this reflectance difference to discriminate oils, however the best application is to use it as an indicator of oil on the surface.
6
In summary, there are few very distinct characteristics that oil exhibits in the visible, IR or shorter wavelengths. Oil remote sensing depends on secondary effects for oil detection and mapping. References: 4 Otremba, Z., and J. Piskozub, Modelling of the Optical Contrast of an Oil Film on a Sea Surface, Opt. Express, 411, 2001 5 Otremba, Z., and J. Piskozub, The Modification of Light Flux Leaving a Wind-roughened, Oil covered Sea Surface: Example of
Computations for Shallow Seas, Ocean. Studies, 117, 2000 6 Wettle, M., P.J. Daniel, G.A. Logan and M. Thankappan, Assessing the Effect of Hydrocarbon Type and Thickness on a Remote Sensing Signal: A Sensitivity Study Based on the Optical Properties of Two Different Oil Types and the HYMAP and Quickbird Sensors, Rem. Sens. Environ., 2000
OIL SPILL REMOTE SENSING: CHAPTER 4 Visible indications of oil
Under many circumstances oil is not visible to the eye on the water surface.
7 Other than the obvious situations of nighttime and fog,
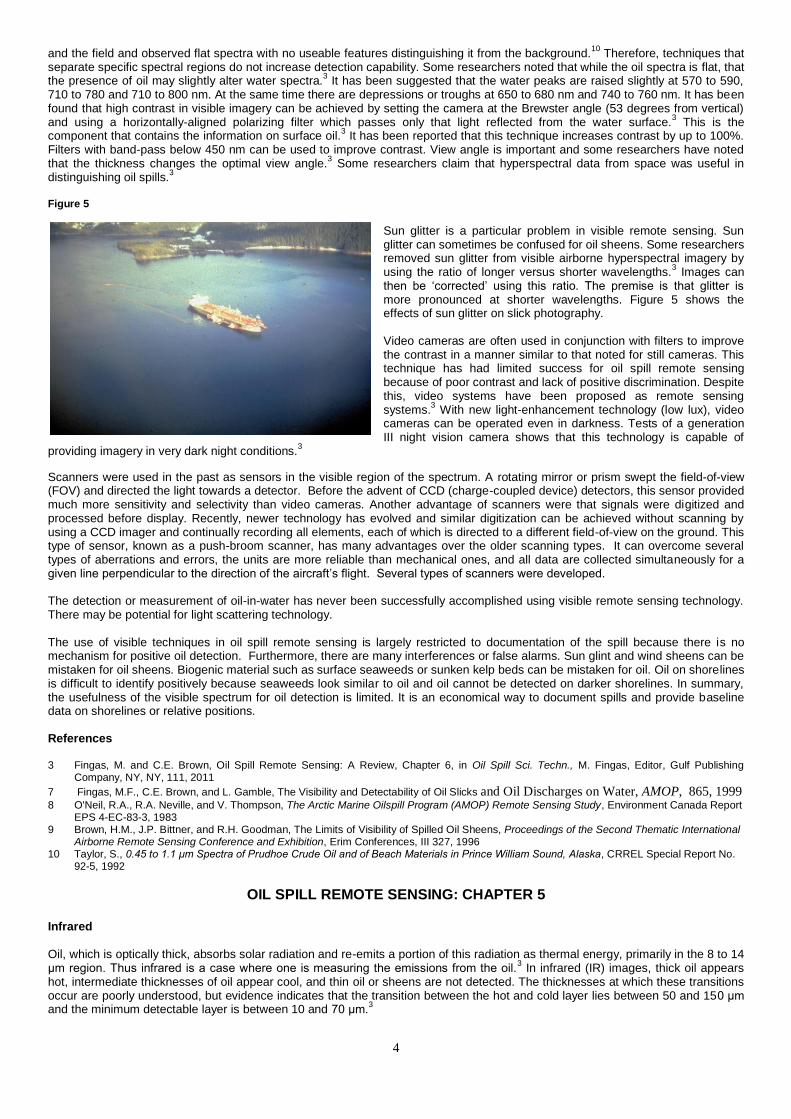
there exists many situations where oil cannot be seen. A very common situation is that of thin oil such as from ship discharges or the presence of materials such as sea weed, ice and debris that mask oil presence. Often there are conditions on the sea that may appear like oil, when there is indeed no oil.
Figure 3 Figure 4
These include wind shadows from land forms, surface wind patterns on the sea, surface dampening by submerged objects or weed beds, natural oils or biogenic material and oceanic fronts. In the case of large spills, the area may be too great to be mapped visually. Several cases of confusion of oil slick appearance and other phenomena are illustrated in Figures 3 and 4. All these factors dictate that remote sensing systems be used to assist in the task of mapping and identifying oil. In many cases, aerial observation and remote sensing are necessary to direct cleanup crews to slicks. Optical sensors - Visible
The use of human vision alone is not considered remote sensing, however it still forms the most common technique for oil-spill surveillance. In the past, major campaigns using only human vision were mounted with varying degrees of success.
3 Optical
techniques, using the same range of the visible spectrum detection, are the most common means of remote sensing. Cameras, both still and video, are common because of their low price and commercial availability. Systems are now available to directly map remote sensing data onto base maps. In the visible region of the electromagnetic spectrum (approximately 400 to 700 nm), oil has a higher surface reflectance than water, but shows limited non-specific absorption/reflection tendencies as shown in Figure 2, in section 3 of this series. Oil generally manifests throughout the entire visible spectrum. Sheen shows up silvery and reflects light over a wide spectral region down to the blue. As there is no strong information in the 500 to 600 nm region, this region is often filtered out to improve contrast.
8 Overall,
however, oil has no specific characteristics that distinguish it from the background.9 A specific study of oil spectra in the laboratory
4
and the field and observed flat spectra with no useable features distinguishing it from the background.10
Therefore, techniques that separate specific spectral regions do not increase detection capability. Some researchers noted that while the oil spectra is flat, that the presence of oil may slightly alter water spectra.
3 It has been suggested that the water peaks are raised slightly at 570 to 590,
710 to 780 and 710 to 800 nm. At the same time there are depressions or troughs at 650 to 680 nm and 740 to 760 nm. It has been found that high contrast in visible imagery can be achieved by setting the camera at the Brewster angle (53 degrees from vertical) and using a horizontally-aligned polarizing filter which passes only that light reflected from the water surface.
3 This is the
component that contains the information on surface oil.3 It has been reported that this technique increases contrast by up to 100%.
Filters with band-pass below 450 nm can be used to improve contrast. View angle is important and some researchers have noted that the thickness changes the optimal view angle.
3 Some researchers claim that hyperspectral data from space was useful in
distinguishing oil spills.3
Figure 5
Sun glitter is a particular problem in visible remote sensing. Sun glitter can sometimes be confused for oil sheens. Some researchers removed sun glitter from visible airborne hyperspectral imagery by using the ratio of longer versus shorter wavelengths.
3 Images can
then be ‘corrected’ using this ratio. The premise is that glitter is more pronounced at shorter wavelengths. Figure 5 shows the effects of sun glitter on slick photography. Video cameras are often used in conjunction with filters to improve the contrast in a manner similar to that noted for still cameras. This technique has had limited success for oil spill remote sensing because of poor contrast and lack of positive discrimination. Despite this, video systems have been proposed as remote sensing systems.
3 With new light-enhancement technology (low lux), video
cameras can be operated even in darkness. Tests of a generation III night vision camera shows that this technology is capable of
providing imagery in very dark night conditions.3
Scanners were used in the past as sensors in the visible region of the spectrum. A rotating mirror or prism swept the field-of-view (FOV) and directed the light towards a detector. Before the advent of CCD (charge-coupled device) detectors, this sensor provided much more sensitivity and selectivity than video cameras. Another advantage of scanners were that signals were digitized and processed before display. Recently, newer technology has evolved and similar digitization can be achieved without scanning by using a CCD imager and continually recording all elements, each of which is directed to a different field-of-view on the ground. This type of sensor, known as a push-broom scanner, has many advantages over the older scanning types. It can overcome several types of aberrations and errors, the units are more reliable than mechanical ones, and all data are collected simultaneously for a given line perpendicular to the direction of the aircraft’s flight. Several types of scanners were developed. The detection or measurement of oil-in-water has never been successfully accomplished using visible remote sensing technology. There may be potential for light scattering technology. The use of visible techniques in oil spill remote sensing is largely restricted to documentation of the spill because there is no mechanism for positive oil detection. Furthermore, there are many interferences or false alarms. Sun glint and wind sheens can be mistaken for oil sheens. Biogenic material such as surface seaweeds or sunken kelp beds can be mistaken for oil. Oil on shorelines is difficult to identify positively because seaweeds look similar to oil and oil cannot be detected on darker shorelines. In summary, the usefulness of the visible spectrum for oil detection is limited. It is an economical way to document spills and provide baseline data on shorelines or relative positions. References
3 Fingas, M. and C.E. Brown, Oil Spill Remote Sensing: A Review, Chapter 6, in Oil Spill Sci. Techn., M. Fingas, Editor, Gulf Publishing
Company, NY, NY, 111, 2011
7 Fingas, M.F., C.E. Brown, and L. Gamble, The Visibility and Detectability of Oil Slicks and Oil Discharges on Water, AMOP, 865, 1999 8 O'Neil, R.A., R.A. Neville, and V. Thompson, The Arctic Marine Oilspill Program (AMOP) Remote Sensing Study, Environment Canada Report
EPS 4-EC-83-3, 1983 9 Brown, H.M., J.P. Bittner, and R.H. Goodman, The Limits of Visibility of Spilled Oil Sheens, Proceedings of the Second Thematic International
Airborne Remote Sensing Conference and Exhibition, Erim Conferences, III 327, 1996 10 Taylor, S., 0.45 to 1.1 μm Spectra of Prudhoe Crude Oil and of Beach Materials in Prince William Sound, Alaska, CRREL Special Report No.
92-5, 1992
OIL SPILL REMOTE SENSING: CHAPTER 5
Infrared
Oil, which is optically thick, absorbs solar radiation and re-emits a portion of this radiation as thermal energy, primarily in the 8 to 14 μm region. Thus infrared is a case where one is measuring the emissions from the oil.
3 In infrared (IR) images, thick oil appears
hot, intermediate thicknesses of oil appear cool, and thin oil or sheens are not detected. The thicknesses at which these transitions occur are poorly understood, but evidence indicates that the transition between the hot and cold layer lies between 50 and 150 μm and the minimum detectable layer is between 10 and 70 μm.
3
5
The reason for the appearance of the ‘cool’ slick is not fully understood. A likely theory is that a moderately thin layer of oil on the water surface causes destructive interference of the thermal radiation waves emitted by the water, thereby reducing the amount of thermal radiation emitted by the water.
3 This is analogous to the appearance of the rainbow sheen. The cool slick would correspond
to the thicknesses as observed above, because the minimum destructive thickness would be about 2 times the wavelength which is between 8 to 10 μm. This would yield a destructive interference onset of about 16 to 20 μm to about 4 wavelengths or about 32 to 40 μm. The destructive or ‘cool’ area is usually only seen with test slicks, which is explained by the fact that the more rapidly-spreading oil is of the correct thickness to show this phenomenon. Slicks that have been on the water for a longer period of time usually are thicker or thinner (i.e. sheen) than 16 to 40 µm. The onset of the hot thermal layer would in theory then be at thicknesses greater than this or at about 50 μm.
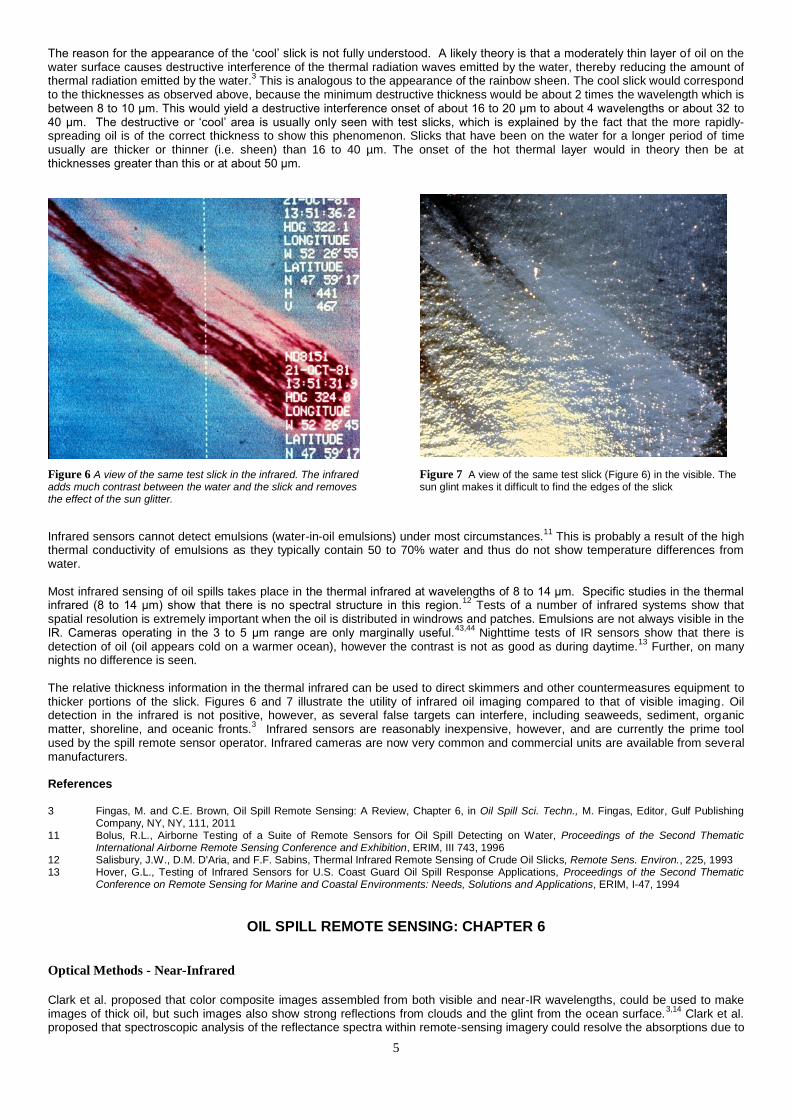
Figure 6 A view of the same test slick in the infrared. The infrared adds much contrast between the water and the slick and removes the effect of the sun glitter.
Figure 7 A view of the same test slick (Figure 6) in the visible. The sun glint makes it difficult to find the edges of the slick
Infrared sensors cannot detect emulsions (water-in-oil emulsions) under most circumstances.11
This is probably a result of the high thermal conductivity of emulsions as they typically contain 50 to 70% water and thus do not show temperature differences from water. Most infrared sensing of oil spills takes place in the thermal infrared at wavelengths of 8 to 14 μm. Specific studies in the thermal infrared (8 to 14 μm) show that there is no spectral structure in this region.
12 Tests of a number of infrared systems show that
spatial resolution is extremely important when the oil is distributed in windrows and patches. Emulsions are not always visible in the IR. Cameras operating in the 3 to 5 μm range are only marginally useful.
43,44 Nighttime tests of IR sensors show that there is
detection of oil (oil appears cold on a warmer ocean), however the contrast is not as good as during daytime.13
Further, on many nights no difference is seen.
The relative thickness information in the thermal infrared can be used to direct skimmers and other countermeasures equipment to thicker portions of the slick. Figures 6 and 7 illustrate the utility of infrared oil imaging compared to that of visible imaging. Oil detection in the infrared is not positive, however, as several false targets can interfere, including seaweeds, sediment, organic matter, shoreline, and oceanic fronts.
3 Infrared sensors are reasonably inexpensive, however, and are currently the prime tool
used by the spill remote sensor operator. Infrared cameras are now very common and commercial units are available from several manufacturers. References
3 Fingas, M. and C.E. Brown, Oil Spill Remote Sensing: A Review, Chapter 6, in Oil Spill Sci. Techn., M. Fingas, Editor, Gulf Publishing
Company, NY, NY, 111, 2011 11 Bolus, R.L., Airborne Testing of a Suite of Remote Sensors for Oil Spill Detecting on Water, Proceedings of the Second Thematic
International Airborne Remote Sensing Conference and Exhibition, ERIM, III 743, 1996 12 Salisbury, J.W., D.M. D'Aria, and F.F. Sabins, Thermal Infrared Remote Sensing of Crude Oil Slicks, Remote Sens. Environ., 225, 1993 13 Hover, G.L., Testing of Infrared Sensors for U.S. Coast Guard Oil Spill Response Applications, Proceedings of the Second Thematic
Conference on Remote Sensing for Marine and Coastal Environments: Needs, Solutions and Applications, ERIM, I-47, 1994
OIL SPILL REMOTE SENSING: CHAPTER 6
Optical Methods - Near-Infrared
Clark et al. proposed that color composite images assembled from both visible and near-IR wavelengths, could be used to make images of thick oil, but such images also show strong reflections from clouds and the glint from the ocean surface.
3,14 Clark et al.
proposed that spectroscopic analysis of the reflectance spectra within remote-sensing imagery could resolve the absorptions due to
6
the organic compounds in oil and can better discriminate the spectral shape of oil.14
A method to analyse absorptions due to specific materials is called absorption-band depth mapping Clark and others showed that simple three-point-band depth mapping could show the location of absorption features but can not identify specific compositions of compounds causing these features when compound mixtures have absorptions near the same wavelength. In the case of open ocean images, comprised of pixels containing water, oil/water mixtures, and clouds, the organic compounds in the oil and oil/water mixtures have absorption features that are distinct from those from water and clouds. These spectral differences, it was proposed, allows one to map qualitative variations in oil abundance. Other than in the Gulf oil spill, this system has not been tested. The researchers used the NASA Airborne Visible/Infrared Imaging Spectrometer (AVIRIS). AVIRIS provides data on the spectrum of the surface at each pixel from 0.35 to 2.5 microns (the visible spectrum is: blue: 0.4 micron, green 0.53 micron, deep red 0.7 micron) in 224 channels. AVIRIS data from oil overflights were used to produce a three-point band depth map, indicating potential locations of thick oil is, by the following methods: 1 Radiance data are converted to surface reflectance using a two step process.
14
2 Three-point-band depth images are computed using continuum-removed reflectance spectra. The band-depth images produced from these calculations are combined into a color composite image as follows: the 2.3-micron feature in the red channel, the 1.73-micron feature in the green channel, and the 1.2-micron feature in the blue channel. The thicker oil then theoretically shows up in the green-blue regions of the image. The Gulf oil spill was mapped using the AVIRUS sensor in the ER aircraft and thickness maps were plotted.
14 This method
appeared to work for the Gulf oil spill, however, confirmation on other spills awaits. Ultraviolet
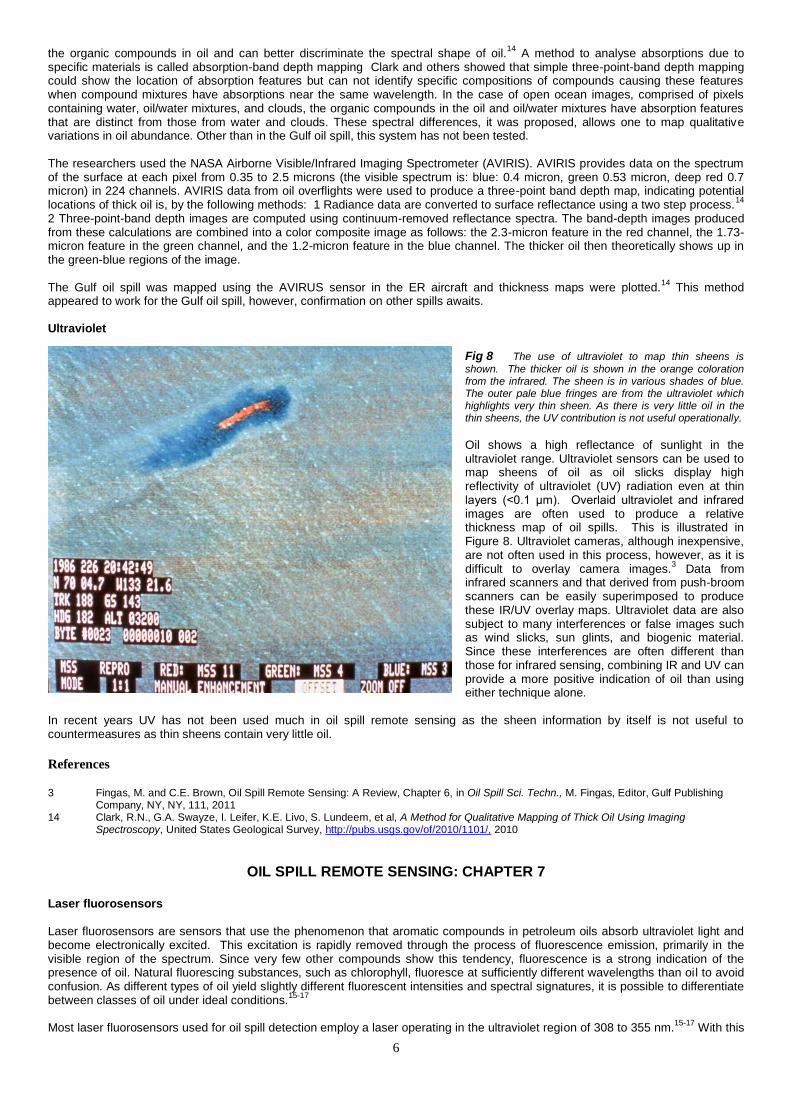
Fig 8 The use of ultraviolet to map thin sheens is
shown. The thicker oil is shown in the orange coloration from the infrared. The sheen is in various shades of blue. The outer pale blue fringes are from the ultraviolet which highlights very thin sheen. As there is very little oil in the thin sheens, the UV contribution is not useful operationally.
Oil shows a high reflectance of sunlight in the ultraviolet range. Ultraviolet sensors can be used to map sheens of oil as oil slicks display high reflectivity of ultraviolet (UV) radiation even at thin layers (<0.1 μm). Overlaid ultraviolet and infrared images are often used to produce a relative thickness map of oil spills. This is illustrated in Figure 8. Ultraviolet cameras, although inexpensive, are not often used in this process, however, as it is difficult to overlay camera images.
3 Data from
infrared scanners and that derived from push-broom scanners can be easily superimposed to produce these IR/UV overlay maps. Ultraviolet data are also subject to many interferences or false images such as wind slicks, sun glints, and biogenic material. Since these interferences are often different than those for infrared sensing, combining IR and UV can provide a more positive indication of oil than using either technique alone.
In recent years UV has not been used much in oil spill remote sensing as the sheen information by itself is not useful to countermeasures as thin sheens contain very little oil.
References
3 Fingas, M. and C.E. Brown, Oil Spill Remote Sensing: A Review, Chapter 6, in Oil Spill Sci. Techn., M. Fingas, Editor, Gulf Publishing
Company, NY, NY, 111, 2011 14 Clark, R.N., G.A. Swayze, I. Leifer, K.E. Livo, S. Lundeem, et al, A Method for Qualitative Mapping of Thick Oil Using Imaging
Spectroscopy, United States Geological Survey, http://pubs.usgs.gov/of/2010/1101/, 2010
OIL SPILL REMOTE SENSING: CHAPTER 7
Laser fluorosensors Laser fluorosensors are sensors that use the phenomenon that aromatic compounds in petroleum oils absorb ultraviolet light and become electronically excited. This excitation is rapidly removed through the process of fluorescence emission, primarily in the visible region of the spectrum. Since very few other compounds show this tendency, fluorescence is a strong indication of the presence of oil. Natural fluorescing substances, such as chlorophyll, fluoresce at sufficiently different wavelengths than oil to avoid confusion. As different types of oil yield slightly different fluorescent intensities and spectral signatures, it is possible to differentiate between classes of oil under ideal conditions.
15-17
Most laser fluorosensors used for oil spill detection employ a laser operating in the ultraviolet region of 308 to 355 nm.
15-17 With this

7
wavelength of activation, there exists a broad range of fluorescent response for organic matter, centered at 420 nm. This is referred to as Gelbstoff or yellow matter, which can be easily annulled. Chlorophyll yields a sharp peak at 685 nm. The fluorescent response of crude oil ranges from 400 to 650 nm with peak centers in the 480 nm region. The use of laser fluorosensors for chlorophyll and other applications has been well documented.
15
Another phenomenon, known as Raman scattering, involves energy transfer between the incident light and the water molecules. When the incident ultraviolet light interacts with the water molecules, Raman scattering occurs. This involves an energy transfer between the incident light and water molecules. The water molecules absorb some of the energy as rotational-vibrational energy and emit light at a wavelength which is the difference between the incident radiation and the vibration-rotational energy of the molecule. The Raman signal for water occurs at 344 nm when the incident wavelength is 308 nm (XeCl laser or eximer laser). With an excitation at 460 nm (tunable dye laser) the Raman occurs at about 540 nm.
18
Fig 9 An illustration of a fluorosensor display. On the left instrument and detection criteria are given. On the right, the flight track (blue) is annotated with oil detection ‘hits’ shown as red bars. The map on the right is a real-time actual map. (Image from Environment Canada)
The water Raman signal is useful for maintaining wavelength calibration of the fluorosensor in operation, but has also been used in a limited way to estimate oil thickness, because the strong absorption by oil on the surface will suppress the water Raman signal in proportion to thickness.
18 The point at which the Raman signal is entirely suppressed depends on the type of oil, since each oil has
a different absorption coefficient. The Raman signal suppression has led to estimates of sensor detection limits of about 0.05 to 0.1 μm.
18 It should be noted that this thickness is well below that of interest for oil spill countermeasures.
Laser fluorosensors have significant potential as they may be the only means to discriminate between oiled and unoiled seaweeds and to detect oil on different types of shorelines. Tests on shorelines show that this technique has been very successful.
15
Algorithms for the detection of oil on shorelines have been developed. Work has been conducted on detecting oil in the water column such as occurs with the product, Orimulsion.
15 The fluorosensor is also the only reliable means of detecting oil in certain ice
and snow situations. Operational use shows that the laser fluorosensor is a powerful tool for oil spill remote sensing.15
Currently, one company makes two commercial models of the instrument (Optimare). Laser fluorosensors have shown high utility in practice and are now becoming essential sensors in many remote sensing packages. The information in the output is unique and the technique provides a unique method of oil identification. The method is analogous to performing chemistry in flight. Figure 9 shows a display of a laser fluorosensor. The typical fluorosensor can provide an abundance of information to the user.
References
15 Brown, C.E., Laser Fluorosensors, in Oil Spill Science and Technology, pp. 171-184, 2011. 16 Hengstermann, T. and R. Reuter, Lidar Fluorosensing of Mineral Oil Spills on the Sea Surface, Appl. Optics, 3218, 1990
17 Vasilescu, J., L. Marmureanu, E. Carstea and C.P. Cristscu, Oil Spills Detection from Fluroescence Lidar Measurements, U.P.B. Sci. Bull., 149, 2010
18 Hoge, F.E. and R.N. Swift, Oil Film Thickness Measurement Using Airborne Laser-Induced Water Raman Backscatter, Appl. Optics, 3269, 1980
8
OIL SPILL REMOTE SENSING: CHAPTER 8
Microwave sensors Microwave Radiometers
Microwave radiometers detect the presence of an oil film on water by measuring the reflective interference pattern excited by the radiation from free space. The apparent emissivity factor of water is 0.4 compared to 0.8 for oil.
19 A passive microwave radiometer
can detect this difference in emissivity and could therefore be used to detect oil. In addition, as the signal changes with thickness, in theory, the device could be used to measure thickness. This detection method has not been very successful in the field, however, as several environmental and oil-specific parameters must be known. In addition, the signal return is dependent on oil thickness but in a cyclical fashion. A given signal strength can imply any one of several film thicknesses within a given slick. Microwave energy emission is greatest when the effective thickness of the oil equals an odd multiple of one quarter of the wavelength of the observed energy. Biogenic materials also interfere and the signal-to-noise ratio is low. In addition, it is difficult to achieve high spatial resolution (might need resolution in metres rather than the typical tens of metres for a radiometer). The Swedish Space Corporation has carried out work with different systems, including a dual band, 22.4- and 31-GHz device, and a single band 37-GHz device.
3 Skou, Sorensen and Poulson describe a 2-channel device operating at 37.5 and 10.7 GHz.
20
Mussetto and co-workers at TRW described the tests of 44-94-GHz and 94-154-GHz, 2-channel devices over oil slicks.3 TRW
showed that correlation with slick thickness is poor and suggest that factors other than thickness also change surface brightness. They suggest that a single-channel device might be useful as an all-weather, relative-thickness instrument. Tests of single-channel devices over oil slicks have also been described in the literature, specifically a 36-GHz and a 90-GHz device.
3 A recent method of
microwave radiometry has been developed in which the polarization contrasts at two orthogonal polarizations are measured in an attempt to measure oil slick thickness.
3 A series of frequency-scanning radiometers have been built and appear to have overcome
the difficulties with the cyclical behaviour.21
Currently, there is a five-channel system on the market. In summary, passive microwave radiometers may have potential as all-weather oil sensors. Their potential as a reliable device for measuring slick thickness, however, is a topic of discussion and certainly would be limited to well-calibrated devices having multiple frequencies. Microwave Scatterometers A microwave scatterometer is a device that measures the scattering of radar energy by a target. One radar scatterometer was flown over several oil slicks and used a low-power transmitter operating in the Ku band (13.3 GHz).
3 The scatterometer detected
the oil, but discrimination was poor. The ‘Heliscat’, a device with five frequencies has been used to investigate capillary wave damping.
22 The advantage of a microwave scatterometer is that it has an aerial coverage similar to optical sensors and it can look
at several incident angles. The main disadvantages include the lack of discrimination for oil and the lack of imaging capability. Surface wave radars It is possible to send radio waves along the sea using high frequency. The conductivity of the sea acts as a wave guide. These radars can be used to detect ships as far out as 500 km.
3 Since these are surface wave phenomena only targets above the surface
are detected, thus slicks may not be detected by this technique. Modeling of the technique does not show whether there is potential for oil detection by this method or not.
3 There are several types of these, one type is used to measure ocean surface
currents.23
Interferometric radar Radars can be used to measure height, currents and other surface elevation phenomena using interferometric techniques. Some radar systems on aircraft are fitted for this application such as the Government of Canada Convair 580. This can also be carried out in space using two satellites traveling in tandem. One research group employed the tandem satellite pairs of ERS-2 and ENVISAT to carry out such work but there are no reports on interferometric use on oil spills.
3
References
3 Fingas, M. and C.E. Brown, Oil Spill Remote Sensing: A Review, Chapter 6, in Oil Spill Sci. Techn., M. Fingas, Editor, Gulf Publishing
Company, NY, NY, 111, 2011 19 Ulaby, F.T., R.K. Moore, and A.K. Fung, Microwave Remote Sensing: Active and Passive, Artech House, 1466, 1989 20 Skou, N., B.M. Sorensen, and A. Poulson, A New Airborne Dual Frequency Microwave Radiometer for Mapping and Quantifying Mineral
Oil on the Sea Surface, Proceedings of the Second Thematic Conference on Remote Sensing for Marine and Coastal Environments , ERIM, 559, 1994
21 McMahon, O.B., T.J. Murphy, and E.R. Brown, Remote Measurement of Oil Spill Thickness, Proceedings of the Fourth Thematic Conference on Remote Sensing for Marine and Coastal Environments, ERIM, I-353, 1997 22 Hühnerfuss, H., W. Alpers, H. Dannhauer, M. Gade, P.A. Lange, V. Neumann, and V. Wismann, Natural and Man-made Sea Slicks in the
North Sea Investigated by a Helicopter-borne 5-frequency Radar Scatterometer, Int. J. Rem. Sens., 1567, 1996 23 Tinis, S.W., D.O. Hodgins, and M.F. Fingas, Assimilation of Radar Measured Surface Current Fields into a Numerical Model for Oil Spill Modelling, Spill Sci. Tech. Bull., 247, 1996
9
OIL SPILL REMOTE SENSING: CHAPTER 9 Radar
Capillary waves on the ocean reflect radar energy, producing a ‘bright’ image known as sea clutter. Since oil on the sea surface dampens capillary waves, the presence of an oil slick might be detected as a ‘dark’ sea or one with an absence of this sea clutter.
3
Unfortunately, oil slicks are not the only phenomena that are detected in this way. There are many interferences or false targets, including fresh water slicks, wind slicks (calms), wave shadows behind land or structures, shallow seaweed beds that calm the water just above them, glacial flour, biogenic oils, and whale and fish sperm.
3,24-29 As a result, radar can be marginally effective in
locations such as Prince William Sound, Alaska where dozens of islands, fresh water inflows, ice, and other features produce hundreds of such false targets. Liu et al. showed that even with extensive processing that false hits on SAR imagery were 20%, that is 20% of the images reported as oil were still look-alikes.
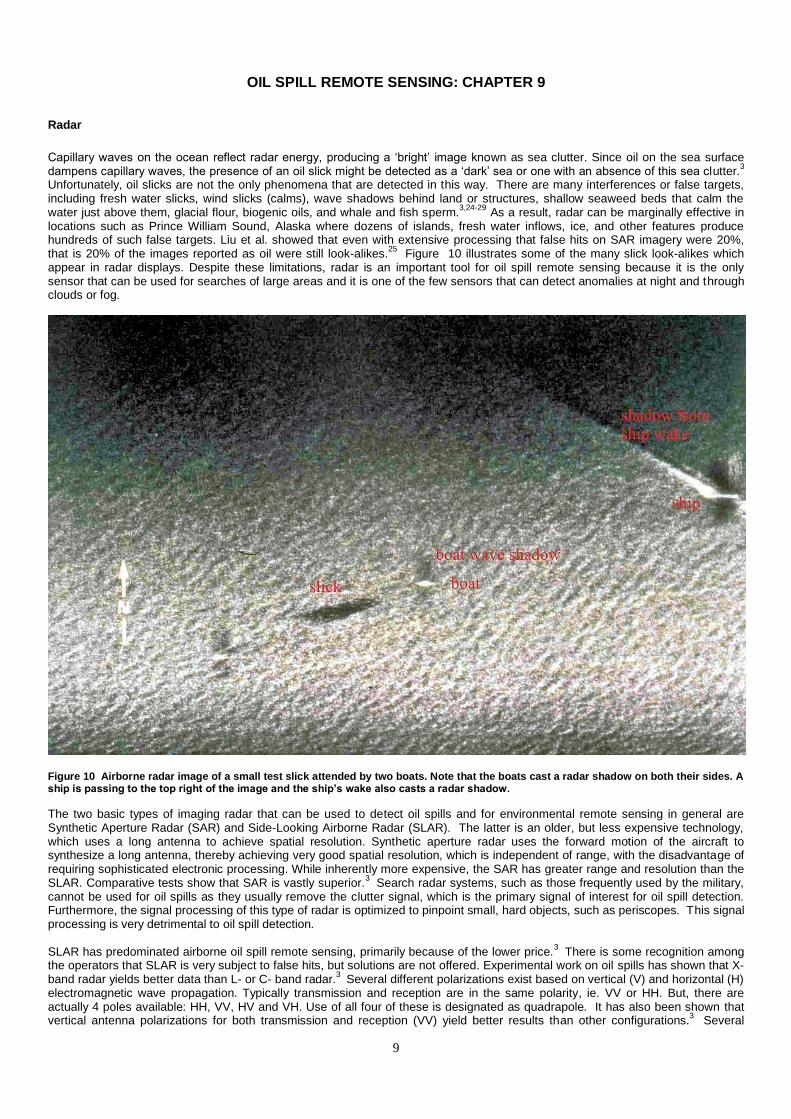
25 Figure 10 illustrates some of the many slick look-alikes which
appear in radar displays. Despite these limitations, radar is an important tool for oil spill remote sensing because it is the only sensor that can be used for searches of large areas and it is one of the few sensors that can detect anomalies at night and through clouds or fog.
Figure 10 Airborne radar image of a small test slick attended by two boats. Note that the boats cast a radar shadow on both their sides. A ship is passing to the top right of the image and the ship’s wake also casts a radar shadow.
The two basic types of imaging radar that can be used to detect oil spills and for environmental remote sensing in general are Synthetic Aperture Radar (SAR) and Side-Looking Airborne Radar (SLAR). The latter is an older, but less expensive technology, which uses a long antenna to achieve spatial resolution. Synthetic aperture radar uses the forward motion of the aircraft to synthesize a long antenna, thereby achieving very good spatial resolution, which is independent of range, with the disadvantage of requiring sophisticated electronic processing. While inherently more expensive, the SAR has greater range and resolution than the SLAR. Comparative tests show that SAR is vastly superior.
3 Search radar systems, such as those frequently used by the military,
cannot be used for oil spills as they usually remove the clutter signal, which is the primary signal of interest for oil spill detection. Furthermore, the signal processing of this type of radar is optimized to pinpoint small, hard objects, such as periscopes. This signal processing is very detrimental to oil spill detection. SLAR has predominated airborne oil spill remote sensing, primarily because of the lower price.
3 There is some recognition among
the operators that SLAR is very subject to false hits, but solutions are not offered. Experimental work on oil spills has shown that X-band radar yields better data than L- or C- band radar.
3 Several different polarizations exist based on vertical (V) and horizontal (H)
electromagnetic wave propagation. Typically transmission and reception are in the same polarity, ie. VV or HH. But, there are actually 4 poles available: HH, VV, HV and VH. Use of all four of these is designated as quadrapole. It has also been shown that vertical antenna polarizations for both transmission and reception (VV) yield better results than other configurations.
3 Several
10
researchers have shown that VV is best for oil spill detection and discrimination.3 Some workers noted that VV polarization tends
to be more suitable for oil pollution detection when winds are strong and HH when winds are light although this was observational.3
However, the dependency of HH polarization on the incidence angle is greater than that of VV polarization. This means that if the incidence angle is small, the difference in intensity between HH and VV polarization is small, but if the incidence angle is large, the VV image on the sea is brighter than the HH image. This suggests that generally the VV image is better for detecting oil spills. A larger standard deviation for the slick compared to the sea typically indicates that it is oil. Several workers have noted that polarimetric SAR can provide powerful discrimination between slicks and look-alikes.
3 Additionally, phase differences can be used
to detect oil. Migliaccio et al. calculated that the co-polarized phase difference (CPD) would yield a larger signal for oil compared to that for the sea.
3 Migliaccio et al. showed that the co-polarized phase difference - e.g. the difference between the HH and VV
phases, can be used to discriminate oil slicks from biogenic slicks. Velotto et al. studied the use of co-polarized radar data for oil spill detection.
3 They use the TERRASAR-X dual polarized HH and VV bands and calculated the co-polarized phase difference
between these bands. They claimed that this approach is able to better discriminate oil spills from weak-damping look-alikes. The ability of radar to detect oil is limited by sea state. Sea states that are too low will not produce enough sea clutter in the surrounding sea to contrast to the oil and very high seas will scatter radar sufficiently to block detection inside the wave troughs. Indications are that minimum wind speeds of 1.5 m/s (~3 knots) are required to allow detection and a maximum wind speed of 6 m/s (~12 knots) will again remove the effect.
3 The most accepted limits are 1.5 m/s (~3 knots) to 10 m/s (~20 knots). This limits the
environmental window of application of radar for detecting oil slicks. Gade et al. studied the difference between extensive systems from a space-borne mission and a helicopter-borne system.
3 They found that at high winds, it was not possible to discriminate
biogenic slicks from oil. At low wind speeds, it was found that images in the L-band showed discrimination. Under these conditions the biogenic material showed greater damping behaviour in the L-band. Okamoto et al. studied the use of ERS-1 using an artificial oil (oleyl alcohol) and found that an image was detected at a wind speed of 11 m/s, but not at 13.7 m/s.
3
Shipborne radar has similar limitations and the additional handicap of low altitude, which restricts its range to between 8 to 30 km, depending on the height of the antenna. Ship radars can be adjusted to reduce the effect of sea clutter de-enhancement. Shipborne radar successfully detected many slicks and commercial systems are now available. During the Prestige spill, a
Netherlands vessel successfully used this technique to guide a recovery vessel into slicks.28
The technique is, however, very limited by sea state and in all cases where it was used, the presence and location of the slick were already known or suspected. Recently researchers have carried out work on improving the imaging of slicks from ship-borne radars.
3 Today there are some
commercial products to enhance the images from ship-borne radar to enable some oil imaging. Gangeskar has proposed an automatic system that could be mounted on oil drilling platforms.
3 This system would use standard X-
band ship navigation units and would provide an alert if an oil spill is present. The system includes an extensive post-processing system to provide both a user-friendly Graphic Use Interface (GUI) and an automatic detection and alert system. The system has not been fully tested to date. Radar has also been used to measure currents and predict oil spill movements by observing frontal movements.
3 Work has shown
that frontal currents and other features can be detected by SAR. In summary, radar optimized for oil spills is useful in oil spill remote sensing, particularly for searches of large areas and for night-time or foul weather work. The technique is highly prone to false targets, however, and is limited to a narrow range of wind speeds. Because of the all-weather and day-night capability, radar is now the most common means of oil spill remote sensing. False Detections and No Detections
Because radar detection of oil spills is so highly susceptible to false images, much work has taken place on means to differentiate oil slicks and false targets, often called look-alikes. These look-alikes include: low wind areas, areas sheltered by land, rain cells, organic films, grease ice, wind fronts, up-welling zones, oceanic fronts, algae blooms, current shear zones, etc.
3 Extensive effort
has been placed upon removing these look-alikes from imagery and automating the process of slick detection.27-29
This issue is relevant to both satellite and airborne SAR systems. Anderson et al. noted that false detections and lack of detections on satellite-borne systems can be high.
30 In analyzing 775 SAR
images over the Baltic sea with potential oil spills, they classified 94% of as low or medium confidence. On the other hand they noted that of 69 actual oil pollution incidents in the Latvian Baltic, only about 45% were actually detected by SAR. About 40% of the SAR detections were slick look-alikes or were very minor amounts of oil. References 3 Fingas, M. and C.E. Brown, Oil Spill Remote Sensing: A Review, Chapter 6, in Oil Spill Sci. Techn., M. Fingas, Editor, Gulf Publishing
Company, NY, NY, 111, 2011 24 Hühnerfuss, H., W. Alpers, and F. Witte, Layers of Different Thicknesses in Mineral Oil Spills Detected by Grey Level Textures of Real Aperture Radar Images, I. J. Rem. Sens., 1093, 1989 25 Liu. P., C. Zhao, X. Li, M. He and W. Pichel, Identification of Ocean Oil Spills in SAR Imagery Based on Fuzzy Logic Algorithm, Int. J..Rem. Sens., 4819, 2010 26 Macklin, J.T., The Imaging of Oil Slicks by Synthetic Aperture Radar, GEC Journal of Research, 19, 1992 27 Madsen, S., N. Skou, and B.M. Sorensen, Comparison of VV and HH Polarized SLAR for Detection of Oil on the Sea Surface, Proceedings of the Second Thematic Conference on Remote Sensing for Marine and Coastal Environments: Needs, Solutions and Applications, ERIM, I-498, 1994 28 Nøst, E. And C.N. Egset, Oil Spill Detection System - Results from Field Trials, Proceedings Oceans Marine Technology Society, 2006

11
OIL SPILL REMOTE SENSING : CHAPTER 10 Slick thickness determination
There is a need to measure oil slick thickness, this need has been expressed both within the oil spill response community and among academics in the field. There are presently no reliable methods, either in the laboratory or the field, for accurately measuring oil-on-water slick thickness. The ability to do so would significantly increase understanding of the dynamics of oil spreading and behaviour. Knowledge of slick thickness would make it possible to determine the effectiveness of certain oil spill countermeasures including dispersant application and in-situ burning. Indeed, the effectiveness of individual dispersants could be determined quantitatively if the oil remaining on the water surface after time and following dispersant application could be accurately measured.
3
Visual thickness indications
Table 1 Relationship of Thickness to Appearance
Visibility Thresholds (µm)
minimum silvery rainbow darkening colors dull colors Dark
Typical thickness 0.09 0.1 0.6* 0.9 2.7 8.5
*Note this is the only physics-based appearance factor A tool for working with oil spills has been the relationship between appearance and thickness. Careful study of the literature on this and comparing this to field experience shows that there is limited potential to scale thicknesses to visual appearance.
3 The only
physics-based appearance occurs are thicknesses of about 0.7 to 2.5 µm at which the rainbow colours appear as a result of multiple constructive and destructive interferences by light. Table 1 shows the summation of the best knowledge on this phenomenon. Figures 11 (below) shows a typical rainbow sheens for which we can estimate that the thickness is about 1 µm. This is the only colour appearance that has a strict physical slick thickness associated with it. Lehr argues that the visual indications of slick thickness are so poor as to not allow for any slick thickness estimation.
31 In particular
he notes that the Bonn agreement thickness code provides insufficient proof for greater thicknesses as it purports to. Lehr suggests that the solution to this is simply to use two thickness regimes, sheen and thicker oil and not to estimate slick volumes from this.

12
Figure 11 A picture of a rainbow sheen. This is the only spill thickness that has a singular physical explanation. (Photograph from
Environment Canada) Slick thickness relationships in remote sensors
A number of investigators tried to correlate slick thickness with appearance in various remote sensing instruments. Hollinger and Mennella conducted a series of eight controlled oil spills off Virginia to investigate the use of microwave radiometry to delineate oil spills.
32 They used 19.4 and 69.8 GHz radiometers on the spills. Measurements using sorbents were used to calibrate the
radiometer. It was noted that the sheens typically had a thickness of 2 to 4 μm. It was found that 90% of the oil was in 10% of the slick area and that the microwave threshold was about 0.1 mm (100 μm). A series of experiments was carried out in 1979 to evaluate infrared (IR) and side-looking airborne radar (SLAR) for oil spill detection.
3 The imagery was correlated against visual and sorbent measurements, which were used to derive a thickness estimate.
It was concluded that the infrared threshold was between 25 and 50 μm and for SLAR 100 nm. The United Kingdom conducted Isowake Experiments in 1982.
3, 33 On the basis of estimations and calculations it was concluded
that the lowest detectable slick thickness for IR was between 10 and 50 μm. Brown et al. conducted experiments to measure the visibility of oil slicks. The observers and an ultraviolet (UV) and visible camera were mounted in a crane basket 30 m over the slick.
3 It was found that the detection ability decreased by over 50% for most oils
and for the cameras when the angle was changed from 90 to 55 degrees from the horizontal (equivalent incidence angle of 0 to 35 degrees). Detectability degraded to 70% and sometimes to nil as the viewing angle was decreased past 55 through 35 degrees. Brown et al. conducted several experiments to ascertain the relationship between thickness of slicks and the density (or intensity) of the infrared image.
3 The thicknesses varied between 1 to 10 mm and thicknesses were measured using an underwater acoustic
system. No relationship between slick thickness and infrared brightness was found. Specific thickness sensors
The suppression of the water Raman peak in laser fluorosensor data has not been fully exploited or tested. This technique may work for thin slicks, but not necessarily for thick ones, at least not with a single excitation frequency. Attempts have been made to calibrate the thickness appearance of infrared imagery, but also without success. It is suspected that the temperatures of the slick as seen in the IR are highly dependent on oil type, sun angle, and weather conditions. If so, it may not be possible to use IR as a calibrated tool for measuring thickness. As accurate ground-truth methods do not exist, it is very difficult to calibrate existing equipment.
3 The use of sorbent techniques to measure surface thickness yields highly variable results.
3 As noted in the section on
microwave radiometers, the signal strength measured by these instruments can imply one of several thicknesses. This methodology does not appear to have potential, other than for measuring relative oil thickness. One method to avoid this problem is to use multi frequencies and with careful calibration. A variety of electrical, optical, and acoustic techniques for measuring oil thickness has been investigated.
3 Two promising
techniques were pursued in a series of laboratory measurements. In the first technique, known as ‘thermal mapping’, a laser is used to heat a region of oil and the resultant temperature profiles created over a small region near this heating are examined using an infrared camera.
3 The temperature profiles created are dependent on the oil thickness. A more promising technique involves
laser acoustics.3
The Laser Ultrasonic Remote Sensing of Oil Thickness (LURSOT) sensor consists of three lasers, one of which is coupled to an interferometer to accurately measure oil thickness.
3 The sensing process is initiated with a thermal pulse created
in the oil layer by the absorption of a powerful CO2 laser pulse. Rapid thermal expansion of the oil occurs near the surface where the laser beam was absorbed, which causes a step-like rise of the sample surface as well as an acoustic pulse of high frequency and large bandwidth (~ 15 MHz for oil). The acoustic pulse travels down through the oil until it reaches the oil-water interface where it is partially transmitted and partially reflected back towards the oil-air interface, where it slightly displaces the oil’s surface. The time required for the acoustic pulse to travel through the oil and back to the surface again is a function of the thickness and the acoustic velocity of the oil. The displacement of the surface is measured by a second laser probe beam aimed at the surface. Motion of the surface induces a phase or frequency shift (Doppler shift) in the reflected probe beam. This phase or frequency modulation of the probe beam can then be demodulated with an interferometer.
3 The thickness can be determined from the time of
propagation of the acoustic wave between the upper and lower surfaces of the oil slick. This is a very reliable means of studying oil thickness and has great potential. Laboratory tests have confirmed the viability of the method and a test unit has been flown to confirm its operability.
34
Several attempts have been made to measure thickness by using visible spectral imaging. As there is no visual indications other than the rainbow sheen area around 0.8 µm, these efforts are wasted.
3 Others have tried to use laboratory measurements to
attempt to establish relationships for remote sensing outputs, such efforts fail because of the complex relationships of light in the atmosphere and on the surface.
3 Similarly, several workers have tried to use the assumption that the oil layer is transparent,
therefore the differences in reflection from the water surface and the top of the oil layer could yield a thickness measurement.3
Unfortunately, this oil is not transparent in the visible ranges, therefore such methods do not work. References
3 Fingas, M. and C.E. Brown, Oil Spill Remote Sensing: A Review, Chapter 6, in Oil Spill Sci. Techn., M. Fingas, Editor, Gulf Publishing
Company, NY, NY, 111, 2011 31 Lehr, W.J., Visual Observations and the Bonn Agreement, AMOP, 669, 2010 32 Hollinger, J.P. and R.A. Mennella, Oil Spills: Measurements of Their Distributions and Volumes by Multifrequency Microwave Radiometry, Science, 54, 1973 33 Horstein, B., The Visibility of Oil-Water Discharges, IOSC, 91, 1973 34 Brown, C.E., M.F. Fingas, J-P. Monchalin, C. Neron and C. Padioleau, Airborne Oil Slick Thickness Measurements: Realization of a

13
Dream, Proceedings of the Eighth International Conference on Remote Sensing for Marine and Coastal Environments, Altarum, 2005
OIL SPILL REMOTE SENSING : CHAPTER 11
Integrated airborne sensor systems
Increasingly, a number of different types of airborne oil spill remote sensors are being consolidated into sensor systems. The reason for this integration is to take advantage of the different information provided by each of the specific sensors and combine the information to provide a more comprehensive information product. Although each of the individual sensors has specific inherent weaknesses such as false detections, these false detections are often different for each sensor type, hence a consolidation of information can help resolve some of the uncertainties that exist from a single data source. Furthermore, additional information can be deduced from the overlaying of imagery from several sensor types. Although the absolute thickness of an oil slick remains the subject of continued research and scientific opinion, the ability to locate the thicker portions of the slick is essential in terms of operational spill cleanup and response. In addition to the integration of a number of remote sensors into a sensor system, information from other sources such as marine vessel traffic surveillance systems (i.e., automatic identification system, AIS) can be integrated and can play an essential role in identifying the source of the marine pollution. Two commercially available airborne marine oil spill remote sensing systems are the MEDUSA and the MSS 6000.
35,36 MEDUSA
incorporates a number of sensor technologies such as laser fluorosensors, infrared/ultraviolet line scanners, forward-looking infrared sensors, microwave radiometers, side-looking airborne radar systems and camera systems, as well processing software into a flexible real-time data acquisition and processing system. The data from the various sensors are geo-referenced and fused with information from AIS and marine surveillance radars into a GIS-based display output format. The processing software is known as the Oil Spill Scene Analysis System (OSSAS) and allows for the extraction of features such as the area of oil coverage including areas of intermediate and thicker portions of the slick. The MSS 6000 Maritime Surveillance System is comprised of a flexible suite of sensors such as side- looking airborne radar systems, infrared/ultraviolet line scanners, forward-looking infrared sensors, microwave radiometers, and camera systems, along with data processing and mission management software in order to perform the oil spill remote sensing surveillance task. The MSS 6000 also focuses on sensor integration and includes AIS and marine search radar inputs. All sensor data, imagery, slick targets, vessels etc. are annotated using navigation data from a single source to form an integrated part of a Geographic Information System (GIS). Both the MEDUSA and MSS 6000 can distribute their data in near-real time via direct downlink or satellite communications to vessels or shore-based communications centers. A large number of maritime nations are now employing integrated airborne sensor systems.
3
References
3 Fingas, M. and C.E. Brown, Oil Spill Remote Sensing: A Review, Chapter 6, in Oil Spill Sci. Techn., M. Fingas, Editor, Gulf Publishing
Company, NY, NY, 111, 2011 35 Optimare, http://www.optimare.de/cms/en/divisions/fek.html, site accessed June 2011 36 Swedish Space Corporation, http://www.ssc.se/?id=5772, site accessed June 2011
OIL SPILL REMOTE SENSING : CHAPTER 12 Satellite remote sensing – Optical The use of optical satellite remote sensing for oil spills has been attempted several times. The slick from the IXTOC I well blowout in Mexico was detected using GOES (Geostationary Operational Environmental Satellite) and by the AVHRR (Advanced Very High Resolution Radiometer) on the LANDSAT satellite.
3 A blowout in the Persian Gulf was subsequently detected. The large EXXON
VALDEZ slick was detected on SPOT (Satellite Pour l'Observation de la Terre) satellite data. Oiled ice in Gabarus Bay resulting from the KURDISTAN spill was detected using LANDSAT data. Several workers were able to detect the Arabian Gulf War Spill in 1991.
3 The HAVEN spill near Italy was also monitored by satellite. A spill in the Barents sea was tracked using an IR band on
NOAA 10. There were many uses of visual imagery from satellites during the Deepwater Horizon spill in the U.S.A.3 It is significant
to note that, in all these cases, the position of the oil was known and data had to be processed to actually see the oil, which sometimes took several weeks. Newer findings show that the ability to detect oil may be a complex function of conditions, oil types and view angles. Land spills have been defined by visible satellites on several occasions. Hese and Schmullius mapped out the oil land contamination in Western Siberia using Landsat and QuickBird data.
3
In the past, there were several problems associated with relying on satellites operating in optical ranges, for oil spill remote sensing. The first is the timing and frequency of overpasses and the absolute need for clear skies to perform optical work.
3 This is
particularly true with older satellites with very infrequent overpasses. The chances of the overpass and the clear skies occurring at the same time gave a very low probability of seeing a spill on a satellite image. This point is well illustrated in the case of the EXXON VALDEZ spill. Although the spill covered vast amounts of ocean for over a month, there was only one clear day that coincided with a satellite overpass, and that was on April 7, 1989. Another disadvantage of satellite remote sensing is the difficulty in developing algorithms to highlight the oil slicks and the long time required to do so. For the EXXON VALDEZ spill, it took over two months before the first group managed to ‘see’ the oil slick in the satellite imagery, although its location was precisely known. Fortunately, this has changed with the data availability in modern satellites.
14
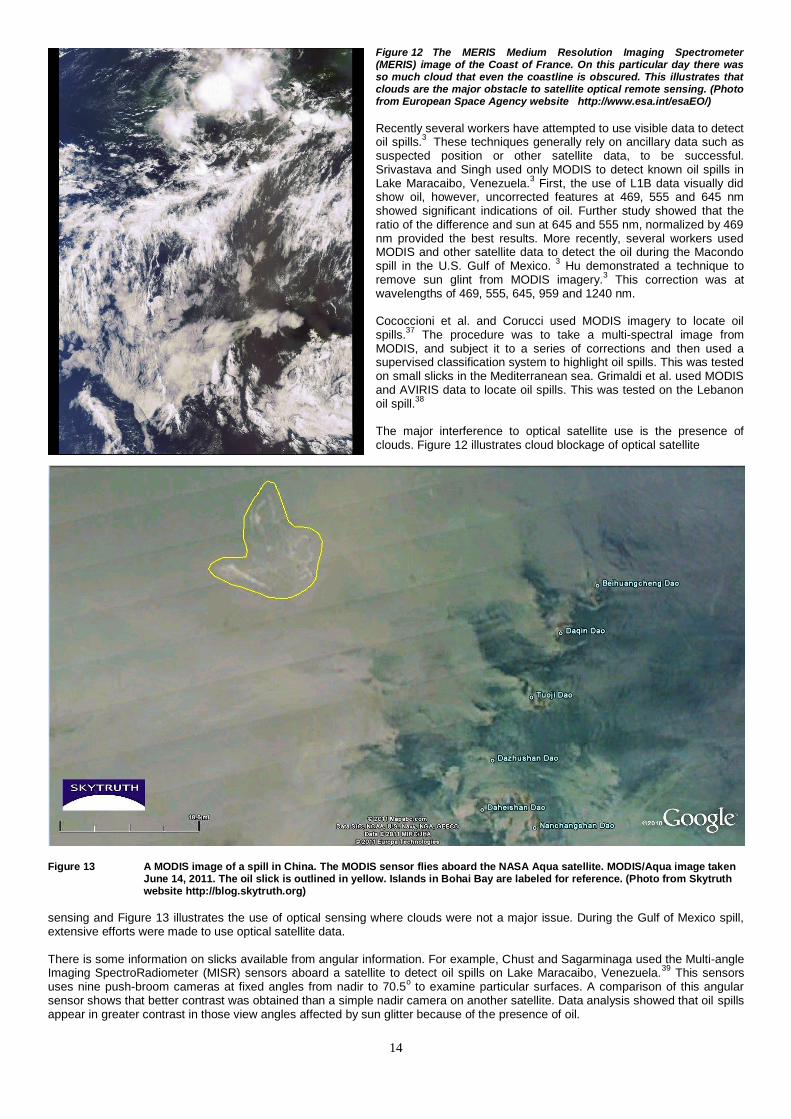
Figure 12 The MERIS Medium Resolution Imaging Spectrometer (MERIS) image of the Coast of France. On this particular day there was so much cloud that even the coastline is obscured. This illustrates that clouds are the major obstacle to satellite optical remote sensing. (Photo from European Space Agency website http://www.esa.int/esaEO/)
Recently several workers have attempted to use visible data to detect oil spills.
3 These techniques generally rely on ancillary data such as
suspected position or other satellite data, to be successful. Srivastava and Singh used only MODIS to detect known oil spills in Lake Maracaibo, Venezuela.
3 First, the use of L1B data visually did
show oil, however, uncorrected features at 469, 555 and 645 nm showed significant indications of oil. Further study showed that the ratio of the difference and sun at 645 and 555 nm, normalized by 469 nm provided the best results. More recently, several workers used MODIS and other satellite data to detect the oil during the Macondo spill in the U.S. Gulf of Mexico.
3 Hu demonstrated a technique to
remove sun glint from MODIS imagery.3 This correction was at
wavelengths of 469, 555, 645, 959 and 1240 nm. Cococcioni et al. and Corucci used MODIS imagery to locate oil spills.
37 The procedure was to take a multi-spectral image from
MODIS, and subject it to a series of corrections and then used a supervised classification system to highlight oil spills. This was tested on small slicks in the Mediterranean sea. Grimaldi et al. used MODIS and AVIRIS data to locate oil spills. This was tested on the Lebanon oil spill.
38
The major interference to optical satellite use is the presence of clouds. Figure 12 illustrates cloud blockage of optical satellite
Figure 13 A MODIS image of a spill in China. The MODIS sensor flies aboard the NASA Aqua satellite. MODIS/Aqua image taken
June 14, 2011. The oil slick is outlined in yellow. Islands in Bohai Bay are labeled for reference. (Photo from Skytruth website http://blog.skytruth.org)
sensing and Figure 13 illustrates the use of optical sensing where clouds were not a major issue. During the Gulf of Mexico spill, extensive efforts were made to use optical satellite data. There is some information on slicks available from angular information. For example, Chust and Sagarminaga used the Multi-angle Imaging SpectroRadiometer (MISR) sensors aboard a satellite to detect oil spills on Lake Maracaibo, Venezuela.
39 This sensors
uses nine push-broom cameras at fixed angles from nadir to 70.5o to examine particular surfaces. A comparison of this angular
sensor shows that better contrast was obtained than a simple nadir camera on another satellite. Data analysis showed that oil spills appear in greater contrast in those view angles affected by sun glitter because of the presence of oil.
15
IR data from satellite has been used to map the land oil pollution in Kuwait.3 It was found that the old hydrocarbon-contaminated
areas showed as much as 10oC difference from the surrounding land. Ground-truthing was used extensively in compiling the data.
Casciello also made an attempt to use IR imagery from the thermal infrared region of the AVHRR satellite to locate known oil spills.
3 Grimaldi et al. used channels 4 and 5 of the thermal infrared channels of AVHRR to calculate the presence of oil spills.
38
This technique relies on the contrast in the IR between clean and oiled water. Li et al. used the SST (Sea Surface Temperature) information in the infrared from MODIS to detect oil spills.
3
In summary, the use of optical satellite data shows mixed results. In any case, clouds become the major obstacle to oil detection and mapping. Visible imagery does show oil spills under ideal conditions as does infrared imagery. In recent years, the success for using optical satellite data has increased, but is not at the point where it could be used as a reliable and routine technique. 3 Fingas, M. and C.E. Brown, Oil Spill Remote Sensing: A Review, Chapter 6, in Oil Spill Sci. Techn., M. Fingas, Editor, Gulf Publishing
Company, NY, NY, 111, 2011 37 Cococcioni, M. And L. Corucci, Issues and Preliminary Results in Oil Spill Detection Using Optical Remotely Sensed Images, IEEE, 2009 38 Grimaldi, C.S.L., D. Casciello, I. Coviello, T. Lacava, N. Pergola and V. Tramutoli, Satellite Oil Spill Detection and Monitoring in the Optical Range, IGARSS, 4487, 2010 39 Chust, G. And Y. Sagarminaga, The Multi-angle View of MISR Detects Oil Slicks under Sun Glitter Conditions, Remote Sensing of the
Environment, 232, 2007
OIL SPILL REMOTE SENSING : CHAPTER 13
Satellite Remote Sensing – Radar
Radar satellites, including ERS-1 and -2, Radarsat-1 and 2, and ENVISAT, have usefulness for detecting large offshore spills and for spotting anomalies.
3 RADARSAT has been used for detecting oil seeps, and many other features on the ocean. A novel
application of RADARSAT has been the study of oil lakes in the deserts of Kuwait.3
Radar satellites are now used routinely by a number of nations to provide imagery for spills and to give indications of ship discharges. ERS-1 and 2 have been used for mapping of oil spills in the Caspian Sea.
9 Fortuny describe the use of ERS-2 and
ENVISAT to provide imagery during the Prestige incident off Spain.40
Torres Palenzuela and co-workers used two ASAR (Advanced SAR) images from the Envisat satellite to study the same Prestige spill off Spain.
41 Using several techniques that were
readily-available such as filtering and comparison to GIS data of the areas, several slicks were identified. These slicks were confirmed by recorded sightings from helicopters and ships.
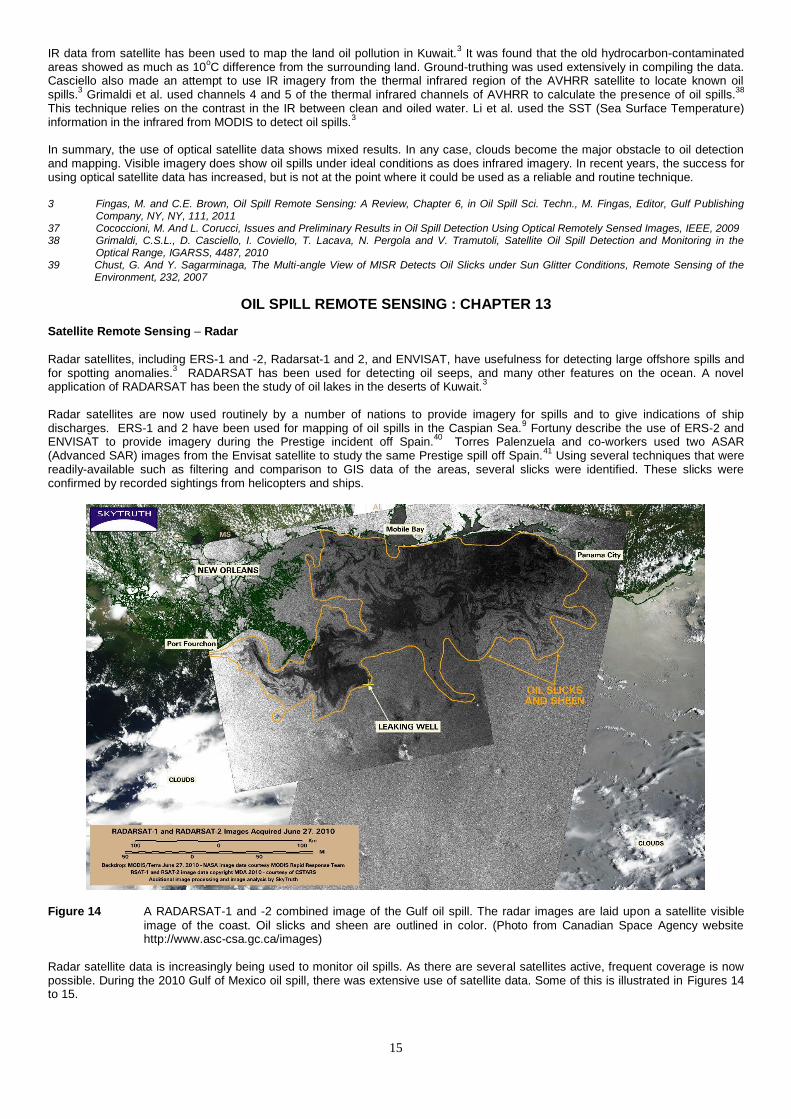
Figure 14 A RADARSAT-1 and -2 combined image of the Gulf oil spill. The radar images are laid upon a satellite visible
image of the coast. Oil slicks and sheen are outlined in color. (Photo from Canadian Space Agency website http://www.asc-csa.gc.ca/images)
Radar satellite data is increasingly being used to monitor oil spills. As there are several satellites active, frequent coverage is now possible. During the 2010 Gulf of Mexico oil spill, there was extensive use of satellite data. Some of this is illustrated in Figures 14 to 15.
16
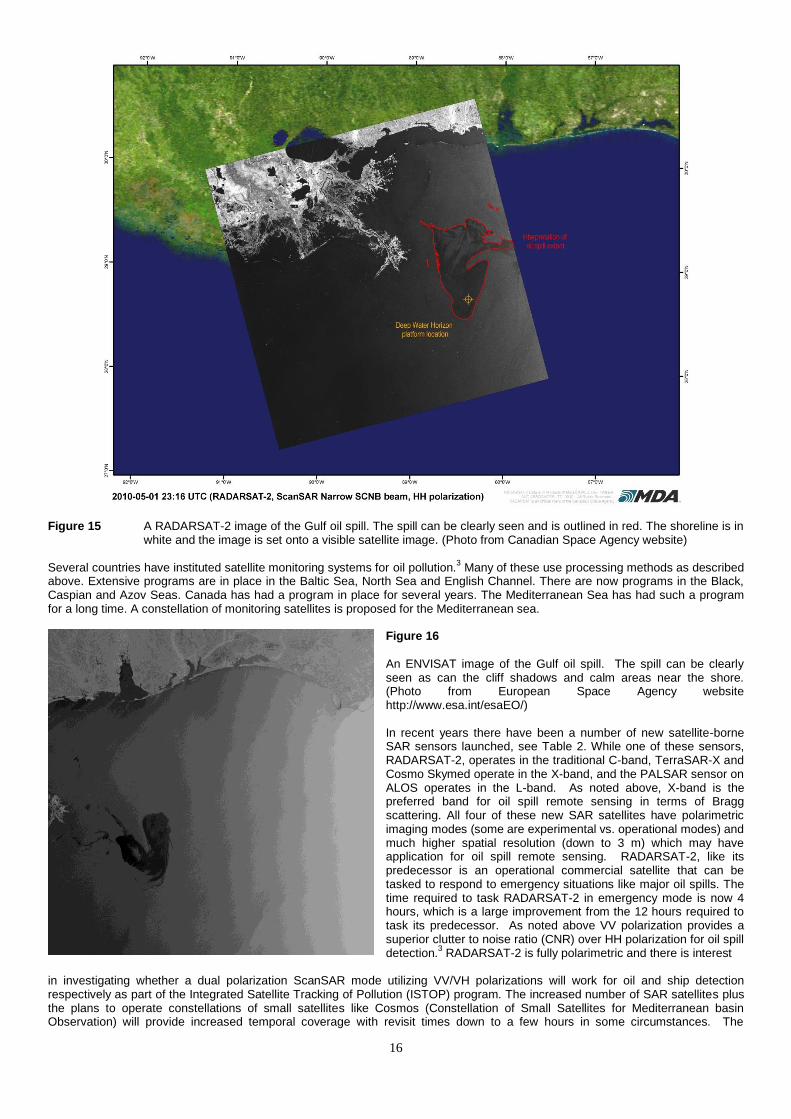
Figure 15 A RADARSAT-2 image of the Gulf oil spill. The spill can be clearly seen and is outlined in red. The shoreline is in
white and the image is set onto a visible satellite image. (Photo from Canadian Space Agency website) Several countries have instituted satellite monitoring systems for oil pollution.
3 Many of these use processing methods as described
above. Extensive programs are in place in the Baltic Sea, North Sea and English Channel. There are now programs in the Black, Caspian and Azov Seas. Canada has had a program in place for several years. The Mediterranean Sea has had such a program for a long time. A constellation of monitoring satellites is proposed for the Mediterranean sea.
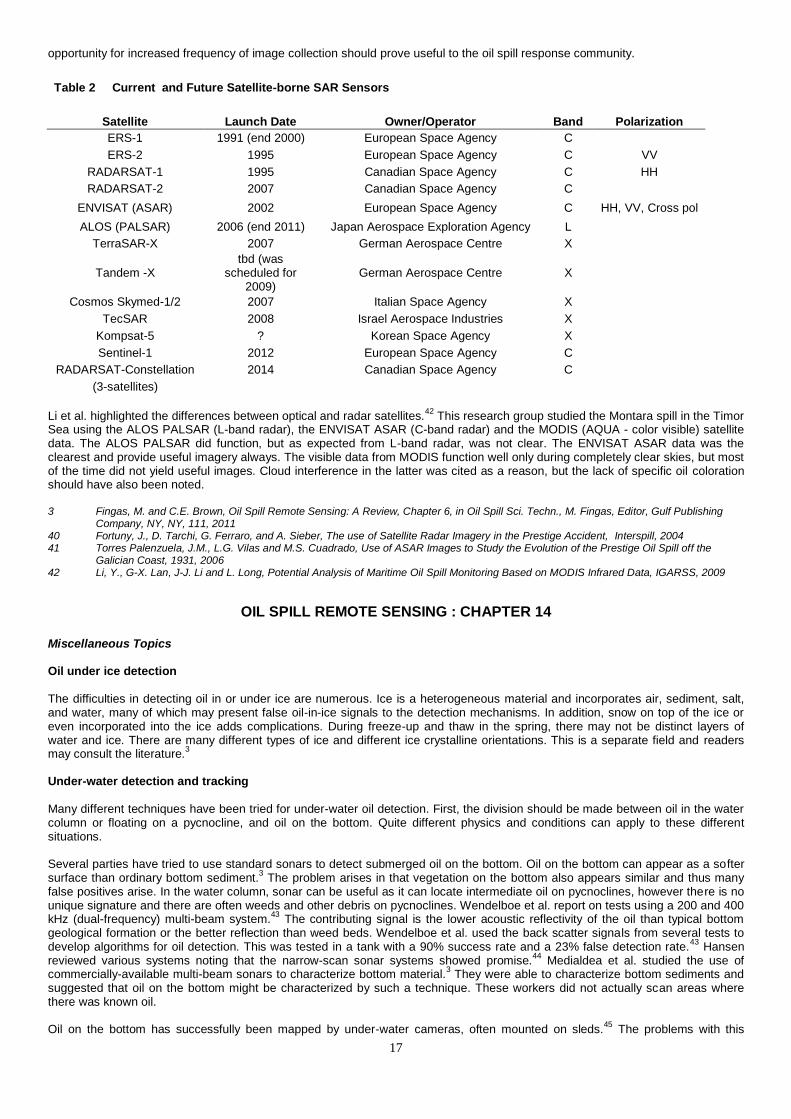
Figure 16
An ENVISAT image of the Gulf oil spill. The spill can be clearly seen as can the cliff shadows and calm areas near the shore. (Photo from European Space Agency website http://www.esa.int/esaEO/) In recent years there have been a number of new satellite-borne SAR sensors launched, see Table 2. While one of these sensors, RADARSAT-2, operates in the traditional C-band, TerraSAR-X and Cosmo Skymed operate in the X-band, and the PALSAR sensor on ALOS operates in the L-band. As noted above, X-band is the preferred band for oil spill remote sensing in terms of Bragg scattering. All four of these new SAR satellites have polarimetric imaging modes (some are experimental vs. operational modes) and much higher spatial resolution (down to 3 m) which may have application for oil spill remote sensing. RADARSAT-2, like its predecessor is an operational commercial satellite that can be tasked to respond to emergency situations like major oil spills. The time required to task RADARSAT-2 in emergency mode is now 4 hours, which is a large improvement from the 12 hours required to task its predecessor. As noted above VV polarization provides a superior clutter to noise ratio (CNR) over HH polarization for oil spill detection.
3 RADARSAT-2 is fully polarimetric and there is interest
in investigating whether a dual polarization ScanSAR mode utilizing VV/VH polarizations will work for oil and ship detection respectively as part of the Integrated Satellite Tracking of Pollution (ISTOP) program. The increased number of SAR satellites plus the plans to operate constellations of small satellites like Cosmos (Constellation of Small Satellites for Mediterranean basin Observation) will provide increased temporal coverage with revisit times down to a few hours in some circumstances. The
17
opportunity for increased frequency of image collection should prove useful to the oil spill response community.
Table 2 Current and Future Satellite-borne SAR Sensors
Satellite Launch Date Owner/Operator Band Polarization
ERS-1 1991 (end 2000) European Space Agency C
ERS-2 1995 European Space Agency C VV
RADARSAT-1 1995 Canadian Space Agency C HH
RADARSAT-2 2007 Canadian Space Agency C
ENVISAT (ASAR) 2002 European Space Agency C HH, VV, Cross pol
ALOS (PALSAR) 2006 (end 2011) Japan Aerospace Exploration Agency L
TerraSAR-X 2007 German Aerospace Centre X
Tandem -X tbd (was
scheduled for 2009)
German Aerospace Centre X
Cosmos Skymed-1/2 2007 Italian Space Agency X
TecSAR 2008 Israel Aerospace Industries X
Kompsat-5 ? Korean Space Agency X
Sentinel-1 2012 European Space Agency C
RADARSAT-Constellation 2014 Canadian Space Agency C
(3-satellites)
Li et al. highlighted the differences between optical and radar satellites.
42 This research group studied the Montara spill in the Timor
Sea using the ALOS PALSAR (L-band radar), the ENVISAT ASAR (C-band radar) and the MODIS (AQUA - color visible) satellite data. The ALOS PALSAR did function, but as expected from L-band radar, was not clear. The ENVISAT ASAR data was the clearest and provide useful imagery always. The visible data from MODIS function well only during completely clear skies, but most of the time did not yield useful images. Cloud interference in the latter was cited as a reason, but the lack of specific oil coloration should have also been noted. 3 Fingas, M. and C.E. Brown, Oil Spill Remote Sensing: A Review, Chapter 6, in Oil Spill Sci. Techn., M. Fingas, Editor, Gulf Publishing Company, NY, NY, 111, 2011 40 Fortuny, J., D. Tarchi, G. Ferraro, and A. Sieber, The use of Satellite Radar Imagery in the Prestige Accident, Interspill, 2004 41 Torres Palenzuela, J.M., L.G. Vilas and M.S. Cuadrado, Use of ASAR Images to Study the Evolution of the Prestige Oil Spill off the
Galician Coast, 1931, 2006 42 Li, Y., G-X. Lan, J-J. Li and L. Long, Potential Analysis of Maritime Oil Spill Monitoring Based on MODIS Infrared Data, IGARSS, 2009
OIL SPILL REMOTE SENSING : CHAPTER 14
Miscellaneous Topics Oil under ice detection
The difficulties in detecting oil in or under ice are numerous. Ice is a heterogeneous material and incorporates air, sediment, salt, and water, many of which may present false oil-in-ice signals to the detection mechanisms. In addition, snow on top of the ice or even incorporated into the ice adds complications. During freeze-up and thaw in the spring, there may not be distinct layers of water and ice. There are many different types of ice and different ice crystalline orientations. This is a separate field and readers may consult the literature.
3
Under-water detection and tracking
Many different techniques have been tried for under-water oil detection. First, the division should be made between oil in the water column or floating on a pycnocline, and oil on the bottom. Quite different physics and conditions can apply to these different situations. Several parties have tried to use standard sonars to detect submerged oil on the bottom. Oil on the bottom can appear as a softer surface than ordinary bottom sediment.
3 The problem arises in that vegetation on the bottom also appears similar and thus many
false positives arise. In the water column, sonar can be useful as it can locate intermediate oil on pycnoclines, however there is no unique signature and there are often weeds and other debris on pycnoclines. Wendelboe et al. report on tests using a 200 and 400 kHz (dual-frequency) multi-beam system.
43 The contributing signal is the lower acoustic reflectivity of the oil than typical bottom
geological formation or the better reflection than weed beds. Wendelboe et al. used the back scatter signals from several tests to develop algorithms for oil detection. This was tested in a tank with a 90% success rate and a 23% false detection rate.
43 Hansen
reviewed various systems noting that the narrow-scan sonar systems showed promise.44
Medialdea et al. studied the use of commercially-available multi-beam sonars to characterize bottom material.
3 They were able to characterize bottom sediments and
suggested that oil on the bottom might be characterized by such a technique. These workers did not actually scan areas where there was known oil. Oil on the bottom has successfully been mapped by under-water cameras, often mounted on sleds.
45 The problems with this

18
technique are the bottom visibility - often insufficient to discriminate, and the difficulty in towing the camera vehicle as slow as 1 knot, the necessary speed. Pfeifer et al. were successful in employing mosaics of photographs to determine the aerial extent of oil on the sea floor.
46
A low-technology approach had been historically employed. Heavy oil, having a density as would cause it to sink, often adheres to Oil snares or pom-poms, which are polypropylene strips mounted as a cheerleaders pom-pom. These can be mounted on a beam and towed over the bottom and then raised periodically to see if oil has adhered.
3 Alternatively they can be mounted on an anchor
with a marker buoy. These are then raised periodically to check if the subsurface oil has contacted them. The use of laser fluorosensors for underwater oil has been suggested.
3
Camilli et al. have successfully applied mass spectrometry to the detection of sunken heavy oil (Fuel Oil #6).47
Using the small and enclosed mass spectrometer, TETHYS, the low molecular weight hydrocarbons coming from sunken oil masses are monitored. The mass spectrometer is mounted in a submersible which is driven over the sea floor. The exact position of the submersible is monitored closely using an acoustic positioning system on the surface. Signals then can be correlated closely to the position on the seafloor. Three ion peaks of m/z 43, 41, 27, are monitored to establish hydrocarbon presence. Tests show that the ion peaks provide sensitivity as low as 0.4 ppb. This is fully sufficient to monitor sunken oil. Tests were conducted in a test tank and later over actual spills in the Gulf of Mexico. The technique was able to find concentrations of sunken oil and place the locations within 1 metre. The tests in the Gulf of Mexico were conducted at depths of 200 metres and confirmed by using cameras on the submersible.
References
3 Fingas, M. and C.E. Brown, Oil Spill Remote Sensing: A Review, Chapter 6, in Oil Spill Sci. Techn., M. Fingas, Editor, Gulf Publishing Company, NY, NY, 111, 2011 43 Wendelboe, G., L. Fonseca, M. Ericksen, F. Hvidbak and M. Mutschler, Detection of Heavy Oil on the Seabed by Application of a 400
kHz Multibeam Echo Sounder, AMOP, 791, 2009 44 Hansen, K.A., Research Efforts for Detection and Recovery of Submerged Oil, AMOP, 1055, 2010 45 Michel, J., Spills of Nonfloating Oil: Evaluation of Response Technologies, IOSC, 261, 2008 46 Pfeifer, C. E. Brzozowski, R. Markian and R. Redman, Quantifying Percent Cover of Submerged Oil Using Underwater Video Imagery,
IOSC, 269, 2008 47 Camilli, R., B. Bingham, C.M. Reddy, R.K. Nelson and A.N. Duryea, Method for Rapid Localization of Seafloor Petroleum Contamination
Using Concurrent Mass Spectrometry and Acoustic Positioning, Mar. Pollut. Bull., 1505, 2009
OIL SPILL REMOTE SENSING : CHAPTER 15
Miscellaneous Topics (continued) Small remote-controlled aircraft
Several parties have suggested remote controlled aircraft to provide more economical solutions for response personnel.
3 In fact,
remote controlled aircraft have been used by a number of parties for monitoring a variety of pollutants since the 1970's. Belgium employs a UAV of the B-Hunter class to routinely monitor its portion of the North Sea.
48 This is a large UAV which has
visible and IR camera systems aboard. The unit has a 10-hour endurance over the targets. A variety of commercial platforms are now available which can provide carriage for small sensors such as visible and IR cameras. Further, automatic navigation technology has now made these units, especially helicopters, very much easier to fly than in previous years. Real-time displays and printers
A very important aspect of remote sensing is the production of data so that operations people can quickly and directly use it. Real-time displays are important so that remote sensor operators can adjust instruments directly in flight and provide information quickly on the location or state of the spill. A major concern of the client is that data be rapidly available.
3 An additional concern is that the
data from various sensors be available in a combined or fused form. Further there is a need to correct this data for aircraft motion
and to annotate the data with time and position. At this time, existing hardware and software must be adapted as commercial off-the-shelf equipment for directly outputting and printing sensor data is not yet available. One means to overcome some of these problems is the development of entire packages for oil spill remote sensing. Robbe and Hengsterman describe the MEDUSA system which consists of an integrated system with IR, UV, SLAR, Microwave Radiometer, laser fluorosensor and navigation systems.
49
Routine surveillance One of the applications of oil spill remote sensing equipment is to detect and map slicks resulting from illegal discharges of oil from ships and offshore platforms. Historically this has always been performed using visual techniques but in the past decade has
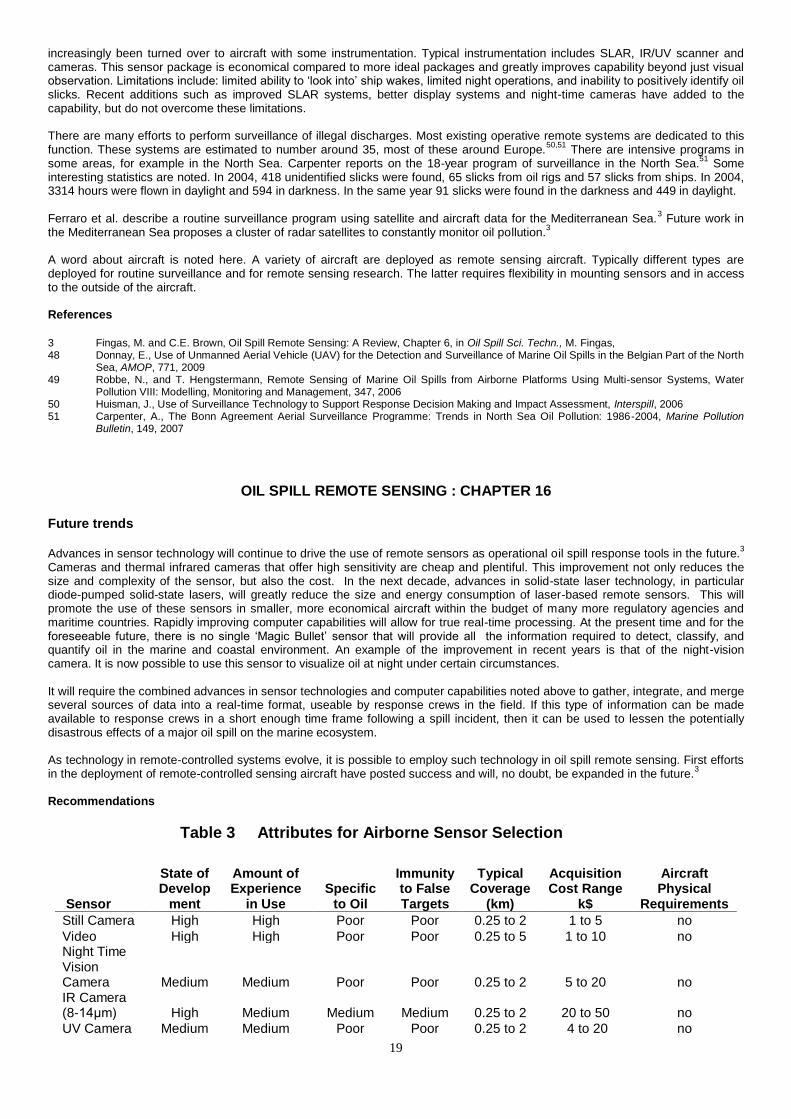
19
increasingly been turned over to aircraft with some instrumentation. Typical instrumentation includes SLAR, IR/UV scanner and cameras. This sensor package is economical compared to more ideal packages and greatly improves capability beyond just visual observation. Limitations include: limited ability to ‘look into’ ship wakes, limited night operations, and inability to posit ively identify oil slicks. Recent additions such as improved SLAR systems, better display systems and night-time cameras have added to the capability, but do not overcome these limitations. There are many efforts to perform surveillance of illegal discharges. Most existing operative remote systems are dedicated to this function. These systems are estimated to number around 35, most of these around Europe.
50,51 There are intensive programs in
some areas, for example in the North Sea. Carpenter reports on the 18-year program of surveillance in the North Sea.51
Some interesting statistics are noted. In 2004, 418 unidentified slicks were found, 65 slicks from oil rigs and 57 slicks from ships. In 2004, 3314 hours were flown in daylight and 594 in darkness. In the same year 91 slicks were found in the darkness and 449 in daylight. Ferraro et al. describe a routine surveillance program using satellite and aircraft data for the Mediterranean Sea.
3 Future work in
the Mediterranean Sea proposes a cluster of radar satellites to constantly monitor oil pollution.3
A word about aircraft is noted here. A variety of aircraft are deployed as remote sensing aircraft. Typically different types are deployed for routine surveillance and for remote sensing research. The latter requires flexibility in mounting sensors and in access to the outside of the aircraft. References
3 Fingas, M. and C.E. Brown, Oil Spill Remote Sensing: A Review, Chapter 6, in Oil Spill Sci. Techn., M. Fingas, 48 Donnay, E., Use of Unmanned Aerial Vehicle (UAV) for the Detection and Surveillance of Marine Oil Spills in the Belgian Part of the North
Sea, AMOP, 771, 2009 49 Robbe, N., and T. Hengstermann, Remote Sensing of Marine Oil Spills from Airborne Platforms Using Multi-sensor Systems, Water
Pollution VIII: Modelling, Monitoring and Management, 347, 2006 50 Huisman, J., Use of Surveillance Technology to Support Response Decision Making and Impact Assessment, Interspill, 2006 51 Carpenter, A., The Bonn Agreement Aerial Surveillance Programme: Trends in North Sea Oil Pollution: 1986-2004, Marine Pollution
Bulletin, 149, 2007
OIL SPILL REMOTE SENSING : CHAPTER 16
Future trends Advances in sensor technology will continue to drive the use of remote sensors as operational oil spill response tools in the future.
3
Cameras and thermal infrared cameras that offer high sensitivity are cheap and plentiful. This improvement not only reduces the size and complexity of the sensor, but also the cost. In the next decade, advances in solid-state laser technology, in particular diode-pumped solid-state lasers, will greatly reduce the size and energy consumption of laser-based remote sensors. This will promote the use of these sensors in smaller, more economical aircraft within the budget of many more regulatory agencies and maritime countries. Rapidly improving computer capabilities will allow for true real-time processing. At the present time and for the foreseeable future, there is no single ‘Magic Bullet’ sensor that will provide all the information required to detect, classify, and quantify oil in the marine and coastal environment. An example of the improvement in recent years is that of the night-vision camera. It is now possible to use this sensor to visualize oil at night under certain circumstances. It will require the combined advances in sensor technologies and computer capabilities noted above to gather, integrate, and merge several sources of data into a real-time format, useable by response crews in the field. If this type of information can be made available to response crews in a short enough time frame following a spill incident, then it can be used to lessen the potentially disastrous effects of a major oil spill on the marine ecosystem. As technology in remote-controlled systems evolve, it is possible to employ such technology in oil spill remote sensing. First efforts in the deployment of remote-controlled sensing aircraft have posted success and will, no doubt, be expanded in the future.
3
Recommendations
Table 3 Attributes for Airborne Sensor Selection
Sensor
State of Develop
ment
Amount of Experience
in Use Specific
to Oil
Immunity to False Targets
Typical Coverage
(km)
Acquisition Cost Range
k$
Aircraft Physical
Requirements
Still Camera High High Poor Poor 0.25 to 2 1 to 5 no
Video High High Poor Poor 0.25 to 5 1 to 10 no Night Time Vision Camera Medium Medium Poor Poor 0.25 to 2 5 to 20 no IR Camera (8-14μm) High Medium Medium Medium 0.25 to 2 20 to 50 no
UV Camera Medium Medium Poor Poor 0.25 to 2 4 to 20 no

20
Multi-spectral Scanner Medium Medium Poor Poor 0.25 to 2 100 to 200 some
Radar High High Medium Poor 5 to 50 1200 to 8000 yes-Dedicated Microwave Radiometer Medium Medium Medium Medium 1 to 5 400 to 1000 yes- Dedicated Laser Fluorosensor Medium Limited Good Good
0.01 to 0.1 300 to 1000 yes- Dedicated
Recommendations are based on the above considerations and include economy as a major factor. Tables 3 and 4 show the considerations related to the development state, cost and use of the sensor. The laser fluorosensor offers the only potential for discriminating between oiled and un-oiled weeds or shoreline, and for positively identifying oil pollution on ice, among ice and in a variety of other situations. This instrument, however, is large and expensive. A cheap sensor recommended for oil spill work is an infrared camera. This is the cheapest but undiscriminating device. This is the only piece of equipment that can be purchased off-the-shelf. All other sensors require special order and, often, development. Radar, although low in priority for purchase, offers the only potential for large area searches and foul weather remote sensing. Most other sensors are experimental or do not offer good potential for oil detection or mapping. Any sensor package should include a real-time printer and display, and a down-link. In order to respond effectively to major marine oil spills, it is recommended that one employs a combination of airborne and satellite-borne sensor systems. Improvements in the resolution of satellite-based systems, particularly SAR systems combined with the increased number of such systems and the ability to steer them to image the area of the oil spill will lead to their increased use in a tactical role. Being capable of imaging vast areas of the open ocean will ensure that satellite-borne sensors will also continue to be used in a strategic manner. There are a number of commercially available airborne sensor systems which provide near real-time information on oil slick location and indications of thicker areas of the pollution in an easily interpretable graphical manner. These airborne sensor systems are currently being employed by a large number of maritime nations in conjunction with satellite-based sensor systems. In order to respond effectively to major marine oil spills, it is recommended that one employs a combination of airborne and satellite-borne sensor systems. Improvements in the resolution of satellite-based systems, particularly SAR systems combined with the increased number of such systems and the ability to steer them to image the area of the oil spill will lead to their increased use in a tactical role. Being capable of imaging vast areas of the open ocean will ensure that satellite-borne sensors will also continue to be used in a strategic manner. There are a number of commercially available airborne sensor systems which provide near real-time information on oil slick location and indications of thicker areas of the pollution in an easily interpretable graphical manner. These airborne sensor systems are currently being employed by a large number of maritime nations in conjunction with satellite-based sensor systems.
Table 4 Sensor Suitability for Various Missions
Sensor
Support for
Cleanup
Night & Fog
Operation
Detection of
Oil with
Debris
Oiled Shoreline
Survey Spill
Mapping
Ship Discharge
Surveillance
Enforcement and
Prosecution
Still Camera 2 n/a 1 2 2 2 2 Video 2 n/a 1 2 2 2 2
Night Time Vision Camera 3 4 1 n/a 2 2 2 IR Camera (8-
14μm) 4 2 1 n/a 3 3 3 UV Camera 2 n/a n/a n/a 3 2 1
UV/IR Scanner 4 2 1 n/a 4 2 2 Multi-spectral
Scanner 1 n/a n/a 1 2 1 1 Radar n/a 4 n/a n/a 4 3 2
Microwave Radiometer 1 3 n/a n/a 2 2 1
Laser Fluorosensor 4 3 5 5 1 5 5
Key: n/a = not applicable; numerical values represent a scale from 1 = poorly suited to 5 = ideally suited
Prospective buyers should be aware of ‘new’ suppliers. Many oil spill groups have suffered from poor and inoperative equipment. Vendors offering ‘magic’ solutions are abundant. Inevitably such products do not perform as promised and often the buyers must return to the market place to start over. This scenario recurs too frequently. There are an increasing number of satellite-borne SAR and optical sensors, some of which currently or soon will operate in constellations to provide increased coverage of the earth's surface. These enhanced capabilities will allow for the possible use of these sensors in a tactical mode of operation. In spite of these increased capabilities, there remains an essential role for airborne
21
oil spill remote sensing platforms. The ability to collect and deliver real-time oil slick location information will ensure the continued use of airborne systems in spite of their high operational costs. If this type of real-time oil spill remote sensing information can be made available to response crews in a short enough time frame following a spill incident, the information can be used to mitigate the potentially disastrous effects of a major oil spill on the marine ecosystem.
References 3 Fingas, M. and C.E. Brown, Oil Spill Remote Sensing: A Review, Chapter 6, in Oil Spill Sci. Techn., M. Fingas, Editor, Gulf Publishing Company, NY, NY, 111, 2011

22