Embed Size (px)
Citation preview
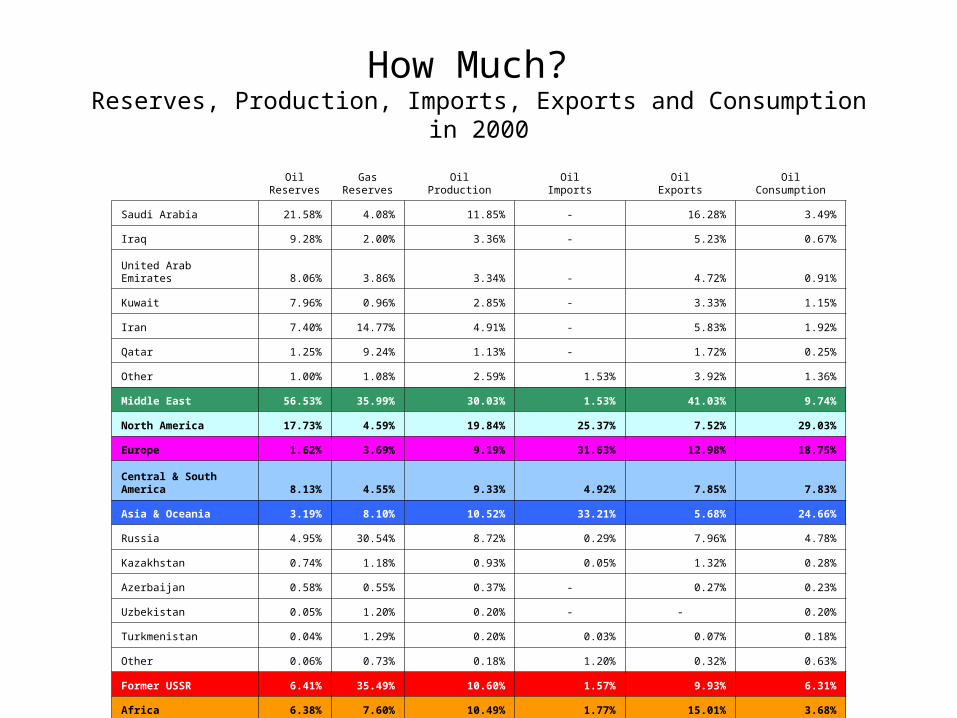
OilReserves
GasReserves
OilProduction
OilImports
OilExports
OilConsumption
Saudi Arabia 21.58% 4.08% 11.85% - 16.28% 3.49%
Iraq 9.28% 2.00% 3.36% - 5.23% 0.67%
United Arab Emirates 8.06% 3.86% 3.34% - 4.72% 0.91%
Kuwait 7.96% 0.96% 2.85% - 3.33% 1.15%
Iran 7.40% 14.77% 4.91% - 5.83% 1.92%
Qatar 1.25% 9.24% 1.13% - 1.72% 0.25%
Other 1.00% 1.08% 2.59% 1.53% 3.92% 1.36%
Middle East 56.53% 35.99% 30.03% 1.53% 41.03% 9.74%
North America 17.73% 4.59% 19.84% 25.37% 7.52% 29.03%
Europe 1.62% 3.69% 9.19% 31.63% 12.98% 18.75%
Central & South America 8.13% 4.55% 9.33% 4.92% 7.85% 7.83%
Asia & Oceania 3.19% 8.10% 10.52% 33.21% 5.68% 24.66%
Russia 4.95% 30.54% 8.72% 0.29% 7.96% 4.78%
Kazakhstan 0.74% 1.18% 0.93% 0.05% 1.32% 0.28%
Azerbaijan 0.58% 0.55% 0.37% - 0.27% 0.23%
Uzbekistan 0.05% 1.20% 0.20% - - 0.20%
Turkmenistan 0.04% 1.29% 0.20% 0.03% 0.07% 0.18%
Other 0.06% 0.73% 0.18% 1.20% 0.32% 0.63%
Former USSR 6.41% 35.49% 10.60% 1.57% 9.93% 6.31%
Africa 6.38% 7.60% 10.49% 1.77% 15.01% 3.68%
How Much? Reserves, Production, Imports, Exports and Consumption in 2000
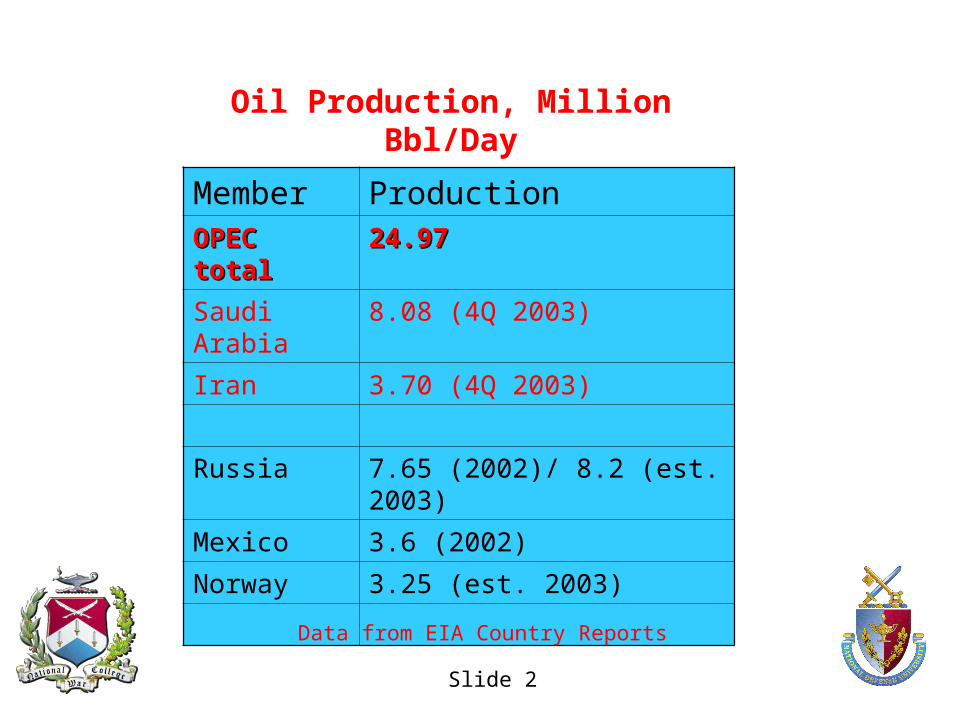
Member ProductionOPEC OPEC totaltotal
24.9724.97
Saudi Arabia
8.08 (4Q 2003)
Iran 3.70 (4Q 2003)
Russia 7.65 (2002)/ 8.2 (est. 2003)
Mexico 3.6 (2002)
Norway 3.25 (est. 2003)
Data from EIA Country Reports
Slide 2
Oil Production, Million Bbl/Day
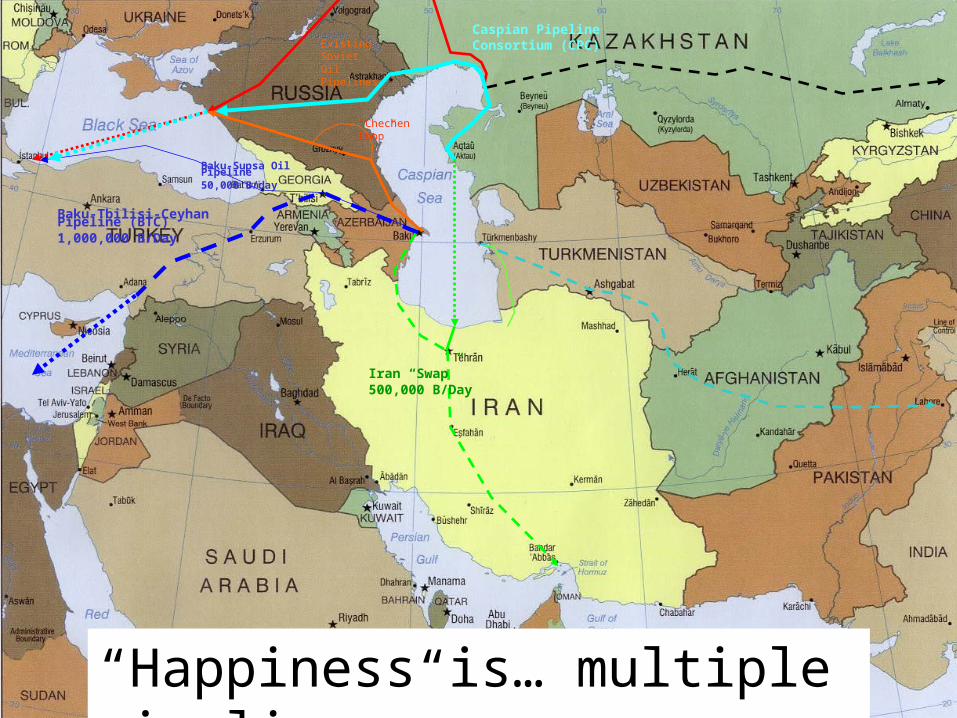
“Happiness is… multiple pipelines”
Baku-Supsa Oil Pipeline50,000 B/day
Existing Soviet Oil Pipelines
“Chechen Loop”
Baku-Tbilisi-Ceyhan Pipeline (BTC)1,000,000 B/Day
Caspian Pipeline Consortium (CPC)
Iran “Swap”500,000 B/Day
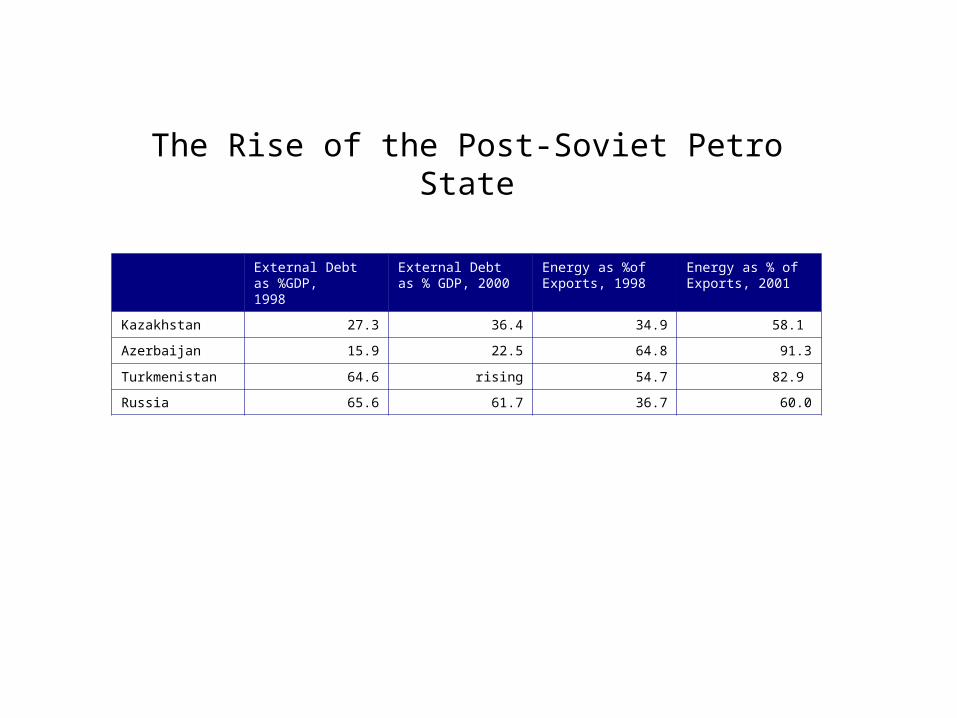
External Debt as %GDP, 1998
External Debt as % GDP, 2000
Energy as %of Exports, 1998
Energy as % of Exports, 2001
Kazakhstan 27.3 36.4 34.9 58.1
Azerbaijan 15.9 22.5 64.8 91.3
Turkmenistan 64.6 rising 54.7 82.9
Russia 65.6 61.7 36.7 60.0
The Rise of the Post-Soviet Petro State