Embed Size (px)
Citation preview

IPICEX 2008
1
Oil Palm Plantation:Meeting Demands and Challenges
Y Bhg Dato’ Dr Mohd Basri WahidDirector-General
&Dr Chan Kook Weng
Senior Research FellowMPOB
18 November 2008
Outline of presentation• Introduction:
- Crude oil price Jan 59- Jun150- Oct70 USD/b- Oil palm response to fluctuations- Food and bio-energy: A new initiative
• Aim of paper• Seven focus areas:
1. Production increase: Breeding & Biotech2. Food versus fuels3. Second generation biofuels4. Mitigating climate change5. Sustainability6. Diversification : crop and livestock inter 7. Policy needs
• Recommendations and Conclusion

IPICEX 2008
2
PALM OIL INDUSTRY
RM 86 Billion
Nutraceuticals
GM DerivedProductsRM 50 Bill
BiomassRM 20 Bill
EnergyRM 20 Bill
OleochemicalsUSD 160 Bill
FeedUSD 10 Bill
FOOD
Palm MachineryRM10 Bill
Phenolic-basedIndustry
Services
Processing
Livestock/cropintegration
• Phenolics• Tocotrienols• Lycopene• Minor components• Vaccines• Antibodies
• Functional food• Nutraceutical• Pharmaceutical• Cosmaceutical
• In-field• Harvesting machine
• Laboratory (analysis)• C-trading• Food Safety• Sustainability Certification
•Bakery•Confectionery•Snack Food•Liquid Oil•Functional Food•Programme Food
• Animal feed• Livestock• Aquaculture
• Soap• Surfactant• Fatty Acid• Fatty esters• Fatty alcohol
• High oleic acid oil• High Stearic• High Palmitoleic• High ricinoleic• Biodegradable plastic• High lycopene
• OP lumber• OP plywood• OP mdf• OP chipboard• OP composite• OP Automotive
industry
• Solid-pellets• Liquid – biodiesel
- bioethanol• Gases – BTL
- Methane• Gasification - Bioil
• Biorefinery
• Livestock• Cereal• Agriculture
Birth and Enhancement of Palm Oil and Related Industries : Macro & Micro
PU polyolα SMEDHSALubricantPG GreenInkAdhesiveCoatingsUSD500 millionHydraulic fluidCandelsPesticidesSolvents
(Source: Basri and Chan 2007a & b)
Oil Palm Industry’s Response
• New insights on how to manage with fluctuations - Keep cost well monitored- Adopt flexible mechanism adjusting forward and
spot sale percentages to meet price sale trend• Fear of another world recession:
- Price of CPO followed crude oil trend - Cost of fertilizers sky-rocketted
• Crude oil price, CPO price drop but not fertilizers:- Production cost up- Default in palm oil contract- Deferment in shipment- Built up in stock- Fear of recession kept CPO price down- Joint Malaysian and Indonesian action

IPICEX 2008
3
Source : (Tarmizi 2008)
Year RM/Ha
2003 808
2004 851
2005 874
2006 841
2007 1882
2008 (1ST Quarter) 2128
2008 (2nd Quarter) 2912
Escalated Fertilizer Cost/Hectare (N,P,K at 8kg/ha)
0
5001000
15002000
25003000
3500
2002 2004 2006 1stQtr
2008
Year
RM
/T
SOAUREAPRMOPKieseriteF1
Trend of inorganic fertilizer prices from 2002 – 2nd Qtr 2008
(Source:Khalid and Tarmizi 2008)

IPICEX 2008
4
0
5001000
1500
2000
25003000
3500
2003 2004 2005 2006 2007 1stQtr
2008
2ndOtr
2008
Year
RM
/Ha
)Trend of fertilizer costs from 2003-2nd Qtr. 2008 (RM/ha)
(Source:Khalid and Tarmizi 2008)
Action by Industry
• Strengthen existing contracts• Establish new ones• Explore new and exciting technologies• Participate in energy security sector• Commercialize B5 by February 2009• Dawn of a Food and Bio-energy Initiative

IPICEX 2008
5
Response of Private and Government Sectors
• Private sector:- Remove excessive stock- Set up biodiesel infrastructure
• Government sector:- Malaysian Cabinet Committee announced:- 5% blending policy from February 2009- All Government vehicles to use B5- RM200 Million replanting grant for 200,000ha- RM 200 Million for Biofuels infrastructure
Aim of Paper • Show guiding principles:
- Forward move to Food and Bio-energy should gointo second –generation technologies
- Explore potential barriers to trade of food and bio-energy
- Require life cycle accounting of greenhouse gas(GHG) emissions
• Meet global challenges:- Reduce food miles- Utilize wastes- Reduce GHG emissions- Meet sustainability criteria
IPICEX 2008
6
Focus Areas
• Crop breeding and biotechnology• Avoid ‘food versus fuel’ issue• R&D into second –generation technologies• Mitigate climate change with Kyoto mechanisms• Sustainability certification• Diversification into crop and livestock integration• Policy needs
Why Food and Bio-energy Together?
• Potential renewable energy (RE) untapped• Potential path to Food and Energy security• Slow down carbon emission• Displace some fossil fuel with B5• Collection and conversion set up in rural areas• Construction of bio-energy infrastructure
generate extra socio-economic activities• Fight to eradicate rural poverty • Ensure sustainable use of local resources• New rural economic activities linked to excess
energy generated stimulate rural development

IPICEX 2008
7
1.1. Crop Breeding and Biotechnology: CPO Demand
(‘000 t) 2000 2003 2007
Opening Stock 14,652 14,850 17,176
Production 114,757 125,622 154,107
Imports 35,682 44,027 58,381
Exports 35,934 44,282 57,906
Disappearance 113,432 125,841 154,834
Closing Stocks 15,724 14,376 16,924
Source : (MPOB 2008)
1.2. World Production of Oils and Fats (‘000 t)
Source : (MPOB 2008)
2000 2003 2007
Palm oil 21,867 28,259 38,246Palm kernel oil 2,698 3,347 4,397Soya bean oil 25,563 31,241 37,481Cotton seed oil 3,850 3,987 5,119Ground nut oil 4,539 4.568 4,156Sunflower seed oil 9,745 8,917 10,997Rapeseed oil 14,502 12,698 18,521Corn oil 1,966 2,017 2,337Coconut oil 3,261 3,270 3,033Olive oil 2,540 2,904 2,993Others (Castor, Sesame, Linseed )
1,907 1,892 2,094
Total Vegetable oils 92,438 98,368 129,374Total animal oils 22,319 22,645 24,733Grand total 114,757 125,622 154,107
(Source: MPOB 2008)

IPICEX 2008
8
1.3. World Major Export of Oils and Fats (‘000 t)
Source : (MPOB 2008)
2000 2003 2007
Palm oil 15,019 21,911 29,694
Palm kernel oil 1,220 1,788 2,574
Soya bean oil 6,771 9,327 11,197
Cotton seed oil 196 156 141
Ground nut oil 235 228 204
Sunflower seed oil 3,054 2,593 4,162
Rapeseed oil 1,783 997 2,162
Corn oil 768 741 707
Coconut oil 2,046 2,036 1,889
Olive oil 496 548 781
Others (Castor, Sesame, Linseed )
423 327 445
Total Vegetable oils
32,011 40,652 53,956
Total animal oils 3,923 3,630 3,950
Grand total 35,934 44,282 57,906(Source: MPOB 2008)
1.4. Major Producers of Palm Oil (‘000 t)
Source : (MPOB 2008)
2000 2003 2007
Indonesia 7,050 10,600 16,800
Malaysia 10,842 13,355 15,823
Thailand 525 690 1,020
Nigeria 740 785 835
Columbia 524 527 780
Others 2,186 2,302 2,988
Total 21,867 28,259 38,246

IPICEX 2008
9
1.5. Major Exporters of Palm Oil (‘000 t)
Source : (MPOB 2008)
2000 2003 2007
Malaysia 9,081 12,266 13,738
Indonesia 4,139 7,370 12,530
Papua New Guinea 336 327 385
Columbia 97 115 290
Cote de Ivoire 72 78 104
Others 1,294 1,755 2,647
Total 15,019 21,911 29,694
1.6. By-Products from Processing 80million t FFB
Types % to FFB Estimated Production (Million t/yr) based 80million t FFB processed
1. POME 65 52.0
2. EFB 23 18.4
3. Fibre 13 10.4
4. Shell 6 4.8
Total 85.6
Source : (Ravi Menon 2008)

IPICEX 2008
10
1.7. Calorific Value (Heat Content) of Palm Products
Source : (Ravi Menon 2008)
Product Calorific Value (KJ/Kg)
CPO 39,380
Trunk 17,471
Frond 15,751
POME 16,992
Root 15,548
Empty fruit bunches 18,795
Fibre 19055
Shell 20,093
Kernel cake 18,884
Direct planting in biomass Chipping of EFB
Applying POME to Chipped EFB windrow Applying POME to Chipped EFB windrow
IPICEX 2008
11
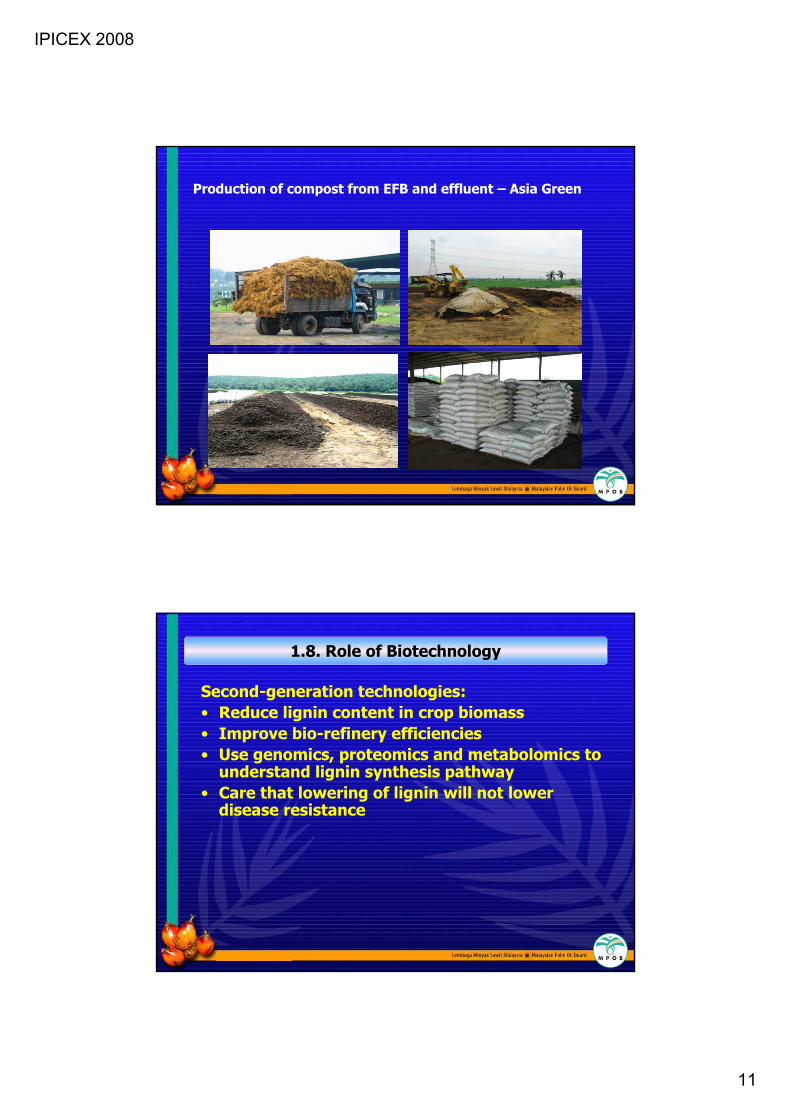
Production of compost from EFB and effluent – Asia Green
1.8. Role of Biotechnology
Second-generation technologies:• Reduce lignin content in crop biomass• Improve bio-refinery efficiencies• Use genomics, proteomics and metabolomics to
understand lignin synthesis pathway• Care that lowering of lignin will not lower
disease resistance

IPICEX 2008
12
2. Avoid ‘Food versus Fuel’ Issue
• First-generation to second-generation technologies move from palm oil to non-food biomass feedstock
• Second-generation technologies:- Thermal-chemical processes - Gasification and pyrolysis- Bio-ethanol, syngas and charr
• Balance use of biomass feedstock for mulching and bio-energy conversion
3.1. R&D Requirements on Second-generation Biofuels
• Crop productivity to accompany feedstock production
• EU biofuels demand 10% 2010, 15% 2015 and 20% 2020
• Second –generation technologies on-stream 2015
• Right balance between supporting a domestic program and an efficient export biofuels scheme

IPICEX 2008
13
3.2. R&D Requirements on Second-generation Biofuels
• Energy efficiency in mill boilers• Release balance of biomass as feedstock for
second-generation biofuels production• Trapping methane:
- Retrofitting effluent ponds with geo-membrane
- Inverted moving roof top concrete cylinderto trap methane
- Methane through use of gas turbine use excess energy to feed into national grid
Effluent pond Tank Digester
Poly ethylene membrane

IPICEX 2008
14
4. Mitigating Climate Change with Kyoto Mechanisms
• Land use change and net carbon and energy savings
• Eco-system approach for food and bio-energy production with carbon balance
• Go for high energy ratio crops as energy crops• Increase higher amount of carbon sequestered• Original forest carbon spread out over 100
years due to sustainability of growing on same land
• Post-2012 negotiation:- Posnah, 2008 and Copenhagen 2009- Afforestation, Reforestation, avoided Deforestation and REDD
Source : (Wood and Corley 1991)
Crops Energy Input (GJ/ha)
Energy output (GJ/ha)
Output/input
Oil palm 19 182 9.0
Rape seed 23 70 3.0
Soya bean 20 50 2.5
4.1 Energy Ratios of soil crops

IPICEX 2008
15
4.2. Biomass Pools and Carbon Recycling
Source : (Henson 1999)
Plant parts Net dry matter production (t/ha/yr)
Shoot biomass increment 7.05
Root biomass increment 1.23
Litter biomass increment 9.00
FFB Production (Non-oil equivalent)
24.42
Root turnover 2.27
Total 43.97
Source : (Oil World 2008)
Crops Area planted (million ha)
Average oil yield (t/ha/yr)
Production(Million t)
Oil palm 9.17 3.68 33.73
Soya bean 92.10 0.36 33.58
Rape seed 27.30 0.59 16.21
Sunflower 22.90 0.42 9.66
4.3. Area Planted and Avoided Deforestation

IPICEX 2008
16
5. Sustainability Certification: COA, CoP & RSPO• COA:
- Planted on genuine agricultural land - All growers licensed, registered and
regulated- To assure clients of production on legal
land• CoP:
- Cover entire supply chain- From nurseries, plantations, mills,
refineries, kernel crushers, and transport and storage
• RSPO:- Meet 8 principles and 39 criteria- United Plantations Bhd 1st to be awarded
Certificate of Assurance (COA)
• Smallholders form 40% of total oil palm area• RSPO comes with a cost that not all
smallholders can afford• Smallholders may not have all information
required for certification

IPICEX 2008
17
6. Diversification of crop and livestock Integration• Intercropping and integration:
- Raise land productivity without going for new land
- Double avenue planting allow succesful intercropping
- Cattle integrated to increase meet production
• Success factors for cattle integration:- Selection of suitable breeds- Well coordinated management cycles- Harmonized estate operations to keep
livestock from sprayed fields- Stocking rate dependent of grass
availability
7. Policy Needs to Deliver Benefits
• Enhanced food and bio-energy production:- Select high energy ratio crops- Second-generation technologies- Focus on non-food biomass as feedstock- Small holders to grow and collect biomass
to centralized processing plants- Use oil palm as energy dedicated crop- Palm biomass-based as significant source
of jobs in rural areas- Remove barriers to trade

IPICEX 2008
18
Conclusions• Nurture food and bio-energy production to be
on way to food and energy security
• A complementary set of investment into large scale cellulosic conversion technologies
• There must be crop productivity improvement to accompany aggressive biofuels production
• Fulfillment of Small Renewable Energy Programme (SREP) for lower GHG emission
• Ensure steady supply of sustainable palm oil and bio-energy cost-effectively
Thank You Thank You
Website: www.mpob.gov.my Website: www.mpob.gov.my