Embed Size (px)
Citation preview
UNITED STATES SECURITIES AND EXCHANGE COMMISSIONWashington, D.C. 20549
FORM 10-K
�� ANNUAL REPORT PURSUANT TO SECTION 13 OR 15(d)
OF THE SECURITIES EXCHANGE ACT OF 1934
For the fiscal year ended July 31, 2009
OR
�� TRANSITION REPORT PURSUANT TO SECTION 13 OR 15 (d)
OF THE SECURITIES EXCHANGE ACT OF 1934
For the Transition Period from _____ to _____
___________________________
Commission File Number 001-12622
OIL-DRI CORPORATION OF AMERICA
Delaware 36-2048898(State or other jurisdiction of (I.R.S. Employer Identification No.)
incorporation or organization)
410 North Michigan Avenue, Suite 400, Chicago, Illinois 60611-4213
(312) 321-1515
Securities registered pursuant to Section 12(b) of the Act:
Title of Each Class Name of Each Exchange on Which Registered
Common Stock, par value $0.10 per share New York Stock Exchange
Securities registered pursuant to Section 12(g) of the Act:
None
Indicate by check mark if the registrant is a well-known seasoned issuer, as defined in Rule 405 of the Securities Act:
Yes� No�
Indicate by check mark if the registrant is not required to file reports pursuant to Section 13 or Section 15(d) of the Act:
Yes� No�
Indicate by check mark whether the registrant (1) has filed all reports required to be filed by Section 13 or 15(d) of the
Securities Exchange Act of 1934 during the preceding 12 months (or for such shorter period that the registrant was
required to file such reports), and (2) has been subject to such filing requirements for the past 90 days:
Yes� No �
2
Indicate by check mark whether the registrant has submitted electronically and posted on its corporate Web site, if
any, every Interactive Data File required to be submitted and posted pursuant to Rule 405 of Regulation S-T during
the preceding 12 months (or for such shorter period that the registrant was required to submit and post such files).
Yes� No�
Indicate by check mark if disclosure of delinquent filers pursuant to Item 405 of Regulation S-K is not containedherein, and will not be contained, to the best of the registrant’s knowledge, in definitive proxy or information
statements incorporated by reference in Part III of this Form 10-K or any amendment to this Form 10-K.�
Indicate by check mark whether the registrant is a large accelerated filer, an accelerated filer, a non-accelerated filer, or
a smaller reporting company. See the definitions of “large accelerated filer,” “accelerated filer” and “smaller reporting
company” in Rule 12b-2 of the Exchange Act:
Large accelerated filer � Accelerated filer �
Non-accelerated filer � Smaller reporting company �
(Do not check if a smaller reporting company)
Indicate by check mark whether the registrant is a shell company (as defined in Rule 12b-2 of the Exchange Act):
Yes� No�
The aggregate market value of Oil-Dri’s Common Stock owned by non-affiliates as of January 31, 2009 for accelerated
filer purposes was $81,210,000.
The aggregate market value of Oil-Dri’s Common Stock owned by non-affiliates as of September 30, 2009 was
$74,483,571.
Number of shares of each class of Oil-Dri’s capital stock outstanding as of September 30, 2009:
Common Stock – 5,197,525 shares
Class B Stock – 1,915,460 sharesClass A Common Stock – 0 shares
DOCUMENTS INCORPORATED BY REFERENCE
The following documents are incorporated by reference: Oil-Dri’s Proxy Statement for its 2009 Annual Meeting of
Stockholders (“Proxy Statement”), which will be filed with the Securities and Exchange Commission (“SEC”) not later
than November 28, 2009 (120 days after the end of Oil-Dri’s fiscal year ended July 31, 2009), is incorporated into Part
III of this Annual Report on Form 10-K, as indicated herein.
3
CONTENTS
Item Page
PART I
1. Business ................................................................................................................................... 5 – 11
1A. Risk Factors ............................................................................................................................. 12 – 18
1B. Unresolved Staff Comments ................................................................................................... 19
2. Properties ................................................................................................................................. 19 – 21
3. Legal Proceedings ................................................................................................................... 22
4. Submission of Matters to a Vote of Security Holders............................................................ 22
PART II
5. Market for Registrant’s Common Equity, Related Stockholder Matters
and Issuer Purchases of Equity Securities .............................................................................. 23 – 24
6. Selected Financial Data........................................................................................................... 25 – 26
7. Management Discussion and Analysis of Financial
Condition and the Results of Operations ................................................................................ 26 – 38
7A. Quantitative and Qualitative Disclosures About Market Risk ............................................... 39 - 40
8. Financial Statements and Supplementary Data ...................................................................... 41 – 68
Management’s Report on Internal Control Over Financial Reporting .................................. 69
Report of Independent Registered Public Accounting Firm .................................................. 70
9. Changes in and Disagreements with Accountants
on Accounting and Financial Disclosure................................................................................ 71
9A. Controls and Procedures.......................................................................................................... 71
9B. Other Information.................................................................................................................... 71
PART III
10. Directors, Executive Officers and Corporate Governance..................................................... 72
11. Executive Compensation......................................................................................................... 72
12. Security Ownership of Certain Beneficial Owners and Management andRelated Stockholder Matters ................................................................................................... 72
13. Certain Relationships and Related Transactions and Director Independence ....................... 72
14. Principal Accountants Fees and Services ............................................................................... 72
4
CONTENTS (CONTINUED)
Item Page
PART IV
15. Exhibits and Financial Statement Schedules ......................................................................................... 73 – 76
Signatures ............................................................................................................................................... 77 – 78
Schedule II – Valuation and Qualifying Accounts................................................................................ 79
Exhibit Index .......................................................................................................................................... 80
FORWARD-LOOKING STATEMENTS
Certain statements in this report, including, but not limited to, those under the heading “Management’s
Discussion and Analysis of Financial Condition and Results of Operations” and those statements elsewhere in this
report and other documents we file with the SEC contain forward-looking statements that are based on current
expectations, estimates, forecasts and projections about our future performance, our business, our beliefs and ourmanagement’s assumptions. In addition, we, or others on our behalf, may make forward-looking statements in press
releases or written statements, or in our communications and discussions with investors and analysts in the normal
course of business through meetings, webcasts, phone calls and conference calls. Words such as “expect,” “outlook,”
“forecast,” “would,” “could,” “should,” “project,” “intend,” “plan,” “continue,” “believe,” “seek,” “estimate,”
“anticipate,” “believe,” “may,” “assume,” variations of such words and similar expressions are intended to identify
such forward-looking statements, which are made pursuant to the safe harbor provisions of the Private Securities
Litigation Reform Act of 1995.
Such statements are subject to certain risks, uncertainties and assumptions that could cause actual results to
differ materially including, but not limited to, those described in Item 1A “Risk Factors” below and other reports filed
with the SEC. Should one or more of these or other risks or uncertainties materialize, or should underlyingassumptions prove incorrect, actual results may vary materially from those anticipated, intended, expected, believed,
estimated, projected or planned. You are cautioned not to place undue reliance on these forward-looking statements,
which speak only as of the date hereof. Except to the extent required by law, we do not have any intention or
obligation to update publicly any forward-looking statements after the distribution of this report, whether as a result of
new information, future events, changes in assumptions or otherwise.
TRADEMARK NOTICE
Agsorb, Calibrin, Cat’s Pride, ConditionAde, Flo-Fre, Jonny Cat, KatKit, Oil-Dri, Pel-Unite, Perform, Poultry
Guard, Pro Mound, Pure-Flo, Rapid Dry, Select, Terra-Green, and Ultra-Clear are all registered trademarks of Oil-Dri
Corporation of America or of its subsidiaries. Pro’s Choice, Saular and Verge are trademarks of Oil-Dri Corporation of
America. Fresh Step is a registered trademark of The Clorox Company.
5
PART I
ITEM 1 – BUSINESS
In 1969, Oil-Dri Corporation of America was incorporated in Delaware as the successor to an Illinoiscorporation incorporated in 1946; the Illinois corporation was the successor to a partnership that commenced business
in 1941. Except as otherwise indicated herein or as the context otherwise requires, references to “Oil-Dri,” the
“Company,” “we,” “us” or “our” refer to Oil-Dri Corporation of America and its subsidiaries.
GENERAL BUSINESSDEVELOPMENTS
We continued to focus on our corporate strategy which helped us contend with the challenges of the global
economic crisis that began during our fiscal year ended July 31, 2009. Our guiding principle to create value from
sorbent minerals resulted in the introduction of a new natural cat litter in our Retail and Wholesale Products Group
and a new mycotoxin binder for animal health in our Business to Business Products Group. Our strong balance
sheet provided the resources necessary to make required debt payments, pay dividends, increase capital expendituresand support the launch of new products during the year. Our gross margin improved from fiscal 2008, although we
did not return to our past historical levels. Our overall net selling prices increased due to strategic pricing and the
mix of products sold. Freight costs were slightly lower in fiscal 2009 due to a decline in the cost of diesel fuel used
to transport our products; however, the costs of natural gas and recycled fuel oil used to dry our clay and resin
material used in our packaging were higher than in fiscal 2008. The global effect of the economic downturn impacted
demand for products in both our domestic and foreign markets and resulted in a decrease in total tons sold during fiscal
2009. For more information on recent business developments, see Item 7 “Management’s Discussion and Analysis of
Financial Condition and Results of Operations” below.
PRINCIPALPRODUCTS
We are a leader in developing, manufacturing and marketing sorbent products. Our sorbent products are
principally produced from clay minerals and, to a lesser extent, other sorbent materials. Our sorbent technologies
include absorbent and adsorbent products. Absorbents, like sponges, draw liquids up into their many pores. Examples
of our absorbent clay products are Cat’s Pride and Jonny Cat premium cat litter and other cat litters. We also produce
Oil-Dri branded floor absorbents, Agsorb granular agricultural chemical carriers and ConditionAde and Calibrin animal
feed binders. Adsorbent products attract liquids, impurities, metals and surfactants to themselves and form low-level
chemical bonds. Examples of our adsorbent products are Oil-Dri synthetic sorbents, which are used for industrial
cleanup, and Pure-Flo, Perform and Select bleaching clay products, which act as a filtration media for edible oils, fats
and tallows. Also, our Ultra-Clear product serves as a clarification aid for petroleum-based oils and by-products. Both
our absorbent and adsorbent products are described in more detail below.
Cat Litter Products
We produce two types of cat litter products, traditional coarse and scoopable. Coarse litters have absorbent
and odor controlling characteristics. Scoopable litters have the additional characteristic of clumping when exposed to
moisture, allowing the consumer to selectively dispose of the used portion of the litter. Our coarse and scoopable
products are sold under our Cat’s Pride and Jonny Cat brand names. We also package and market Cat’s Pride Kat Kit
and Jonny Cat cat litter in a disposable tray, as well as Jonny Cat litter pan liners. We manufacture the Fresh Step
brand of coarse cat litter for The Clorox Company and other private label cat litters for other customers. These other
private label products are sold through independent food brokers and our sales force to major retail outlets.
We have two long-term supply arrangements (only one of which is material) under which we manufacturebranded traditional litters for other marketers. Under these co-manufacturing relationships, the marketer controls all
aspects of sales, marketing, and distribution, as well as the odor control formula, and we are responsible for
manufacturing. Our material agreement is with Clorox, under which we have the exclusive right to supply Clorox’s
requirements for Fresh Step coarse cat litter up to certain levels.
6
Industrial and Automotive Sorbent Products
We manufacture products from both clay and synthetic materials that absorb oil, grease, water and other types
of spills. These products are used in industrial, home and automotive environments. Our clay-based sorbent products,
such as Oil-Dri branded floor absorbent, are used for floor maintenance in industrial applications to provide a non-slip
and nonflammable surface for workers. These floor absorbents are used in automotive repair facilities and cardealerships to absorb oil and grease. They are also used in home applications in garages and driveways. Our Oil-Dri
branded synthetic-based products use polypropylene materials. These products are sold in various forms, such as pads,
rolls, socks and spill kits. These products are used to absorb oil, grease, water and most chemical spills.
Industrial and automotive sorbent products are sold through a distribution network that includes industrial,
auto parts, safety, sanitary supply, chemical and paper distributors. These products are also sold through environmental
service companies, mass merchandisers and catalogs.
Bleaching Clay and Clarification Aid Products
We produce an array of bleaching, purification and filtration applications used by edible oil and jet fuel
processors around the world. Bleaching clays are used by edible oil processors to adsorb soluble contaminants thatcreate oxidation problems. Our Pure-Flo and Perform bleaching clays remove impurities, such as trace metals,
chlorophyll and color bodies, in various types of edible oils. Perform products provide increased activity for
hard-to-bleach oils. Our Select adsorbents are used to remove contaminants in vegetable oil processing and can be
used to prepare oil prior to the creation of biodiesel fuel. Our Ultra-Clear clarification aid is used as a filtration and
purification medium for jet fuel and other petroleum-based products.
These products are marketed in the United States and in international markets. The products are supported by
our team of technical sales employees as well as by agent representatives and the services of our research and
development group.
Agricultural and Horticultural Products
We produce a wide range of granular and powdered mineral absorbent products that are used as carriers for
crop protection chemicals, agricultural drying agents, bulk processing aids, growing media components and sports field
products. Our brands include: Agsorb, an agricultural chemical carrier and a drying agent; Flo-Fre, a highly absorbent
microgranule flowability aid; Terra-Green, a growing media supplement; and Pro’s Choice, a sports field conditioner.
Agsorb carriers are used as an alternative to agricultural sprays. The clay granules absorb crop protection
chemicals and are then delivered directly into the ground resulting in a more precise application than chemical sprays.
Agsorb drying agent is blended into fertilizer-pesticide blends applied by farmers to absorb moisture and improve
flowability. Agsorb also acts as a flowability aid for fertilizers and chemicals used in the lawn and garden market. Flo-
Fre microgranules are used by grain processors and other large handlers of bulk products to soak up excess moisture
preventing caking. We employ technical sales people to market agricultural products in the United States.
Pro’s Choice sports field products are used on baseball, football and soccer fields and on golf courses. Pro’s
Choice soil conditioners are used in field construction or as top dressing to absorb moisture, suppress dust and improve
field performance. These products are used to amend sand-based golf green construction, as well as other areas such as
tees and fairways, to help retain moisture and nutrients for better grass growth. Pro Mound packing clay is used to
construct pitcher’s mounds and batter’s boxes. Rapid Dry drying agent is used to dry up puddles and slick spots after
rain. Sports field products are used at all levels of play, including professional, college and high school and on
municipal fields. These products are sold through a network of distributors specializing in sports turf products.
Animal Health and Nutrition Products
We produce several products used in the livestock feed industry. ConditionAde and Calibrin branded
products are used in animal feed to absorb naturally-occurring mycotoxins in the feed and thereby improve animal
health and productivity. Pel-Unite and Pel-Unite Plus are specialized animal feed binders used in the manufacture of
pelleted feeds. These products are sold through a network of feed products distributors in the United States and
primarily through exclusive distribution agreements with animal health and nutrition products distributors in Latin
America, Africa and Asia.
7
BUSINESS SEGMENTS
We have two reportable operating segments for financial reporting derived from the different characteristics
of our two major customer groups: Retail and Wholesale Products Group and Business to Business Products Group.
The Retail and Wholesale Products Group customers include mass merchandisers, wholesale clubs, drugstore
chains, pet specialty retail outlets, dollar stores, retail grocery stores, distributors of industrial cleanup and automotive
products and environmental service companies. The Business to Business Products Group customers include
processors and refiners of edible oils, petroleum-based oils and biodiesel fuel, manufacturers of animal feed and
agricultural chemicals, marketers of consumer products and sports turf users. Certain financial information on both
segments is contained in Note 3 of the Notes to the Consolidated Financial Statements and is incorporated herein by
reference.
We do not manage our business, allocate resources or generate revenue data by product line. Any of our
products may be sold in one or both of our operating segments. Information concerning total revenue of classes of
similar products accounting for more than 10% of consolidated revenues in any of the last three fiscal years is notseparately provided because it would be impracticable to do so.
FOREIGNOPERATIONS
Our wholly-owned subsidiary, Favorite Products Company, Ltd., is a manufacturer and marketer of branded
and private label cat litter in the Canadian market place. Among its leading brands are Saular, Cat’s Pride and Jonny
Cat. Our Canadian business also sells clay industrial granule floor absorbents, synthetic polypropylene sorbent
materials and agricultural chemical carriers.
Our wholly-owned subsidiary, Oil-Dri (U.K.) Limited, is a manufacturer and marketer of industrial granule
floor absorbents and cat litter. These products are marketed in the United Kingdom and Western Europe. Oil-Dri(U.K.) also sells synthetic polypropylene sorbent materials, filtration units and plastic containment products.
Our wholly-owned subsidiary, Oil-Dri SARL, is a Swiss company that performs various management,
customer service and administrative functions for our domestic operations.
Our foreign operations are subject to the normal risks of doing business overseas, such as currency
devaluations and fluctuations, restrictions on the transfer of funds and import/export duties. We were not materially
impacted by these foreign currency fluctuations in any of our last three fiscal years. Certain financial information about
our foreign and domestic operations is contained in Note 3 of the Notes to the Consolidated Financial Statements and is
incorporated herein by reference.
CUSTOMERS
Sales to Wal-Mart Stores, Inc. and its affiliates accounted for approximately 26%, 25% and 23% of our total
net sales for the fiscal years ended July 31, 2009, 2008 and 2007, respectively. Wal-Mart is a customer in our Retail
and Wholesale Products Group segment. In the fiscal year ending July 31, 2010, we expect a material decrease in net
sales to Wal-Mart as a result of its decision to reduce distribution of our branded cat litter products in certain markets (a
decision discussed in Item 7 “Management’s Discussion and Analysis of Financial Condition and Results of
Operations” below); however, we expect that net sales to Wal-Mart will continue to account for greater than 10% of
our total net sales. There are no customers in the Business to Business Products Group with sales equal to or greater
than 10% of our total sales; however, sales to The Clorox Company (a customer in our Business to Business Products
Group) and its affiliates accounted for approximately 8% of our total net sales for each of the fiscal years ended July
31, 2009, 2008 and 2007. The degree of margin contribution of our significant customers in the Business to BusinessProducts Group varies, with certain customers having a greater effect on our operating results. The loss of any
customer other than those described in this paragraph would not be expected to have a material adverse effect on our
business.
8
COMPETITION
Price, service, marketing, technical support, product quality and delivery are the principal methods of
competition in our markets and competition has historically been very vigorous. Some of our competitors are large
companies whose financial resources are substantially greater than ours.
In our Retail and Wholesale Products Group, we have five principal competitors, including some who are also
customers of ours. Cat litter market growth has been modest in recent years. Scoopable products have a majority of
the market share followed by traditional coarse products. Our new products have contributed to our increased
scoopable litter sales and we have increased our coarse litter sales through our private label products. The
overwhelming majority of all cat litter is mineral based; however, alternative litters based on alternative strata such as
paper, various agricultural waste products and silica gels have earned a niche position. The consumer trend away from
regional grocery stores towards large national retailers has presented competitive challenges as well as opportunities.
These stores enjoy substantial negotiating leverage over their suppliers, including us; however, our operations support
nation-wide distribution, which gives us a potential advantage over smaller and regional manufacturers in selling to
these stores.
In the Business to Business Products Group, we have 11 principal competitors. The agricultural chemicalcarrier portion of this segment has experienced competition from new technologies in the agricultural and home and
garden markets. The bleaching clay and fluids clarification aid portion of this Group operates in a highly cost
competitive global marketplace. Product performance is also a primary competitive factor for these products. The
animal health portion of this Group also operates in a global marketplace with price and performance competition from
multi-national and local competitors.
PATENTS
We have obtained or applied for patents for certain of our processes and products sold to customers in both the
Retail and Wholesale Products Group and the Business to Business Products Group. These patents expire at various
times, beginning in April 2011. We expect no material impact on our business from the expiration of patents in thenext year.
BACKLOG; SEASONALITY
At July 31, 2009, 2008 and 2007, our backlog of orders was approximately $6,015,000, $7,139,000, and
$3,984,000, respectively. The value of backlog orders is determined by the number of tons on backlog order and the
net selling prices. Net selling prices have increased each year. The increased value of backlog orders at July 31, 2008
also reflected a significant increase in the number of tons on backlog order. The weaker U.S. dollar relative to many
foreign currencies during 2008 made domestically manufactured products more attractive in many foreign markets.
The increased volume of exported goods throughout the economy created difficulties securing foreign freight carriers,
so we urged our international customers to place orders farther in advance to provide additional time to arrange
transportation. These advance orders resulted in a higher number of tons on back log order at July 31, 2008. Allbacklog orders are expected to be filled within the next 12 months. We consider our business, taken as a whole, to be
only moderately seasonal; however, business activities of certain customers (such as agricultural chemical
manufacturers) are subject to such seasonal factors as crop acreage planted and product formulation cycles.
EFFECTS OF INFLATION
Inflation generally affects us by increasing the cost of employee wages and benefits, transportation,
processing equipment, purchased raw materials and packaging, energy and borrowings under our credit facility. See
Item 7 “Management Discussion and Analysis of Financial Condition and the Results of Operations” and Item 7A
“Quantitative and Qualitative Disclosures About Market Risk” below.
9
RESERVES
We mine sorbent materials, which we generally refer to as “clay”, on leased or owned land near our
manufacturing facilities in Mississippi, Georgia, Illinois and California; we also have reserves in Nevada, Oregon and
Tennessee. We estimate that our proven reserves of these sorbent materials are approximately 154,388,000 tons in
aggregate and our probable reserves are approximately 129,364,000 tons in aggregate. Based on our rate ofconsumption during the 2009 fiscal year, and without regard to any of our reserves in Nevada, Oregon and Tennessee,
we consider our proven reserves adequate to supply our needs for over 40 years. Although we consider these reserves
to be extremely valuable to our business, only a small portion of the reserves, those which were acquired in
acquisitions, are reflected at cost on our balance sheet.
It is our policy to attempt to add to reserves in most years, but not necessarily in every year, an amount at least
equal to the amount of reserves consumed in that year. We have a program of exploration for additional reserves and,
although reserves have been acquired, we cannot assure that additional reserves will continue to become available. Our
use of these reserves, and our ability to explore for additional reserves, are subject to compliance with existing and
future federal and state statutes and regulations regarding mining and environmental compliance. During the fiscal
year ended July 31, 2009 we utilized these reserves to produce substantially all of the sorbent minerals that we sold.
Proven reserves are those reserves for which (a) quantity is computed from dimensions revealed in outcrops,
trenches, workings or drill holes; grade and/or quality are computed from results of detailed sampling, and (b) the sites
for inspection, sampling and measurement are spaced so closely and the geologic character is so well defined that size,
shape, depth and mineral content of reserves are well established. Probable reserves are computed from information
similar to that used for proven reserves, but the sites for inspection, sampling, and measurement are farther apart or are
otherwise less adequately spaced. The degree of assurance, although lower than that for proven reserves, is high
enough to assume continuity between points of observation. We employ geologists and mineral specialists who
estimate and evaluate existing and potential reserves in terms of quality, quantity and availability.
MINING OPERATIONS
We have conducted mining operations in Ripley, Mississippi since 1963, in Ochlocknee, Georgia since 1968,
in Blue Mountain, Mississippi since 1989, in Mounds, Illinois since 1998 and in Taft, California since 2002. Our raw
materials are surface mined on a year-round basis, generally using large earth moving scrapers, bulldozers,
excavators or off-road trucks to remove overburden, and then loaded into dump trucks with backhoe or front end
loader for movement to the processing facilities. The mining and hauling of our clay is performed by us and by
independent contractors. Our current operating mines range in distance from immediately adjacent to approximately
13 miles from the related processing plants. Processing facilities are generally accessed from the mining areas by
private road, and in some instances by public highways. Each of our processing facilities maintains inventories of
unprocessed clay of approximately one week of production requirements. See Item 2 “Properties” below for
additional information regarding our mining properties and operations.
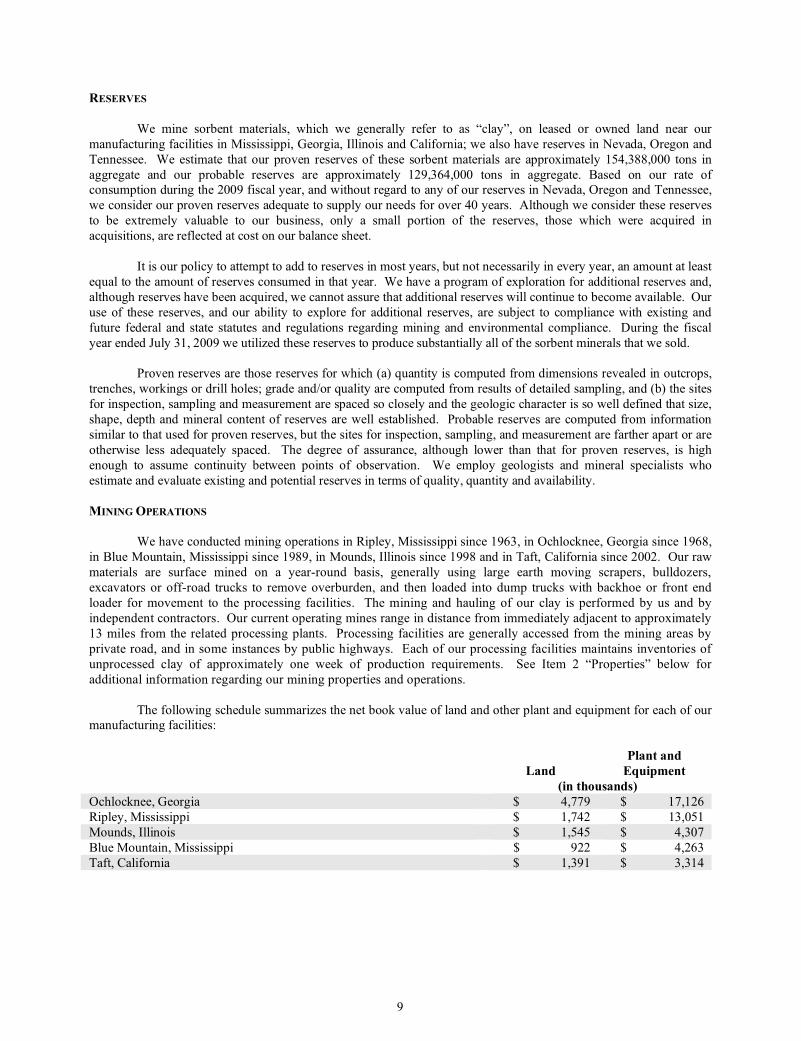
The following schedule summarizes the net book value of land and other plant and equipment for each of ourmanufacturing facilities:
Plant and
Land Equipment
(in thousands)
Ochlocknee, Georgia $ 4,779 $ 17,126
Ripley, Mississippi $ 1,742 $ 13,051
Mounds, Illinois $ 1,545 $ 4,307
Blue Mountain, Mississippi $ 922 $ 4,263
Taft, California $ 1,391 $ 3,314
10
EMPLOYEES
As of July 31, 2009 we employed 806 persons, 61 of whom were employed by our foreign subsidiaries. Our
corporate offices, research and development center and manufacturing facilities are adequately staffed and no material
labor shortages are anticipated. Approximately 43 of our employees in the U.S. and approximately 28 of ouremployees in Canada are represented by labor unions, with whom we have entered into separate collective bargaining
agreements. We consider our employee relations to be satisfactory.
ENVIRONMENTALCOMPLIANCE
Our mining and manufacturing operations and facilities in Georgia, Mississippi, California and Illinois are
required to comply with state surface mining statutes and various other federal, state and local statutes, regulations and
ordinances which govern the discharge of materials, water and waste into the environment and restrict mining on
wetlands or otherwise regulate our operations. In recent years, environmental regulation has grown increasingly
stringent, a trend that we expect will continue. We endeavor to be in compliance in all material respects at all times
with all applicable environmental controls and regulations. As a result, expenditures relating to environmental
compliance have increased over the years; however, these expenditures have not been material. As part of our ongoingenvironmental compliance activities, we incur expenses in connection with reclaiming exhausted mining sites.
Historically, reclamation expenses have not had a material effect on our cost of goods sold.
In addition to the environmental requirements relating to mining and manufacturing operations and facilities,
there is increasing federal and state regulation with respect to the content, labeling, use, and disposal after use, of
various products we sell. We endeavor to be in compliance in all material respects at all times with that regulation and
to assist our customers in that compliance.
We cannot assure that, despite all commercially reasonable efforts, we will always be in compliance in all
material respects with all applicable environmental regulation or with requirements regarding the content, labeling, use,
and disposal after use, of our products; nor can we assure that from time to time enforcement of such requirements willnot have a material adverse effect on our business. See Item 1A “Risk Factors” below for a discussion of these and
other risks to our business.
ENERGY
We use natural gas, recycled fuel oil and coal as permitted for energy sources in the processing of our clay
products. Consistent with prior years, we have switched among the various energy sources during certain months due
to seasonal availability and cost. See Item 7A “Quantitative and Qualitative Disclosures About Market Risk” below
with respect to our use of forward contracts.
RESEARCH ANDDEVELOPMENT
At our research and development facility in Vernon Hills, Illinois, we develop new products and applications
and improve existing products. The facility’s staff (and various consultants they engage from time to time) consists of
geologists, mineralogists and chemists. In the past several years, our research efforts have resulted in a number of new
sorbent products and processes. The facility produces prototype samples and tests new products for customer trial and
evaluation.
We spent approximately $2,099,000, $2,497,000, and $2,154,000 during the fiscal years ended July 31, 2009,
2008 and 2007, respectively, for research and development. None of this research and development was customer
sponsored, and all research and development costs are expensed in the period in which incurred. See Note 1 of the
Notes to the Consolidated Financial Statements.
11
AVAILABLE INFORMATION
We file annual, quarterly and current reports, proxy statements and other documents with the SEC under
the Securities Exchange Act of 1934, as amended. The public may read and copy any materials filed with the SEC
at the SEC’s Public Reference Room at 100 F Street, N.E., Washington, D.C. 20549. The public may obtain
information on the operation of the Public Reference Room by calling the SEC at 1-800-SEC-0330. Also, the SECmaintains an Internet website that contains reports, proxy and information statements, and other information
regarding issuers that file electronically with the SEC. The public can obtain any documents that are filed by the
Company at http://www.sec.gov.
In addition, this Annual Report on Form 10-K, as well as our quarterly reports on Form 10-Q, current
reports on Form 8-K and any amendments to all of the foregoing reports, are made available free of charge on or
through the “Investor Information” section of our website (www.oildri.com) as soon as reasonably practicable after
such reports are electronically filed with or furnished to the SEC.
Information relating to corporate governance at Oil-Dri, including its Code of Ethics and Business
Conduct, information concerning executive officers, directors and Board committees (including committee charters),
and transactions in Oil-Dri securities by directors and officers, is available free of charge on or through the “InvestorInformation” section of our website at www.oildri.com. We are not including the information on our website as a
part of, or incorporating it by reference into, this Annual Report on Form 10-K.
12
ITEM 1A – RISK FACTORS
In addition to the other information in this report and our other filings with the SEC, you should carefully
consider the risks described below. If any of the following risks occur, our business, financial condition or
operating results could be materially and adversely affected.
Risks Related to our Business
Our future growth and financial performance depend in large part on successful new product introductions.
A significant portion of our net sales comes from the sale of mature products, such as coarse cat litter, floor
absorbent and agricultural chemical carriers, which have had little or no volume growth (or even volume declines) in
recent fiscal years. Our future growth and financial performance will require that we successfully introduce new
products or extend existing product offerings to meet emerging customer needs, technological trends and product
market opportunities. We cannot be certain that we will achieve these goals. The development and introduction of
new products generally require substantial and effective research, development and marketing expenditures, some or
all of which may be unrecoverable if the new products do not gain market acceptance. New product development
itself is inherently risky, as research failures, competitive barriers arising out of the intellectual property rights ofothers, launch difficulties, customer rejection and unexpectedly short product life cycles may occur even after
substantial effort and expense on our part. Even in the case of a successful launch of a new product, the ultimate
benefit we realize may be uncertain if the new product “cannibalizes” sales of our existing products beyond
expected levels.
We face intense competition in our markets.
Our markets are highly competitive and we expect that both direct and indirect competition will increase in
the future. Our overall competitive position depends on a number of factors including price, customer service and
technical support, product quality and delivery. Some of our competitors, particularly in the sale of cat litter (the
largest product in our Retail and Wholesale Products Group), are much larger and have substantially greaterfinancial resources. The competition in the future may, in some cases, result in price reductions, reduced margins or
loss of market share, any of which could materially and adversely affect our business, operating results and financial
condition. If we fail to compete successfully based on these or other factors, our business and future financial
results could be materially and adversely affected.
Our quarterly results may be volatile.
Our operating results have varied on a quarterly basis during our operating history and are likely to
fluctuate significantly in the future. Our expense levels are based, in part, on our expectations regarding future net
sales, and many of our expenses are fixed, particularly in the short term. We may be unable to adjust spending in a
timely manner to compensate for any unexpected revenue shortfall. Any significant shortfall of net sales in relation
to our expectations could negatively affect our quarterly operating results. Our operating results may be below theexpectations of our investors as a result of a variety of factors, many of which are outside our control. Factors that
may affect our quarterly operating results include:
• fluctuating demand for our products and services;
• size and timing of sales of our products and services;
• the mix of products with varying profitability sold in a given quarter;
• changes in our operating costs including raw materials, energy, transportation, packaging, overburden
removal, trade spending, health care costs and other costs;
• our ability to anticipate and adapt to rapidly changing conditions;
• introduction of new products and services by us or our competitors;
• our ability to successfully implement price increases and surcharges, as well as other changes in ourpricing policies or those of our competitors;
• variations in purchasing patterns by our customers;
• the ability of major customers and other debtors to meet their obligations to us as they come due;
• our ability to successfully manage regulatory, tax and legal matters;
• the incurrence of restructuring, impairment or other charges; and
13
• general economic conditions and specific economic conditions in our industry and the industries of our
customers.
Accordingly, we believe that quarter-to-quarter comparisons of our operating results are not necessarily meaningful.
Investors should not rely on the results of one quarter as an indication of our future performance.
Acquisitions involve a number of risks, any of which could cause us not to realize the anticipated benefits.
We intend from time to time to strategically explore potential opportunities to expand our operations and
reserves through acquisitions. Identification of good acquisition candidates is difficult and highly competitive. If
we are unable to identify attractive acquisition candidates, complete acquisitions, and successfully integrate the
companies, businesses or properties that we acquire, our profitability may decline and we could experience a
material adverse effect on our business, financial condition, or results of operations. Acquisitions involve a number
of inherent risks, including:
• uncertainties in assessing the value, strengths, and potential profitability of, and identifying the extent
of all weaknesses, risks, contingent and other liabilities (including environmental or mining safety
liabilities), of acquisition candidates;• the potential loss of key customers, management and employees of an acquired business;
• the ability to achieve identified operating and financial synergies anticipated to result from an
acquisition;
• problems that could arise from the integration of the acquired business; and
• unanticipated changes in business, industry or general economic conditions that affect the assumptions
underlying our rationale for pursuing the acquisition.
Any one or more of these factors could cause us not to realize the benefits anticipated to result from an acquisition.
Moreover, any acquisition opportunities we pursue could materially affect our liquidity and capital resources and
may require us to incur indebtedness, seek equity capital or both. In addition, future acquisitions could result in our
assuming more long-term liabilities relative to the value of the acquired assets than we have assumed in our previousacquisitions.
We depend on a limited number of customers for a large portion of our net sales.
A limited number of customers account for a large percentage of our net sales. Our largest customer, Wal-
Mart Stores, Inc. and its affiliates, accounted for approximately 26%, 25% and 23% of our net sales for the fiscal
years ended July 31, 2009, 2008 and 2007, respectively. Sales to The Clorox Company and its affiliates accounted
for approximately 8% of our net sales for each of the fiscal years ended July 31, 2009, 2008 and 2007. The loss of
or a substantial decrease in the volume of purchases by Wal-Mart, Clorox or any of our other top customers would
harm our sales and profitability. In addition, an adverse change in the terms of our dealings with, or in the financial
wherewithal or viability of, one or more of our significant customers could harm our business, financial condition
and results of operations.
We expect that a significant portion of our net sales will continue to be derived from a small number of
customers and that the percentage of net sales represented by these customers may increase. As a result, changes in
the strategies of our largest customers may reduce our net sales. These strategic changes may include a reduction in
the number of brands they carry or a shift of shelf space to private label products (a change Wal-Mart in fact
implemented with respect to cat litter products in August 2009) or increased use of global or centralized
procurement initiatives. In addition, our business is based primarily upon individual sales orders placed by
customers rather than contracts with a fixed duration. Accordingly, most of our customers could reduce their
purchasing levels or cease buying products from us on relatively short notice. While we do have long-term contracts
with certain of our customers, including Clorox, even these agreements are subject to termination in certain
circumstances. In addition, the degree of profit margin contribution of our significant customers varies. If asignificant customer with a more favorable profit margin was to terminate its relationship with us or shift its mix of
product purchases to lower-margin products, it would have a disproportionate adverse impact on our results of
operations. If we lose a significant customer or if sales of our products to a significant customer materially decrease,
it may have a material adverse effect on our business, financial condition and results of operations.
14
Providing price concessions or trade terms that are acceptable to our customers, or the failure to do so, could
adversely affect our sales and profitability.
The products we sell are subject to significant price competition. From time to time, we may need to
reduce the prices for some of our products to respond to competitive and customer pressures and to maintain marketshare. These pressures are often exacerbated during an economic downturn. Any reduction in prices to respond to
these pressures would reduce our profit margins. In addition, if our sales volumes fail to grow sufficiently to offset
any reduction in margins, our results of operations would suffer. Because of the competitive environment facing
many of our customers, particularly our high-volume mass merchandiser customers, these customers have
increasingly sought to obtain price reductions, specialized packaging or other concessions from product suppliers.
These business demands may relate to inventory practices, logistics or other aspects of the customer-supplier
relationship. To the extent we provide these concessions, our profit margins are reduced. Further, if we are unable
to maintain terms that are acceptable to our customers, these customers could reduce purchases of our products and
increase purchases of products from our competitors, which would harm our sales and profitability.
Increases in energy and other commodity prices would increase our operating costs, and we may be unable to
pass all these increases on to our customers in the form of higher prices.
If our energy costs increase disproportionately to our net sales, our earnings could be significantly reduced.
Because we use energy, including natural gas, fuel oil, coal, electricity, diesel fuel and gasoline, to manufacture and
transport our products, our operating costs increase if our energy costs rise. Our energy costs have risen
substantially over the last five years. Increases in energy costs increase our operating costs and may reduce our
profitability if we are unable to pass all the increases on to our customers. During periods of higher energy costs, we
may not be able to recover our operating cost increases through price increases or surcharges.
Our most significant energy requirements typically are for natural gas and fuel oil. We are subject to
volatility in the price and availability of natural gas and fuel oil, as well as other sources of energy. In the past, we
have endeavored to reallocate a portion of our energy needs among these different sources due to seasonal supplylimitations and the higher cost of one particular fuel relative to other fuels; however, there can be no assurance that
we will be able to effectively reallocate among different fuels in the future. From time to time, we may use forward
purchase contracts or financial instruments to hedge the volatility of a portion of our natural gas and fuel oil costs.
The success or failure of any such hedging transactions depends on a number of factors including, but not limited to,
our ability to anticipate and manage volatility in energy prices, the general demand for natural gas and fuel oil by the
manufacturing sector, seasonality and the weather patterns throughout the United States and the world.
The prices of other commodities such as paper, plastic resins, synthetic rubber and steel significantly
influence the costs of packaging, replacement parts and equipment we use in the manufacture of our products and
the maintenance of our facilities. The prices of these commodities, and the costs of the related materials we use,
have also risen substantially over the last five years, and may continue to rise in the future. These increased
materials costs present the same types of risks as described above with respect to increased energy costs.
Reductions in inventory by our customers could adversely affect our sales and increase our inventory risk.
From time to time, customers in both our Retail and Wholesale Products Group and our Business to
Business Products Group have reduced inventory levels as part of managing their working capital requirements.
Any reduction in inventory levels by our customers would harm our operating results for the financial periods
affected by the reductions. In particular, continued consolidation within the retail industry could potentially reduce
inventory levels maintained by our retail customers, which could adversely affect our results of operations for the
financial periods affected by the reductions. Similarly, inventory reductions by our agricultural chemical carrier
customers or our contract cat litter manufacturing customers could also adversely affect our results of operations for
the financial periods in which the reductions occur.
The value of our inventory may decline as a result of surplus inventory, price reductions or obsolescence.
We must identify the right product mix and maintain sufficient inventory on hand to meet customer orders. Failure
to do so could adversely affect our revenue and operating results. If circumstances change (for example, an
unexpected shift in market demand, pricing or customer defaults) there could be a material impact on the net
realizable value of our inventory. We maintain an inventory valuation reserve account against diminution in the
15
value or salability of our inventory; however, there is no guaranty that these arrangements will be sufficient to avoid
write-offs in excess of our reserves.
Increasing market acceptance of genetically enhanced and treated agricultural products, particularly genetically
modified and treated seeds, could continue to adversely affect our business.
In our Business to Business Products Group, we sell clay granules which are used by agricultural chemical
formulators as carriers for crop protection chemicals, including herbicides, fungicides and insecticides. The
increased use of genetically modified and treated seeds has reduced the need for certain crop production chemicals
(and the carriers for those chemicals) in the past and may continue to do so in the future. Demand for these products
could also be adversely affected by increased consumer acceptance of genetically modified products, as well as
governmental policies, laws and regulations that affect the development, manufacture and distribution of those
products.
Environmental, health and safety matters create potential compliance and other liability risks.
We are subject to a variety of federal, state, local and foreign regulatory requirements relating to the
environment and to health and safety matters. For example, our mining operations are subject to extensivegovernmental regulation on matters such as permitting and licensing requirements, workplace safety, plant and
wildlife protection, wetlands protection, reclamation and restoration of mining properties after mining is completed,
the discharge of materials into the environment, and the effects that mining has on groundwater quality and
availability. We believe we have obtained all material permits and licenses required to conduct our present
operations. We will, however, need additional permits and renewals of permits in the future.
The expense, liabilities and requirements associated with environmental, health and safety regulations are
costly and time-consuming and may delay commencement or continuation of exploration, mining or manufacturing
operations. We have incurred, and will continue to incur, significant capital and operating expenditures and other
costs in complying with environmental, health and safety laws and regulations. In recent years, regulation of
environmental, health and safety matters has grown increasingly stringent, a trend that we expect will continue.Substantial penalties may be imposed if we violate certain of these laws and regulations even if the violation was
inadvertent or unintentional. Failure to maintain or achieve compliance with these laws and regulations or with the
permits required for our operations could result in substantial operating costs and capital expenditures, in addition to
fines and administrative, civil or criminal sanctions, third-party claims for property damage or personal injury,
cleanup and site restoration costs and liens, the issuance of injunctions to limit or cease operations, the suspension or
revocation of permits and other enforcement measures that could have the effect of limiting our operations. Under
the “joint and several” liability principle of certain environmental laws, we may be held liable for all remediation
costs at a particular site and the amount of that liability could be material. In addition, future environmental laws
and regulations could restrict our ability to expand our facilities or extract our deposits or could require us to acquire
costly equipment or to incur other significant expenses in connection with our business. There can be no assurance
that future events, including changes in any environmental requirements and the costs associated with complying
with such requirements, will not have a material adverse effect on us.
Government regulation imposes significant costs on us, and future regulatory changes (or related customer
responses to regulatory changes) could increase those costs or limit our ability to produce and sell our
products.
In addition to the regulatory matters described above, our operations are subject to various federal, state,local and foreign laws and regulations relating to the manufacture, packaging, labeling, content, storage, distribution
and advertising of our products and the conduct of our business operations. For example, in the United States, many
of our products are regulated by the Food and Drug Administration, the Consumer Product Safety Commission and
the Environmental Protection Agency and our product claims and advertising are regulated by the Federal Trade
Commission. Most states have agencies that regulate in parallel to these federal agencies. In addition, our
international sales and operations are subject to regulation in each of the foreign jurisdictions in which we
manufacture, distribute or sell our products. There is increasing federal and state regulation with respect to the
content, labeling, use, and disposal after use, of various products we sell. Throughout the world, but particularly in
the European Union, there is also increasing government scrutiny and regulation of the food chain and products
entering or affecting the food chain.
16
If we are found to be out of compliance with applicable laws and regulations in these or other areas, we
could be subject to loss of customers and to civil remedies, including fines, injunctions, recalls or asset seizures, as
well as potential criminal sanctions, any of which could have a material adverse effect on our business. Loss of or
failure to obtain necessary permits and registrations could delay or prevent us from meeting product demand,
introducing new products, building new facilities or acquiring new businesses and could adversely affect operating
results. If these laws or regulations are changed or interpreted differently in the future, it may become more difficultor expensive for us to comply. In addition, investigations or evaluations of our products by government agencies
may require us to adopt additional labeling, safety measures or other precautions, or may effectively limit or
eliminate our ability to market and sell these products. Accordingly, there can be no assurance that current or future
governmental regulation will not have a material adverse effect on our business or that we will be able to obtain or
renew required governmental authorizations in the future.
We are also experiencing increasing customer scrutiny of the content and manufacturing of our products,
particularly our products entering or affecting the food chain, in parallel with the increasing government regulation
discussed above. Our customers may impose product specifications or other requirements that are different from,
and more onerous than, applicable laws and regulations. As a result, the failure of our products to meet these
additional requirements may result in loss of customers and decreased sales of our products even in the absence of
any actual failure to comply with applicable laws and regulations. There can be no assurance that future customerrequirements concerning the content or manufacturing of our products will not have a material adverse effect on our
business.
We depend on our mining operations for substantially all of our supply of sorbent minerals.
Our principal raw materials, the sorbent minerals commonly known as fuller’s earth, are mined by us or
independent contractors on land that we own or lease. While our mining operations are conducted in surface mines
which do not present many of the risks associated with deep underground mining, our mining operations are
nevertheless subject to many conditions beyond our control. Our mining operations are affected by weather andnatural disasters, such as heavy rains and flooding, equipment failures and other unexpected maintenance problems,
variations in the amount of rock and soil overlying deposits, variations in geological conditions, fires and other
accidents, fluctuations in the price or availability of supplies and other matters. Any of these risks could result in
significant damage to our mining properties or processing facilities, personal injury to our employees, environmental
damage, delays in mining or processing, losses or possible legal liability. We cannot predict whether or the extent to
which we will suffer the impact of these and other conditions in the future.
We may not be successful in acquiring adequate additional reserves in the future.
We have an ongoing program of exploration for additional reserves on existing properties as well as
through the potential acquisition of new owned or leased properties; however, we cannot provide assurances that our
attempts to acquire additional reserves in the future will be successful. Our ability to acquire additional reserves in
the future could be limited by competition from other companies for attractive properties, the lack of suitable
properties that can be acquired on terms acceptable to us or restrictions under our existing or future debt facilities.
We may not be able to negotiate new leases or obtain mining contracts for properties containing additional reserves
or renew our leasehold interests in properties on which operations are not commenced during the term of the lease.Also, requirements for environmental compliance may restrict exploration or use of lands that might otherwise be
utilized as a source of reserves.
We face risks as a result of our international sales and business operations.
We derived approximately 14% of our net sales from sales outside of the United States in the fiscal year
ended July 31, 2009. Our ability to sell our products and conduct our operations outside of the United States is
subject to a number of risks. Local economic, political and labor conditions in each country could adversely affect
demand for our products or disrupt our operations in these markets, particularly when local political and economicconditions are unstable. In addition, international sales and operations are subject to currency exchange fluctuations,
fund transfer restrictions and import/export duties, and international operations are subject to foreign regulatory
requirements and issues, including with respect to environmental matters. Any of these matters could result in
sudden, and potentially prolonged, changes in demand for our products. Also, we may have difficulty enforcing
agreements and collecting accounts receivable through a foreign country’s legal system.
17
We may face product liability claims that are costly and create adverse publicity.
If any of the products that we sell cause harm to any of our customers or to consumers, we could be
exposed to product liability lawsuits. If we are found liable under product liability claims, we could be required to
pay substantial monetary damages. Further, even if we successfully defend ourselves against this type of claim, we
could be forced to spend a substantial amount of money in litigation expenses, our management could be required tospend valuable time in the defense against these claims and our reputation could suffer, any of which could harm our
business.
Failure to maintain effective internal control over financial reporting could have a material adverse effect on our
business, operating results and stock price.
Section 404 of the Sarbanes-Oxley Act and related SEC rules require that we perform an annual
management assessment of the design and effectiveness of our internal control over financial reporting and obtain an
opinion from our independent registered public accounting firm on our internal control over financial reporting. Our
assessment concluded that our internal control over financial reporting was effective as of July 31, 2009 and we
obtained from our independent registered public accounting firm an unqualified opinion on our internal control over
financial reporting; however, there can be no assurance that we will be able to maintain the adequacy of our internalcontrol over financial reporting, as such standards are modified, supplemented or amended from time to time in
future periods. Accordingly, we cannot assure that we will be able to conclude on an ongoing basis that we have
effective internal control over financial reporting in accordance with Section 404 of the Sarbanes-Oxley Act.
Moreover, effective internal control is necessary for us to produce reliable financial reports and is important to help
prevent financial fraud. If we cannot provide reliable financial reports or prevent fraud, our business and operating
results could be harmed, investors could lose confidence in our reported financial information, and the trading price
of our Common Stock could drop significantly.
Risks Related to Our Common Stock
Our principal stockholders have the ability to control matters requiring a stockholder vote and could delay, deter
or prevent a change of control in our company.
Under our Certificate of Incorporation, the holders of our Common Stock are entitled to one vote per share
and the holders of our Class B Stock are entitled to 10 votes per share; the two classes generally vote together
without regard to class (except that any amendment to our Certificate of Incorporation changing the number of
authorized shares or adversely affecting the rights of Common Stock or Class B Stock requires the separate approval
of the class so affected as well as the approval of both classes voting together). As a result, the holders of our Class
B Stock exert control over us and thus limit the ability of other stockholders to influence corporate matters.
Beneficial ownership of Common Stock and Class B Stock by the Jaffee Investment Partnership, L.P., and its
affiliates (including Richard M. Jaffee, our Chairman, and Daniel S. Jaffee, his son and our President and Chief
Executive Officer) provides them with the ability to control the election of our Board of Directors and the outcome
of most matters requiring the approval of our stockholders, including the amendment of certain provisions of ourCertificate of Incorporation and By-Laws, the approval of any equity-based employee compensation plans and the
approval of fundamental corporate transactions, including mergers and substantial asset sales. Through their
concentration of voting power, our principal stockholders may be able to delay, deter or prevent a change in control
of our company or other business combinations that might otherwise be beneficial to our other stockholders.
18
We are a “controlled company” within the meaning of the New York Stock Exchange (“NYSE”) rules and, as a
result, qualify for, and intend to rely on, exemptions from certain corporate governance requirements.
We are a “controlled company” under the New York Stock Exchange Corporate Governance Standards.
As a controlled company, we may rely on exemptions from certain NYSE corporate governance requirements that
otherwise would be applicable, including the requirements:
• that a majority of the board of directors consists of independent directors;
• that we have a nominating and governance committee, and that this committee be composed entirely of
independent directors and governed by a written charter addressing the committee’s purpose and
responsibilities;
• that we have a compensation committee composed entirely of independent directors with a written
charter addressing the committee’s purpose and responsibilities; and
• that we conduct an annual performance evaluation of the nominating and corporate governance and
compensation committees.
We have previously relied on these exemptions, and we intend to continue to rely on them in the future. As a result,
you may not have the same benefits and information available to stockholders of NYSE-listed companies that aresubject to all of the NYSE corporate governance requirements.
The market price for our Common Stock may be volatile.
In recent periods, there has been volatility in the market price for our Common Stock. Furthermore, the
market price of our Common Stock could fluctuate substantially in the future in response to a number of factors,
including the following:
• fluctuations in our quarterly operating results or the operating results of our competitors;
• changes in general conditions in the economy, the financial markets, or our industry;
• announcements of significant acquisitions, strategic alliances or joint ventures by us, our customers orour competitors;
• introduction of new products or services;
• increases in the price of energy sources and other raw materials; and
• other developments affecting us, our industry, customers or competitors.
In addition, in recent years the stock market has experienced extreme price and volume fluctuations. This volatility
has had a significant effect on the market prices of securities issued by many companies for reasons unrelated to
their operating performance. These broad market fluctuations may materially adversely affect our Common Stock
price, regardless of our operating results. Given its relatively small public float and average daily trading volume,
our Common Stock may be relatively more susceptible to volatility arising from any of these factors. There can be
no assurance that the price of our Common Stock will increase in the future or be maintained at its recent levels.
Future sales of our Common Stock could depress its market price.
Future sales of shares of our Common Stock could adversely affect its prevailing market price. If our
officers, directors or significant stockholders sell a large number of shares, or if we issue a large number of shares,
the market price of our Common Stock could significantly decline. Moreover, the perception in the public market
that stockholders might sell shares of Common Stock could depress the market for our Common Stock. Our
Common Stock’s relatively small public float and average daily trading volume may make it relatively more
susceptible to these risks.
19
ITEM 1B – UNRESOLVED STAFF COMMENTS
None.
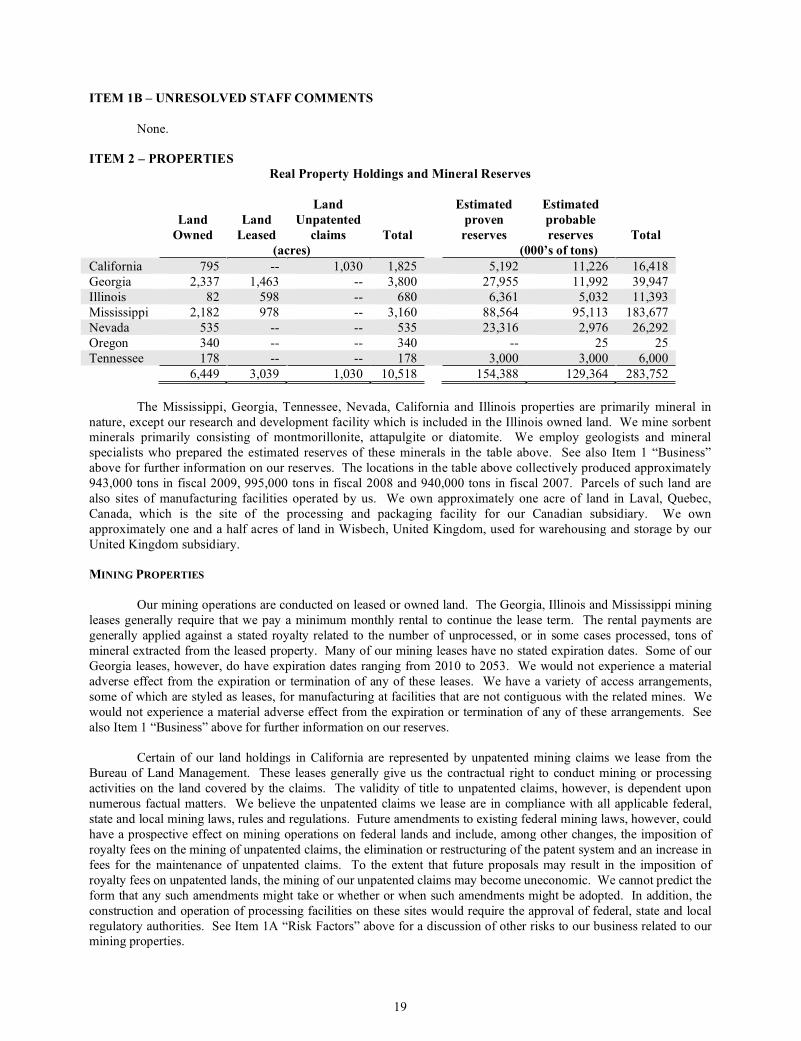
ITEM 2 – PROPERTIES
Real Property Holdings and Mineral Reserves
Land
Owned
Land
Leased
Land
Unpatented
claims Total
Estimated
proven
reserves
Estimated
probable
reserves Total
(acres) (000’s of tons)
California 795 -- 1,030 1,825 5,192 11,226 16,418
Georgia 2,337 1,463 -- 3,800 27,955 11,992 39,947
Illinois 82 598 -- 680 6,361 5,032 11,393
Mississippi 2,182 978 -- 3,160 88,564 95,113 183,677
Nevada 535 -- -- 535 23,316 2,976 26,292
Oregon 340 -- -- 340 -- 25 25
Tennessee 178 -- -- 178 3,000 3,000 6,000
6,449 3,039 1,030 10,518 154,388 129,364 283,752
The Mississippi, Georgia, Tennessee, Nevada, California and Illinois properties are primarily mineral in
nature, except our research and development facility which is included in the Illinois owned land. We mine sorbentminerals primarily consisting of montmorillonite, attapulgite or diatomite. We employ geologists and mineral
specialists who prepared the estimated reserves of these minerals in the table above. See also Item 1 “Business”
above for further information on our reserves. The locations in the table above collectively produced approximately
943,000 tons in fiscal 2009, 995,000 tons in fiscal 2008 and 940,000 tons in fiscal 2007. Parcels of such land are
also sites of manufacturing facilities operated by us. We own approximately one acre of land in Laval, Quebec,
Canada, which is the site of the processing and packaging facility for our Canadian subsidiary. We own
approximately one and a half acres of land in Wisbech, United Kingdom, used for warehousing and storage by our
United Kingdom subsidiary.
MINING PROPERTIES
Our mining operations are conducted on leased or owned land. The Georgia, Illinois and Mississippi mining
leases generally require that we pay a minimum monthly rental to continue the lease term. The rental payments are
generally applied against a stated royalty related to the number of unprocessed, or in some cases processed, tons of
mineral extracted from the leased property. Many of our mining leases have no stated expiration dates. Some of our
Georgia leases, however, do have expiration dates ranging from 2010 to 2053. We would not experience a material
adverse effect from the expiration or termination of any of these leases. We have a variety of access arrangements,
some of which are styled as leases, for manufacturing at facilities that are not contiguous with the related mines. We
would not experience a material adverse effect from the expiration or termination of any of these arrangements. See
also Item 1 “Business” above for further information on our reserves.
Certain of our land holdings in California are represented by unpatented mining claims we lease from the
Bureau of Land Management. These leases generally give us the contractual right to conduct mining or processing
activities on the land covered by the claims. The validity of title to unpatented claims, however, is dependent upon
numerous factual matters. We believe the unpatented claims we lease are in compliance with all applicable federal,
state and local mining laws, rules and regulations. Future amendments to existing federal mining laws, however, could
have a prospective effect on mining operations on federal lands and include, among other changes, the imposition of
royalty fees on the mining of unpatented claims, the elimination or restructuring of the patent system and an increase in
fees for the maintenance of unpatented claims. To the extent that future proposals may result in the imposition of
royalty fees on unpatented lands, the mining of our unpatented claims may become uneconomic. We cannot predict the
form that any such amendments might take or whether or when such amendments might be adopted. In addition, the
construction and operation of processing facilities on these sites would require the approval of federal, state and local
regulatory authorities. See Item 1A “Risk Factors” above for a discussion of other risks to our business related to ourmining properties.
20
MINING ANDMANUFACTURINGMETHODS
Mining and Hauling
We mine sorbent minerals (which we refer to generally as “clay”) in open-pit mines in Georgia,Mississippi, Illinois and California. The mining and hauling operations are similar throughout the Oil-Dri locations,
with the exception of California. The land to be mined is first stripped. The stripping process involves removing
the overburden and preparing the site to allow the excavators to reach the desired clay. When stripping is
completed, the excavators dig out and load the clay onto dump trucks. The trucks haul the clay directly to our
processing plants where it is dumped in a clay yard and segregated by clay type if necessary. Generally, the mine
sites are in close proximity to the processing plants; however, the maximum distance the clay is currently hauled to a
plant is 13 miles.
At our California mines the clay is excavated and hauled to a hopper. An initial crushing and screening
operation is performed at the mine site before the trucks are loaded for delivery to the processing plant.
Processing
The processing of our clay varies depending on the level of moisture desired in the clay after the drying
process. The moisture level is referred to as regular volatile moisture (“RVM”) or low volatile moisture (“LVM”)
RVM Clay: A front end loader is used to load the clay from the clay yard into the primary crusher. The
primary crusher reduces the clay chunks to 2.0 inches in diameter or smaller. From the crusher, the clay is
transported via a belt conveyor into the clay shed. A clay shed loader feeds the clay into a disintegrator which
reduces the clay to particles 0.5 inches in diameter or smaller. The clay then feeds directly into the RVM kiln. The
RVM kiln reduces the clay’s moisture content. From the RVM kiln, the clay moves through a series of mills and
screens which further size and separate the clay into the desired particle sizes. The sized clay is then conveyed into
storage tanks. The RVM processed clay can then be packaged or processed into LVM material.
LVM Clay: RVM clay is fed from storage tanks into the LVM kiln where the moisture content is further
reduced. The clay then proceeds into a rotary cooler, then on to a screening circuit which separates the clay into the
desired particle sizes.
Packaging
Once the clay has been dried to the desired level and sized the clay will be packaged. Our products have
package sizes ranging from bags and jugs of cat litter to railcars of agricultural products. We also package some of
our products into bulk (2000 pound) bags and into bulk trucks. The size and delivery configuration of the finished
product is determined by customer requirements.
21
FACILITIES
We operate manufacturing facilities on property owned or leased by us as shown on the map below:
Oil-Dri Corporation of America Plant Site Locations
Facilities
Location Owned/Leased Function
Alpharetta, Georgia Leased Non-clay processing and packaging
Blue Mountain, Mississippi Both Clay mining, manufacturing and packaging
Chicago, Illinois Leased Principal executive office
Mounds, Illinois Owned Clay mining, manufacturing and packaging
Coppet, Switzerland Leased Customer service office
Laval, Quebec, Canada Owned Non-clay production and clay and non-clay packaging
Ochlocknee, Georgia Owned Clay mining, manufacturing and packaging
Ripley, Mississippi Owned Clay mining, manufacturing and packaging
Taft, California Owned Clay mining, manufacturing and packaging
Vernon Hills, Illinois Owned Research and development
Wisbech, United Kingdom Both Non-clay production and clay and non-clay packaging
We have no mortgages on the real property we own. The lease for the Alpharetta, Georgia facility expires
in 2013. The lease for the Chicago, Illinois corporate office space expires in 2018. The lease for the Wisbech,
United Kingdom facility expires in 2032. The lease for the Coppet, Switzerland office is on a year-to-year basis.
We consider that our properties are generally in good condition, are well maintained and are suitable and adequate to
carry on our business.

22
ITEM 3 – LEGAL PROCEEDINGS
We are party to various legal actions from time to time that are ordinary in nature and incidental to the
operation of our business. While it is not possible at this time to determine with certainty the ultimate outcome of
these or other lawsuits, we believe that none of the pending proceedings will have a material adverse effect on ourbusiness or financial condition.
ITEM 4 – SUBMISSION OF MATTERS TO A VOTE OF SECURITY HOLDERS
None.
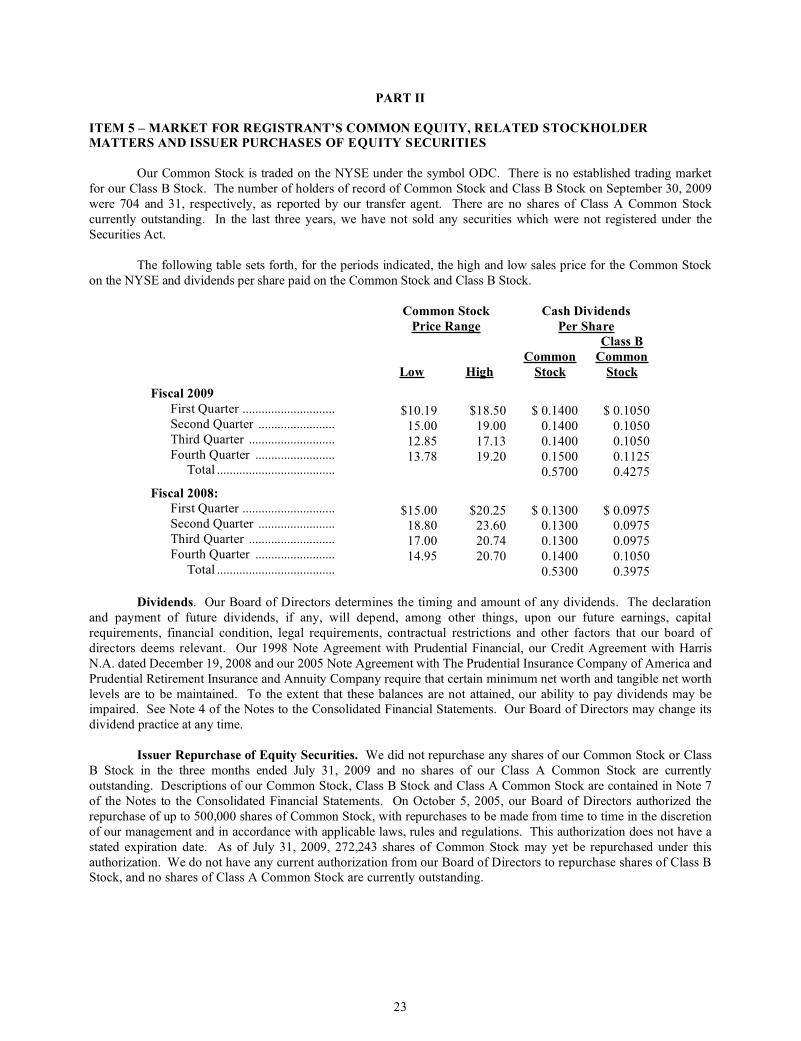
23
PART II
ITEM 5 – MARKET FOR REGISTRANT’S COMMON EQUITY, RELATED STOCKHOLDER
MATTERS AND ISSUER PURCHASES OF EQUITY SECURITIES
Our Common Stock is traded on the NYSE under the symbol ODC. There is no established trading market
for our Class B Stock. The number of holders of record of Common Stock and Class B Stock on September 30, 2009
were 704 and 31, respectively, as reported by our transfer agent. There are no shares of Class A Common Stock
currently outstanding. In the last three years, we have not sold any securities which were not registered under the
Securities Act.
The following table sets forth, for the periods indicated, the high and low sales price for the Common Stock
on the NYSE and dividends per share paid on the Common Stock and Class B Stock.
Common Stock
Price Range
Cash Dividends
Per Share
Low High
Common
Stock
Class B
Common
Stock
Fiscal 2009
First Quarter .............................
Second Quarter ........................
Third Quarter ...........................
Fourth Quarter .........................Total .....................................
$10.19
15.00
12.85
13.78
$18.50
19.00
17.13
19.20
$ 0.1400
0.1400
0.1400
0.1500
0.5700
$ 0.1050
0.1050
0.1050
0.1125
0.4275
Fiscal 2008:
First Quarter .............................
Second Quarter ........................
Third Quarter ...........................
Fourth Quarter .........................
Total .....................................
$15.0018.80
17.00
14.95
$20.2523.60
20.74
20.70
$ 0.13000.1300
0.1300
0.1400
0.5300
$ 0.09750.0975
0.0975
0.1050
0.3975
Dividends. Our Board of Directors determines the timing and amount of any dividends. The declaration
and payment of future dividends, if any, will depend, among other things, upon our future earnings, capital
requirements, financial condition, legal requirements, contractual restrictions and other factors that our board of
directors deems relevant. Our 1998 Note Agreement with Prudential Financial, our Credit Agreement with Harris
N.A. dated December 19, 2008 and our 2005 Note Agreement with The Prudential Insurance Company of America and
Prudential Retirement Insurance and Annuity Company require that certain minimum net worth and tangible net worth
levels are to be maintained. To the extent that these balances are not attained, our ability to pay dividends may beimpaired. See Note 4 of the Notes to the Consolidated Financial Statements. Our Board of Directors may change its
dividend practice at any time.
Issuer Repurchase of Equity Securities. We did not repurchase any shares of our Common Stock or Class
B Stock in the three months ended July 31, 2009 and no shares of our Class A Common Stock are currently
outstanding. Descriptions of our Common Stock, Class B Stock and Class A Common Stock are contained in Note 7
of the Notes to the Consolidated Financial Statements. On October 5, 2005, our Board of Directors authorized the
repurchase of up to 500,000 shares of Common Stock, with repurchases to be made from time to time in the discretion
of our management and in accordance with applicable laws, rules and regulations. This authorization does not have a
stated expiration date. As of July 31, 2009, 272,243 shares of Common Stock may yet be repurchased under this
authorization. We do not have any current authorization from our Board of Directors to repurchase shares of Class BStock, and no shares of Class A Common Stock are currently outstanding.
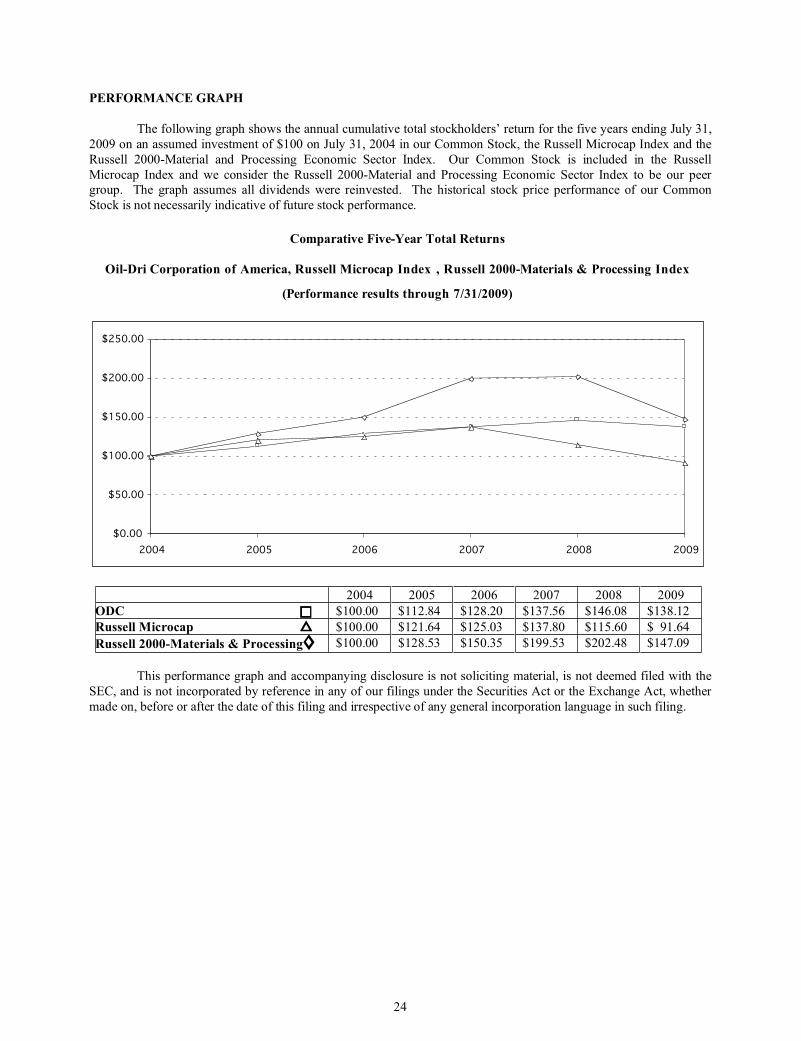
24
PERFORMANCE GRAPH
The following graph shows the annual cumulative total stockholders’ return for the five years ending July 31,
2009 on an assumed investment of $100 on July 31, 2004 in our Common Stock, the Russell Microcap Index and the
Russell 2000-Material and Processing Economic Sector Index. Our Common Stock is included in the Russell
Microcap Index and we consider the Russell 2000-Material and Processing Economic Sector Index to be our peergroup. The graph assumes all dividends were reinvested. The historical stock price performance of our Common
Stock is not necessarily indicative of future stock performance.
Comparative Five-Year Total Returns
Oil-Dri Corporation of America, Russell Microcap Index , Russell 2000-Materials & Processing Index
(Performance results through 7/31/2009)
2004 2005 2006 2007 2008 2009
ODC �� $100.00 $112.84 $128.20 $137.56 $146.08 $138.12
Russell Microcap �� $100.00 $121.64 $125.03 $137.80 $115.60 $ 91.64
Russell 2000-Materials & Processing�� $100.00 $128.53 $150.35 $199.53 $202.48 $147.09
This performance graph and accompanying disclosure is not soliciting material, is not deemed filed with the
SEC, and is not incorporated by reference in any of our filings under the Securities Act or the Exchange Act, whether
made on, before or after the date of this filing and irrespective of any general incorporation language in such filing.
$0.00
$50.00
$100.00
$150.00
$200.00
$250.00
2004 2005 2006 2007 2008 2009
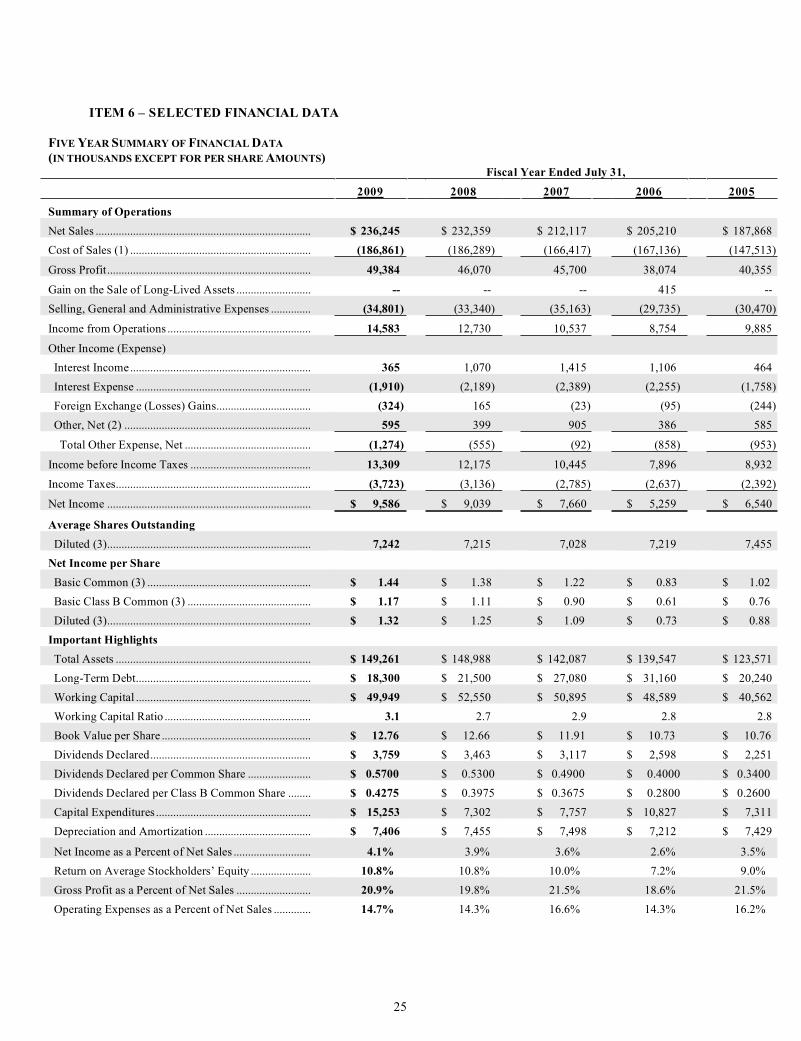
25
ITEM 6 – SELECTED FINANCIAL DATA
FIVE YEAR SUMMARY OF FINANCIALDATA
(IN THOUSANDS EXCEPT FOR PER SHAREAMOUNTS)Fiscal Year Ended July 31,
2009 2008 2007 2006 2005
Summary of Operations
Net Sales ........................................................................... $ 236,245 $ 232,359 $ 212,117 $ 205,210 $ 187,868
Cost of Sales (1) ............................................................... (186,861) (186,289) (166,417) (167,136) (147,513)
Gross Profit....................................................................... 49,384 46,070 45,700 38,074 40,355
Gain on the Sale of Long-Lived Assets .......................... -- -- -- 415 --
Selling, General and Administrative Expenses .............. (34,801) (33,340) (35,163) (29,735) (30,470)
Income from Operations .................................................. 14,583 12,730 10,537 8,754 9,885
Other Income (Expense)
Interest Income............................................................... 365 1,070 1,415 1,106 464
Interest Expense ............................................................. (1,910) (2,189) (2,389) (2,255) (1,758)
Foreign Exchange (Losses) Gains................................. (324) 165 (23) (95) (244)
Other, Net (2) ................................................................. 595 399 905 386 585
Total Other Expense, Net ............................................ (1,274) (555) (92) (858) (953)
Income before Income Taxes .......................................... 13,309 12,175 10,445 7,896 8,932
Income Taxes.................................................................... (3,723) (3,136) (2,785) (2,637) (2,392)
Net Income ....................................................................... $ 9,586 $ 9,039 $ 7,660 $ 5,259 $ 6,540
Average Shares Outstanding
Diluted (3)....................................................................... 7,242 7,215 7,028 7,219 7,455
Net Income per Share
Basic Common (3) ......................................................... $ 1.44 $ 1.38 $ 1.22 $ 0.83 $ 1.02
Basic Class B Common (3) ........................................... $ 1.17 $ 1.11 $ 0.90 $ 0.61 $ 0.76
Diluted (3)....................................................................... $ 1.32 $ 1.25 $ 1.09 $ 0.73 $ 0.88
Important Highlights
Total Assets .................................................................... $ 149,261 $ 148,988 $ 142,087 $ 139,547 $ 123,571
Long-Term Debt............................................................. $ 18,300 $ 21,500 $ 27,080 $ 31,160 $ 20,240
Working Capital ............................................................. $ 49,949 $ 52,550 $ 50,895 $ 48,589 $ 40,562
Working Capital Ratio ................................................... 3.1 2.7 2.9 2.8 2.8
Book Value per Share .................................................... $ 12.76 $ 12.66 $ 11.91 $ 10.73 $ 10.76
Dividends Declared........................................................ $ 3,759 $ 3,463 $ 3,117 $ 2,598 $ 2,251
Dividends Declared per Common Share ...................... $ 0.5700 $ 0.5300 $ 0.4900 $ 0.4000 $ 0.3400
Dividends Declared per Class B Common Share ........ $ 0.4275 $ 0.3975 $ 0.3675 $ 0.2800 $ 0.2600
Capital Expenditures ...................................................... $ 15,253 $ 7,302 $ 7,757 $ 10,827 $ 7,311
Depreciation and Amortization ..................................... $ 7,406 $ 7,455 $ 7,498 $ 7,212 $ 7,429
Net Income as a Percent of Net Sales ........................... 4.1% 3.9% 3.6% 2.6% 3.5%
Return on Average Stockholders’ Equity ..................... 10.8% 10.8% 10.0% 7.2% 9.0%
Gross Profit as a Percent of Net Sales .......................... 20.9% 19.8% 21.5% 18.6% 21.5%
Operating Expenses as a Percent of Net Sales ............. 14.7% 14.3% 16.6% 14.3% 16.2%
26
(1) In fiscal 2008, cost of sales was reduced by pre-tax net proceeds of $831,000 from the sale of emission reduction
credits to unaffiliated third parties. See Note 2 of the Notes to the Consolidated Financial Statements.
(2) In fiscal 2007, Other Income (Expense) included pre-tax proceeds of $389,000 from life insurance on former
employees.
(3) Average shares outstanding and net income per share for fiscal year 2005 have been restated to reflect a five-for-
four stock split, effected by a stock dividend of one-quarter share for each outstanding share of Common Stock and
Class B Stock. The Board announced the stock dividend on June 6, 2006, during our fiscal year 2006. The stock
dividend was paid on September 8, 2006 to stockholders of record at the close of business on August 4, 2006.
ITEM 7 – MANAGEMENT’S DISCUSSION AND ANALYSIS OF FINANCIAL CONDITION AND
RESULTS OF OPERATIONS
The following discussion and analysis of our financial condition and results of operations should be read
together with the financial statements and the related notes included elsewhere herein. This discussion contains
forward-looking statements that involve risks and uncertainties. Our actual results may differ materially from the
results discussed in the forward-looking statements. Factors that might cause a difference include, but are not limited
to, those discussed under “Forward-Looking Statements” and in Item 1A “Risk Factors” in this Annual Report on
Form 10-K.
OVERVIEW
We develop, mine, manufacture and market sorbent products principally produced from clay minerals and, to
a lesser extent, other sorbent materials. Our principal products include cat litter, industrial and automotive floorabsorbents, fluids purification and filtration bleaching clays, agricultural chemical carriers, animal health and nutrition
products and sports field products. Our products are sold to two primary customer groups, including customers who
resell our products as originally produced to the end customer and those who use our products as part of their
production process or use them as an ingredient in their final finished product. We have two reportable operating
segments based on the different characteristics of our two primary customer groups: Retail and Wholesale Products
Group and Business to Business Products Group. Each operating segment is discussed individually below. Additional
detailed descriptions of the operating segments are included in Item 1 “Business” above.
We had net income of $9,586,000, or $1.32 per diluted share, for the year ended July 31, 2009, a 6%
increase over net income of $9,039,000, or $1.25 per diluted share, for the year ended July 31, 2008. Net income
was positively impacted by a higher average net selling price due to strategic pricing and the mix of products sold,with some products contributing more to net income than others. Net income was negatively impacted by higher
costs of natural gas and recycled fuel oil used to dry our clay and resin materials used to package our products.
The global effect of the economic downturn during fiscal 2009 impacted demand for products in both our
domestic and foreign markets and resulted in a decrease in total tons sold. In our Retail and Wholesale Products
Group, competition for our consumer products increased as consumer spending declined. The downturn in the
manufacturing and automotive industries reduced demand for our industrial absorbents. In our Business to Business
Products Group, our agricultural chemical carrier sales declined in both the agricultural and the lawn and garden
markets. Sales of our sports products declined due to the negative impact of economic conditions on municipalities and
other recreational baseball customers. The weak global economy along with a good quality soybean crop resulted in
lower tons sold for our bleaching earth products. Our continued focus on our corporate strategy to create value fromsorbent minerals helped us contend with these challenging times. We introduced new products in both Groups and
continued our commitment to research and development to create new products and to improve existing products.
RESULTSOFOPERATIONS
FISCAL 2009 COMPARED TOFISCAL 2008
Consolidated net sales for the year ended July 31, 2009 were $236,245,000, an increase of 2% from net
sales of $232,359,000 in fiscal 2008. Both our Retail and Wholesale Products Group and our Business to Business
Products Group contributed to the net sales increase. Net income for the year was $9,586,000, an increase of 6%
from net income of $9,039,000 in fiscal 2008. The Retail and Wholesale Products Group contributed to the improved
27
net income as higher average net selling prices overcame lower volume and increased costs; however, in the Business
to Business Products Group the lower volume and higher costs prevailed over higher average net selling prices.
BUSINESS TO BUSINESS PRODUCTS GROUP
Net sales of the Business to Business Products Group for fiscal 2009 were $76,049,000, an increase of$1,001,000, or 1%, from net sales of $75,048,000 in fiscal 2008. Higher average net selling prices and a favorable
product sales mix provided for increased sales in fiscal 2009 despite 9% lower tons sold for the Group compared to
fiscal 2008. Net sales of co-packaged cat litter, animal health and nutrition and agricultural chemical carrier
products all increased, while net sales of fluids purification and sports-related products decreased. Our co-packaged
traditional coarse cat litter net sales were up 8% in fiscal 2009. A 4% increase in tons sold due to product
improvements and a higher average net selling price more than offset the loss of a small co-package customer during
fiscal 2009. Net sales of animal health and nutrition products rose 2% due primarily to increased average net
selling prices and the introduction of new mycotoxin binder products. Net sales of agricultural chemical carriers were
up approximately 12% due primarily to a higher average net selling price that more than offset approximately 11%
lower tons sold. Agricultural chemical carriers tons sold declined in the agricultural and the lawn and garden markets
due primarily to the poor economy. Net sales of bleaching earth and fluid purification products were down 3% from
fiscal 2008 as a 9% decline in tons sold outweighed a higher average net selling price. The lower tons sold forbleaching earth products resulted from a weak global economy and a good quality soybean crop, which required less
bleaching clay to process the oil. Sales of our baseball-related products declined 7% due to the negative impact of
economic conditions on municipalities and other recreational baseball customers. Sales of golf-related products
decreased 83% upon the loss of a distributor.
The Business to Business Products Group’s operating income decreased 5% to $14,948,000 in fiscal 2009
from $15,782,000 in fiscal 2008. Approximately 8% higher combined materials, packaging and freight costs more than
offset a higher average net selling price. Materials costs increased approximately 11% due to the higher cost for fuel
used to dry our clay-based products compared to the prior fiscal year. Freight costs were approximately 5% higher
compared to fiscal 2008. Although diesel fuel and ocean freight prices declined, particularly in the later part of fiscal
2009, the average cost for fiscal 2009 was greater than for fiscal 2008. Conversely, packaging costs declinedapproximately 8% due primarily to lower costs of paper used in packaging. Selling and administrative expenses were
21% higher in fiscal 2009 compared to fiscal 2008 due primarily to marketing and promotional activities for our new
mycotoxin binder product.
RETAIL ANDWHOLESALE PRODUCTS GROUP
Net sales of the Retail and Wholesale Products Group for fiscal 2009 were $160,196,000, an increase of
$2,885,000, or 2%, from net sales of $157,311,000 in fiscal 2008. The Group’s net sales growth was driven by
increased average net selling prices and a favorable product sales mix that overcame a 4% decrease in tons sold. Net
sales of cat litter products increased approximately 6% in fiscal 2009. Private label cat litter net sales increased
approximately 7% due to higher average net selling prices accompanied by a 1% increase in tons sold. Branded cat
litter net sales also increased approximately 5% due to a higher average net selling price that offset a 7% decline in tonssold. Branded coarse cat litter tons sold declined; however, our branded scoopable cat litter tons sold increased as a
result of new natural products and marketing programs. Wal-Mart, our largest customer, informed us in June 2009 that
its stores will carry a reduced number of cat litter brands beginning in August 2009, the first month of our fiscal year
2010. We expect to maintain a private label relationship with this customer. As disclosed in our June 2009 press
release regarding this development, we believe this change will have a material negative impact on fiscal 2010 net sales
and net income. Our intention is to moderate the impact on our consolidated financial results of the expected reduction
in sales to Wal-Mart through expanded distribution to other customers, new product introductions, cost saving
initiatives and product sales mix improvement. Net sales of domestic industrial absorbents were flat as a higher
average net selling price offset a 7% decline in tons sold due to poor economic conditions in the manufacturing and
automotive industries. Net sales of our foreign subsidiaries decreased 24% with a 16% decline in tons sold. Both our
United Kingdom and Canadian subsidiaries have been negatively impacted by unfavorable local currency fluctuationscompared to the U.S. Dollar and the worldwide economic slowdown. See Foreign Operations below for further
information regarding our foreign subsidiaries’ results.
The Retail and Wholesale Products Group’s operating income increased 14% to $17,007,000 in fiscal 2009
from $14,973,000 in fiscal 2008. A higher average net selling price overcame an approximate 3% increase in
combined freight, materials and packaging costs. Packaging costs increased approximately 3% due primarily to higher
28
resin costs. Material costs increased approximately 5% due primarily to the higher cost for fuel used to dry our clay-
based products compared to the prior fiscal year. Freight costs were 3% less than the prior fiscal year as lower diesel
prices reduced domestic freight costs, particularly in the later part of fiscal 2009. Selling and administrative expenses
were 13% greater in fiscal 2009 compared to fiscal 2008. In fiscal 2009 advertising costs increased due to several
marketing campaigns to enhance our brand awareness.
CONSOLIDATED RESULTS
Consolidated gross profit as a percentage of net sales in fiscal 2009 increased to 21% from 20% in fiscal
2008. Cost of sales for fiscal 2008 was reduced by $831,000 as a result of the sale of emission reduction credits, as
described in Note 2 of the Notes to the Consolidated Financial Statements, which increased our consolidated gross
profit as a percentage of net sales for fiscal 2008 by approximately 1%. Gross profit improved in fiscal 2009 due
primarily to a higher average net selling price which overcame increased manufacturing and packaging costs. The cost
of fuel used in the manufacturing process was 19% higher in fiscal 2009 compared to fiscal 2008. Non-fuel
manufacturing costs, including depreciation and amortization, increased 13% over the same period of the prior fiscal
year. Significant manufacturing cost increases were in purchased materials, repairs, labor and non-kiln fuel.
Selling, general and administrative expenses as a percentage of net sales increased in fiscal 2009 to 15% from14% in fiscal 2008. The discussion of the Groups’ operating income above describes the increased selling and
administrative expenses that were allocated to our operating segments. The remaining unallocated corporate expenses
were lower in fiscal 2009 due primarily to lower expenses for the estimated incentive bonus, research and development
and stock option compensation. The lower fiscal 2009 incentive bonus expense was based on performance targets that
are established for each year. Research and development costs were lower as we moved further through the
development cycle for several new products. Stock option compensation was lower as more stock options became
fully vested and no new options were issued. These lower expenses were partially offset by higher pension and rent
expense.
Interest expense in fiscal 2009 decreased $279,000 from fiscal 2008 due to a reduction in debt outstanding.
Interest income in fiscal 2009 decreased $705,000 from fiscal 2008 due to lower average interest rates and loweraverage investment balances.
Other income in fiscal 2009 increased $195,000 from fiscal 2008. Other income in fiscal 2009 included
income relating to a lease arrangement with a co-packaging partner. Other income in fiscal 2008 included expenses
associated with examinations by regulatory agencies.
Our effective tax rate was 28% of pre-tax income in fiscal 2009 compared to 26% in fiscal 2008. The
effective tax rate was higher in fiscal 2009 due to increased income, a lower deduction for mining depletion due to
reduced tonnage and an unfavorable tax impact from the results of foreign operations.
Total assets increased $273,000 during fiscal 2009. Current assets decreased $8,934,000, or 11%, from the
fiscal 2008 year-end balances primarily due to decreased investments in Treasury securities and accounts receivable.These decreases were partially offset by increased cash and cash equivalents and prepaid expenses. These changes are
described in the Liquidity and Capital Resources section below. Property, plant and equipment, net of accumulated
depreciation, increased $8,045,000 due primarily to capital projects related to new product development at our
manufacturing facilities and the purchase of land. Other noncurrent assets increased $1,162,000 from fiscal 2008 due
to a higher deferred tax asset partially offset by a decrease in a lease receivable with a co-packaging partner.
Total liabilities decreased $1,664,000, or 3%, during fiscal 2009. Current liabilities decreased $6,333,000, or
21%, during fiscal 2009. The changes in current liabilities are described in the Liquidity and Capital Resources section
below. Noncurrent liabilities increased $4,669,000 due primarily to higher accruals for pension and post-retirement
benefits and deferred compensation partially offset by a reduction in long term debt due to scheduled payments. The
increased pension and post-retirement benefit accruals were driven by the actuarially calculated benefit obligations andlower pension asset values as of July 31, 2009. See Note 9 of the Notes to the Consolidated Financial Statements for
more information on employee benefit plans. Deferred compensation accruals increased due to new deferrals and
earnings on deferred balances in excess of payouts.
29
FISCAL 2008 COMPARED TOFISCAL 2007
Consolidated net sales for the year ended July 31, 2008 were $232,359,000, an increase of 10% from net
sales of $212,117,000 in fiscal 2007. Both our Retail and Wholesale Products Group and our Business to Business
Products Group contributed to the sales improvement. Our focus on strategic pricing company-wide to contend withrising costs resulted in an increased average net selling price. In addition, total tons sold for fiscal year 2008 increased
5%. Net income for the year was $9,039,000, an increase of 18% from net income of $7,660,000 in fiscal 2007.
Net income was positively impacted by higher average net selling prices, increased tons sold and an $831,000
reduction in cost of sales from the sale of emission reduction credits, as described in Note 2 of the Notes to the
Consolidated Financial Statements. Net income was negatively affected by higher freight, materials and packaging
costs. Freight costs increased significantly due to record high fuel prices which impacted our truck, rail and ship
distribution channels. Materials costs were driven upward by the high cost of fuel used to dry our clay-based products
and to transport raw materials. The cost of purchased packaging materials increased due to price increases in the resin
and paper markets. The Business to Business Products Group contributed to the improved net income as higher net
selling prices overcame lower volume and increased costs; however, in the Retail and Wholesale Products Group the
higher costs prevailed over increases in both net selling prices and volume.
BUSINESS TO BUSINESS PRODUCTS GROUP
Net sales of the Business to Business Products Group for fiscal 2008 were $75,048,000, an increase of
$5,436,000, or 8%, from net sales of $69,612,000 in fiscal 2007. Total tons sold for the Group were down 3%
compared to fiscal 2007; however, higher average net selling prices provided for increased sales in fiscal 2008. Net
sales of fluids purification products, co-packaged cat litter products and animal health and nutrition products all
increased. Net sales of bleaching earth and fluids purification products increased 22% due to higher average net selling
prices and 8% more tons sold. The increased tonnage was the result of additional business opportunities in both
domestic and export markets and in the biodiesel production industry. Our co-packaged traditional coarse cat litter net
sales were up 4% in fiscal 2008. Selling price increases and a new co-packaging customer offset a 4% decline in tons
sold. Tons sold decreased as coarse cat litter sales continued to decline in the overall cat litter market while scoopablecat litter sales continued to increase. Net sales of animal health and nutrition products rose 10% primarily due to
increased tons sold and increased average net selling prices for our mycotoxin binder and animal feed binder products.
In contrast, net sales of agricultural chemical carriers were down 5% due to 11% lower tons sold caused by continued
market erosion from the growth of genetically modified seed and seed treatments. Tons sold for the Group’s Flo-Fre
product line (a by-product of the manufacture of our agricultural chemical carriers) also declined; however, the impact
of lower volume was offset by a higher average net selling price which resulted in an increase in net sales. Net sales of
sports field products were down as the result of the loss of a customer.
The Business to Business Products Group’s operating income increased 19% to $15,782,000 in fiscal 2008
from $13,302,000 in fiscal 2007. Average net selling price increases were partially offset by approximately 6% higher
combined freight, materials and packaging costs. Freight costs increased approximately 23% due to higher diesel fuel
prices. Packaging costs were driven upward by price increases in the resin and paper markets. Selling andadministrative expenses were only 1% higher in fiscal 2008 compared to fiscal 2007. Higher marketing costs in fiscal
2008 were mostly offset by lower bad debt expense. Bad debt expense was higher in fiscal 2007 due to the write-off of
a receivable from a sports product customer.
RETAIL ANDWHOLESALE PRODUCTS GROUP
Net sales of the Retail and Wholesale Products Group for fiscal 2008 were $157,311,000, an increase of
$14,806,000, or 10%, from net sales of $142,505,000 reported in fiscal 2007. The net sales growth was driven by
increases in both overall net selling prices and tons sold. The Group’s total tons sold were up 9%, including an 18%
increase in cat litter tons. Net sales of private label cat litter increased 35% due to selling price increases and 29% more
volume. The higher volume was the result of expanded distribution to existing customers, as well as distribution tonew customers. The Group’s net sales were also positively impacted by reduced trade spending costs (trade spending
costs are reported as a reduction of net sales). Partially offsetting these net sales increases was a 1% reduction in
branded cat litter net sales due to loss of a customer. Net sales of synthetic and clay-based industrial absorbents were
also both down 1% due to lower volume.
30
The Retail and Wholesale Products Group’s operating income decreased 7% to $14,973,000 in fiscal 2008
from $16,162,000 in fiscal 2007 due to higher costs. The Group’s combined freight, materials and packaging costs
increased approximately 6% during fiscal 2008. Record high fuel prices resulted in freight costs approximately 16%
higher than in fiscal 2007. The Group’s product margins were also negatively impacted by higher packaging and
materials costs as described above. These higher costs exceeded the improvement in the Group’s net sales. Selling and
administrative expenses were 9% lower in fiscal 2008 compared to fiscal 2007. In fiscal 2007 advertising costs werehigher due to packaging re-design and market research costs.
CONSOLIDATED RESULTS
Consolidated gross profit as a percentage of net sales in fiscal 2008 decreased to 20% from 22% in fiscal
2007. Cost of sales for fiscal 2008 was reduced by $831,000 as a result of the sale of emission reduction credits, as
described in Note 2 of the Notes to the Consolidated Financial Statements, which increased our consolidated gross
profit as a percentage of net sales for fiscal 2008 by approximately 1%. Increased average net selling prices in fiscal
2008 did not overcome increased freight, materials and packaging costs. Gross profit was further reduced by a 5%
increase in the cost of fuel used in the manufacturing process in fiscal 2008 compared to fiscal 2007.
Selling, general and administrative expenses as a percentage of net sales in fiscal 2008 decreased to 14% fromthe 17% in fiscal 2007. The discussion of the Groups’ operating income above describes the fluctuation in the selling,
general and administrative expenses that were allocated to our operating segments. The remaining unallocated
corporate expenses were lower in fiscal 2008 due primarily to decreases in the estimated incentive bonus and audit
fees. The lower fiscal 2008 incentive bonus expense was based on performance targets that are established for each
year. Audit expense was higher in fiscal 2007 when we became an accelerated filer and were required for the first time
to comply with the requirements of Section 404 of the Sarbanes-Oxley Act of 2002.
Interest expense in fiscal 2008 decreased $200,000 from fiscal 2007 due to a reduction in debt outstanding.
Interest income in fiscal 2008 decreased $345,000 from fiscal 2007 due to lower average interest rates that offset the
benefits of higher average investment balances.
Other income in fiscal 2008 decreased $506,000 from fiscal 2007. Other income in fiscal 2007 included
proceeds received from life insurance policies on former employees.
Our effective tax rate was 26% of pre-tax income in fiscal 2008 versus 27% in fiscal 2007. The effective
tax rate was lower in fiscal 2008 primarily due to an increased deduction for mining depletion.
Total assets increased $6,901,000, or 5%, during fiscal 2008. Current assets increased $4,351,000, or 6%,
from the fiscal 2007 year-end balances primarily due to increased accounts receivable, investments in Treasury
securities and inventories. These increases were partially offset by decreased cash and cash equivalents. These
changes are described in the Liquidity and Capital Resources section below. Other assets increased $2,555,000 from
fiscal 2007 due to the $1,300,000 purchase of strategic intangible assets for the Retail and Wholesale Products Group
and a lease receivable relating to a co-packaging agreement for the Business to Business Products Group.
Property, plant and equipment, net of accumulated depreciation, was consistent with the year-end balance in
fiscal 2007. Capital expenditures for fiscal 2008 were approximately equal to depreciation expense.
Total liabilities decreased $483,000, or 1%, during fiscal 2008. Noncurrent liabilities decreased $3,179,000,
due to payment on long term debt. This decrease was partially offset by increases in the accrued postretirement
benefits and deferred compensation, as described in Notes 9 and 10, respectively, of the Notes to the Consolidated
Financial Statements. Current liabilities increased $2,696,000, or 10%, during fiscal 2008. The changes in current
liabilities are described in the Liquidity and Capital Resources section below.
FOREIGNOPERATIONS
Net sales by our foreign subsidiaries during fiscal 2009 were $13,447,000, or 6% of total company net sales.
This represents a decrease of $4,140,000, or 24%, from fiscal 2008, in which foreign subsidiary net sales were
$17,587,000, or 8% of total company net sales. Net sales and tons sold decreased in both our Canadian and United
Kingdom subsidiaries. Industrial absorbent sales were down for both subsidiaries as the worldwide economic
slowdown impacted sales through reduced orders. Aggressive competition in the Canadian cat litter market also
31
resulted in some reduced sales and the loss of a customer. In addition, the British Pound was approximately 5%
weaker and the Canadian Dollar was approximately 17% weaker against the U.S. Dollar for fiscal 2009 compared to
fiscal 2008, which resulted in lower sales values after translation to U.S. Dollars. For fiscal 2009 our foreign
subsidiaries reported a net loss of $559,000, a decrease of $1,444,000 from the $885,000 net income reported in fiscal
2008. The lower tons sold and currency impacts described above contributed to the net loss, along with increased
material and freight costs. Identifiable assets of our foreign subsidiaries as of July 31, 2009 were $9,692,000 comparedto $10,857,000 as of July 31, 2008. Most of the decrease in identifiable assets was in cash and cash equivalents,
accounts receivable and inventories.
Net sales by our foreign subsidiaries during fiscal 2008 were $17,587,000, or 8% of total company net sales.
This represents an increase of $630,000, or 4%, from fiscal 2007, in which foreign subsidiary net sales were
$16,957,000, or 8% of total company net sales. Net sales increased in both our Canadian and United Kingdom
subsidiaries. Our Canadian subsidiary’s net sales increase was primarily due to a higher net selling price that overcame
lower tons sold. The lower volume was primarily in private label cat litter sales due to the loss of a customer. For
fiscal 2008 our foreign subsidiaries reported net income of $885,000, an increase of $555,000 from the $330,000 net
income reported in fiscal 2007. Net selling price increases improved results for both our Canadian and United
Kingdom subsidiaries. Our Canadian subsidiary also obtained a greater portion of a raw material from an alternative
lower cost source during fiscal 2008. Our Swiss subsidiary reported lower income taxes in fiscal 2008 due toadditional taxes recognized in fiscal 2007 related to the repatriation of untaxed earnings. Identifiable assets of our
foreign subsidiaries as of July 31, 2008 were $10,857,000 compared to $9,775,000 as of July 31, 2007. Most of the
increase in identifiable assets was in cash and cash equivalents, inventories and accounts receivable.
LIQUIDITY AND CAPITAL RESOURCES
Our principal capital requirements include funding working capital needs, the purchasing and upgrading of
real estate, equipment and facilities, and investing in infrastructure and potential acquisitions. We have principally
used cash generated from operations and, to the extent needed, issuance of debt securities and borrowings under our
credit facilities to fund these requirements. Cash and cash equivalents totaled $11,839,000, $6,848,000 and
$12,133,000 at July 31, 2009, 2008 and 2007, respectively. As of July 31, 2009 there were no outstandingborrowings under our revolving credit facility with Harris N.A.
The following table sets forth certain elements of our Consolidated Statements of Cash Flows (in thousands):
Net cash provided by operating activities
In fiscal 2009 net cash provided by operations was $15,814,000, an increase of $4,473,000 from fiscal 2008,
due primarily to an increase in other liabilities and changes in working capital. Other liabilities increased in fiscal 2009
due to higher postretirement benefit liabilities based on actuarially calculated benefit obligations and lower pension
asset values as of July 31, 2009. See Note 9 of the Notes to the Consolidated Financial Statements for more
information regarding our employee benefit plans. Deferred compensation increased $394,000 due to continued
deferrals and earnings on deferred balances in excess of payouts. The other significant changes in working capital are
described below.
In fiscal 2008 net cash provided by operations was $11,341,000, a decrease of $5,510,000 from fiscal 2007,
due primarily to changes in working capital and an increase in other assets that offset an increase in other liabilities.
Other assets increased due primarily to a lease receivable relating to a co-packaging agreement in the Business to
Business Products Group. Other liabilities increased due to higher postretirement benefit liabilities.
Fiscal Year Ended
July 31,
2009
July 31,
2008
July 31,
2007
Net cash provided by operating activities $ 15,814 $ 11,341 $ 16,851
Net cash used in investing activities ( 2,189) (10,890) (5,467)
Net cash used in financing activities (9,082) (5,666) (5,546)
Effect of exchange rate changes on cash and cash equivalents 448 (70) (312)
Net increase (decrease) in cash and cash equivalents 4,991 (5,285) 5,526
32
The changes in the primary components of working capital that impacted operating cash flows for these years
are as follows:
Accounts receivable, less allowance for doubtful accounts, decreased $2,383,000 at fiscal year-end 2009
compared to fiscal year-end 2008. The decrease was due primarily to lower fiscal 2009 fourth quarter sales,
particularly during the month of July. Accounts receivable, less allowance for doubtful accounts, increased $3,450,000at fiscal year-end 2008 compared to fiscal year-end 2007. The increase was due in part to strong fiscal 2008 fourth
quarter net sales which were 10% greater than fiscal 2007 fourth quarter net sales.
Inventories were up slightly at fiscal year-end 2009 compared to fiscal year-end 2008 due to a higher finished
goods inventory that offset a lower packaging inventory. Inventories increased by $2,507,000 at fiscal year-end 2008
compared to fiscal year-end 2007 reflecting the higher cost of materials, packaging and fuel and increased inventory
levels. Inventory levels increased due to production planning and service level requirements.
Accounts payable decreased $2,187,000 at fiscal year-end 2009 compared to fiscal year-end 2008 as the result
of fewer purchases due to lower sales and production levels during the fourth quarter of fiscal 2009. Similarly, accrued
freight decreased $1,272,000 and other accrued expenses decreased $732,000 at fiscal year-end 2009. Accounts
payable increased $1,310,000 at fiscal year-end 2008 compared to fiscal year-end 2007 due primarily to higher costsfor purchased items, particularly energy and packaging. Timing of payments also impacts all year-end accounts
payable balances.
Net cash used in investing activities
Cash used in investing activities was $2,189,000 in fiscal 2009 versus $10,890,000 in fiscal 2008. During
fiscal 2009 net dispositions of investment securities was $13,037,000 compared to net purchases of investment
securities of $2,331,000 in fiscal 2008. In fiscal 2009 proceeds from disposition of investment securities were used to
fund higher requirements for capital expenditures and debt payments. In addition, during fiscal 2008 we modified our
investment strategy to allocate a greater portion of our financial resources to investments versus cash. Purchases and
dispositions of investment securities in both periods are also subject to variations in the timing of investment maturities.Capital expenditures were $15,253,000 during fiscal 2009 compared to $7,302,000 in fiscal 2008. Significant capital
projects related to new product development at our manufacturing facilities and the purchase of land used cash in fiscal
2009. During fiscal 2008 we also used $1,300,000 to purchase strategic intangible assets in the Retail and Wholesale
Products Group.
Cash used in investing activities was $10,890,000 in fiscal 2008 versus $5,467,000 in fiscal 2007. During
fiscal 2008 net purchases of investment securities were $2,331,000 compared to net dispositions of $2,233,000 in fiscal
2007. During fiscal 2008 we modified our investment strategy to allocate a greater portion of our financial resources to
investments versus cash. Purchases and dispositions of investment securities in both periods are also subject to
variations in the timing of investment maturities. During fiscal 2008 we also used $1,300,000 to purchase strategic
intangible assets in the Retail and Wholesale Products Group. Capital expenditures were $455,000 lower in fiscal 2008
compared to fiscal 2007.
Net cash used in financing activities
Cash used in financing activities was $9,082,000 in fiscal 2009 compared to $5,666,000 in fiscal 2008. We
used cash in fiscal 2009 primarily for principal payments on long-term debt, dividends and purchases of treasury stock.
Payments on long-term debt were $1,500,000 higher in fiscal 2009 in accordance with our debt agreements. Cash
used to purchase treasury stock was $636,000 higher in fiscal 2009. Dividends paid were $307,000 higher in fiscal
2009 due to a dividend increase. In addition, proceeds from issuance of treasury stock and Common Stock during
fiscal 2009 were $811,000 lower as a result of less stock option exercise activity.
Cash used in financing activities was $5,666,000 in fiscal 2008 compared to $5,546,000 in fiscal 2007. Weused cash in fiscal 2008 primarily for principal payments on long-term debt and dividends. Dividend payments were
$339,000 higher in fiscal 2008 due to a dividend increase; however, proceeds from issuance of treasury stock and
Common Stock during fiscal 2008 were $363,000 higher as a result of more stock option exercise activity.
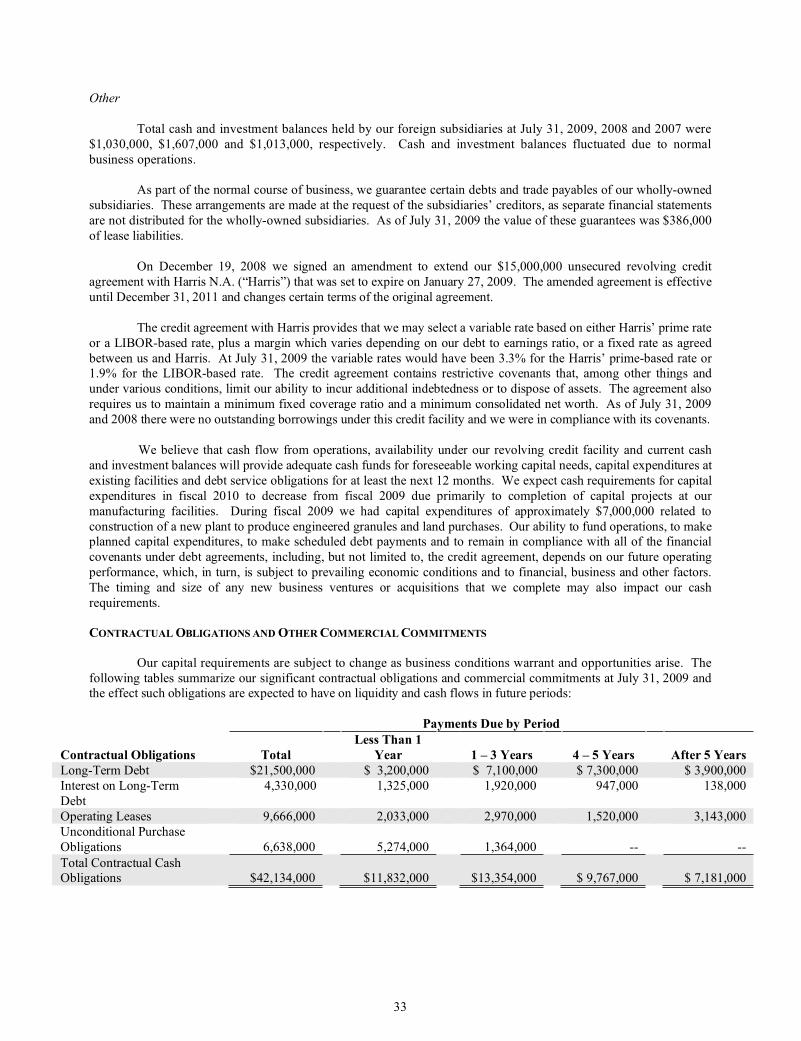
33
Other
Total cash and investment balances held by our foreign subsidiaries at July 31, 2009, 2008 and 2007 were
$1,030,000, $1,607,000 and $1,013,000, respectively. Cash and investment balances fluctuated due to normal
business operations.
As part of the normal course of business, we guarantee certain debts and trade payables of our wholly-owned
subsidiaries. These arrangements are made at the request of the subsidiaries’ creditors, as separate financial statements
are not distributed for the wholly-owned subsidiaries. As of July 31, 2009 the value of these guarantees was $386,000
of lease liabilities.
On December 19, 2008 we signed an amendment to extend our $15,000,000 unsecured revolving credit
agreement with Harris N.A. (“Harris”) that was set to expire on January 27, 2009. The amended agreement is effective
until December 31, 2011 and changes certain terms of the original agreement.
The credit agreement with Harris provides that we may select a variable rate based on either Harris’ prime rate
or a LIBOR-based rate, plus a margin which varies depending on our debt to earnings ratio, or a fixed rate as agreed
between us and Harris. At July 31, 2009 the variable rates would have been 3.3% for the Harris’ prime-based rate or1.9% for the LIBOR-based rate. The credit agreement contains restrictive covenants that, among other things and
under various conditions, limit our ability to incur additional indebtedness or to dispose of assets. The agreement also
requires us to maintain a minimum fixed coverage ratio and a minimum consolidated net worth. As of July 31, 2009
and 2008 there were no outstanding borrowings under this credit facility and we were in compliance with its covenants.
We believe that cash flow from operations, availability under our revolving credit facility and current cash
and investment balances will provide adequate cash funds for foreseeable working capital needs, capital expenditures at
existing facilities and debt service obligations for at least the next 12 months. We expect cash requirements for capital
expenditures in fiscal 2010 to decrease from fiscal 2009 due primarily to completion of capital projects at our
manufacturing facilities. During fiscal 2009 we had capital expenditures of approximately $7,000,000 related to
construction of a new plant to produce engineered granules and land purchases. Our ability to fund operations, to makeplanned capital expenditures, to make scheduled debt payments and to remain in compliance with all of the financial
covenants under debt agreements, including, but not limited to, the credit agreement, depends on our future operating
performance, which, in turn, is subject to prevailing economic conditions and to financial, business and other factors.
The timing and size of any new business ventures or acquisitions that we complete may also impact our cash
requirements.
CONTRACTUALOBLIGATIONSANDOTHERCOMMERCIALCOMMITMENTS
Our capital requirements are subject to change as business conditions warrant and opportunities arise. The
following tables summarize our significant contractual obligations and commercial commitments at July 31, 2009 andthe effect such obligations are expected to have on liquidity and cash flows in future periods:
Payments Due by Period
Contractual Obligations Total
Less Than 1
Year 1 – 3 Years 4 – 5 Years After 5 Years
Long-Term Debt $21,500,000 $ 3,200,000 $ 7,100,000 $ 7,300,000 $ 3,900,000
Interest on Long-Term
Debt
4,330,000 1,325,000 1,920,000 947,000 138,000
Operating Leases 9,666,000 2,033,000 2,970,000 1,520,000 3,143,000
Unconditional Purchase
Obligations 6,638,000 5,274,000 1,364,000 -- --
Total Contractual CashObligations $42,134,000 $11,832,000 $13,354,000 $ 9,767,000 $ 7,181,000
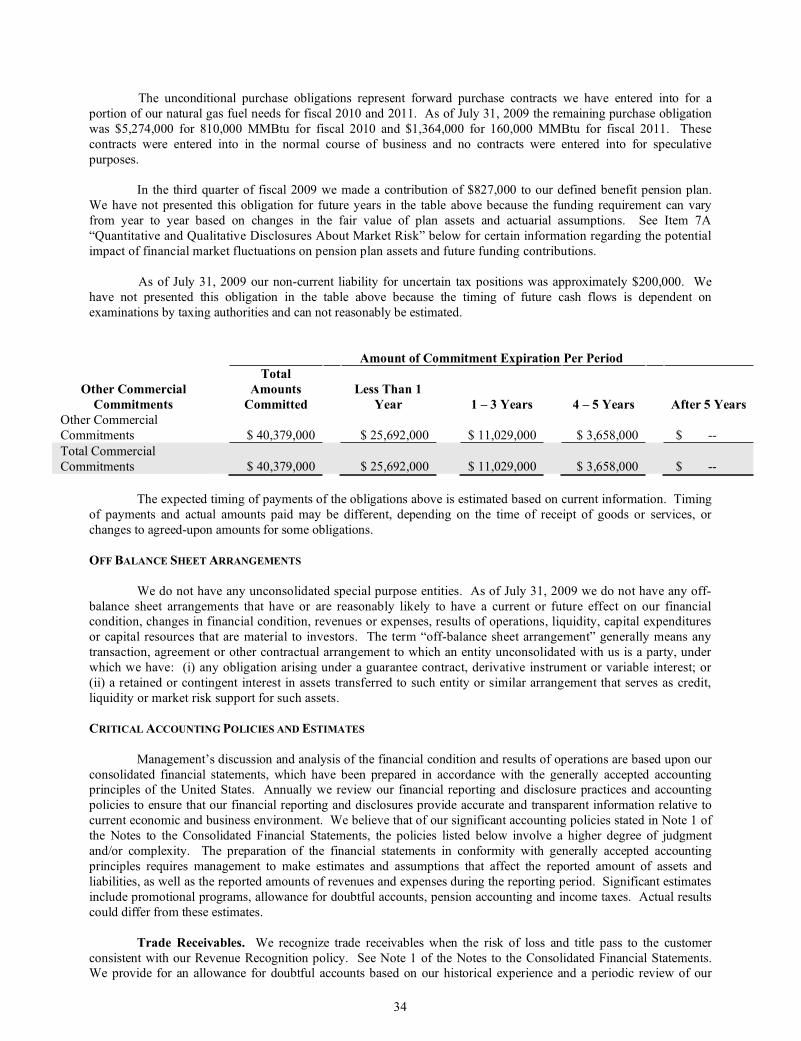
34
The unconditional purchase obligations represent forward purchase contracts we have entered into for a
portion of our natural gas fuel needs for fiscal 2010 and 2011. As of July 31, 2009 the remaining purchase obligation
was $5,274,000 for 810,000 MMBtu for fiscal 2010 and $1,364,000 for 160,000 MMBtu for fiscal 2011. These
contracts were entered into in the normal course of business and no contracts were entered into for speculative
purposes.
In the third quarter of fiscal 2009 we made a contribution of $827,000 to our defined benefit pension plan.
We have not presented this obligation for future years in the table above because the funding requirement can vary
from year to year based on changes in the fair value of plan assets and actuarial assumptions. See Item 7A
“Quantitative and Qualitative Disclosures About Market Risk” below for certain information regarding the potential
impact of financial market fluctuations on pension plan assets and future funding contributions.
As of July 31, 2009 our non-current liability for uncertain tax positions was approximately $200,000. We
have not presented this obligation in the table above because the timing of future cash flows is dependent on
examinations by taxing authorities and can not reasonably be estimated.
Amount of Commitment Expiration Per Period
Other Commercial
Commitments
Total
Amounts
Committed
Less Than 1
Year 1 – 3 Years 4 – 5 Years After 5 Years
Other Commercial
Commitments $ 40,379,000 $ 25,692,000 $ 11,029,000 $ 3,658,000 $ --
Total Commercial
Commitments $ 40,379,000 $ 25,692,000 $ 11,029,000 $ 3,658,000 $ --
The expected timing of payments of the obligations above is estimated based on current information. Timing
of payments and actual amounts paid may be different, depending on the time of receipt of goods or services, or
changes to agreed-upon amounts for some obligations.
OFF BALANCE SHEET ARRANGEMENTS
We do not have any unconsolidated special purpose entities. As of July 31, 2009 we do not have any off-
balance sheet arrangements that have or are reasonably likely to have a current or future effect on our financialcondition, changes in financial condition, revenues or expenses, results of operations, liquidity, capital expenditures
or capital resources that are material to investors. The term “off-balance sheet arrangement” generally means any
transaction, agreement or other contractual arrangement to which an entity unconsolidated with us is a party, under
which we have: (i) any obligation arising under a guarantee contract, derivative instrument or variable interest; or
(ii) a retained or contingent interest in assets transferred to such entity or similar arrangement that serves as credit,
liquidity or market risk support for such assets.
CRITICAL ACCOUNTING POLICIES AND ESTIMATES
Management’s discussion and analysis of the financial condition and results of operations are based upon our
consolidated financial statements, which have been prepared in accordance with the generally accepted accountingprinciples of the United States. Annually we review our financial reporting and disclosure practices and accounting
policies to ensure that our financial reporting and disclosures provide accurate and transparent information relative to
current economic and business environment. We believe that of our significant accounting policies stated in Note 1 of
the Notes to the Consolidated Financial Statements, the policies listed below involve a higher degree of judgment
and/or complexity. The preparation of the financial statements in conformity with generally accepted accounting
principles requires management to make estimates and assumptions that affect the reported amount of assets and
liabilities, as well as the reported amounts of revenues and expenses during the reporting period. Significant estimates
include promotional programs, allowance for doubtful accounts, pension accounting and income taxes. Actual results
could differ from these estimates.
Trade Receivables. We recognize trade receivables when the risk of loss and title pass to the customer
consistent with our Revenue Recognition policy. See Note 1 of the Notes to the Consolidated Financial Statements.We provide for an allowance for doubtful accounts based on our historical experience and a periodic review of our
35
accounts receivable, including a review of the overall aging of accounts and analysis of specific accounts. A customer
is determined to be uncollectible when we have completed our internal collection procedures, including termination of
shipments, direct customer contact and formal demand of payment. We believe our allowance for doubtful accounts is
reasonable; however, the unanticipated default by a customer with a material trade receivable could occur. We
recorded an allowance for doubtful accounts of $652,000 and $614,000 at July 31, 2009 and 2008, respectively.
Inventories. We value inventories at the lower of cost (first-in, first-out) or market. Inventory costs
include the cost of raw materials, packaging supplies, labor and other overhead costs. We perform a detailed review
of our inventory items to determine if an obsolescence reserve adjustment is necessary. The review surveys all of
our operating facilities and sales divisions to ensure that both historical issues and new market trends are considered.
The allowance not only considers specific items, but also takes into consideration the overall value of the inventory
as of the balance sheet date. The inventory obsolescence reserve values at July 31, 2009 and 2008 were $274,000
and $138,000, respectively.
Reclamation. During the normal course of our overburden removal activities we perform on-going
reclamation activities. As overburden is removed from a pit, it is hauled to a previously mined pit and used to refill
older sites. This process allows us to continuously reclaim older pits and dispose of overburden simultaneously,
therefore minimizing the liability of the reclamation process.
On an annual basis we evaluate our potential reclamation liability in accordance with Statement of Financial
Accounting Standards (“SFAS”) No. 143, Accounting for Asset Retirement Obligations and with Financial Accounting
Standards Board (“FASB”) Interpretation No. 47 (as amended), Accounting for Conditional Asset Retirement
Obligations. As of July 31, 2009 and 2008 we have recorded an estimated net reclamation asset of $301,000 and
$320,000, respectively, and a corresponding estimated reclamation liability of $813,000 and $718,000, respectively.
These values represent the discounted present value of the estimated future mining reclamation costs at the production
plants. The reclamation assets are depreciated over the estimated useful lives of the various mines. The reclamation
liabilities are increased based on a yearly accretion charge, once again over the estimated useful lives of the mines.
Accounting for reclamation obligations requires that we make estimates unique to each mining operation ofthe future costs we will incur to complete the reclamation work required to comply with existing laws and regulations.
Actual costs incurred in the future could differ from estimated amounts. Future changes to environmental laws could
increase the extent of reclamation work required. Any such increases in future costs could materially impact the
amount incurred for reclamation costs.
Impairment of goodwill, trademarks and other intangible assets. We review carrying values of goodwill,
trademarks and other indefinite lived intangible assets periodically for possible impairment in accordance with SFAS
No. 142, Goodwill and Other Intangible Assets. Our impairment review is based on a discounted cash flow approach
that requires significant judgment with respect to volume, revenue, expense growth rates and the selection of an
appropriate discount rate. Impairment occurs when the carrying value exceeds the fair value. Our impairment analysis
is performed in the first quarter of the fiscal year and we use judgment in assessing whether assets may have become
impaired between annual valuations. Indicators such as unexpected adverse economic factors, unanticipatedtechnological changes, competitive activities and acts by governments and courts may indicate that an asset has become
impaired. Our analysis in the first quarter of fiscal 2009 did not indicate any impairment. We continue to monitor
events, circumstances or changes in the business that might imply a reduction in value and might lead to impairment.
Trade Promotions and Advertising. We routinely commit to one-time or ongoing trade promotion
programs in our Retail and Wholesale Products Group. Promotional reserves are provided for sales incentives made
directly to consumers, such as coupons, and sales incentives made to customers, such as slotting, discounts based on
sales volume, cooperative marketing programs and other arrangements. All such trade promotion costs are netted
against sales. Promotional reserves are established based on our best estimate of the amounts necessary to settle
future and existing claims on products sold as of the balance sheet date. To estimate trade promotion reserves, we
rely on our historical experience with trade spending patterns and that of the industry, current trends and forecasteddata. While we believe our promotional reserves are reasonable and that appropriate judgments have been made,
estimated amounts could differ from future obligations.
Advertising costs include printed materials, participation in industry conventions and shows and market
research. Advertising costs for print media are expensed when the advertising occurs. All other advertising costs
are expensed when incurred. All advertising costs are part of selling, general and administrative expenses.
36
We have accrued liabilities at the end of each period for the estimated trade spending and advertising
programs. We recorded liabilities of $2,073,000 and $2,126,000 for trade promotions and advertising at July 31,
2009 and 2008, respectively.
Stock-Based Compensation. We account for stock options and restricted stock issued under ourlong term incentive plans in accordance with SFAS No. 123 (revised 2004), Share-Based Payment (“SFAS No. 123-
R”). SFAS No. 123-R requires the determination of the fair value of stock-based compensation at the grant date and
the recognition in the financial statements of the related compensation expense over the appropriate vesting period.
The fair value of stock-based compensation was estimated on the grant date using the Black-Scholes Option Pricing
Method. This method requires management to make certain estimates, including estimating the expected term of
stock options, expected volatility of our stock and expected dividends. In addition, judgment is required in
estimating the amount of stock-based awards that are expected to be forfeited. If actual results differ significantly
from these estimates or different key assumptions were used, it could have a material effect on our Consolidated
Financial Statements. We recognized share-based compensation expense of $332,000 in fiscal 2009 and $669,000
in fiscal 2008, net of related tax effect. These amounts include expense related to stock option grants and
amortization of restricted stock.
Pension and Postretirement Benefit Costs. We calculate our pension and postretirement benefit obligations
and the related effects on results of operations using actuarial models. To measure the expense and obligations, we
must make a variety of estimates including critical assumptions for the discount rate used to value certain liabilities and
the expected return on plan assets set aside to fund these costs. We evaluate these critical assumptions at least annually.
Other assumptions involving demographic factors, such as retirement age, mortality and turnover, are evaluated
periodically and are updated to reflect actual experience. As these assumptions change from period to period,
recorded pension and postretirement benefit amounts and funding requirements could also change. Actual results in
any given year will often differ from actuarial assumptions because of economic and other factors.
The discount rate is the rate assumed to measure the single amount that, if invested at the measurement date
in a portfolio of high-quality debt instruments, would provide the necessary future cash flows to pay the pensionbenefits when due. The discount rate is subject to change each year. We refer to an applicable index and the expected
duration of the benefit payments to select a discount rate at which we believe the benefits could be effectively settled.
The discount rate for fiscal 2009 and 2008 was the single equivalent rate that would yield the same present value as the
plan’s expected cashflows discounted with spot rates on a yield curve of investment-grade corporate bonds. The yield
curve is the Citigroup Pension Liability Index. In fiscal 2007, the discount rate assumption was a benchmark rate based
on the Citigroup Pension Liability Index. Our determination of pension expense or income is based on a market-related
valuation of plan assets, which is the fair market value. Our expected rate of return on plan assets is determined based
on asset allocations and historical experience. The expected long-term rate of inflation and risk premiums for the
various asset categories are based on general historical returns and inflation rates. The target allocation of assets is used
to develop a composite rate of return assumption. See Note 9 of the Notes to the Consolidated Financial Statements
for additional information.
Income Taxes. Our effective tax rate is based on expected income, statutory tax rates and tax planning
opportunities available to us in various jurisdictions in which we operate. Significant judgment is required in
determining our effective tax rate and in evaluating our tax positions.
We determine our current and deferred taxes in accordance with SFAS No. 109, Accounting for Income
Taxes. The tax effect of the expected reversal of tax differences is recorded at rates currently enacted for each
jurisdiction in which we operate. To the extent that temporary differences will result in future tax benefit, we must
estimate the timing of their reversal and whether taxable operating income in future periods will be sufficient to
fully recognize any deferred tax assets. We maintain valuation allowances where it is likely that all or a portion of a
deferred tax asset will not be realized. Changes in valuation allowances from period to period are included in the
income tax provision in the period of change. In determining whether a valuation allowance is warranted, we takeinto account such factors as prior earnings history, expected future earnings and other factors that could effect the
realization of deferred tax assets. We recorded valuation allowances for income taxes of $3,222,000 and $2,462,000
at July 31, 2009 and 2008, respectively. The valuation allowance at July 31, 2009 has been established for the full
amount of the deferred tax benefit related to our alternative minimum tax credit carryforwards since we believe it is
more likely than not that the benefit of these credits will not be realized. See Note 6 of the Notes to the Consolidated
Financial Statements for further discussion.
37
NEWACCOUNTING PRONOUNCEMENTS
Recently Adopted Accounting Standards
On August 1, 2008 we adopted the required portions of SFAS No. 157, Fair Value Measurements, and its
subsequent amendments. The adoption of this Statement did not have a material impact on our consolidated
financial statements. This Statement defines fair value, establishes a framework for measuring fair value in
accordance with generally accepted accounting principles and expands disclosures about fair value measurements.
In February 2008 SFAS No. 157 was amended by FASB Staff Position (“FSP”) SFAS No. 157-1, Application of
FASB Statement No. 157 to FASB Statement No. 13 and Other Accounting Pronouncements That Address Fair
Value Measurements for Purposes of Lease Classification or Measurement under Statement 13. FSP SFAS No.
157-1 amends SFAS No. 157 to exclude FASB Statement No. 13, Accounting for Leases and other accounting
pronouncements that address fair value measurements for purposes of lease classification or measurement. SFAS
No. 157 was further amended by FSP SFAS No. 157-3, Determining the Fair Value of a Financial Asset When the
Market for That Asset is Not Active and by FSP SFAS No. 157-4, Determining Fair Value When the Volume and
Level of Activity for the Asset or Liability Have Significantly Decreased and Identifying Transactions That Are Not
Orderly. See Note 5 of the Notes to the Consolidated Financial Statements for the description of our adoption of
SFAS No. 157, as amended.
In February 2008 the FASB issued SFAS No. 157-2, Effective Date of FASB Statement No. 157. FSP
SFAS No. 157-2 delays the effective date of SFAS No. 157 for nonfinancial assets and nonfinancial liabilities,
except for items that are recognized or disclosed at fair value in the financial statements on a recurring basis (at least
annually). We will apply SFAS No. 157 to nonfinancial assets and liabilities for the first quarter ending October 31,
2009 of our fiscal year 2010. We do not believe adoption of these delayed portions will have a material impact on
our consolidated financial statements.
In February 2007 the FASB issued FASB Statement No. 159, The Fair Value Option for Financial Assetsand Financial Liabilities. SFAS No. 159 permits entities to choose to measure many financial instruments and
certain other items at fair value at specified election dates. Unrealized gains and losses on items for which the fair
value option has been elected will be reported in earnings at each subsequent reporting date. The Statement also
establishes presentation and disclosure requirements relating to items measured at fair value. We adopted this
Statement as of August 1, 2008. We did not elect the Fair Value Option for any of our financial assets or liabilities;
therefore, the adoption of FAS No. 159 had no impact on our consolidated financial statements.
On August 1, 2008 we adopted the Emerging Issues Task Force (“EITF”) consensus on Issue No. 06-11,
Accounting for Income Tax Benefits of Dividends on Share-Based Payment Awards (“EITF 06-11”). EITF 06-11
requires that the tax benefit related to dividend and dividend equivalents paid on equity-classified nonvested shares
and nonvested share units, which are expected to vest, be recorded as an increase to additional paid-in capital. The
adoption of EITF 06-11 had an insignificant impact on our consolidated financial statements.
As of July 31, 2009 we adopted FSP SFAS No. 115-2 and SFAS No. 124-2, Recognition and Presentation
of Other-Than Temporary Impairment. We had no investments in debt securities as of July 31, 2009; therefore, this
FSP had no impact on our consolidated financial statements. This FSP amends the other-than-temporary
impairment guidance in U.S. GAAP for debt securities by clarifying the interaction of the factors that should be
considered when determining whether a debt security is other than temporarily impaired and by improving the
related presentation and disclosure for such debt and equity securities in the financial statements.
For our fiscal year ended July 31, 2009 we adopted SFAS No. 165, Subsequent Events, which establishes
general standards of accounting for and disclosure of events that occur after the balance sheet date but before
financial statements are issued or available to be issued that are not addressed in other generally accepted accountingprinciples. See Principles of Consolidation and Basis of Presentation in Note 1 of the Notes to the Consolidated
Financial Statements.
38
Recently Issued Accounting Standards
In April 2009 the FASB issued FSP SFAS No. 107-1 and APB 28-1, Interim Disclosures about Fair Value
of Financial Instruments. This FSP requires a publicly traded company to include disclosures about the fair value of
its financial instruments whenever it issues summarized financial information for interim reporting periods. ThisFSP is effective for interim periods ending after June 15, 2009 with early adoption permitted for periods ending after
March 15, 2009. We will adopt this pronouncement for the first quarter ending October 31, 2009 of our fiscal year
2010. We do not believe this FSP will have a material impact on our consolidated financial statements.
In April 2009 the FASB issued FSP FAS No. 141R-1, Accounting for Assets Acquired and Liabilities
Assumed in a Business Combination That Arise from Contingencies. This FSP addresses issues on initial recognition
and measurement, subsequent measurement and accounting, and disclosure of assets and liabilities arising from
contingencies in a business combination. This pronouncement is effective for assets and liabilities arising from
contingencies in business combinations for which the acquisition date is on or after the beginning of the first annual
reporting period beginning on or after December 15, 2008. We adopted FSP SFAS No. 141-R as of August 1, 2009
and will apply its provisions to future business combinations.
In December 2008 the FASB issued FSP SFAS No. 132R-1, Employers’ Disclosures about Postretirement
Benefit Plan Assets. This FSP amends SFAS No. 132 (Revised 2003), Employers’ Disclosures about Pensions and
Other Postretirement Benefits, to expand the disclosure requirements for employers’ pension and other
postretirement benefit plan assets. FSP SFAS No. 132R-1 requires employers to disclose information about fair
value measurements of plan assets, the investment policies and strategies for the major categories of plan assets and
significant concentrations of risk within plan assets. We will adopt this FSP in our consolidated financial statements
for the fiscal year ending July 31, 2010 on a prospective basis. We are currently evaluating the impact FSP FAS
132R-1 will have on our consolidated financial statements.
In November 2008 the FASB issued FSP EITF No. 08-7, Accounting for Defensive Intangible Assets. This
FSP clarifies the definition and accounting for defensive intangible assets acquired in a business combination or anasset acquisition. This FSP states that, upon acquisition, an intangible asset must be recognized at fair value in
accordance with SFAS No. 157, Fair Value Measurement, regardless of how the acquiring entity intends to use the
asset. The intangible asset should be amortized over a useful life approximated by the period over which it is
expected to provide direct and indirect cash flows benefits resulting from the limitation against others to use the
intangible asset. We adopted FSP EITF No. 08-7 as of August 1, 2009 and will apply its provisions to future
intangible asset acquisitions.
In June 2008 the FASB issued FSP EITF No. 03-6-1, Determining Whether Instruments Granted in Share-
Based Payment Transactions Are Participating Securities. This FSP states that unvested share-based payment
awards that contain nonforfeitable rights to dividends or dividend equivalents (whether paid or unpaid) are
participating securities and shall be included in the computation of earnings per share pursuant to the two-class
method. We will adopt FSP EITF No. 03-6-1 for the first quarter ending October 31, 2009 of our fiscal year 2010.We do not believe this FSP will have a material impact on our consolidated financial statements or our earnings per
share.
In December 2007 the FASB issued SFAS No. 160, Noncontrolling Interests in Consolidated Financial
Statements—An Amendment of ARB No. 51. This statement establishes new accounting and reporting standards for
the noncontrolling interest in a subsidiary and for the deconsolidation of a subsidiary. SFAS No. 160 requires the
noncontrolling interest to be reported as a component of equity, changes in a parent’s ownership interest while the
parent retains its controlling interest be accounted for as equity transactions, and any retained noncontrolling equity
investment upon the deconsolidation of a subsidiary be initially measured at fair value. We adopted this Statement
as of August 1, 2009. The adoption of SFAS No. 160 did not have a material impact on our consolidated financial
statements.
39
ITEM 7A – QUANTITATIVE AND QUALITATIVE DISCLOSURES ABOUT MARKET RISK
We are exposed to interest rate risk and employ policies and procedures to manage our exposure to changes in
the market risk of our cash equivalents and short-term investments. We had two offsetting interest rate swap
agreements with the same counterparty as of July 31, 2009. We believe that the market risk arising from holdings ofour financial instruments is not material.
We are exposed to foreign currency fluctuation risk, primarily U.S. Dollar/British Pound, U.S. Dollar/Euro
and U.S. Dollar/Canadian Dollar, as it relates to certain accounts receivables and our foreign operations. Foreign
currency denominated accounts receivable is a small fraction of our consolidated accounts receivable. We are also
subject to translation exposure of our foreign subsidiaries’ financial statements. In recent years, our foreign
subsidiaries have not generated a substantial portion of our consolidated net sales or net income. We do not enter into
any hedge contracts in an attempt to offset any adverse effect of changes in currency exchange rates. We believe that
the foreign currency fluctuation risk is immaterial to our consolidated financial statements.
We are exposed to market risk at it relates to the investments of plan assets under our defined benefit pension
plan. The fair value of these assets is subject to change due to fluctuations in the financial markets. The decline in theequity markets resulted in a lower value of our pension plan assets as of July 31, 2009. The lower asset value may
increase our pension expense for fiscal 2010 and may increase the amount and accelerate the timing of future funding
contributions.
We are exposed to regulatory risk in the fluids purification, agricultural and animal health markets, principally
as a result of the risk of increasing regulation of the food chain in the United States and Europe. We actively monitor
developments in this area, both directly and through trade organizations of which we are a member.
We are exposed to commodity price risk with respect to fuel. We contract for a portion of our anticipated fuel
needs using forward purchase contracts to mitigate the volatility of our kiln fuel prices. As of July 31, 2009 we have
purchased natural gas contracts representing approximately 40% of our planned kiln fuel needs for fiscal 2010. Weestimate the weighted average cost of these natural gas contracts in fiscal 2010 to be approximately 36% lower than the
contracts in fiscal 2009; however, this average will change if we continue to buy natural gas contracts. We have also
purchased contracts for a portion of our fuel requirements for fiscal 2011 to take advantage of declines in gas prices.
All contracts are related to the normal course of business and no contracts are entered into for speculative purposes.
40
The following table provides information about our natural gas future contracts, which are sensitive to changes in
commodity prices, specifically natural gas prices. For the future contracts, the table presents the notional amounts in
MMBtu’s, the weighted average contract prices, and the total dollar contract amount, which will mature by July 31,
2010 and 2011. The Fair Value was determined using the “Most Recent Settle” price for the “Henry Hub Natural Gas”
option contract prices as listed by the New York Mercantile Exchange on September 30, 2009.
Commodity Price Sensitivity
Natural Gas Future Contracts
For the Year Ending July 31, 2010
Expected 2010
MaturityFair Value
Natural Gas Future Volumes (MMBtu) 810,000 --
Weighted Average Price (Per MMBtu) $6.51 --
Contract Amount ($ U.S., in thousands) $5,274 $3,778
Commodity Price Sensitivity
Natural Gas Future Contracts
For the Year Ending July 31, 2011
Expected 2011 Maturity Fair Value
Natural Gas Future Volumes (MMBtu) 160,000 --
Weighted Average Price (Per MMBtu) $8.53 --
Contract Amount ($ U.S., in thousands) $1,364 $ 1,069
Factors that could influence the fair value of the natural gas contracts, include, but are not limited to, the
creditworthiness of our natural gas suppliers, the overall general economy, developments in world events, the
general demand for natural gas by the manufacturing sector, seasonality and the weather patterns throughout the
United States and the world. Some of these same events have allowed us to mitigate the impact of the natural gas
contracts by the continued, and in some cases expanded, use of recycled oil in our manufacturing processes.
Accurate estimates of the impact that these contracts may have on our fiscal 2010 financial results are difficult tomake due to the inherent uncertainty of future fluctuations in option contract prices in the natural gas options
market.
Please also see Item 1A “Risk Factors” above for a discussion of these and other risks and uncertainties we
face in our business.
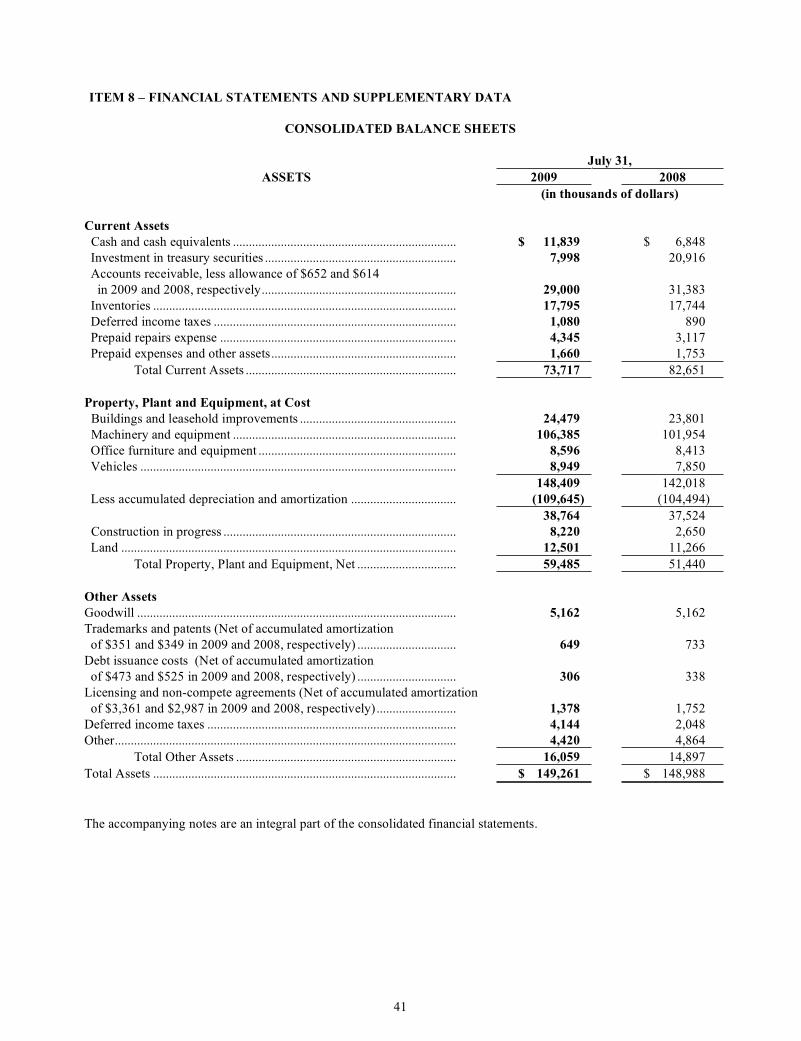
41
ITEM 8 – FINANCIAL STATEMENTS AND SUPPLEMENTARY DATA
CONSOLIDATED BALANCE SHEETS
July 31,
ASSETS 2009 2008
(in thousands of dollars)
Current Assets
Cash and cash equivalents ...................................................................... $ 11,839 $ 6,848
Investment in treasury securities ............................................................ 7,998 20,916
Accounts receivable, less allowance of $652 and $614
in 2009 and 2008, respectively............................................................. 29,000 31,383
Inventories ............................................................................................... 17,795 17,744
Deferred income taxes ............................................................................ 1,080 890
Prepaid repairs expense .......................................................................... 4,345 3,117
Prepaid expenses and other assets.......................................................... 1,660 1,753
Total Current Assets .................................................................. 73,717 82,651
Property, Plant and Equipment, at Cost
Buildings and leasehold improvements ................................................. 24,479 23,801
Machinery and equipment ...................................................................... 106,385 101,954
Office furniture and equipment .............................................................. 8,596 8,413
Vehicles ................................................................................................... 8,949 7,850
148,409 142,018
Less accumulated depreciation and amortization ................................. (109,645) (104,494)
38,764 37,524
Construction in progress ......................................................................... 8,220 2,650
Land ......................................................................................................... 12,501 11,266
Total Property, Plant and Equipment, Net ............................... 59,485 51,440
Other Assets
Goodwill .................................................................................................... 5,162 5,162
Trademarks and patents (Net of accumulated amortization
of $351 and $349 in 2009 and 2008, respectively) ............................... 649 733
Debt issuance costs (Net of accumulated amortization
of $473 and $525 in 2009 and 2008, respectively) ............................... 306 338
Licensing and non-compete agreements (Net of accumulated amortization
of $3,361 and $2,987 in 2009 and 2008, respectively)......................... 1,378 1,752
Deferred income taxes .............................................................................. 4,144 2,048
Other........................................................................................................... 4,420 4,864
Total Other Assets ..................................................................... 16,059 14,897
Total Assets ............................................................................................... $ 149,261 $ 148,988
The accompanying notes are an integral part of the consolidated financial statements.
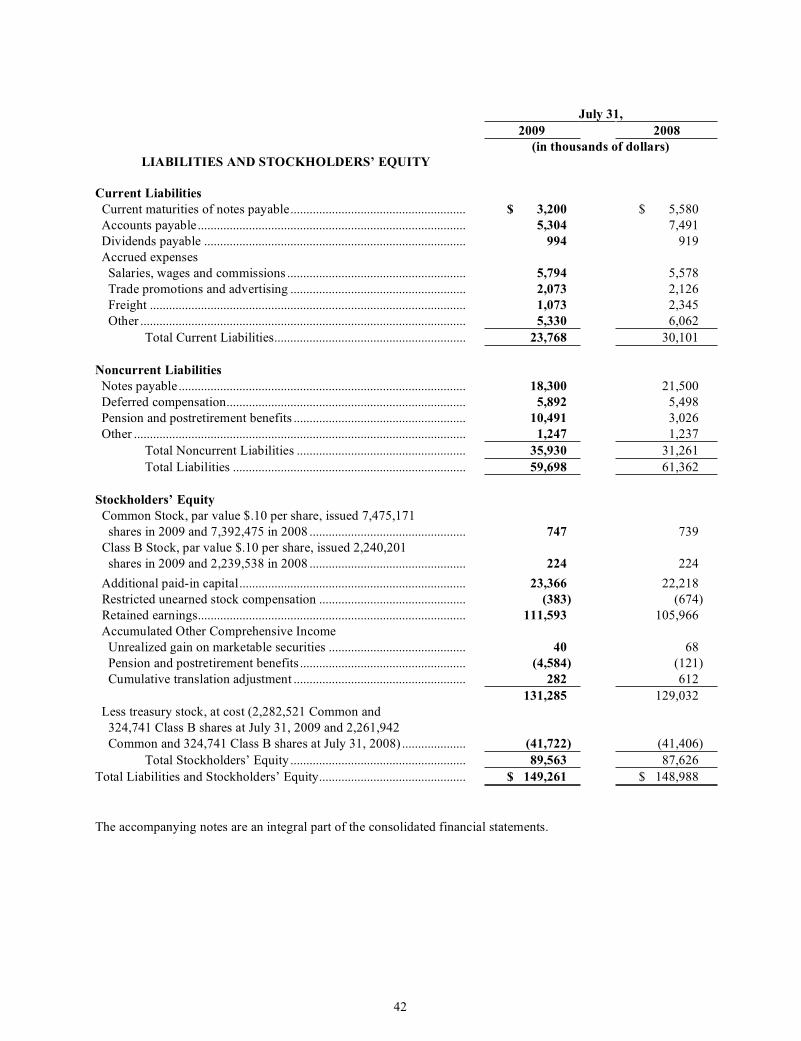
42
July 31,
2009 2008
LIABILITIES AND STOCKHOLDERS’ EQUITY
(in thousands of dollars)
Current Liabilities
Current maturities of notes payable....................................................... $ 3,200 $ 5,580
Accounts payable.................................................................................... 5,304 7,491
Dividends payable .................................................................................. 994 919
Accrued expenses
Salaries, wages and commissions ........................................................ 5,794 5,578
Trade promotions and advertising ....................................................... 2,073 2,126
Freight ................................................................................................... 1,073 2,345
Other ...................................................................................................... 5,330 6,062
Total Current Liabilities............................................................ 23,768 30,101
Noncurrent Liabilities
Notes payable.......................................................................................... 18,300 21,500
Deferred compensation........................................................................... 5,892 5,498
Pension and postretirement benefits ...................................................... 10,491 3,026
Other ........................................................................................................ 1,247 1,237
Total Noncurrent Liabilities ..................................................... 35,930 31,261
Total Liabilities ......................................................................... 59,698 61,362
Stockholders’ Equity
Common Stock, par value $.10 per share, issued 7,475,171
shares in 2009 and 7,392,475 in 2008 ................................................. 747 739
Class B Stock, par value $.10 per share, issued 2,240,201
shares in 2009 and 2,239,538 in 2008 ................................................. 224 224
Additional paid-in capital....................................................................... 23,366 22,218
Restricted unearned stock compensation .............................................. (383) (674)
Retained earnings.................................................................................... 111,593 105,966
Accumulated Other Comprehensive Income
Unrealized gain on marketable securities ........................................... 40 68
Pension and postretirement benefits .................................................... (4,584) (121)
Cumulative translation adjustment ...................................................... 282 612
131,285 129,032
Less treasury stock, at cost (2,282,521 Common and
324,741 Class B shares at July 31, 2009 and 2,261,942
Common and 324,741 Class B shares at July 31, 2008) .................... (41,722) (41,406)
Total Stockholders’ Equity ....................................................... 89,563 87,626
Total Liabilities and Stockholders’ Equity.............................................. $ 149,261 $ 148,988
The accompanying notes are an integral part of the consolidated financial statements.
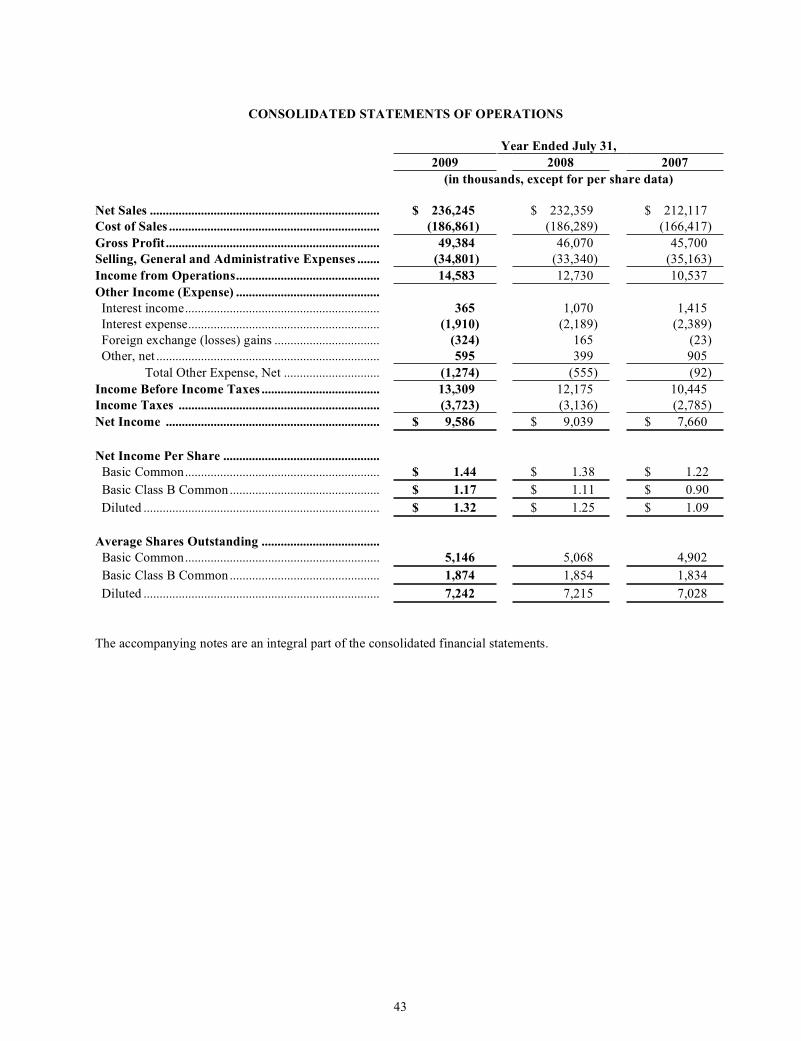
43
CONSOLIDATED STATEMENTS OF OPERATIONS
Year Ended July 31,
2009 2008 2007
(in thousands, except for per share data)
Net Sales ........................................................................ $ 236,245 $ 232,359 $ 212,117
Cost of Sales .................................................................. (186,861) (186,289) (166,417)
Gross Profit................................................................... 49,384 46,070 45,700
Selling, General and Administrative Expenses ....... (34,801) (33,340) (35,163)
Income from Operations............................................. 14,583 12,730 10,537
Other Income (Expense) .............................................
Interest income............................................................. 365 1,070 1,415
Interest expense............................................................ (1,910) (2,189) (2,389)
Foreign exchange (losses) gains ................................. (324) 165 (23)
Other, net ...................................................................... 595 399 905
Total Other Expense, Net .............................. (1,274) (555) (92)
Income Before Income Taxes ..................................... 13,309 12,175 10,445
Income Taxes ............................................................... (3,723) (3,136) (2,785)
Net Income ................................................................... $ 9,586 $ 9,039 $ 7,660
Net Income Per Share .................................................
Basic Common............................................................. $ 1.44 $ 1.38 $ 1.22
Basic Class B Common............................................... $ 1.17 $ 1.11 $ 0.90
Diluted .......................................................................... $ 1.32 $ 1.25 $ 1.09
Average Shares Outstanding .....................................
Basic Common............................................................. 5,146 5,068 4,902
Basic Class B Common............................................... 1,874 1,854 1,834
Diluted .......................................................................... 7,242 7,215 7,028
The accompanying notes are an integral part of the consolidated financial statements.
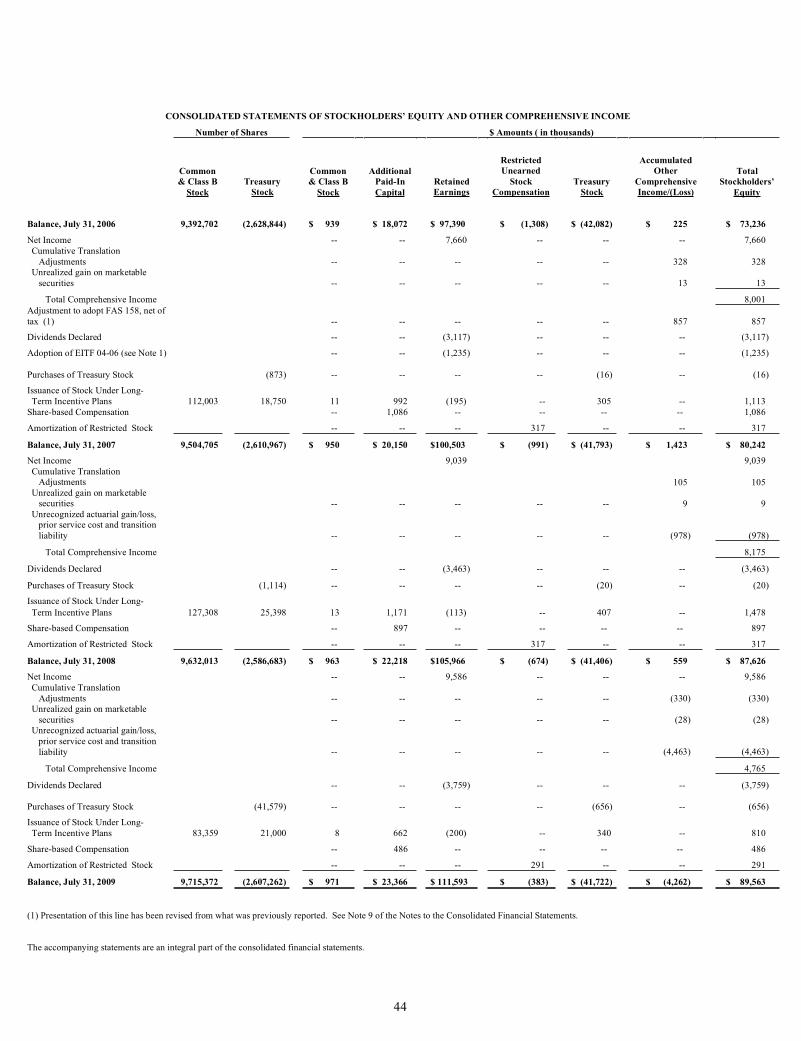
44
CONSOLIDATED STATEMENTS OF STOCKHOLDERS’ EQUITY AND OTHER COMPREHENSIVE INCOME
Number of Shares $ Amounts ( in thousands)
Common
& Class B
Stock
Treasury
Stock
Common
& Class B
Stock
Additional
Paid-In
Capital
Retained
Earnings
Restricted
Unearned
Stock
Compensation
Treasury
Stock
Accumulated
Other
Comprehensive
Income/(Loss)
Total
Stockholders’
Equity
Balance, July 31, 2006 9,392,702 (2,628,844) $ 939 $ 18,072 $ 97,390 $ (1,308) $ (42,082) $ 225 $ 73,236
Net Income -- -- 7,660 -- -- -- 7,660
Cumulative Translation
Adjustments -- -- -- -- -- 328 328Unrealized gain on marketable
securities -- -- -- -- -- 13 13
Total Comprehensive Income 8,001
Adjustment to adopt FAS 158, net of
tax (1) -- -- -- -- -- 857 857
Dividends Declared -- -- (3,117) -- -- -- (3,117)
Adoption of EITF 04-06 (see Note 1) -- -- (1,235) -- -- -- (1,235)
Purchases of Treasury Stock (873) -- -- -- -- (16) -- (16)
Issuance of Stock Under Long-
Term Incentive Plans 112,003 18,750 11 992 (195) -- 305 -- 1,113
Share-based Compensation -- 1,086 -- -- -- -- 1,086
Amortization of Restricted Stock -- -- -- 317 -- -- 317
Balance, July 31, 2007 9,504,705 (2,610,967) $ 950 $ 20,150 $100,503 $ (991) $ (41,793) $ 1,423 $ 80,242
Net Income 9,039 9,039
Cumulative TranslationAdjustments 105 105Unrealized gain on marketablesecurities -- -- -- -- -- 9 9Unrecognized actuarial gain/loss,prior service cost and transition
liability -- -- -- -- -- (978) (978)
Total Comprehensive Income 8,175
Dividends Declared -- -- (3,463) -- -- -- (3,463)
Purchases of Treasury Stock (1,114) -- -- -- -- (20) -- (20)
Issuance of Stock Under Long-
Term Incentive Plans 127,308 25,398 13 1,171 (113) -- 407 -- 1,478
Share-based Compensation -- 897 -- -- -- -- 897
Amortization of Restricted Stock -- -- -- 317 -- -- 317
Balance, July 31, 2008 9,632,013 (2,586,683) $ 963 $ 22,218 $105,966 $ (674) $ (41,406) $ 559 $ 87,626
Net Income -- -- 9,586 -- -- -- 9,586
Cumulative Translation
Adjustments -- -- -- -- -- (330) (330)Unrealized gain on marketable
securities -- -- -- -- -- (28) (28)Unrecognized actuarial gain/loss,
prior service cost and transition
liability -- -- -- -- -- (4,463) (4,463)
Total Comprehensive Income 4,765
Dividends Declared -- -- (3,759) -- -- -- (3,759)
Purchases of Treasury Stock (41,579) -- -- -- -- (656) -- (656)
Issuance of Stock Under Long-
Term Incentive Plans 83,359 21,000 8 662 (200) -- 340 -- 810
Share-based Compensation -- 486 -- -- -- -- 486
Amortization of Restricted Stock -- -- -- 291 -- -- 291
Balance, July 31, 2009 9,715,372 (2,607,262) $ 971 $ 23,366 $ 111,593 $ (383) $ (41,722) $ (4,262) $ 89,563
(1) Presentation of this line has been revised from what was previously reported. See Note 9 of the Notes to the Consolidated Financial Statements.
The accompanying statements are an integral part of the consolidated financial statements.
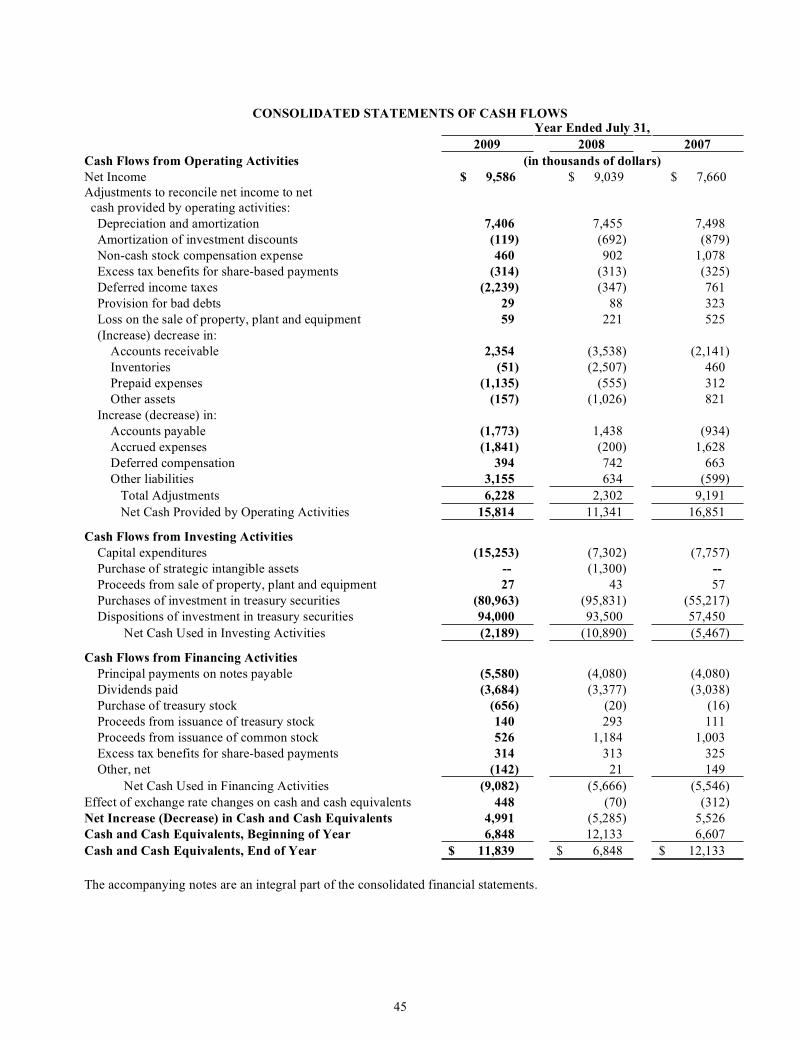
45
CONSOLIDATED STATEMENTS OF CASH FLOWSYear Ended July 31,
2009 2008 2007
Cash Flows from Operating Activities (in thousands of dollars)
Net Income $ 9,586 $ 9,039 $ 7,660
Adjustments to reconcile net income to net
cash provided by operating activities:
Depreciation and amortization 7,406 7,455 7,498
Amortization of investment discounts (119) (692) (879)
Non-cash stock compensation expense 460 902 1,078
Excess tax benefits for share-based payments (314) (313) (325)
Deferred income taxes (2,239) (347) 761
Provision for bad debts 29 88 323
Loss on the sale of property, plant and equipment 59 221 525
(Increase) decrease in:
Accounts receivable 2,354 (3,538) (2,141)
Inventories (51) (2,507) 460
Prepaid expenses (1,135) (555) 312
Other assets (157) (1,026) 821
Increase (decrease) in:
Accounts payable (1,773) 1,438 (934)
Accrued expenses (1,841) (200) 1,628
Deferred compensation 394 742 663
Other liabilities 3,155 634 (599)
Total Adjustments 6,228 2,302 9,191
Net Cash Provided by Operating Activities 15,814 11,341 16,851
Cash Flows from Investing Activities
Capital expenditures (15,253) (7,302) (7,757)
Purchase of strategic intangible assets -- (1,300) --
Proceeds from sale of property, plant and equipment 27 43 57
Purchases of investment in treasury securities (80,963) (95,831) (55,217)
Dispositions of investment in treasury securities 94,000 93,500 57,450
Net Cash Used in Investing Activities (2,189) (10,890) (5,467)
Cash Flows from Financing Activities
Principal payments on notes payable (5,580) (4,080) (4,080)
Dividends paid (3,684) (3,377) (3,038)
Purchase of treasury stock (656) (20) (16)
Proceeds from issuance of treasury stock 140 293 111
Proceeds from issuance of common stock 526 1,184 1,003
Excess tax benefits for share-based payments 314 313 325
Other, net (142) 21 149
Net Cash Used in Financing Activities (9,082) (5,666) (5,546)
Effect of exchange rate changes on cash and cash equivalents 448 (70) (312)
Net Increase (Decrease) in Cash and Cash Equivalents 4,991 (5,285) 5,526
Cash and Cash Equivalents, Beginning of Year 6,848 12,133 6,607
Cash and Cash Equivalents, End of Year $ 11,839 $ 6,848 $ 12,133
The accompanying notes are an integral part of the consolidated financial statements.
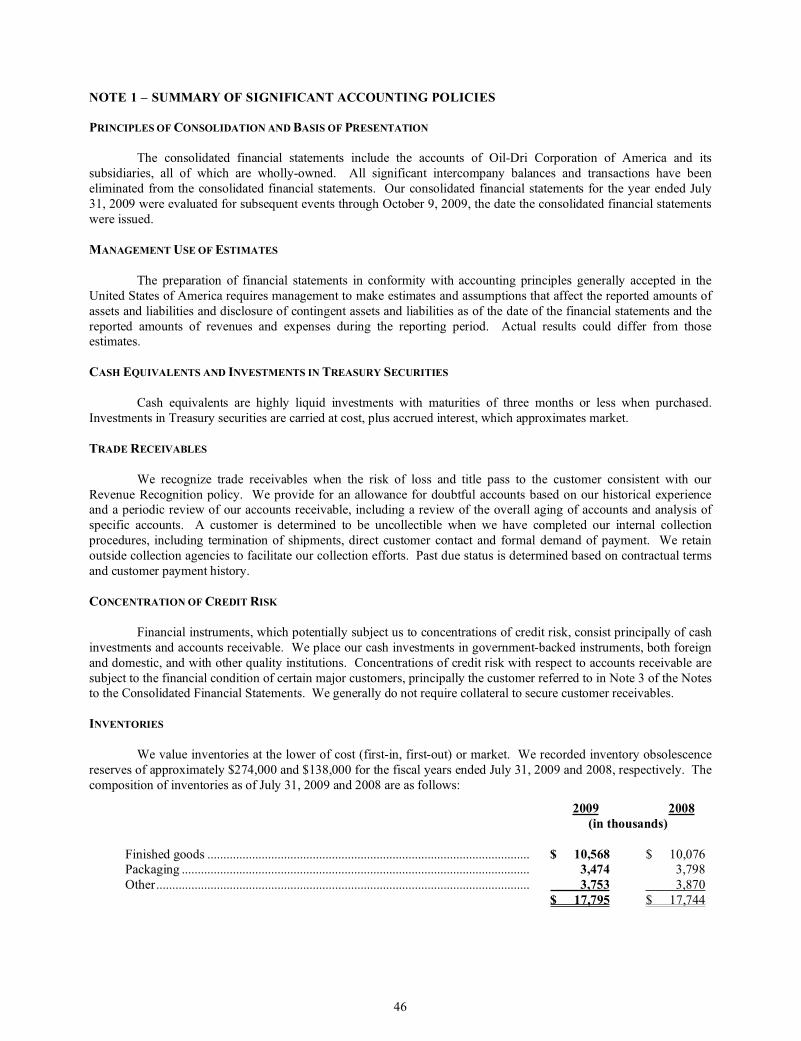
46
NOTE 1 – SUMMARY OF SIGNIFICANT ACCOUNTING POLICIES
PRINCIPLESOF CONSOLIDATION ANDBASIS OF PRESENTATION
The consolidated financial statements include the accounts of Oil-Dri Corporation of America and its
subsidiaries, all of which are wholly-owned. All significant intercompany balances and transactions have been
eliminated from the consolidated financial statements. Our consolidated financial statements for the year ended July
31, 2009 were evaluated for subsequent events through October 9, 2009, the date the consolidated financial statements
were issued.
MANAGEMENT USEOF ESTIMATES
The preparation of financial statements in conformity with accounting principles generally accepted in the
United States of America requires management to make estimates and assumptions that affect the reported amounts of
assets and liabilities and disclosure of contingent assets and liabilities as of the date of the financial statements and the
reported amounts of revenues and expenses during the reporting period. Actual results could differ from thoseestimates.
CASH EQUIVALENTS AND INVESTMENTS IN TREASURY SECURITIES
Cash equivalents are highly liquid investments with maturities of three months or less when purchased.
Investments in Treasury securities are carried at cost, plus accrued interest, which approximates market.
TRADE RECEIVABLES
We recognize trade receivables when the risk of loss and title pass to the customer consistent with our
Revenue Recognition policy. We provide for an allowance for doubtful accounts based on our historical experienceand a periodic review of our accounts receivable, including a review of the overall aging of accounts and analysis of
specific accounts. A customer is determined to be uncollectible when we have completed our internal collection
procedures, including termination of shipments, direct customer contact and formal demand of payment. We retain
outside collection agencies to facilitate our collection efforts. Past due status is determined based on contractual terms
and customer payment history.
CONCENTRATIONOF CREDIT RISK
Financial instruments, which potentially subject us to concentrations of credit risk, consist principally of cash
investments and accounts receivable. We place our cash investments in government-backed instruments, both foreign
and domestic, and with other quality institutions. Concentrations of credit risk with respect to accounts receivable are
subject to the financial condition of certain major customers, principally the customer referred to in Note 3 of the Notesto the Consolidated Financial Statements. We generally do not require collateral to secure customer receivables.
INVENTORIES
We value inventories at the lower of cost (first-in, first-out) or market. We recorded inventory obsolescence
reserves of approximately $274,000 and $138,000 for the fiscal years ended July 31, 2009 and 2008, respectively. The
composition of inventories as of July 31, 2009 and 2008 are as follows:
2009 2008
(in thousands)
Finished goods ..................................................................................................... $ 10,568 $ 10,076Packaging ............................................................................................................. 3,474 3,798
Other..................................................................................................................... 3,753 3,870
$ 17,795 $ 17,744
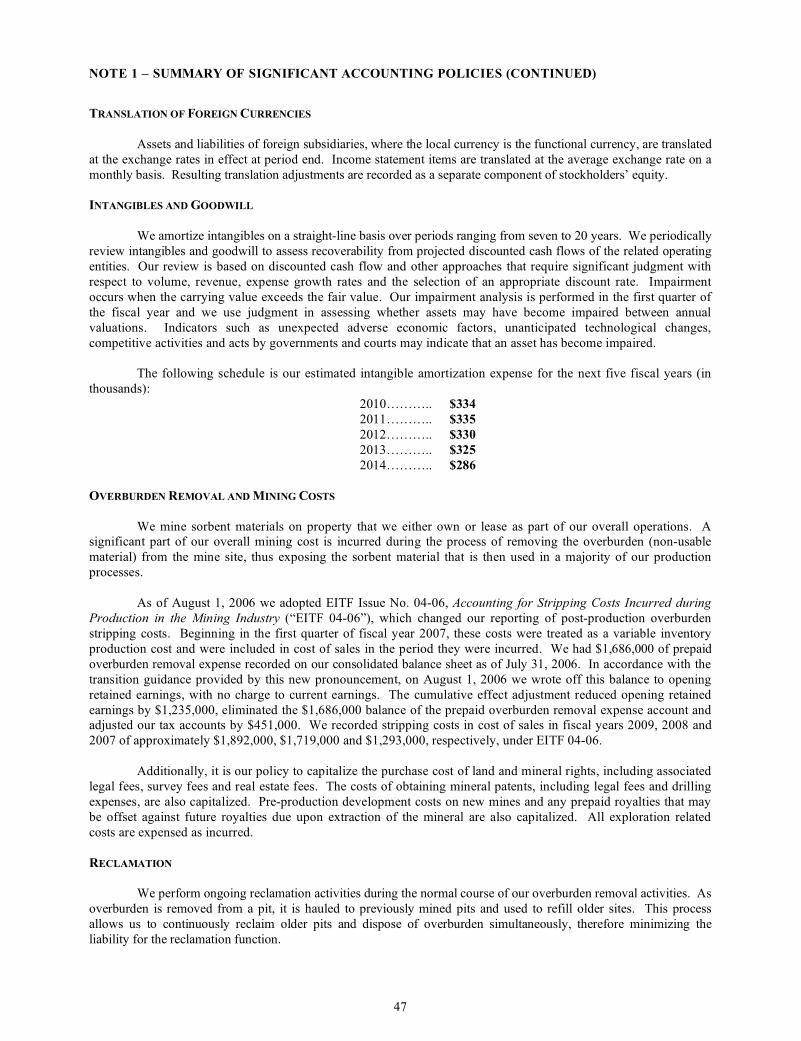
NOTE 1 – SUMMARY OF SIGNIFICANT ACCOUNTING POLICIES (CONTINUED)
47
TRANSLATION OF FOREIGN CURRENCIES
Assets and liabilities of foreign subsidiaries, where the local currency is the functional currency, are translated
at the exchange rates in effect at period end. Income statement items are translated at the average exchange rate on a
monthly basis. Resulting translation adjustments are recorded as a separate component of stockholders’ equity.
INTANGIBLES ANDGOODWILL
We amortize intangibles on a straight-line basis over periods ranging from seven to 20 years. We periodically
review intangibles and goodwill to assess recoverability from projected discounted cash flows of the related operating
entities. Our review is based on discounted cash flow and other approaches that require significant judgment with
respect to volume, revenue, expense growth rates and the selection of an appropriate discount rate. Impairment
occurs when the carrying value exceeds the fair value. Our impairment analysis is performed in the first quarter of
the fiscal year and we use judgment in assessing whether assets may have become impaired between annual
valuations. Indicators such as unexpected adverse economic factors, unanticipated technological changes,
competitive activities and acts by governments and courts may indicate that an asset has become impaired.
The following schedule is our estimated intangible amortization expense for the next five fiscal years (in
thousands):
2010……….. $334
2011……….. $335
2012……….. $330
2013……….. $325
2014……….. $286
OVERBURDEN REMOVAL ANDMINING COSTS
We mine sorbent materials on property that we either own or lease as part of our overall operations. Asignificant part of our overall mining cost is incurred during the process of removing the overburden (non-usable
material) from the mine site, thus exposing the sorbent material that is then used in a majority of our production
processes.
As of August 1, 2006 we adopted EITF Issue No. 04-06, Accounting for Stripping Costs Incurred during
Production in the Mining Industry (“EITF 04-06”), which changed our reporting of post-production overburden
stripping costs. Beginning in the first quarter of fiscal year 2007, these costs were treated as a variable inventory
production cost and were included in cost of sales in the period they were incurred. We had $1,686,000 of prepaid
overburden removal expense recorded on our consolidated balance sheet as of July 31, 2006. In accordance with the
transition guidance provided by this new pronouncement, on August 1, 2006 we wrote off this balance to opening
retained earnings, with no charge to current earnings. The cumulative effect adjustment reduced opening retained
earnings by $1,235,000, eliminated the $1,686,000 balance of the prepaid overburden removal expense account andadjusted our tax accounts by $451,000. We recorded stripping costs in cost of sales in fiscal years 2009, 2008 and
2007 of approximately $1,892,000, $1,719,000 and $1,293,000, respectively, under EITF 04-06.
Additionally, it is our policy to capitalize the purchase cost of land and mineral rights, including associated
legal fees, survey fees and real estate fees. The costs of obtaining mineral patents, including legal fees and drilling
expenses, are also capitalized. Pre-production development costs on new mines and any prepaid royalties that may
be offset against future royalties due upon extraction of the mineral are also capitalized. All exploration related
costs are expensed as incurred.
RECLAMATION
We perform ongoing reclamation activities during the normal course of our overburden removal activities. As
overburden is removed from a pit, it is hauled to previously mined pits and used to refill older sites. This process
allows us to continuously reclaim older pits and dispose of overburden simultaneously, therefore minimizing the
liability for the reclamation function.
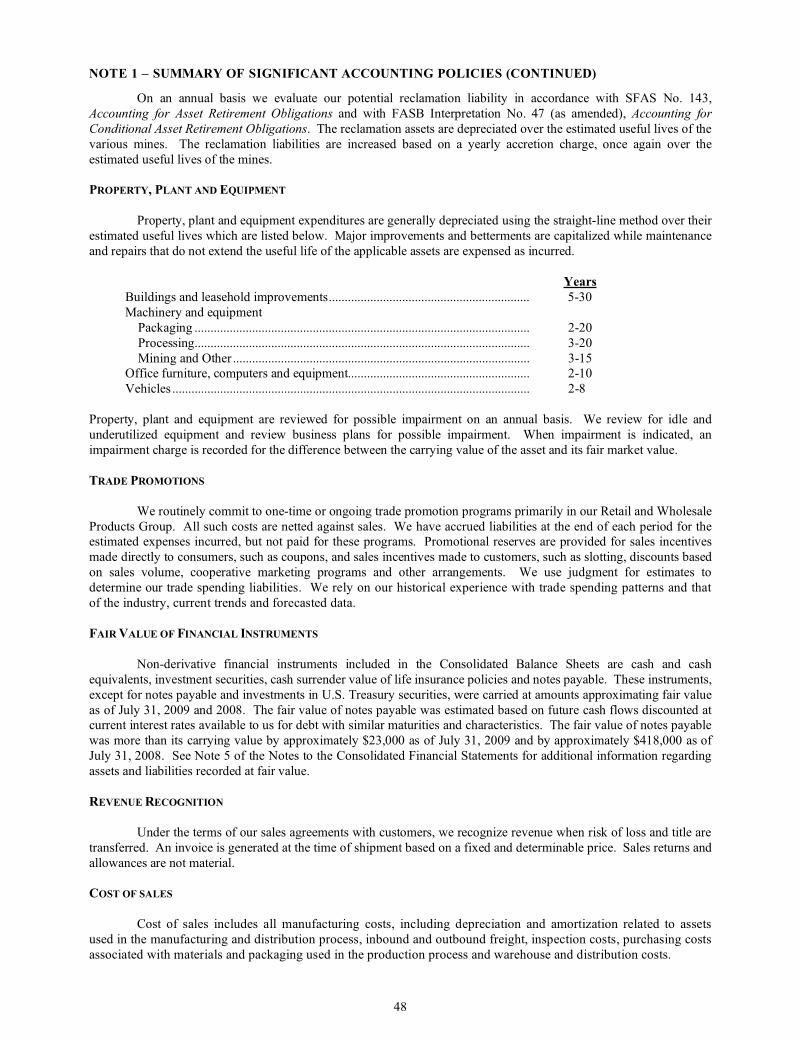
NOTE 1 – SUMMARY OF SIGNIFICANT ACCOUNTING POLICIES (CONTINUED)
48
On an annual basis we evaluate our potential reclamation liability in accordance with SFAS No. 143,
Accounting for Asset Retirement Obligations and with FASB Interpretation No. 47 (as amended), Accounting for
Conditional Asset Retirement Obligations. The reclamation assets are depreciated over the estimated useful lives of the
various mines. The reclamation liabilities are increased based on a yearly accretion charge, once again over the
estimated useful lives of the mines.
PROPERTY, PLANT AND EQUIPMENT
Property, plant and equipment expenditures are generally depreciated using the straight-line method over their
estimated useful lives which are listed below. Major improvements and betterments are capitalized while maintenance
and repairs that do not extend the useful life of the applicable assets are expensed as incurred.
Years
Buildings and leasehold improvements............................................................... 5-30
Machinery and equipment
Packaging ......................................................................................................... 2-20
Processing......................................................................................................... 3-20
Mining and Other ............................................................................................. 3-15Office furniture, computers and equipment......................................................... 2-10
Vehicles ................................................................................................................ 2-8
Property, plant and equipment are reviewed for possible impairment on an annual basis. We review for idle and
underutilized equipment and review business plans for possible impairment. When impairment is indicated, an
impairment charge is recorded for the difference between the carrying value of the asset and its fair market value.
TRADE PROMOTIONS
We routinely commit to one-time or ongoing trade promotion programs primarily in our Retail and Wholesale
Products Group. All such costs are netted against sales. We have accrued liabilities at the end of each period for theestimated expenses incurred, but not paid for these programs. Promotional reserves are provided for sales incentives
made directly to consumers, such as coupons, and sales incentives made to customers, such as slotting, discounts based
on sales volume, cooperative marketing programs and other arrangements. We use judgment for estimates to
determine our trade spending liabilities. We rely on our historical experience with trade spending patterns and that
of the industry, current trends and forecasted data.
FAIRVALUE OF FINANCIAL INSTRUMENTS
Non-derivative financial instruments included in the Consolidated Balance Sheets are cash and cash
equivalents, investment securities, cash surrender value of life insurance policies and notes payable. These instruments,
except for notes payable and investments in U.S. Treasury securities, were carried at amounts approximating fair value
as of July 31, 2009 and 2008. The fair value of notes payable was estimated based on future cash flows discounted atcurrent interest rates available to us for debt with similar maturities and characteristics. The fair value of notes payable
was more than its carrying value by approximately $23,000 as of July 31, 2009 and by approximately $418,000 as of
July 31, 2008. See Note 5 of the Notes to the Consolidated Financial Statements for additional information regarding
assets and liabilities recorded at fair value.
REVENUE RECOGNITION
Under the terms of our sales agreements with customers, we recognize revenue when risk of loss and title are
transferred. An invoice is generated at the time of shipment based on a fixed and determinable price. Sales returns and
allowances are not material.
COST OF SALES
Cost of sales includes all manufacturing costs, including depreciation and amortization related to assets
used in the manufacturing and distribution process, inbound and outbound freight, inspection costs, purchasing costs
associated with materials and packaging used in the production process and warehouse and distribution costs.
NOTE 1 – SUMMARY OF SIGNIFICANT ACCOUNTING POLICIES (CONTINUED)
49
SHIPPING ANDHANDLINGCOSTS
Shipping and handling costs are included in cost of sales and were $40,465,000, $42,567,000, and
$33,830,000 for the years ended July 31, 2009, 2008 and 2007, respectively.
SELLING, GENERAL AND ADMINISTRATIVE EXPENSES
Selling, general and administrative expenses include salaries, wages and benefits associated with staff
outside the manufacturing and distribution functions, all marketing related costs, any miscellaneous trade spending
expenses not required to be included in net sales, research and development costs, depreciation and amortization
related to assets outside the manufacturing and distribution process and all other non-manufacturing and non-
distribution expenses.
RESEARCH ANDDEVELOPMENT
Research and development costs of $2,099,000, $2,497,000, and $2,154,000 were charged to expense as
incurred for the years ended July 31, 2009, 2008 and 2007, respectively.
ADVERTISINGCOSTS
Advertising costs include printed materials, participation in industry conventions and shows and market
research. Advertising costs for print media are expensed when the advertising occurs. All other advertising costs
are expensed when incurred. All advertising costs are part of selling, general and administrative expenses.
Advertising expenses were $2,158,000, $1,054,000, and $1,473,000 for the years ended July 31, 2009, 2008 and 2007,
respectively.
PENSION AND POSTRETIREMENT BENEFIT COSTS
We provide a defined benefit pension plan for eligible salaried and hourly employees. We also provide apostretirement health benefit plan to domestic salaried employees who qualify under the plan’s provisions. Our
pension and postretirement health benefit plans are accounted for using actuarial valuations required by SFAS No. 87,
Employers’ Accounting for Pensions and SFAS No. 106, Employers’ Accounting for Postretirement Benefits Other
Than Pensions.
As of July 31, 2007, we adopted the provisions of SFAS No. 158, Employers’ Accounting for Defined
Benefit Pension and Other Postretirement Plans (“SFAS No. 158”). SFAS No. 158 requires the funded status of
our defined pension and postretirement health benefit plans to be recognized on the balance sheet. In addition,
changes in the funded status that arise during the period but are not recognized as components of net periodic benefit
cost are recognized within other comprehensive income, net of income tax. See Note 9 for additional information.
STOCK-BASED COMPENSATION
We account for stock options and restricted stock issued under our long term incentive plans in accordance
with SFAS No. 123-R. SFAS No. 123-R requires the determination of the fair value of stock-based compensation at
the grant date and the recognition in the financial statements of the related compensation expense over the
appropriate vesting period. We adopted SFAS No. 123-R on August 1, 2005, the beginning of our fiscal year 2006
using a modified prospective application. Under this application, we are required to record compensation expense
for all awards granted after the date of adoption and for the unvested portion of previously granted awards that were
outstanding at the date of adoption. See Note 8 for additional information.
INCOME TAXES
Deferred income tax assets and liabilities are recorded for the impact of temporary differences between the tax
basis of assets and liabilities and the amounts recognized for financial reporting purposes. Deferred tax assets are
reviewed and a valuation allowance is established if management believes that it is more likely than not that some
portion of our deferred tax assets will not be realized. Changes in valuation allowances from period to period are
included in the tax provision in the period of change.
NOTE 1 – SUMMARY OF SIGNIFICANT ACCOUNTING POLICIES (CONTINUED)
50
U.S. income tax expense and foreign withholding taxes are provided on remittances of foreign earnings and
on unremitted foreign earnings that are not indefinitely reinvested. Where unremitted foreign earnings are indefinitely
reinvested, no provision for federal or state tax expense is recorded. When circumstances change and we determine
that some or all of the undistributed earnings will be remitted in the foreseeable future, a corresponding expense is
accrued in the current period.
We adopted the provisions of FASB Interpretation No. 48, Accounting for Uncertainty in Income Taxes
(“FIN 48”) as of August 1, 2007. There were no material adjustments associated with the implementation of FIN
48. As of August 1, 2007 unrecognized tax benefits and accrued interest and penalties were not material. We
recognize interest and penalties accrued related to uncertain tax positions in income tax (benefit) expense.
We are subject to U.S. federal income tax as well as income tax in multiple state and foreign jurisdictions.
Our federal income tax return for the fiscal year ended July 31, 2008 remains open for future examination. Foreign
and U.S. state jurisdictions have statutes of limitations generally ranging from 3 to 5 years. The state impact of any
federal income tax changes remains subject to examination by various states for a period of up to one year after
formal notification to the states. There are no material open or unsettled federal, state, local or foreign income tax
audits. We believe our accrual for tax liabilities is adequate for all open audit years. On the basis of present
information, we do not anticipate the total unrecognized tax benefits will significantly change due to the settlementof audits or the expiration of statue of limitations in the next twelve months.
NEWACCOUNTING PRONOUNCEMENTS
Recently Adopted Accounting Standards
On August 1, 2008 we adopted the required portions of SFAS No. 157, Fair Value Measurements, and its
subsequent amendments. The adoption of this Statement did not have a material impact on our consolidated
financial statements. This Statement defines fair value, establishes a framework for measuring fair value in
accordance with generally accepted accounting principles and expands disclosures about fair value measurements.In February 2008 SFAS No. 157 was amended by FSP SFAS No. 157-1, Application of FASB Statement No. 157 to
FASB Statement No. 13 and Other Accounting Pronouncements That Address Fair Value Measurements for
Purposes of Lease Classification or Measurement under Statement 13. FSP SFAS No. 157-1 amends SFAS No. 157
to exclude FASB Statement No. 13, Accounting for Leases and other accounting pronouncements that address fair
value measurements for purposes of lease classification or measurement. SFAS No. 157 was further amended by
FSP SFAS No. 157-3, Determining the Fair Value of a Financial Asset When the Market for That Asset is Not
Active and by FSP SFAS No. 157-4, Determining Fair Value When the Volume and Level of Activity for the Asset or
Liability Have Significantly Decreased and Identifying Transactions That Are Not Orderly. See Note 5 of the Notes
to the Consolidated Financial Statements for the description of our adoption of SFAS No. 157, as amended.
In February 2008 the FASB issued SFAS No. 157-2, Effective Date of FASB Statement No. 157. FSP
SFAS No. 157-2 delays the effective date of SFAS No. 157 for nonfinancial assets and nonfinancial liabilities,except for items that are recognized or disclosed at fair value in the financial statements on a recurring basis (at least
annually). We will apply SFAS No. 157 to nonfinancial assets and liabilities for the first quarter ending October 31,
2009 of our fiscal year 2010. We do not believe adoption of these delayed portions will have a material impact on
our consolidated financial statements.
In February 2007 the FASB issued FASB Statement No. 159, The Fair Value Option for Financial Assetsand Financial Liabilities. SFAS No. 159 permits entities to choose to measure many financial instruments and
certain other items at fair value at specified election dates. Unrealized gains and losses on items for which the fair
value option has been elected will be reported in earnings at each subsequent reporting date. The Statement also
establishes presentation and disclosure requirements relating to items measured at fair value. We adopted this
Statement as of August 1, 2008. We did not elect the Fair Value Option for any of our financial assets or liabilities;
therefore, the adoption of FAS No. 159 had no impact on our consolidated financial statements.
On August 1, 2008 we adopted the EITF consensus on Issue No. 06-11, Accounting for Income Tax
Benefits of Dividends on Share-Based Payment Awards (“EITF 06-11”). EITF 06-11 requires that the tax benefit
related to dividend and dividend equivalents paid on equity-classified nonvested shares and nonvested share units,which are expected to vest, be recorded as an increase to additional paid-in capital. The adoption of EITF 06-11 had
an insignificant impact on our consolidated financial statements.
NOTE 1 – SUMMARY OF SIGNIFICANT ACCOUNTING POLICIES (CONTINUED)
51
As of July 31, 2009 we adopted FSP SFAS No. 115-2 and SFAS No. 124-2, Recognition and Presentation
of Other-Than Temporary Impairment. We had no investments in debt securities as of July 31, 2009; therefore, this
FSP had no impact on our consolidated financial statements. This FSP amends the other-than-temporary
impairment guidance in U.S. GAAP for debt securities by clarifying the interaction of the factors that should be
considered when determining whether a debt security is other than temporarily impaired and by improving the
related presentation and disclosure for such debt and equity securities in the financial statements.
For our fiscal year ended July 31, 2009 we adopted SFAS No. 165, Subsequent Events, which establishes
general standards of accounting for and disclosure of events that occur after the balance sheet date but before
financial statements are issued or available to be issued that are not addressed in other generally accepted accounting
principles. See Principles of Consolidation and Basis of Presentation in Note 1 of the Notes to the Consolidated
Financial Statements.
Recently Issued Accounting Standards
In April 2009 the FASB issued FSP SFAS No. 107-1 and APB 28-1, Interim Disclosures about Fair Value
of Financial Instruments. This FSP requires a publicly traded company to include disclosures about the fair value ofits financial instruments whenever it issues summarized financial information for interim reporting periods. This
FSP is effective for interim periods ending after June 15, 2009 with early adoption permitted for periods ending after
March 15, 2009. We will adopt this pronouncement for the first quarter ending October 31, 2009 of our fiscal year
2010. We do not believe this FSP will have a material impact on our consolidated financial statements.
In April 2009 the FASB issued FSP FAS No. 141R-1, Accounting for Assets Acquired and Liabilities
Assumed in a Business Combination That Arise from Contingencies. This FSP addresses issues on initial recognition
and measurement, subsequent measurement and accounting, and disclosure of assets and liabilities arising from
contingencies in a business combination. This pronouncement is effective for assets and liabilities arising from
contingencies in business combinations for which the acquisition date is on or after the beginning of the first annual
reporting period beginning on or after December 15, 2008. We adopted FSP SFAS No. 141-R as of August 1, 2009and will apply its provisions to future business combinations.
In December 2008 the FASB issued FSP SFAS No. 132R-1, Employers’ Disclosures about Postretirement
Benefit Plan Assets. This FSP amends SFAS No. 132 (Revised 2003), Employers’ Disclosures about Pensions and
Other Postretirement Benefits, to expand the disclosure requirements for employers’ pension and other
postretirement benefit plan assets. FSP SFAS No. 132R-1 requires employers to disclose information about fair
value measurements of plan assets, the investment policies and strategies for the major categories of plan assets and
significant concentrations of risk within plan assets. We will adopt this FSP in our consolidated financial statements
for the fiscal year ending July 31, 2010 on a prospective basis. We are currently evaluating the impact FSP FAS
132R-1 will have on our consolidated financial statements.
In November 2008 the FASB issued FSP EITF No. 08-7, Accounting for Defensive Intangible Assets. ThisFSP clarifies the definition and accounting for defensive intangible assets acquired in a business combination or an
asset acquisition. This FSP states that, upon acquisition, an intangible asset must be recognized at fair value in
accordance with SFAS No. 157, Fair Value Measurement, regardless of how the acquiring entity intends to use the
asset. The intangible asset should be amortized over a useful life approximated by the period over which it is
expected to provide direct and indirect cash flows benefits resulting from the limitation against others to use the
intangible asset. We adopted FSP EITF No. 08-7 as of August 1, 2009 and will apply its provisions to future
intangible asset acquisitions.
In June 2008 the FASB issued FSP EITF No. 03-6-1, Determining Whether Instruments Granted in Share-
Based Payment Transactions Are Participating Securities. This FSP states that unvested share-based payment
awards that contain nonforfeitable rights to dividends or dividend equivalents (whether paid or unpaid) areparticipating securities and shall be included in the computation of earnings per share pursuant to the two-class
method. We will adopt FSP EITF No. 03-6-1 for the first quarter ending October 31, 2009 of our fiscal year 2010.
We do not believe this FSP will have a material impact on our consolidated financial statements or our earnings per
share.
NOTE 1 – SUMMARY OF SIGNIFICANT ACCOUNTING POLICIES (CONTINUED)
52
In December 2007 the FASB issued SFAS No. 160, Noncontrolling Interests in Consolidated Financial
Statements—An Amendment of ARB No. 51. This statement establishes new accounting and reporting standards for
the noncontrolling interest in a subsidiary and for the deconsolidation of a subsidiary. SFAS No. 160 requires the
noncontrolling interest to be reported as a component of equity, changes in a parent’s ownership interest while the
parent retains its controlling interest be accounted for as equity transactions, and any retained noncontrolling equity
investment upon the deconsolidation of a subsidiary be initially measured at fair value. We adopted this Statementas of August 1, 2009. The adoption of SFAS No. 160 had no impact on our consolidated financial statements.
NOTE 2 – SPECIAL CHARGES, FEES AND CHANGES IN ACCOUNTING ESTIMATES
COSTOF SALES
During fiscal 2008 we recorded an $831,000 pre-tax reduction to our cost of sales from the sale to an
unaffiliated third party of emission reduction credits we held in the State of California. We do not need these credits
to operate our California mining and manufacturing facility.
NOTE 3 – OPERATING SEGMENTS
SFAS No. 131, Disclosures About Segments of an Enterprise and Related Information establishes standards
for reporting information about operating segments. Under SFAS No. 131, we have two reportable operating segments
derived from the different characteristics of our two major customer groups: Retail and Wholesale Products Group and
Business to Business Products Group. Net sales and operating income for each segment are provided below. Revenues
by product line are not provided because it would be impracticable to do so. The accounting policies of the segments
are the same as those described in the Note 1 of the Notes to the Consolidated Financial Statements.
We do not rely on any segment asset allocations and we do not consider them meaningful because of the
shared nature of our production facilities; however, we have estimated the segment asset allocations below for those
assets for which we can reasonably determine. The unallocated asset category is the remainder of our total assets. The
asset allocation is estimated and is not a measure used by our chief operating decision maker about allocating resources
to the operating segments or in assessing their performance. The corporate expenses line represents certain unallocated
expenses, including primarily salaries, wages and benefits, purchased services, rent, utilities and depreciation and
amortization associated with corporate functions such as research and development, information systems, finance,
legal, human resources and customer service. Corporate expenses also include the annual incentive plan bonus accrual.
July 31,
Assets
2009 2008 2007
(in thousands)
Business to Business Products $ 42,581 $ 38,026 $ 35,298
Retail and Wholesale Products 69,300 66,838 61,992
Unallocated Assets 37,380 44,124 44,797
Total Assets $149,261 $148,988 $142,087
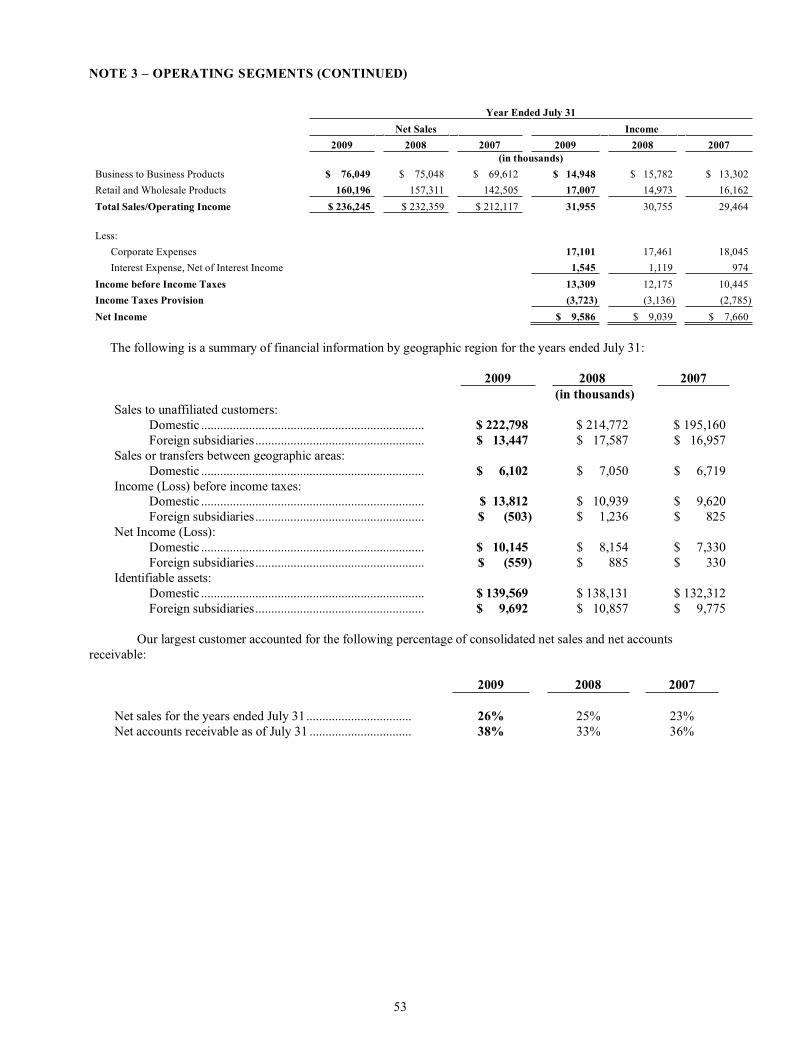
NOTE 3 – OPERATING SEGMENTS (CONTINUED)
53
Year Ended July 31
Net Sales Income
2009 2008 2007 2009 2008 2007
(in thousands)
Business to Business Products $ 76,049 $ 75,048 $ 69,612 $ 14,948 $ 15,782 $ 13,302
Retail and Wholesale Products 160,196 157,311 142,505 17,007 14,973 16,162
Total Sales/Operating Income $ 236,245 $ 232,359 $ 212,117 31,955 30,755 29,464
Less:
Corporate Expenses 17,101 17,461 18,045
Interest Expense, Net of Interest Income 1,545 1,119 974
Income before Income Taxes 13,309 12,175 10,445
Income Taxes Provision (3,723) (3,136) (2,785)
Net Income $ 9,586 $ 9,039 $ 7,660
The following is a summary of financial information by geographic region for the years ended July 31:
2009 2008 2007
(in thousands)
Sales to unaffiliated customers:
Domestic ...................................................................... $ 222,798 $ 214,772 $ 195,160
Foreign subsidiaries..................................................... $ 13,447 $ 17,587 $ 16,957
Sales or transfers between geographic areas:
Domestic ...................................................................... $ 6,102 $ 7,050 $ 6,719
Income (Loss) before income taxes:Domestic ...................................................................... $ 13,812 $ 10,939 $ 9,620
Foreign subsidiaries..................................................... $ (503) $ 1,236 $ 825
Net Income (Loss):
Domestic ...................................................................... $ 10,145 $ 8,154 $ 7,330
Foreign subsidiaries..................................................... $ (559) $ 885 $ 330
Identifiable assets:
Domestic ...................................................................... $ 139,569 $ 138,131 $ 132,312
Foreign subsidiaries..................................................... $ 9,692 $ 10,857 $ 9,775
Our largest customer accounted for the following percentage of consolidated net sales and net accounts
receivable:
2009 2008 2007
Net sales for the years ended July 31................................. 26% 25% 23%
Net accounts receivable as of July 31 ................................ 38% 33% 36%
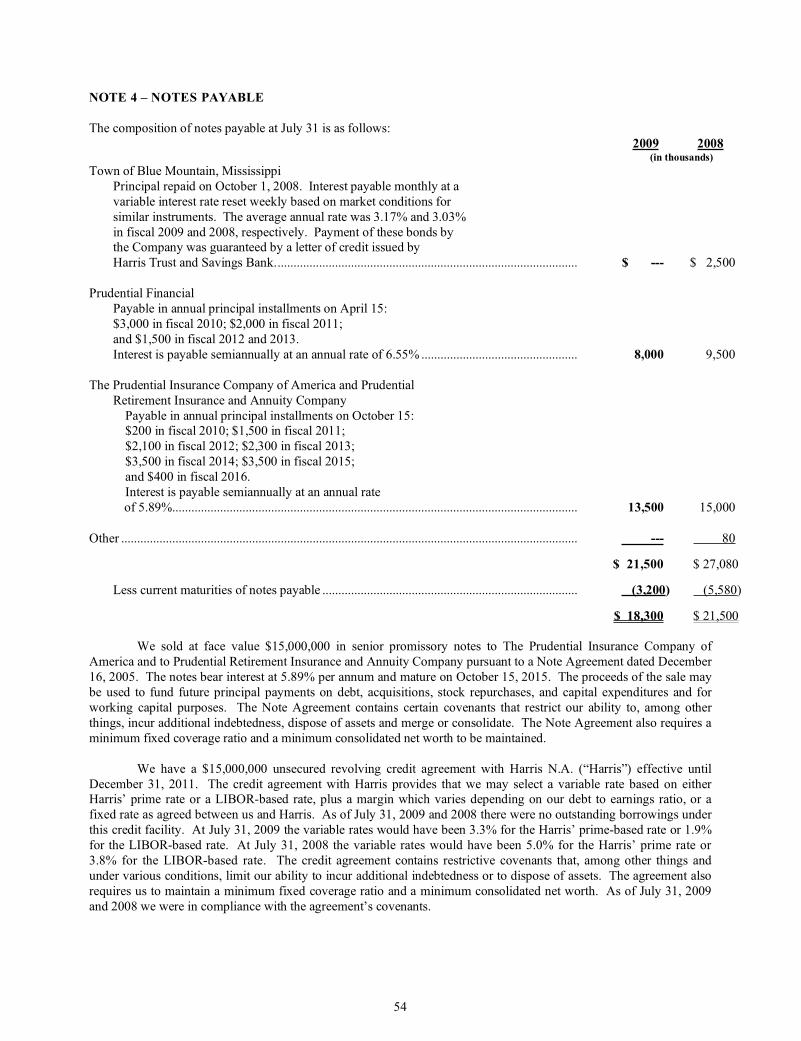
54
NOTE 4 – NOTES PAYABLE
The composition of notes payable at July 31 is as follows:
2009 2008(in thousands)
Town of Blue Mountain, Mississippi
Principal repaid on October 1, 2008. Interest payable monthly at a
variable interest rate reset weekly based on market conditions for
similar instruments. The average annual rate was 3.17% and 3.03%
in fiscal 2009 and 2008, respectively. Payment of these bonds bythe Company was guaranteed by a letter of credit issued by
Harris Trust and Savings Bank............................................................................................... $ --- $ 2,500
Prudential Financial
Payable in annual principal installments on April 15:
$3,000 in fiscal 2010; $2,000 in fiscal 2011;
and $1,500 in fiscal 2012 and 2013.
Interest is payable semiannually at an annual rate of 6.55% ................................................. 8,000 9,500
The Prudential Insurance Company of America and Prudential
Retirement Insurance and Annuity Company
Payable in annual principal installments on October 15:$200 in fiscal 2010; $1,500 in fiscal 2011;
$2,100 in fiscal 2012; $2,300 in fiscal 2013;
$3,500 in fiscal 2014; $3,500 in fiscal 2015;
and $400 in fiscal 2016.
Interest is payable semiannually at an annual rate
of 5.89%............................................................................................................................... 13,500 15,000
Other ............................................................................................................................................... --- 80
$ 21,500 $ 27,080
Less current maturities of notes payable ................................................................................ (3,200) (5,580)
$ 18,300 $ 21,500
We sold at face value $15,000,000 in senior promissory notes to The Prudential Insurance Company of
America and to Prudential Retirement Insurance and Annuity Company pursuant to a Note Agreement dated December
16, 2005. The notes bear interest at 5.89% per annum and mature on October 15, 2015. The proceeds of the sale may
be used to fund future principal payments on debt, acquisitions, stock repurchases, and capital expenditures and for
working capital purposes. The Note Agreement contains certain covenants that restrict our ability to, among other
things, incur additional indebtedness, dispose of assets and merge or consolidate. The Note Agreement also requires a
minimum fixed coverage ratio and a minimum consolidated net worth to be maintained.
We have a $15,000,000 unsecured revolving credit agreement with Harris N.A. (“Harris”) effective until
December 31, 2011. The credit agreement with Harris provides that we may select a variable rate based on eitherHarris’ prime rate or a LIBOR-based rate, plus a margin which varies depending on our debt to earnings ratio, or a
fixed rate as agreed between us and Harris. As of July 31, 2009 and 2008 there were no outstanding borrowings under
this credit facility. At July 31, 2009 the variable rates would have been 3.3% for the Harris’ prime-based rate or 1.9%
for the LIBOR-based rate. At July 31, 2008 the variable rates would have been 5.0% for the Harris’ prime rate or
3.8% for the LIBOR-based rate. The credit agreement contains restrictive covenants that, among other things and
under various conditions, limit our ability to incur additional indebtedness or to dispose of assets. The agreement also
requires us to maintain a minimum fixed coverage ratio and a minimum consolidated net worth. As of July 31, 2009
and 2008 we were in compliance with the agreement’s covenants.
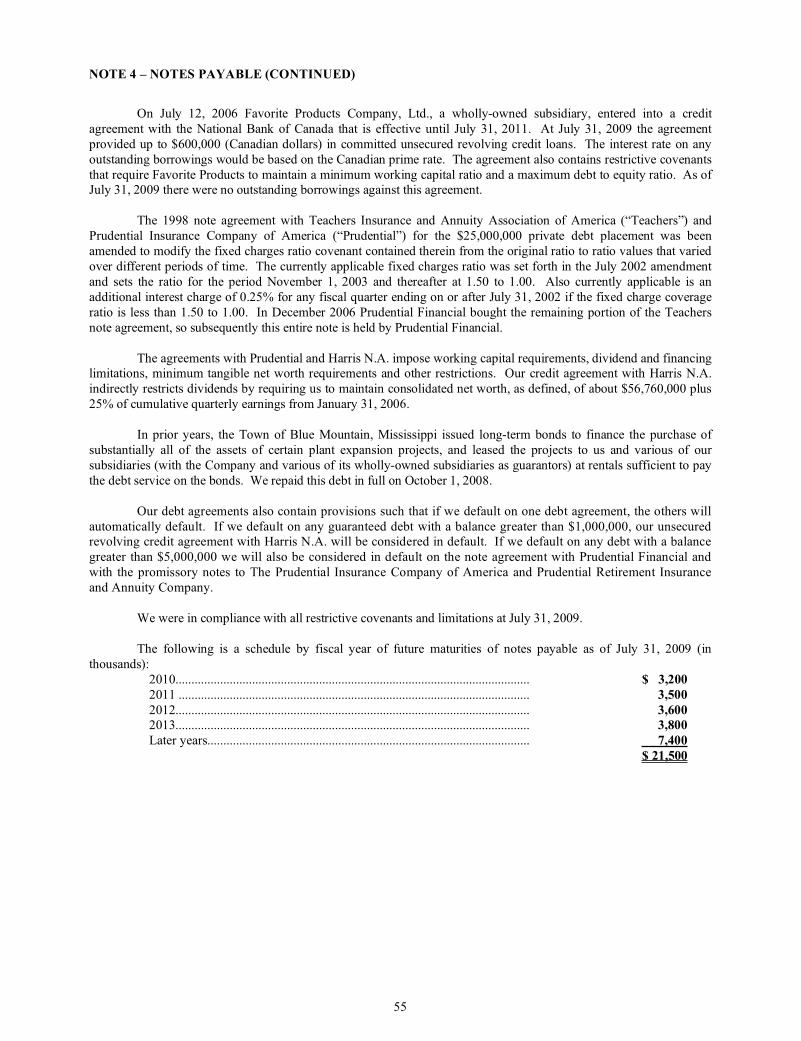
NOTE 4 – NOTES PAYABLE (CONTINUED)
55
On July 12, 2006 Favorite Products Company, Ltd., a wholly-owned subsidiary, entered into a credit
agreement with the National Bank of Canada that is effective until July 31, 2011. At July 31, 2009 the agreement
provided up to $600,000 (Canadian dollars) in committed unsecured revolving credit loans. The interest rate on any
outstanding borrowings would be based on the Canadian prime rate. The agreement also contains restrictive covenants
that require Favorite Products to maintain a minimum working capital ratio and a maximum debt to equity ratio. As ofJuly 31, 2009 there were no outstanding borrowings against this agreement.
The 1998 note agreement with Teachers Insurance and Annuity Association of America (“Teachers”) and
Prudential Insurance Company of America (“Prudential”) for the $25,000,000 private debt placement was been
amended to modify the fixed charges ratio covenant contained therein from the original ratio to ratio values that varied
over different periods of time. The currently applicable fixed charges ratio was set forth in the July 2002 amendment
and sets the ratio for the period November 1, 2003 and thereafter at 1.50 to 1.00. Also currently applicable is an
additional interest charge of 0.25% for any fiscal quarter ending on or after July 31, 2002 if the fixed charge coverage
ratio is less than 1.50 to 1.00. In December 2006 Prudential Financial bought the remaining portion of the Teachers
note agreement, so subsequently this entire note is held by Prudential Financial.
The agreements with Prudential and Harris N.A. impose working capital requirements, dividend and financinglimitations, minimum tangible net worth requirements and other restrictions. Our credit agreement with Harris N.A.
indirectly restricts dividends by requiring us to maintain consolidated net worth, as defined, of about $56,760,000 plus
25% of cumulative quarterly earnings from January 31, 2006.
In prior years, the Town of Blue Mountain, Mississippi issued long-term bonds to finance the purchase of
substantially all of the assets of certain plant expansion projects, and leased the projects to us and various of our
subsidiaries (with the Company and various of its wholly-owned subsidiaries as guarantors) at rentals sufficient to pay
the debt service on the bonds. We repaid this debt in full on October 1, 2008.
Our debt agreements also contain provisions such that if we default on one debt agreement, the others will
automatically default. If we default on any guaranteed debt with a balance greater than $1,000,000, our unsecuredrevolving credit agreement with Harris N.A. will be considered in default. If we default on any debt with a balance
greater than $5,000,000 we will also be considered in default on the note agreement with Prudential Financial and
with the promissory notes to The Prudential Insurance Company of America and Prudential Retirement Insurance
and Annuity Company.
We were in compliance with all restrictive covenants and limitations at July 31, 2009.
The following is a schedule by fiscal year of future maturities of notes payable as of July 31, 2009 (in
thousands):
2010............................................................................................................... $ 3,200
2011 .............................................................................................................. 3,500
2012............................................................................................................... 3,600
2013............................................................................................................... 3,800
Later years..................................................................................................... 7,400
$ 21,500
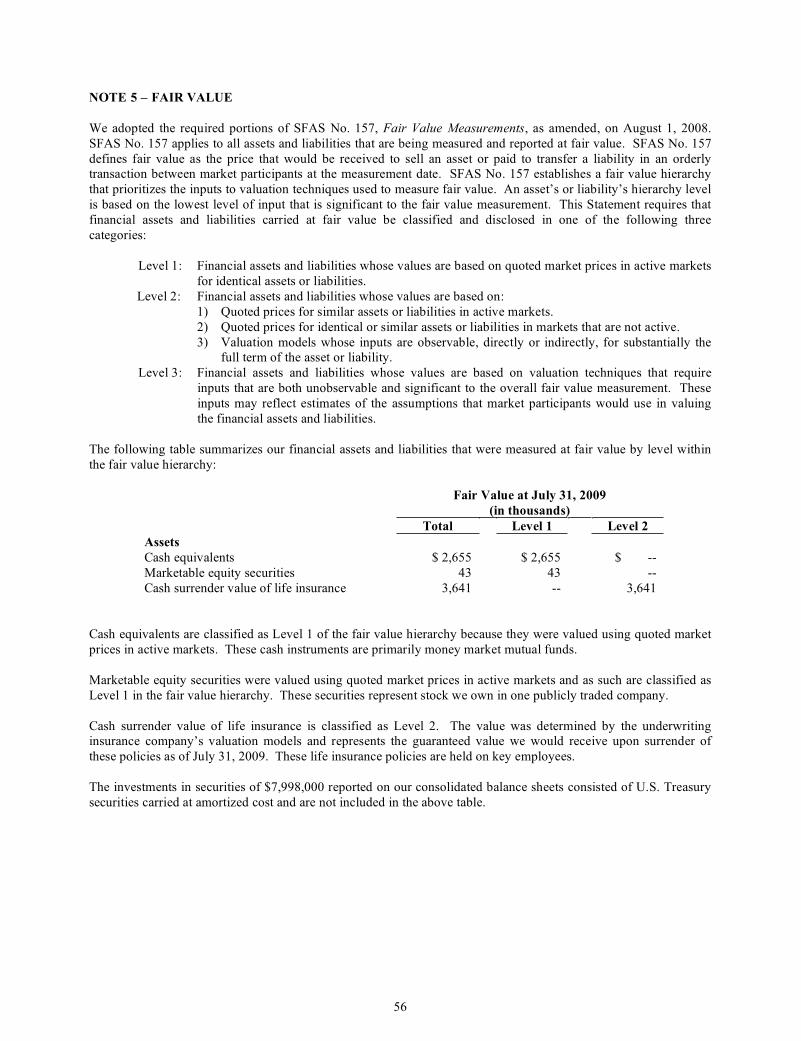
56
NOTE 5 – FAIR VALUE
We adopted the required portions of SFAS No. 157, Fair Value Measurements, as amended, on August 1, 2008.
SFAS No. 157 applies to all assets and liabilities that are being measured and reported at fair value. SFAS No. 157
defines fair value as the price that would be received to sell an asset or paid to transfer a liability in an orderlytransaction between market participants at the measurement date. SFAS No. 157 establishes a fair value hierarchy
that prioritizes the inputs to valuation techniques used to measure fair value. An asset’s or liability’s hierarchy level
is based on the lowest level of input that is significant to the fair value measurement. This Statement requires that
financial assets and liabilities carried at fair value be classified and disclosed in one of the following three
categories:
Level 1: Financial assets and liabilities whose values are based on quoted market prices in active markets
for identical assets or liabilities.
Level 2: Financial assets and liabilities whose values are based on:
1) Quoted prices for similar assets or liabilities in active markets.
2) Quoted prices for identical or similar assets or liabilities in markets that are not active.
3) Valuation models whose inputs are observable, directly or indirectly, for substantially thefull term of the asset or liability.
Level 3: Financial assets and liabilities whose values are based on valuation techniques that require
inputs that are both unobservable and significant to the overall fair value measurement. These
inputs may reflect estimates of the assumptions that market participants would use in valuing
the financial assets and liabilities.
The following table summarizes our financial assets and liabilities that were measured at fair value by level within
the fair value hierarchy:
Fair Value at July 31, 2009
(in thousands)
Total Level 1 Level 2
Assets
Cash equivalents $ 2,655 $ 2,655 $ --
Marketable equity securities 43 43 --
Cash surrender value of life insurance 3,641 -- 3,641
Cash equivalents are classified as Level 1 of the fair value hierarchy because they were valued using quoted market
prices in active markets. These cash instruments are primarily money market mutual funds.
Marketable equity securities were valued using quoted market prices in active markets and as such are classified as
Level 1 in the fair value hierarchy. These securities represent stock we own in one publicly traded company.
Cash surrender value of life insurance is classified as Level 2. The value was determined by the underwritinginsurance company’s valuation models and represents the guaranteed value we would receive upon surrender of
these policies as of July 31, 2009. These life insurance policies are held on key employees.
The investments in securities of $7,998,000 reported on our consolidated balance sheets consisted of U.S. Treasury
securities carried at amortized cost and are not included in the above table.
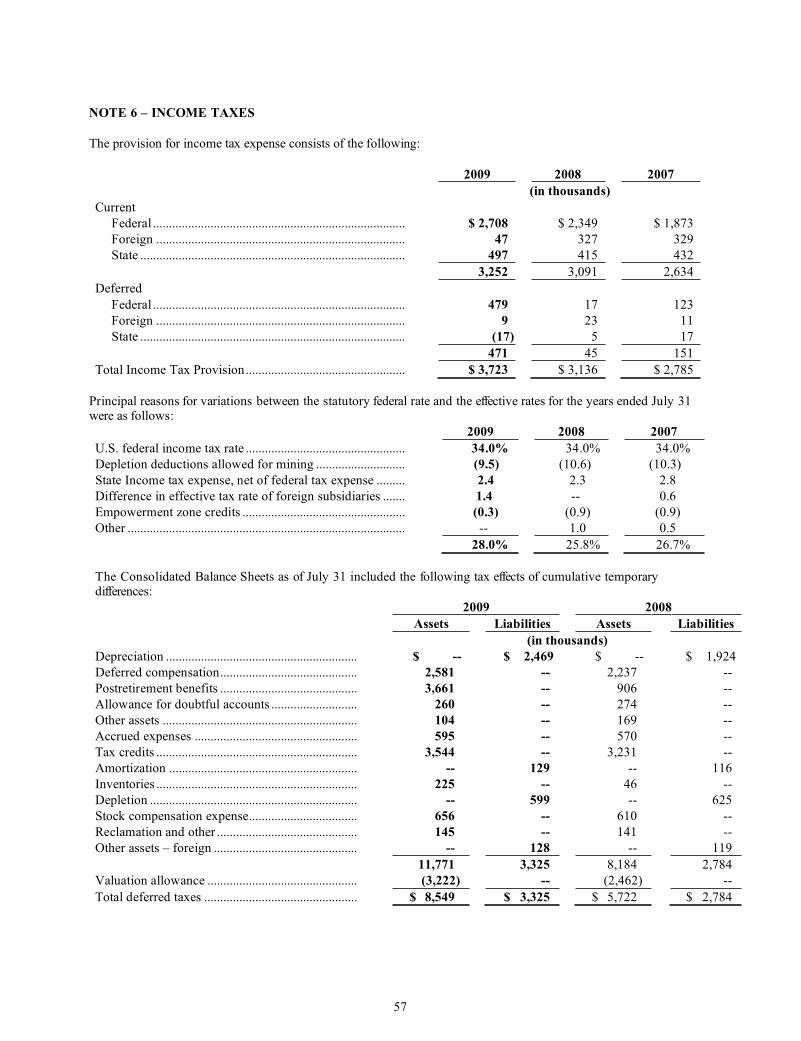
57
NOTE 6 – INCOME TAXES
The provision for income tax expense consists of the following:
2009 2008 2007
(in thousands)
Current
Federal ............................................................................... $ 2,708 $ 2,349 $ 1,873
Foreign .............................................................................. 47 327 329
State ................................................................................... 497 415 432
3,252 3,091 2,634
Deferred
Federal ............................................................................... 479 17 123
Foreign .............................................................................. 9 23 11
State ................................................................................... (17) 5 17
471 45 151
Total Income Tax Provision.................................................. $ 3,723 $ 3,136 $ 2,785
Principal reasons for variations between the statutory federal rate and the effective rates for the years ended July 31were as follows:
2009 2008 2007
U.S. federal income tax rate .................................................. 34.0% 34.0% 34.0%
Depletion deductions allowed for mining ............................ (9.5) (10.6) (10.3)
State Income tax expense, net of federal tax expense ......... 2.4 2.3 2.8
Difference in effective tax rate of foreign subsidiaries ....... 1.4 -- 0.6
Empowerment zone credits ................................................... (0.3) (0.9) (0.9)
Other ....................................................................................... -- 1.0 0.5
28.0% 25.8% 26.7%
The Consolidated Balance Sheets as of July 31 included the following tax effects of cumulative temporarydifferences:
2009 2008
Assets Liabilities Assets Liabilities
(in thousands)
Depreciation ............................................................ $ -- $ 2,469 $ -- $ 1,924
Deferred compensation........................................... 2,581 -- 2,237 --
Postretirement benefits ........................................... 3,661 -- 906 --
Allowance for doubtful accounts ........................... 260 -- 274 --
Other assets ............................................................. 104 -- 169 --
Accrued expenses ................................................... 595 -- 570 --
Tax credits ............................................................... 3,544 -- 3,231 --
Amortization ........................................................... -- 129 -- 116
Inventories ............................................................... 225 -- 46 --
Depletion ................................................................. -- 599 -- 625
Stock compensation expense.................................. 656 -- 610 --
Reclamation and other ............................................ 145 -- 141 --
Other assets – foreign ............................................. -- 128 -- 119
11,771 3,325 8,184 2,784
Valuation allowance ............................................... (3,222) -- (2,462) --
Total deferred taxes ................................................ $ 8,549 $ 3,325 $ 5,722 $ 2,784
58
NOTE 6 – INCOME TAXES (CONTINUED)
As of July 31, 2009 we had alternative minimum tax (“AMT”) credit carryforwards for federal income tax
purposes of approximately $3,222,000, which can be carried forward indefinitely or until utilized. A number of factors
determine whether or not we will be able to utilize the AMT credit carryforwards. We believe it is more likely than notthat we will not realize a benefit from the carryforwards; therefore, a valuation allowance has been established for the
full amount of the deferred tax benefit related to the AMT tax credits.
Historically no provision had been made for possible income taxes which may be paid on the distribution of
untaxed earnings of foreign subsidiaries of approximately $5,306,000, $5,211,000 and $4,360,000 as of July 31, 2009,
2008 and 2007, respectively. No provision was required as substantially all such amounts were intended to be
indefinitely invested in the subsidiaries or to be handled in such a way that no additional income taxes would be
incurred when such earnings are distributed.
NOTE 7 – STOCKHOLDERS’ EQUITY
Our authorized capital stock at July 31, 2009 and 2008 consisted of 15,000,000 shares of Common Stock,
7,000,000 shares of Class B Stock and 30,000,000 shares of Class A Common Stock, each with a par value of $.10 per
share. There are no Class A Common Stock shares currently outstanding.
The Common Stock and Class B Stock are equal, on a per share basis, in all respects except as to voting
rights, conversion rights, cash dividends and stock splits or stock dividends. The Class A Common Stock is equal, on a
per share basis, in all respects, to the Common Stock except as to voting rights and stock splits or stock dividends. In
the case of voting rights, Common Stock is entitled to one vote per share and Class B Stock is entitled to ten votes per
share, while Class A Common Stock generally has no voting rights. Common Stock and Class A Common Stock have
no conversion rights. Class B Stock is convertible on a share-for-share basis into Common Stock at any time and is
subject to mandatory conversion under certain circumstances.
Common Stock is entitled to cash dividends, as and when declared or paid, equal to at least 133 1/3% on a per
share basis of the cash dividend paid on Class B Stock. Class A Common Stock is entitled to cash dividends on a per
share basis equal to the cash dividend on Common Stock. Additionally, while shares of Common Stock, Class A
Common Stock and Class B Stock are outstanding, the sum of the per share cash dividend paid on shares of Common
Stock and Class A Common Stock, must be equal to at least 133 1/3% of the sum of the per share cash dividend paid
on Class B Stock and Class A Common Stock. See Note 4 regarding dividend restrictions.
Shares of Common Stock, Class A Common Stock and Class B Stock are equal in respect of all rights to
dividends (other than cash) and distributions in the form of stock or other property (including stock dividends and
split-ups) in each case in the same ratio except in the case of a Special Stock Dividend. The Special Stock Dividend,
which can be issued only once, is either a dividend of one share of Class A Common Stock for each share of CommonStock and Class B Stock outstanding or a recapitalization, in which half of each outstanding share of Common Stock
and Class B Stock would be converted into a half share of Class A Common Stock.
Our Board of Directors has authorized in the aggregate the repurchase of 2,916,771 shares of the Company
stock. As of July 31, 2009, 2,302,287 shares of Common Stock and 342,241 shares of Class B Stock have been
repurchased under the Board approved repurchase authorizations and 146,545 shares of Common Stock by other
transactions authorized by management prior to the adoption of the Board’s repurchase authorizations.
59
NOTE 8 – STOCK-BASED COMPENSATION
We account for stock options and restricted stock issued under our long term incentive plans in accordancewith SFAS No. 123-R. SFAS No. 123-R requires the determination of the fair value of stock-based compensation at
the grant date and the recognition in the financial statements of the related compensation expense over the
appropriate vesting period. We adopted SFAS No. 123-R on August 1, 2005, the beginning of our fiscal year 2006,
using a modified prospective application. Under this application we are required to record compensation expense
for all awards granted after the date of adoption and for the unvested portion of previously granted awards that were
outstanding at the date of adoption.
SFAS No. 123-R requires that stock-based compensation be recognized over the period from the date of
grant to the date when the award is no longer contingent on the employee providing additional service to the
company. Certain employees are eligible for accelerated vesting in accordance with the terms of our plans if they
are at least 55 years old and their age plus years of service equals 80. Any unamortized expense is recognized
immediately when the employee meets these criteria.
STOCK OPTIONS
Our 1995 Long Term Incentive Plan (“1995 Plan”) provided for grants of both incentive and non-qualified
stock options and restricted stock. Stock options were granted at an option price per share of 100% of the fair
market value of our Class A Common Stock or, if no Class A Common Stock is outstanding, our Common Stock
(“Stock”) on the date of grant. Stock options were generally granted with a five-year vesting period and a 10-year
term. The stock options vest 25% two years after the grant date and 25% in each of the three following
anniversaries of the grant date. The 1995 Plan expired for purposes of issuing new grants on August 5, 2005. Allshares of stock issued upon option exercises under this plan were from authorized but unissued stock; all shares of
restricted stock issued were from treasury stock.
The Oil-Dri Corporation of America 2006 Long Term Incentive Plan (“2006 Plan”) permits the grant of
stock options, stock appreciation rights, restricted stock, restricted stock units, performance awards and other stock-
based and cash-based awards. Our employees and non-employee directors are eligible to receive grants under the
2006 Plan. The total number of shares of stock subject to grants under the 2006 Plan may not exceed
937,500. Option grants covering 25,000 shares have been issued to our outside directors with a vesting period of
one year and option grants covering 32,500 shares have been issued to employees with vesting similar to the vesting
described above under the 1995 Plan. 90,000 shares of restricted stock have been issued under the 2006 Plan.
The Oil-Dri Corporation of America Outside Director Stock Plan (the “Directors’ Plan”) provides for
grants of stock options to directors at an option price per share of 100% of the fair market value of Common Stock
on the date of grant. Our directors are considered employees under the provisions of FAS 123-R. Stock options
have been granted to our directors for a 10-year term with a one year vesting period. There are 60,250 shares
outstanding and no shares are available for future grants under this plan. All shares of stock issued under the
Directors’ Plan were from treasury stock.
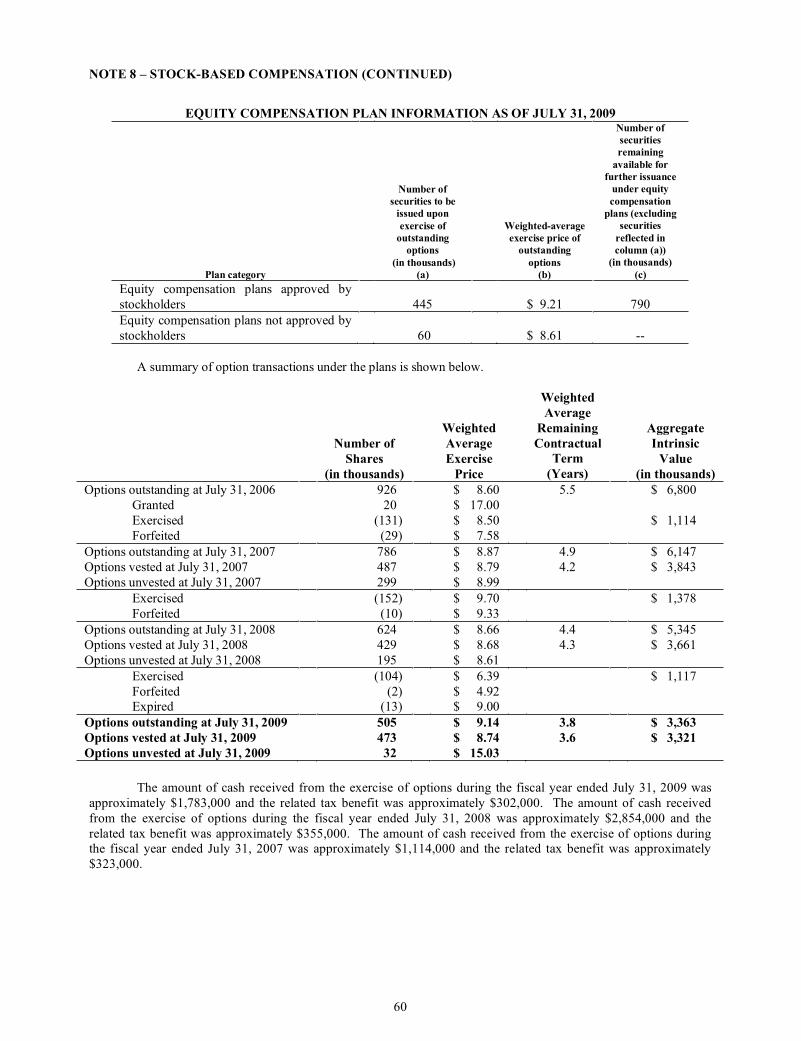
NOTE 8 – STOCK-BASED COMPENSATION (CONTINUED)
60
EQUITY COMPENSATION PLAN INFORMATION AS OF JULY 31, 2009
Plan category
Number of
securities to be
issued upon
exercise of
outstanding
options
(in thousands)
(a)
Weighted-average
exercise price of
outstanding
options
(b)
Number of
securities
remaining
available for
further issuance
under equity
compensation
plans (excluding
securities
reflected in
column (a))
(in thousands)
(c)
Equity compensation plans approved by
stockholders 445 $ 9.21 790
Equity compensation plans not approved by
stockholders 60 $ 8.61 --
A summary of option transactions under the plans is shown below.
Number of
Shares
(in thousands)
Weighted
Average
Exercise
Price
Weighted
Average
Remaining
Contractual
Term
(Years)
Aggregate
Intrinsic
Value
(in thousands)
Options outstanding at July 31, 2006 926 $ 8.60 5.5 $ 6,800
Granted 20 $ 17.00
Exercised (131) $ 8.50 $ 1,114
Forfeited (29) $ 7.58
Options outstanding at July 31, 2007 786 $ 8.87 4.9 $ 6,147
Options vested at July 31, 2007 487 $ 8.79 4.2 $ 3,843
Options unvested at July 31, 2007 299 $ 8.99
Exercised (152) $ 9.70 $ 1,378
Forfeited (10) $ 9.33
Options outstanding at July 31, 2008 624 $ 8.66 4.4 $ 5,345
Options vested at July 31, 2008 429 $ 8.68 4.3 $ 3,661
Options unvested at July 31, 2008 195 $ 8.61
Exercised (104) $ 6.39 $ 1,117
Forfeited (2) $ 4.92Expired (13) $ 9.00
Options outstanding at July 31, 2009 505 $ 9.14 3.8 $ 3,363
Options vested at July 31, 2009 473 $ 8.74 3.6 $ 3,321
Options unvested at July 31, 2009 32 $ 15.03
The amount of cash received from the exercise of options during the fiscal year ended July 31, 2009 was
approximately $1,783,000 and the related tax benefit was approximately $302,000. The amount of cash received
from the exercise of options during the fiscal year ended July 31, 2008 was approximately $2,854,000 and the
related tax benefit was approximately $355,000. The amount of cash received from the exercise of options duringthe fiscal year ended July 31, 2007 was approximately $1,114,000 and the related tax benefit was approximately
$323,000.
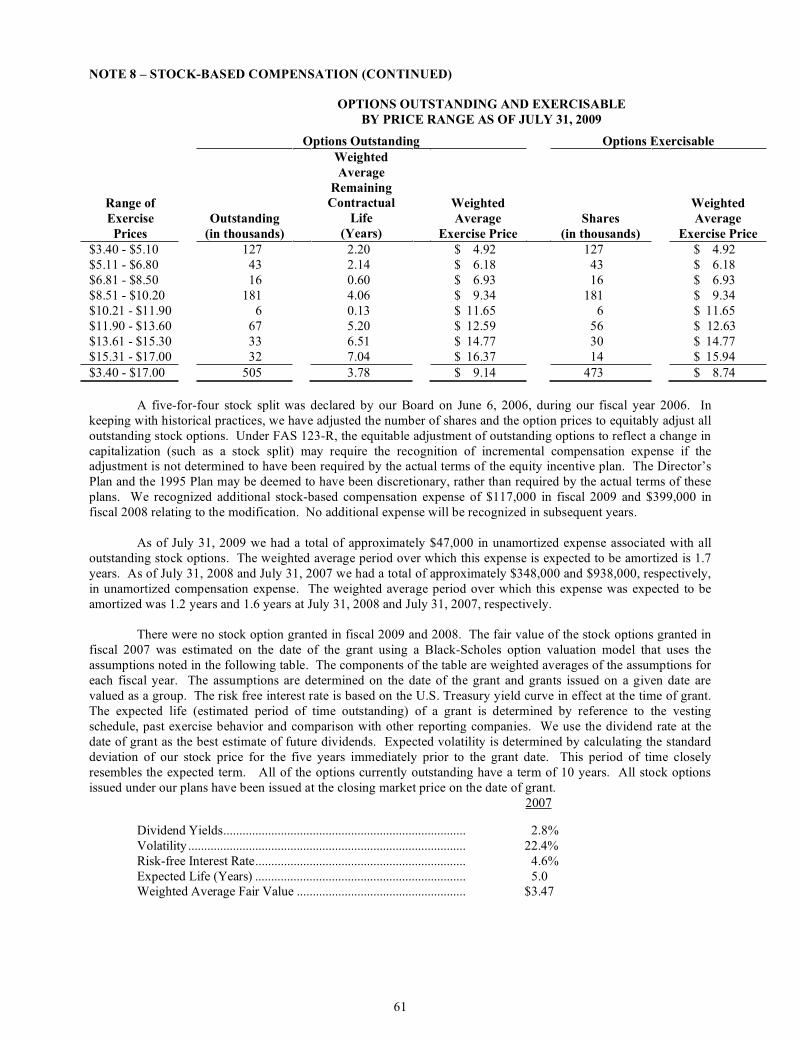
NOTE 8 – STOCK-BASED COMPENSATION (CONTINUED)
61
OPTIONS OUTSTANDING AND EXERCISABLE
BY PRICE RANGE AS OF JULY 31, 2009
Options Outstanding Options Exercisable
Range of
Exercise
Prices
Outstanding
(in thousands)
Weighted
Average
Remaining
Contractual
Life
(Years)
Weighted
Average
Exercise Price
Shares
(in thousands)
Weighted
Average
Exercise Price
$3.40 - $5.10 127 2.20 $ 4.92 127 $ 4.92
$5.11 - $6.80 43 2.14 $ 6.18 43 $ 6.18
$6.81 - $8.50 16 0.60 $ 6.93 16 $ 6.93
$8.51 - $10.20 181 4.06 $ 9.34 181 $ 9.34
$10.21 - $11.90 6 0.13 $ 11.65 6 $ 11.65
$11.90 - $13.60 67 5.20 $ 12.59 56 $ 12.63
$13.61 - $15.30 33 6.51 $ 14.77 30 $ 14.77
$15.31 - $17.00 32 7.04 $ 16.37 14 $ 15.94
$3.40 - $17.00 505 3.78 $ 9.14 473 $ 8.74
A five-for-four stock split was declared by our Board on June 6, 2006, during our fiscal year 2006. In
keeping with historical practices, we have adjusted the number of shares and the option prices to equitably adjust all
outstanding stock options. Under FAS 123-R, the equitable adjustment of outstanding options to reflect a change in
capitalization (such as a stock split) may require the recognition of incremental compensation expense if theadjustment is not determined to have been required by the actual terms of the equity incentive plan. The Director’s
Plan and the 1995 Plan may be deemed to have been discretionary, rather than required by the actual terms of these
plans. We recognized additional stock-based compensation expense of $117,000 in fiscal 2009 and $399,000 in
fiscal 2008 relating to the modification. No additional expense will be recognized in subsequent years.
As of July 31, 2009 we had a total of approximately $47,000 in unamortized expense associated with all
outstanding stock options. The weighted average period over which this expense is expected to be amortized is 1.7
years. As of July 31, 2008 and July 31, 2007 we had a total of approximately $348,000 and $938,000, respectively,
in unamortized compensation expense. The weighted average period over which this expense was expected to be
amortized was 1.2 years and 1.6 years at July 31, 2008 and July 31, 2007, respectively.
There were no stock option granted in fiscal 2009 and 2008. The fair value of the stock options granted in
fiscal 2007 was estimated on the date of the grant using a Black-Scholes option valuation model that uses the
assumptions noted in the following table. The components of the table are weighted averages of the assumptions for
each fiscal year. The assumptions are determined on the date of the grant and grants issued on a given date are
valued as a group. The risk free interest rate is based on the U.S. Treasury yield curve in effect at the time of grant.
The expected life (estimated period of time outstanding) of a grant is determined by reference to the vesting
schedule, past exercise behavior and comparison with other reporting companies. We use the dividend rate at the
date of grant as the best estimate of future dividends. Expected volatility is determined by calculating the standard
deviation of our stock price for the five years immediately prior to the grant date. This period of time closely
resembles the expected term. All of the options currently outstanding have a term of 10 years. All stock options
issued under our plans have been issued at the closing market price on the date of grant.
2007
Dividend Yields............................................................................ 2.8%
Volatility ....................................................................................... 22.4%
Risk-free Interest Rate.................................................................. 4.6%
Expected Life (Years) .................................................................. 5.0Weighted Average Fair Value ..................................................... $3.47
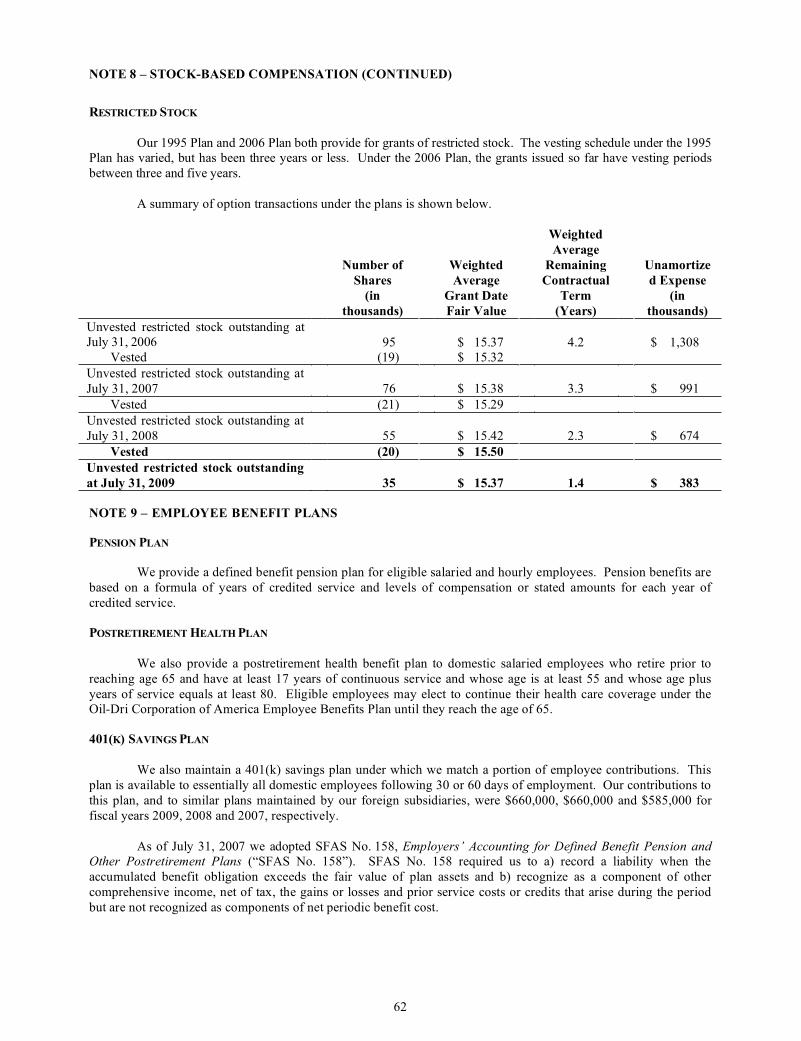
NOTE 8 – STOCK-BASED COMPENSATION (CONTINUED)
62
RESTRICTED STOCK
Our 1995 Plan and 2006 Plan both provide for grants of restricted stock. The vesting schedule under the 1995Plan has varied, but has been three years or less. Under the 2006 Plan, the grants issued so far have vesting periods
between three and five years.
A summary of option transactions under the plans is shown below.
Number of
Shares
(in
thousands)
Weighted
Average
Grant Date
Fair Value
Weighted
Average
Remaining
Contractual
Term
(Years)
Unamortize
d Expense
(in
thousands)
Unvested restricted stock outstanding atJuly 31, 2006 95 $ 15.37 4.2 $ 1,308
Vested (19) $ 15.32
Unvested restricted stock outstanding at
July 31, 2007 76 $ 15.38 3.3 $ 991
Vested (21) $ 15.29
Unvested restricted stock outstanding at
July 31, 2008 55 $ 15.42 2.3 $ 674
Vested (20) $ 15.50
Unvested restricted stock outstanding
at July 31, 2009 35 $ 15.37 1.4 $ 383
NOTE 9 – EMPLOYEE BENEFIT PLANS
PENSION PLAN
We provide a defined benefit pension plan for eligible salaried and hourly employees. Pension benefits are
based on a formula of years of credited service and levels of compensation or stated amounts for each year of
credited service.
POSTRETIREMENTHEALTHPLAN
We also provide a postretirement health benefit plan to domestic salaried employees who retire prior to
reaching age 65 and have at least 17 years of continuous service and whose age is at least 55 and whose age plus
years of service equals at least 80. Eligible employees may elect to continue their health care coverage under theOil-Dri Corporation of America Employee Benefits Plan until they reach the age of 65.
401(K) SAVINGSPLAN
We also maintain a 401(k) savings plan under which we match a portion of employee contributions. This
plan is available to essentially all domestic employees following 30 or 60 days of employment. Our contributions to
this plan, and to similar plans maintained by our foreign subsidiaries, were $660,000, $660,000 and $585,000 for
fiscal years 2009, 2008 and 2007, respectively.
As of July 31, 2007 we adopted SFAS No. 158, Employers’ Accounting for Defined Benefit Pension andOther Postretirement Plans (“SFAS No. 158”). SFAS No. 158 required us to a) record a liability when the
accumulated benefit obligation exceeds the fair value of plan assets and b) recognize as a component of other
comprehensive income, net of tax, the gains or losses and prior service costs or credits that arise during the period
but are not recognized as components of net periodic benefit cost.
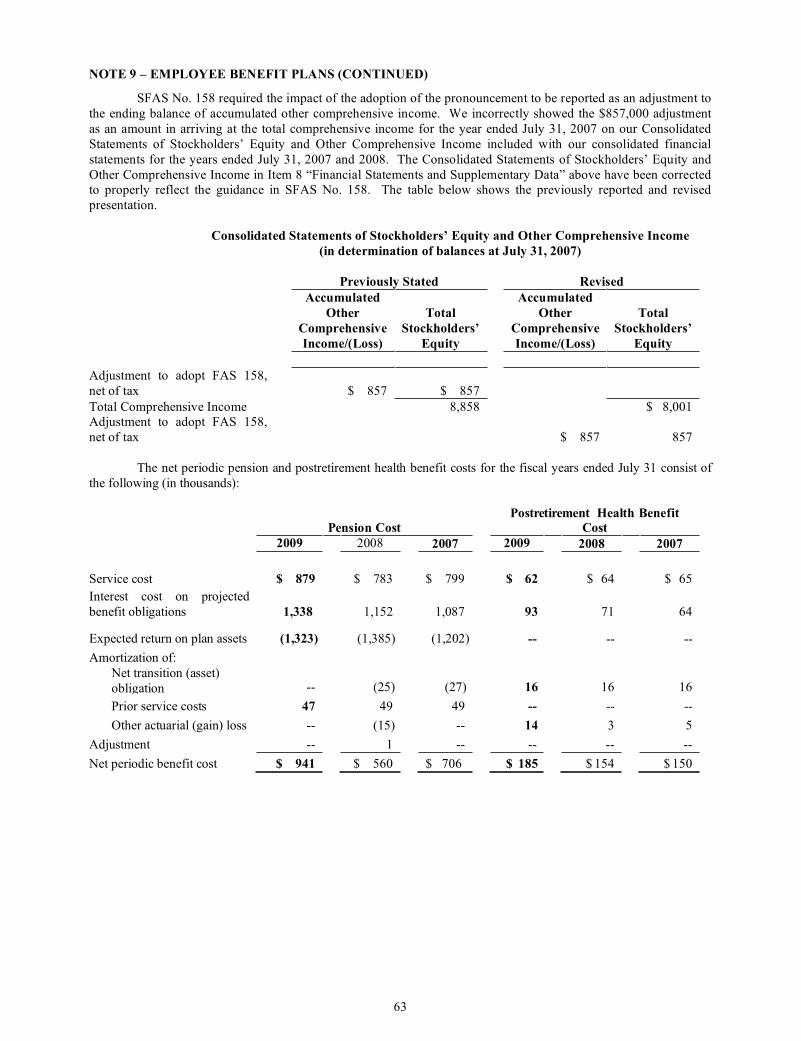
NOTE 9 – EMPLOYEE BENEFIT PLANS (CONTINUED)
63
SFAS No. 158 required the impact of the adoption of the pronouncement to be reported as an adjustment to
the ending balance of accumulated other comprehensive income. We incorrectly showed the $857,000 adjustment
as an amount in arriving at the total comprehensive income for the year ended July 31, 2007 on our Consolidated
Statements of Stockholders’ Equity and Other Comprehensive Income included with our consolidated financial
statements for the years ended July 31, 2007 and 2008. The Consolidated Statements of Stockholders’ Equity and
Other Comprehensive Income in Item 8 “Financial Statements and Supplementary Data” above have been correctedto properly reflect the guidance in SFAS No. 158. The table below shows the previously reported and revised
presentation.
Consolidated Statements of Stockholders’ Equity and Other Comprehensive Income
(in determination of balances at July 31, 2007)
Previously Stated Revised
Accumulated
Other
Comprehensive
Income/(Loss)
Total
Stockholders’
Equity
Accumulated
Other
Comprehensive
Income/(Loss)
Total
Stockholders’
Equity
Adjustment to adopt FAS 158,
net of tax $ 857 $ 857
Total Comprehensive Income 8,858 $ 8,001Adjustment to adopt FAS 158,
net of tax $ 857 857
The net periodic pension and postretirement health benefit costs for the fiscal years ended July 31 consist of
the following (in thousands):
Pension Cost
Postretirement Health Benefit
Cost
2009 2008 2007 2009 2008 2007
Service cost $ 879 $ 783 $ 799 $ 62 $ 64 $ 65
Interest cost on projected
benefit obligations 1,338 1,152 1,087 93 71 64
Expected return on plan assets (1,323) (1,385) (1,202) -- -- --
Amortization of:
Net transition (asset)
obligation -- (25) (27) 16 16 16
Prior service costs 47 49 49 -- -- --
Other actuarial (gain) loss -- (15) -- 14 3 5
Adjustment -- 1 -- -- -- --
Net periodic benefit cost $ 941 $ 560 $ 706 $ 185 $ 154 $ 150
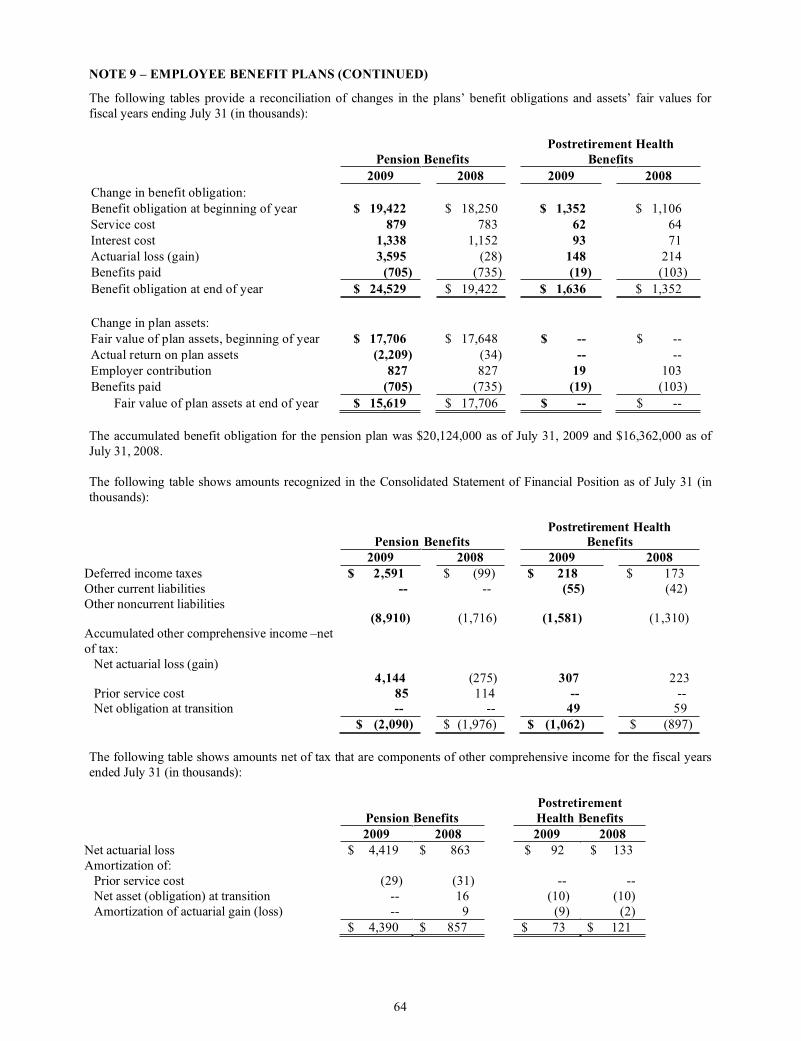
NOTE 9 – EMPLOYEE BENEFIT PLANS (CONTINUED)
64
The following tables provide a reconciliation of changes in the plans’ benefit obligations and assets’ fair values for
fiscal years ending July 31 (in thousands):
Pension Benefits
Postretirement Health
Benefits
2009 2008 2009 2008
Change in benefit obligation:
Benefit obligation at beginning of year $ 19,422 $ 18,250 $ 1,352 $ 1,106
Service cost 879 783 62 64
Interest cost 1,338 1,152 93 71
Actuarial loss (gain) 3,595 (28) 148 214
Benefits paid (705) (735) (19) (103)
Benefit obligation at end of year $ 24,529 $ 19,422 $ 1,636 $ 1,352
Change in plan assets:
Fair value of plan assets, beginning of year $ 17,706 $ 17,648 $ -- $ --
Actual return on plan assets (2,209) (34) -- --
Employer contribution 827 827 19 103
Benefits paid (705) (735) (19) (103)
Fair value of plan assets at end of year $ 15,619 $ 17,706 $ -- $ --
The accumulated benefit obligation for the pension plan was $20,124,000 as of July 31, 2009 and $16,362,000 as of
July 31, 2008.
The following table shows amounts recognized in the Consolidated Statement of Financial Position as of July 31 (in
thousands):
Pension Benefits
Postretirement Health
Benefits
2009 2008 2009 2008
Deferred income taxes $ 2,591 $ (99) $ 218 $ 173
Other current liabilities -- -- (55) (42)
Other noncurrent liabilities(8,910) (1,716) (1,581) (1,310)
Accumulated other comprehensive income –net
of tax:
Net actuarial loss (gain)4,144 (275) 307 223
Prior service cost 85 114 -- --Net obligation at transition -- -- 49 59
$ (2,090) $ (1,976) $ (1,062) $ (897)
The following table shows amounts net of tax that are components of other comprehensive income for the fiscal years
ended July 31 (in thousands):
Pension Benefits
Postretirement
Health Benefits
2009 2008 2009 2008
Net actuarial loss $ 4,419 $ 863 $ 92 $ 133
Amortization of:
Prior service cost (29) (31) -- --
Net asset (obligation) at transition -- 16 (10) (10)
Amortization of actuarial gain (loss) -- 9 (9) (2)
$ 4,390 $ 857 $ 73 $ 121
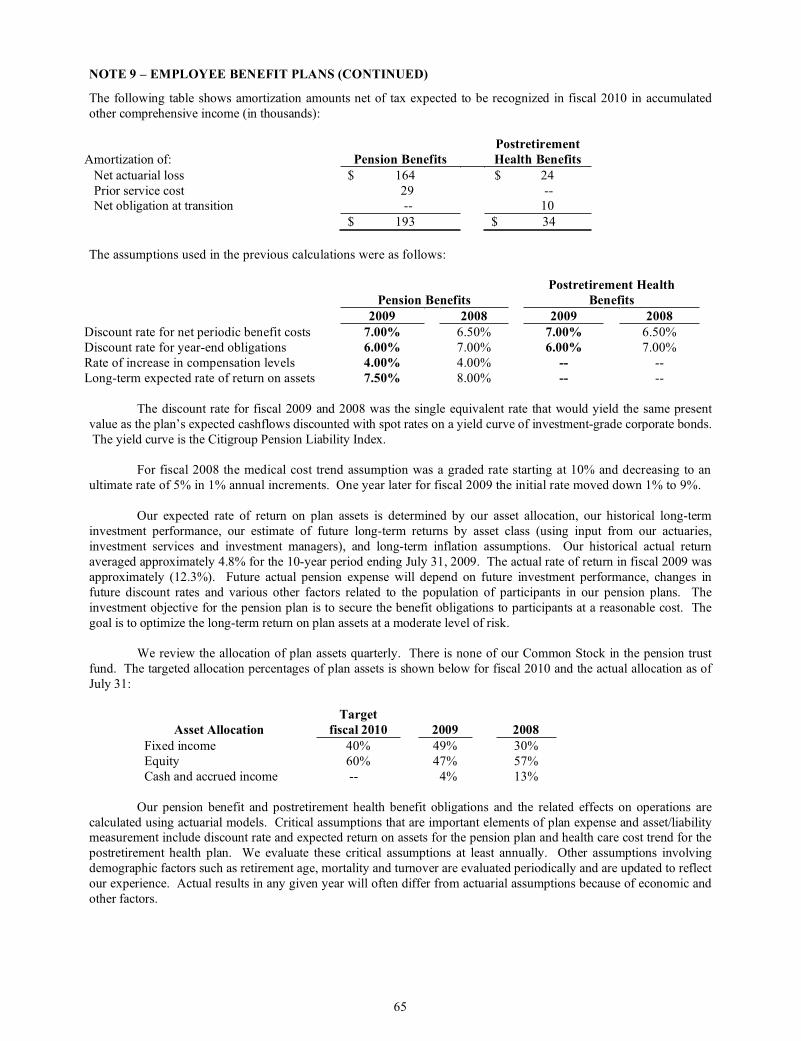
NOTE 9 – EMPLOYEE BENEFIT PLANS (CONTINUED)
65
The following table shows amortization amounts net of tax expected to be recognized in fiscal 2010 in accumulated
other comprehensive income (in thousands):
Amortization of: Pension Benefits
Postretirement
Health Benefits
Net actuarial loss $ 164 $ 24
Prior service cost 29 --Net obligation at transition -- 10
$ 193 $ 34
The assumptions used in the previous calculations were as follows:
Pension Benefits
Postretirement Health
Benefits
2009 2008 2009 2008
Discount rate for net periodic benefit costs 7.00% 6.50% 7.00% 6.50%
Discount rate for year-end obligations 6.00% 7.00% 6.00% 7.00%
Rate of increase in compensation levels 4.00% 4.00% -- --
Long-term expected rate of return on assets 7.50% 8.00% -- --
The discount rate for fiscal 2009 and 2008 was the single equivalent rate that would yield the same present
value as the plan’s expected cashflows discounted with spot rates on a yield curve of investment-grade corporate bonds.
The yield curve is the Citigroup Pension Liability Index.
For fiscal 2008 the medical cost trend assumption was a graded rate starting at 10% and decreasing to an
ultimate rate of 5% in 1% annual increments. One year later for fiscal 2009 the initial rate moved down 1% to 9%.
Our expected rate of return on plan assets is determined by our asset allocation, our historical long-term
investment performance, our estimate of future long-term returns by asset class (using input from our actuaries,
investment services and investment managers), and long-term inflation assumptions. Our historical actual return
averaged approximately 4.8% for the 10-year period ending July 31, 2009. The actual rate of return in fiscal 2009 was
approximately (12.3%). Future actual pension expense will depend on future investment performance, changes in
future discount rates and various other factors related to the population of participants in our pension plans. The
investment objective for the pension plan is to secure the benefit obligations to participants at a reasonable cost. The
goal is to optimize the long-term return on plan assets at a moderate level of risk.
We review the allocation of plan assets quarterly. There is none of our Common Stock in the pension trust
fund. The targeted allocation percentages of plan assets is shown below for fiscal 2010 and the actual allocation as of
July 31:
Asset Allocation
Target
fiscal 2010 2009 2008
Fixed income 40% 49% 30%
Equity 60% 47% 57%
Cash and accrued income -- 4% 13%
Our pension benefit and postretirement health benefit obligations and the related effects on operations are
calculated using actuarial models. Critical assumptions that are important elements of plan expense and asset/liabilitymeasurement include discount rate and expected return on assets for the pension plan and health care cost trend for the
postretirement health plan. We evaluate these critical assumptions at least annually. Other assumptions involving
demographic factors such as retirement age, mortality and turnover are evaluated periodically and are updated to reflect
our experience. Actual results in any given year will often differ from actuarial assumptions because of economic and
other factors.
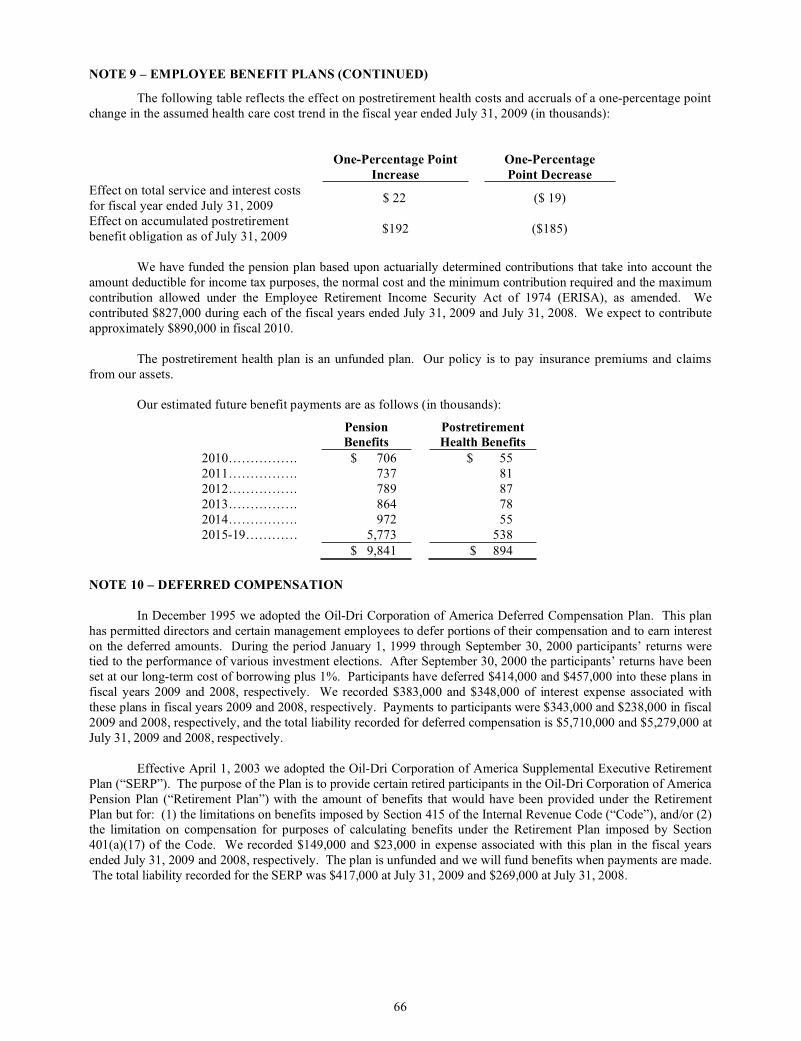
NOTE 9 – EMPLOYEE BENEFIT PLANS (CONTINUED)
66
The following table reflects the effect on postretirement health costs and accruals of a one-percentage point
change in the assumed health care cost trend in the fiscal year ended July 31, 2009 (in thousands):
One-Percentage Point
Increase
One-Percentage
Point Decrease
Effect on total service and interest costs
for fiscal year ended July 31, 2009$ 22 ($ 19)
Effect on accumulated postretirement
benefit obligation as of July 31, 2009$192 ($185)
We have funded the pension plan based upon actuarially determined contributions that take into account the
amount deductible for income tax purposes, the normal cost and the minimum contribution required and the maximum
contribution allowed under the Employee Retirement Income Security Act of 1974 (ERISA), as amended. We
contributed $827,000 during each of the fiscal years ended July 31, 2009 and July 31, 2008. We expect to contribute
approximately $890,000 in fiscal 2010.
The postretirement health plan is an unfunded plan. Our policy is to pay insurance premiums and claims
from our assets.
Our estimated future benefit payments are as follows (in thousands):
NOTE 10 – DEFERRED COMPENSATION
In December 1995 we adopted the Oil-Dri Corporation of America Deferred Compensation Plan. This plan
has permitted directors and certain management employees to defer portions of their compensation and to earn interest
on the deferred amounts. During the period January 1, 1999 through September 30, 2000 participants’ returns weretied to the performance of various investment elections. After September 30, 2000 the participants’ returns have been
set at our long-term cost of borrowing plus 1%. Participants have deferred $414,000 and $457,000 into these plans in
fiscal years 2009 and 2008, respectively. We recorded $383,000 and $348,000 of interest expense associated with
these plans in fiscal years 2009 and 2008, respectively. Payments to participants were $343,000 and $238,000 in fiscal
2009 and 2008, respectively, and the total liability recorded for deferred compensation is $5,710,000 and $5,279,000 at
July 31, 2009 and 2008, respectively.
Effective April 1, 2003 we adopted the Oil-Dri Corporation of America Supplemental Executive Retirement
Plan (“SERP”). The purpose of the Plan is to provide certain retired participants in the Oil-Dri Corporation of America
Pension Plan (“Retirement Plan”) with the amount of benefits that would have been provided under the Retirement
Plan but for: (1) the limitations on benefits imposed by Section 415 of the Internal Revenue Code (“Code”), and/or (2)the limitation on compensation for purposes of calculating benefits under the Retirement Plan imposed by Section
401(a)(17) of the Code. We recorded $149,000 and $23,000 in expense associated with this plan in the fiscal years
ended July 31, 2009 and 2008, respectively. The plan is unfunded and we will fund benefits when payments are made.
The total liability recorded for the SERP was $417,000 at July 31, 2009 and $269,000 at July 31, 2008.
Pension
Benefits
Postretirement
Health Benefits
2010……………. $ 706 $ 55
2011……………. 737 81
2012……………. 789 87
2013……………. 864 78
2014……………. 972 55
2015-19………… 5,773 538
$ 9,841 $ 894
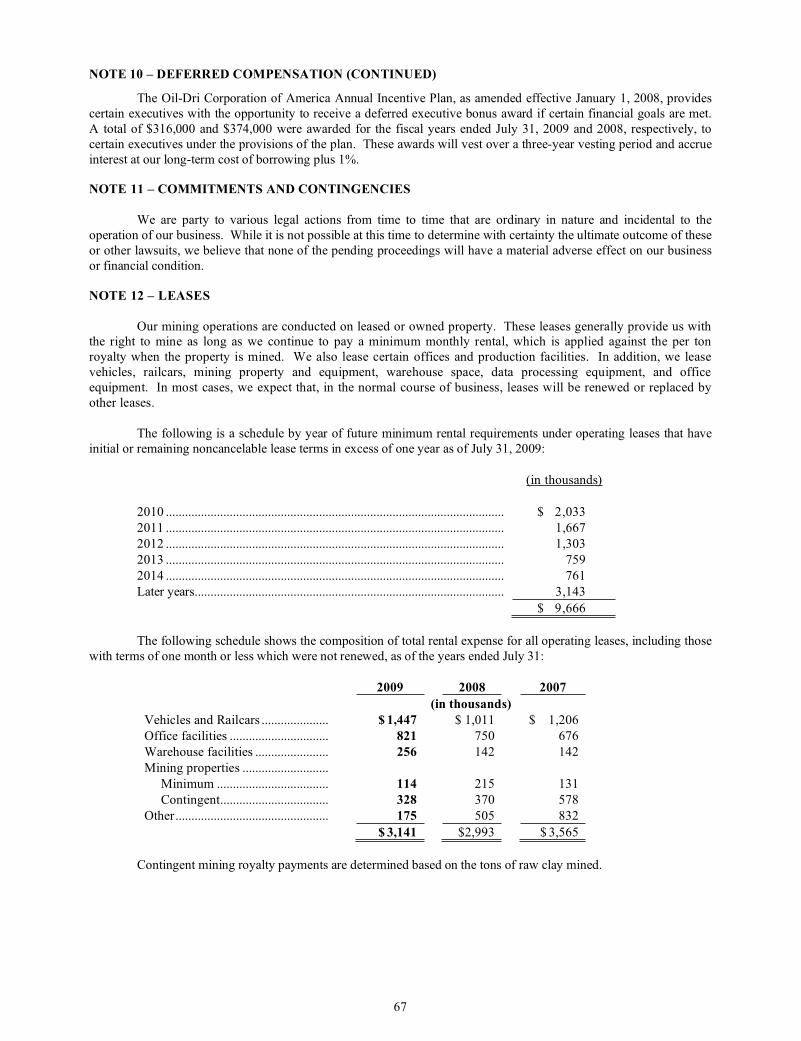
NOTE 10 – DEFERRED COMPENSATION (CONTINUED)
67
The Oil-Dri Corporation of America Annual Incentive Plan, as amended effective January 1, 2008, provides
certain executives with the opportunity to receive a deferred executive bonus award if certain financial goals are met.
A total of $316,000 and $374,000 were awarded for the fiscal years ended July 31, 2009 and 2008, respectively, to
certain executives under the provisions of the plan. These awards will vest over a three-year vesting period and accrue
interest at our long-term cost of borrowing plus 1%.
NOTE 11 – COMMITMENTS AND CONTINGENCIES
We are party to various legal actions from time to time that are ordinary in nature and incidental to the
operation of our business. While it is not possible at this time to determine with certainty the ultimate outcome of these
or other lawsuits, we believe that none of the pending proceedings will have a material adverse effect on our business
or financial condition.
NOTE 12 – LEASES
Our mining operations are conducted on leased or owned property. These leases generally provide us withthe right to mine as long as we continue to pay a minimum monthly rental, which is applied against the per ton
royalty when the property is mined. We also lease certain offices and production facilities. In addition, we lease
vehicles, railcars, mining property and equipment, warehouse space, data processing equipment, and office
equipment. In most cases, we expect that, in the normal course of business, leases will be renewed or replaced by
other leases.
The following is a schedule by year of future minimum rental requirements under operating leases that have
initial or remaining noncancelable lease terms in excess of one year as of July 31, 2009:
(in thousands)
2010 .......................................................................................................... $ 2,033
2011 .......................................................................................................... 1,667
2012 .......................................................................................................... 1,303
2013 .......................................................................................................... 759
2014 .......................................................................................................... 761
Later years................................................................................................. 3,143
$ 9,666
The following schedule shows the composition of total rental expense for all operating leases, including those
with terms of one month or less which were not renewed, as of the years ended July 31:
2009 2008 2007
(in thousands)
Vehicles and Railcars ..................... $ 1,447 $ 1,011 $ 1,206
Office facilities ............................... 821 750 676
Warehouse facilities ....................... 256 142 142
Mining properties ...........................
Minimum ................................... 114 215 131
Contingent.................................. 328 370 578
Other................................................ 175 505 832
$ 3,141 $2,993 $ 3,565
Contingent mining royalty payments are determined based on the tons of raw clay mined.
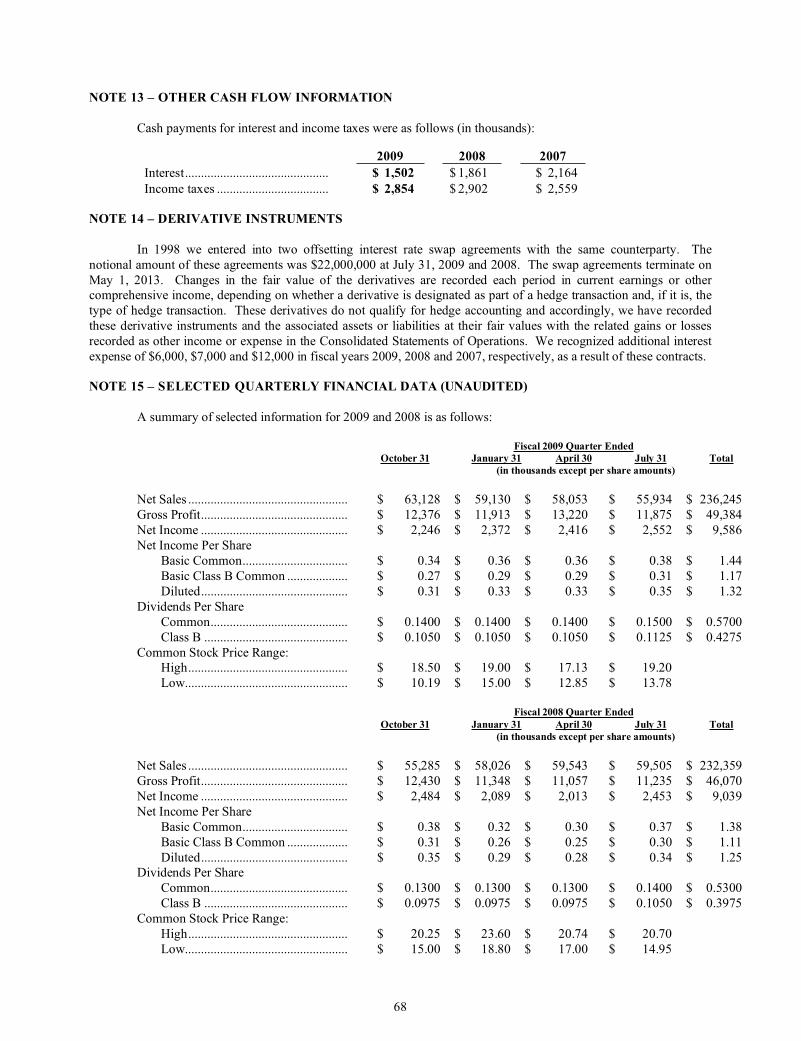
68
NOTE 13 – OTHER CASH FLOW INFORMATION
Cash payments for interest and income taxes were as follows (in thousands):
2009 2008 2007
Interest............................................. $ 1,502 $ 1,861 $ 2,164
Income taxes ................................... $ 2,854 $ 2,902 $ 2,559
NOTE 14 – DERIVATIVE INSTRUMENTS
In 1998 we entered into two offsetting interest rate swap agreements with the same counterparty. The
notional amount of these agreements was $22,000,000 at July 31, 2009 and 2008. The swap agreements terminate on
May 1, 2013. Changes in the fair value of the derivatives are recorded each period in current earnings or othercomprehensive income, depending on whether a derivative is designated as part of a hedge transaction and, if it is, the
type of hedge transaction. These derivatives do not qualify for hedge accounting and accordingly, we have recorded
these derivative instruments and the associated assets or liabilities at their fair values with the related gains or losses
recorded as other income or expense in the Consolidated Statements of Operations. We recognized additional interest
expense of $6,000, $7,000 and $12,000 in fiscal years 2009, 2008 and 2007, respectively, as a result of these contracts.
NOTE 15 – SELECTED QUARTERLY FINANCIAL DATA (UNAUDITED)
A summary of selected information for 2009 and 2008 is as follows:
Fiscal 2009 Quarter Ended
October 31 January 31 April 30 July 31 Total
(in thousands except per share amounts)
Net Sales .................................................. $ 63,128 $ 59,130 $ 58,053 $ 55,934 $ 236,245
Gross Profit.............................................. $ 12,376 $ 11,913 $ 13,220 $ 11,875 $ 49,384
Net Income .............................................. $ 2,246 $ 2,372 $ 2,416 $ 2,552 $ 9,586
Net Income Per Share
Basic Common................................. $ 0.34 $ 0.36 $ 0.36 $ 0.38 $ 1.44
Basic Class B Common ................... $ 0.27 $ 0.29 $ 0.29 $ 0.31 $ 1.17
Diluted.............................................. $ 0.31 $ 0.33 $ 0.33 $ 0.35 $ 1.32
Dividends Per Share
Common........................................... $ 0.1400 $ 0.1400 $ 0.1400 $ 0.1500 $ 0.5700
Class B ............................................. $ 0.1050 $ 0.1050 $ 0.1050 $ 0.1125 $ 0.4275
Common Stock Price Range:High.................................................. $ 18.50 $ 19.00 $ 17.13 $ 19.20
Low................................................... $ 10.19 $ 15.00 $ 12.85 $ 13.78
Fiscal 2008 Quarter Ended
October 31 January 31 April 30 July 31 Total
(in thousands except per share amounts)
Net Sales .................................................. $ 55,285 $ 58,026 $ 59,543 $ 59,505 $ 232,359
Gross Profit.............................................. $ 12,430 $ 11,348 $ 11,057 $ 11,235 $ 46,070
Net Income .............................................. $ 2,484 $ 2,089 $ 2,013 $ 2,453 $ 9,039
Net Income Per Share
Basic Common................................. $ 0.38 $ 0.32 $ 0.30 $ 0.37 $ 1.38
Basic Class B Common ................... $ 0.31 $ 0.26 $ 0.25 $ 0.30 $ 1.11
Diluted.............................................. $ 0.35 $ 0.29 $ 0.28 $ 0.34 $ 1.25Dividends Per Share
Common........................................... $ 0.1300 $ 0.1300 $ 0.1300 $ 0.1400 $ 0.5300
Class B ............................................. $ 0.0975 $ 0.0975 $ 0.0975 $ 0.1050 $ 0.3975
Common Stock Price Range:
High.................................................. $ 20.25 $ 23.60 $ 20.74 $ 20.70
Low................................................... $ 15.00 $ 18.80 $ 17.00 $ 14.95
69
MANAGEMENT’S REPORT ON INTERNAL CONTROL OVER FINANCIAL REPORTING
Our management is responsible for establishing and maintaining adequate internal control over financial
reporting, as such term is defined in Exchange Act Rules 13a-15f. Our internal control over financial reporting is a
process designed to provide reasonable assurance regarding the reliability of financial reporting and the preparation
of financial statements for external purposes in accordance with accounting principles generally accepted in theUnited States of America.
Under the supervision and with the participation of our management, including our principal executive
officer and principal financial officer, we conducted an assessment of the effectiveness of our internal control over
financial reporting based on the framework in Internal Control - Integrated Framework issued by the Committee
Sponsoring Organizations of the Treadway Commission (COSO). Based on our assessment, our management
concluded that our internal control over financial reporting was effective as of July 31, 2009.
Because of its inherent limitations, internal control over financial reporting may not prevent or detect
misstatements. Also, projections of any evaluation of effectiveness to future periods are subject to the risk that
controls may become inadequate because of changes in conditions, or that the degree of compliance with the
policies or procedures may deteriorate.
Our internal controls over financial reporting as of July 31, 2009 have been audited by
PricewaterhouseCoopers LLP, an independent registered public accounting firm, as stated in their report which
appears on the next page of this Annual Report on Form 10-K.
70
REPORT OF INDEPENDENT REGISTERED PUBLIC ACCOUNTING FIRM
To Board of Directors and Stockholders of Oil-Dri Corporation of America:
In our opinion, the accompanying consolidated financial statements listed in the index appearing under
Item 15(a)(1) present fairly, in all material respects, the financial position of Oil-Dri Corporation of America and its
subsidiaries at July 31, 2009 and 2008, and the results of their operations and their cash flows for each of the three
years in the period ended July 31, 2009 in conformity with accounting principles generally accepted in the United
States of America. In addition, in our opinion, the financial statement schedule listed in the accompanying index
appearing under Item 15(a)(2) presents fairly, in all material respects, the information set forth therein when read in
conjunction with the related consolidated financial statements. Also in our opinion, the Company maintained, in all
material respects, effective internal control over financial reporting as of July 31, 2009, based on criteria established
in Internal Control - Integrated Framework issued by the Committee of Sponsoring Organizations of the Treadway
Commission (COSO). The Company’s management is responsible for these financial statements and financial
statement schedules, for maintaining effective internal control over financial reporting and for its assessment of the
effectiveness of internal control over financial reporting, included in Management’s Report on Internal Control over
Financial Reporting. Our responsibility is to express opinions on these financial statements, on the financial
statement schedules, and on the Company’s internal control over financial reporting based on our audits (which were
integrated audits in 2009 and 2008). We conducted our audits in accordance with the standards of the Public
Company Accounting Oversight Board (United States). Those standards require that we plan and perform the audits
to obtain reasonable assurance about whether the financial statements are free of material misstatement and whether
effective internal control over financial reporting was maintained in all material respects. Our audits of the financial
statements included examining, on a test basis, evidence supporting the amounts and disclosures in the financial
statements, assessing the accounting principles used and significant estimates made by management, and evaluating
the overall financial statement presentation. Our audit of internal control over financial reporting included obtaining
an understanding of internal control over financial reporting, assessing the risk that a material weakness exists, and
testing and evaluating the design and operating effectiveness of internal control based on the assessed risk. Our
audits also included performing such other procedures as we considered necessary in the circumstances. We believe
that our audits provide a reasonable basis for our opinions.
A company’s internal control over financial reporting is a process designed to provide reasonable assurance
regarding the reliability of financial reporting and the preparation of financial statements for external purposes in
accordance with generally accepted accounting principles. A company’s internal control over financial reporting
includes those policies and procedures that (i) pertain to the maintenance of records that, in reasonable detail,
accurately and fairly reflect the transactions and dispositions of the assets of the company; (ii) provide reasonable
assurance that transactions are recorded as necessary to permit preparation of financial statements in accordance
with generally accepted accounting principles, and that receipts and expenditures of the company are being made
only in accordance with authorizations of management and directors of the company; and (iii) provide reasonable
assurance regarding prevention or timely detection of unauthorized acquisition, use, or disposition of the company’s
assets that could have a material effect on the financial statements.
Because of its inherent limitations, internal control over financial reporting may not prevent or detect
misstatements. Also, projections of any evaluation of effectiveness to future periods are subject to the risk that
controls may become inadequate because of changes in conditions, or that the degree of compliance with the
policies or procedures may deteriorate.
/s/PricewaterhouseCoopers LLP
PricewaterhouseCoopers LLP
Chicago, Illinois
October 9, 2009
71
ITEM 9 – CHANGES IN AND DISAGREEMENTS WITH ACCOUNTANTS ON ACCOUNTING AND
FINANCIAL DISCLOSURE
None.
ITEM 9A – CONTROLS AND PROCEDURES
Evaluation of Disclosure Controls and Procedures
Management conducted an evaluation of the effectiveness of the design and operation of our disclosure
controls and procedures as of the end of the period covered by this Form 10-K. The controls evaluation was conducted
under the supervision and with the participation of management, including our Chief Executive Officer (“CEO”) and
Chief Financial Officer (“CFO”). Based upon the controls evaluation, our CEO and CFO have concluded that, as of
the end of the period covered by this report, our disclosure controls and procedures were effective to provide
reasonable assurance that information required to be disclosed in our Exchange Act reports is recorded, processed,summarized and reported within the time periods specified by the SEC, and that such information is accumulated and
communicated to management, including the CEO and CFO, as appropriate to allow timely decisions regarding
required disclosure.
Management’s Report on Internal Control Over Financial Reporting
Management’s Report on Internal Control Over Financial Reporting is set forth in Part II, Item 8 of this
Annual Report on Form 10-K.
Changes in Internal Control over Financial Reporting
There were no changes in our internal control over financial reporting that occurred during our most recently
completed fiscal quarter that have materially affected, or are reasonably likely to materially affect, our internal control
over financial reporting.
Inherent Limitations on Effectiveness of Controls
Our management, including the CEO and CFO, do not expect that our disclosure controls and procedures or
our internal control over financial reporting will prevent or detect all errors and all fraud. A control system, no
matter how well designed and operated, can provide only reasonable, not absolute, assurance that the control
system’s objectives will be met. The design of a control system must reflect the fact that there are resource
constraints, and the benefits of controls must be considered relative to their costs. Further, because of the inherent
limitations in all control systems, no evaluation of controls can provide absolute assurance that misstatements due toerror or fraud will not occur or that all control issues and instances of fraud, if any, within the Company have been
detected. These inherent limitations include the realities that judgments in decision-making can be faulty and that
breakdowns can occur because of simple error or mistake. Controls can also be circumvented by the individual acts
of some persons, by collusion of two or more people, or by management override of the controls. The design of any
system of controls is based in part on certain assumptions about the likelihood of future events, and there can be no
assurance that any design will succeed in achieving its stated goals under all potential future conditions. Projections
of any evaluation of controls effectiveness to future periods are subject to risks. Over time, controls may become
inadequate because of changes in conditions or deterioration in the degree of compliance with policies or
procedures.
ITEM 9B – OTHER INFORMATION
None.
72
PART III
ITEM 10 – DIRECTORS, EXECUTIVE OFFICERS AND CORPORATE GOVERNANCE
The information required by this Item (except as set forth below) is contained in Oil-Dri’s Proxy Statement for
its 2009 annual meeting of stockholders (“Proxy Statement”) under the captions “1. Election of Directors,” “Executive
Officers,” “Section 16(a) Beneficial Ownership Reporting Compliance,” “Director Nominations,” “Audit Committee”
and “Corporate Governance Matters” and is incorporated herein by this reference.
The Company has adopted a Code of Ethics and Business Conduct (the “Code”) which applies to all of its
directors, officers (including the Company’s Chief Executive Officer and senior financial officers) and employees. The
Code imposes significant responsibilities on the Chief Executive Officer and the senior financial officers of the
Company. The Code, the Company’s Corporate Governance Guidelines and the charter of its Audit Committee may be
viewed on the Company’s website, www.oildri.com and are available in print to any person upon request to Investor
Relations, Oil-Dri Corporation of America, 410 North Michigan Avenue, Suite 400, Chicago, Illinois 60611-4213,
telephone (312) 321-1515 or e-mail to [email protected]. Any amendment to, or waiver of, a provision of the Codewhich applies to the Company’s Chief Executive Officer or senior financial officers and relates to the elements of a
“code of ethics” as defined by the SEC will also be posted on the Company’s website. As allowed by the controlled
company exemption to certain NYSE rules, the Company does not have a nominating/corporate governance committee
and its compensation committee does not have a charter.
On December 22, 2008 we filed with the NYSE the Annual CEO Certification regarding our compliance with
the NYSE corporate governance listing standards as required by Section 303A.12(a) of the NYSE Listed Company
Manual. In addition, we have filed as exhibits to this Annual Report on Form 10-K the applicable certifications of our
Chief Executive Officer and our Chief Financial Officer required under Section 302 of the Sarbanes-Oxley Act of
2002, regarding the quality of our public disclosures.
ITEM 11 – EXECUTIVE COMPENSATION
The information required by this Item is contained in Oil-Dri’s Proxy Statement under the captions
“Executive Compensation,” “Report of the Compensation Committee of the Board of Directors,” “Compensation of
Directors,” “Compensation Committee” and “Compensation Committee Interlocks and Insider Participation” and is
incorporated herein by reference.
ITEM 12 – SECURITY OWNERSHIP OF CERTAIN BENEFICIAL OWNERS AND MANAGEMENT AND
RELATED STOCKHOLDER MATTERS
The information required by this Item is contained in Oil-Dri’s Proxy Statement under the captions “Principal
Stockholders.” “Security Ownership of Management” and “Equity Compensation Plans” and is incorporated herein by
reference.
ITEM 13 – CERTAIN RELATIONSHIPS AND RELATED TRANSACTIONS AND DIRECTOR
INDEPENDENCE
The information required by this Item is contained in Oil-Dri’s Proxy Statement under the captions “Certain
Relationships and Related Transactions” and “Director Independence” and is incorporated herein by reference.
ITEM 14 – PRINCIPAL ACCOUNTANTS FEES AND SERVICES
The information required by this Item is contained in Oil-Dri’s Proxy Statement under the caption “Auditor
Fees” and is incorporated herein by reference.
73
PART IV
ITEM 15 – EXHIBITS AND FINANCIAL STATEMENT SCHEDULE
(a)(1) The following consolidated financial statements are contained herein.
Consolidated Balance Sheets as of July 31, 2009 and July 31, 2008.
Consolidated Statements of Operations for the fiscal years ended July 31, 2009, July 31, 2008 and
July 31, 2007.
Consolidated Statements of Stockholders’ Equity for the fiscal years ended July 31, 2009, July 31,
2008 and July 31, 2007.
Consolidated Statements of Cash Flows for the fiscal years ended July 31, 2009, July 31, 2008 and
July 31, 2007.
Notes to Consolidated Financial Statements.
Report of Independent Registered Public Accounting Firm.
(a)(2) The following financial statement schedule is contained herein:
Schedule to Financial Statements, as follows:
Schedule II - Valuation and Qualifying Accounts, years ended July 31, 2009, July 31, 2008 and July
31, 2007.
All other schedules are omitted because they are inapplicable, not required under the instructions or
the information is included in the consolidated financial statements or notes thereto.
(a)(3) The following documents are exhibits to this Report:
Exhibit
No. Description SEC Document Reference
3.1 Certificate of Incorporation of Oil-Dri, as amended. Incorporated by reference to Exhibit 4.1 to Oil-Dri’s
Registration Statement on Form S-8 (RegistrationNo. 333-57625), filed on June 24, 1998.
3.2 By-Laws of Oil-Dri Corporation of America, as
Amended and Restated on December 5, 2006.
Incorporated by reference to Exhibit 3.1 to Oil-Dri’s
(file No. 001-12622) Current Report on Form 8-K
filed on December 11, 2006.
10.1 Memorandum of Agreement #1450 “Fresh Step“�
dated as of March 12, 2001 between A&M
Products Manufacturing Company and Oil-Dri
(confidential treatment of certain portions of this
exhibit has been granted).
Incorporated by reference to Exhibit 10(s) to Oil-
Dri’s (File No. 001-12622) Current Report on Form
8-K filed on May 1, 2001.
10.2 First Amendment, dated as of December 13, 2002,
to Memorandum of Agreement #1450 “Fresh
Step”� dated as of March 12, 2001.
Incorporated by reference to Exhibit 10.2 to Oil-
Dri’s (File No. 001-12622) Annual Report on Form
10-K for the fiscal year ended July 31, 2007.
10.3 Second Amendment, dated as of October 15, 2007,
to Memorandum of Agreement #1450 “Fresh
Step”� dated as of March 12, 2001.
Incorporated by reference to Exhibit 10.1 to Oil-
Dri’s (File No. 001-12622) Quarterly Report on
Form 10-Q for the quarter ended April 30, 2008.
74
Exhibit
No. Description SEC Document Reference
10.4 Exclusive Supply Agreement dated May 19, 1999
between Church & Dwight Co., Inc. and Oil-Dri
(confidential treatment of certain portions of thisexhibit has been granted).
Incorporated by reference to Exhibit (10)(r) to Oil-
Dri’s (File No. 001-12622) Annual Report on Form
10-K for the fiscal year ended July 31, 1999.
10.5 $25,000,000 Note Purchase Agreement dated as of
April 15, 1998 between Oil-Dri and Teachers
Insurance and Annuity Association of America and
Cigna Investments, Inc.
Incorporated by reference to Exhibit (10)(m) to Oil-
Dri’s (File No. 001-12622) Quarterly Report on
Form 10-Q for the quarter ended April 30, 1998.
10.6 First Amendment, dated as of January 15, 2001 to
the Note Purchase Agreement dated as of April 15,
1998.
Incorporated by reference to Exhibit (10)(m)(5) to
Oil-Dri’s (File No. 001-12622) Quarterly Report on
Form 10-Q for the quarter ended January 31, 2001.
10.7 Second Amendment, dated as of July 15, 2002 toNote Purchase Agreement dated as of April 15,
1998.
Incorporated by reference to Exhibit 10(m)(6) toOil-Dri’s (File No. 001-12622) Annual Report on
Form 10-K for the fiscal year ended July 31, 2002.
10.8 Third Amendment, dated as of January 27, 2006 to
Note Purchase Agreement dated as of April 15,
1998.
Incorporated by reference to Exhibit 10.2 to Oil-
Dri’s (File No. 001-12622) Current Report on Form
8-K filed on February 1, 2006.
10.9 $15,000,000 Credit Agreement, dated January 27,
2006 among the Company, certain subsidiaries of
the Company and Harris N.A.
Incorporated by reference to Exhibit 10.1 to Oil-
Dri’s (File No. 001-12622) Current Report on Form
8-K filed on February 1, 2006.
10.10 First Amendment, dated as of December 19, 2008 to
Credit Agreement dated as of January 27, 2006.
Incorporated by reference to Exhibit 10.1 to Oil-
Dri’s (File No. 001-12622) Quarterly Report on
Form 10-Q for the quarter ended January 31, 2009.
10.11 $15,000,000 Note Agreement dated as of December
16, 2005 among the Company, The Prudential
Insurance Company of America and Prudential
Retirement Insurance and Annuity Company.
Incorporated by reference to Exhibit 10.1 to Oil-
Dri’s (File No. 001-12622) Current Report on Form
8-K filed on December 22, 2005.
10.12 First Amendment, dated as of July 12, 2006 to Note
Agreement dated as of December 16, 2005.
Incorporated by reference to Exhibit 10.9 to Oil-
Dri’s (File No. 001-12622) Annual Report on Form
10-K for the fiscal year ended July 31, 2006.
10.13 Description of 1987 Executive Deferred
Compensation Program.*
Incorporated by reference to Exhibit (10)(f) to Oil-
Dri’s (File No. 001-12622) Annual Report on Form
10-K for the fiscal year ended July 31, 1988.
10.14 Salary Continuation Agreement dated August 1,
l989 between Richard M. Jaffee and Oil-Dri (“1989
Agreement”).*
Incorporated by reference to Exhibit (10)(g) to Oil-
Dri’s (File No. 001-12622) Annual Report on Form
10-K for the fiscal year ended July 31, 1989.
10.15 Extension and Amendment, dated October 9, 1998,
to the 1989 Agreement.*
Incorporated by reference to Exhibit 10.12 to Oil-
Dri’s (File No. 001-12622) Annual Report on Form
10-K for the fiscal year ended July 31, 2006.
10.16 Second Amendment, effective October 31, 2000, to
the 1989 Agreement.*
Incorporated by reference to Exhibit 99.1 to Oil-
Dri’s (File No. 001-12622) Current Report on Form
8-K filed on November 13, 2000.
75
Exhibit
No. Description SEC Document Reference
10.17 Third Amendment, dated as of January 31, 2006, to
the 1989 Agreement.*
Incorporated by reference to Exhibit 10.1 to Oil-
Dri’s (File No. 001-12622) Current Report on Form
8-K filed on February 13, 2006.
10.18 Oil-Dri Corporation of America Deferred
Compensation Plan, as amended and restated
effective April 1, 2003.*
Incorporated by reference to Exhibit (10)(j)(1) to
Oil-Dri’s (File No. 001-12622) Quarterly Report on
Form 10-Q for the quarter ended April 30, 2003.
10.19 First Amendment, effective as of January 1, 2007,
to Oil-Dri Corporation of America Deferred
Compensation Plan, as amended and restated
effective April 1, 2003.*
Incorporated by reference to Exhibit 10.1 to Oil-
Dri’s (File No. 001-12622) Quarterly Report on
Form 10-Q for the quarter ended January 31, 2008.
10.20 Second Amendment, effective as of January 1,
2008, to Oil-Dri Corporation of America Deferred
Compensation Plan, as amended and restatedeffective April 1, 2003.*
Incorporated by reference to Exhibit 10.1 to Oil-
Dri’s (File No. 001-12622) Quarterly Report on
Form 10-Q for the quarter ended January 31, 2008.
10.21 Oil-Dri Corporation of America 1995 Long-Term
Incentive Plan as amended and restated effective
June 9, 2000.*
Incorporated by reference to Exhibit (10)(k) to Oil-
Dri’s (File No. 001-12622) Annual Report on Form
10-K for the fiscal year ended July 31, 2000.
10.22 Supplemental Executive Retirement Plan dated
April 1, 2003.*
Incorporated by reference to Exhibit (10)(1) to Oil-
Dri’s (File No. 001-12622) Quarterly Report on
Form 10-Q for the quarter ended April 30, 2003.
10.23 Oil-Dri Corporation of America Outside DirectorStock Plan as amended and restated effective
October 16, 1999.*
Incorporated by reference to Exhibit (10)(n) to Oil-Dri’s (File No. 001-12622) Annual Report on Form
10-K for the fiscal year ended July 31, 2000.
10.24 Oil-Dri Corporation of America Annual Incentive
Plan (as amended and restated effective January 1,
2008).*
Incorporated by reference to Exhibit 10.4 to Oil-
Dri’s (File No. 001-12622) Quarterly Report on
Form 10-Q for the quarter ended January 31, 2008.
10.25 Restricted Stock Agreement, dated as of March 14,
2006, between Oil-Dri Corporation of America and
Daniel S. Jaffee.*
Incorporated by reference to Exhibit 10.3 to Oil-
Dri’s (File No. 001-12622) Current Report on Form
8-K filed on March 20, 2006.
10.26 Oil-Dri Corporation of America 2005 DeferredCompensation Plan (as amended and restated
effective January 1, 2008)*
Incorporated by reference to Exhibit 10.3 to Oil-Dri’s (File No. 001-12622) Quarterly Report on
Form 10-Q for the quarter ended January 31, 2008.
10.27 Oil-Dri Corporation of America 2006 Long Term
Incentive Plan (as amended and restated effective
July 28, 2006)*
Incorporated by reference to Appendix A to Oil-
Dri’s (File No. 001-12622) Definitive Proxy
Statement on Schedule 14A filed on November 3,
2006.
10.28 First Amendment, effective as of January 1, 2008,
to Oil-Dri Corporation of America 2006 Long Term
Incentive Plan (as amended and restated effectiveJuly 28, 2006)*
Incorporated by reference to Exhibit 10.5 to Oil-
Dri’s (File No. 001-12622) Quarterly Report on
Form 10-Q for the quarter ended January 31, 2008.
10.29 Form of Oil-Dri Corporation of America 2006 Long
Term Incentive Plan Employee Stock Option
Agreement for Class A Common Stock.*
Incorporated by reference to Exhibit 10.2 to Oil-
Dri’s (file No. 001-12622) Current Report on Form
8-K filed on December 11, 2006.
76
Exhibit
No. Description SEC Document Reference
10.30 Form of Oil-Dri Corporation of America 2006 Long
Term Incentive Plan Employee Stock Option
Agreement for Common Stock.*
Incorporated by reference to Exhibit 10.3 to Oil-
Dri’s (file No. 001-12622) Current Report on Form
8-K filed on December 11, 2006.
10.31 Form of Oil-Dri Corporation of America 2006 Long
Term Incentive Plan Employee Stock Option
Agreement for Class B Stock.*
Incorporated by reference to Exhibit 10.4 to Oil-
Dri’s (file No. 001-12622) Current Report on Form
8-K filed on December 11, 2006.
10.32 Form of Oil-Dri Corporation of America 2006 Long
Term Incentive Plan Director Stock Option
Agreement for Common Stock.*
Incorporated by reference to Exhibit 10.5 to Oil-
Dri’s (file No. 001-12622) Current Report on Form
8-K filed on December 11, 2006.
10.33 Form of Oil-Dri Corporation of America 2006 Long
Term Incentive Plan Restricted Stock Agreement
for Class A Common Stock.*
Incorporated by reference to Exhibit 10.6 to Oil-
Dri’s (file No. 001-12622) Current Report on Form
8-K filed on December 11, 2006.
10.34 Form of Oil-Dri Corporation of America 2006 Long
Term Incentive Plan Restricted Stock Agreement
for Common Stock.*
Incorporated by reference to Exhibit 10.7 to Oil-
Dri’s (file No. 001-12622) Current Report on Form
8-K filed on December 11, 2006.
10.35 Form of Oil-Dri Corporation of America 2006 Long
Term Incentive Plan Restricted Stock Agreement
for Class B Stock.*
Incorporated by reference to Exhibit 10.8 to Oil-
Dri’s (file No. 001-12622) Current Report on Form
8-K filed on December 11, 2006.
11.1 Statement re: Computation of Income per Share. Filed herewith.
14.1 Code of Ethics Available at Oil-Dri’s website www.oildri.com or inprint upon request to Investor Relations, Oil-Dri
Corporation of America, 410 North Michigan
Avenue, Suite 400, Chicago, IL 60611-4213,
telephone (312) 321-1515 or e-mail to
21.1 Subsidiaries of Oil-Dri. Filed herewith.
23.1 Consent of PricewaterhouseCoopers LLP. Filed herewith.
31.1 Certifications pursuant to Rule 13a – 14(a). Filed herewith.
32.1 Certifications pursuant to Section 1350 of the
Sarbanes-Oxley Act of 2002.
Furnished herewith.
* Management contract or compensatory plan or arrangement.
77
SIGNATURES
Pursuant to the requirements of Section 13 or 15(d) of the Securities Exchange Act of 1934, Oil-Dri has duly
caused this report to be signed on its behalf by the undersigned, thereunto duly authorized.
OIL-DRI CORPORATION OF AMERICA(Registrant)
By /s/ Daniel S. Jaffee
Daniel S. Jaffee
President and Chief Executive Officer, Director
Dated: October 9, 2009
Pursuant to the requirements of the Securities Exchange Act of 1934, this report has been signed below by the
following persons on behalf of Oil-Dri and in the capacities and on the dates indicated:
/s/ Richard M. Jaffee October 9, 2009
Richard M. Jaffee
Chairman of the Board of Directors
/s/ Daniel S. Jaffee October 9, 2009
Daniel S. Jaffee
President and Chief Executive Officer, Director
(Principal Executive Officer)
/s/ Andrew N. Peterson October 9, 2009
Andrew N. PetersonVice President and Chief Financial Officer
(Principal Financial Officer)
/s/ Daniel T. Smith October 9, 2009
Daniel T. Smith
Vice President and Controller
(Principal Accounting Officer)
/s/ J. Steven Cole October 9, 2009
J. Steven Cole
Director
/s/ Arnold W. Donald October 9, 2009
Arnold W. Donald
Director
/s/ Joseph C. Miller October 9, 2009
Joseph C. Miller
Vice Chairman of the Board of Directors
78
/s/ Michael A. Nemeroff October 9, 2009
Michael A. Nemeroff
Director
/s/ Allan H. Selig October 9, 2009Allan H. Selig
Director
/s/ Paul E. Suckow October 9, 2009
Paul E. Suckow
Director
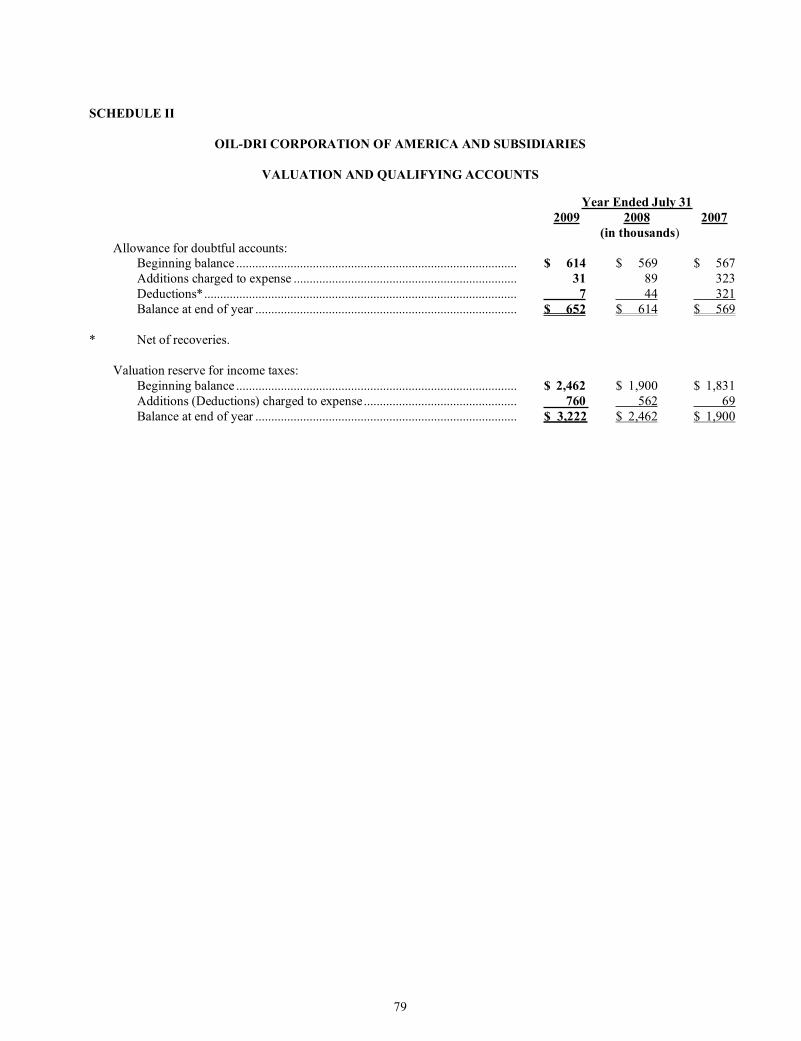
79
SCHEDULE II
OIL-DRI CORPORATION OF AMERICA AND SUBSIDIARIES
VALUATION AND QUALIFYING ACCOUNTS
Year Ended July 31
2009 2008 2007
(in thousands)
Allowance for doubtful accounts:Beginning balance ........................................................................................ $ 614 $ 569 $ 567
Additions charged to expense ...................................................................... 31 89 323
Deductions*.................................................................................................. 7 44 321
Balance at end of year .................................................................................. $ 652 $ 614 $ 569
* Net of recoveries.
Valuation reserve for income taxes:
Beginning balance ........................................................................................ $ 2,462 $ 1,900 $ 1,831
Additions (Deductions) charged to expense................................................ 760 562 69
Balance at end of year .................................................................................. $ 3,222 $ 2,462 $ 1,900
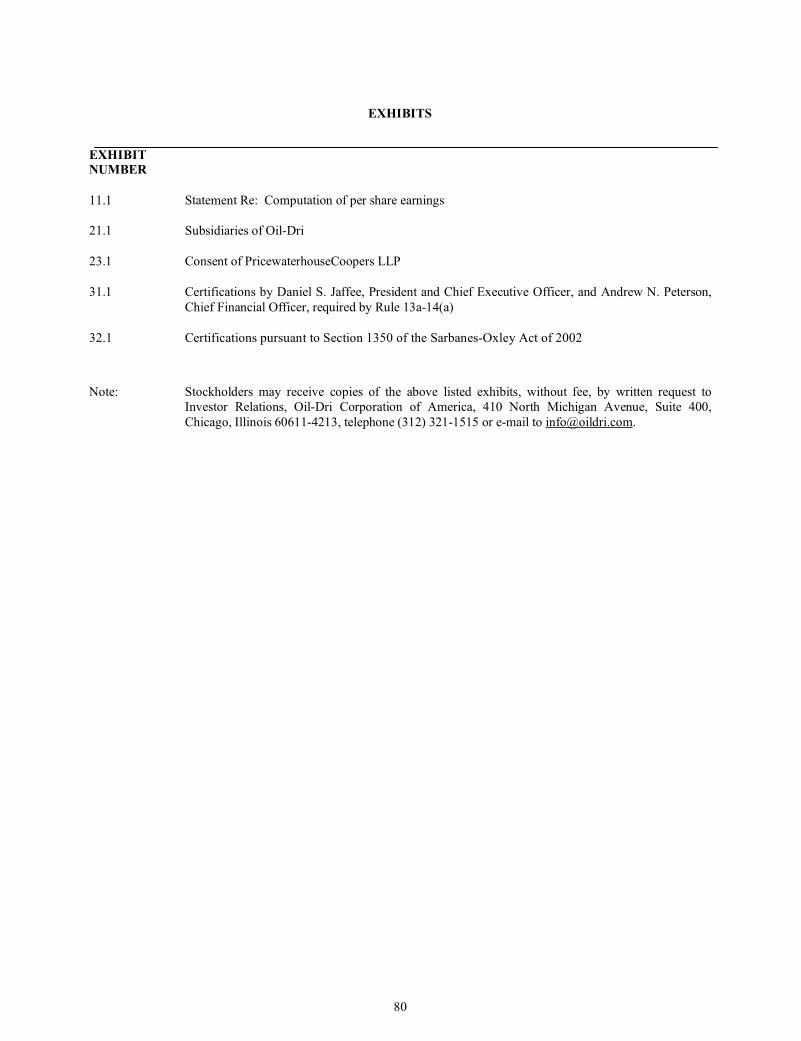
80
EXHIBITS
EXHIBIT
NUMBER
11.1 Statement Re: Computation of per share earnings
21.1 Subsidiaries of Oil-Dri
23.1 Consent of PricewaterhouseCoopers LLP
31.1 Certifications by Daniel S. Jaffee, President and Chief Executive Officer, and Andrew N. Peterson,
Chief Financial Officer, required by Rule 13a-14(a)
32.1 Certifications pursuant to Section 1350 of the Sarbanes-Oxley Act of 2002
Note: Stockholders may receive copies of the above listed exhibits, without fee, by written request toInvestor Relations, Oil-Dri Corporation of America, 410 North Michigan Avenue, Suite 400,
Chicago, Illinois 60611-4213, telephone (312) 321-1515 or e-mail to [email protected].
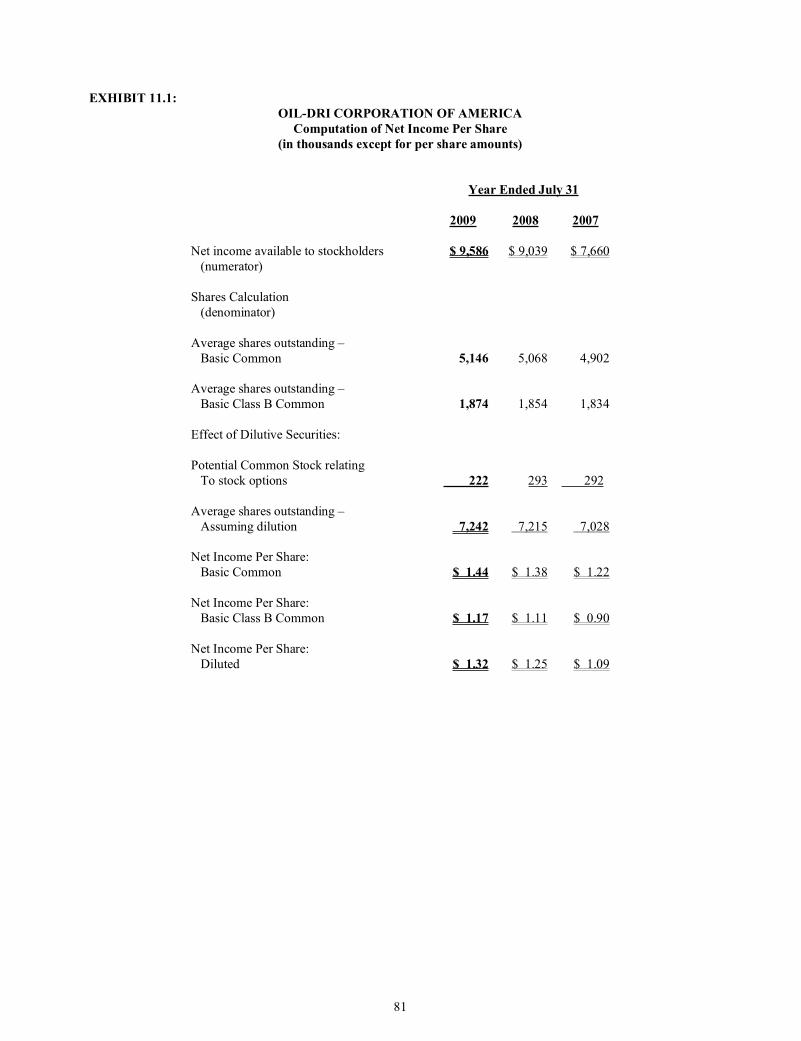
81
EXHIBIT 11.1:
OIL-DRI CORPORATION OF AMERICA
Computation of Net Income Per Share
(in thousands except for per share amounts)
Year Ended July 31
2009 2008 2007
Net income available to stockholders
(numerator)
$ 9,586 $ 9,039 $ 7,660
Shares Calculation
(denominator)
Average shares outstanding –
Basic Common 5,146 5,068 4,902
Average shares outstanding –
Basic Class B Common 1,874 1,854 1,834
Effect of Dilutive Securities:
Potential Common Stock relating
To stock options 222 293 292
Average shares outstanding –
Assuming dilution 7,242 7,215 7,028
Net Income Per Share:
Basic Common $ 1.44 $ 1.38 $ 1.22
Net Income Per Share:
Basic Class B Common $ 1.17 $ 1.11 $ 0.90
Net Income Per Share:
Diluted $ 1.32 $ 1.25 $ 1.09
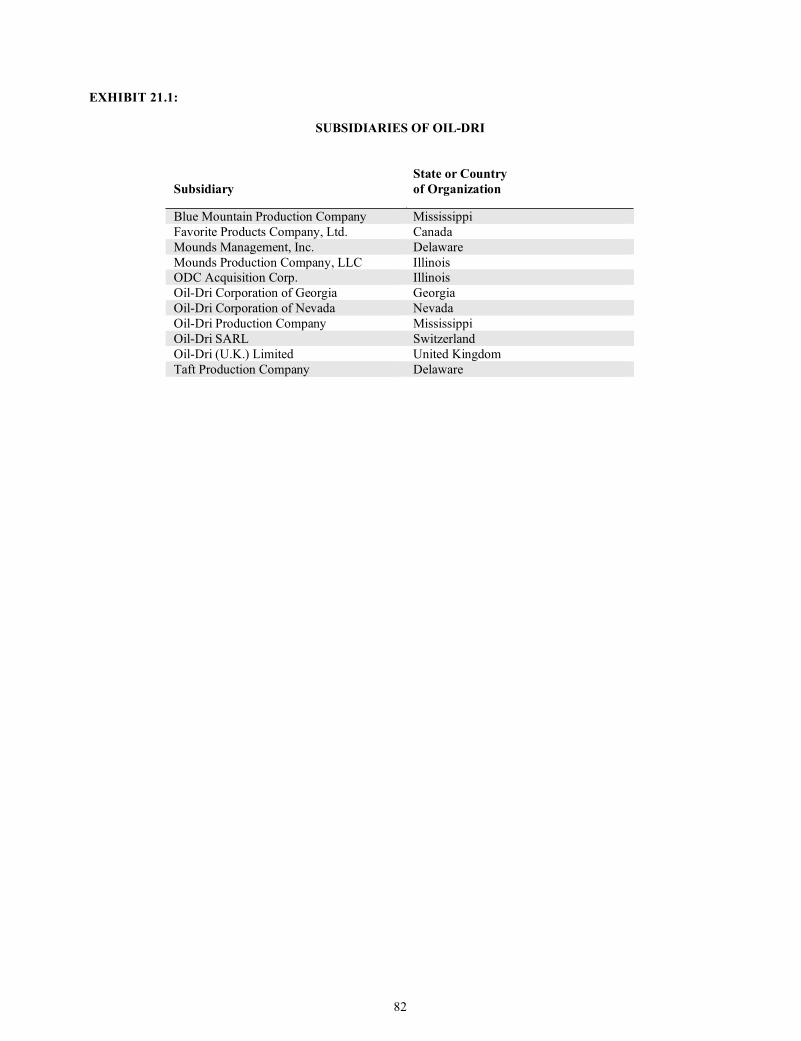
82
EXHIBIT 21.1:
SUBSIDIARIES OF OIL-DRI
Subsidiary
State or Country
of Organization
Blue Mountain Production Company Mississippi
Favorite Products Company, Ltd. Canada
Mounds Management, Inc. Delaware
Mounds Production Company, LLC IllinoisODC Acquisition Corp. Illinois
Oil-Dri Corporation of Georgia Georgia
Oil-Dri Corporation of Nevada Nevada
Oil-Dri Production Company Mississippi
Oil-Dri SARL Switzerland
Oil-Dri (U.K.) Limited United Kingdom
Taft Production Company Delaware
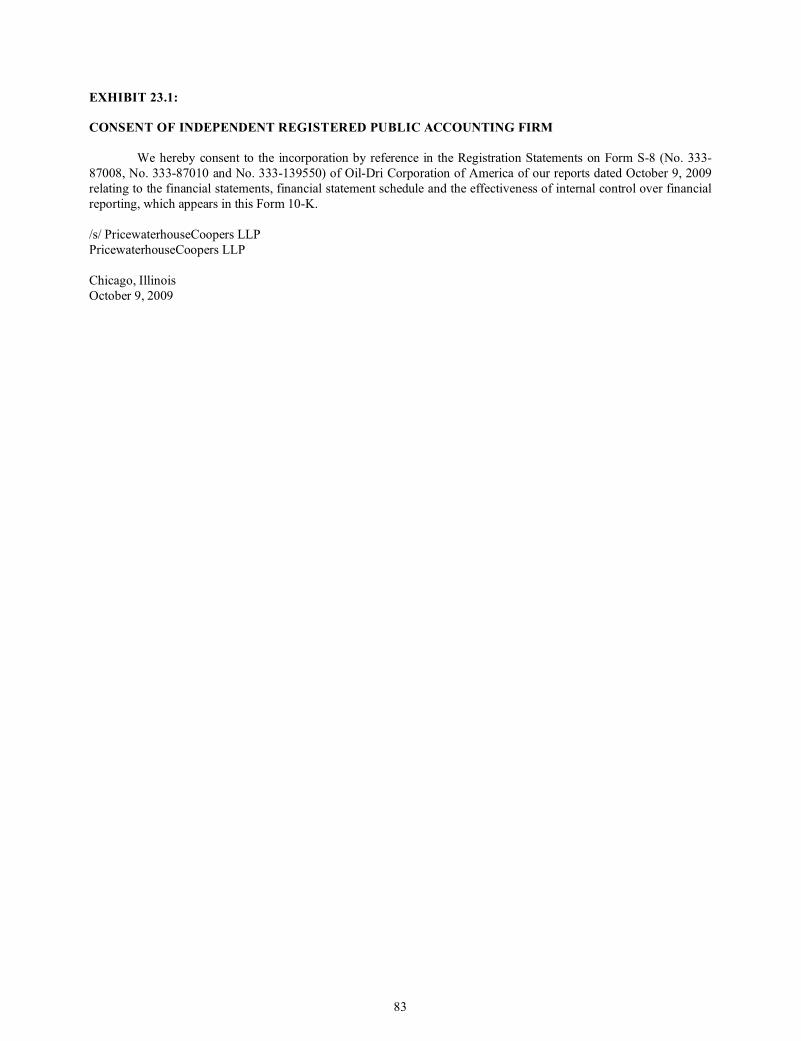
83
EXHIBIT 23.1:
CONSENT OF INDEPENDENT REGISTERED PUBLIC ACCOUNTING FIRM
We hereby consent to the incorporation by reference in the Registration Statements on Form S-8 (No. 333-
87008, No. 333-87010 and No. 333-139550) of Oil-Dri Corporation of America of our reports dated October 9, 2009
relating to the financial statements, financial statement schedule and the effectiveness of internal control over financial
reporting, which appears in this Form 10-K.
/s/ PricewaterhouseCoopers LLP
PricewaterhouseCoopers LLP
Chicago, Illinois
October 9, 2009
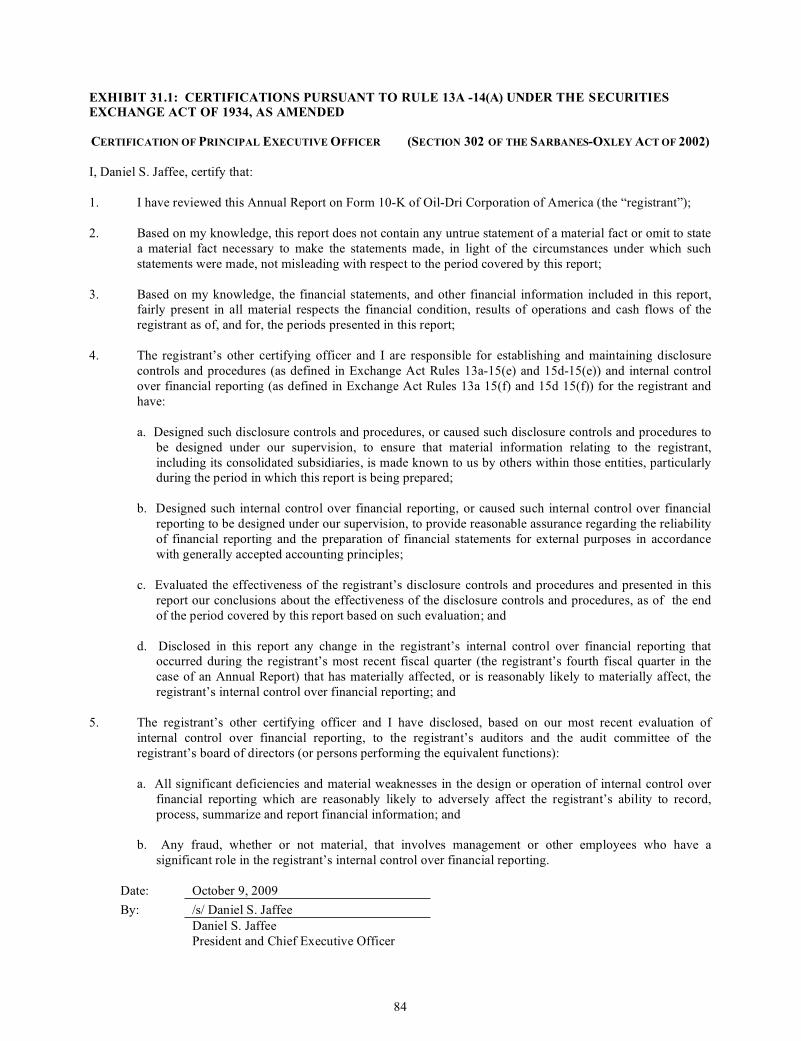
84
EXHIBIT 31.1: CERTIFICATIONS PURSUANT TO RULE 13A -14(A) UNDER THE SECURITIES
EXCHANGE ACT OF 1934, AS AMENDED
CERTIFICATION OF PRINCIPAL EXECUTIVEOFFICER (SECTION 302 OF THE SARBANES-OXLEY ACTOF 2002)
I, Daniel S. Jaffee, certify that:
1. I have reviewed this Annual Report on Form 10-K of Oil-Dri Corporation of America (the “registrant”);
2. Based on my knowledge, this report does not contain any untrue statement of a material fact or omit to state
a material fact necessary to make the statements made, in light of the circumstances under which such
statements were made, not misleading with respect to the period covered by this report;
3. Based on my knowledge, the financial statements, and other financial information included in this report,fairly present in all material respects the financial condition, results of operations and cash flows of the
registrant as of, and for, the periods presented in this report;
4. The registrant’s other certifying officer and I are responsible for establishing and maintaining disclosure
controls and procedures (as defined in Exchange Act Rules 13a-15(e) and 15d-15(e)) and internal control
over financial reporting (as defined in Exchange Act Rules 13a 15(f) and 15d 15(f)) for the registrant and
have:
a. Designed such disclosure controls and procedures, or caused such disclosure controls and procedures to
be designed under our supervision, to ensure that material information relating to the registrant,
including its consolidated subsidiaries, is made known to us by others within those entities, particularlyduring the period in which this report is being prepared;
b. Designed such internal control over financial reporting, or caused such internal control over financial
reporting to be designed under our supervision, to provide reasonable assurance regarding the reliability
of financial reporting and the preparation of financial statements for external purposes in accordance
with generally accepted accounting principles;
c. Evaluated the effectiveness of the registrant’s disclosure controls and procedures and presented in this
report our conclusions about the effectiveness of the disclosure controls and procedures, as of the end
of the period covered by this report based on such evaluation; and
d. Disclosed in this report any change in the registrant’s internal control over financial reporting thatoccurred during the registrant’s most recent fiscal quarter (the registrant’s fourth fiscal quarter in the
case of an Annual Report) that has materially affected, or is reasonably likely to materially affect, the
registrant’s internal control over financial reporting; and
5. The registrant’s other certifying officer and I have disclosed, based on our most recent evaluation of
internal control over financial reporting, to the registrant’s auditors and the audit committee of the
registrant’s board of directors (or persons performing the equivalent functions):
a. All significant deficiencies and material weaknesses in the design or operation of internal control over
financial reporting which are reasonably likely to adversely affect the registrant’s ability to record,
process, summarize and report financial information; and
b. Any fraud, whether or not material, that involves management or other employees who have a
significant role in the registrant’s internal control over financial reporting.
Date: October 9, 2009
By: /s/ Daniel S. Jaffee
Daniel S. Jaffee
President and Chief Executive Officer
85
EXHIBIT 31.1 (CONTINUED):
CERTIFICATION OF PRINCIPAL FINANCIAL OFFICER (SECTION 302 OF THE SARBANES-OXLEY ACTOF 2002)
I, Andrew N. Peterson, certify that:
1. I have reviewed this Annual Report on Form 10-K of Oil-Dri Corporation of America (the “registrant”);
2. Based on my knowledge, this report does not contain any untrue statement of a material fact or omit to state
a material fact necessary to make the statements made, in light of the circumstances under which such
statements were made, not misleading with respect to the period covered by this report;
3. Based on my knowledge, the financial statements, and other financial information included in this report,
fairly present in all material respects the financial condition, results of operations and cash flows of the
registrant as of, and for, the periods presented in this report;
4. The registrant’s other certifying officer and I are responsible for establishing and maintaining disclosure
controls and procedures (as defined in Exchange Act Rules 13a-15(e) and 15d-15(e)) and internal control
over financial reporting (as defined in Exchange Act Rules 13a 15(f) and 15d 15(f)) for the registrant and
have:
a. Designed such disclosure controls and procedures, or caused such disclosure controls and procedures to
be designed under our supervision, to ensure that material information relating to the registrant,
including its consolidated subsidiaries, is made known to us by others within those entities, particularly
during the period in which this report is being prepared;
b. Designed such internal control over financial reporting, or caused such internal control over financial
reporting to be designed under our supervision, to provide reasonable assurance regarding the reliability
of financial reporting and the preparation of financial statements for external purposes in accordance
with generally accepted accounting principles;
c. Evaluated the effectiveness of the registrant’s disclosure controls and procedures and presented in this
report our conclusions about the effectiveness of the disclosure controls and procedures, as of the end
of the period covered by this report based on such evaluation; and
d. Disclosed in this report any change in the registrant’s internal control over financial reporting that
occurred during the registrant’s most recent fiscal quarter (the registrant’s fourth fiscal quarter in the
case of an Annual Report) that has materially affected, or is reasonably likely to materially affect, theregistrant’s internal control over financial reporting; and
5. The registrant’s other certifying officer and I have disclosed, based on our most recent evaluation of
internal control over financial reporting, to the registrant’s auditors and the audit committee of the
registrant’s board of directors (or persons performing the equivalent functions):
a. All significant deficiencies and material weaknesses in the design or operation of internal control over
financial reporting which are reasonably likely to adversely affect the registrant’s ability to record,
process, summarize and report financial information; and
b. Any fraud, whether or not material, that involves management or other employees who have a significant role inthe registrant’s internal control over financial reporting.
Date: October 9, 2009
By: /s/ Andrew N. Peterson
Andrew N. Peterson
Chief Financial Officer
86
EXHIBIT 32.1:
CERTIFICATIONS PURSUANT TO 18 U.S.C. SECTION 1350 AS ADOPTED PURSUANT TO
THE SARBANES-OXLEY ACT OF 2002 CERTIFICATION
Pursuant to 18 U.S.C. Section 1350, the undersigned officer of Oil-Dri Corporation of America (the “Company”)
hereby certifies that to the best of my knowledge the Company’s Annual Report on Form 10-K for the year ended
July 31, 2009 (the “Report”) fully complies with the requirements of Section 13(a) or 15(d), as applicable, of the
Securities Exchange Act of 1934 and that the information contained in the Report fairly presents, in all material
respects, the financial condition and results of operation of the Company.
Dated: October 9, 2009
/s/ Daniel S. Jaffee
Name: Daniel S. Jaffee
Title: President and Chief Executive Officer
A signed original of this written statement required by Section 906 has been provided to Oil-Dri Corporation of
America and will be retained by Oil-Dri Corporation of America and furnished to the Securities and Exchange
Commission or its staff upon request.
The foregoing certification is being furnished solely pursuant to Section 906 of the Sarbanes-Oxley Act of 2002
(Section 1350, Chapter 63 of Title 18, United States Code) and is not being filed as part of the Report or as a
separate disclosure document.
CERTIFICATION
Pursuant to 18 U.S.C. Section 1350, the undersigned officer of Oil-Dri Corporation of America (the “Company”)
hereby certifies that to the best of my knowledge the Company’s Annual Report on Form 10-K for the quarter ended
July 31, 2009 (the “Report”) fully complies with the requirements of Section 13(a) or 15(d), as applicable, of the
Securities Exchange Act of 1934 and that the information contained in the Report fairly presents, in all material
respects, the financial condition and results of operation of the Company.
Dated: October 9, 2009
/s/ Andrew N. Peterson
Name: Andrew N. Peterson
Title: Chief Financial Officer
A signed original of this written statement required by Section 906 has been provided to Oil-Dri Corporation of
America and will be retained by Oil-Dri Corporation of America and furnished to the Securities and Exchange
Commission or its staff upon request.
The foregoing certification is being furnished solely pursuant to Section 906 of the Sarbanes-Oxley Act of 2002
(Section 1350, Chapter 63 of Title 18, United States Code) and is not being filed as part of the Report or as aseparate disclosure document.