Embed Size (px)
Citation preview
Policy Research Working Paper 8209
Oil Discovery and Macroeconomic Management
The Recent Ghanaian Experience
Mahamudu BawumiaHåvard Halland
Governance Global Practice GroupOctober 2017
WPS8209P
ublic
Dis
clos
ure
Aut
horiz
edP
ublic
Dis
clos
ure
Aut
horiz
edP
ublic
Dis
clos
ure
Aut
horiz
edP
ublic
Dis
clos
ure
Aut
horiz
ed
Produced by the Research Support Team
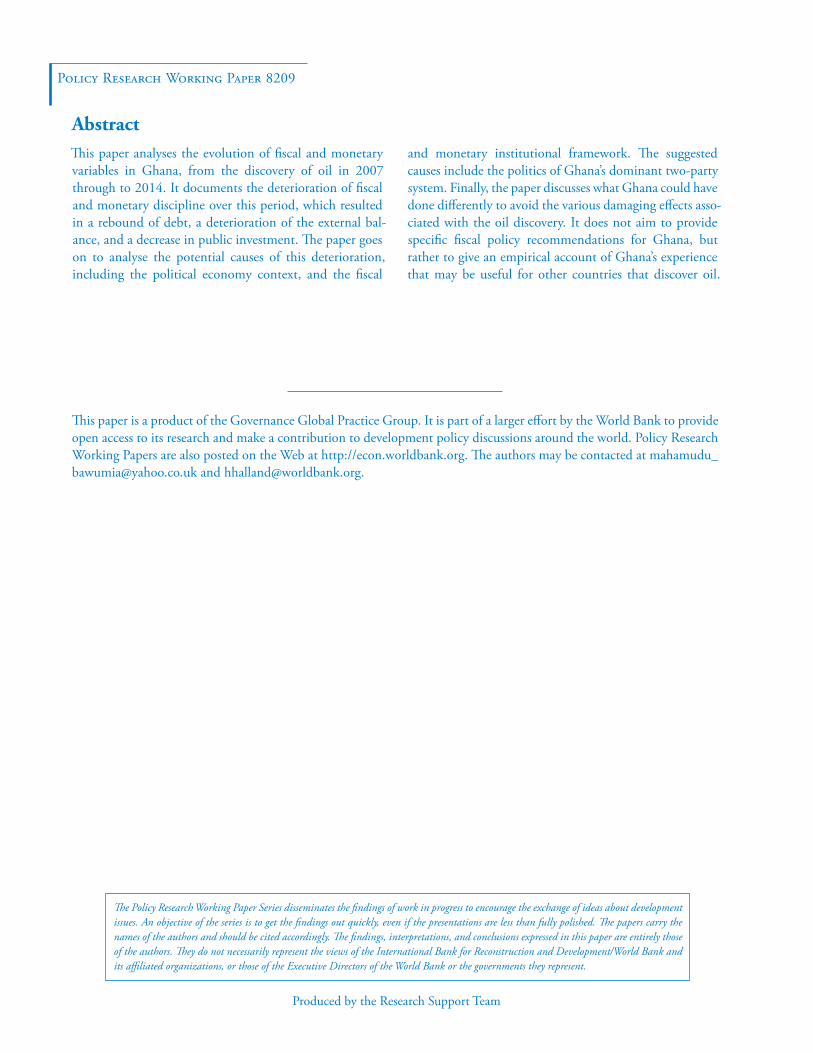
Abstract
The Policy Research Working Paper Series disseminates the findings of work in progress to encourage the exchange of ideas about development issues. An objective of the series is to get the findings out quickly, even if the presentations are less than fully polished. The papers carry the names of the authors and should be cited accordingly. The findings, interpretations, and conclusions expressed in this paper are entirely those of the authors. They do not necessarily represent the views of the International Bank for Reconstruction and Development/World Bank and its affiliated organizations, or those of the Executive Directors of the World Bank or the governments they represent.
Policy Research Working Paper 8209
This paper is a product of the Governance Global Practice Group. It is part of a larger effort by the World Bank to provide open access to its research and make a contribution to development policy discussions around the world. Policy Research Working Papers are also posted on the Web at http://econ.worldbank.org. The authors may be contacted at [email protected] and [email protected].
This paper analyses the evolution of fiscal and monetary variables in Ghana, from the discovery of oil in 2007 through to 2014. It documents the deterioration of fiscal and monetary discipline over this period, which resulted in a rebound of debt, a deterioration of the external bal-ance, and a decrease in public investment. The paper goes on to analyse the potential causes of this deterioration, including the political economy context, and the fiscal
and monetary institutional framework. The suggested causes include the politics of Ghana’s dominant two-party system. Finally, the paper discusses what Ghana could have done differently to avoid the various damaging effects asso-ciated with the oil discovery. It does not aim to provide specific fiscal policy recommendations for Ghana, but rather to give an empirical account of Ghana’s experience that may be useful for other countries that discover oil.
Oil discovery and macroeconomic management
The recent Ghanaian experience
Mahamudu Bawumia* and Håvard Halland+
JEL classification codes: E62, H60, Q32, Q33
Keywords: Ghana, macroeconomic policy, oil, fiscal consolidation
Acknowledgements
The authors are grateful to the Governance Partnership Facility and its donors — the U.K.
Department for International Development (DFID), the Australian Department of Foreign
Affairs and Trade (DFAT), the Netherlands’ Ministry of Foreign Affairs, and Norway’s Ministry
of Foreign Affairs—for providing full funding for this paper. The authors are also grateful Ishac
Diwan, Sebastien Dessus, and Santiago Herrera for their deeply insightful feedback on advanced
drafts for this paper, to Guenter Heidenhof and Sergiy Kulyk for their guidance, and to Jay-Hyung
Kim, Nicola Smithers, and Marijn Verhoeven, all of the World Bank, for their early input on this
project. Participants at the June 2014 conference of the Natural Resource Governance Institute
provided comments on Mahamudu Bawumia’s presentation of the issues discussed in this paper.
Kwaku Appiah-Adu and Mohammed Amin Adam provided feedback on earlier drafts. The
guidance of Kevin Carey, Ismaila Ceesay, Jens Kromann Kristensen, and Peter Mullins will
influence any subsequent versions of this paper and related papers.
Acronyms and Abbreviations
ABFA annual budget funding amount
BOG Bank of Ghana
CDB China Development Bank
CDD Centre for Democratic Development
CPP Convention People’s Party
GDP gross domestic product
GNGC Ghana National Gas Company
GNPC Ghana National Petroleum Company
GYEEDA Youth Employment and Entrepreneurial Development Agency
HIPC heavily indebted poor country
IFIs international financial institutions
IMF International Monetary Fund
LMIC lower-middle-income country
MDRI Multilateral Debt Relief Initiative
NDC National Democratic Congress
NPL nonperforming loan
NPP New Patriotic Party
NRGI Natural Resource Governance Institute
PAC Public Accounts Committee
PNC People’s National Convention
PPP Progressive People’s Party
PRMA Petroleum Revenue Management Act
RTI Right to Information
SADA Savannah Accelerated Development Authority
3
1 Introduction
Much of the extensive literature on the ‘resource curse’ phenomenon suggests a negative
correlation between national resource endowments and economic growth (Sachs and Warner
1995, 2001), although some studies have attributed this relationship to endogeneity
(Brunnschweiler 2007; Brunnschweiler and Bulte 2008), or have obtained different results by
expanding Sachs and Warner’s regression. The literature subsequent to Sachs and Warner has
concentrated on identifying the mechanisms through which natural resource wealth impacts on
growth. By this line of reasoning, natural resource abundance leads to some phenomenon that in
turn affects growth (Alexeev and Conrad 2009). The channels through which the so-called curse
is transmitted include: real exchange rate appreciation, which leads to a contraction of the non-
resource export sector or ‘Dutch disease’ (Corden and Neary 1982); rent-seeking and corruption,
which drag down growth (Ades and Di Tella 1999; Mehlum et al. 2006a, 2006b); large swings in
commodity prices that result in macroeconomic instability (van der Ploeg and Poelhekke 2010);
the interaction of resource rents and government consumption (Atkinson and Hamilton 2003);
volatility of discretionary government expenditure (Bleaney and Halland 2014); armed conflict to
control resources (Collier and Hoeffler 2004); volatility of commodity prices (Blattman et al. 2007);
and anticipation of better times (van der Ploeg 2011).1
Given the availability of disaggregated fiscal and monetary data, Ghana provides a unique
opportunity to consider the resource curse hypothesis from a case study perspective. The case of
Ghana provides limited support for some versions of this hypothesis, but ultimately tells a simpler
story of insufficient fiscal and monetary discipline resulting from challenges to policymaking.
Crucially—and contrary to, for example, Botswana—Ghana was not able to manage expectations
sufficiently after oil was discovered. Its experience is in that sense consistent with van der Ploeg’s
(2011) ‘anticipation of better times’ hypothesis. It is also consistent with Atkinson and Hamilton
(2003), who conclude that the combination of natural resource rents and high government
consumption provides an explanation for the curse, and with Collier and Hoeffler (2009), who
argue that the combination of rents from the extractive industries and open democratic systems is
associated with slower growth unless there are enough checks and balances. Ghana’s large increase
in sovereign debt after the discovery of oil reflects the concerns of Mansoorian (1991), who
1 Excellent surveys of the resource curse literature include van der Ploeg (2011) and Frankel (2010).
4
suggests that an abundance of natural resources may encourage countries to assume unsustainable
levels of debt.
In Ghana, tightly fought elections in 2008 and 2012, in the context of expected or newly available
oil revenues, generated a situation where electoral promises trumped the need to manage
expectations, generating spending pressures that ultimately could not be contained. Institutional
weakness, which in the resource curse literature is most often referred to by aggregated indexes of
institutional quality, took on very precise forms in Ghana. Specifically, nominal fiscal rules and
central bank independence were not sufficiently supported by political consensus or by strong legal
and other institutional underpinnings, and apparently nor was the integrity of the stabilization and
savings funds. Procedures for forecasting oil revenues were not isolated against political upward
pressure on the estimates (unlike, for example, in Chile (Solimano and Guajardo 2017)).
Ghana’s story is also not primarily one of reduced growth resulting from externally generated
causes such as Dutch disease (if foreign exchange is not sufficiently sterilized) and oil revenue
volatility, although the precipitous fall in oil prices that started in 2014 has generated additional
problems. But it does correspond well with arguments from the political economy of
macroeconomics, surveyed by Persson and Tabellini (2000). A fundamental insight from this
literature is that, in economic terms, the implicit discount rate used by politicians may exceed the
rate of interest by the probability of the politicians being removed from office. Hence if a political
faction expects to be expelled from office in the near future, it will extract oil or minerals much
faster than is socially optimal and will also borrow against future oil revenues (van der Ploeg 2011).
Bleaney and Halland (2016) do not find evidence that natural resource wealth in general promotes
fiscal indiscipline. Nor do they find evidence that new resource exporters, on average, exhibit less
fiscal discipline. In fact, their results indicate that fuel exporters tend to have a better general
government fiscal balance. However, their econometric model, based on the most disaggregated
fiscal data currently available for econometric analysis, does not explain the performance of some
outliers such as Ghana and Mongolia. In that sense, this case study of Ghana complements and
extends what can be learned about the resource curse from econometric analysis.
Until around 2012, Ghana was one of the stars of the ‘Africa rising’ story, the toast of the
international development community, and a benchmark for other African countries in the areas
of democracy and development. In particular:
5
Ghana’s gross domestic product (GDP) more than quadrupled in nominal terms between
2001 and 2008, shifting its World Bank categorization from that of a heavily indebted poor
country (HIPC) to that of a lower-middle-income country.
Ghana received HIPC relief from the International Monetary Fund (IMF), World Bank,
and bilateral donors to the tune of US$4.2 billion after reaching the HIPC completion
point in 2004. Ghana established a track record of macroeconomic stability and fiscal
discipline prior to the discovery of oil. To some extent, this discipline was externally
imposed, since to obtain HIPC debt relief Ghana needed to adhere to the IMF’s
programme.
Ghana benefited from the experiences of countries such as Nigeria, and in fact put together
a framework to avoid the oil curse. The Petroleum Revenue Management Act (PRMA)
2011 (Act 815, Republic of Ghana 2011) lays down the key parameters for the accounting
and collecting of petroleum revenues due to the government of Ghana. It establishes limits
on the amounts of revenue that shall be directed into the annual budget and into savings.
It provides for the operation and management of savings, and ensures that savings will be
prudently managed. In addition, the law provides clear oversight, auditing, transparency,
and reporting mechanisms to safeguard the management of petroleum revenues.
Ghana has a good record of democratic governance, with a free press, rule of law, and
reasonably strong institutions.
Therefore one would have expected Ghana to be on the list of sub-Saharan African countries able
to avoid the natural resource curse. However, even before oil production began in 2011, and
increasingly thereafter, Ghana found itself embroiled in all the problems of the curse. In August
2014 it requested a bailout from the IMF.
Section 2 of this paper provides an introduction to the Ghanaian context before oil was discovered.
Section 3 provides the context of the policy choices faced by the government at the time oil was
discovered and the legal framework put in place to manage oil revenues. Sections 4 and 5 examine
the deterioration of public finances and the large accumulation of debt following the discovery of
oil. Section 6 analyses the decline in capital expenditure following Ghana’s oil discovery. Section
7 examines the dramatic increase in central bank financing of government, and Section 8 analyses
the deterioration in Ghana’s external payments position. Section 9 examines Ghana’s declining
economic growth following the oil discovery, while section 10 examines the possible increase in
6
corruption post-oil discovery. Section 11 places the developments in Ghana in the context of the
political system and in particular the specific context of narrowly won elections. Section 12 asks
the question ‘What could Ghana have done differently?’ and section 13 concludes.
2 The years before the discovery
To place Ghana’s story in context, it is important to examine the state of the Ghanaian economy
in the years leading up to the discovery of oil.
During the pre-liberalization era (1960–83), the government-led development strategy (involving
socialist policies: controls, etc.) led eventually and inexorably to declines in growth and per capita
incomes, deterioration in other macro variables, a decline in the share of industry (from nearly 20
per cent of GDP in 1965 to 6.2 per cent by 1982), a government expenditure decline (from 17.1
per cent of GDP in 1965 to 3.3 per cent by 1982), and a fall in central government revenues (from
20 per cent of GDP in 1970 to five per cent by 1982) (Fosu 2009). In addition, during this period
Ghana implemented an import substitution industrialization policy which aimed to reduce the
economy’s dependence on import trade. State-owned enterprises in various sectors of the
economy were established, ranging from agricultural to manufacturing industries. This was not
sustainable, however, due to continual political instabilities, low levels of factor productivity, and
gross economic mismanagement. The country for most periods during this era also experienced
poor performance in major macroeconomic indicators, including the exchange rate and the trade
balance. Although the country recorded a trade surplus for the years 1967 to 1969, this was not
sustainable, and by 1971 it experienced one of its largest trade deficits. The economic imbalances
that characterized the economy during the pre-liberalization era were among the many reasons
that Ghana opted eventually for financial assistance from the multilateral institutions, the World
Bank and the IMF.
This precipitated the launch of the Economic Recovery Programme (ERP) in 1983 and the related
Structural Adjustment Programme (SAP) in 1986. This was structured on the basis of a
liberalization policy regime with the aim of addressing major economic imbalances experienced in
the country. The ERP included the liberalization of the foreign exchange and other markets in
order to halt the downward economic spiral, whilst the SAP was mainly designed to correct
structural imbalances. The main objectives of the reforms were to create incentives for production,
increase income through market-friendly policies, minimize the interventionist role of
government, and stem the economic inefficiencies in the system, including corruption. The
7
outcomes were generally positive. Ghana experienced very significant improvements in major
economic indicators in the post-liberalization era. Among these can be mentioned higher GDP
growth, human development improvements including a drastic reduction of poverty from 51.1 per
cent in 1991–92 to 20 per cent in 2005–06, a rise in capital formation, a drastic fall in the rate of
inflation, a rise in economic freedom, and a drastic fall in the stock of external debt.
However, an excessive fiscal expansion in the run-up to the December 2000 presidential and
parliamentary elections tipped the Ghanaian economy into a new vicious cycle of intense inflation
and currency depreciation, and this coincided with a sharp deterioration in the commodity terms
of trade. In the short span of one year, ending in December 2000, the cedi (the national currency)
virtually collapsed, losing 50 per cent of its value relative to the US dollar. The country’s gross
international reserves were so depleted that they could not cover even one month’s imports, and
external payments arrears started building up.
Against this background, peaceful democratic elections in 2000 resulted in a change in government
from the ruling National Democratic Congress (NDC) to the New Patriotic Party (NPP). John
Agyekum Kufuor was elected president. This was a landmark election, being the first change of
government achieved through the ballot box. A military government was replaced by an elected
one in the culmination of a democratization process that had begun in 1992. The immediate focus
of the new government was to restore macroeconomic stability. The term of the Kufuor
government also coincided, from 2001 to 2006, with adherence to an IMF programme that was
required to obtain HIPC debt relief. In a sense, Ghana during this period was operating under a
quasi-fiscal rule. This involved a major shift in macroeconomic policy, from a stance of
considerable fiscal relaxation and monetary accommodation, to one of fiscal stringency and
monetary discipline.
A major pillar of this macroeconomic stabilization process was old-fashioned fiscal consolidation.
The central government budget was cast in a medium-term framework right from the start, and
public finances were set on a fiscal consolidation course to cut the budget deficit and stabilize
domestic public debt. This called for robust revenue mobilization (to increase the flexibility of the
revenue base and reduce fiscal vulnerability) and prudent spending. For example, the 2003 fiscal
programme set a target of zero net domestic financing of the public-sector borrowing requirement
for 2003.
The government’s fiscal policy strategy from 2001 focused on debt reduction, with the aim that
the private sector would have access to enough financial resources to increase economic activity
8
(IMF 2004). Under the Multilateral Debt Relief Initiative (MDRI), Ghana’s debt relief was
estimated at US$4.2 billion in nominal terms. After the enhanced HIPC initiative was implemented
in 2004 and Ghana qualified for the MDRI,2 Ghana’s external debt decreased significantly, from
156.3 per cent of GDP in 2000 to only 17.2 per cent of GDP by 2006 (Table 1).
Monetary policy at this time was underpinned by the adoption of an inflation-targeting framework,
with the central bank taking advantage of the statutory independence that parliament had
enshrined in the Bank of Ghana Act (BOG 2002).
This new fiscal and monetary policy framework caused a decline in inflation and inflationary
expectations and strengthened Ghana’s external payments position. Headline inflation declined
from 40.5 per cent in 2000 to 12.7 per cent by 2007 (Table 1), and between 2001 and 2007 (except
for a deficit of US$10.5 million recorded in 2004) the overall balance of payments was in surplus.
Gross international reserves increased from US$233 million (less than one month of import cover)
in 2000 to US$2.84 billion (approximately three months of import cover) by 2007.
2 The MDRI provided 100 per cent relief on eligible debt from three multilateral institutions to a group of low-income countries to help them meet their Millennium Development Goal of halving poverty by 2015.
9
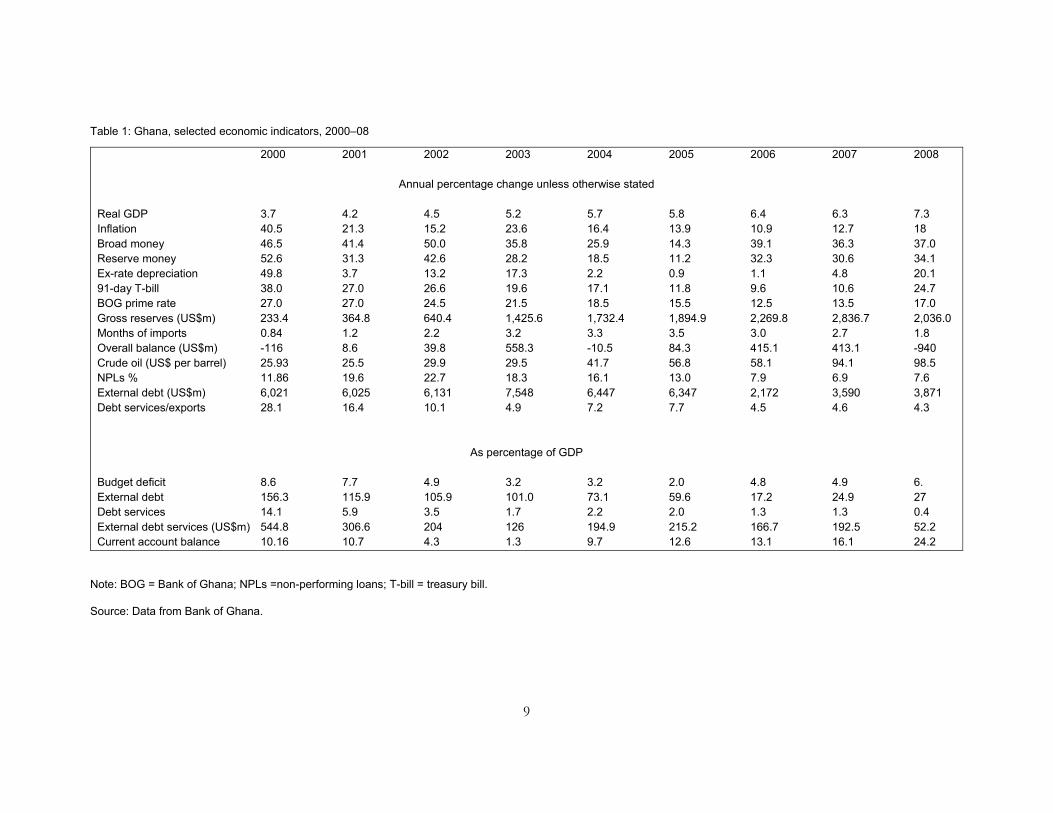
Table 1: Ghana, selected economic indicators, 2000–08
2000 2001 2002 2003 2004 2005 2006 2007 2008
Annual percentage change unless otherwise stated
Real GDP 3.7 4.2 4.5 5.2 5.7 5.8 6.4 6.3 7.3 Inflation 40.5 21.3 15.2 23.6 16.4 13.9 10.9 12.7 18 Broad money 46.5 41.4 50.0 35.8 25.9 14.3 39.1 36.3 37.0 Reserve money 52.6 31.3 42.6 28.2 18.5 11.2 32.3 30.6 34.1 Ex-rate depreciation 49.8 3.7 13.2 17.3 2.2 0.9 1.1 4.8 20.1 91-day T-bill 38.0 27.0 26.6 19.6 17.1 11.8 9.6 10.6 24.7 BOG prime rate 27.0 27.0 24.5 21.5 18.5 15.5 12.5 13.5 17.0 Gross reserves (US$m) 233.4 364.8 640.4 1,425.6 1,732.4 1,894.9 2,269.8 2,836.7 2,036.0 Months of imports 0.84 1.2 2.2 3.2 3.3 3.5 3.0 2.7 1.8 Overall balance (US$m) -116 8.6 39.8 558.3 -10.5 84.3 415.1 413.1 -940 Crude oil (US$ per barrel) 25.93 25.5 29.9 29.5 41.7 56.8 58.1 94.1 98.5 NPLs % 11.86 19.6 22.7 18.3 16.1 13.0 7.9 6.9 7.6 External debt (US$m) 6,021 6,025 6,131 7,548 6,447 6,347 2,172 3,590 3,871 Debt services/exports 28.1 16.4 10.1 4.9 7.2 7.7 4.5 4.6 4.3
As percentage of GDP
Budget deficit 8.6 7.7 4.9 3.2 3.2 2.0 4.8 4.9 6. External debt 156.3 115.9 105.9 101.0 73.1 59.6 17.2 24.9 27 Debt services 14.1 5.9 3.5 1.7 2.2 2.0 1.3 1.3 0.4 External debt services (US$m) 544.8 306.6 204 126 194.9 215.2 166.7 192.5 52.2 Current account balance 10.16 10.7 4.3 1.3 9.7 12.6 13.1 16.1 24.2
Note: BOG = Bank of Ghana; NPLs =non-performing loans; T-bill = treasury bill.
Source: Data from Bank of Ghana.
10
Ghana’s overall debt profile also improved significantly: the debt burden after the adjustments was
well within the sustainability threshold, in sharp contrast to the country’s previous HIPC status.
Thanks to the HIPC relief, Ghana’s external debt declined from US$6.02 billion in 2000 to
US$3.59 billion by 2007. Furthermore, the proportion of exports used to service Ghana’s debts
declined from 28.1 per cent in 2000 to only 4.6 per cent by 2007 (Table 1).
After the cedi depreciated by some 50 per cent against the US dollar in 2000, relative exchange
rate stability was restored in 2001, when the depreciation was just 3.7 per cent. This was followed
by 13.2 per cent and 17.3 per cent nominal depreciation in 2002 and 2003 respectively, 2.2 per
cent in 2004, 0.9 per cent in 2005, 1.1 per cent in 2006, and 4.8 per cent in 2007 (anchored by
declining inflation expectations). Between 2004 and 2007 the cedi depreciated by an average of
2.25 per cent annually against the dollar (Table 1). This contrasted with the cedi’s historical
instability and its 50 per cent depreciation in 2000.
3 The discovery of oil
In June and August 2007, in the midst of a global food and oil crisis, the UK-based firm Tullow
Oil, and its US partners Kosmos Energy and Anadarko Petroleum, announced two significant oil
discoveries off Ghana’s coast. The initial yield estimate was for about 1.8 billion barrels of
recoverable reserves. With oil production projected to begin in 2010, the Ghanaian government
was optimistic that this discovery would have a significantly positive effect on the economy and
reduce Ghana’s reliance on oil imports. There was a sense among government officials and the
population that Ghana had hit the jackpot. Ghana would be freed from the clutches of donors
and international financial institutions to pursue a more independent, growth-based development
agenda. With an election on the horizon for 2008, the incumbent NPP government was eager to
maximize the political benefit of the oil discovery, and in the process arguably did not manage
expectations sufficiently (unlike countries such as Botswana—see Acemoglu et al. (2003)). Some
initial reports conveyed the impression that Ghana’s reserves were comparable in size to those of
Nigeria and Angola (Modern Ghana 2007b).
However, affected soon afterwards by increased domestic government spending and the global oil
and food crisis, Ghana’s economic environment took a turn for the worse as early as 2007–08.
The government then faced the choice of fiscal contraction, full cost recovery for utilities,
postponement of some already committed expenditures, or continued fiscal expansion.
Government factions argued that as the world was heading towards a recession, Ghana needed to
11
adopt counter-cyclical policies, and therefore aggregate demand needed to be increased in the
interim. It was argued that public finances could then be balanced when the crisis was over, and
when the oil would start flowing in 2010 expectedly.
For a government facing an imminent election in 2008, this was a persuasive argument. There was
a sense that some reduction in the price trends (of oil in particular) and the forthcoming oil
revenues would soon abate Ghana’s economic difficulties (Bawumia 2010). The natural resource
discovery gave a false sense of greater fiscal space than was the case. Therefore, in an election year,
the government did not bite the bullet to allow full cost recovery in petroleum and electricity
prices.
The expansionary fiscal policy of 2007–08 had predictable consequences, and the economy
suffered a setback: inflation increased from 10.9 per cent at the end of 2006 to 18.1 per cent at the
end of 2008, and the exchange rate depreciated by 20.1 per cent in 2008 compared with only 1.1
per cent in 2006. The budget deficit increased from 4.8 per cent of GDP in 2006 to 6.5 per cent
of GDP by 2008. Gross international reserves declined from US$2.27 billion (three months of
import cover) in 2006 to US$2.04 billion (1.8 months of import cover) in 2008 (Table 1). Thus the
beginnings of the natural resource curse were evident in Ghana long before the first drop of oil
was produced.
Nevertheless, the government of Ghana expressed determination to make sure that Ghana’s oil
resources would be managed well so as to avoid the dreaded curse (Amoako-Tuffour and Ghanney
2013). The government convened stakeholders to chart the way forward and to learn what pitfalls
to avoid and which best practices to follow from the diverse experiences of countries such as
Nigeria and Norway. To underpin good governance in the oil sector, and based on these
discussions, public consultations, and best practices across oil-producing countries, Ghana passed
both the PRMA and the Petroleum Commission Act in 2011.
4 The deterioration of public finances
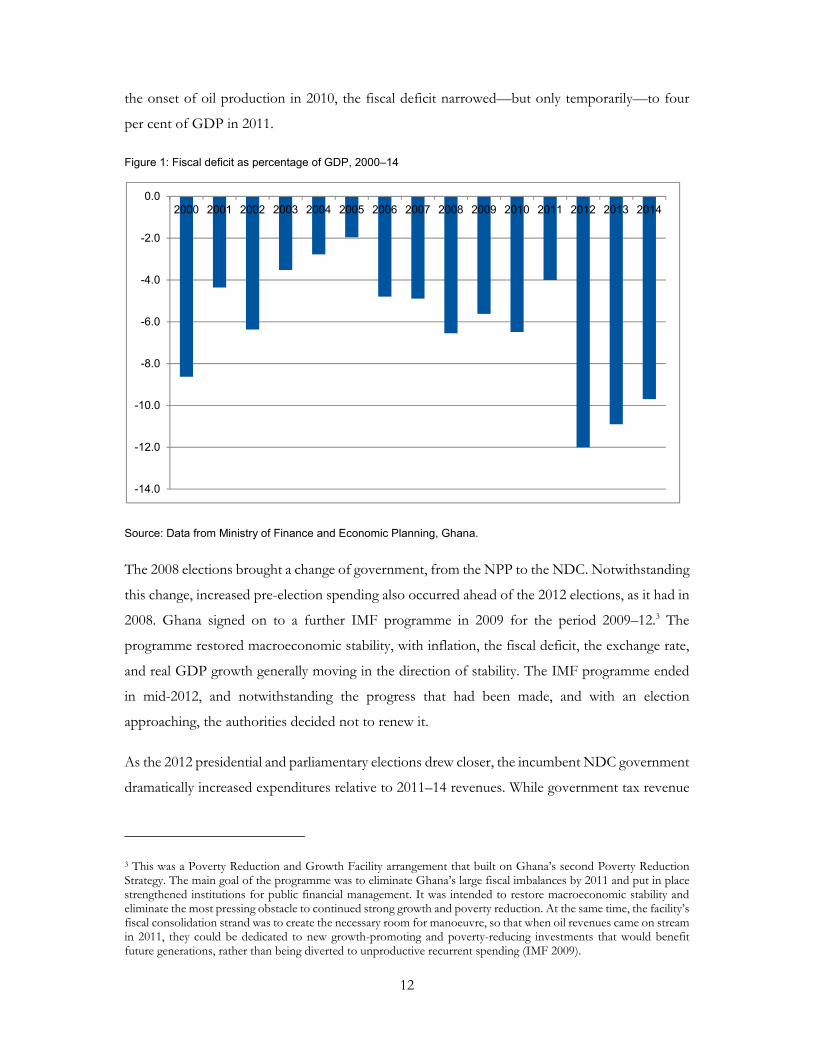
Notwithstanding all the efforts to avoid the oil curse, Ghana’s public finances began to deteriorate
following the oil discovery in 2007. As Figure 1 indicates, public finances were generally sound
from 2001 to 2007. The fiscal deficit as a percentage of GDP declined from 8.6 per cent in 2000
to only two per cent by 2005. It subsequently increased to 6.5 per cent of GDP in 2008, as the
government increased expenditure in that election year in anticipation of oil revenues. Following
12
the onset of oil production in 2010, the fiscal deficit narrowed—but only temporarily—to four
per cent of GDP in 2011.
Figure 1: Fiscal deficit as percentage of GDP, 2000–14
Source: Data from Ministry of Finance and Economic Planning, Ghana.
The 2008 elections brought a change of government, from the NPP to the NDC. Notwithstanding
this change, increased pre-election spending also occurred ahead of the 2012 elections, as it had in
2008. Ghana signed on to a further IMF programme in 2009 for the period 2009–12.3 The
programme restored macroeconomic stability, with inflation, the fiscal deficit, the exchange rate,
and real GDP growth generally moving in the direction of stability. The IMF programme ended
in mid-2012, and notwithstanding the progress that had been made, and with an election
approaching, the authorities decided not to renew it.
As the 2012 presidential and parliamentary elections drew closer, the incumbent NDC government
dramatically increased expenditures relative to 2011–14 revenues. While government tax revenue
3 This was a Poverty Reduction and Growth Facility arrangement that built on Ghana’s second Poverty Reduction Strategy. The main goal of the programme was to eliminate Ghana’s large fiscal imbalances by 2011 and put in place strengthened institutions for public financial management. It was intended to restore macroeconomic stability and eliminate the most pressing obstacle to continued strong growth and poverty reduction. At the same time, the facility’s fiscal consolidation strand was to create the necessary room for manoeuvre, so that when oil revenues came on stream in 2011, they could be dedicated to new growth-promoting and poverty-reducing investments that would benefit future generations, rather than being diverted to unproductive recurrent spending (IMF 2009).
-14.0
-12.0
-10.0
-8.0
-6.0
-4.0
-2.0
0.02000 2001 2002 2003 2004 2005 2006 2007 2008 2009 2010 2011 2012 2013 2014
13
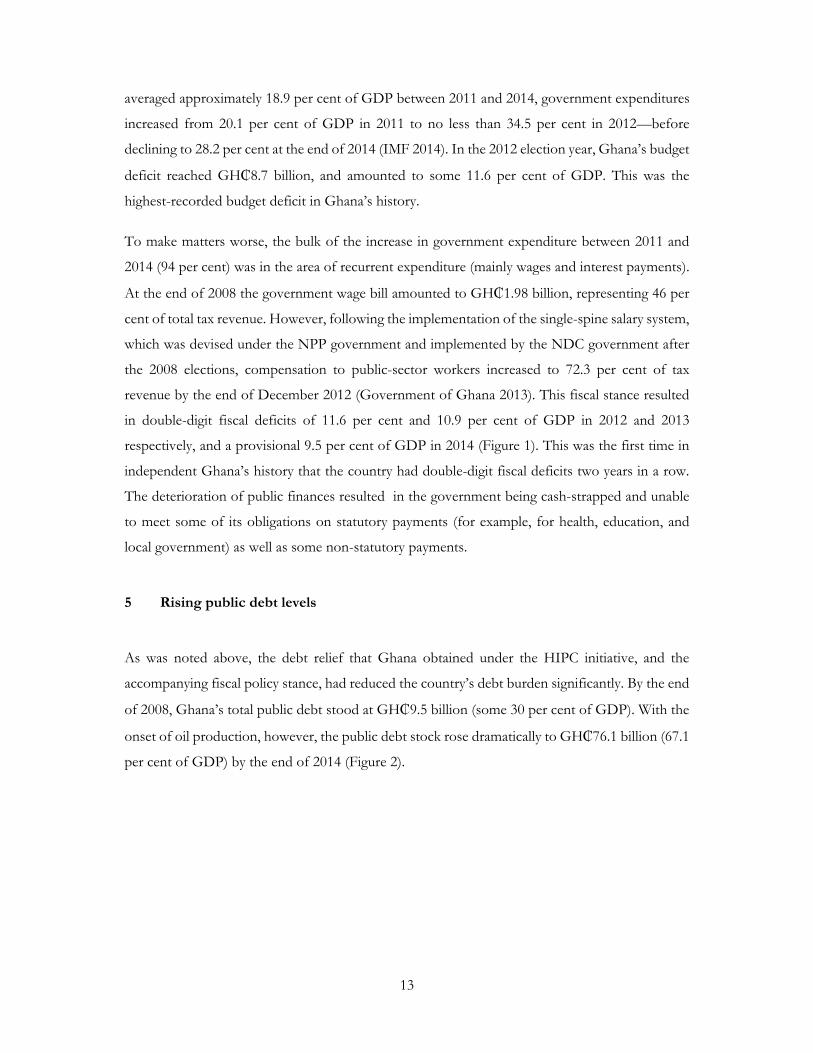
averaged approximately 18.9 per cent of GDP between 2011 and 2014, government expenditures
increased from 20.1 per cent of GDP in 2011 to no less than 34.5 per cent in 2012—before
declining to 28.2 per cent at the end of 2014 (IMF 2014). In the 2012 election year, Ghana’s budget
deficit reached GH₵8.7 billion, and amounted to some 11.6 per cent of GDP. This was the
highest-recorded budget deficit in Ghana’s history.
To make matters worse, the bulk of the increase in government expenditure between 2011 and
2014 (94 per cent) was in the area of recurrent expenditure (mainly wages and interest payments).
At the end of 2008 the government wage bill amounted to GH₵1.98 billion, representing 46 per
cent of total tax revenue. However, following the implementation of the single-spine salary system,
which was devised under the NPP government and implemented by the NDC government after
the 2008 elections, compensation to public-sector workers increased to 72.3 per cent of tax
revenue by the end of December 2012 (Government of Ghana 2013). This fiscal stance resulted
in double-digit fiscal deficits of 11.6 per cent and 10.9 per cent of GDP in 2012 and 2013
respectively, and a provisional 9.5 per cent of GDP in 2014 (Figure 1). This was the first time in
independent Ghana’s history that the country had double-digit fiscal deficits two years in a row.
The deterioration of public finances resulted in the government being cash-strapped and unable
to meet some of its obligations on statutory payments (for example, for health, education, and
local government) as well as some non-statutory payments.
5 Rising public debt levels
As was noted above, the debt relief that Ghana obtained under the HIPC initiative, and the
accompanying fiscal policy stance, had reduced the country’s debt burden significantly. By the end
of 2008, Ghana’s total public debt stood at GH₵9.5 billion (some 30 per cent of GDP). With the
onset of oil production, however, the public debt stock rose dramatically to GH₵76.1 billion (67.1
per cent of GDP) by the end of 2014 (Figure 2).
14
Figure 2: Total debt as percentage of GDP, 2000–14
Source: Data from Ministry of Finance and Economic Planning, Ghana.
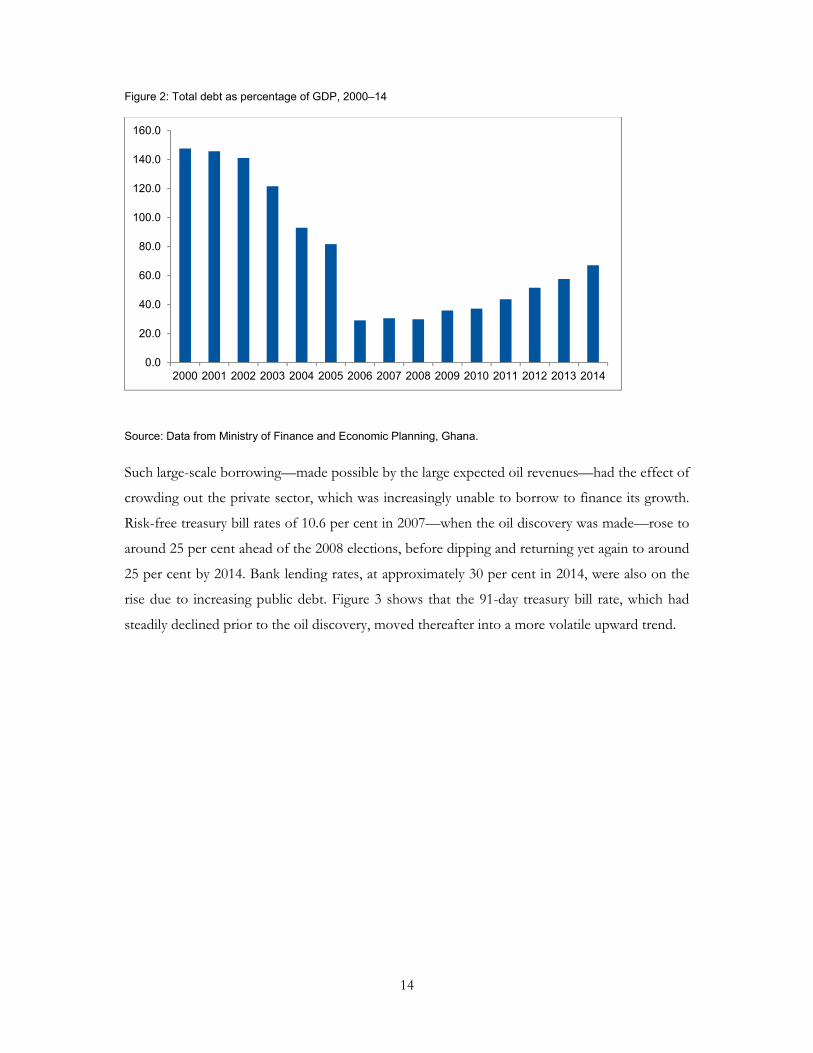
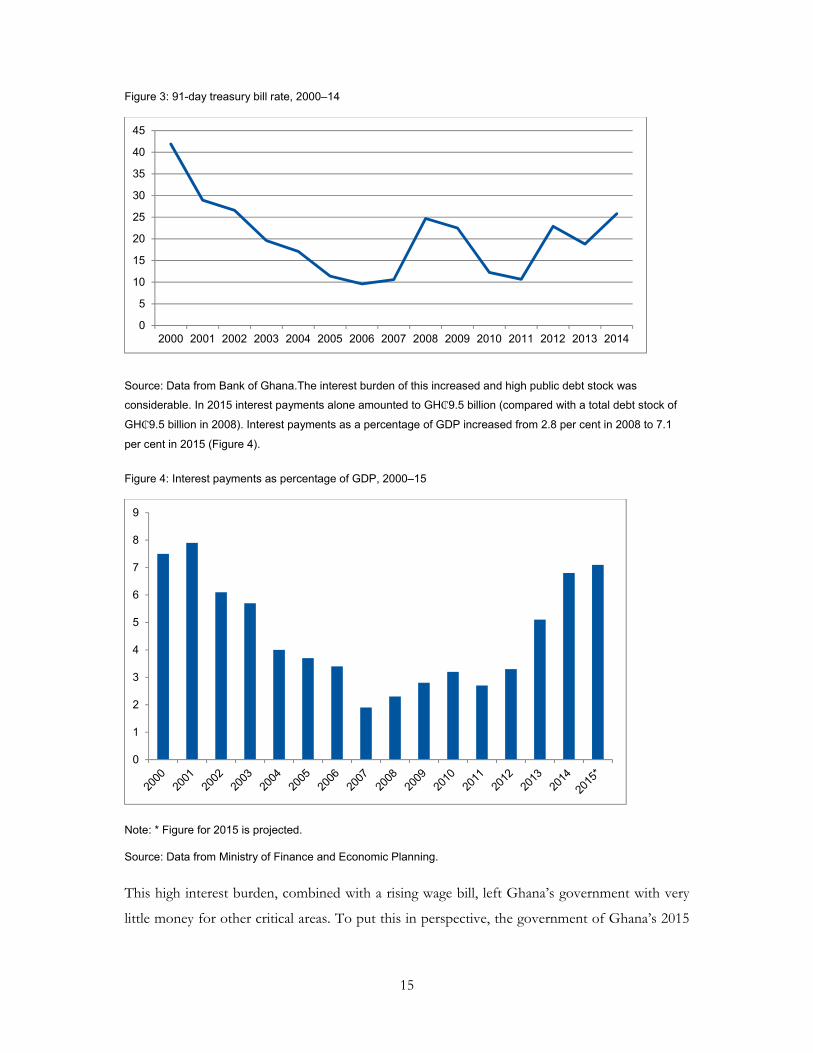
Such large-scale borrowing—made possible by the large expected oil revenues—had the effect of
crowding out the private sector, which was increasingly unable to borrow to finance its growth.
Risk-free treasury bill rates of 10.6 per cent in 2007—when the oil discovery was made—rose to
around 25 per cent ahead of the 2008 elections, before dipping and returning yet again to around
25 per cent by 2014. Bank lending rates, at approximately 30 per cent in 2014, were also on the
rise due to increasing public debt. Figure 3 shows that the 91-day treasury bill rate, which had
steadily declined prior to the oil discovery, moved thereafter into a more volatile upward trend.
0.0
20.0
40.0
60.0
80.0
100.0
120.0
140.0
160.0
2000 2001 2002 2003 2004 2005 2006 2007 2008 2009 2010 2011 2012 2013 2014
15
Figure 3: 91-day treasury bill rate, 2000–14
Source: Data from Bank of Ghana.The interest burden of this increased and high public debt stock was
considerable. In 2015 interest payments alone amounted to GH₵9.5 billion (compared with a total debt stock of
GH₵9.5 billion in 2008). Interest payments as a percentage of GDP increased from 2.8 per cent in 2008 to 7.1
per cent in 2015 (Figure 4).
Figure 4: Interest payments as percentage of GDP, 2000–15
Note: * Figure for 2015 is projected.
Source: Data from Ministry of Finance and Economic Planning.
This high interest burden, combined with a rising wage bill, left Ghana’s government with very
little money for other critical areas. To put this in perspective, the government of Ghana’s 2015
0
5
10
15
20
25
30
35
40
45
2000 2001 2002 2003 2004 2005 2006 2007 2008 2009 2010 2011 2012 2013 2014
0
1
2
3
4
5
6
7
8
9
16
budget allocations (excluding internally generated funds and donor contributions) to the following
ministries were:
Ministry of Food and Agriculture GH₵61.0 million
Ministry of Water Resources and Housing GH₵198.7 million
Ministry of Transport GH₵180.3 million
Ministry of Roads and Highways GH₵333.0 million
Ministry of Trade and Industry GH₵2 million
Ministry of Fisheries GH₵31.5 million
Ministry of Health GH₵44.5 million
Ministry of Education GH₵101 million
The total sum allocated to these eight key ministries in 2015 amounted to about GH₵952 million,
whereas interest payments on Ghana’s public debt stock in the same year were GH₵9.5 billion—
that is, 10 times the combined allocations to these critical ministries.
The country’s 2015 interest payments were expected to amount to approximately six times its
projected oil revenues for 2015.4 The interest cost of the debt is therefore depriving key sectors of
critical resources. This situation is reminiscent of Ghana’s situation before the HIPC debt relief,
when the debt burden had reduced critical fiscal space that could have enhanced capital and social
expenditure.
At 67 per cent of GDP, by 2015 Ghana’s debt stock had crossed the critical 60 per cent level,
which is of particular concern in developing countries with limited access to capital flows. In fact,
Ghana’s debt by then was right back on the unsustainable track that had led to its HIPC relief.
How could Ghana have so misjudged its capacity to borrow so soon after obtaining HIPC relief?
Apart from the oil discovery heightening expectations about ability to pay, it should also be noted
4 Revised projection of oil revenues based on an oil price of US$52.8 per barrel. These numbers are based on information available when this paper was drafted in 2016.
17
that Ghana’s GDP was rebased in 2010. This resulted in statistically increasing Ghana’s GDP by
60 per cent from 2007. With the rebasing of GDP, the debt-to-GDP ratios looked very satisfactory
on the surface. What policymakers may have overlooked was the fact that the GDP was rebased
without an attendant increase in foreign exchange liquidity. In this situation, taking comfort from
an apparently low debt-to-GDP ratio was potentially very misleading.
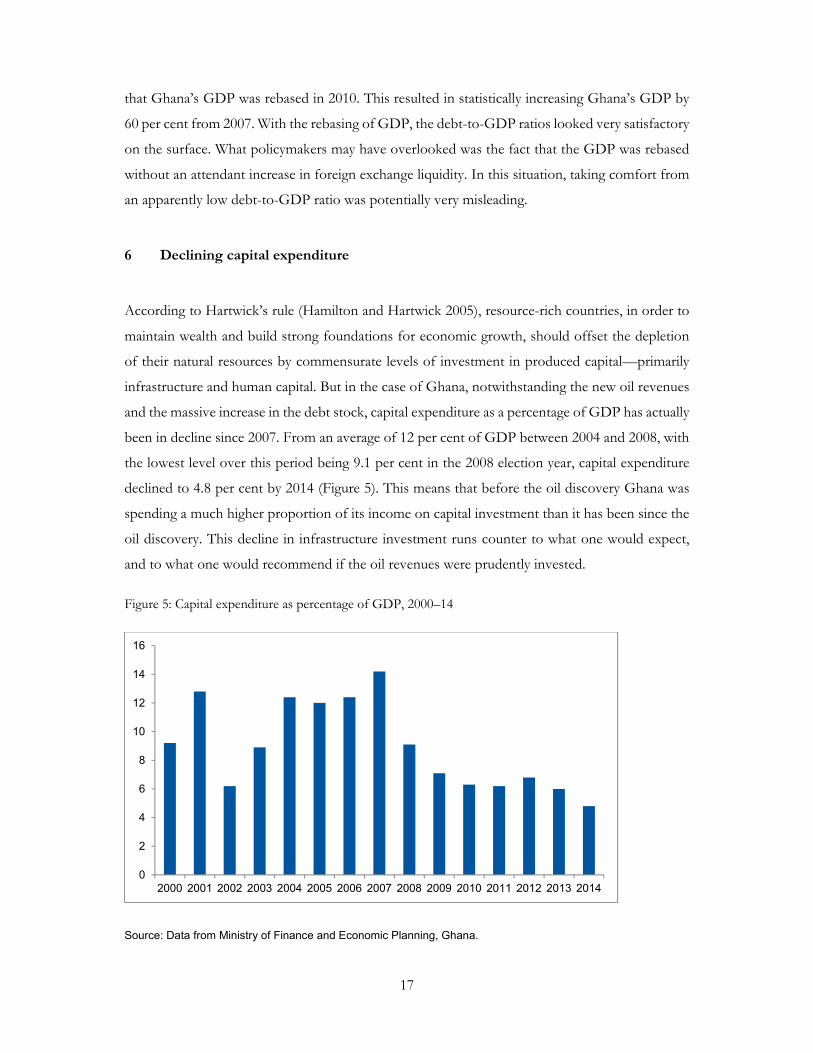
6 Declining capital expenditure
According to Hartwick’s rule (Hamilton and Hartwick 2005), resource-rich countries, in order to
maintain wealth and build strong foundations for economic growth, should offset the depletion
of their natural resources by commensurate levels of investment in produced capital—primarily
infrastructure and human capital. But in the case of Ghana, notwithstanding the new oil revenues
and the massive increase in the debt stock, capital expenditure as a percentage of GDP has actually
been in decline since 2007. From an average of 12 per cent of GDP between 2004 and 2008, with
the lowest level over this period being 9.1 per cent in the 2008 election year, capital expenditure
declined to 4.8 per cent by 2014 (Figure 5). This means that before the oil discovery Ghana was
spending a much higher proportion of its income on capital investment than it has been since the
oil discovery. This decline in infrastructure investment runs counter to what one would expect,
and to what one would recommend if the oil revenues were prudently invested.
Figure 5: Capital expenditure as percentage of GDP, 2000–14
Source: Data from Ministry of Finance and Economic Planning, Ghana.
0
2
4
6
8
10
12
14
16
2000 2001 2002 2003 2004 2005 2006 2007 2008 2009 2010 2011 2012 2013 2014
18
In accordance with Section 21(5) of the 2011 PRMA, four priority expenditures were approved by
parliament in the annual budget funding amount (ABFA): (i) expenditure and amortization of
loans for oil and gas infrastructure, (ii) roads and other infrastructure, (iii) agricultural
modernization, and (iv) capacity building (including oil and gas). Table 2 shows the allocations to
these areas for the 2012 budget year.
Table 2: Annual budget allocations to four priority areas, 2012
Priority areas GH₵ millions
Expenditure and amortization of loans for oil and gas infrastructure 100.00
Roads and other infrastructure 232.41
Agricultural modernization 72.47
Capacity building 111.95
Total 516.83
Source: Government of Ghana Budget 2013.
Even though on paper the oil revenue allocation is skewed towards infrastructure, the overall
decline in capital spending means that the total allocation to infrastructure is likely to have declined.
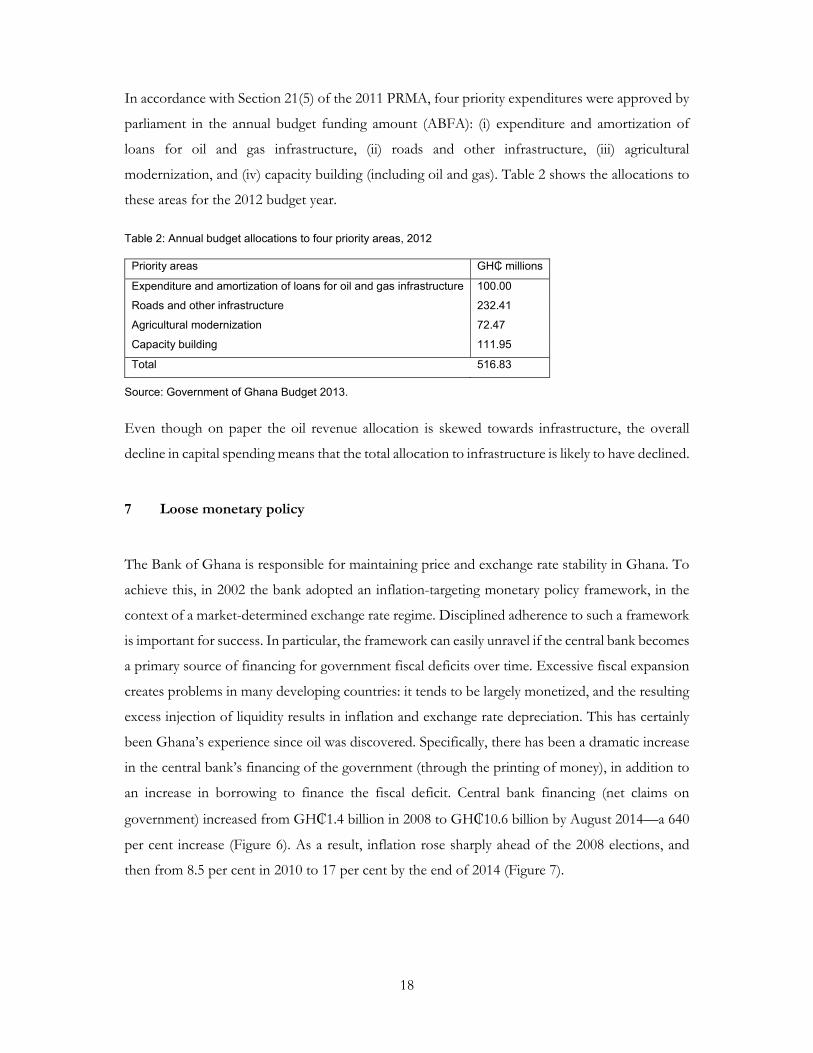
7 Loose monetary policy
The Bank of Ghana is responsible for maintaining price and exchange rate stability in Ghana. To
achieve this, in 2002 the bank adopted an inflation-targeting monetary policy framework, in the
context of a market-determined exchange rate regime. Disciplined adherence to such a framework
is important for success. In particular, the framework can easily unravel if the central bank becomes
a primary source of financing for government fiscal deficits over time. Excessive fiscal expansion
creates problems in many developing countries: it tends to be largely monetized, and the resulting
excess injection of liquidity results in inflation and exchange rate depreciation. This has certainly
been Ghana’s experience since oil was discovered. Specifically, there has been a dramatic increase
in the central bank’s financing of the government (through the printing of money), in addition to
an increase in borrowing to finance the fiscal deficit. Central bank financing (net claims on
government) increased from GH₵1.4 billion in 2008 to GH₵10.6 billion by August 2014—a 640
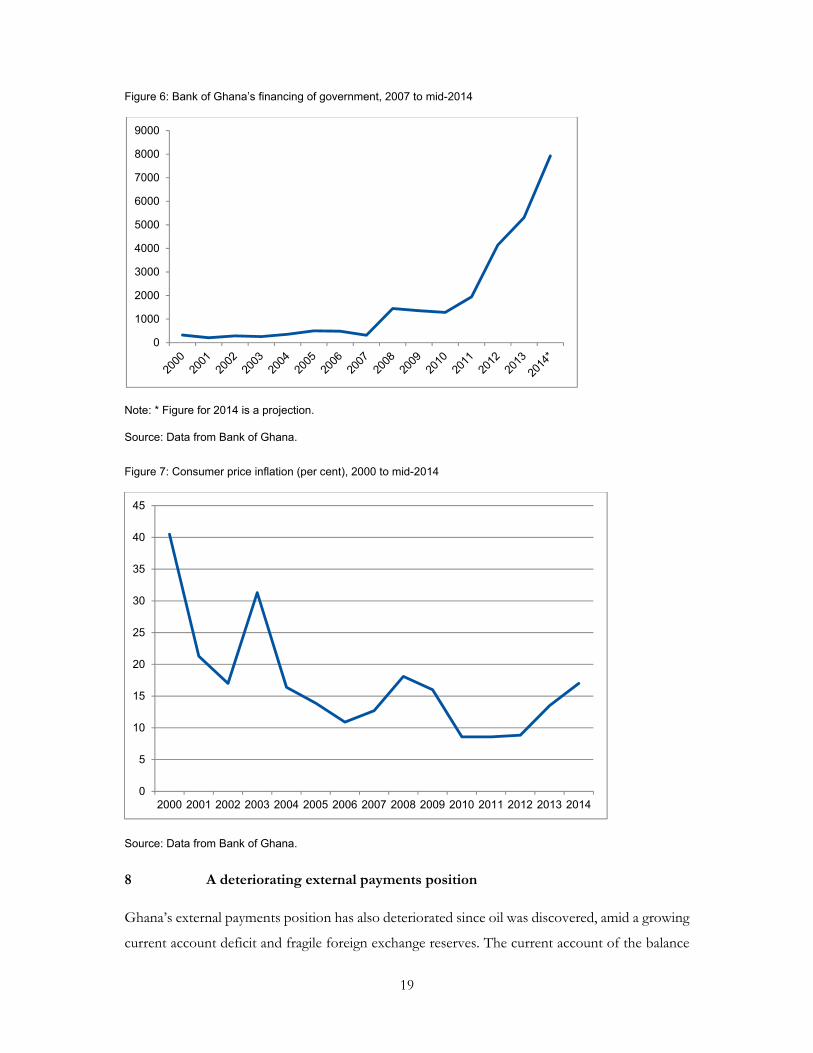
per cent increase (Figure 6). As a result, inflation rose sharply ahead of the 2008 elections, and
then from 8.5 per cent in 2010 to 17 per cent by the end of 2014 (Figure 7).
19
Figure 6: Bank of Ghana’s financing of government, 2007 to mid-2014
Note: * Figure for 2014 is a projection.
Source: Data from Bank of Ghana.
Figure 7: Consumer price inflation (per cent), 2000 to mid-2014
Source: Data from Bank of Ghana.
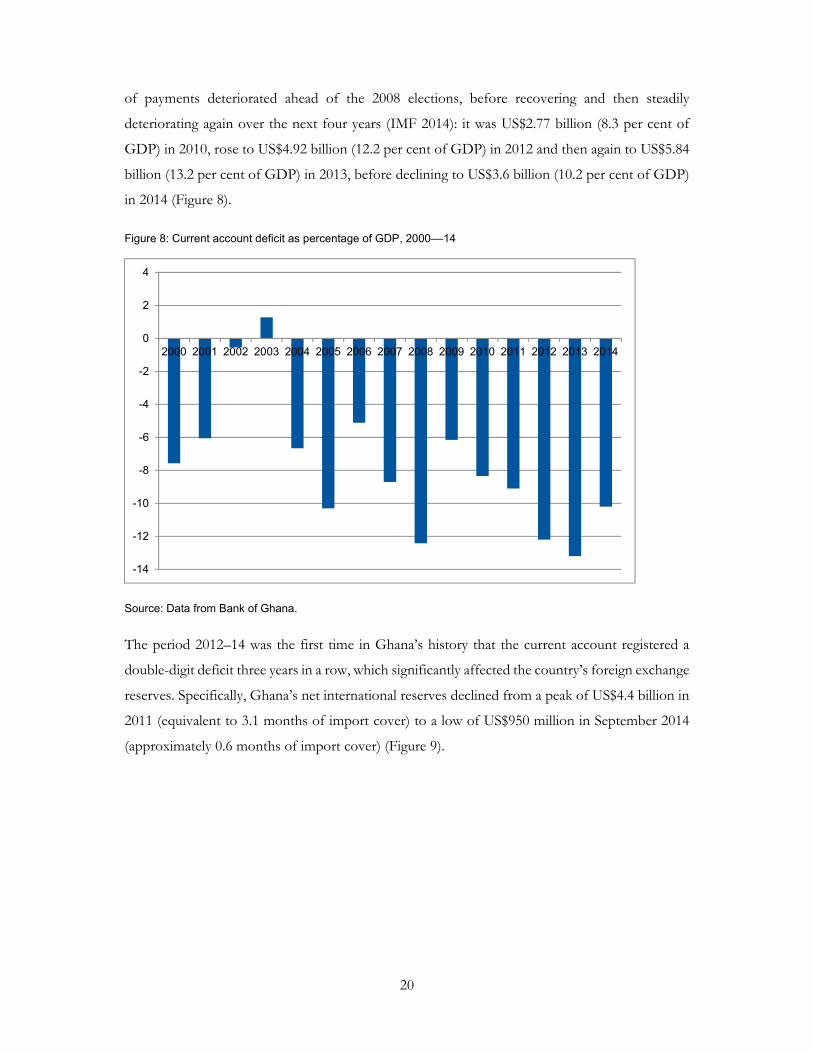
8 A deteriorating external payments position
Ghana’s external payments position has also deteriorated since oil was discovered, amid a growing
current account deficit and fragile foreign exchange reserves. The current account of the balance
0
1000
2000
3000
4000
5000
6000
7000
8000
9000
0
5
10
15
20
25
30
35
40
45
2000 2001 2002 2003 2004 2005 2006 2007 2008 2009 2010 2011 2012 2013 2014
20
of payments deteriorated ahead of the 2008 elections, before recovering and then steadily
deteriorating again over the next four years (IMF 2014): it was US$2.77 billion (8.3 per cent of
GDP) in 2010, rose to US$4.92 billion (12.2 per cent of GDP) in 2012 and then again to US$5.84
billion (13.2 per cent of GDP) in 2013, before declining to US$3.6 billion (10.2 per cent of GDP)
in 2014 (Figure 8).
Figure 8: Current account deficit as percentage of GDP, 2000––14
Source: Data from Bank of Ghana.
The period 2012–14 was the first time in Ghana’s history that the current account registered a
double-digit deficit three years in a row, which significantly affected the country’s foreign exchange
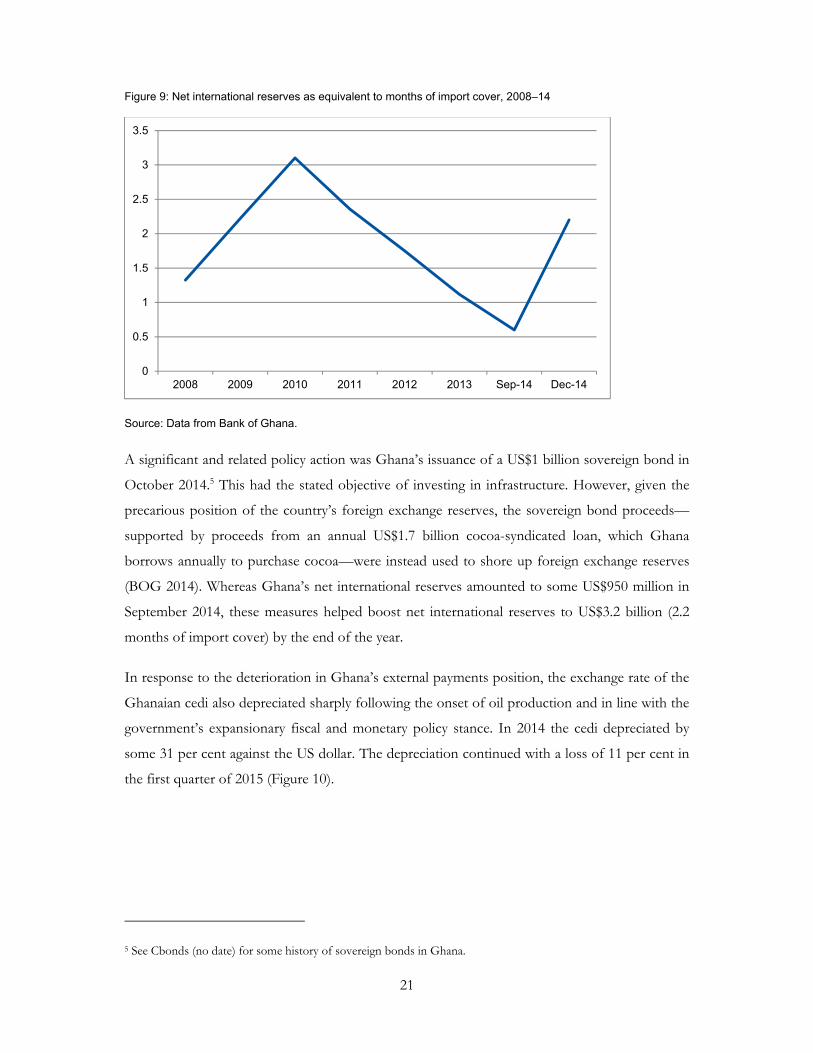
reserves. Specifically, Ghana’s net international reserves declined from a peak of US$4.4 billion in
2011 (equivalent to 3.1 months of import cover) to a low of US$950 million in September 2014
(approximately 0.6 months of import cover) (Figure 9).
-14
-12
-10
-8
-6
-4
-2
0
2
4
2000 2001 2002 2003 2004 2005 2006 2007 2008 2009 2010 2011 2012 2013 2014
21
Figure 9: Net international reserves as equivalent to months of import cover, 2008–14
Source: Data from Bank of Ghana.
A significant and related policy action was Ghana’s issuance of a US$1 billion sovereign bond in
October 2014.5 This had the stated objective of investing in infrastructure. However, given the
precarious position of the country’s foreign exchange reserves, the sovereign bond proceeds—
supported by proceeds from an annual US$1.7 billion cocoa-syndicated loan, which Ghana
borrows annually to purchase cocoa—were instead used to shore up foreign exchange reserves
(BOG 2014). Whereas Ghana’s net international reserves amounted to some US$950 million in
September 2014, these measures helped boost net international reserves to US$3.2 billion (2.2
months of import cover) by the end of the year.
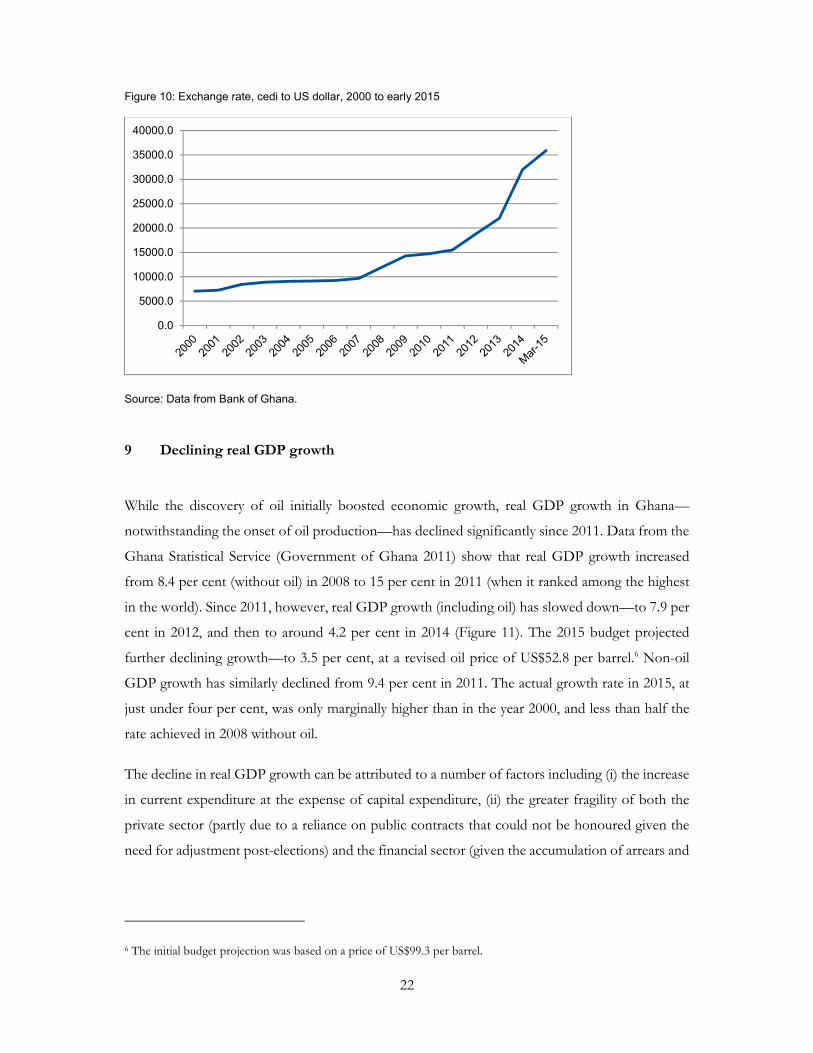
In response to the deterioration in Ghana’s external payments position, the exchange rate of the
Ghanaian cedi also depreciated sharply following the onset of oil production and in line with the
government’s expansionary fiscal and monetary policy stance. In 2014 the cedi depreciated by
some 31 per cent against the US dollar. The depreciation continued with a loss of 11 per cent in
the first quarter of 2015 (Figure 10).
5 See Cbonds (no date) for some history of sovereign bonds in Ghana.
0
0.5
1
1.5
2
2.5
3
3.5
2008 2009 2010 2011 2012 2013 Sep-14 Dec-14
22
Figure 10: Exchange rate, cedi to US dollar, 2000 to early 2015
Source: Data from Bank of Ghana.
9 Declining real GDP growth
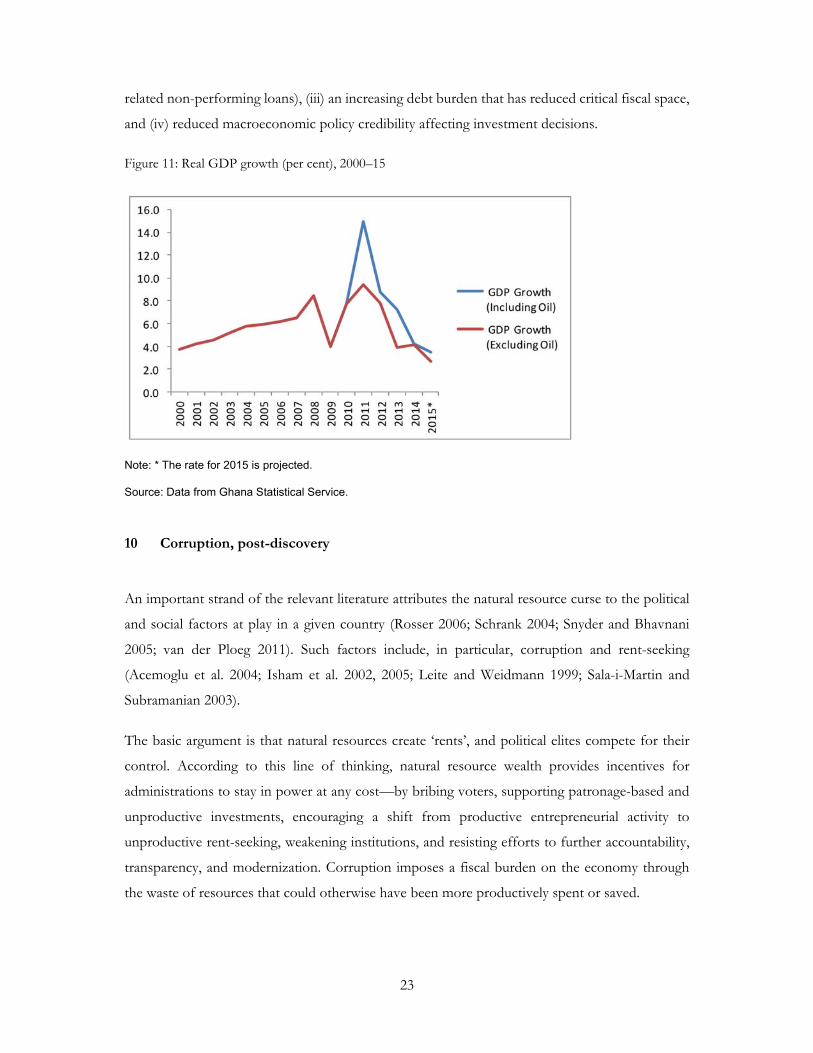
While the discovery of oil initially boosted economic growth, real GDP growth in Ghana—
notwithstanding the onset of oil production—has declined significantly since 2011. Data from the
Ghana Statistical Service (Government of Ghana 2011) show that real GDP growth increased
from 8.4 per cent (without oil) in 2008 to 15 per cent in 2011 (when it ranked among the highest
in the world). Since 2011, however, real GDP growth (including oil) has slowed down—to 7.9 per
cent in 2012, and then to around 4.2 per cent in 2014 (Figure 11). The 2015 budget projected
further declining growth—to 3.5 per cent, at a revised oil price of US$52.8 per barrel.6 Non-oil
GDP growth has similarly declined from 9.4 per cent in 2011. The actual growth rate in 2015, at
just under four per cent, was only marginally higher than in the year 2000, and less than half the
rate achieved in 2008 without oil.
The decline in real GDP growth can be attributed to a number of factors including (i) the increase
in current expenditure at the expense of capital expenditure, (ii) the greater fragility of both the
private sector (partly due to a reliance on public contracts that could not be honoured given the
need for adjustment post-elections) and the financial sector (given the accumulation of arrears and
6 The initial budget projection was based on a price of US$99.3 per barrel.
0.0
5000.0
10000.0
15000.0
20000.0
25000.0
30000.0
35000.0
40000.0
23
related non-performing loans), (iii) an increasing debt burden that has reduced critical fiscal space,
and (iv) reduced macroeconomic policy credibility affecting investment decisions.
Figure 11: Real GDP growth (per cent), 2000–15
Note: * The rate for 2015 is projected.
Source: Data from Ghana Statistical Service.
10 Corruption, post-discovery
An important strand of the relevant literature attributes the natural resource curse to the political
and social factors at play in a given country (Rosser 2006; Schrank 2004; Snyder and Bhavnani
2005; van der Ploeg 2011). Such factors include, in particular, corruption and rent-seeking
(Acemoglu et al. 2004; Isham et al. 2002, 2005; Leite and Weidmann 1999; Sala-i-Martin and
Subramanian 2003).
The basic argument is that natural resources create ‘rents’, and political elites compete for their
control. According to this line of thinking, natural resource wealth provides incentives for
administrations to stay in power at any cost—by bribing voters, supporting patronage-based and
unproductive investments, encouraging a shift from productive entrepreneurial activity to
unproductive rent-seeking, weakening institutions, and resisting efforts to further accountability,
transparency, and modernization. Corruption imposes a fiscal burden on the economy through
the waste of resources that could otherwise have been more productively spent or saved.
24
In the case of Ghana, there are some indications that corruption may have been on the rise since
the discovery of oil. The Afrobarometer Survey conducted in 2014 by the Ghana Centre for
Democratic Development (CDD 2014) found that public perceptions of corruption had
significantly increased, and there was a similar perception of an increase in corruption in the run-
up to the 2008 elections under the NPP government (CDD 2008). According to the 2014 survey,
three quarters (75 per cent) of respondents said corruption had increased over the previous year.
11 Ghana’s political system in the context of oil
Ghana practises what has been described as a hybrid system of governance. The president is
chosen directly by the people (unlike in the parliamentary system), and is head of government and
head of state with full executive powers. But unlike the system operating in the United States, for
example, the president can appoint members of parliament to the executive branch—even while
they continue to function as legislators. Indeed, the Fourth Republican Constitution, under which
Ghana operates, makes it mandatory for the president to select a majority of ministers from
parliament.
The fact that the president is mandated to choose members of parliament as ministers—and that,
as in the case of all previous sitting presidents, these legislators are likely to be members of the
president’s political party—means that power is significantly skewed towards the executive branch
of the government. The executive branch also plays a large part in judicial duties. Not only is the
executive responsible for framing and presenting all bills sent to parliament, but the president
wields the power to appoint justices to the High Court and Appeals Court (acting on the advice
of the Judicial Council) as well as Supreme Court, and to appoint the chief justice (in consultation
with the Council of State and with prior approval of parliament). In practice, therefore, Ghana’s
political system is a presidential one (Banful 2011).
Ghana is a multiparty democracy, but of the 23 political parties registered in 2014, very few are
active across the nation. The strongest, most vibrant parties are the NDC, the NPP, the
Convention People’s Party, the People’s National Convention, and the Progressive People’s Party.
Of these, all but the latter have had at least one member in parliament since 1996. That said, the
relative dominance of the NDC and NPP in various general elections since 1992 has turned
Ghana’s democracy into a virtual two-party system.
25
All general elections since that year have been closely contested between the two parties. Only a
small margin (in terms of percentages and sometimes actual numbers) separates the two. The NDC
won the presidential elections and a majority of parliamentary seats in the 1992, 1996, 2008, and
2012 general elections, while the NPP won the presidential elections and a majority of
parliamentary seats in the 2000 and 2004 general elections.
In the 2000 presidential elections, none of the candidates of the two parties was able to secure the
required 50 per cent plus one vote to be elected president. The election therefore went into a run-
off, with NPP candidate John Agyekum Kufuor securing 56.9 per cent of the votes to be elected
president. In the 2004 presidential elections, he secured 52.5 per cent of the votes to defeat John
Atta Mills of the NDC, who received 44.6 per cent of the votes.
The 2008 election saw Mills defeat Nana Akufo-Addo of the NPP by the narrowest of margins—
41,000 votes (of about 12 million registered voters and nine million actual votes)—in a run-off
poll conducted after both candidates failed to secure the required votes in the first round. Mills
received 50.2 per cent of the votes and Akufo-Addo received 49.8 per cent. This was the closest
election in Ghana’s history, and the first to follow the discovery of oil. It speaks to the functioning
of Ghana’s democracy that the incumbent government was defeated by the opposition, even if by
the narrowest of margins.
The 2012 election was also fiercely fought: the NDC’s John Dramani Mahama received 50.7 per
cent of the votes, while NPP candidate Nana Akufo-Addo received 47.7 per cent (the candidates
of five other parties and an independent shared the remaining 1.6 per cent).
Such close margins indicate that political support for Ghana’s two main parties is more or less
evenly divided across the electorate. In this context, and for a four-year political term, the pressure
on any government to deliver is high. A loss of the support of even a small number of voters can
turn the next election. When oil was discovered in 2007, the incumbent NPP government raised
public expectations to a high pitch in the run-up to the 2008 elections (Modern Ghana 2007a).
President John Agyekum Kufuor declared, ‘It is a great time to be Ghanaian’ (Abissath 2008). As
discussed above, the main economic indicators deteriorated sharply ahead of both the 2008 and
2012 elections: the first time while the NPP was in government, the second time while the NDC
was the incumbent party. Consistent with the political business cycle literature, incumbent
governments in Ghana have generally expanded fiscal policy in election years. In a joint review of
public expenditure, Republic of Ghana et al. (2011) found that in election years (1992, 1996, 2000,
2004, and 2008) the fiscal deficit (on a cash basis) as a percentage of GDP was 1.5 per cent higher
26
than the year before. The 2012 fiscal outcome following the oil discovery therefore cannot be
wholly attributed to the oil discovery, even though the oil discovery may have amplified the
political business cycle given additional financing possibilities.
Much of the literature on the political economy of resource booms predicts that the first
government to enjoy resource rents will do all it can to remain in power. In the case of Ghana,
this drive may be further facilitated by a skew in political power towards the executive branch,
with the parliament and judiciary arguably playing subsidiary roles. Ghana’s experience may
therefore support some researchers’ hypothesis that presidential systems are more prone to this
sort of tendency than parliamentary systems (Andersen and Aslaksen 2008; Persson and Tabellini
2003).
12 What could Ghana have done differently?
The objective of this paper is not to provide policy recommendations for Ghana, but rather to
make available an empirical account of Ghana’s experience to other recent or upcoming oil and
mineral producers. In that context, it is useful to briefly discuss what Ghana might have done
differently.
12.1 Anchoring fiscal discipline
While the discovery of oil provided Ghana with the fiscal space to increase its borrowing, there
was clear and present danger amid a lack of actual value. In the case of Ghana, plans for how the
loans were to be spent—and the transparency of their terms—were arguably insufficient. In sum,
institutional mechanisms were insufficient to check unsustainable fiscal expansion. Would fiscal
rules of the type employed in Chile and discussed by Solimano and Guajardo (2017) help in such
a context?
12.2 Fiscal rules and budget institutions
Fiscal rules commit governments, usually by legislation, to numerical targets—most often
budgetary aggregates pertaining to debts, deficits, expenditures, and revenues. The aim is to tie the
hands of the fiscal authorities in a bid to achieve greater fiscal discipline. (Fiscal guidelines, on the
other hand, are not backed by legislation.) Research on the effectiveness of fiscal rules does not
27
indicate that fiscal discipline follows in a straight line. Ossowski and Halland (2016) note that fiscal
rules seem to work best in countries with:
a prior commitment to fiscal discipline
strong institutions
political commitment and consensus
policy credibility
strong public financial management capacity
fiscal transparency
robust monitoring
It is therefore possible that a country lacking fiscal rules but possessing a commitment to fiscal
discipline and good institutions will outperform a country with well-designed fiscal rules but with
less commitment to fiscal discipline, less political consensus, and weaker institutions.
Chile provides a good example of the success of fiscal rules amid dependence on resource revenues
(Frankel 2011). Here, the structural budget balance is targeted to allow some cyclical flexibility.
The medium-term equilibrium price of copper and the output gap are decided on by two non-
partisan expert panels. The Chilean mechanisms are discussed in greater detail in Solimano and
Guajardo (2017).
What is clear from the literature is that political economy considerations are critical to the
success—or otherwise—of fiscal rules in resource-rich countries. For many low-income countries,
infrastructure needs are high, as is the demand for public-sector wages. Governments facing
elections may attempt to respond to these two demands by embarking on infrastructure projects
without conducting value-for-money audits, and also by increasing public-sector wages (Gelb
1986; Medas and Zakharova 2009). Under these circumstances, electoral imperatives may trump
any fiscal rule.
Similarly, it is very difficult for politicians in low-income countries that have just discovered a
resource to make an argument to increase savings and pursue some sort of intertemporal
28
optimization, as argued in a paper by van der Ploeg and Venables (2017). This is especially the case
when elections are hard fought and close in margin.
The application of fiscal rules in Ghana is new territory: the history of the country’s fiscal
management is one of fiscal indiscipline interspersed with short periods of fiscal discipline. As
discussed above, the period between 2001 and 2006, for example, was one of sustained fiscal
consolidation under an IMF programme. In a sense, Ghana was operating under an externally
imposed and monitored quasi-fiscal rule, given that it needed to adhere to the IMF’s programme
to obtain HIPC relief. But in a cost-benefit analysis, even a fiscal rule enshrined in law might lose
out to the promise of electoral victory. Judging from successive administrations’ very poor
observance of the 2002 Bank of Ghana Act and the 2011 PRMA, fiscal rules by themselves are
not sufficient to guarantee fiscal discipline.7 What is needed is a commitment to—and a consensus
on—fiscal discipline across the political divide, policy credibility, and a building up of strong public
financial management capacity. With these requirements in place, a fiscal responsibility law might
work.
12.3 Anchoring monetary discipline
In Ghana, fiscal dominance following oil discovery and production was also accommodated by
the central bank. Central bank financing of the fiscal deficit increased fourfold between 2007 and
2008 (in the run-up to the 2008 elections), and subsequently increased sixfold between 2008 and
2014. In the context of an inflation-targeting framework, such an increase in liquidity was bound
to compromise the central bank’s ability to maintain price and exchange rate stability.
12.4 The Bank of Ghana Act and central bank independence
The case for central bank independence is largely based on the argument that central banks need
to be protected from political interference to deliver on the goal of price stability (Alesina and
Summers 1993; Bade and Parkin 1982; Parkin 1987). Yet some research (including in developing
countries) indicates mixed economic performance even where central banks are independent
(Berger et al. 2001; Eijffinger and de Haan 1996; Klomp and de Haan 2007).
7 A detailed account of how Ghana’s PRMA has been breached one way or another can be found in NRGI (2015).
29
In the case of Ghana, following a prolonged bout of macroeconomic instability, the 2002 Bank of
Ghana Act was passed with the intention of insulating the central bank from political interference
and fiscal dominance. The Act was a landmark piece of legislation that established the
independence of the Bank of Ghana. Section 3(1) of the Act specifies that ‘the primary objective
of the Bank is to maintain stability in the general level of prices.’ The Act further states that ‘(2)
without prejudice to subsection (1) the Bank shall support the general economic policy of
government and promote economic growth and effective operation of banking and credit systems
in the country, independent of instructions from the Government or any other authority’ (BOG 2002, emphasis
added). This provision makes the Bank of Ghana, on paper at least, one of the most independent
central banks in the world (Ayensu 2007).
This historic Act gives operational independence to the Bank of Ghana and specifies, among other
provisions, that:
The primary objective of the central bank is to maintain price stability ‘independent of
instructions from Government or any other authority’. This has refocused the central
bank’s role on the major task of inflation control, and away from the developmental
activities that characterized the bank’s past operations.
The Monetary Policy Committee is responsible for formulating monetary policy, which
should bring transparency to the central bank’s operations and its communications with
the public.
Government borrowing from the central bank in any year will be limited to 10 per cent of
its current year’s revenue.
To achieve its primary objective of maintaining price stability under the Bank of Ghana Act, the
Bank of Ghana formally adopted an inflation-targeting monetary policy framework in 2002. In
this context, the central bank should be able to choose instruments independent of political
pressure. In addition, the absence of fiscal dominance implies that the central bank should have
minimal responsibility for financing government deficits, or generally that fiscal policy does not
dictate monetary policy. Thus most legal frameworks in inflation-targeting countries tend to limit
or even prohibit central bank financing of government borrowing. Instead, countries working
within such frameworks have sought to maintain strong fiscal discipline and/or developed deep
financial markets with the capacity to absorb the public sector’s borrowing requirement. In this
30
context, fiscal reforms to maintain a broad revenue base, and thus reduce the need for seigniorage
revenue,8 become crucial (Tuladhar 2005).
So why is it that central bank financing has grown so dramatically since the oil discovery, and why
has the 2002 Bank of Ghana Act not been able to restrain this increase in central bank financing?
The answer most likely lies in the inability of the central bank to withstand pressure from the
government. There are no sanctions for breaches of the Act. Also, under the Act, the Bank of
Ghana does not report to parliament. Furthermore, the ceiling on lending to the government is
based on the government’s estimate of revenue collection in the current year, which provides an
incentive for an upward bias in revenue estimates. Instead, such legislation might have set a ceiling
on the bank’s lending to the government that is based on the government’s actual revenue
collection in the previous year.
The experience of Ghana shows that while monetary policy matters, fiscal policy matters even
more. Ghana’s monetary policy framework could not withstand sustained pressure from the fiscal
authorities in 2000, 2008, and 2012—all election years. It is clear that governments must commit
to fiscal discipline beyond the electoral cycle. In the context of Ghana’s most recent (April 2015)
IMF programme, the central bank will be required to reduce its financing to the government to
five per cent in 2015 and zero in the 2016 election year (IMF 2015). The conditions necessary for
fiscal rules to be effective are probably the same as those necessary for central bank independence:
policy credibility, fiscal discipline, political commitment, and political consensus, among others.
The manner in which the central bank has exercised its role has also encouraged fiscal dominance.
An amendment of the Bank of Ghana Act to strictly limit central bank financing of the
government might have helped. Consistent with the inflation-targeting framework, a zero-
financing limit (on a continual basis) would have helped to anchor both monetary and fiscal
discipline.
12.5 Transparency
To enhance transparency in the management of natural resources, Ghana joined the Extractive
Industries Transparency Initiative (EITI) in 2003 with a focus on revenue transparency. Ghana
became compliant with EITI in 2011. Ghana also set up the Public Interest Accountability
8 Seigniorage is the difference between the face value of money (i.e. coins or notes) and its production cost.
31
Committee (PIAC) in 2011 under Section 51 of the 2011 Petroleum Revenue Management Act
(Act 815). The role of PIAC is to conduct independent assessment and monitor the utilization of
oil revenues to ensure accountability by government.
How much have PIAC and EITI contributed to enhancing transparency in the management of
Ghana’s oil resources? The Institute of Economic Affairs Ghana, a leading public policy think
thank, has developed the Petroleum Transparency and Accountability Index Project, an index to
monitor transparency and accountability in the oil sector since 2011. The index focuses on four
key areas: revenue transparency, expenditure transparency, contract transparency, and the Ghana
Petroleum Funds. The 2015 report found that steady progress had been made with regard to the
transparency of revenue, expenditure and the Ghana Petroleum Funds. Contract transparency
showed the least improvement, lacking public disclosure of contracts and the associated process
(IEA 2015)
The biggest project thus far undertaken in the oil and gas sector is the Atuabo gas project of the
Ghana National Gas Company (GNGC). This US$850 million investment, which is financed with
a loan from the China Development Bank, has been collateralized with Ghana’s oil revenues. In
addition, public funds of US$140 million have been used to capitalize the GNGC (ACEP 2014a).
In spite of this, parliament has had no role in the approval of the investment programme of the
GNGC, whereas the Ghana National Petroleum Company, the national oil company, must have
its investment programme approved by parliament (ACEP 2014a). This state of affairs creates
room for possible fiscal indiscipline, as contracts of this nature evade value-for-money audits and
other scrutiny.
Furthermore, contracts for prospecting or exploration rights in Ghana’s oil and gas sector are
issued through an administrative process, rather than through competitive tendering. Ghana also
does not have any mandatory contract disclosure provisions, and therefore details of oil contracts
that do not come before parliament can only be disclosed by a ministerial directive.
Notwithstanding Ghana’s compliance with EITI, civil society organizations have called for
increased disclosure of information on beneficial ownership in mineral and oil contracts. (EITI
encourages participating countries to disclose such vital information, but does not make this
mandatory.) Furthermore, there have been claims that the oversight responsibility of PIAC may
have been curtailed, with the record over the last two years indicating that PIAC has had difficulties
in carrying out its mandated activities, partly because of underfunding. According to Adam (2014),
in 2014 PIAC received only 14 per cent of its proposed budget.
32
12.6 Strengthening the law on the management of oil revenues
Ghana’s PRMA includes the following provisions, among others:
Up to 70 per cent of expected revenue from petroleum operations may be utilized in any
financial year.
The excess revenue after the budgetary allocation must be paid into the Petroleum Holding
Fund.
At least 70 per cent of the excess revenue, after budgetary allocation, must be transferred
into the Petroleum Stabilization Fund (a fund to sustain public expenditure capacity during
periods of unanticipated petroleum revenue shortfalls).
The balance is paid into the Heritage Fund (an endowment fund to support development
for future generations when petroleum reserves have been depleted).
The oil revenues due to the budget can be used as collateral for loans for the first 10 years
of oil production.
But in the face of dwindling foreign exchange reserves, the Petroleum Stabilization Fund was
drawn down even well before oil prices fell and there was any actual shortfall in petroleum
revenues. As the funds transferred to the Stabilization Fund increased in 2012 and 2013, the
government—trying to create more room for expenditure, and using a provision (Section 23) of
the 2011 PRMA—set a cap on the amount to be transferred into the Stabilization Fund. The cap
was set at US$250 million at a time in 2013 when the balance on the account stood at US$426
million. This provided fiscal space to spend the excess amount of US$176 million. Civil society
organizations have argued that the withdrawal of funds from the Stabilization Fund was illegal,
since this was not made public and was first brought to the attention of the public by a whistle-
blower (ACEP 2014b).
The lesson from Ghana’s experience thus far is that while stabilization and savings funds can help
smooth spending, they can certainly not prevent slippages. In the case of Ghana’s PRMA, this is
compounded by the fact that collateralization of future oil revenues was allowed for the first 10
years, thereby undermining the initial objective to limit excessive spending permitted by oil
discoveries.
33
12.7 Forecasting government oil revenues
The literature contains persuasive evidence that official forecasts of revenues during resource
booms tend to be overly optimistic (Forni and Momigliano 2004; Frankel 2011; Jonung and Larch
2006). This is arguably the case in Ghana.
According to Adam (2014), Ghana’s 2011 PRMA as designed gives an incentive to governments
(that want to spend) to project higher revenues than are likely realizable, because 70 per cent of
the projected benchmark oil revenue is allocated to the budget. In 2011 the government projected
that it would receive GH₵1.2 billion from oil, including corporate taxes of about GH₵600 million.
The total amount actually earned, however, came down to GH₵667 million, representing a
shortfall of GH₵583 million. The benchmark revenue for 2012 was over GH₵1 billion,9 but the
amount actually received came down to GH₵562.4 million. The government forecasted oil
revenues from corporate taxes of GH₵600 million for 2011 and GH₵384.1 million for 2012,
although these corporate tax revenues were arguably unlikely to materialize (Adam 2014). This is
because the Jubilee partners10 are entitled to capital cost recovery under the 1987 Petroleum
Income Tax Law (PNDC Law 188). There was nevertheless an overprojection of these revenues,
perhaps motivated by the provisions of the 2011 PRMA, by which the proportion of the oil
revenues that accrues to the budget (ABFA) is based on projected benchmark oil revenues. In the
meantime, the projected revenues were spent in advance by using additional government
borrowing.
In the 2015 government budget presented to parliament in November 2014, oil revenues were
estimated at GH₵4.2 billion (3.1 per cent of GDP) based on an oil price of US$99.3 per barrel,
when global oil prices at the time were actually close to US$50 per barrel. This estimate followed
the 2011 PRMA Act provision of using the seven-year moving average price. It was argued that
the use of the US$99.3 price was dictated by the PRMA legislation (and this over-optimistic
forecast was used to programme 70 per cent of the projected revenue as part of the 2015 budget),
although that implied a revenue shortfall of GH₵2.7 billion (two per cent of GDP). Prudence
would have dictated that, despite the law, no budgeted expenditures be made in relation to
unrealizable revenues.
9 Based on a projected oil price of US$90 per barrel. 10 Tullow, Kosmos, Anadarko, and Sabre, which are currently producing Ghana’s oil from the Jubilee Field (offshore).
34
The government later, at the prompting of the IMF (in the context of negotiations for an IMF
bailout), presented a revised oil revenue estimate of GH₵1.5 billion (1.1 per cent of GDP) using
the price of US$52.8 per barrel, even though the original budget was approved by parliament in
January 2015.11
To enhance safeguards against fiscal indiscipline, adequate legislation and methodologies for
revenue forecasting are imperative. Frankel (2011) has recommended, following Chile’s example,
that resource-rich countries consider establishing independent non-partisan expert panels to
forecast resource revenues for the budget and the extent to which prices (of oil, in the case of
Ghana) deviate from their long-run averages.
13 Conclusions
The discovery of oil in Ghana in 2007 raised public expectations quickly and substantially. For
many, oil appeared to be the long-awaited solution to Ghana’s developmental challenges. This
hope was reflected in the 2008 and 2012 election campaigns, which saw political parties promise
much in the areas of education, infrastructure, and health, among others. Many of these promises
were made with an eye on forthcoming oil revenues. Fiscal discipline was given low priority, as
parties focused on winning the elections.
As a consequence, the public finances deteriorated, debt returned to unsustainable levels, current
account deficits ballooned, foreign exchange reserves dwindled, the exchange rate depreciated
rapidly, interest rates rose, inflation rose, and real GDP growth declined. These are the hallmarks
of a resource curse. Ghana’s experience suggests that symptoms of the resource curse that have
dimmed its prospects since the discovery of oil could have been avoided in the presence of:
a broad-based political commitment to fiscal and monetary discipline
strong institutions, including the ability to uphold relevant fiscal and monetary legislation
strong public financial management capacity
11 Statement to parliament on ‘Implications of the Fall in Crude Oil Prices on the Budget’ submitted by the Minister of Finance and Economic Planning, 12 March 2015.
35
transparency in the management of oil resources
alignment of expenditure with realizable revenues in the context of independent oil
revenue forecasts
The case of Ghana may not fit smoothly into the classic resource curse narrative because several
of the usual transmission channels—such as an appreciation of the real exchange rate and the
volatility of commodity prices, or armed conflict—are missing. Nevertheless, as discussed in the
introduction to this paper, the Ghanaian story in part reflects the insights provided by the literature
on the political economy of development, and more specifically the political economy of the
resource curse. The immediate cause of the lack of fiscal and monetary discipline in Ghana can be
found in policy decisions.
Importantly, Ghana’s story allows us to move beyond vague notions of ‘institutional quality’,
measured by aggregate indexes, when considering the resource curse and how to address it. The
Ghanaian experience confirms that there are specific institutional checks and balances that must be
upheld if a country is to avoid the resource curse. From a fiscal and monetary perspective, these
include early management of expectations, a broad-based political commitment to fiscal discipline
as opposed to a reliance on fiscal rules, full and real (as opposed to nominal) independence of the
central bank, as well as the establishment of means to isolate from political pressures any sovereign
wealth fund and the government entity responsible for oil revenue projections. Ultimately, these
factors are likely to be critical in determining whether the discovery of natural resources will
adversely affect economic growth or not. In the case of Ghana, they were key factors in the
regrettable shift from boom to gloom just four years after the discovery of oil.
36
References
Abissath, M.K. (2008). ‘Preparing for Oil Boom in Ghana: Any Lessons from Others?’ Abissath
Features. Available at: abissathfeatures-mawu.blogspot.co.uk/2008/06/preparing-for-oil-
boom-in-ghana-any.html (accessed 25 August 2017).
Acemoglu, D., S. Johnson, and J. Robinson (2003). ‘An African Success Story: Botswana’. In D.
Rodrik (ed.), In Search of Prosperity: Analytic Narratives on Economic Growth. Princeton, NJ:
Princeton University Press.
Acemoglu, D., J.A. Robinson, and T. Verdier (2004). ‘Kleptocracy and Divide-and-Rule: A Theory
of Personal Rule’. Journal of the European Economic Association, 2: 162–92.
ACEP (2014a). ‘Ghana Gas Report, May 2014’. Accra: Africa Centre for Energy Policy.
ACEP (2014b). ‘Press Release on the Illegal Withdrawal of Funds from the Petroleum Stabilization
Fund, June 2014’. Accra: Africa Centre for Energy Policy.
Adam, M.A. (2014). ‘Three Years of Petroleum Revenue Management in Ghana’. Public Interest
Report 2. Accra: Africa Centre for Energy Policy.
Ades, A., and R. Di Tella (1999). ‘Rents, Competition, and Corruption.’ American Economic Review,
89(4): 982–93.
Alesina, A., and L. Summers (1993). ‘Central Bank Independence and Macroeconomic
Performance: Some Comparative Evidence’. Journal of Money Credit and Banking, 25: 151–62.
Alexeev, M., and R. Conrad (2009). ‘The Elusive Curse of Oil’. Review of Economics and Statistics,
91(3): 586–98.
Amoako-Tuffour, J., and M. Ghanney (2013). ‘Ghana’s Petroleum Revenue Management Law: A
Social Contract for Good Economic Governance and Possible Challenges’. In K. Appiah-
Adu (ed.), Governance of the Petroleum Sector in an Emerging Developing Economy. Farnham: Gower
Publishing.
Andersen, J.J., and S. Aslaksen (2008). ‘Constitutions and the Resource Curse’. Journal of Development
Economics, 87: 227–46.
Atkinson, G., and K. Hamilton (2003). ‘Savings, Growth and the Resource Curse Hypothesis’.
World Development, 31(11): 1793–807.
Ayensu, E. (ed.) (2007). ‘Commemoration of Fiftieth Anniversary’. Accra: Bank of Ghana.
37
Bade, R., and M. Parkin (1982). ‘Central Bank Laws and Monetary Policy’. Unpublished paper.
London, ON: University of Western Ontario, Department of Economics.
Banful, A.B. (2011). ‘Do Formula-Based Intergovernmental Transfer Mechanisms Eliminate
Politically Motivated Targeting? Evidence from Ghana’. Journal of Development Economics, 96:
380–90.
Bawumia, M. (2010). Monetary Policy and Financial Sector Reform in Africa: The Experience of Ghana.
Bradenten, FL: BookLocker.
Berger, H., J. de Haan, and S. Eijffinger (2001). ‘Central Bank Independence: An Update of Theory
and Evidence’. Journal of Economic Surveys, 15(1): 3–40.
Blattman, C., J. Hwang, and J. Williamson (2007). ‘Winners and Losers in the Commodity Lottery:
The Impact of Terms of Trade Growth and Volatility in the Periphery 1870–1939’. Journal of
Development Economics, 82(1): 156–79.
Bleaney, M., and H. Halland (2014). ‘Natural Resource Exports, Fiscal Policy Volatility and
Growth’. Scottish Journal of Political Economy, 61(5): 502–22.
Bleaney, M., and H. Halland (2016). ‘Do Resource-Rich Countries Suffer from a Lack of Fiscal
Discipline?’ Policy Research Working Paper 7552. Washington, DC: World Bank,
Governance Global Practice Group.
BOG (2002). ‘Bank of Ghana Act (Act 612)’. Accra: Bank of Ghana.
BOG (2014). ‘Bank of Ghana Monetary Account, December 2014’. Accra: Bank of Ghana.
BOG (2015). ‘Bank of Ghana Monetary Policy Committee, February 2015’. Accra: Bank of Ghana.
Brunnschweiler, C.N. (2007). ‘Cursing the Blessings? Natural Resource Abundance, Institutions,
and Economic Growth’. World Development, 36(3): 399–419.
Brunnschweiler, C.N., and E. Bulte (2008). ‘The Resource Curse Revisited and Revised: A Tale of
Paradoxes and Red Herrings’. Journal of Environmental Economics and Management, 55(3): 248–64.
Cbonds (no date). ‘Ghana: Bonds’. Available at: em.cbonds.com/countries/Ghana-bond
(accessed 25 August 2017).
CDD (2008). ‘How Ghanaians Rate the Performance of the NPP Administration’. Afrobarometer
Briefing Paper 49. Accra: Ghana Center for Democratic Development.
CDD (2014). ‘Afrobarometer Survey: Dispatch 6’. Accra: Ghana Center for Democratic
Development.
38
Collier, P., and A. Hoeffler (2004). ‘Greed and Grievance in Civil War’. Oxford Economic Papers,
56(4): 563–95.
Collier, P., and A. Hoeffler (2009). ‘Testing the Neocon Agenda: Democracy in Resource-Rich
Societies’. European Economic Review, 53(3): 293–308.
Corden, W., and J. Neary (1982). ‘Booming Sector and De-Industrialisation in a Small Open
Economy’. Economic Journal, 92: 825–48.
Eijffinger, S., and J. de Haan (1996). ‘The Political Economy of Central Bank Independence’.
Special Papers in International Economics 19. Princeton, NJ: University of Princeton,
International Finance Section.
Forni, L., and S. Momigliano (2004). ‘Cyclical Sensitivity of Fiscal Policies Based on Real Time
Data’. Economic Working Paper 540. Rome: Bank of Italy, Economic Research Department.
Fosu, A.K. (2009). ‘Country Role Models for Development Success: The Ghana Case’. Working
Paper 2009/42. Helsinki: UNU-WIDER.
Frankel, J.A. (2010). ‘The Natural Resource Curse: A Survey’. NBER Working Paper 15836.
Cambridge, MA: National Bureau of Economic Research.
Frankel, J.A. (2011). ‘A Solution to Fiscal Procyclicality: The Structural Budget Institutions
Pioneered by Chile’. NBER Working Paper 1694. Cambridge, MA: National Bureau of
Economic Research.
Gelb, A. (1986). ‘Adjustment to Windfall Gains: A Theoretical Framework’. In J.P. Neary and S.
van Wijnbergen (eds), Natural Resources and the Macroeconomy. Cambridge, MA: MIT Press.
Government of Ghana (2011). ‘Auditor General Report 2011’. Accra: Government of Ghana.
Government of Ghana (2013). ‘Budget Statement 2013’. Accra: Government of Ghana.
Hamilton, K., and J. Hartwick (2005). ‘Investing Exhaustible Resource Rents and the Path of
Consumption’. Canadian Journal of Economics, 38(2): 615–21.
IEA (2015). ‘Petroleum Transparency and Accountability (P-TRAC) Index Project’. Accra:
Institute of Economic Affairs.
IMF (2004). ‘Ghana: Enhanced HIPC Initiative Completion Point Document’. Washington, DC:
International Monetary Fund.
IMF (2009). ‘Ghana: 2009 Article IV Consultation and Request for a Three-Year Arrangement
Under the Poverty Reduction and Growth Facility—Staff Report; Staff Supplement; Staff
39
Statement; Public Information Notice and Press Release on the Executive Board Discussion;
and Statement by the Executive Director for Ghana’. IMF Country Report 09/256.
Washington, DC: International Monetary Fund. Available at:
www.imf.org/external/pubs/ft/scr/2009/cr09256.pdf (accessed 25 August 2017).
IMF (2014). ‘Article IV Consultation: Staff Report’. IMF Country Report 14/129. Washington,
DC: International Monetary Fund.
IMF (2015). ‘Ghana Request for a Three-Year Arrangement Under the Extended Credit Facility’.
Washington, DC: International Monetary Fund.
Isham, J., M. Woolock, L. Pritchett, and G. Busby (2002). ‘The Varieties of Rentier Experience:
How Natural Resource Export Structures Affect the Political Economy of Economic
Growth’. Economics Discussion Paper 03-08. Middlebury, VT: Middlebury College.
Isham, J., M. Woolock, L. Pritchett, and G. Busby (2005). ‘The Varieties of Resource Experience:
Natural Resource Export Structures and the Political Economy of Economic Growth’. World
Bank Economic Review, 19(2): 141–74.
Jonung, L., and M. Larch (2006). ‘Improving Fiscal Policy in the EU: The Case for Independent
Forecasts’. Economic Policy, 21(47): 491–534.
Klomp, J.G., and J. de Haan (2007). ‘Inflation and Central Bank Independence: A Meta Regression
Analysis’. Mimeo. Groningen: University of Groningen.
Leite, C., and J. Weidmann (1999). ‘Does Mother Nature Corrupt? Natural Resources, Corruption,
and Economic Growth’. IMF Working Paper WP/99/85. Washington, DC: International
Monetary Fund.
Mansoorian, A. (1991). ‘Resource Discoveries and “Excessive” External Borrowing’. Economic
Journal, 101(409): 1497–509.
Medas, P., and D. Zakharova (2009). ‘Primer on Fiscal Analysis in Oil-Producing Countries’. IMF
Working Paper 56. Washington, DC: International Monetary Fund.
Mehlum, H., K. Moene, and R. Torvik (2006a). ‘Cursed by Resources or Institutions?’ World
Economy, 29(8): 1117–31.
Mehlum, H., K. Moene, and R. Torvik (2006b). ‘Institutions and the Resource Curse’. Economic
Journal, 116(508): 1–20.
40
Modern Ghana (2007a). ‘Oil: Huge Field Discovered at Cape Three Points’. Modern Ghana, 19
June. Available at: www.modernghana.com/news/137981/1/oil-huge-field-discovered-at-
cape-three-points.html (accessed 25 August 2017).
Modern Ghana (2007b). ‘Oil! Oil! Oil!’ Modern Ghana, 27 June. Available at:
www.modernghana.com/news/138430/1/oil-oil-oil.html (accessed 25 August 2017).
NRGI (2015). ‘In Ghana, Fiscal Responsibility Remains Elusive Even as Oil Flows’. Accra:
Natural Resource Governance Institute.
Ossowski, R., and H. Halland (2016). Fiscal Management in Resource-Rich Countries: Essentials for
Economists, Public Finance Professionals, and Policy Makers. Washington, DC: World Bank.
Parkin, M. (1987). ‘Domestic Monetary Institutions and Deficits’. In J.M. Buchanan et al. (eds),
Deficits. Oxford: Basil Blackwell.
Persson, T., and G. Tabellini (2000). Political Economics: Explaining Economic Policy. Cambridge, MA:
MIT Press.
Persson, T., and G. Tabellini (2003). The Economic Effects of Constitutions: What Do the Data Say?
Cambridge, MA: MIT Press.
Republic of Ghana (2011). ‘Petroleum Revenue Management Act 2011 (Act 815)’. Accra: Ghana.
Republic of Ghana, World Bank, DANIDA, and KfW (2011). ‘Joint Review of Public Expenditure
and Financial Management’. Accra: Ghana.
Rosser, A. (2006). ‘The Political Economy of the Resource Curse: A Literature Survey’. Working
Paper 368. Brighton: Institute of Development Studies.
Sachs, J.D., and A.M. Warner (1995). ‘Natural Resource Abundance and Economic Growth’.
NBER Working Paper 5398. Cambridge, MA: National Bureau of Economic Research.
Sachs, J.D., and A.M. Warner (2001). ‘The Curse of Natural Resources’. European Economic Review,
45(4–6): 827–38.
Sala-i-Martin, X., and A. Subramanian (2003). ‘Addressing the Natural Resource Curse: An
Illustration from Nigeria’. IMF Working Paper WP/03/139. Washington, DC: International
Monetary Fund.
Schrank, A. (2004). ‘Reconsidering the “Resource Curse”: Sociological Analysis versus Ecological
Determinism’. New Haven, CT: Yale University, Department of Sociology.
41
Snyder, R., and R. Bhavnani (2005). ‘Diamonds, Blood, and Taxes: A Revenue-Centred
Framework for Explaining Political Order’. Journal of Conflict Resolution, 49(4): 563–97.
Solimano, A, and D. Calderón Guajardo (2017). ‘The Copper Sector, Fiscal Rules, and Stabilization
Funds in Chile: Scope and Limits’. Working Paper 2017/53. Helsinki: UNU-WIDER.
Tuladhar, A. (2005). ‘Governance Structures and Decision Making Roles in Inflation Targeting
Central Banks’. IMF Working Paper WP/05/183. Washington, DC: International Monetary
Fund.
van der Ploeg, F. (2011). ‘Natural Resources: Curse or Blessing?’ Journal of Economic Literature, 49(2):
366–420.
van der Ploeg, F., and S. Poelhekke (2010). ‘The Pungent Smell of “Red Herrings”: Subsoil, Assets,
Rents, Volatility and the Resource Curse’. Journal of Environmental Economics and Management,
60: 44–55.
van der Ploeg, F., and A.J. Venables (2017). ‘Extractive Revenues and Government Spending:
Short- versus Long-Term Considerations’. Working Paper 2017/45: Helsinki: UNU-
WIDER.