Embed Size (px)
Citation preview
Oil-Consumption-Weighted GDP: Description, Calculation, and Comparison
Vipin Arora, Tyler Hodge, and Tancred Lidderdale May 2016
Independent Statistics & Analysis
www.eia.gov
U.S. Energy Information Administration
Washington, DC 20585
This paper is released to encourage discussion and critical comment. The analysis and conclusions expressed here
are those of the authors and not necessarily those of the U.S. Energy Information Administration. Our thanks to
Vinay Tripathi, summer intern from Stanford University, for his background research on this project.
WORKING PAPER SERIES
May 2016
Vipin Arora, Tyler Hodge, and Tancred Lidderdale | U.S. Energy Information Administration | This paper is released to encourage discussion and critical comment. The analysis and conclusions expressed here are those of the authors and not necessarily those of the U.S. Energy Information Administration.
1
Summary
We outline an alternative measure of gross domestic product (GDP) for regional country groupings that
accounts for the relative level of oil consumption within each of the component countries. This analysis
specifically focuses on aggregate oil‐weighted GDP indices for the OECD (Organization for Economic
Cooperation and Development), non‐OECD, and world. We detail the calculation of this oil‐weighted
GDP index and compare growth rates for the OECD, non‐OECD, and world with those from GDP series
based on purchasing power parity (PPP) and market exchange rates (MER). We then explore these
differences by showing how oil intensity—oil consumption as a share of GDP—varies for these groups
based upon the GDP series used.
May 2016
Vipin Arora, Tyler Hodge, and Tancred Lidderdale | U.S. Energy Information Administration | This paper is released to encourage discussion and critical comment. The analysis and conclusions expressed here are those of the authors and not necessarily those of the U.S. Energy Information Administration.
2
Introduction For many people across Alabama and Louisiana, up into Ohio and way out in California, the release of
preseason college football rankings marks the end of summer and the transition to the best time of
year. As the fall season creeps closer—traffic picks up, the kids start to dread the upcoming school
year—various outfits order the best teams in the country from 1 to 25, before a single game has been
played. As strange as it seems, the formation of these rankings has some similarities to forecasts of oil
consumption.
For both preseason rankings and oil consumption forecasts, estimates must be made based on old
information and the extension of that data to the future. College football pollsters invariably modify
their extrapolations of past performance based on other things, including the quality of returning
players, “intangibles”, and the like. Those forecasting oil consumption do so as well: they generally use
predictions of future growth in real [inflation‐adjusted] gross domestic product (GDP), consider the
implications of national policies and technologies on oil demand, and factor in geopolitical risks.
Because it is available for most countries, GDP is often used in forecasting models of international oil
consumption. However, in order to calculate world [or regional] GDP growth rates, individual country
GDPs must first be converted from their local currencies to a common one. There are two standard
ways to do this: (1) using exchange rates determined by national authorities or in legally‐sanctioned
markets where currencies are traded (i.e., market exchange rates (MER)), or (2) using purchasing power
parities, sometimes called PPP exchange rates.1 The country values can then be aggregated to a world
or regional total for growth rate calculations.
One element that most crude oil forecasters ignore when using standard world GDP measures is its
distribution among oil consumers. Yet, it matters for total oil consumption whether economic growth is
occurring in countries that use oil heavily [with respect to their total economic output], or is
concentrated among those countries that consume relatively little. In this paper, we outline one
modification to account for this: a GDP index and growth rate weighted by oil consumption. The oil‐
weighted index still uses GDP as a measure of economic activity, but relates it to oil consumption
through weights tied to each country’s share of total world oil consumption. Such an adjustment can
have a significant effect on observed world GDP growth rates [Figure 1].
1 The PPP exchange rate is the number of units of a country’s currency required to buy the same amount of goods and services
in domestic markets as a U.S. dollar would buy in the United States. For more on converting GDP to a common currency see
Vipin Arora (2015), “Currency Conversion and Energy Projections: Some Questions and Answers,” EIA Working Paper. URL:
https://www.eia.gov/workingpapers/pdf/mer_ppp_arora.pdf.
May 2016
Vipin Arora, Tyler Hodge, and Tancred Lidderdale | U.S. Energy Information Administration | This paper is released to encourage discussion and critical comment. The analysis and conclusions expressed here are those of the authors and not necessarily those of the U.S. Energy Information Administration.
3
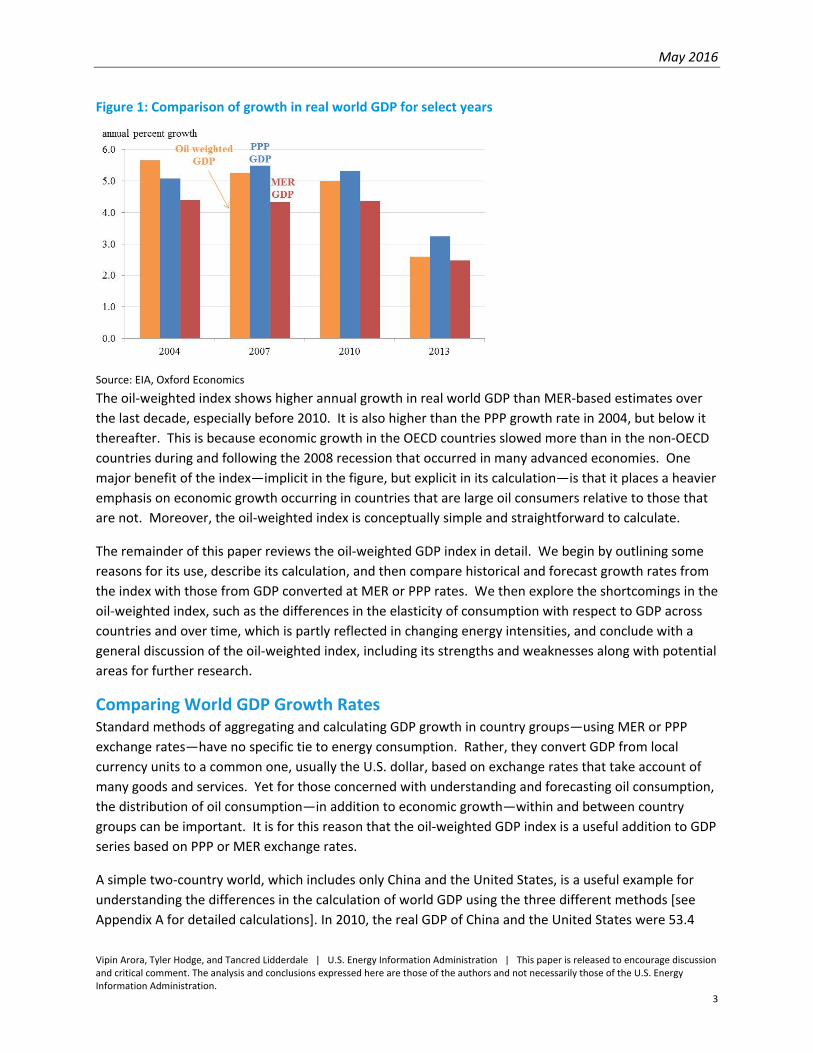
Figure 1: Comparison of growth in real world GDP for select years
Source: EIA, Oxford Economics
The oil‐weighted index shows higher annual growth in real world GDP than MER‐based estimates over
the last decade, especially before 2010. It is also higher than the PPP growth rate in 2004, but below it
thereafter. This is because economic growth in the OECD countries slowed more than in the non‐OECD
countries during and following the 2008 recession that occurred in many advanced economies. One
major benefit of the index—implicit in the figure, but explicit in its calculation—is that it places a heavier
emphasis on economic growth occurring in countries that are large oil consumers relative to those that
are not. Moreover, the oil‐weighted index is conceptually simple and straightforward to calculate.
The remainder of this paper reviews the oil‐weighted GDP index in detail. We begin by outlining some
reasons for its use, describe its calculation, and then compare historical and forecast growth rates from
the index with those from GDP converted at MER or PPP rates. We then explore the shortcomings in the
oil‐weighted index, such as the differences in the elasticity of consumption with respect to GDP across
countries and over time, which is partly reflected in changing energy intensities, and conclude with a
general discussion of the oil‐weighted index, including its strengths and weaknesses along with potential
areas for further research.
Comparing World GDP Growth Rates Standard methods of aggregating and calculating GDP growth in country groups—using MER or PPP
exchange rates—have no specific tie to energy consumption. Rather, they convert GDP from local
currency units to a common one, usually the U.S. dollar, based on exchange rates that take account of
many goods and services. Yet for those concerned with understanding and forecasting oil consumption,
the distribution of oil consumption—in addition to economic growth—within and between country
groups can be important. It is for this reason that the oil‐weighted GDP index is a useful addition to GDP
series based on PPP or MER exchange rates.
A simple two‐country world, which includes only China and the United States, is a useful example for
understanding the differences in the calculation of world GDP using the three different methods [see
Appendix A for detailed calculations]. In 2010, the real GDP of China and the United States were 53.4
May 2016
Vipin Arora, Tyler Hodge, and Tancred Lidderdale | U.S. Energy Information Administration | This paper is released to encourage discussion and critical comment. The analysis and conclusions expressed here are those of the authors and not necessarily those of the U.S. Energy Information Administration.
4
billion yuan and 15.0 billion dollars, respectively. That year, China's yuan‐to‐dollar exchange rates were
3.38 for the PPP and 6.77 for the MER.2 Based on the PPP exchange rate, China's real GDP in 2010
accounted for 45% of the two‐country world total. The MER exchange rate, on the other hand, resulted
in a conversion of China's real GDP so that it was only 29% of the world total. Consequently, China's
GDP gets more weight in the calculation of world GDP using the lower PPP exchange rate. Moreover,
because of China's higher GDP growth rate [9.5% from 2010 to 2011 compared with the 1.6% growth in
U.S. real GDP], the aggregated world GDP growth rate is also higher [5.2% based on the PPP compared
with 3.9% using the MER]. China's share of oil consumption in 2010 was 32% of the two‐country total
and the calculated oil‐consumption‐weighted GDP growth rate in 2011 was 4.1%, close to that of the
MER‐based world GDP growth rate.
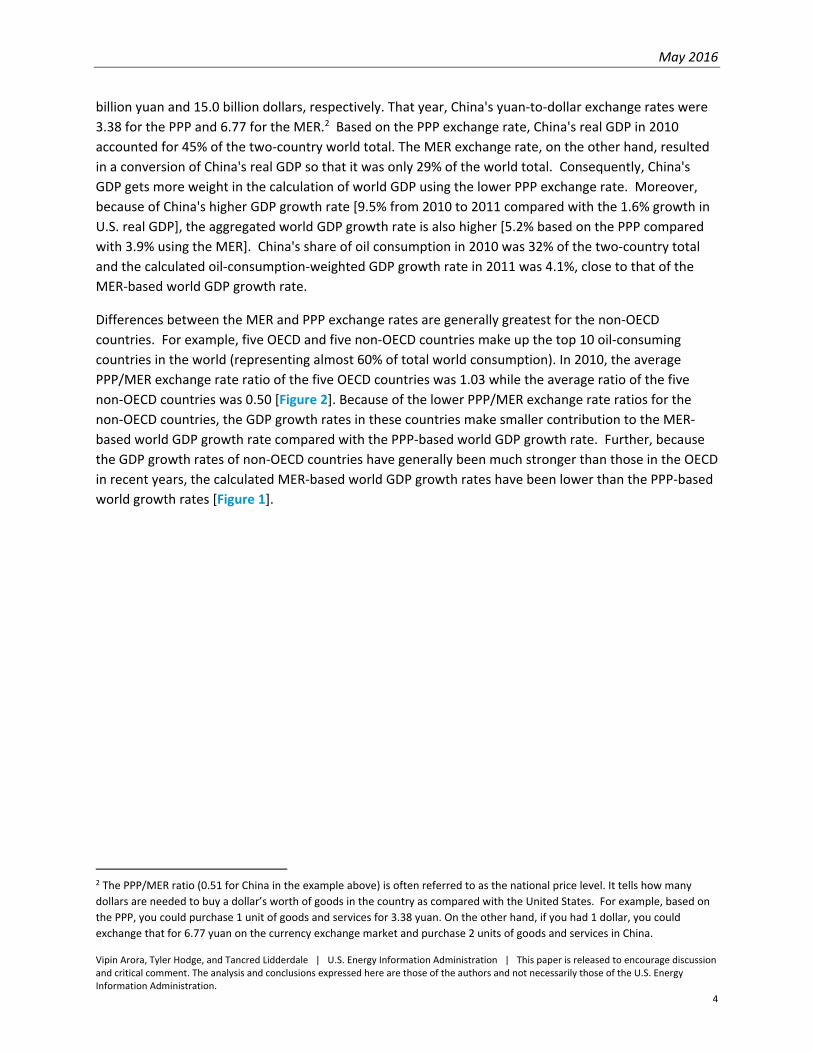
Differences between the MER and PPP exchange rates are generally greatest for the non‐OECD
countries. For example, five OECD and five non‐OECD countries make up the top 10 oil‐consuming
countries in the world (representing almost 60% of total world consumption). In 2010, the average
PPP/MER exchange rate ratio of the five OECD countries was 1.03 while the average ratio of the five
non‐OECD countries was 0.50 [Figure 2]. Because of the lower PPP/MER exchange rate ratios for the
non‐OECD countries, the GDP growth rates in these countries make smaller contribution to the MER‐
based world GDP growth rate compared with the PPP‐based world GDP growth rate. Further, because
the GDP growth rates of non‐OECD countries have generally been much stronger than those in the OECD
in recent years, the calculated MER‐based world GDP growth rates have been lower than the PPP‐based
world growth rates [Figure 1].
2 The PPP/MER ratio (0.51 for China in the example above) is often referred to as the national price level. It tells how many
dollars are needed to buy a dollar’s worth of goods in the country as compared with the United States. For example, based on
the PPP, you could purchase 1 unit of goods and services for 3.38 yuan. On the other hand, if you had 1 dollar, you could
exchange that for 6.77 yuan on the currency exchange market and purchase 2 units of goods and services in China.
May 2016
Vipin Arora, Tyler Hodge, and Tancred Lidderdale | U.S. Energy Information Administration | This paper is released to encourage discussion and critical comment. The analysis and conclusions expressed here are those of the authors and not necessarily those of the U.S. Energy Information Administration.
5
Figure 2: 2010 PPP/MER Exchange Rate Ratios of 10 Largest Oil Consuming Countries
Source: EIA, Oxford Economics
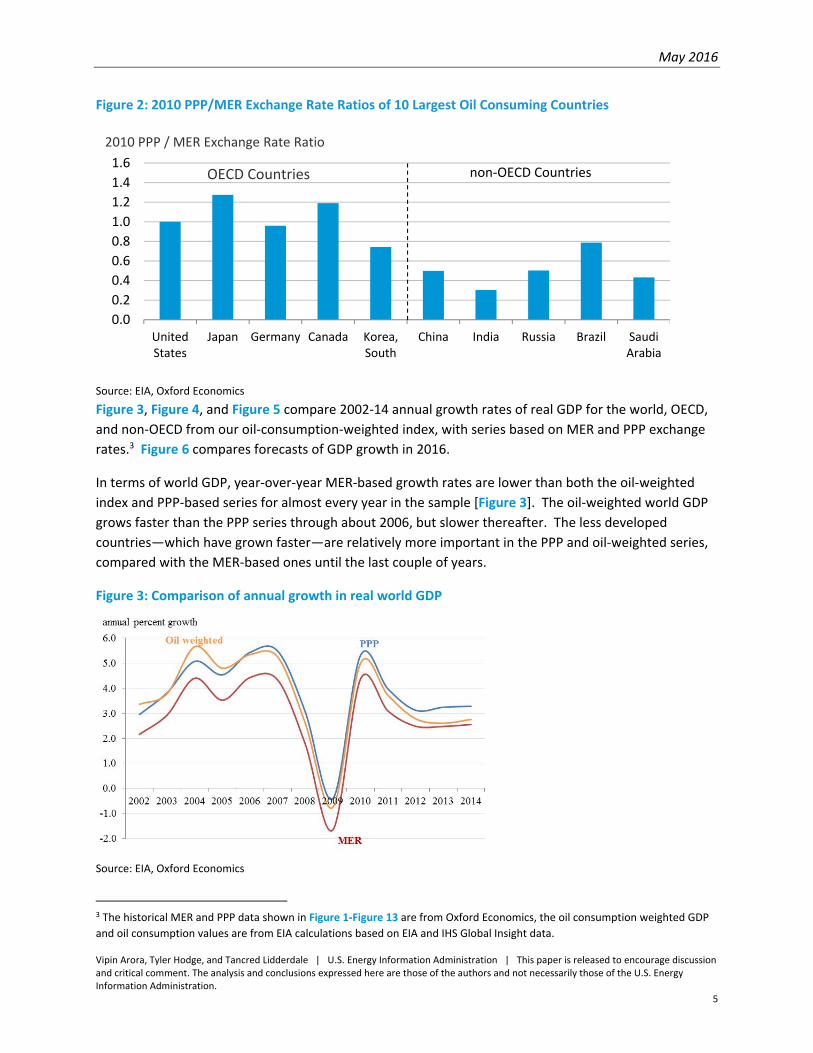
Figure 3, Figure 4, and Figure 5 compare 2002‐14 annual growth rates of real GDP for the world, OECD,
and non‐OECD from our oil‐consumption‐weighted index, with series based on MER and PPP exchange
rates.3 Figure 6 compares forecasts of GDP growth in 2016.
In terms of world GDP, year‐over‐year MER‐based growth rates are lower than both the oil‐weighted
index and PPP‐based series for almost every year in the sample [Figure 3]. The oil‐weighted world GDP
grows faster than the PPP series through about 2006, but slower thereafter. The less developed
countries—which have grown faster—are relatively more important in the PPP and oil‐weighted series,
compared with the MER‐based ones until the last couple of years.
Figure 3: Comparison of annual growth in real world GDP
Source: EIA, Oxford Economics
3 The historical MER and PPP data shown in Figure 1‐Figure 13 are from Oxford Economics, the oil consumption weighted GDP
and oil consumption values are from EIA calculations based on EIA and IHS Global Insight data.
0.0
0.2
0.4
0.6
0.8
1.0
1.2
1.4
1.6
UnitedStates
Japan Germany Canada Korea,South
China India Russia Brazil SaudiArabia
OECD Countries non‐OECD Countries
2010 PPP / MER Exchange Rate Ratio
May 2016
Vipin Arora, Tyler Hodge, and Tancred Lidderdale | U.S. Energy Information Administration | This paper is released to encourage discussion and critical comment. The analysis and conclusions expressed here are those of the authors and not necessarily those of the U.S. Energy Information Administration.
6
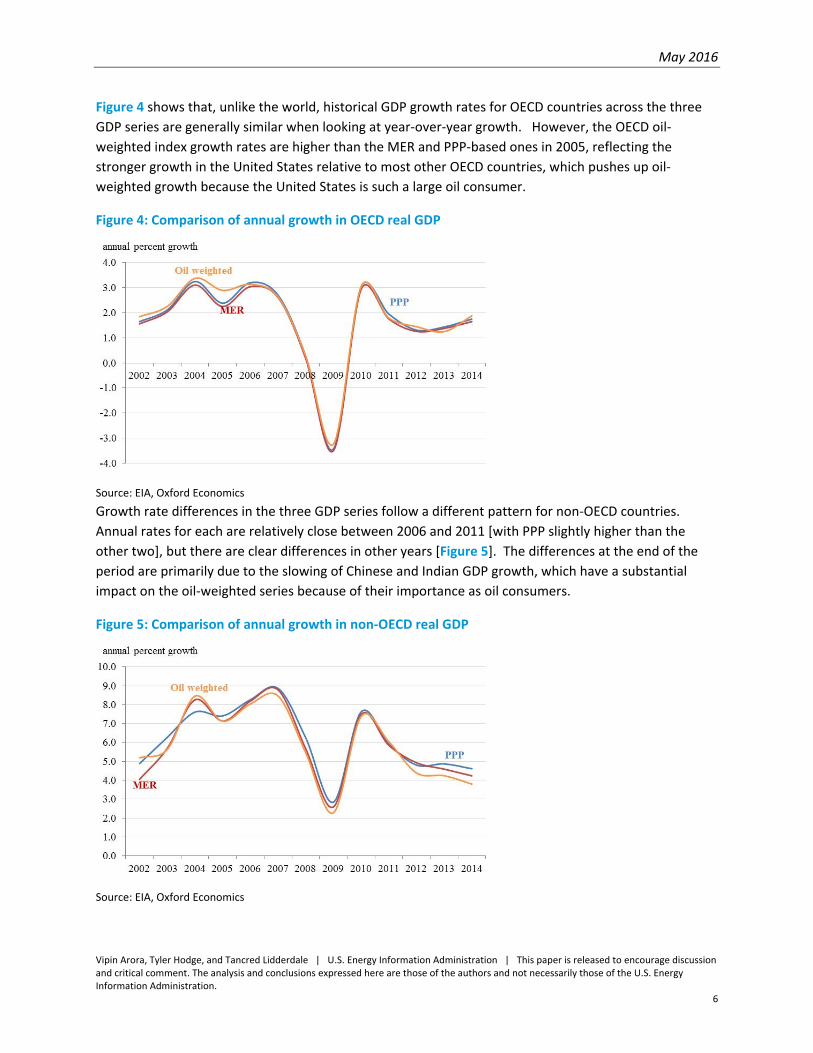
Figure 4 shows that, unlike the world, historical GDP growth rates for OECD countries across the three
GDP series are generally similar when looking at year‐over‐year growth. However, the OECD oil‐
weighted index growth rates are higher than the MER and PPP‐based ones in 2005, reflecting the
stronger growth in the United States relative to most other OECD countries, which pushes up oil‐
weighted growth because the United States is such a large oil consumer.
Figure 4: Comparison of annual growth in OECD real GDP
Source: EIA, Oxford Economics
Growth rate differences in the three GDP series follow a different pattern for non‐OECD countries.
Annual rates for each are relatively close between 2006 and 2011 [with PPP slightly higher than the
other two], but there are clear differences in other years [Figure 5]. The differences at the end of the
period are primarily due to the slowing of Chinese and Indian GDP growth, which have a substantial
impact on the oil‐weighted series because of their importance as oil consumers.
Figure 5: Comparison of annual growth in non‐OECD real GDP
Source: EIA, Oxford Economics
May 2016
Vipin Arora, Tyler Hodge, and Tancred Lidderdale | U.S. Energy Information Administration | This paper is released to encourage discussion and critical comment. The analysis and conclusions expressed here are those of the authors and not necessarily those of the U.S. Energy Information Administration.
7
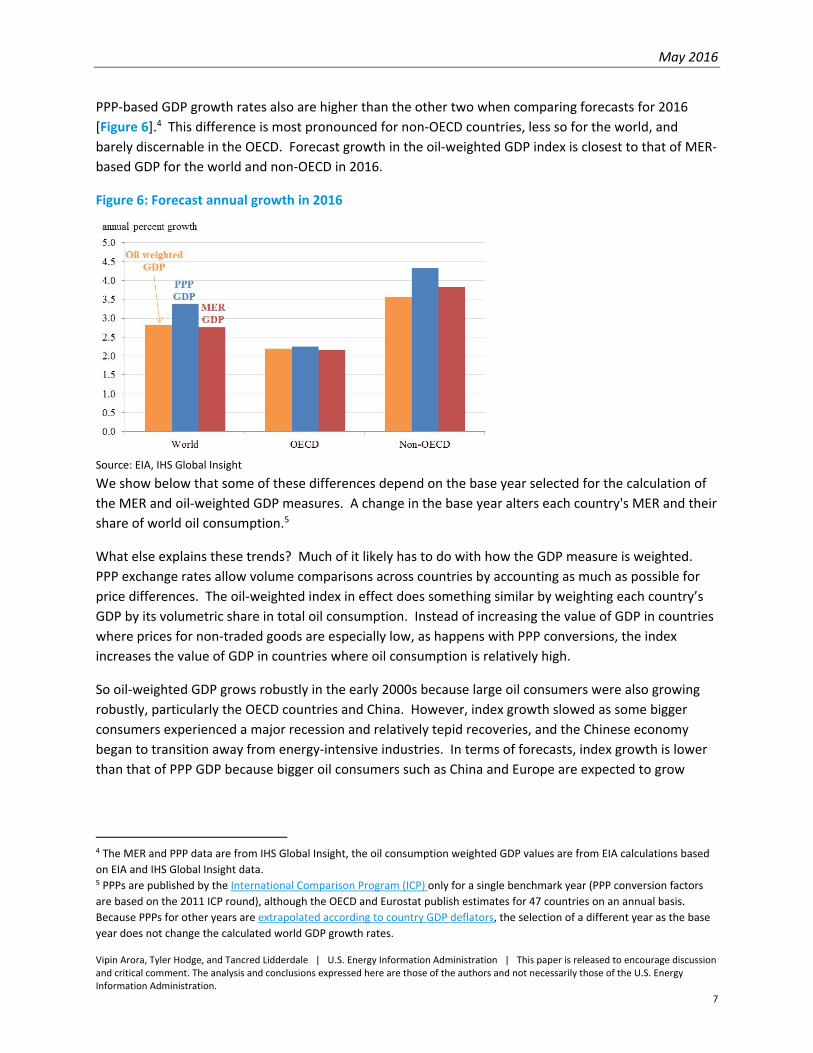
PPP‐based GDP growth rates also are higher than the other two when comparing forecasts for 2016
[Figure 6].4 This difference is most pronounced for non‐OECD countries, less so for the world, and
barely discernable in the OECD. Forecast growth in the oil‐weighted GDP index is closest to that of MER‐
based GDP for the world and non‐OECD in 2016.
Figure 6: Forecast annual growth in 2016
Source: EIA, IHS Global Insight
We show below that some of these differences depend on the base year selected for the calculation of
the MER and oil‐weighted GDP measures. A change in the base year alters each country's MER and their
share of world oil consumption.5
What else explains these trends? Much of it likely has to do with how the GDP measure is weighted.
PPP exchange rates allow volume comparisons across countries by accounting as much as possible for
price differences. The oil‐weighted index in effect does something similar by weighting each country’s
GDP by its volumetric share in total oil consumption. Instead of increasing the value of GDP in countries
where prices for non‐traded goods are especially low, as happens with PPP conversions, the index
increases the value of GDP in countries where oil consumption is relatively high.
So oil‐weighted GDP grows robustly in the early 2000s because large oil consumers were also growing
robustly, particularly the OECD countries and China. However, index growth slowed as some bigger
consumers experienced a major recession and relatively tepid recoveries, and the Chinese economy
began to transition away from energy‐intensive industries. In terms of forecasts, index growth is lower
than that of PPP GDP because bigger oil consumers such as China and Europe are expected to grow
4 The MER and PPP data are from IHS Global Insight, the oil consumption weighted GDP values are from EIA calculations based
on EIA and IHS Global Insight data. 5 PPPs are published by the International Comparison Program (ICP) only for a single benchmark year (PPP conversion factors
are based on the 2011 ICP round), although the OECD and Eurostat publish estimates for 47 countries on an annual basis.
Because PPPs for other years are extrapolated according to country GDP deflators, the selection of a different year as the base
year does not change the calculated world GDP growth rates.
May 2016
Vipin Arora, Tyler Hodge, and Tancred Lidderdale | U.S. Energy Information Administration | This paper is released to encourage discussion and critical comment. The analysis and conclusions expressed here are those of the authors and not necessarily those of the U.S. Energy Information Administration.
8
slower than countries such as India, where GDP is substantially underestimated because of price
differences.
Calculation of Oil Consumption‐Weighted GDP Oil‐weighted GDP is calculated in several steps. First, we gather historical and forecast levels of real GDP
for as many countries as possible from around the world. These data series are measured in local
currencies and may have different base years. To make them consistent, we then create a GDP index for
each country, where the base year/quarter value is set to 100.6 EIA’s base year/quarter is currently
2010Q1.
The next step is to gather historical oil consumption volumes for each of those countries for which we
have GDP estimates.7 Oil consumption data can change significantly from year to year in some
countries, and in order to minimize the effect of this volatility on the weighted index, we also choose a
base year and calculate each country's shares of total consumption for that specific year [currently
2010]. For a world GDP growth rate, each country's oil consumption is calculated as a share of the total
for all of the countries. Similarly, we can calculate an OECD or non‐OECD GDP growth rate using each
OECD or non‐OECD country's consumption as a share of OECD or non‐OECD total consumption,
respectively.
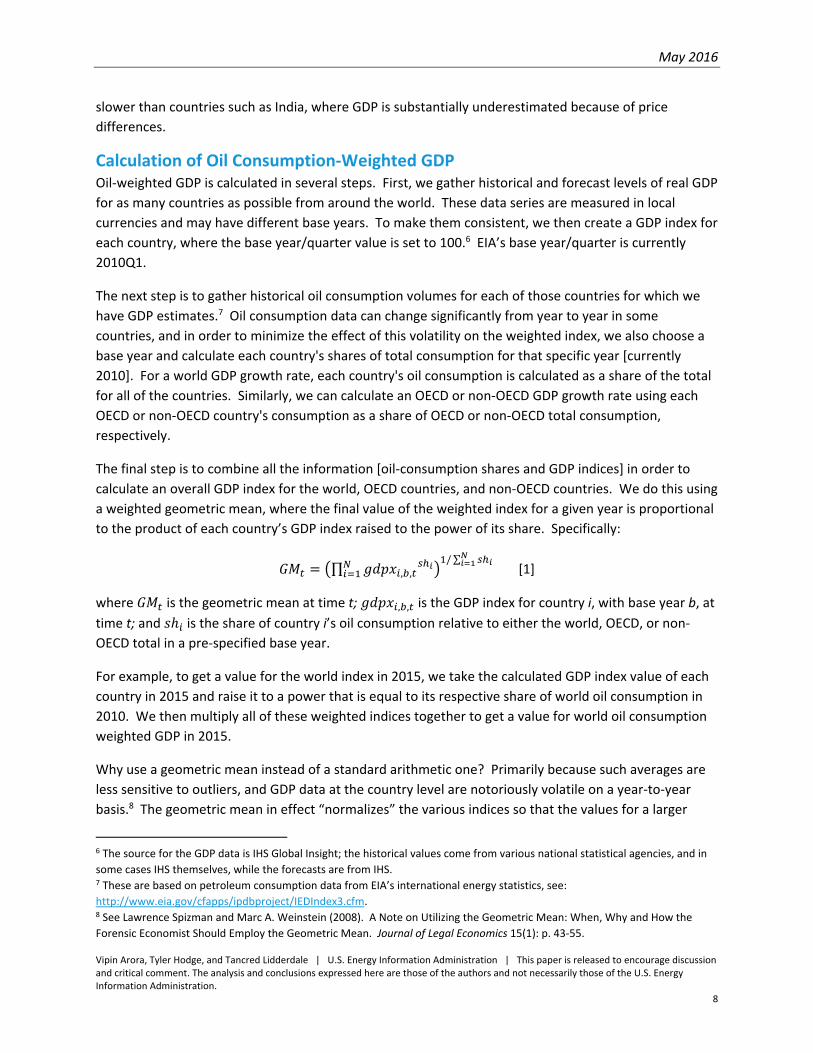
The final step is to combine all the information [oil‐consumption shares and GDP indices] in order to
calculate an overall GDP index for the world, OECD countries, and non‐OECD countries. We do this using
a weighted geometric mean, where the final value of the weighted index for a given year is proportional
to the product of each country’s GDP index raised to the power of its share. Specifically:
∏ , ,/∑
[1]
where is the geometric mean at time t; , , is the GDP index for country i, with base year b, at
time t; and is the share of country i’s oil consumption relative to either the world, OECD, or non‐
OECD total in a pre‐specified base year.
For example, to get a value for the world index in 2015, we take the calculated GDP index value of each
country in 2015 and raise it to a power that is equal to its respective share of world oil consumption in
2010. We then multiply all of these weighted indices together to get a value for world oil consumption
weighted GDP in 2015.
Why use a geometric mean instead of a standard arithmetic one? Primarily because such averages are
less sensitive to outliers, and GDP data at the country level are notoriously volatile on a year‐to‐year
basis.8 The geometric mean in effect “normalizes” the various indices so that the values for a larger
6 The source for the GDP data is IHS Global Insight; the historical values come from various national statistical agencies, and in
some cases IHS themselves, while the forecasts are from IHS. 7 These are based on petroleum consumption data from EIA’s international energy statistics, see:
http://www.eia.gov/cfapps/ipdbproject/IEDIndex3.cfm. 8 See Lawrence Spizman and Marc A. Weinstein (2008). A Note on Utilizing the Geometric Mean: When, Why and How the
Forensic Economist Should Employ the Geometric Mean. Journal of Legal Economics 15(1): p. 43‐55.
May 2016
Vipin Arora, Tyler Hodge, and Tancred Lidderdale | U.S. Energy Information Administration | This paper is released to encourage discussion and critical comment. The analysis and conclusions expressed here are those of the authors and not necessarily those of the U.S. Energy Information Administration.
9
country do not dominate the weighting over smaller ones, or so that outliers have less of an impact on
the final values.
GDP Elasticity of Consumption A significant shortcoming of using an aggregated regional or world oil‐consumption‐weighted GDP
growth rate [as well as the MER‐ and PPP‐weighted rates] as an indicator of world oil consumption
growth is that it does not account for differences in the elasticity of oil consumption with respect to
changes in GDP [and income] across countries. Generally, the percentage change in oil consumption for
a 1% change in real GDP is larger for the emerging economies [e.g., non‐OECD countries] than in the
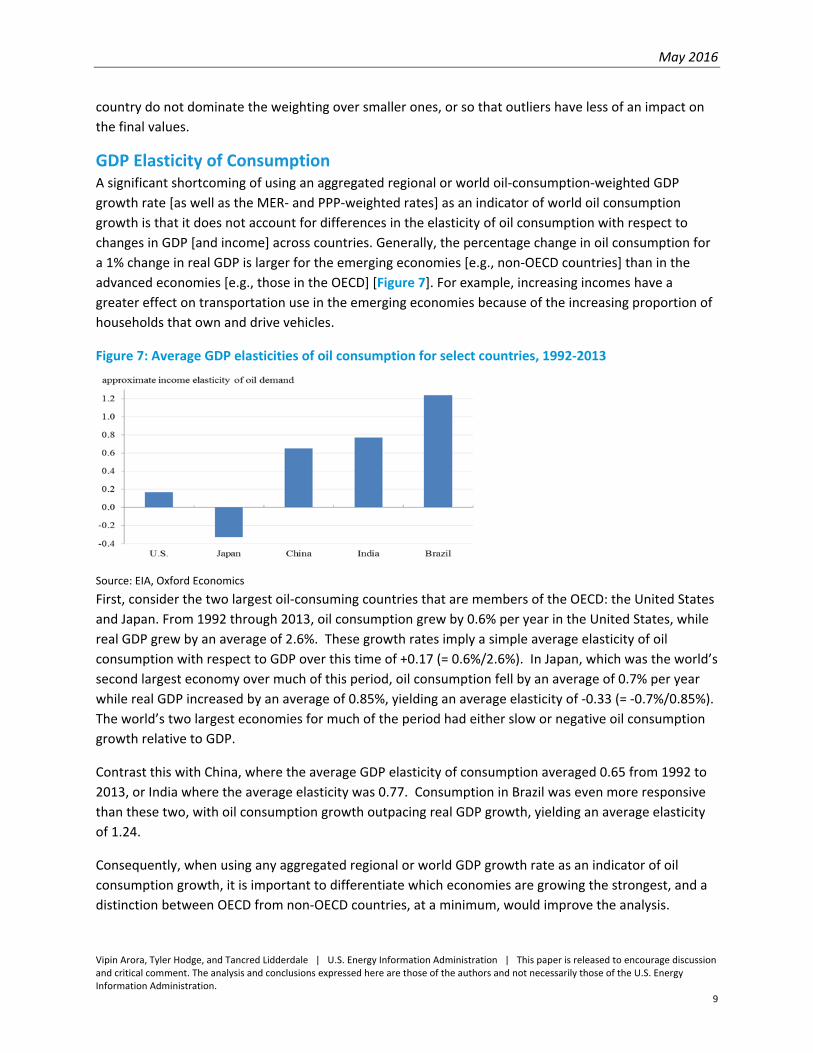
advanced economies [e.g., those in the OECD] [Figure 7]. For example, increasing incomes have a
greater effect on transportation use in the emerging economies because of the increasing proportion of
households that own and drive vehicles.
Figure 7: Average GDP elasticities of oil consumption for select countries, 1992‐2013
Source: EIA, Oxford Economics
First, consider the two largest oil‐consuming countries that are members of the OECD: the United States
and Japan. From 1992 through 2013, oil consumption grew by 0.6% per year in the United States, while
real GDP grew by an average of 2.6%. These growth rates imply a simple average elasticity of oil
consumption with respect to GDP over this time of +0.17 (= 0.6%/2.6%). In Japan, which was the world’s
second largest economy over much of this period, oil consumption fell by an average of 0.7% per year
while real GDP increased by an average of 0.85%, yielding an average elasticity of ‐0.33 (= ‐0.7%/0.85%).
The world’s two largest economies for much of the period had either slow or negative oil consumption
growth relative to GDP.
Contrast this with China, where the average GDP elasticity of consumption averaged 0.65 from 1992 to
2013, or India where the average elasticity was 0.77. Consumption in Brazil was even more responsive
than these two, with oil consumption growth outpacing real GDP growth, yielding an average elasticity
of 1.24.
Consequently, when using any aggregated regional or world GDP growth rate as an indicator of oil
consumption growth, it is important to differentiate which economies are growing the strongest, and a
distinction between OECD from non‐OECD countries, at a minimum, would improve the analysis.
May 2016
Vipin Arora, Tyler Hodge, and Tancred Lidderdale | U.S. Energy Information Administration | This paper is released to encourage discussion and critical comment. The analysis and conclusions expressed here are those of the authors and not necessarily those of the U.S. Energy Information Administration.
10
Oil Intensity Even after separating OECD from non‐OECD countries, forecasting oil consumption based on regional
GDP growth rates is still problematic because GDP elasticities of consumption are different across
countries and are not constant over time. An indicator of different and changing elasticities is the
change in oil intensity (oil consumption as a share of GDP), particularly when examined in context over
the business cycle.
Figure 8, Figure 10, and Figure 12 show the annual change in oil intensity over the 2002‐2013 period for
the world, OECD, and non‐OECD.9 Figure 9, Figure 11, and Figure 13 show average annual growth rates
of real GDP and oil consumption over different ranges of time for the same three regions.
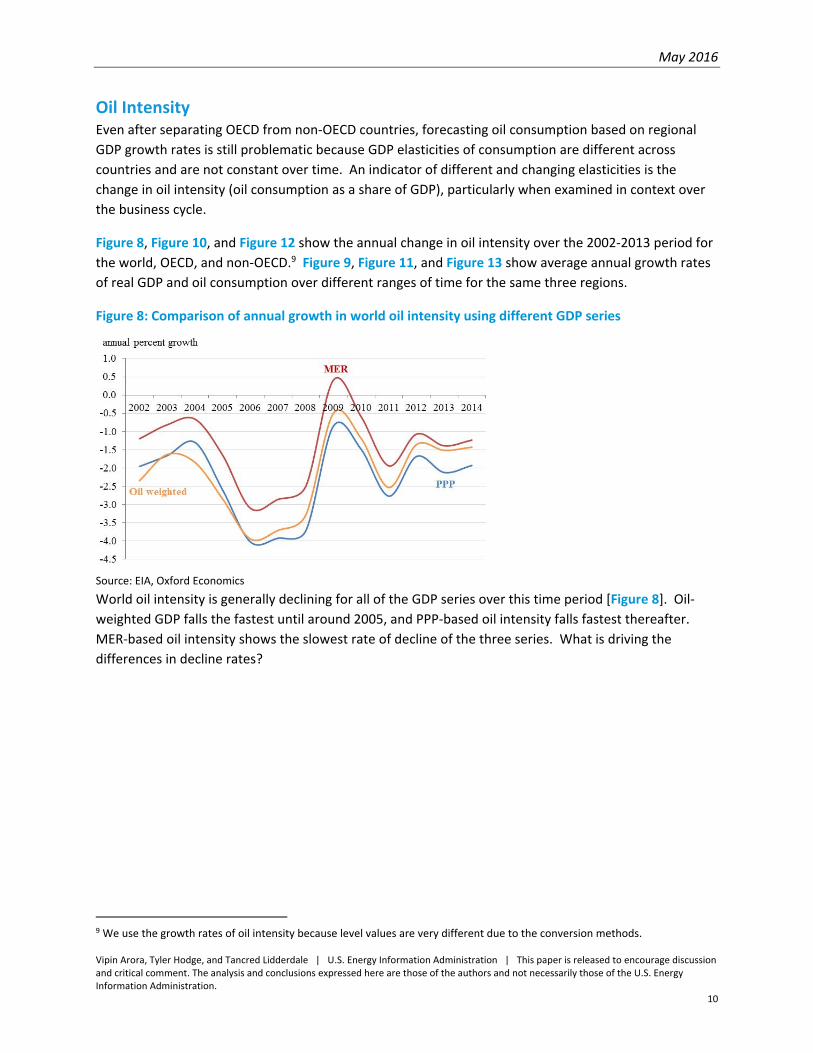
Figure 8: Comparison of annual growth in world oil intensity using different GDP series
Source: EIA, Oxford Economics
World oil intensity is generally declining for all of the GDP series over this time period [Figure 8]. Oil‐
weighted GDP falls the fastest until around 2005, and PPP‐based oil intensity falls fastest thereafter.
MER‐based oil intensity shows the slowest rate of decline of the three series. What is driving the
differences in decline rates?
9 We use the growth rates of oil intensity because level values are very different due to the conversion methods.
May 2016
Vipin Arora, Tyler Hodge, and Tancred Lidderdale | U.S. Energy Information Administration | This paper is released to encourage discussion and critical comment. The analysis and conclusions expressed here are those of the authors and not necessarily those of the U.S. Energy Information Administration.
11
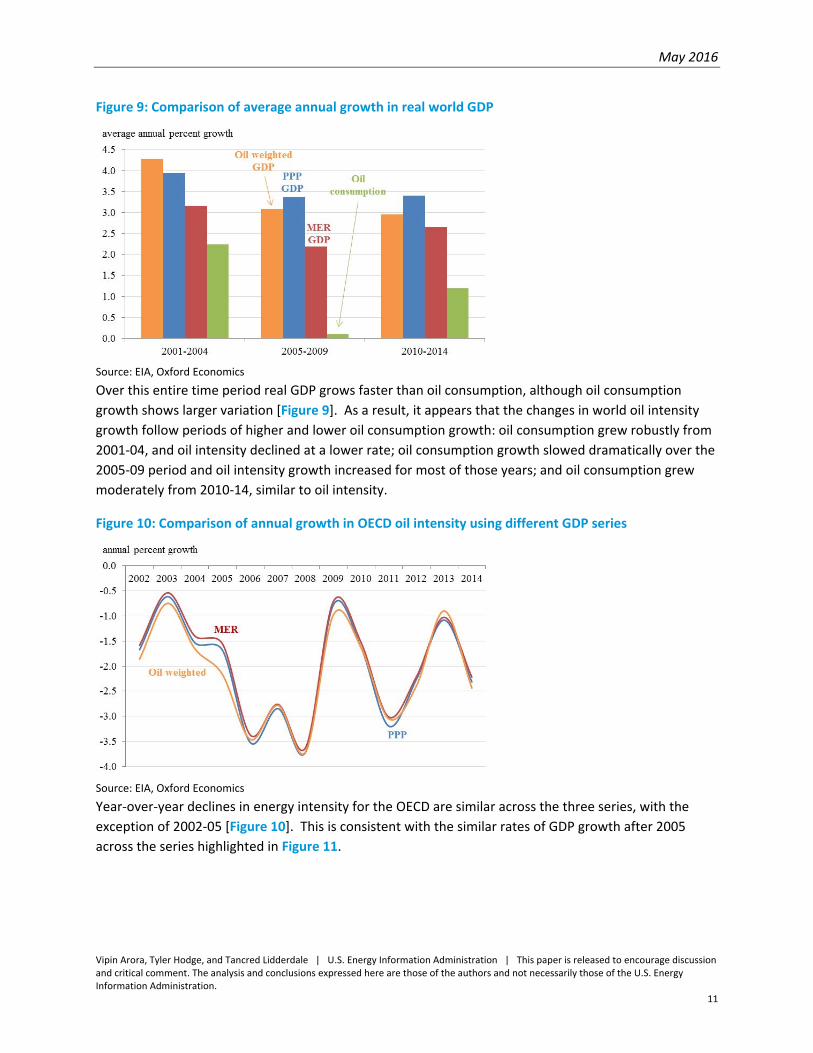
Figure 9: Comparison of average annual growth in real world GDP
Source: EIA, Oxford Economics
Over this entire time period real GDP grows faster than oil consumption, although oil consumption
growth shows larger variation [Figure 9]. As a result, it appears that the changes in world oil intensity
growth follow periods of higher and lower oil consumption growth: oil consumption grew robustly from
2001‐04, and oil intensity declined at a lower rate; oil consumption growth slowed dramatically over the
2005‐09 period and oil intensity growth increased for most of those years; and oil consumption grew
moderately from 2010‐14, similar to oil intensity.
Figure 10: Comparison of annual growth in OECD oil intensity using different GDP series
Source: EIA, Oxford Economics
Year‐over‐year declines in energy intensity for the OECD are similar across the three series, with the
exception of 2002‐05 [Figure 10]. This is consistent with the similar rates of GDP growth after 2005
across the series highlighted in Figure 11.
May 2016
Vipin Arora, Tyler Hodge, and Tancred Lidderdale | U.S. Energy Information Administration | This paper is released to encourage discussion and critical comment. The analysis and conclusions expressed here are those of the authors and not necessarily those of the U.S. Energy Information Administration.
12
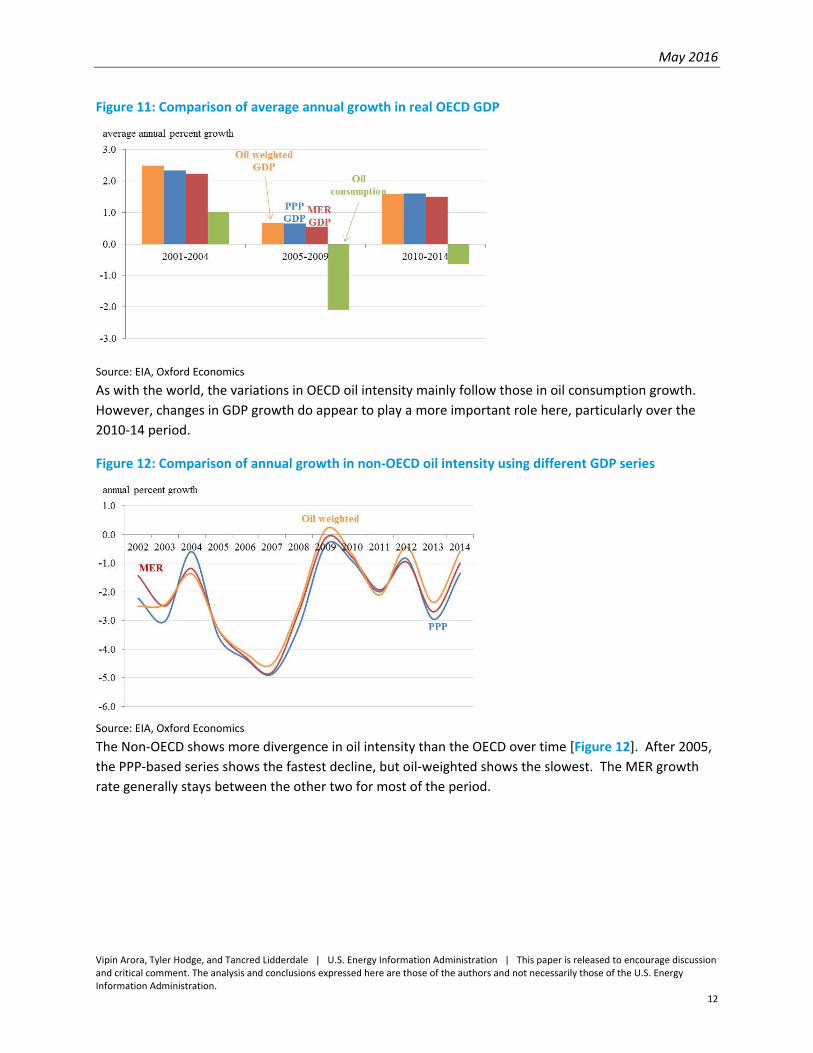
Figure 11: Comparison of average annual growth in real OECD GDP
Source: EIA, Oxford Economics
As with the world, the variations in OECD oil intensity mainly follow those in oil consumption growth.
However, changes in GDP growth do appear to play a more important role here, particularly over the
2010‐14 period.
Figure 12: Comparison of annual growth in non‐OECD oil intensity using different GDP series
Source: EIA, Oxford Economics
The Non‐OECD shows more divergence in oil intensity than the OECD over time [Figure 12]. After 2005,
the PPP‐based series shows the fastest decline, but oil‐weighted shows the slowest. The MER growth
rate generally stays between the other two for most of the period.
May 2016
Vipin Arora, Tyler Hodge, and Tancred Lidderdale | U.S. Energy Information Administration | This paper is released to encourage discussion and critical comment. The analysis and conclusions expressed here are those of the authors and not necessarily those of the U.S. Energy Information Administration.
13
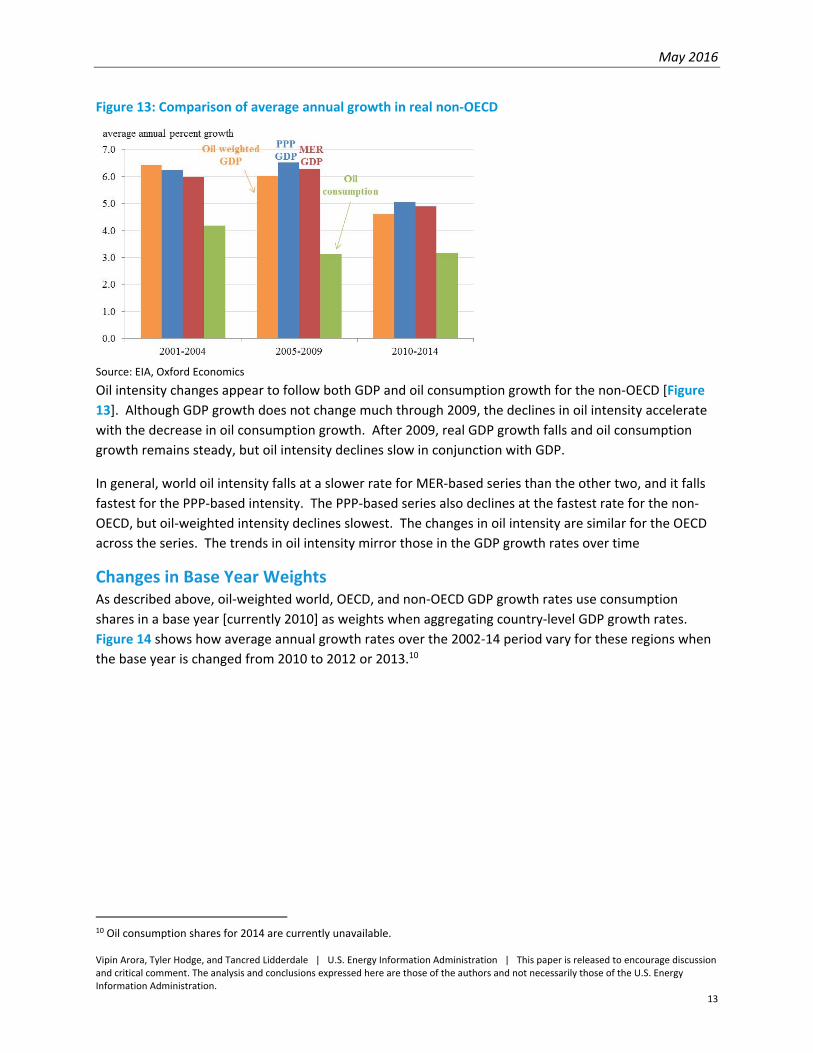
Figure 13: Comparison of average annual growth in real non‐OECD
Source: EIA, Oxford Economics
Oil intensity changes appear to follow both GDP and oil consumption growth for the non‐OECD [Figure
13]. Although GDP growth does not change much through 2009, the declines in oil intensity accelerate
with the decrease in oil consumption growth. After 2009, real GDP growth falls and oil consumption
growth remains steady, but oil intensity declines slow in conjunction with GDP.
In general, world oil intensity falls at a slower rate for MER‐based series than the other two, and it falls
fastest for the PPP‐based intensity. The PPP‐based series also declines at the fastest rate for the non‐
OECD, but oil‐weighted intensity declines slowest. The changes in oil intensity are similar for the OECD
across the series. The trends in oil intensity mirror those in the GDP growth rates over time
Changes in Base Year Weights As described above, oil‐weighted world, OECD, and non‐OECD GDP growth rates use consumption
shares in a base year [currently 2010] as weights when aggregating country‐level GDP growth rates.
Figure 14 shows how average annual growth rates over the 2002‐14 period vary for these regions when
the base year is changed from 2010 to 2012 or 2013.10
10 Oil consumption shares for 2014 are currently unavailable.
May 2016
Vipin Arora, Tyler Hodge, and Tancred Lidderdale | U.S. Energy Information Administration | This paper is released to encourage discussion and critical comment. The analysis and conclusions expressed here are those of the authors and not necessarily those of the U.S. Energy Information Administration.
14
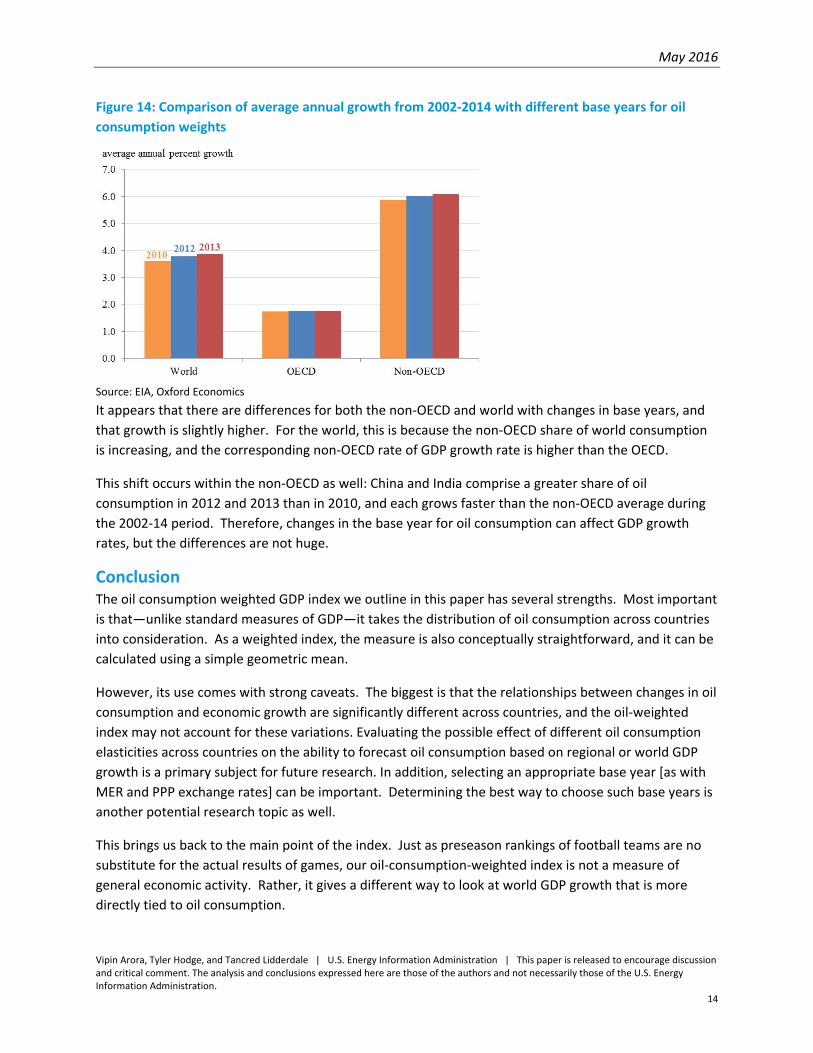
Figure 14: Comparison of average annual growth from 2002‐2014 with different base years for oil
consumption weights
Source: EIA, Oxford Economics
It appears that there are differences for both the non‐OECD and world with changes in base years, and
that growth is slightly higher. For the world, this is because the non‐OECD share of world consumption
is increasing, and the corresponding non‐OECD rate of GDP growth rate is higher than the OECD.
This shift occurs within the non‐OECD as well: China and India comprise a greater share of oil
consumption in 2012 and 2013 than in 2010, and each grows faster than the non‐OECD average during
the 2002‐14 period. Therefore, changes in the base year for oil consumption can affect GDP growth
rates, but the differences are not huge.
Conclusion The oil consumption weighted GDP index we outline in this paper has several strengths. Most important
is that—unlike standard measures of GDP—it takes the distribution of oil consumption across countries
into consideration. As a weighted index, the measure is also conceptually straightforward, and it can be
calculated using a simple geometric mean.
However, its use comes with strong caveats. The biggest is that the relationships between changes in oil
consumption and economic growth are significantly different across countries, and the oil‐weighted
index may not account for these variations. Evaluating the possible effect of different oil consumption
elasticities across countries on the ability to forecast oil consumption based on regional or world GDP
growth is a primary subject for future research. In addition, selecting an appropriate base year [as with
MER and PPP exchange rates] can be important. Determining the best way to choose such base years is
another potential research topic as well.
This brings us back to the main point of the index. Just as preseason rankings of football teams are no
substitute for the actual results of games, our oil‐consumption‐weighted index is not a measure of
general economic activity. Rather, it gives a different way to look at world GDP growth that is more
directly tied to oil consumption.
May 2016
Vipin Arora, Tyler Hodge, and Tancred Lidderdale | U.S. Energy Information Administration | This paper is released to encourage discussion and critical comment. The analysis and conclusions expressed here are those of the authors and not necessarily those of the U.S. Energy Information Administration.
15
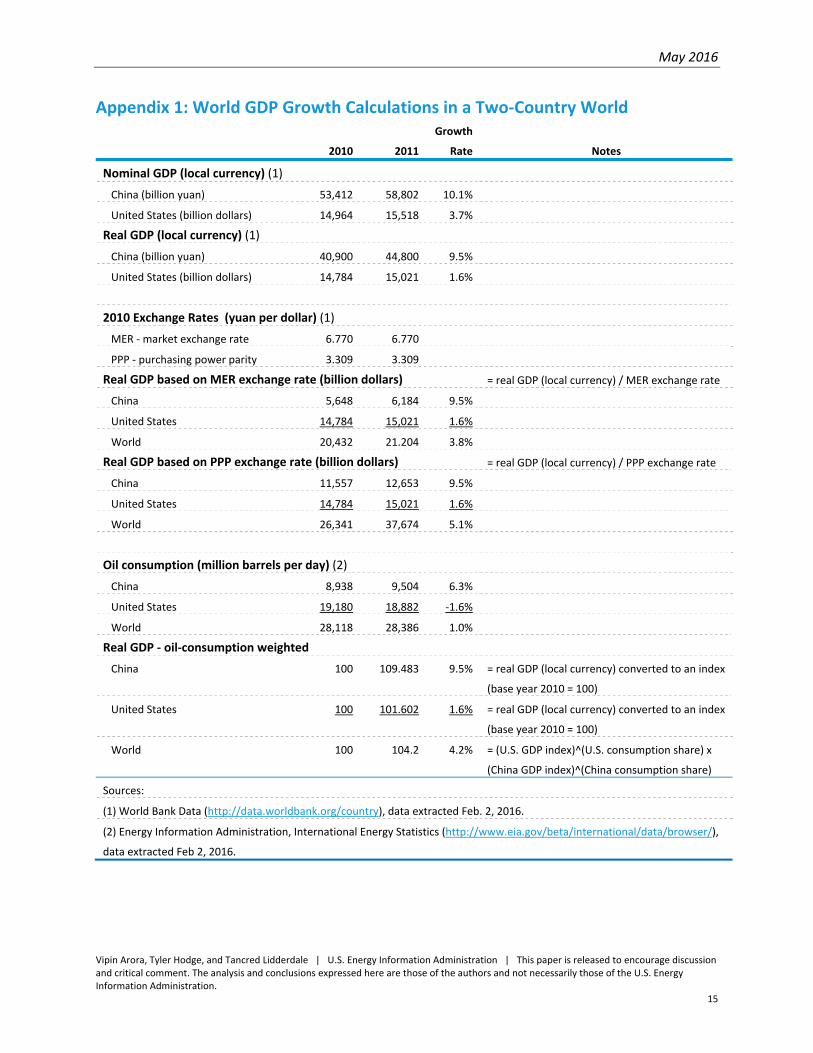
Appendix 1: World GDP Growth Calculations in a Two‐Country World
2010 2011
Growth
Rate Notes
Nominal GDP (local currency) (1)
China (billion yuan) 53,412 58,802 10.1%
United States (billion dollars) 14,964 15,518 3.7%
Real GDP (local currency) (1)
China (billion yuan) 40,900 44,800 9.5%
United States (billion dollars) 14,784 15,021 1.6%
2010 Exchange Rates (yuan per dollar) (1)
MER ‐ market exchange rate 6.770 6.770
PPP ‐ purchasing power parity 3.309 3.309
Real GDP based on MER exchange rate (billion dollars) = real GDP (local currency) / MER exchange rate
China 5,648 6,184 9.5%
United States 14,784 15,021 1.6%
World 20,432 21.204 3.8%
Real GDP based on PPP exchange rate (billion dollars) = real GDP (local currency) / PPP exchange rate
China 11,557 12,653 9.5%
United States 14,784 15,021 1.6%
World 26,341 37,674 5.1%
Oil consumption (million barrels per day) (2)
China 8,938 9,504 6.3%
United States 19,180 18,882 ‐1.6%
World 28,118 28,386 1.0%
Real GDP ‐ oil‐consumption weighted
China 100 109.483 9.5% = real GDP (local currency) converted to an index
(base year 2010 = 100)
United States 100 101.602 1.6% = real GDP (local currency) converted to an index
(base year 2010 = 100)
World 100 104.2 4.2% = (U.S. GDP index)^(U.S. consumption share) x
(China GDP index)^(China consumption share)
Sources:
(1) World Bank Data (http://data.worldbank.org/country), data extracted Feb. 2, 2016.
(2) Energy Information Administration, International Energy Statistics (http://www.eia.gov/beta/international/data/browser/),
data extracted Feb 2, 2016.