Embed Size (px)
Citation preview
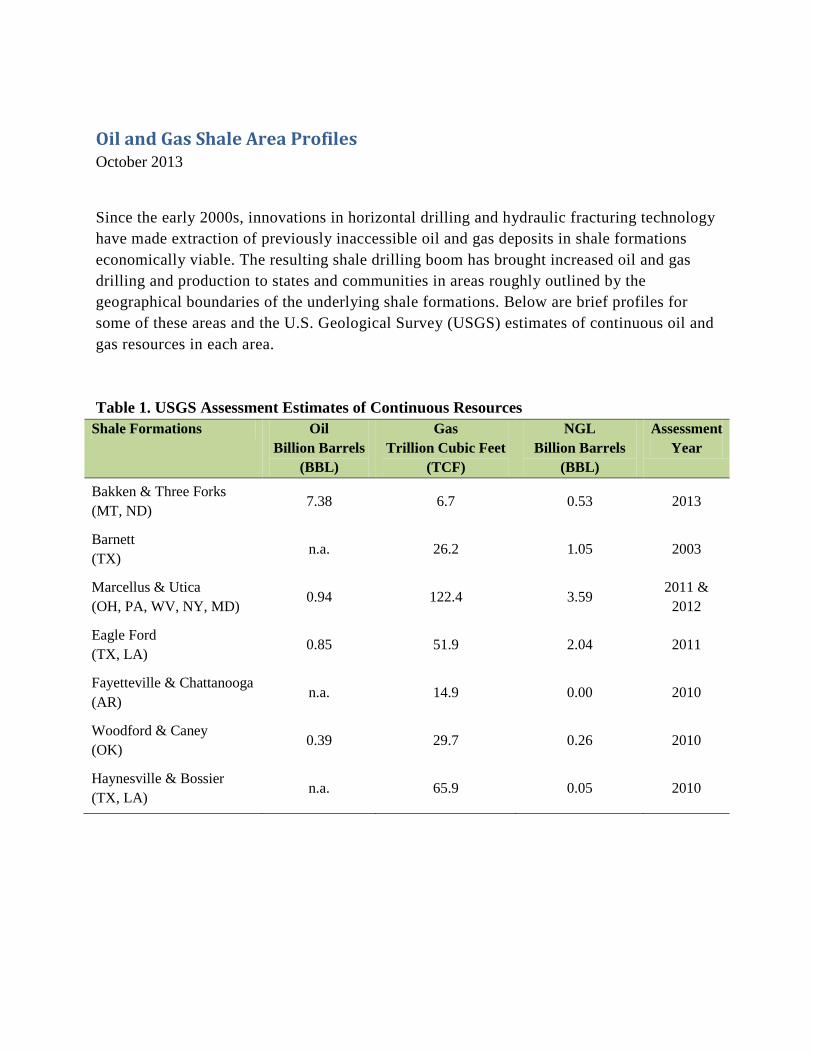
Oil and Gas Shale Area Profiles October 2013
Since the early 2000s, innovations in horizontal drilling and hydraulic fracturing technology have made extraction of previously inaccessible oil and gas deposits in shale formations economically viable. The resulting shale drilling boom has brought increased oil and gas drilling and production to states and communities in areas roughly outlined by the geographical boundaries of the underlying shale formations. Below are brief profiles for some of these areas and the U.S. Geological Survey (USGS) estimates of continuous oil and gas resources in each area. Table 1. USGS Assessment Estimates of Continuous Resources
Shale Formations Oil Billion Barrels
(BBL)
Gas Trillion Cubic Feet
(TCF)
NGL Billion Barrels
(BBL)
Assessment Year
Bakken & Three Forks (MT, ND) 7.38 6.7 0.53 2013
Barnett (TX)
n.a. 26.2 1.05 2003
Marcellus & Utica (OH, PA, WV, NY, MD) 0.94 122.4 3.59
2011 & 2012
Eagle Ford (TX, LA)
0.85 51.9 2.04 2011
Fayetteville & Chattanooga (AR)
n.a. 14.9 0.00 2010
Woodford & Caney (OK) 0.39 29.7 0.26 2010
Haynesville & Bossier (TX, LA)
n.a. 65.9 0.05 2010
1
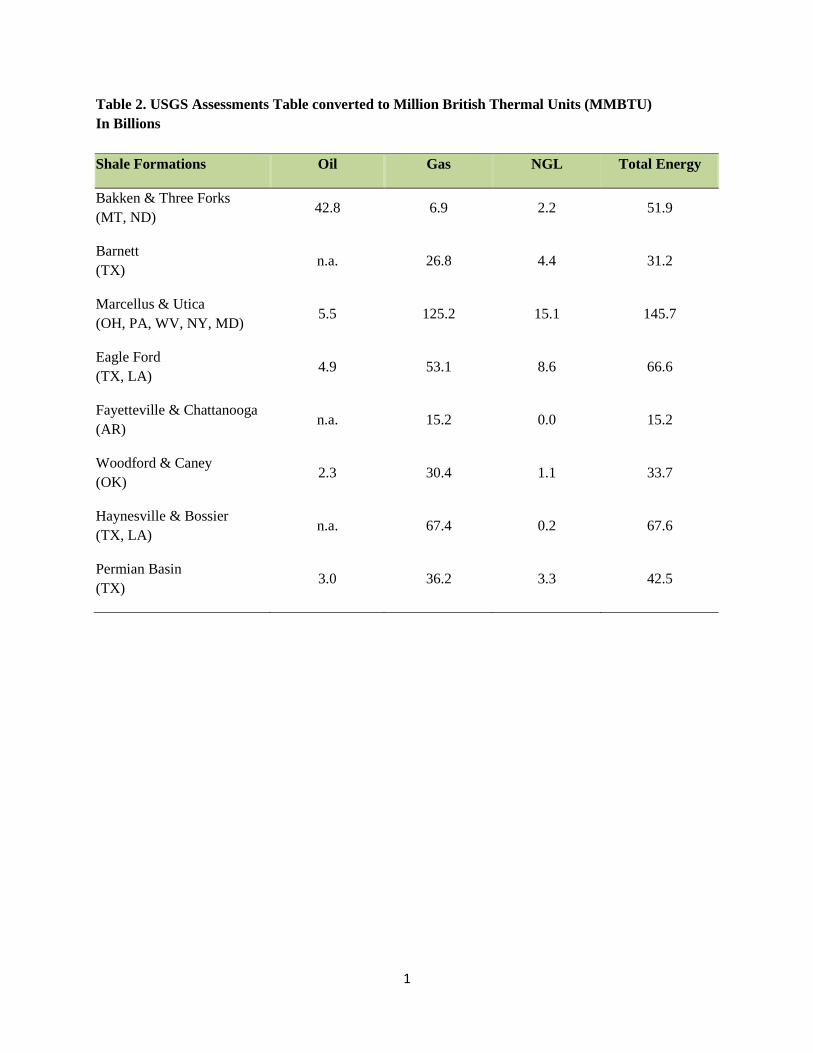
Table 2. USGS Assessments Table converted to Million British Thermal Units (MMBTU) In Billions Shale Formations Oil Gas NGL Total Energy
Bakken & Three Forks (MT, ND) 42.8 6.9 2.2 51.9
Barnett (TX) n.a. 26.8 4.4 31.2
Marcellus & Utica (OH, PA, WV, NY, MD) 5.5 125.2 15.1 145.7
Eagle Ford (TX, LA) 4.9 53.1 8.6 66.6
Fayetteville & Chattanooga (AR) n.a. 15.2 0.0 15.2
Woodford & Caney (OK) 2.3 30.4 1.1 33.7
Haynesville & Bossier (TX, LA) n.a. 67.4 0.2 67.6
Permian Basin (TX) 3.0 36.2 3.3 42.5
2
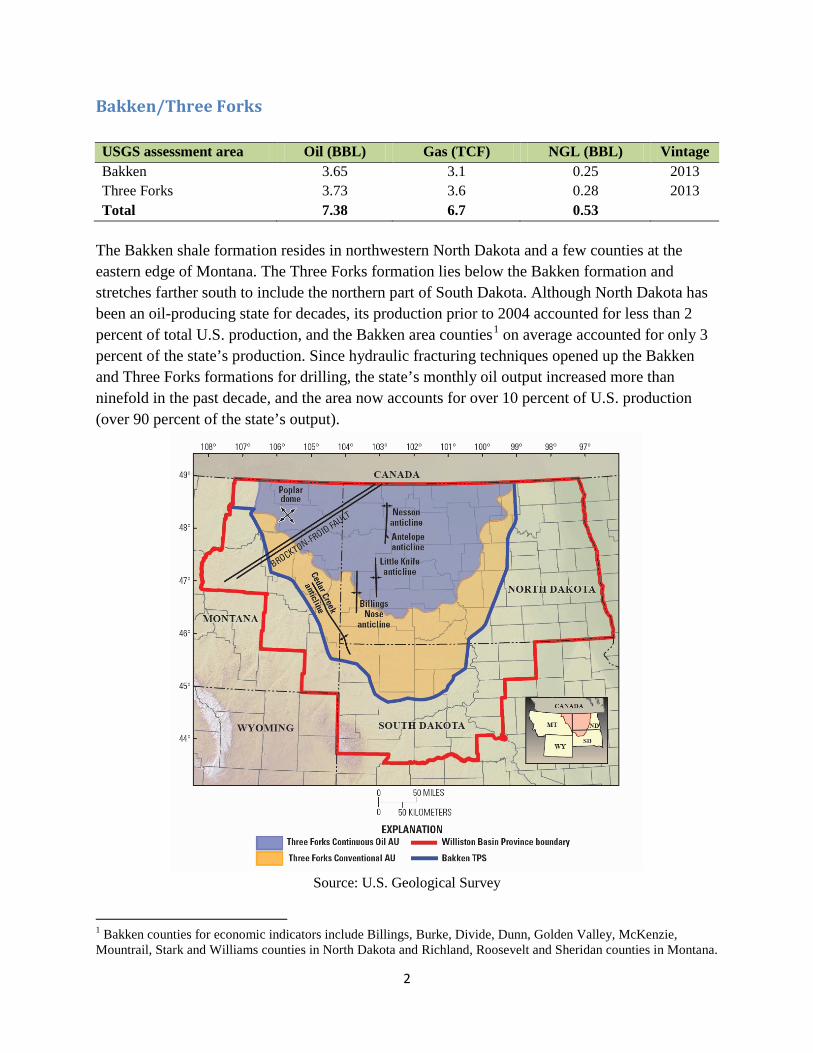
Bakken/Three Forks USGS assessment area Oil (BBL) Gas (TCF) NGL (BBL) Vintage Bakken 3.65 3.1 0.25 2013 Three Forks 3.73 3.6 0.28 2013 Total 7.38 6.7 0.53
The Bakken shale formation resides in northwestern North Dakota and a few counties at the eastern edge of Montana. The Three Forks formation lies below the Bakken formation and stretches farther south to include the northern part of South Dakota. Although North Dakota has been an oil-producing state for decades, its production prior to 2004 accounted for less than 2 percent of total U.S. production, and the Bakken area counties1 on average accounted for only 3 percent of the state’s production. Since hydraulic fracturing techniques opened up the Bakken and Three Forks formations for drilling, the state’s monthly oil output increased more than ninefold in the past decade, and the area now accounts for over 10 percent of U.S. production (over 90 percent of the state’s output).
Source: U.S. Geological Survey
1 Bakken counties for economic indicators include Billings, Burke, Divide, Dunn, Golden Valley, McKenzie, Mountrail, Stark and Williams counties in North Dakota and Richland, Roosevelt and Sheridan counties in Montana.
3
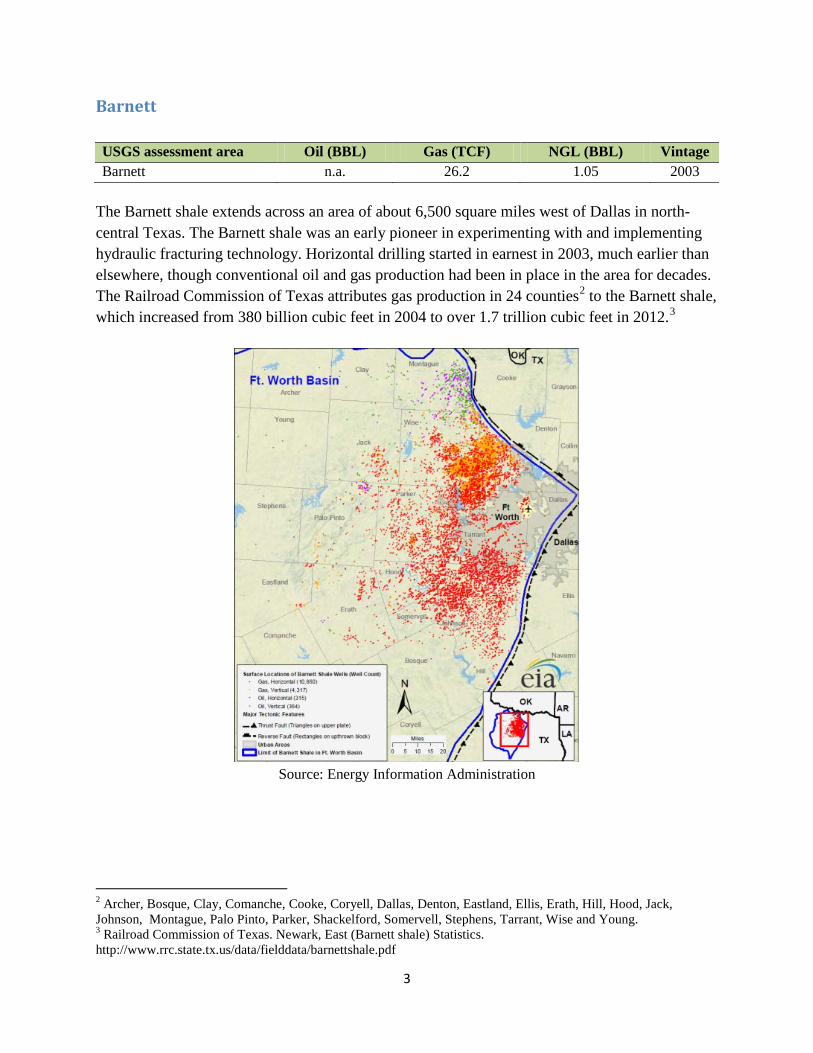
Barnett USGS assessment area Oil (BBL) Gas (TCF) NGL (BBL) Vintage Barnett n.a. 26.2 1.05 2003
The Barnett shale extends across an area of about 6,500 square miles west of Dallas in north-central Texas. The Barnett shale was an early pioneer in experimenting with and implementing hydraulic fracturing technology. Horizontal drilling started in earnest in 2003, much earlier than elsewhere, though conventional oil and gas production had been in place in the area for decades. The Railroad Commission of Texas attributes gas production in 24 counties2 to the Barnett shale, which increased from 380 billion cubic feet in 2004 to over 1.7 trillion cubic feet in 2012.3
Source: Energy Information Administration
2 Archer, Bosque, Clay, Comanche, Cooke, Coryell, Dallas, Denton, Eastland, Ellis, Erath, Hill, Hood, Jack, Johnson, Montague, Palo Pinto, Parker, Shackelford, Somervell, Stephens, Tarrant, Wise and Young. 3 Railroad Commission of Texas. Newark, East (Barnett shale) Statistics. http://www.rrc.state.tx.us/data/fielddata/barnettshale.pdf
4
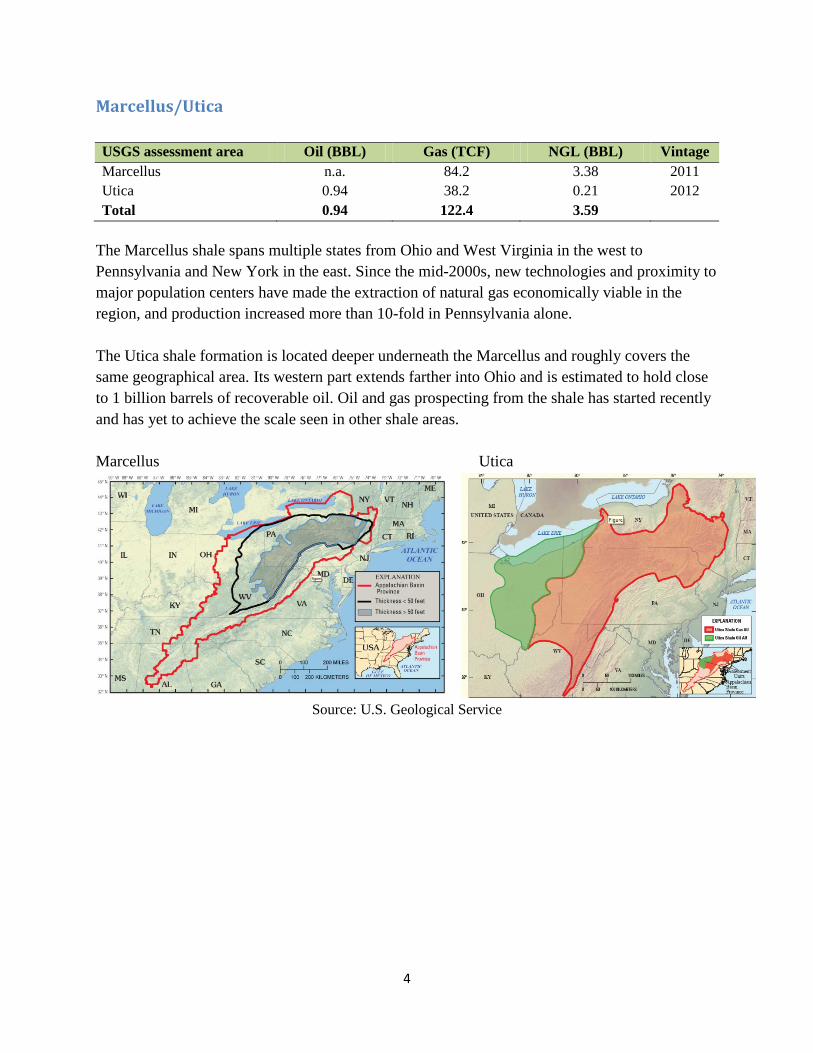
Marcellus/Utica USGS assessment area Oil (BBL) Gas (TCF) NGL (BBL) Vintage Marcellus n.a. 84.2 3.38 2011 Utica 0.94 38.2 0.21 2012 Total 0.94 122.4 3.59
The Marcellus shale spans multiple states from Ohio and West Virginia in the west to Pennsylvania and New York in the east. Since the mid-2000s, new technologies and proximity to major population centers have made the extraction of natural gas economically viable in the region, and production increased more than 10-fold in Pennsylvania alone. The Utica shale formation is located deeper underneath the Marcellus and roughly covers the same geographical area. Its western part extends farther into Ohio and is estimated to hold close to 1 billion barrels of recoverable oil. Oil and gas prospecting from the shale has started recently and has yet to achieve the scale seen in other shale areas. Marcellus Utica
Source: U.S. Geological Service
5
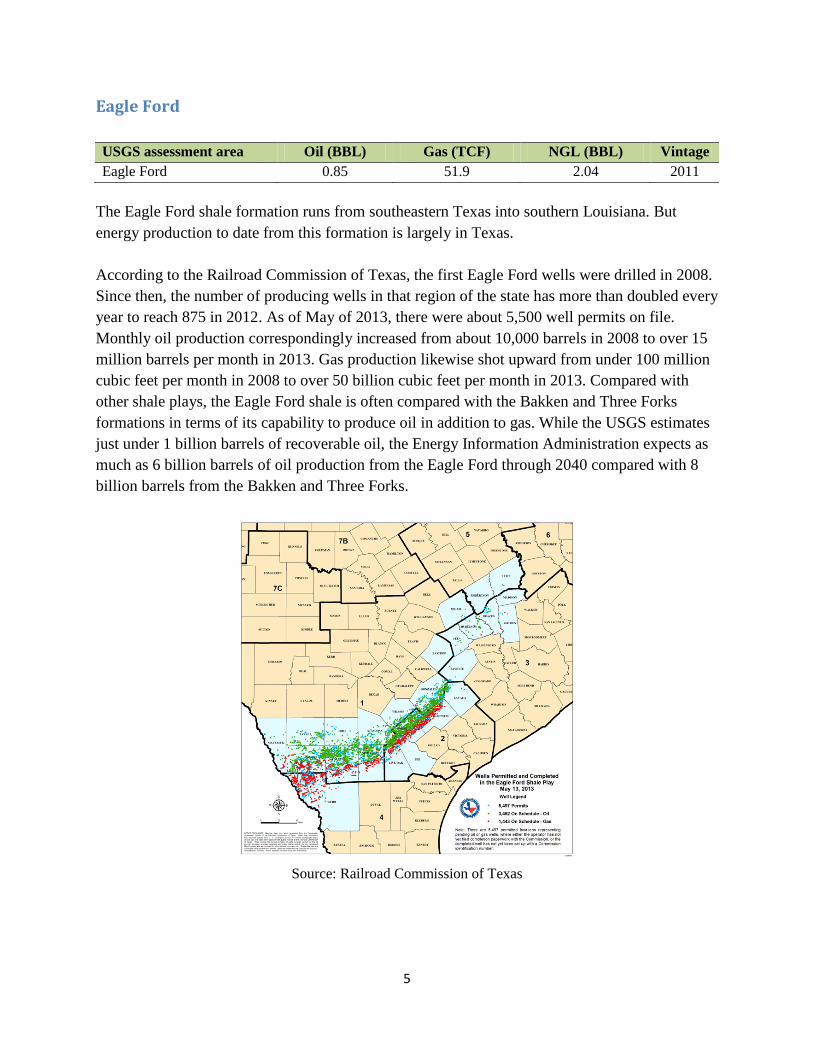
Eagle Ford USGS assessment area Oil (BBL) Gas (TCF) NGL (BBL) Vintage Eagle Ford 0.85 51.9 2.04 2011
The Eagle Ford shale formation runs from southeastern Texas into southern Louisiana. But energy production to date from this formation is largely in Texas. According to the Railroad Commission of Texas, the first Eagle Ford wells were drilled in 2008. Since then, the number of producing wells in that region of the state has more than doubled every year to reach 875 in 2012. As of May of 2013, there were about 5,500 well permits on file. Monthly oil production correspondingly increased from about 10,000 barrels in 2008 to over 15 million barrels per month in 2013. Gas production likewise shot upward from under 100 million cubic feet per month in 2008 to over 50 billion cubic feet per month in 2013. Compared with other shale plays, the Eagle Ford shale is often compared with the Bakken and Three Forks formations in terms of its capability to produce oil in addition to gas. While the USGS estimates just under 1 billion barrels of recoverable oil, the Energy Information Administration expects as much as 6 billion barrels of oil production from the Eagle Ford through 2040 compared with 8 billion barrels from the Bakken and Three Forks.
Source: Railroad Commission of Texas
6
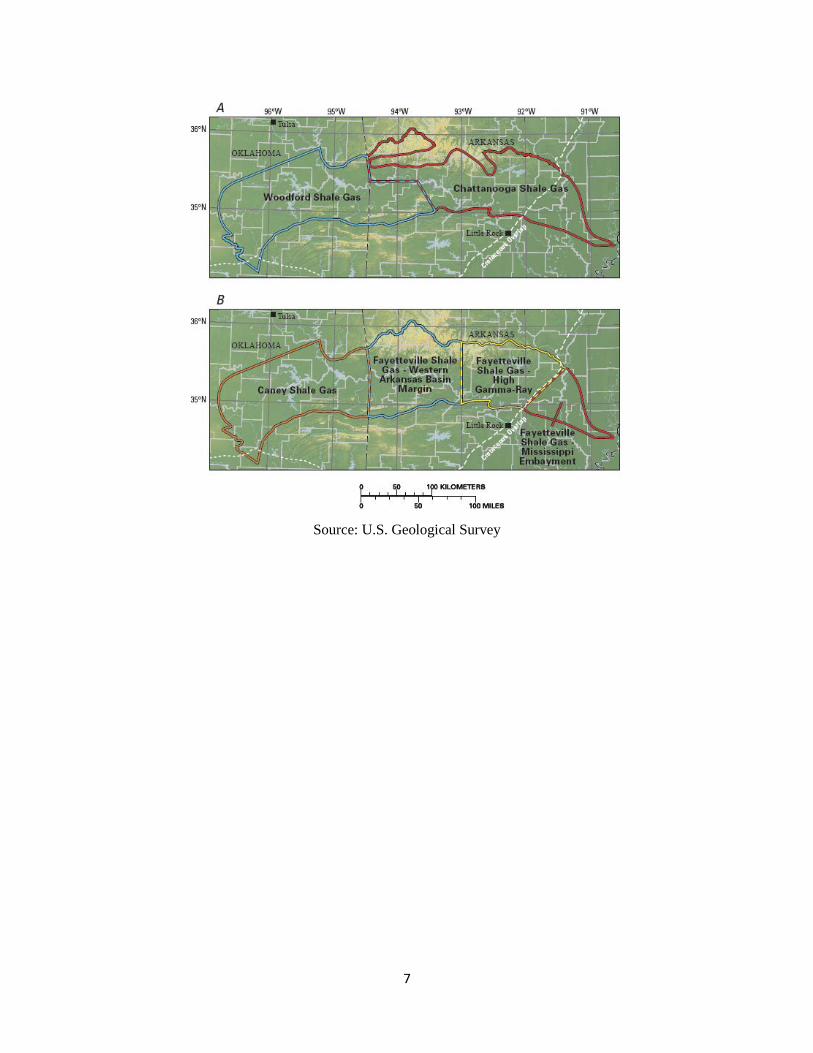
Fayetteville/Chattanooga/Woodford/Caney USGS assessment area Oil (BBL) Gas (TCF) NGL (BBL) Vintage Fayetteville n.a. 13.2 0 2010 Chattanooga n.a. 1.6 0 2010 Woodford 0.39 28.6 0.25 2010 Caney n.a. 1.1 0.01 2010 Total 0.39 44.6 0.26
The Fayetteville shale is located in the eastern part of the Arkoma Basin that straddles Oklahoma and Arkansas. The Arkansas Oil and Gas Commission attributes gas sales from 12 counties4 to the Fayetteville shale, of which Cleburne, Conway, Faulkner, Van Buren and White are the largest producers. According to its statistics, natural gas sales from the Fayetteville shale increased from about 100 million cubic feet in 2004 to over 1 trillion cubic feet in 2012, more than tripling in volume every year.5 Roughly the same area as Fayetteville, deeper underneath is the Chattanooga shale, estimated to hold over a trillion cubic feet of gas. It is laterally equivalent to the more famous Woodford shale on the Oklahoma side of the Arkoma Basin but historically has not been a focus of exploration activity. Drilling has been under way in the Woodford shale formation, located in central to southeastern Oklahoma, for about 10 years; only the Barnett shale in Texas has produced natural gas longer. The shale formation spans several basins, including the western half of the Arkoma Basin and the southeastern part of the Anadarko Basin. The Caney shale formation sits on top of Woodford on the Oklahoma side of the Arkoma Basin and is laterally equivalent to the Fayetteville shale.
4 Cleburne, Conway, Faulkner, Franklin, Independence, Jackson, Johnson, Pope, Stone, Van Buren, White and Woodruff 5 State of Arkansas Oil and Gas Commission. Fayetteville Shale Gas Sales Information. http://www.aogc2.state.ar.us/Fayprodinfo.htm
7
Source: U.S. Geological Survey
8
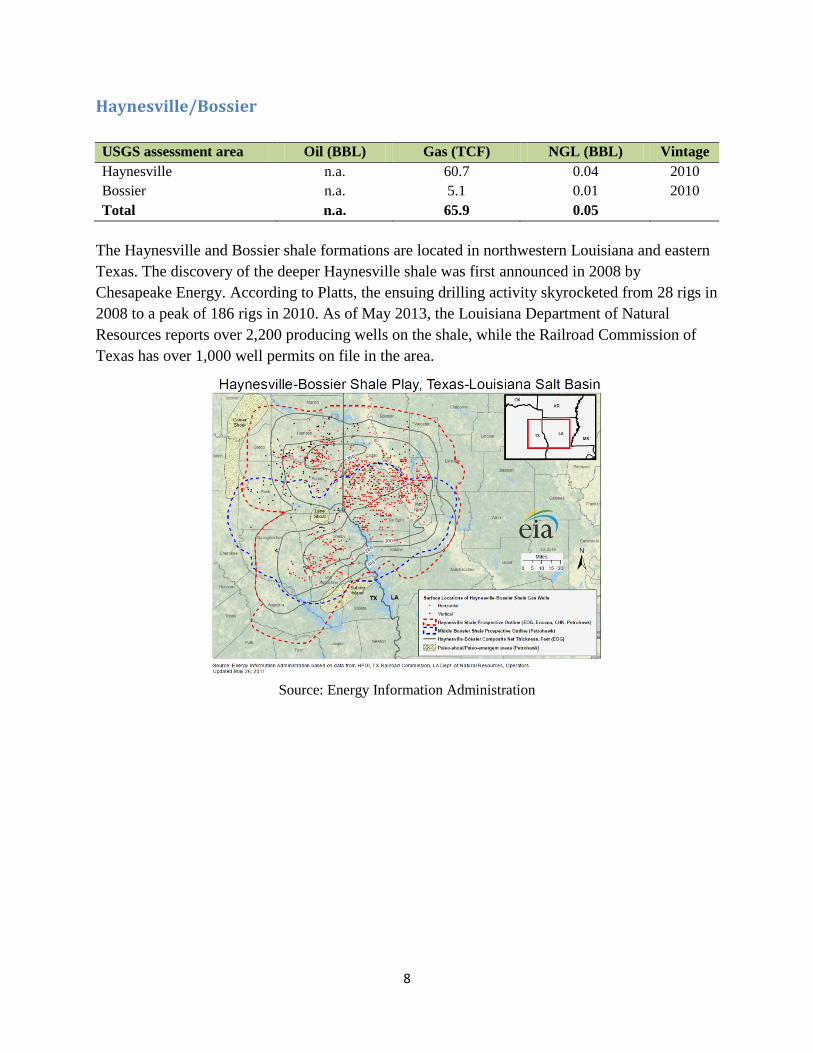
Haynesville/Bossier USGS assessment area Oil (BBL) Gas (TCF) NGL (BBL) Vintage Haynesville n.a. 60.7 0.04 2010 Bossier n.a. 5.1 0.01 2010 Total n.a. 65.9 0.05
The Haynesville and Bossier shale formations are located in northwestern Louisiana and eastern Texas. The discovery of the deeper Haynesville shale was first announced in 2008 by Chesapeake Energy. According to Platts, the ensuing drilling activity skyrocketed from 28 rigs in 2008 to a peak of 186 rigs in 2010. As of May 2013, the Louisiana Department of Natural Resources reports over 2,200 producing wells on the shale, while the Railroad Commission of Texas has over 1,000 well permits on file in the area.
Source: Energy Information Administration
9
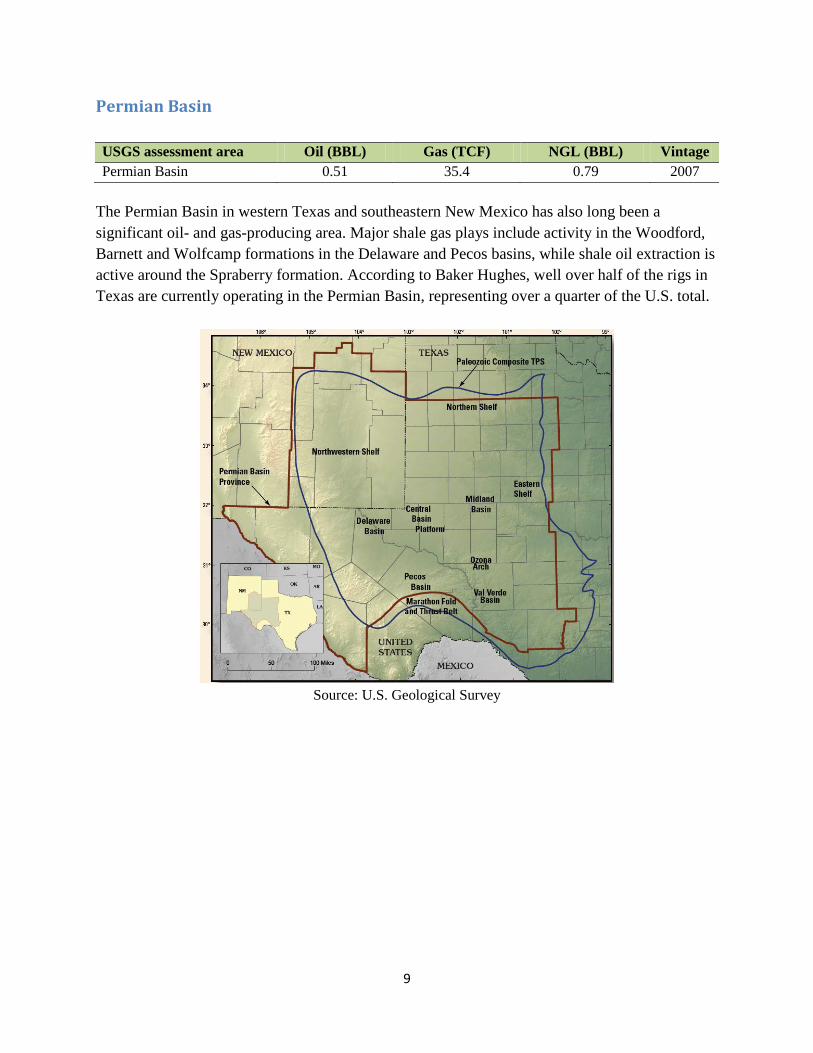
Permian Basin USGS assessment area Oil (BBL) Gas (TCF) NGL (BBL) Vintage Permian Basin 0.51 35.4 0.79 2007
The Permian Basin in western Texas and southeastern New Mexico has also long been a significant oil- and gas-producing area. Major shale gas plays include activity in the Woodford, Barnett and Wolfcamp formations in the Delaware and Pecos basins, while shale oil extraction is active around the Spraberry formation. According to Baker Hughes, well over half of the rigs in Texas are currently operating in the Permian Basin, representing over a quarter of the U.S. total.
Source: U.S. Geological Survey
10
References Bruner, K., and R. Smosna. A Comparative Study of the Mississippian Barnett Shale, Fort Worth
Basin, and Devonian Marcellus Shale, Appalachian Basin. US Department of Energy/National Energy Technology Laboratory publication DOE/NETL-2011/1478, April 2011.
Cardott, B.J. Woodford Shale: From Hydrocarbon Source Rock to Reservoir. Presentation made to
the AAPG (American Association of Petroleum Geologists) Woodford Shale Forum. April 2013. Accessed from Oklahoma Geological Survey website on June 25, 2013: http://www.ogs.ou.edu/fossilfuels/pdf/2013CardAAPGWoodford.pdf
Coleman, J.L., Milici, R.C., Cook, T.A., Charpentier, R.R., Kirschbaum, Mark, Klett, T.R., Pollastro,
R.M., and Schenk, C.J. Assessment of undiscovered oil and gas resources of the Devonian Marcellus Shale of the Appalachian Basin Province, 2011. U.S. Geological Survey Fact Sheet 2011–3092, 2 p., available at http://pubs.usgs.gov/fs/2011/3092/.
Dubiel, R.F.; Warwick, P.D.; Swanson, Sharon; Burke, Lauri; Biewick, L.R.H.; Charpentier, R.R.;
Coleman, J.L.; Cook, T.A.; Dennen, Kris; Doolan, Colin; Enomoto, Catherine; Hackley, P.C.; Karlsen, A.W.; Klett, T.R.; Kinney, S.A.; Lewan, M.D.; Merrill, Matt; Pearson, Krystal; Pearson, O.N.; Pitman, J.K.; Pollastro, R.M.; Rowan, E.L.; Schenk, C.J.; and Valentine, Brett. Assessment of undiscovered oil and gas resources in Jurassic and Cretaceous strata of the Gulf Coast, 2010. U.S. Geological Survey Fact Sheet 2011-3020, March 2011.
Energy Information Administration. Annual Energy Outlook 2013. April 2013. Energy Information Administration. Review of Emerging Resources: U.S. Shale Gas and Shale Oil
Plays. July 2011. Gaswirth, S.B., Marra, K.R., Cook, T.A, Charpentier, R.R., Gautier, D.L., Higley, D.K., Klett, T.R.,
Lewan, M.D., Lillis, P.G., Schenk, C.J., Tennyson, M.E., and Whidden, K.J. Assessment of undiscovered oil resources in the Bakken and Three Forks Formations, Williston Basin Province, Montana, North Dakota, and South Dakota, 2013. U.S. Geological Survey Fact Sheet 2013–3013, 4 p., http://pubs.usgs.gov/fs/2013/3013/
Higley, D.K., Gaswirth, S.B., Abbott, M.M., Charpentier, R.R., Cook, T.A., Ellis, G.S., Gianoutsos,
N.J., Hatch, J.R., Klett, T.R., Nelson, Philip, Pawlewicz, M.J., Pearson, O.N., Pollastro, R.M., and Schenk, C.J. Assessment of undiscovered oil and gas resources of the Anadarko Basin Province of Oklahoma, Kansas, Texas, and Colorado, 2010. U.S. Geological Survey Fact Sheet 2011–3003, January 2011.
Houseknecht, D.W., Coleman, J.L., Milici, R.C., Garrity, C.P., Rouse, W.A., Fulk, B.R., Paxton,
S.T., Abbott, M.M., Mars, J.C., Cook, T.A., Schenk, C.J., Charpentier, R.R., Klett, T.R., Pollastro, R.M., and Ellis, G.S. Assessment of undiscovered natural gas resources of the Arkoma
11
Basin Province and geologically related areas. U.S. Geological Survey Fact Sheet 2010-3043, June 2010.
Kirschbaum, M.A., Schenk, C.J., Cook, T.A., Ryder, R.T., Charpentier, R.R., Klett, T.R., Gaswirth,
S.B., Tennyson, M.E., and Whidden, K.J. Assessment of undiscovered oil and gas resources of the Ordovician Utica Shale of the Appalachian Basin Province, 2012. U.S. Geological Survey Fact Sheet 2012–3116, 6 p.
Pollastro, R.M., Hill, R.J., Ahlbrandt, T.A., Charpentier, R.R., Cook, T.A., Klett, T.R., Henry, M.E.,
and C.J. Schenk. Assessment of Undiscovered Oil and Gas Resources of the Bend Arch-Fort Worth Basin Province of North-Central Texas and Southwestern Oklahoma, 2003. U.S. Geological Survey Fact Sheet 2004-3022, March 2004.
Schenk, C. J., Pollastro, R.M., Cook, T.A., Pawlewicz, M.J., Klett, T.R., Charpentier, R.R., and
Cook, H.E. Assessment of Undiscovered Oil and Gas Resources of the Permian Basin Province of West Texas and New Mexico, 2007. U.S. Geological Survey Fact Sheet FS-2007-3115, 4 p.