Embed Size (px)
Citation preview
Governor's Office of State Planning and Budgeting
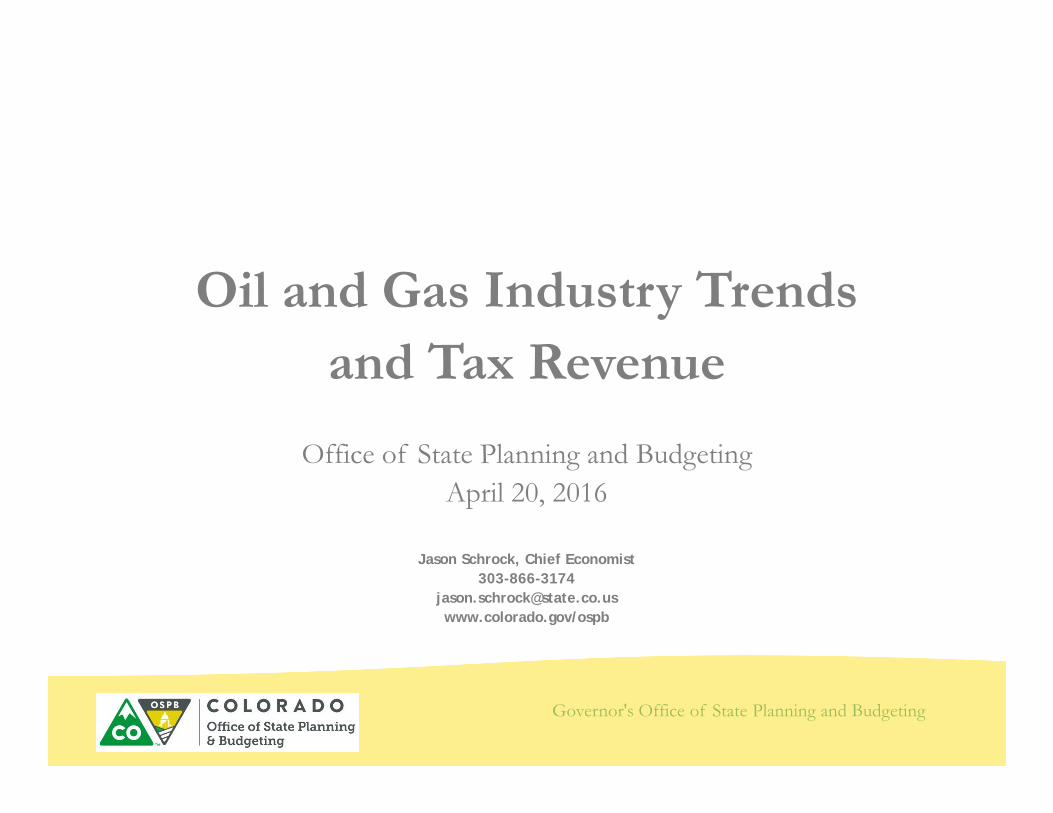
Oil and Gas Industry Trendsand Tax Revenue
Office of State Planning and BudgetingApril 20, 2016
Jason Schrock, Chief Economist303-866-3174
[email protected]/ospb
Governor's Office of State Planning and Budgeting
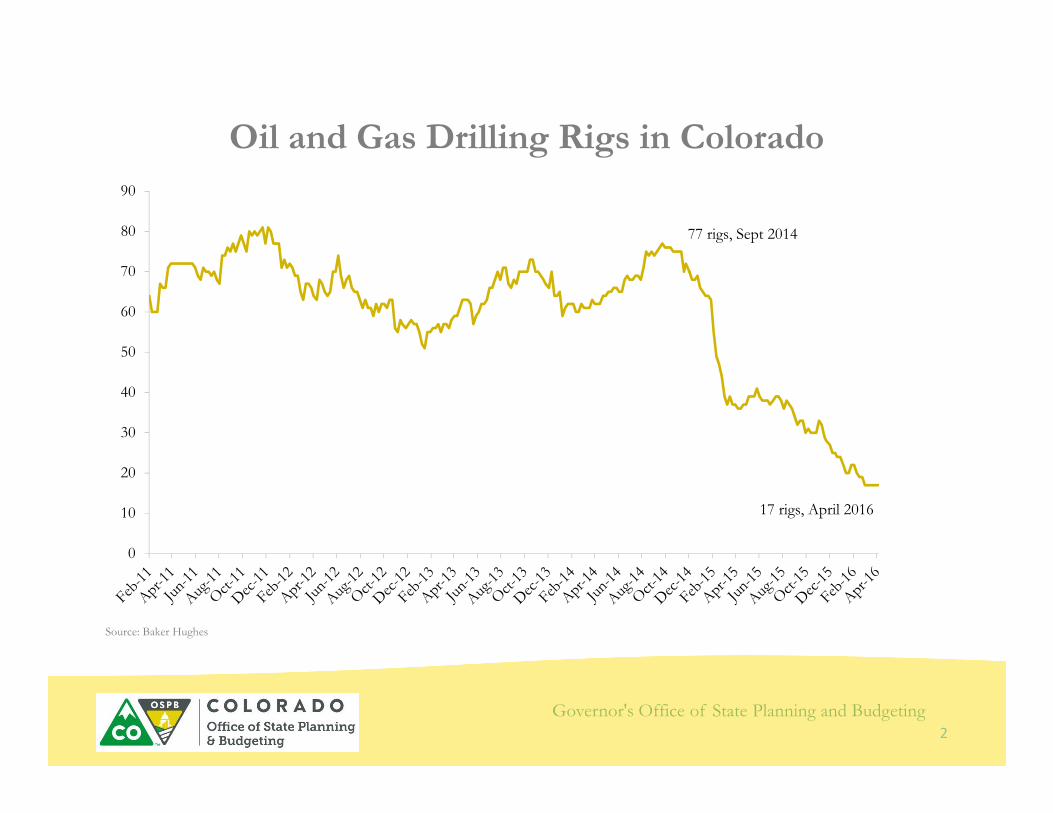
Oil and Gas Drilling Rigs in Colorado
2
Source: Baker Hughes
0
10
20
30
40
50
60
70
80
90
77 rigs, Sept 2014
17 rigs, April 2016
Governor's Office of State Planning and Budgeting
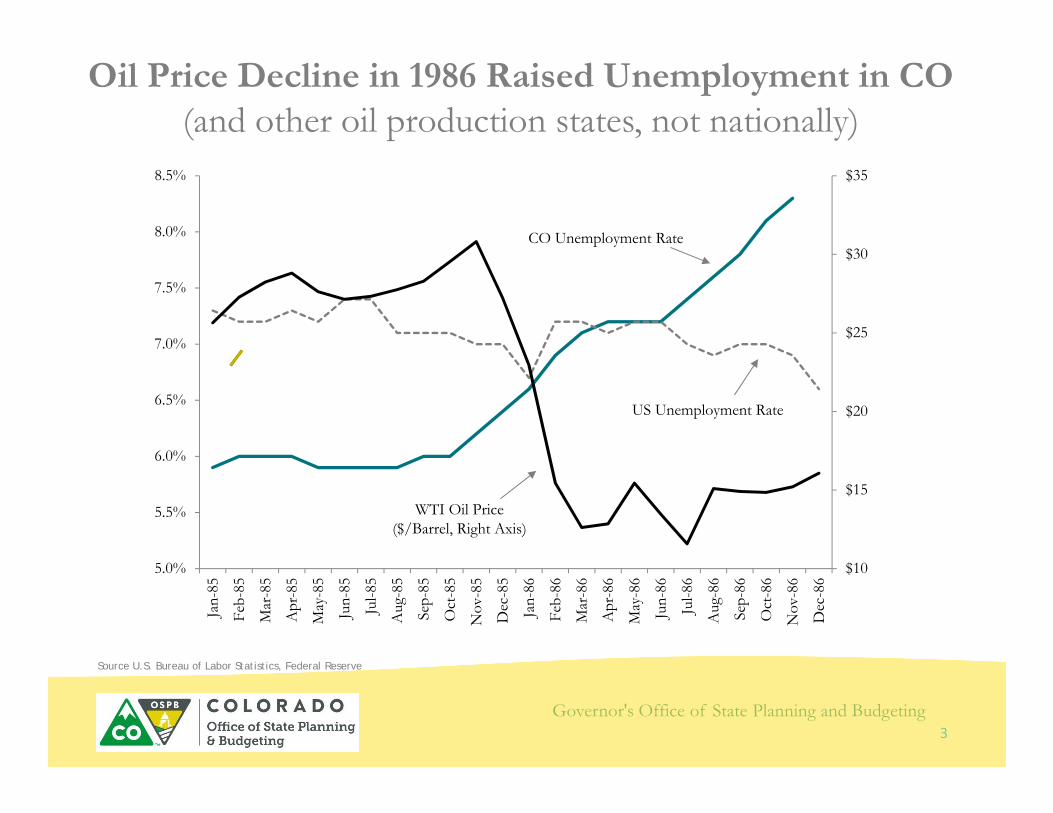
Oil Price Decline in 1986 Raised Unemployment in CO (and other oil production states, not nationally)
3
$10
$15
$20
$25
$30
$35
5.0%
5.5%
6.0%
6.5%
7.0%
7.5%
8.0%
8.5%
Jan-
85
Feb-
85
Mar
-85
Apr
-85
May
-85
Jun-
85
Jul-8
5
Aug
-85
Sep-
85
Oct
-85
Nov
-85
Dec
-85
Jan-
86
Feb-
86
Mar
-86
Apr
-86
May
-86
Jun-
86
Jul-8
6
Aug
-86
Sep-
86
Oct
-86
Nov
-86
Dec
-86
WTI Oil Price ($/Barrel, Right Axis)
CO Unemployment Rate
US Unemployment Rate
Source U.S. Bureau of Labor Statistics, Federal Reserve
Governor's Office of State Planning and Budgeting
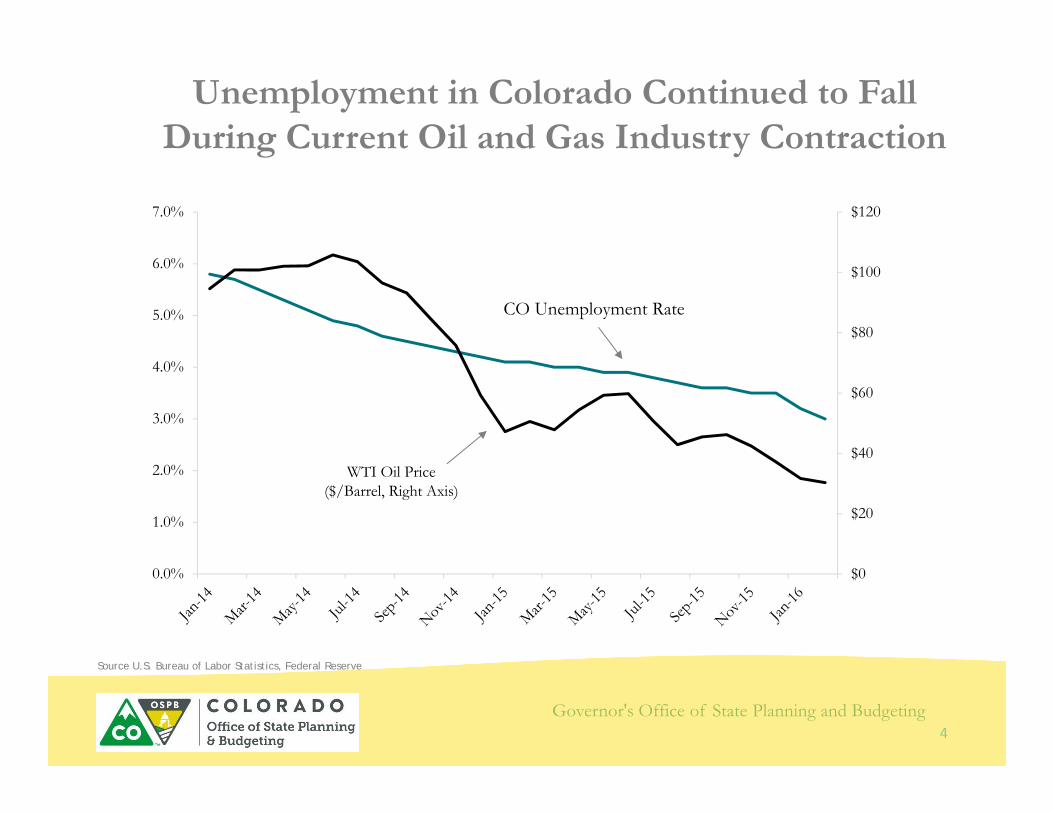
Unemployment in Colorado Continued to Fall During Current Oil and Gas Industry Contraction
4
$0
$20
$40
$60
$80
$100
$120
0.0%
1.0%
2.0%
3.0%
4.0%
5.0%
6.0%
7.0%
CO Unemployment Rate
WTI Oil Price ($/Barrel, Right Axis)
Source U.S. Bureau of Labor Statistics, Federal Reserve
Governor's Office of State Planning and Budgeting
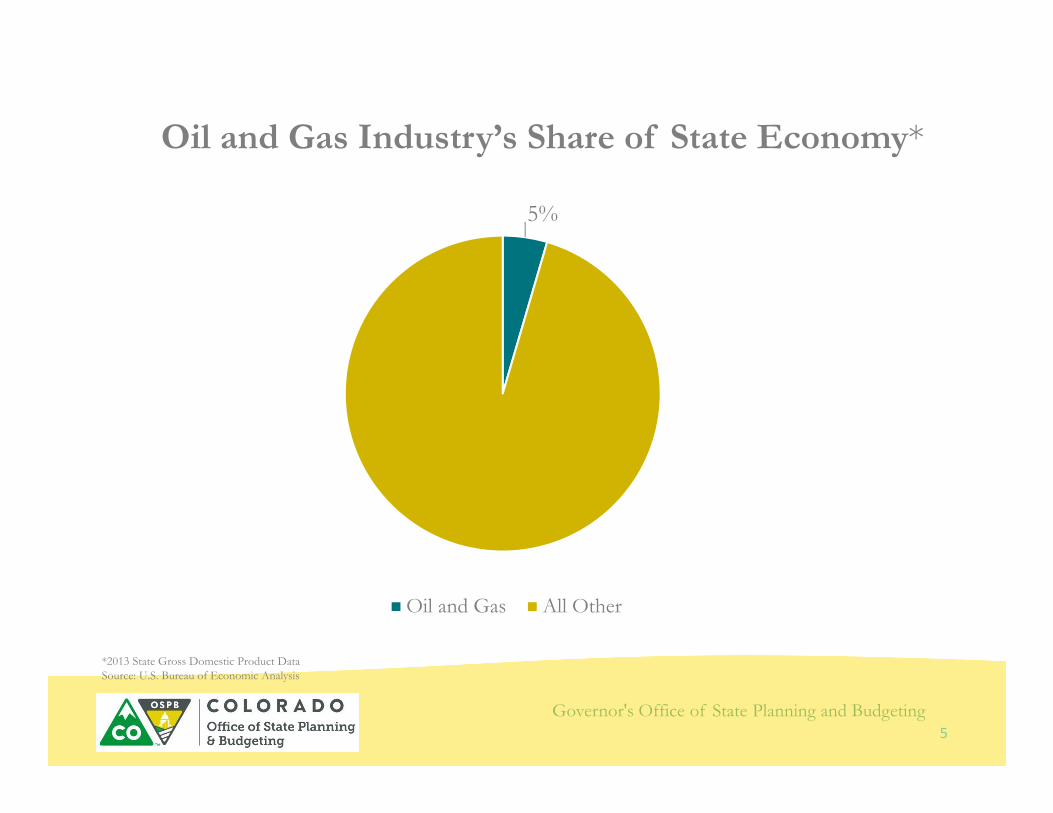
Oil and Gas Industry’s Share of State Economy*
5
5%
Oil and Gas All Other
*2013 State Gross Domestic Product DataSource: U.S. Bureau of Economic Analysis
Governor's Office of State Planning and Budgeting
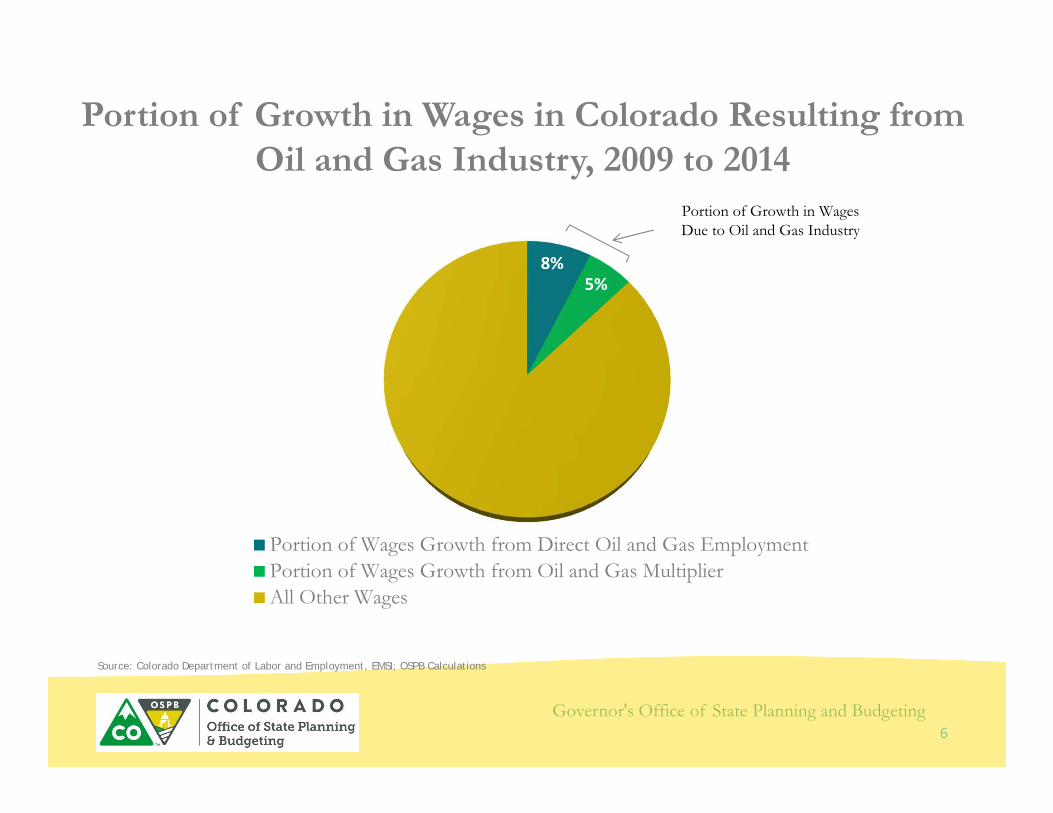
Portion of Growth in Wages in Colorado Resulting from Oil and Gas Industry, 2009 to 2014
6
Source: Colorado Department of Labor and Employment, EMSI; OSPB Calculations
8%5%
Portion of Wages Growth from Direct Oil and Gas EmploymentPortion of Wages Growth from Oil and Gas MultiplierAll Other Wages
Portion of Growth in Wages Due to Oil and Gas Industry
Governor's Office of State Planning and Budgeting
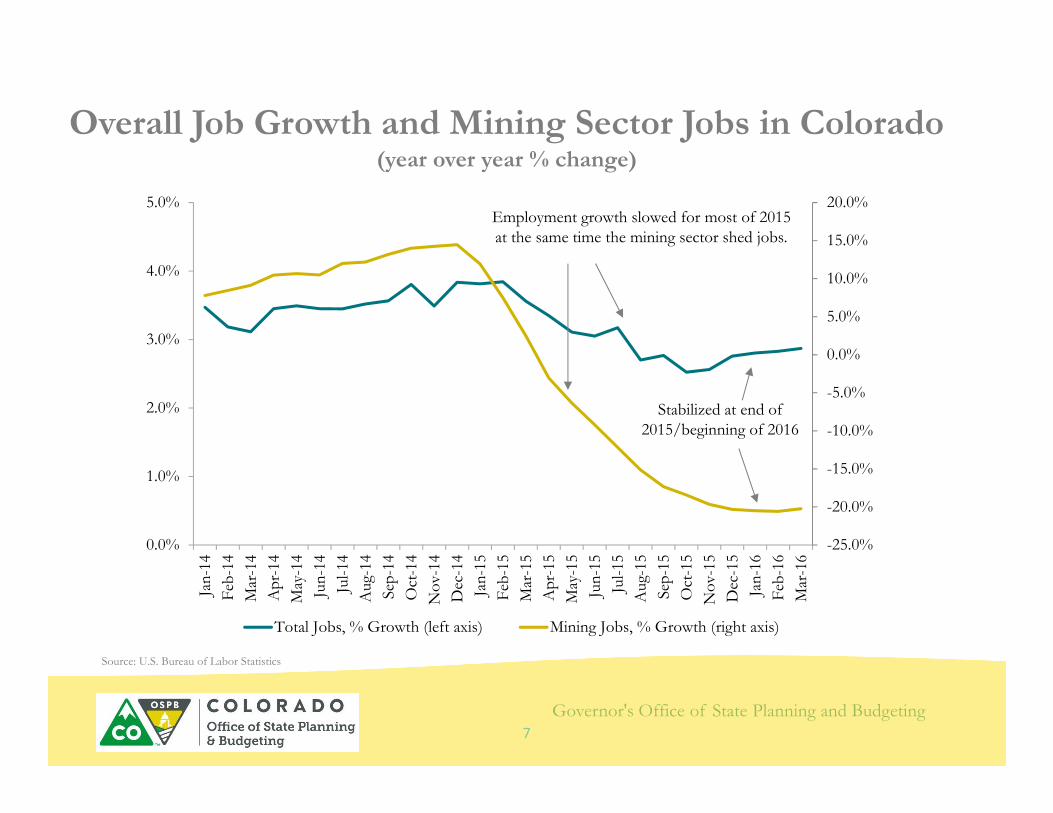
Overall Job Growth and Mining Sector Jobs in Colorado (year over year % change)
7
Source: U.S. Bureau of Labor Statistics
-25.0%
-20.0%
-15.0%
-10.0%
-5.0%
0.0%
5.0%
10.0%
15.0%
20.0%
0.0%
1.0%
2.0%
3.0%
4.0%
5.0%Ja
n-14
Feb-
14M
ar-1
4A
pr-1
4M
ay-1
4Ju
n-14
Jul-1
4A
ug-1
4Se
p-14
Oct
-14
Nov
-14
Dec
-14
Jan-
15Fe
b-15
Mar
-15
Apr
-15
May
-15
Jun-
15Ju
l-15
Aug
-15
Sep-
15O
ct-1
5N
ov-1
5D
ec-1
5Ja
n-16
Feb-
16M
ar-1
6
Total Jobs, % Growth (left axis) Mining Jobs, % Growth (right axis)
Employment growth slowed for most of 2015 at the same time the mining sector shed jobs.
Stabilized at end of 2015/beginning of 2016
Governor's Office of State Planning and Budgeting
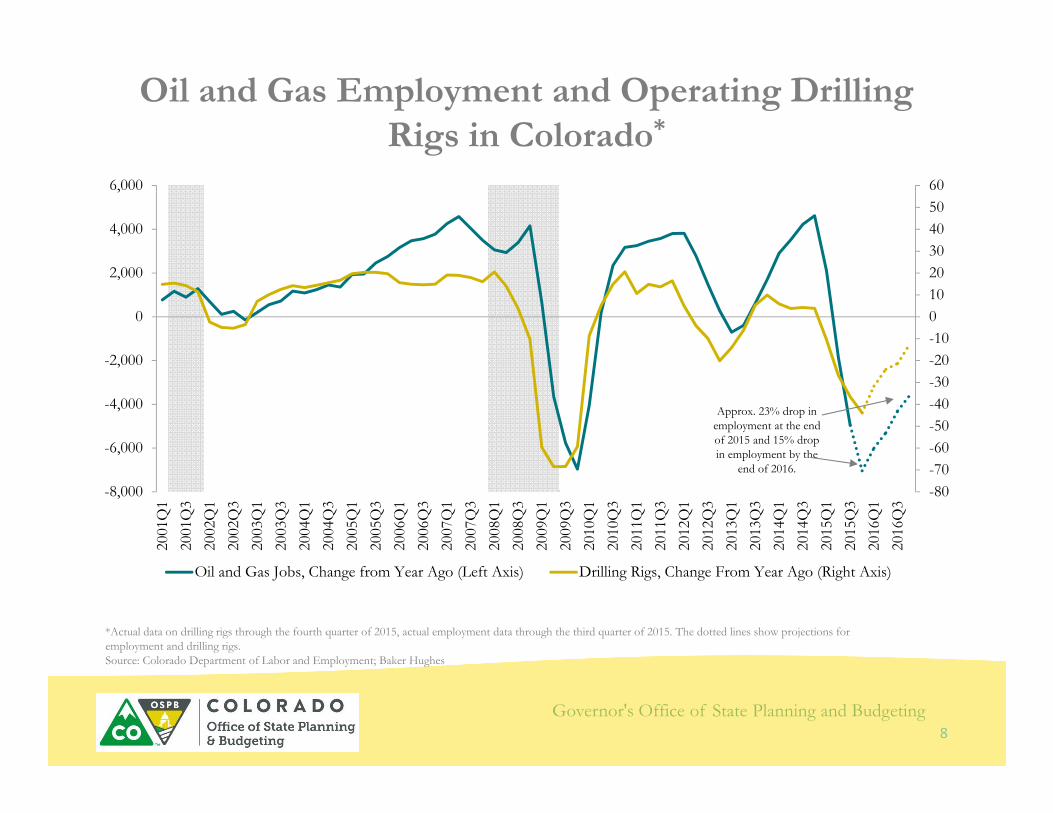
Oil and Gas Employment and Operating Drilling Rigs in Colorado*
8
*Actual data on drilling rigs through the fourth quarter of 2015, actual employment data through the third quarter of 2015. The dotted lines show projections for employment and drilling rigs. Source: Colorado Department of Labor and Employment; Baker Hughes
-80-70-60-50-40-30-20-100102030405060
-8,000
-6,000
-4,000
-2,000
0
2,000
4,000
6,00020
01Q
120
01Q
320
02Q
120
02Q
320
03Q
120
03Q
320
04Q
120
04Q
320
05Q
120
05Q
320
06Q
120
06Q
320
07Q
120
07Q
320
08Q
120
08Q
320
09Q
120
09Q
320
10Q
120
10Q
320
11Q
120
11Q
320
12Q
120
12Q
320
13Q
120
13Q
320
14Q
120
14Q
320
15Q
120
15Q
320
16Q
120
16Q
3
Oil and Gas Jobs, Change from Year Ago (Left Axis) Drilling Rigs, Change From Year Ago (Right Axis)
Approx. 23% drop in employment at the end of 2015 and 15% drop in employment by the
end of 2016.
Governor's Office of State Planning and Budgeting
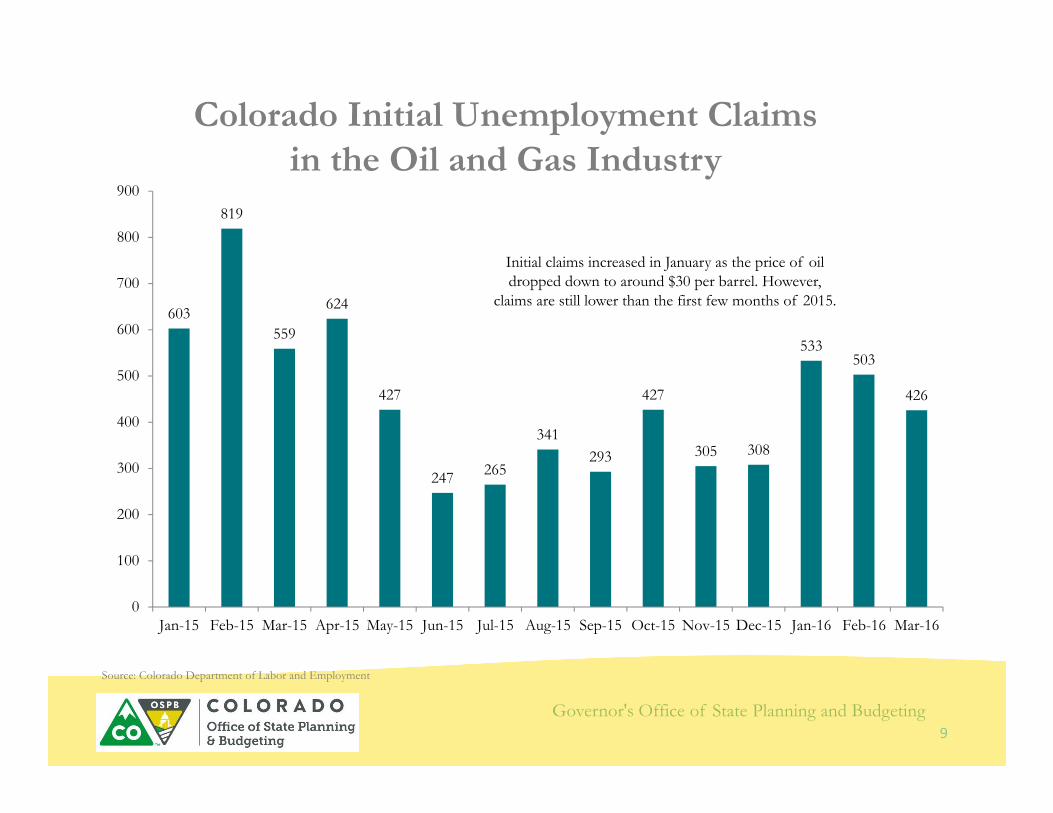
603
819
559
624
427
247 265
341293
427
305 308
533503
426
0
100
200
300
400
500
600
700
800
900
Jan-15 Feb-15 Mar-15 Apr-15 May-15 Jun-15 Jul-15 Aug-15 Sep-15 Oct-15 Nov-15 Dec-15 Jan-16 Feb-16 Mar-16
Colorado Initial Unemployment Claims in the Oil and Gas Industry
9
Initial claims increased in January as the price of oil dropped down to around $30 per barrel. However,
claims are still lower than the first few months of 2015.
Source: Colorado Department of Labor and Employment
Governor's Office of State Planning and Budgeting
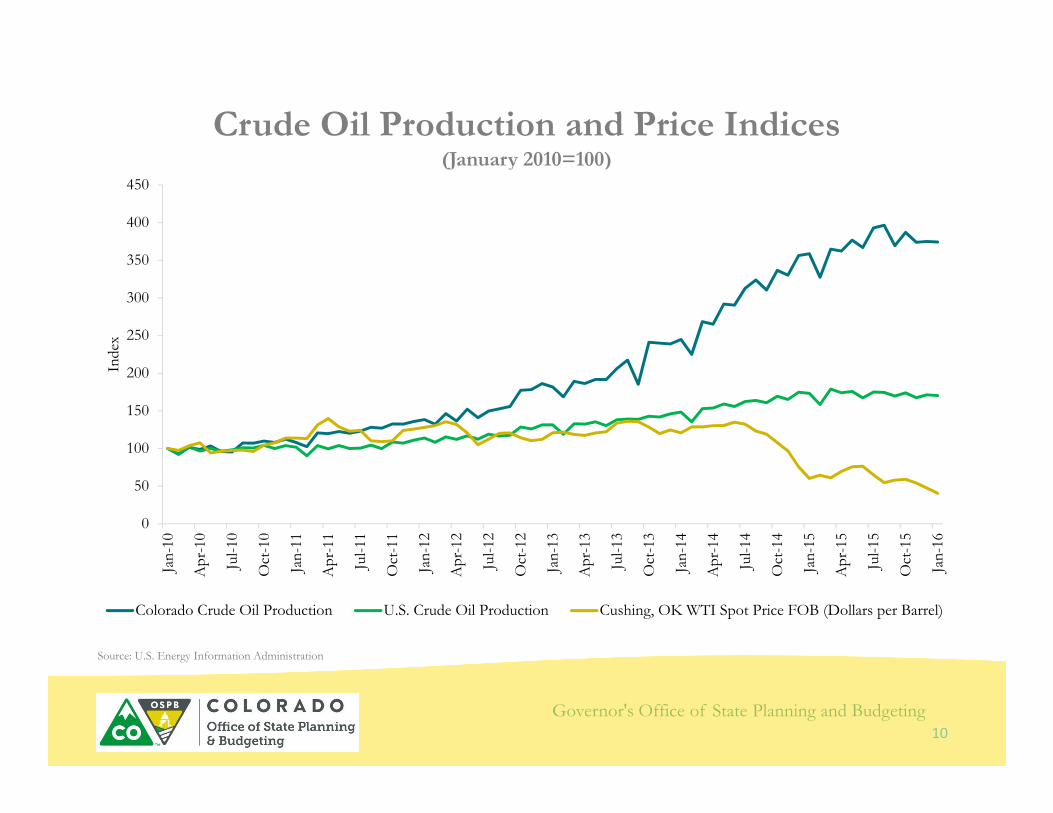
Crude Oil Production and Price Indices (January 2010=100)
10
Source: U.S. Energy Information Administration
0
50
100
150
200
250
300
350
400
450Ja
n-10
Apr
-10
Jul-1
0
Oct
-10
Jan-
11
Apr
-11
Jul-1
1
Oct
-11
Jan-
12
Apr
-12
Jul-1
2
Oct
-12
Jan-
13
Apr
-13
Jul-1
3
Oct
-13
Jan-
14
Apr
-14
Jul-1
4
Oct
-14
Jan-
15
Apr
-15
Jul-1
5
Oct
-15
Jan-
16
Inde
x
Colorado Crude Oil Production U.S. Crude Oil Production Cushing, OK WTI Spot Price FOB (Dollars per Barrel)
Governor's Office of State Planning and Budgeting
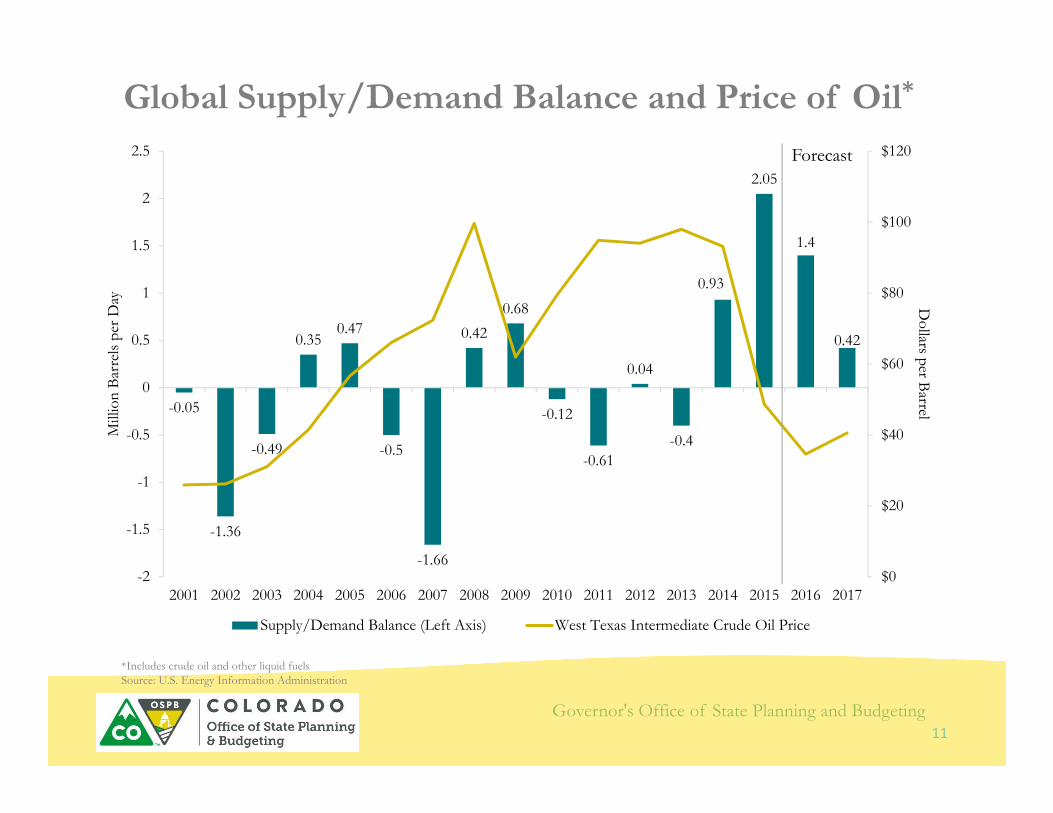
Global Supply/Demand Balance and Price of Oil*
11
*Includes crude oil and other liquid fuels Source: U.S. Energy Information Administration
-0.05
-1.36
-0.49
0.350.47
-0.5
-1.66
0.420.68
-0.12
-0.61
0.04
-0.4
0.93
2.05
1.4
0.42
$0
$20
$40
$60
$80
$100
$120
-2
-1.5
-1
-0.5
0
0.5
1
1.5
2
2.5
2001 2002 2003 2004 2005 2006 2007 2008 2009 2010 2011 2012 2013 2014 2015 2016 2017
Dollars per Barrel
Mill
ion
Barr
els p
er D
ay
Supply/Demand Balance (Left Axis) West Texas Intermediate Crude Oil Price
Forecast
Governor's Office of State Planning and Budgeting
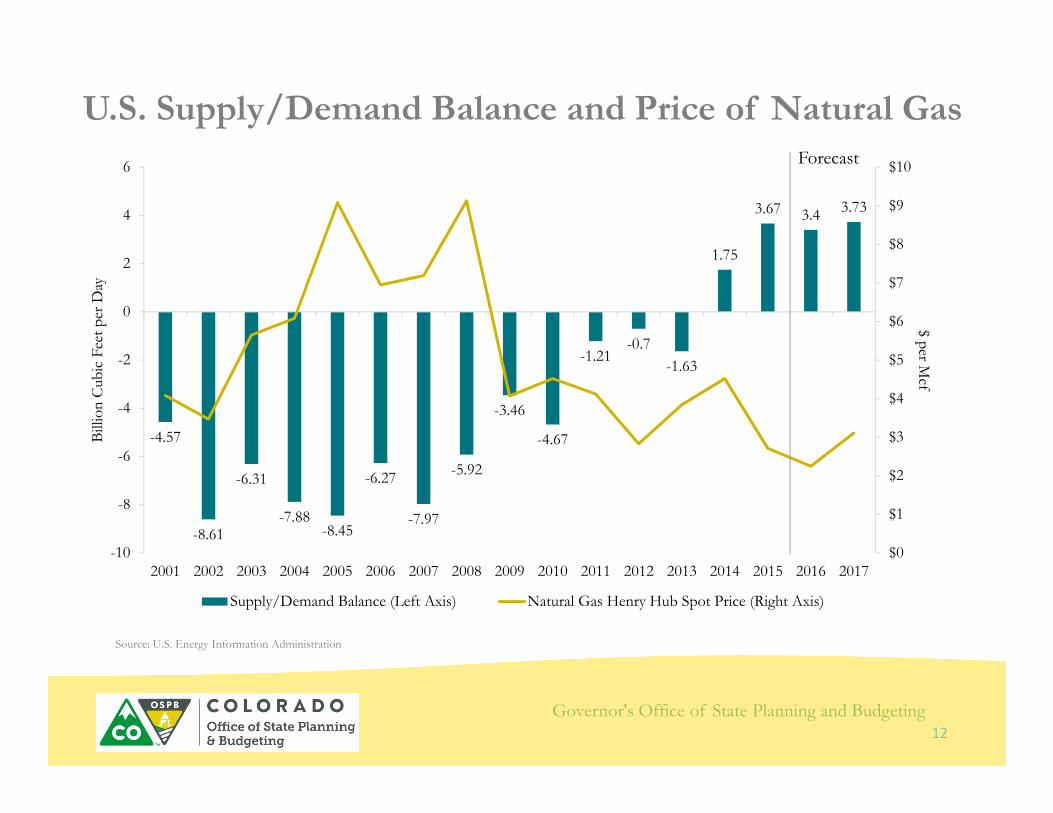
-4.57
-8.61
-6.31
-7.88-8.45
-6.27
-7.97
-5.92
-3.46
-4.67
-1.21-0.7
-1.63
1.75
3.67 3.4 3.73
$0
$1
$2
$3
$4
$5
$6
$7
$8
$9
$10
-10
-8
-6
-4
-2
0
2
4
6
2001 2002 2003 2004 2005 2006 2007 2008 2009 2010 2011 2012 2013 2014 2015 2016 2017
$ per Mcf
Billi
on C
ubic
Feet
per
Day
Supply/Demand Balance (Left Axis) Natural Gas Henry Hub Spot Price (Right Axis)
U.S. Supply/Demand Balance and Price of Natural Gas
12
Source: U.S. Energy Information Administration
Forecast
Governor's Office of State Planning and Budgeting
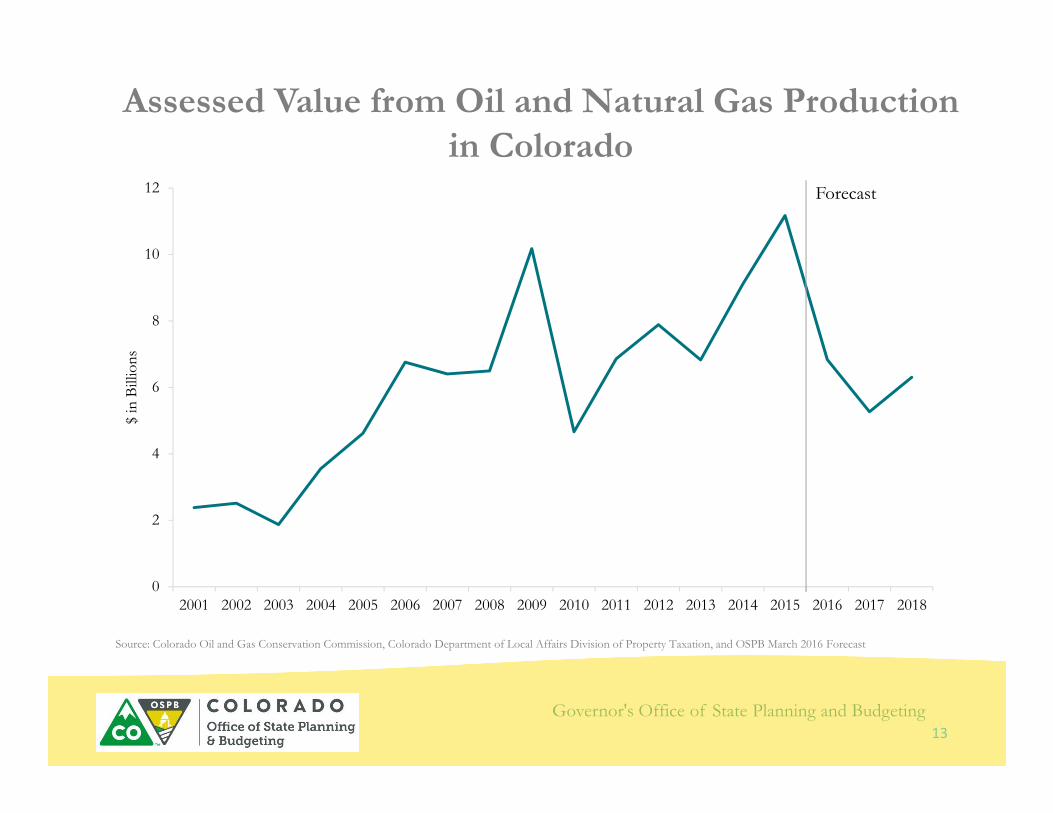
Assessed Value from Oil and Natural Gas Production in Colorado
13
Source: Colorado Oil and Gas Conservation Commission, Colorado Department of Local Affairs Division of Property Taxation, and OSPB March 2016 Forecast
0
2
4
6
8
10
12
2001 2002 2003 2004 2005 2006 2007 2008 2009 2010 2011 2012 2013 2014 2015 2016 2017 2018
$ in
Bill
ions
Forecast
Governor's Office of State Planning and Budgeting
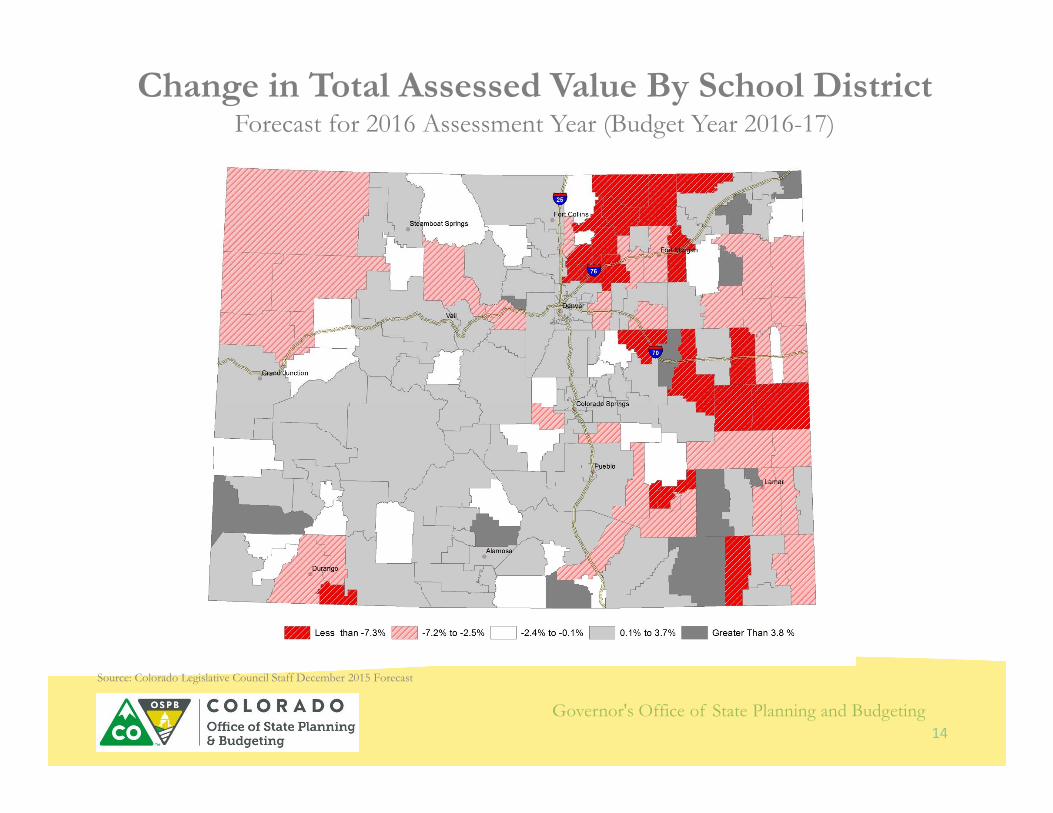
Change in Total Assessed Value By School District Forecast for 2016 Assessment Year (Budget Year 2016-17)
14
Source: Colorado Legislative Council Staff December 2015 Forecast
Governor's Office of State Planning and Budgeting
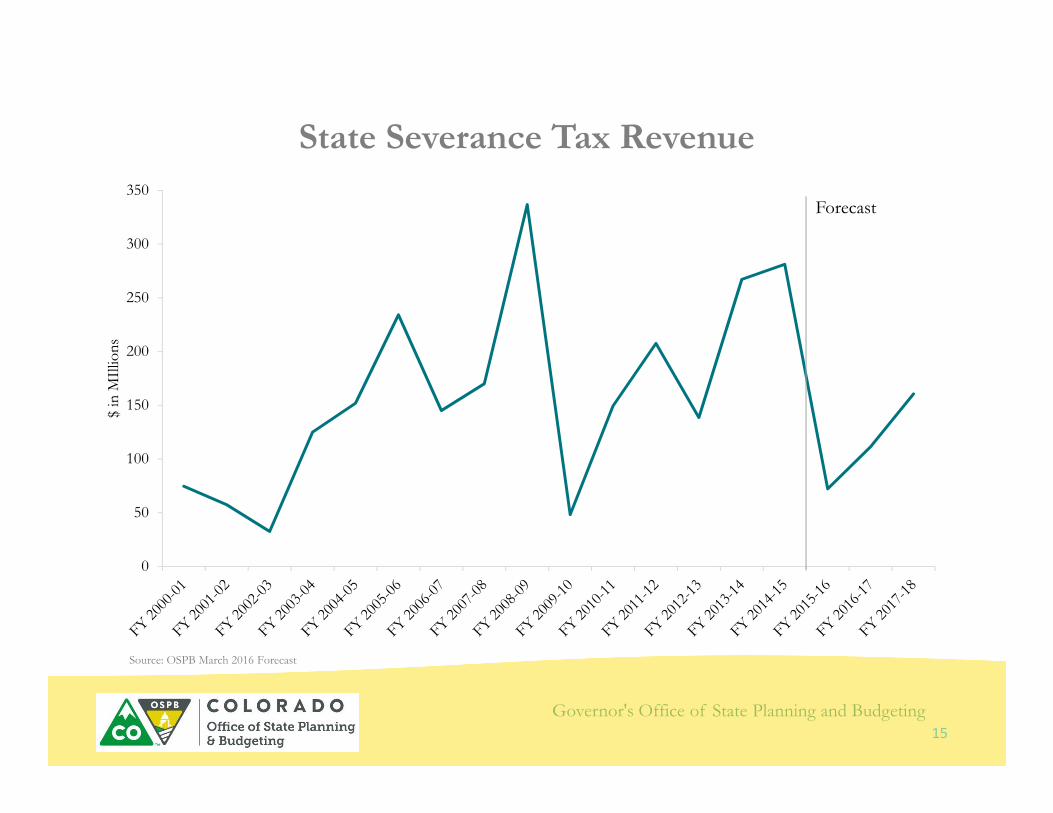
0
50
100
150
200
250
300
350
$ in
MIll
ions
State Severance Tax Revenue
15
Source: OSPB March 2016 Forecast
Forecast
Governor's Office of State Planning and Budgeting
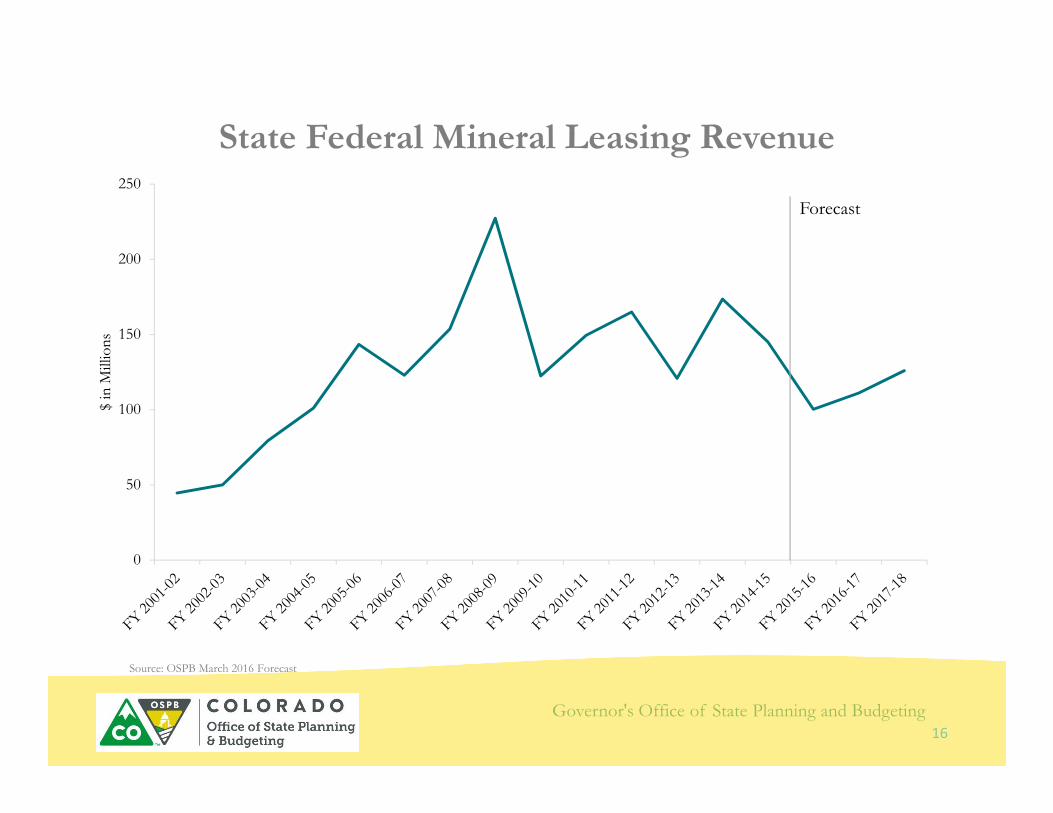
0
50
100
150
200
250
$ in
Mill
ions
State Federal Mineral Leasing Revenue
16
Source: OSPB March 2016 Forecast
Forecast
Governor's Office of State Planning and Budgeting
Thank You
Office of State Planning and Budgeting
Jason Schrock, Chief Economist303-866-3174
[email protected]/ospb