Embed Size (px)
Citation preview
Oil and Gas Industry Economic and
Fiscal Contributions in Colorado by County, 2014
Conducted by:
BUSINESS RESEARCH DIVISION Leeds School of Business
University of Colorado Boulder 420 UCB
Boulder, CO 80309-0420 Telephone: 303-492-3307 colorado.edu/business/brd
Research Team Richard Wobbekind Brian Lewandowski
Report for the Colorado Oil and Gas Association
December 2015

Business Research Division • Leeds School of Business • University of Colorado Boulder Page i
TABLE OF CONTENTS Table of Contents ................................................................................................................................................ i Executive Summary ............................................................................................................................................ 2 Methodology ...................................................................................................................................................... 3 Industry Employment, Firms, and Wages ........................................................................................................... 4 Oil and Gas Industry Economic Impact ............................................................................................................... 5
Commodity Prices ........................................................................................................................................... 5 Production and Value of Production .............................................................................................................. 8 Weld County Oil and Gas Production ........................................................................................................... 11
Oil and Gas Industry Public Revenue ................................................................................................................ 13 Property Taxes .............................................................................................................................................. 13 Public Leases and Royalties .......................................................................................................................... 14 Severance Taxes ........................................................................................................................................... 16 Distribution of Federal Mineral Lease Proceeds and State Severance Tax Revenue ................................... 18 Colorado Oil and Gas Converation Commission Taxes ................................................................................. 18 Income Taxes ................................................................................................................................................ 18
Conclusion ........................................................................................................................................................ 19 Bibliography ...................................................................................................................................................... 20 Appendix 1: Employment and Wages by County ............................................................................................. 22

Business Research Division • Leeds School of Business • University of Colorado Boulder Page 2
EXECUTIVE SUMMARY The oil and gas industry, along with nearly all extraction industries, inherently provides substantial
economic benefits due to its integrated supply chain, high wage jobs, and propensity to sell nationally and
globally. Much of Colorado’s oil and gas is sold outside of the state, contributing wealth to owners,
employees, governments, and schools, all of which are beneficiaries of oil and gas revenues.
In 2014, Colorado’s upstream and midstream oil and gas industry includes drilling, extraction, support
activities, pipeline construction, and pipeline transportation. The industry recorded $15.8 billion in
production value, accounting for 38,650 direct jobs with average annual wages in excess of $105,000—
twice the average wage of all industries in Colorado. Collectively, this industry contributed nearly $4.1
billion in employee income to Colorado households in 2014.
Examining the multiplier effect of industry spending, or the churn of dollars spent along the industry supply
chain and by income earners, the total economic impact of the industry was $31.7 billion in 2014,
supporting 102,700 jobs and $7.6 billion in compensation.
The oil and gas industry contributed to public revenue in 2014, primarily through property, income, and
severance taxes and through public land leases and royalties. These revenue streams totaled nearly $1.2
billion in 2014. This industry is subject to taxes and assessments beyond what other industries contribute.
Ad valorem taxes, for instance, are 3 times higher for oil and gas production than for commercial property
within the state and 11 times higher than residential property. Oil and gas property taxes exceeded an
estimated $400 million in 2014. Severance taxes paid by the industry totaled $330 million in 2014. The
industry also paid $315 million in royalties, rents, and bonus to federal government in 2014, and nearly
$160 million in state royalties, rents, and bonuses.
As oil production ramps up in Colorado, the energy industry in the state is no longer dominated by gas
production. In 2014, oil accounted for 52% of sales-based value, natural gas accounted for 44%, and carbon
dioxide, 4%.
Industry activity peaked in 2014, with drilling and employment decreasing in 2015 based on lower oil and
gas prices. Overall, production continued to increase through mid-2015 primarily due to new production in
Weld County.

Business Research Division • Leeds School of Business • University of Colorado Boulder Page 3
METHODOLOGY This study quantifies the economic impacts of oil and gas industry activity in Colorado by county using
publicly available industry data. The Bureau of Economic Analysis quantifies industry gross domestic
product (GDP). The Bureau of Labor Statistics and the Colorado Department of Labor and Employment
aggregate nonfarm employment and wages by industry and by county, and the U.S. Census Bureau
estimates nonemployer firms and receipts in Colorado by metropolitan statistical area (MSA).1 The Office of
Natural Resources Revenue publishes federal land leases, bonuses, and royalties by state, and the State
Land Board publishes commensurate data for state lands in Colorado. Other local sources, including the
Colorado Geological Survey; the Colorado Department of Local Affairs (DOLA), Division of Property
Taxation; and the Colorado Department of Revenue, provide estimates of the value of production, direct
industry assessed property values, and severance taxes, respectively, while the Colorado Oil and Gas
Conservation Commission (COGCC) publishes well activity and prices for oil and natural gas by county. This
study compiles the known economic contributions of the industry in Colorado by county and provides
estimates of economic metrics that are not quantified or published by government or by private data
repositories.
The authors completed a comprehensive Colorado oil and gas economic impact report commissioned by
the Colorado Oil & Gas Association (COGA) in 2011 and in 2013, and published in the journal Oil, Gas, and
Mining in 2013, that examined the industry, from drilling and extraction to refining and gasoline stations. In
2014, the American Petroleum Institute, commissioned a study that updated and built on the previous
work, deriving detailed county-level impacts for all counties in Colorado in 2013, focusing on a narrower
supply chain that included only upstream (drilling, extraction, and support activities) and midstream
(pipeline transportation) activities.2 This study current study was commissioned by the Colorado Oil and Gas
Association to again update the economic impact of upstream and midstream activities for 2014.
This study reports economic indicators and traces economic impacts to the county level, ranging from
employment, wages, and well activity to economic and fiscal impacts. Other metrics are available
exclusively at the state level, including federal distributions and price indices.
Total employment was calculated as the sum of employees and nonemployers (considered self-employed).
Publicly available employment and nonemployer data were used to estimate nonemployer detail that is not
1BLS definition of wages: “Under most State laws or regulations, wages include bonuses, stock options, severance pay, profit distributions, cash value of meals and lodging, tips and other gratuities, and, in some States, employer contributions to certain deferred compensation plans such as 401(k) plans.” Census Bureau definition of receipts: “Includes gross receipts, sales, commissions, and income from trades and businesses, as reported on annual business income tax returns. Business income consists of all payments received for services rendered. The composition of nonemployer receipts may differ from receipts data published for employer establishments. Nonemployer receipts may include commissions or earnings. In contrast, for employers the sales and receipts items published (for example, in the Economic Census) represents only the value of the goods involved in the transaction.”
2Includes the following North American Industry Classification System industries and codes: Extraction (211), Drilling wells
(213111), Support activities (213112), Oil and gas pipeline and related structures construction (23712), and Pipeline transportation (486).

Business Research Division • Leeds School of Business • University of Colorado Boulder Page 4
disclosed. Much like employment numbers, wage data were collected and estimated for employees and the
self-employed in core oil and gas industries and related industries.
The percent of wages from oil and gas activities consistently exceeds the percent of employment from oil
and gas activities because oil and gas jobs tend to pay more than the average job. Average wages were
calculated by dividing the total wages of employees and the receipts of self-employed by the number of
employees and nonemployers.
An economic impact analysis was conducted using an input-output modeling software, IMPLAN.3 IMPLAN
generates industry multipliers based on trade flows and industry profiles of the study area. Multipliers refer
to the interindustry relationships within a study area in terms of input-output (I-O) economic impacts.4
Multipliers are useful for analyzing project decisions to understand the incremental impacts that such
activities have on the local economy. IMPLAN multipliers are static and thus do not consider large-scale
disruptive impacts on the economic fabric without calculating specific infrastructure changes.
For the purpose of this study, all multipliers comprise direct, indirect, and induced effects. Direct refers to
direct spending or employment in the study industry or firm. Indirect is the spending or employment in
related industries impacted by spending or employment in the study industry or firm. Induced refers to
changes in household expenditures impacted by spending or employment in the study industry or firm.
State and local fiscal impacts are quantified by identifying and aggregating publicly available data on
industry and production taxes, and estimating revenues for income and sales taxes.
INDUSTRY EMPLOYMENT, FIRMS, AND WAGES The upstream and midstream oil and gas industry includes drilling, extraction, support activities, pipeline
construction, pipeline transportation, and other related industries (e.g., company headquarters). These
industries in Colorado accounted for a combined 38,650 jobs in 2014, earning more than $4.06 billion
(Table 1).5 Average industry earnings of $105,168 were twice that of all industries in Colorado ($52,724)
and all private industries in Colorado ($53,070) in 2014.
3MIG, Inc., www.implan.com.
4Bureau of Economic Analysis, Regional Multipliers, http://www.bea.gov/scb/pdf/regional/perinc/meth/rims2.pdf, retrieved
January 20, 2010.
5Jobs include employees (nonfarm wage and salary earners) and proprietors (nonemployers).

Business Research Division • Leeds School of Business • University of Colorado Boulder Page 5
TABLE 1: COLORADO OIL AND GAS INDUSTRY EMPLOYMENT, FIRMS, AND WAGES, 2014
County Employment Wages (Millions) Firms
Extraction 13,781 $1,765 475 Drilling 2,530 $223 88 Support Activities 15,756 $1,337 854 Pipeline Construction 3,819 $258 97 Pipeline Transportation 1,097 $128 64 Other 1,668 $352 7
Total 38,650 $4,065 1,584 Sources: Bureau of Labor Statistics, Quarterly Census of Employment and
Wages; and the U.S. Census Bureau, Nonemployer data.
OIL AND GAS INDUSTRY ECONOMIC IMPACT The oil and gas industry is a compilation of distinct activities with interrelated, cogent functions that
contributed $31.7 billion to Colorado’s economy in 2014 through direct and indirect activities (Table 2).
Mapping the industry illustrates the integrated supply chain within the state of Colorado, including oil and
gas drilling, extraction, support activities, transportation, pipeline construction, and other activities. Much
of the oil, gas, and CO2 is sold outside the state, resulting in outside industry investment.
TABLE 2: OIL AND GAS TOTAL ECONOMIC IMPACT (DIRECT, INDIRECT, INDUCED), 2014
Source Employment Employee Compensation (Millions)
Value Added (Millions)
Output (Millions)
Drilling and Extraction 52,551 $4,182.0 $8,309.8 $22,628.4 Support Activities 30,058 $2,056.6 $3,370.0 $5,194.2 Transportation 2,966 $231.6 $381.8 $965.1 Pipeline Construction 11,739 $594.7 $843.9 $1,953.6 Other 5,369 $534.6 $718.1 $951.8
Total 102,683 $7,599.4 $13,623.6 $31,693.1
TABLE 3: COLORADO OIL AND GAS EMPLOYMENT IMPACT (DIRECT, INDIRECT, AND INDUCED), 2014
Source Direct Indirect Induced Total
Drilling and Extraction 16,312 11,002 25,238 52,551
Support Activities 15,756 4,307 9,996 30,058
Transportation 1,097 743 1,127 2,966
Pipeline Construction 3,819 5,026 2,894 11,739
Other 1,668 1,103 2,598 5,369
Total 38,650 22,180 41,852 102,682
Commodity Prices
Prices for oil, natural gas, and gasoline began a sharp descent in 2014, impacting producers and consumers
differently. West Texas Intermediate (WTI) oil price peaked in 2014 at $107.95 on June 20; the average for
the year was $93.17 (Figure 1). Prices hit a record high on July 3, 2008, peaking at $145.31. By the end of
2014, the WTI spot price was $53.45, or 50.5% below the 2014 peak and 63.2% below the 2008 peak. This
price decline, which has continued into 2015, has had a bearing on investment (rig counts, employment),

Business Research Division • Leeds School of Business • University of Colorado Boulder Page 6
value of production, and actual production. Prices from January to early November averaged $50.30, or
30.5% below the 10-year average, and were $44.23 on November 10, 2015. Prices have remained below
the 10-year average for 12 months.
FIGURE 1: WTI OIL SPOT PRICE, 2005-2015
The Henry Hub natural gas spot prices have been depressed for much longer than oil prices, generally
trending below the 10-year average since January 2009. The average weekly price in 2014 was $4.39, and
the average price in 2015 through November 6 was $2.74—62% below the 10-year average and 46% below
the 6-year average (Figure 2).
FIGURE 2: HENRY HUB NATUFRAL GAS SPOT PRICE, 2005–2015

Business Research Division • Leeds School of Business • University of Colorado Boulder Page 7
The decrease in energy prices have impacted consumers most apparently in lower gasoline prices. Similar
to the peak in oil prices, gasoline prices peaked during summer 2008 as the nation was entrenched in the
recession (December 2007–June 2009, National Bureau of Economic Research). Nationally, prices peaked at
$4.17 per gallon compared to $4.03 in Colorado (Figure 3). Gasoline prices topped out at $3.71 in 2014 and
averaged $3.39 for the year. Prices in 2015 through November 9 year-to-date averaged $2.47 per gallon
and were $2.16 on the day of November 9, or 27% below the 10-year average and 30% lower year-over-
year.
FIGURE 3: NATIONAL AND COLORADO GASOLINE PRICES, 2005-2015
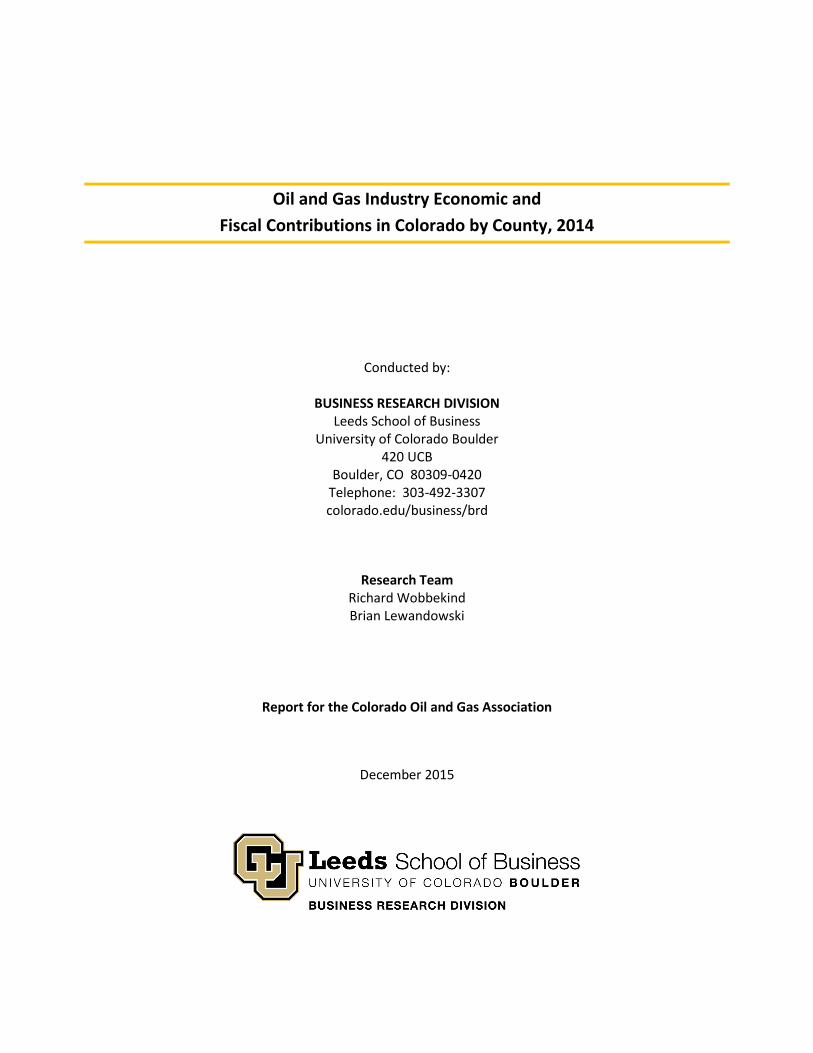
The price decline has been caused by a combination of factors, notably due to higher domestic oil
production, as well as softer global demand. Domestic crude oil storage spiked to record levels in 2015 in
the EIA’s storage statistics of weekly U.S. ending stocks (ending strategic petroleum reserves). The 2014
average reserves were 12% above the 33-year average, and the November 6, 2015, statistics reported oil
storage 45% above the long-term average (Table 4).
Business Research Division • Leeds School of Business • University of Colorado Boulder Page 8
FIGURE 4: UNITED STATES COMMERCIAL CRUDE OIL STORAGE, 1982-2015
Production and Value of Production
Oil and gas production and value of production of increased from 2013 to 2014 despite softer pricing near
in the second half of 2014. Oil and gas production in the state totaled an estimated $15.8 billion in 2014,
with oil accounting for 52% of sales-based value, natural gas accounting for 44%, and carbon dioxide, 4%
(Table 4).
TABLE 4: VALUE OF OIL AND GAS PRODUCTION IN COLORADO BY RESOURCE, 2014 Commodity Value (Millions) Percentage
Crude Oil $8,209 52% Natural Gas $6,911 44% Carbon Dioxide $678 4%
Total $15,798 100% Source: Colorado Geological Survey, Colorado Oil and Gas
Conservation Commission.
The 2014 value of oil, natural gas, and CO2 represents an increase of nearly 26% year-over-year and the
highest level of production on record as higher production offset lower pricing in the second half of the
year (Figure 5). Oil has recovered from the recession, with five consecutive years of increasing value of
production (Figure 6).

Business Research Division • Leeds School of Business • University of Colorado Boulder Page 9
FIGURE 5: VALUE OF COLORADO OIL AND GAS, 2004-2014
FIGURE 6: PERCENT CHANGE IN VALUE OF COLORADO OIL AND GAS, 2004-2014
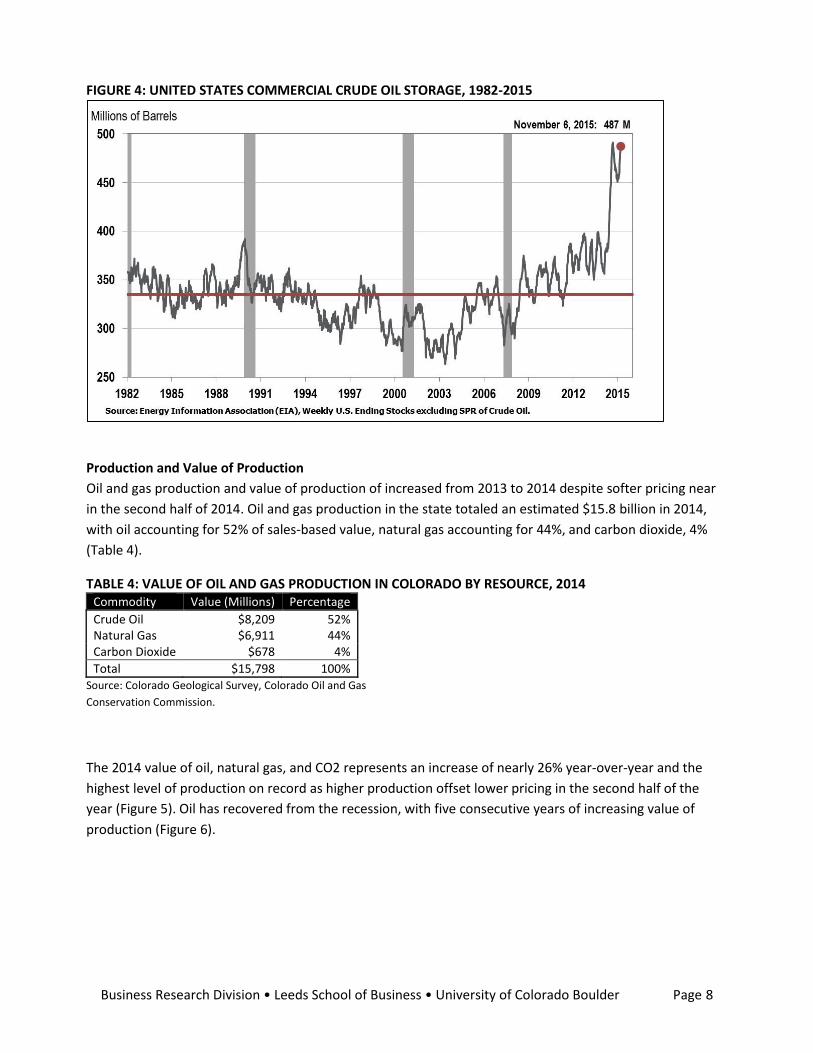
Production value in Colorado has been volatile over the past seven years; much of the volatility is due to
price swings. Oil production grew every year between 1999 and 2014, with sales totaling 95.2 million
barrels in 2014 (Figure 7). The greatest increase in both absolute and percentage growth came in 2014,
increasing by 29.9 million barrels, or nearly 45.8%. The increase in 2014 exceeded the total amount of 2008
production in Colorado. The value of sales was much more volatile, dipping 39% in 2009, then growing 45%
in 2010, 48% in 2011, 24% in 2012, 42% in 2013, and 36% in 2014 before falling in 2015. The top five
Business Research Division • Leeds School of Business • University of Colorado Boulder Page 10
producing counties for oil (Weld, Rio Blanco, Garfield, Lincoln, and Cheyenne counties) represented nearly
96% of oil production in 2014; Weld alone accounted for 86%.
FIGURE 7: COLORADO OIL PRODUCTION, 1999-2014
Natural gas sales generally exhibited a positive trend until 2011, peaking at 21.7 billion MCFs (Figure 8).
Production has been volatile since 2011, decreasing in both 2012 and 2013, and increasing in 2014.
Production in 2014 totaled 19.9 billion MCFs, 5.2% above 2013 but 8.3% below the 2011 level, with low
natural gas prices impacting new development. The increase in production in 2014 led to the highest value
of production since 2010 in Colorado. The value of carbon dioxide production totaled $678 million in 2014.
In sum, 2014 production value of oil and gas in Colorado was $15.8 billion.
In 2014, the state recorded 2 billion MCFs of natural gas production, of which 86% came from five counties
(Garfield, Weld, La Plata, Montezuma, and Las Animas). Garfield County alone represented 31% of 2014
natural gas production. From 2008 through 2014, 22 counties recorded decreased natural gas production
totaling nearly 213 million MCFs of production. This decrease was offset by increases in Weld County and
Garfield County, which recorded increases of 185 million MCFs and 44 million MCFs, respectively.

Business Research Division • Leeds School of Business • University of Colorado Boulder Page 11
FIGURE 8: COLORADO NATURAL GAS PRODUCTION, 1999-2014
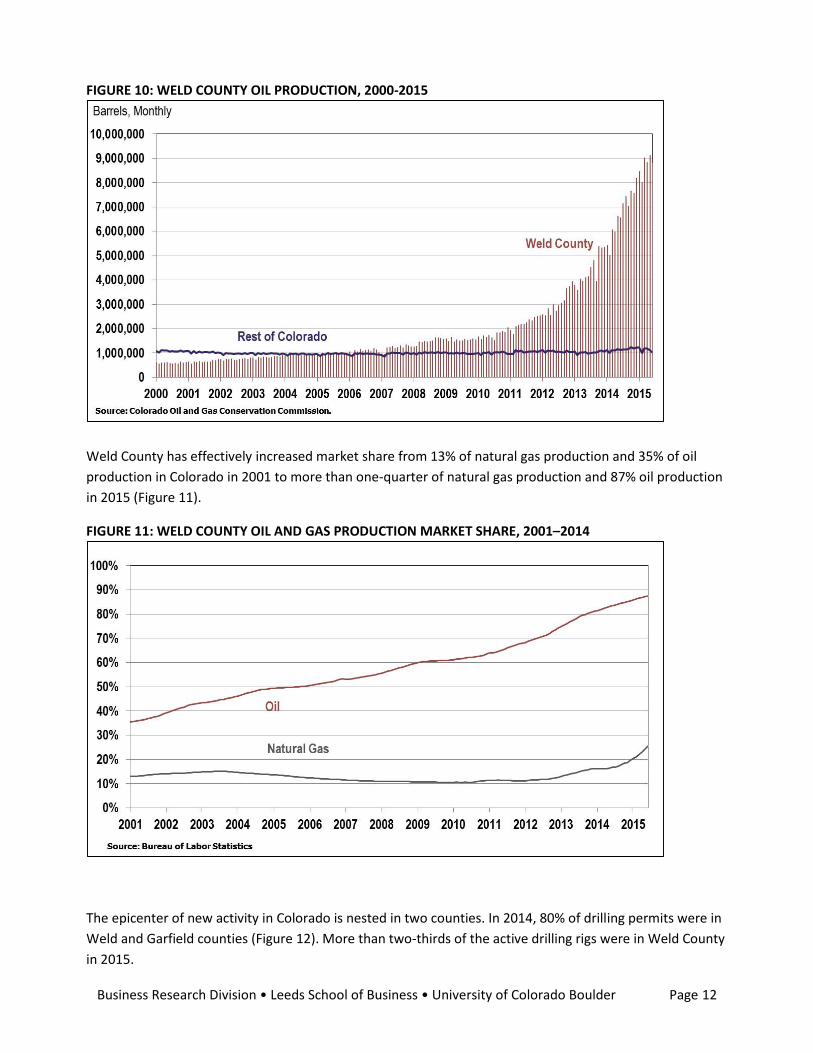
Weld County Oil and Gas Production
From 2008 to 2014, more than 97% of the differential in annual oil production was attributable to Weld
County. Colorado recorded nearly 29.9 million barrels of oil production in 2008, of which Weld County
recorded 17.8 million barrels. In 2014, Colorado recorded 95.2 million barrels of production, of which Weld
County recorded 81.4 million barrels. Colorado oil production, excluding Weld County, remained fairly flat
over the decade (Figure 9). Weld County has continued to exhibit growth in monthly oil production despite
the decrease in oil prices, while the rest of the state has collectively decreased monthly production (Figure
10 ).
FIGURE 9: COLORADO (EXCLUDING WELD COUNTY) OIL PRODUCTION, 2000-2015
Business Research Division • Leeds School of Business • University of Colorado Boulder Page 12
FIGURE 10: WELD COUNTY OIL PRODUCTION, 2000-2015
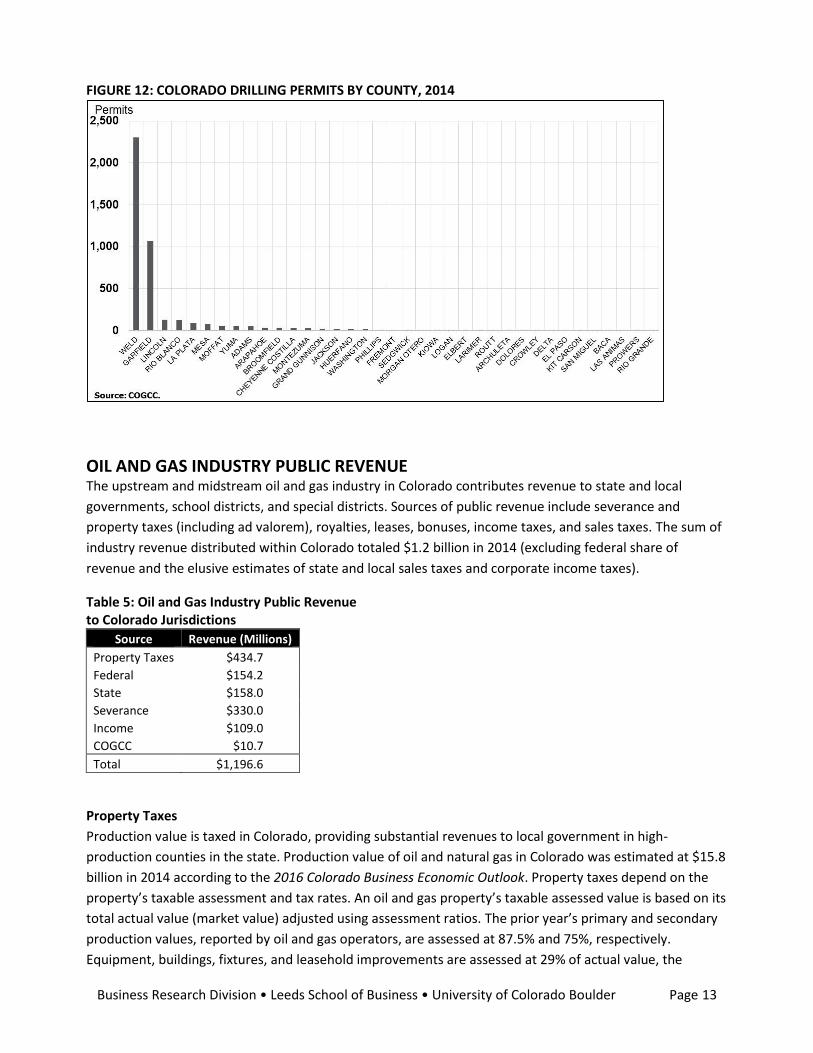
Weld County has effectively increased market share from 13% of natural gas production and 35% of oil
production in Colorado in 2001 to more than one-quarter of natural gas production and 87% oil production
in 2015 (Figure 11).
FIGURE 11: WELD COUNTY OIL AND GAS PRODUCTION MARKET SHARE, 2001–2014
The epicenter of new activity in Colorado is nested in two counties. In 2014, 80% of drilling permits were in
Weld and Garfield counties (Figure 12). More than two-thirds of the active drilling rigs were in Weld County
in 2015.
Business Research Division • Leeds School of Business • University of Colorado Boulder Page 13
FIGURE 12: COLORADO DRILLING PERMITS BY COUNTY, 2014
OIL AND GAS INDUSTRY PUBLIC REVENUE The upstream and midstream oil and gas industry in Colorado contributes revenue to state and local
governments, school districts, and special districts. Sources of public revenue include severance and
property taxes (including ad valorem), royalties, leases, bonuses, income taxes, and sales taxes. The sum of
industry revenue distributed within Colorado totaled $1.2 billion in 2014 (excluding federal share of
revenue and the elusive estimates of state and local sales taxes and corporate income taxes).
Table 5: Oil and Gas Industry Public Revenue to Colorado Jurisdictions
Source Revenue (Millions)
Property Taxes $434.7
Federal $154.2
State $158.0
Severance $330.0
Income $109.0
COGCC $10.7
Total $1,196.6
Property Taxes
Production value is taxed in Colorado, providing substantial revenues to local government in high-
production counties in the state. Production value of oil and natural gas in Colorado was estimated at $15.8
billion in 2014 according to the 2016 Colorado Business Economic Outlook. Property taxes depend on the
property’s taxable assessment and tax rates. An oil and gas property’s taxable assessed value is based on its
total actual value (market value) adjusted using assessment ratios. The prior year’s primary and secondary
production values, reported by oil and gas operators, are assessed at 87.5% and 75%, respectively.
Equipment, buildings, fixtures, and leasehold improvements are assessed at 29% of actual value, the

Business Research Division • Leeds School of Business • University of Colorado Boulder Page 14
commercial property assessment ratio. The appropriate tax rates are then applied to the final assessed
property value. Publicly available assessed values and average mill levies were used to estimate property
tax revenues from oil and gas activities. Colorado’s statewide property tax estimates were calculated using
assessed property values and the total average county levy.
Total property taxes related to land, improvements, and personal property were estimated at $434.7
million in 2014. The majority of property taxes come from what is classified as land value. Based on the
assessed production value for the previous year, land contributed 87.6% of total 2014 oil and gas property
taxes. The ad valorem tax is impacted by both price and production.
Table 6: Estimated Oil and Gas Industry Property Taxes, 2010-2014
Year County City School District Total
2010 $109.9 $3.1 $144.5 $257.6
2011 $150.2 $4.4 $190.5 $345.1
2012 $166.7 $5.4 $221.3 $393.4
2013 $149.0 $5.1 $204.4 $358.5
2014 $184.3 $6.2 $244.1 $434.7 Data source: Colorado Department of Local Affairs, Division of Property Taxation, Annual Reports 2010-2014.
Calculated estimates by Business Research Division. Note: Excludes special districts.
Publicly available assessed values and average mill levies were used to estimate property tax revenues from
oil and gas activities. Colorado’s statewide industry property tax estimates were calculated using assessed
oil and gas property values by county, municipality within counties, and school districts within counties; and
their respective local mill levies, and then summed for the state. These property tax estimates excluded
special districts’ levies on production given the elusive assessed values within special districts.
Public Leases and Royalties
Oil and gas exploration and development on public lands provide additional public revenue through land
leases and royalties. Federal onshore leases generated revenue of $3.7 million in 2014, down from $4.2
million in 2014 (Figure 13).
Federal lease income includes fixed annual rent payments, generally between $1.50 and $2.00 per acre.
Additionally, for lands offered by competitive bidding, premiums paid above rent payments are called
bonuses, estimated at $2 million in 2014. Other revenue totaled $677,000 for the year.
In addition to lease revenue, oil and gas activity on public lands provides royalty revenue. On federal lands,
minimum annual royalty payments, much like rents, are required until production begins. When production
exceeds minimal levels, royalty payments are based on production volume and negotiated sales prices of
the oil and gas produced. Companies are allowed to deduct from royalty value costs associated with
transporting and processing the oil and gas. Royalties generated in Colorado from oil and gas activities on

Business Research Division • Leeds School of Business • University of Colorado Boulder Page 15
federal onshore lands totaled nearly $308.3 million in 2014 (Figure 13).6 Federal royalties in 2014 exceeded
those generated in 2008, when royalties reached $303.9 million.
FIGURE 13: FEDERAL ROYALTIES, RENTS, BONUSES, AND OTHER REVENUES, 2008–2014
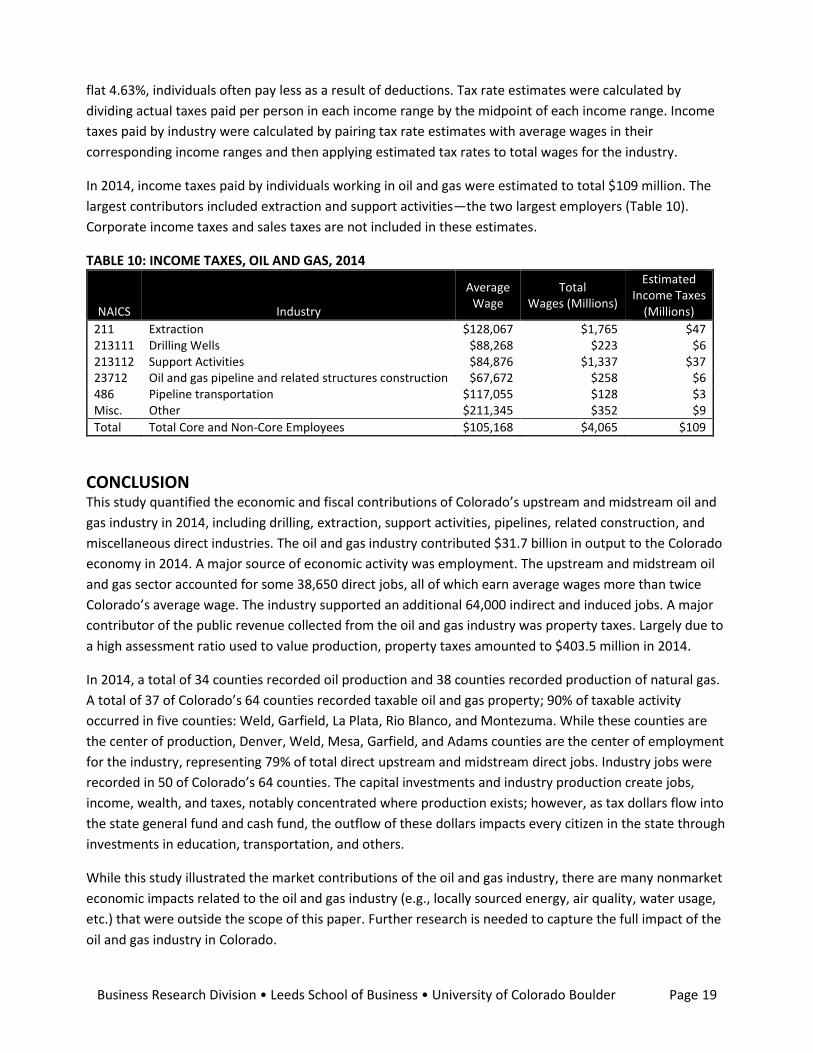
The State of Colorado also leases land. The State Land Board auctions leases to determine the rents oil and
gas companies pay for state parcels. The base rate, $1.50 per acre until changed to $2.50 per acre in 2011,
is collected and classified as rental income. Similar to federal lease bonuses, premiums bid over the base
price, classified as bonus revenue, are also lease income. The State of Colorado received almost $52.7
million in state lease revenue from oil and gas in 2014 (Figure 14).
When mineral resources are discovered on state land, oil and gas companies pay Colorado monthly
royalties based on production volume and sales prices. For the state’s ownership share, Colorado charges a
portion of proceeds from oil and gas sales; the full royalty rate was 12.5% until the State Land Board
authorized a change to 16.67% in June 2010. State royalties totaled nearly $105.4 million in 2014 (Figure
14).
The largest beneficiaries of State Land Board Trust distributions in fiscal year 2014-15 included schools
($178 million), Colorado State University ($1 million), and State Parks and Wildlife ($0.5 million) (Table 7).
6Includes carbon dioxide gas, coalbed methane, oil, processed (residue) gas, unprocessed (wet) gas, gas plant products, and fuel gas.
Business Research Division • Leeds School of Business • University of Colorado Boulder Page 16
TABLE 7: COLORADO STATE LAND BOARD NET TRUST DISTRIBUTIONS, FY2014-15
TRUST BENEFICIARY FY 2014-15 Distributions
School Trust Common Schools $178,124,652
CSU Trust Colorado State University $1,024,034
Internal Improvements Trust Colorado Parks and Wildlife $426,143
Public Buildings Trust Public Buildings $137,697
Hesperus Trust Fort Lewis College $43,007
Penitentiary Trust Colorado Department of Corrections $38,306
CU Trust University of Colorado $44,768
Saline Trust Colorado Parks and Wildlife $40,337
Forest Trust Multiple $26,672
Total TRUST DISTRIBUTIONS $179,905,616 Source: Colorado State Land Board Income and Inventory Report FY2014-15, Table 8, Net Trust Distribution FY 2014-15. Note: Includes all sources of funds, including oil and gas.
FIGURE 14: STATE ROYALTIES, RENTS AND BONUSES, FY2008-FY2015
Severance Taxes
Severance taxes are paid on the production of nonrenewable natural resources. In Colorado, oil and gas
wells with production exceeding stripper-well levels incur severance taxes. The marginal rate for this tax
ranges from 2% to 5%, depending on the gross income from production (Table 8). Severance tax returns are
complicated by the ad valorem property tax credit. When the credit is available, producers deduct from
their severance tax bills 87.5% of ad valorem property taxes paid on production (termed the “ad valorem
tax credit”), net of ad valorem property taxes on stripper wells.
Of the state severance tax revenue, 50% goes to the state trust fund and 50% to the local impact fund.
Funds from the state trust fund are then allocated to a fund used to finance loans for state water projects,

Business Research Division • Leeds School of Business • University of Colorado Boulder Page 17
administered by the Colorado Water Conservation Board and an operational account used for programs
administered by the Colorado Department of Natural Resources. The local impact fund share, meanwhile, is
distributed either to local government grant projects (70%) or directly to local governments (30%).
TABLE 8: SEVERANCE TAX RATES Total Gross Income Range Corresponding Severance Tax Under $25,000 2% of gross income $25,000 - $99,999 $500 plus 3% of the excess over $24,999 $100,000 - $299,999 $2,750 plus 4% of the excess over $99,999 $300,000 and over $10,750 plus 5% of the excess over $299,999
Source: Colorado Department of Revenue, Form DR 0021D.
In 2014, monthly severance taxes fluctuated between a low of $18 million and a high of $54 million (Figure 15). The monthly average in 2014 was $28 million. Removing seasonality, the 12-month total was $330 million from January 2014 to December 2014. This is nearly double the 2013 level, when severance taxes totaled $171 million. FIGURE 15: SEVERANCE TAX COLLECTIONS, 2005–2014 (NOMINAL)
TABLE 9: SEVERANCE TAXES, FY2008–FY2012, IN THOUSANDS (NOMINAL) Year Severance Taxes
2005 $160 2006 $168 2007 $112 2008 $254 2009 $152 2010 $85 2011 $163 2012 $135 2013 $171 2014 $330 Source: Colorado Department of Revenue.

Business Research Division • Leeds School of Business • University of Colorado Boulder Page 18
Given that severance taxes are based on the value of production, which is impacted largely by prices, total
oil and gas severance taxes have followed a lagged trajectory related to prices (Figure 16).
FIGURE 16: COLORADO SEVERANCE TAXES AND WTI OIL SPOT PRICE, 2005-2015
Distribution of Federal Mineral Lease Proceeds and State Severance Tax Revenue
The direct distribution of federal mineral lease proceeds and state severance tax revenues is mandated by
Colorado statute and administered by DOLA. Two separate statutes allocate state proceeds generated from
the production of mineral resources in Colorado to local governments.
Portions of the distribution are allocated based on formulaic calculations and result in the direct
distributions to Colorado counties, municipalities, and school districts. The factors used in the distribution
are measures of resident energy employees, mining and well permits, amount of mineral production,
population, and miles of roads. For an illustration of the Department of Local Affairs portion of
distributions, visit https://www.colorado.gov/pacific/dola/direct-distribution-counties-municipalities.
Colorado Oil and Gas Converation Commission Taxes
Oil and gas companies pay COGCC a conservation levy every quarter for the environmental response fund
and for commission expenses. As of July 2007, the charge is 0.07% of oil, natural gas, and CO2 production
sales, less exemptions. The levy rate is designed to meet the expenses of the agency. COGCC levy revenues
fluctuate in tandem with production values as a result of the formula (Price multiplied by production
multiplied by levy). The levy totaled $10.7 million in 2014.
Income Taxes
Because average wages for jobs in oil and gas tend to be higher than those of the average job in Colorado,
income taxes paid per worker may also higher than average. Although Colorado’s state income tax rate is a
Business Research Division • Leeds School of Business • University of Colorado Boulder Page 19
flat 4.63%, individuals often pay less as a result of deductions. Tax rate estimates were calculated by
dividing actual taxes paid per person in each income range by the midpoint of each income range. Income
taxes paid by industry were calculated by pairing tax rate estimates with average wages in their
corresponding income ranges and then applying estimated tax rates to total wages for the industry.
In 2014, income taxes paid by individuals working in oil and gas were estimated to total $109 million. The
largest contributors included extraction and support activities—the two largest employers (Table 10).
Corporate income taxes and sales taxes are not included in these estimates.
TABLE 10: INCOME TAXES, OIL AND GAS, 2014
NAICS Industry
Average Wage
Total Wages (Millions)
Estimated Income Taxes
(Millions)
211 Extraction $128,067 $1,765 $47 213111 Drilling Wells $88,268 $223 $6 213112 Support Activities $84,876 $1,337 $37 23712 Oil and gas pipeline and related structures construction $67,672 $258 $6 486 Pipeline transportation $117,055 $128 $3 Misc. Other $211,345 $352 $9
Total Total Core and Non-Core Employees $105,168 $4,065 $109
CONCLUSION This study quantified the economic and fiscal contributions of Colorado’s upstream and midstream oil and
gas industry in 2014, including drilling, extraction, support activities, pipelines, related construction, and
miscellaneous direct industries. The oil and gas industry contributed $31.7 billion in output to the Colorado
economy in 2014. A major source of economic activity was employment. The upstream and midstream oil
and gas sector accounted for some 38,650 direct jobs, all of which earn average wages more than twice
Colorado’s average wage. The industry supported an additional 64,000 indirect and induced jobs. A major
contributor of the public revenue collected from the oil and gas industry was property taxes. Largely due to
a high assessment ratio used to value production, property taxes amounted to $403.5 million in 2014.
In 2014, a total of 34 counties recorded oil production and 38 counties recorded production of natural gas.
A total of 37 of Colorado’s 64 counties recorded taxable oil and gas property; 90% of taxable activity
occurred in five counties: Weld, Garfield, La Plata, Rio Blanco, and Montezuma. While these counties are
the center of production, Denver, Weld, Mesa, Garfield, and Adams counties are the center of employment
for the industry, representing 79% of total direct upstream and midstream direct jobs. Industry jobs were
recorded in 50 of Colorado’s 64 counties. The capital investments and industry production create jobs,
income, wealth, and taxes, notably concentrated where production exists; however, as tax dollars flow into
the state general fund and cash fund, the outflow of these dollars impacts every citizen in the state through
investments in education, transportation, and others.
While this study illustrated the market contributions of the oil and gas industry, there are many nonmarket
economic impacts related to the oil and gas industry (e.g., locally sourced energy, air quality, water usage,
etc.) that were outside the scope of this paper. Further research is needed to capture the full impact of the
oil and gas industry in Colorado.

Business Research Division • Leeds School of Business • University of Colorado Boulder Page 20
BIBLIOGRAPHY Bureau of Labor Statistics, Quarterly Census of Employment and Wages. www.bls.gov (accessed November
4, 2015). Colorado Department of Local Affairs. May 2015. 2014 Forty-Fourth Annual Report. Division of Property
Taxation. Colorado Department of Local Affairs. 2015. Severance Direct Distribution and Federal Mineral Lease
Distributions. https://dola.colorado.gov/sdd/sdd_tier1.jsf (accessed October 18, 2015). Colorado Department of Local Affairs. Flowchart of Severance Tax Distributions.
https://drive.google.com/file/d/0B6P5TF4k2v8qRHpXLWVxdFJkTDA/view?pli=1 (accessed September 12, 2015).
Colorado Department of Revenue. Federal AGI and Tax, All Full-year Resident Returns, 2012 Individual
Income Tax Returns. Office of Research and Analysis. https://www.colorado.gov/pacific/revenue/statistics-income, accessed August 2, 2015.
Colorado Oil and Gas Conservation Commission. Colorado Oil and Gas Information System.
http://cogcc.state.co.us/ (accessed November 22, 2015). _________. Staff Report, October 26, 2015. http://cogcc.state.co.us/ (accessed November 22, 2015). Colorado State Board of Land Commissioners. Income & Inventory Report Fiscal Year 2014−15.
https://drive.google.com/file/d/0BxRIvx2vXq4FUmV3V2tmcld5MU0/view?pli=1 (accessed October 27, 2015).
Lewandowski, Brian and Richard Wobbekind. July 2013. Assessment of Oil and Gas Industry 2012 Industry
Economic and Fiscal Impacts in Colorado. Business Research Division, Leeds School of Business, University of Colorado Boulder.
_________. “Assessment of Oil and Gas Industry Economic and Fiscal Impacts in Colorado.” Oil, Gas, and
Mining, volume 1, issue 1, https://www.oilgasandmining.com/. IMPLAN Group LLC, IMPLAN System (data and software),16905 Northcross Dr., Suite 120, Huntersville, NC
28078 www.IMPLAN.com. Nonemployer Statistics. U.S. Census Bureau. http://www.census.gov/econ/nonemployer/index.html
(accessed August 17, 2015). Office of Natural Resources Revenue. States and Offshore Regions Statistics.
http://statistics.onrr.gov/ReportTool.aspx (accessed October 2, 2015). 2016 Colorado Business Economic Outlook. University of Colorado Boulder, Leeds School of Business.
(accessed December 1, 2015). U.S. Bureau of Labor Statistics. http://www.bls.gov/data/.

Business Research Division • Leeds School of Business • University of Colorado Boulder Page 21
U.S. Census Bureau. Nonemployer Statistics Definitions. www.census.gov/econ/nonemployer/definitions.htm, retrieved January 18, 2014.
U.S. Energy Information Administration. April 2015. Annual Energy Outlook 2015 with Projections to 2040.
http://www.eia.gov/forecasts/aeo/pdf/0383(2015).pdf (accessed November 28, 2015). U.S. Energy Information Administration. November 10, 2015. Short-Term Energy Outlook.
http://www.eia.gov/forecasts/steo/ (accessed November 16, 2015). Wobbekind, Richard and Brian Lewandowski. December 2011. Assessment of Oil and Gas Industry Economic
and Fiscal Impacts in Colorado in 2010. Business Research Division, Leeds School of Business, University of Colorado Boulder.

Business Research Division • Leeds School of Business • University of Colorado Boulder Page 22
APPENDIX 1: EMPLOYMENT AND WAGES BY COUNTY The upstream and midstream (pipeline) oil and gas industry comprised 38,650 workers (employees and
proprietors) in 2014 earning nearly $4.1 billion in wages and salaries and in proprietor income.
TABLE 11: COLORADO UPSTREAM AND MIDSTREAM O&G EMPLOYMENT AND WAGES, 2014 County Employment Wages (Millions) Average Wages
Adams 1,589 $115.4 $72,603 Alamosa 0 $0.0 $0 Arapahoe 980 $103.6 $105,712 Archuleta 22 $1.1 $49,763 Baca <10 <1,000,000 $0 Bent 0 $0.0 $0 Boulder 363 $16.3 $44,853 Broomfield 66 $9.4 $143,681 Chaffee <10 <1,000,000 $0 Cheyenne 113 $6.3 $55,549 Clear Creek <10 <1,000,000 $0 Conejos 0 $0.0 $0 Costilla 0 $0.0 $0 Crowley 0 $0.0 $0 Custer 0 $0.0 $0 Delta 14 $1.1 $75,850 Denver 12,737 $2,061.5 $161,850 Dolores 294 $21.5 $73,183 Douglas 666 $83.4 $125,274 Eagle 235 <1,000,000 $0 Elbert 75 $4.5 $59,640 El Paso 146 $8.6 $59,273 Fremont <10 <1,000,000 $0 Garfield 2,325 $188.1 $80,888 Gilpin 0 $0.0 $0 Grand <10 <1,000,000 $0 Gunnison <10 <1,000,000 $0 Hinsdale 0 $0.0 $0 Huerfano <10 <1,000,000 $0 Jackson 28 $1.2 $43,057 Jefferson 984 $126.1 $128,196 Kiowa 12 <1,000,000 $0 Kit Carson 115 $8.3 $72,293 Lake 19 <1,000,000 $0 La Plata 737 $51.7 $70,105 Larimer 566 $24.0 $42,398 Las Animas 469 $41.1 $87,618 Lincoln 0 $0.0 $0 Logan 334 $21.4 $64,139 Mesa 3,345 $247.2 $73,914 Mineral 0 $0.0 $0 Moffat 94 $5.7 $61,123 Montezuma 239 $19.6 $82,295 Montrose 15 <1,000,000 $0 Morgan 449 $36.6 $81,653 Otero 53 $2.8 $53,017 Ouray 10 <1,000,000 $0

Business Research Division • Leeds School of Business • University of Colorado Boulder Page 23
Park <10 <1,000,000 $0 Phillips 17 $1.0 $58,837 Pitkin <10 <1,000,000 $0 Prowers 101 $4.6 $45,670 Pueblo <10 <1,000,000 $0 Rio Blanco 650 $53.1 $81,562 Rio Grande 0 $0.0 $0 Routt 26 $1.4 $53,895 Saguache 0 $0.0 $0 San Juan 0 $0.0 $0 San Miguel <10 <1,000,000 $0 Sedgwick <10 <1,000,000 $0 Summit 0 $0.0 $0 Teller <10 <1,000,000 $0 Washington 47 $6.1 $130,317 Weld 10,348 $767.3 $74,149 Yuma 326 $20.0 $61,473
Total 38,650 $4,064.8 $105,168 Sources: BLS, Colorado Department of Labor and Employment, Census, and BRD analyses.