Embed Size (px)
Citation preview

1/43
Oil and gas diversificationOffshore wind
NORWEP
2/43
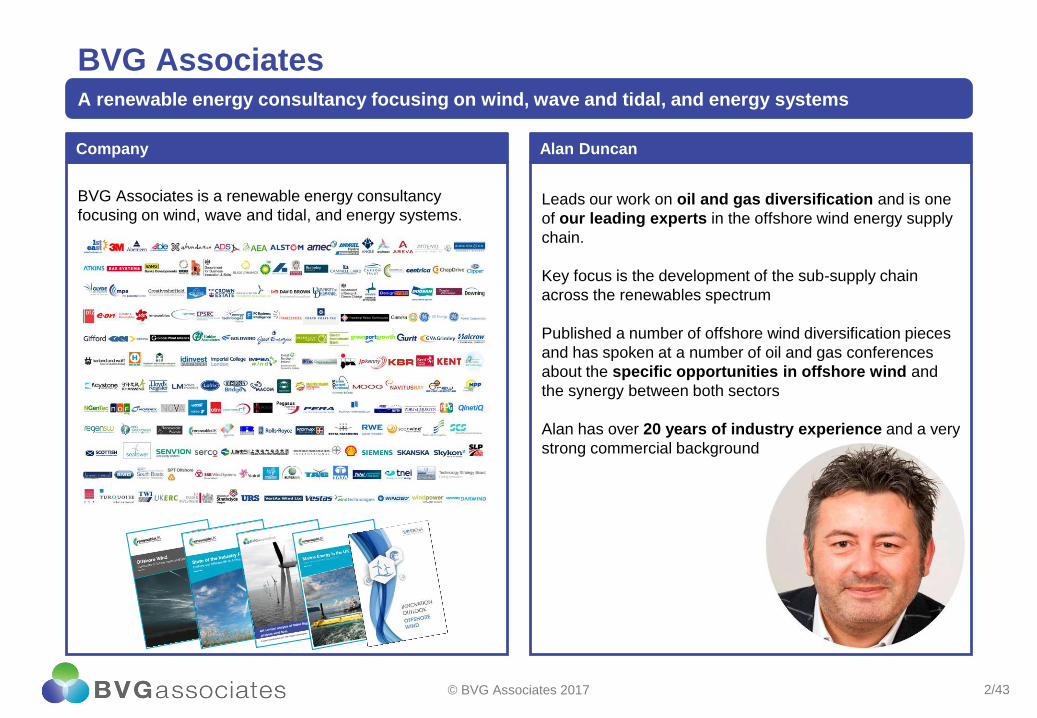
BVG AssociatesA renewable energy consultancy focusing on wind, wave and tidal, and energy systems
Leads our work on oil and gas diversification and is one
of our leading experts in the offshore wind energy supply
chain.
Key focus is the development of the sub-supply chain
across the renewables spectrum
Published a number of offshore wind diversification pieces
and has spoken at a number of oil and gas conferences
about the specific opportunities in offshore wind and
the synergy between both sectors
Alan has over 20 years of industry experience and a very
strong commercial background
Alan Duncan
BVG Associates is a renewable energy consultancy
focusing on wind, wave and tidal, and energy systems.
Company
© BVG Associates 2017

3/43
Contents
© BVG Associates 2017
• The market
• Europe
• UK
• Offshore wind lifecycle
• Procurement strategies
• Oil and gas diversification
• High potential opportunities
• Challenges to diversification

4/43
0
10
20
30
40
50
0
1
2
3
4
5
'16 '17 '18 '19 '20 '21 '22 '23 '24 '25 Cum
ula
tive in
stalle
d c
ap
aci
ty
(GW
)
Insta
lled c
apaci
ty (G
W)
BE DE DK
FR NL UK
Other Europe Cumulative
Source: BVG Associates CAGR: 11%
1. The marketEurope leads globally
© BVG Associates 2017
• Europe had almost 13GW installed capacity at the end of
2016
• In comparison, rest of world had just under 2GW
• By 2020, anticipated to reach about 25GW
• Main markets after 2020: UK, Germany, Netherlands and
France
5/43
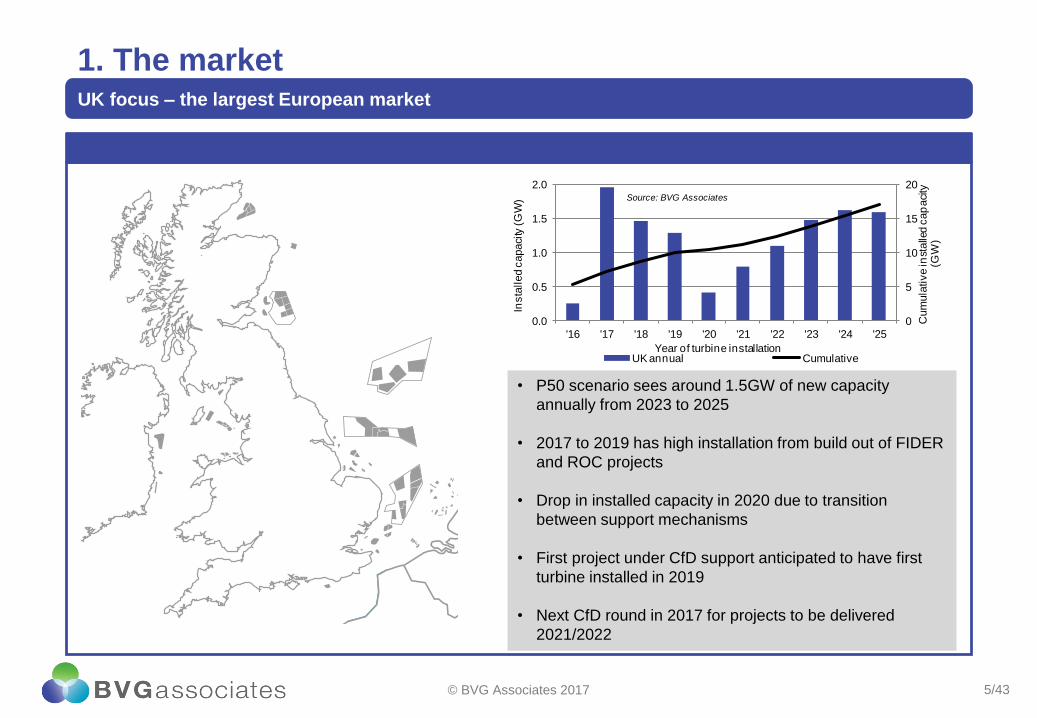
1. The marketUK focus – the largest European market
© BVG Associates 2017
• P50 scenario sees around 1.5GW of new capacity
annually from 2023 to 2025
• 2017 to 2019 has high installation from build out of FIDER
and ROC projects
• Drop in installed capacity in 2020 due to transition
between support mechanisms
• First project under CfD support anticipated to have first
turbine installed in 2019
• Next CfD round in 2017 for projects to be delivered
2021/2022
0
5
10
15
20
0.0
0.5
1.0
1.5
2.0
'16 '17 '18 '19 '20 '21 '22 '23 '24 '25
Cum
ula
tive in
stalle
d c
ap
aci
ty
(GW
)
Insta
lled c
apaci
ty (G
W)
Year of turbine installationUK annual Cumulative
Source: BVG Associates

6/43
1. The marketDE focus – the second largest European market
© BVG Associates 2017
• P50 scenario sees around 600MW of new capacity
annually from 2023 to 2025
• Market regulation seeing significant overhawl with
introduction of Offshore Wind Act “WindSeeG”
• Moving from a FiT to CfD support mechanism
• First competitive auction is planned for 2021
0
5
10
15
20
0.0
0.5
1.0
1.5
2.0
'16 '17 '18 '19 '20 '21 '22 '23 '24 '25
Cum
ula
tive in
stalle
d c
ap
aci
ty
(GW
)
Insta
lled c
apaci
ty (G
W)
Year of turbine installationGermany annual Cumulative
Source: BVG AssociatesSource: BVG Associates

7/43
1. The marketRest of Europe
Denmark France
Belgium Netherlands
© BVG Associates 2017
0
1
2
3
0.0
0.3
0.6
0.9
'16 '17 '18 '19 '20 '21 '22 '23 '24 '25 Cum
ula
tive in
stalle
d c
ap
aci
ty
(GW
)
Insta
lled c
apaci
ty (G
W)
Annual Cumulative
Source: BVG Associates
0
1
2
3
4
0.00
0.20
0.40
0.60
0.80
'16 '17 '18 '19 '20 '21 '22 '23 '24 '25 Cum
ula
tive in
stalle
d c
ap
aci
ty
(GW
)
Insta
lled c
apaci
ty (G
W)
Annual Cumulative
Source: BVG Associates
0
2
4
6
8
0.00
0.20
0.40
0.60
0.80
'16 '17 '18 '19 '20 '21 '22 '23 '24 '25 Cum
ula
tive in
stalle
d c
ap
aci
ty
(GW
)
Insta
lled c
apaci
ty (G
W)
Annual Cumulative
Source: BVG Associates
0
1
2
3
4
0.00
0.20
0.40
0.60
0.80
'16 '17 '18 '19 '20 '21 '22 '23 '24 '25 Cum
ula
tive in
stalle
d c
ap
aci
ty
(GW
)
Insta
lled c
apaci
ty (G
W)
Annual Cumulative
Source: BVG Associates
8/43
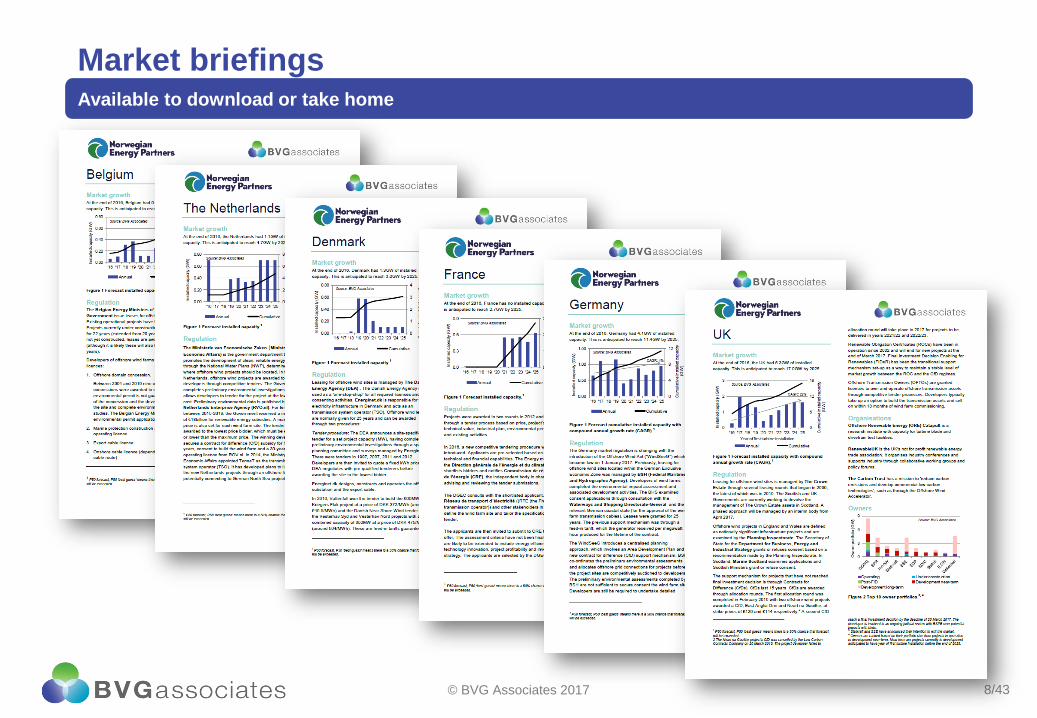
Market briefingsAvailable to download or take home
© BVG Associates 2017

9/43
2. Offshore wind lifecycle
© BVG Associates 2017
20%
15%
10%
5%
Equity(real IRR)
De
v (m
argi
n)
Foun-ation
(margin)
Install-ation
(margin)OMS
(margin)
Turbine(margin)
Debt(real interest rate)
Trans-mission(margin)
0% 25% 50% 75% 100%
Contribution to LCOE
Typic
al r
eal in
tere
st ra
te, IR
R o
r m
arg
in (
%)
Lifetime spend is for a 1GW wind farm

10/43
2. Offshore wind lifecycle
© BVG Associates 2017
Development and project management
3%
Turbine25%
Balance of plant17%
Installation and commissioning
11%
Operation, mantenance and service
40%
Decommissioning4%

11/43
2. Offshore wind lifecycle
© BVG Associates 2017
0
50
100
150
200
'15 '16 '17 '18 '19 '20 '21 '22 '23 '24 '25 '26 '27 '28 '29 '30
Co
st o
f en
erg
y €/M
Wh)
Date of first operation
Offshore wind (Q1 2017) Offshore wind (Q3 2015) CCGT (BEIS Nov 2016)
NNG (UK) - Mainstream EA1 (UK) - Iberdrola Horns Rev 3 (DK) - Vattenfall
Borssele 1&2 (NL) - DONG Vesterhav (DK) - Vattenfall Kriegers Flak (DK) - Vattenfall
Borssele 3&4 (NL) - Shell consortium
12/43
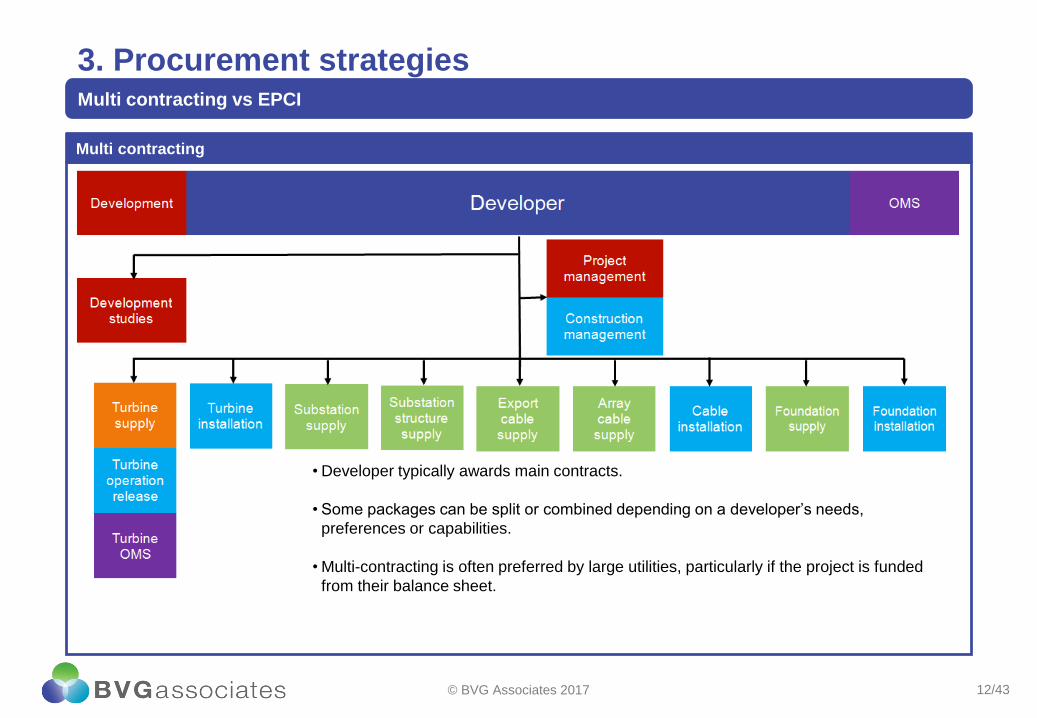
3. Procurement strategiesMulti contracting vs EPCI
Multi contracting
© BVG Associates 2017
• Developer typically awards main contracts.
• Some packages can be split or combined depending on a developer’s needs,
preferences or capabilities.
• Multi-contracting is often preferred by large utilities, particularly if the project is funded
from their balance sheet.

13/43
3. Procurement strategiesMulti contracting vs EPCI
EPCI
© BVG Associates 2017
• EPCI contracting usually involves three main
packages. The turbine package is typically kept
separate. The other two packages vary in scope
according to the strengths of the bidders.
• Contract values can exceed £1 billion, which is a
major risk for all but the largest and most experienced
contractors.
• The interfaces between the non-turbine packages are
not difficult for the developer to manage.
• Independent developers and less experienced utilities
prefer this approach.
14/43
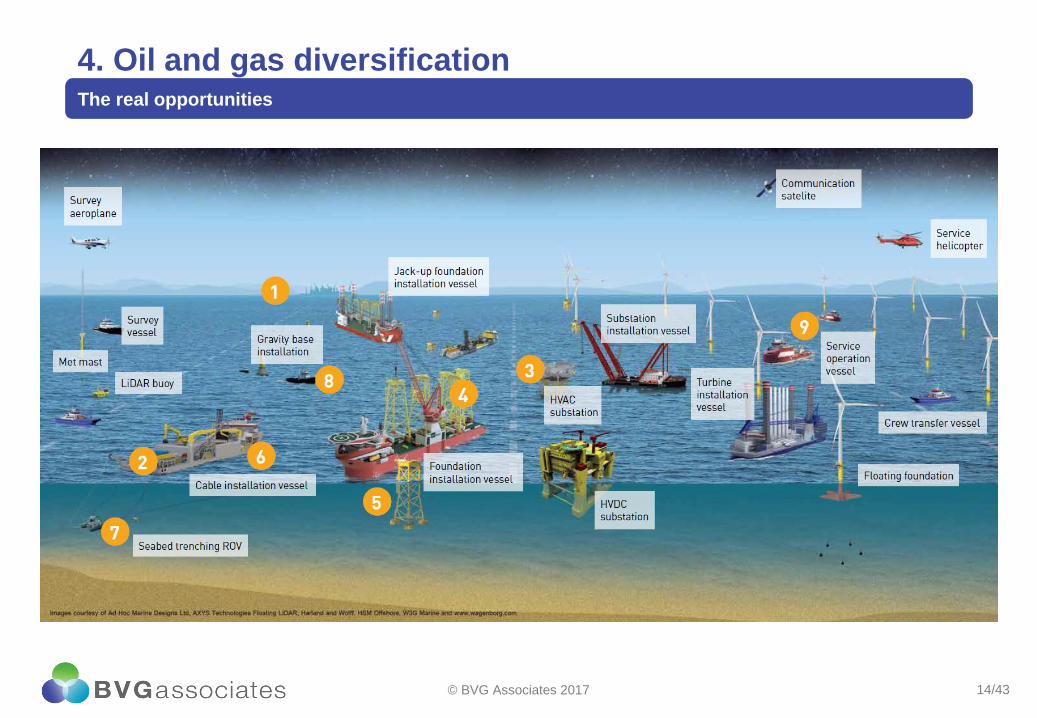
4. Oil and gas diversificationThe real opportunities
© BVG Associates 2017

15/43
4. Oil and gas diversificationThe real opportunities
© BVG Associates 2017
1. Oil and gas track record in offshore wind
2. Oil and gas sector synergies
3. Appetite from offshore wind
4. Potential for levelised cost of energy (LCOE) benefit from new involvement by oil and gas companies
5. Size and timing of investments by oil and gas companies
6. Size of the opportunity
Green-light opportunities have been identified as those areas of the offshore wind supply chain that present oil and gas
suppliers with the greatest opportunity to support.
Areas of supply denoted as amber or red are still an opportunity for supply, the assessment simply considers where the
logical argument exists for the best chance of diversification success.

16/43
4. Oil and gas diversificationThe real opportunities
© BVG Associates 2017
Score
Criterion 1 2 3 4
Oil and gas track record in
offshore wind
No known O&G companies with a
track record in offshore wind in the
last three years
< 25% of the companies that have
supplied offshore wind in the last
three years have an O&G background
< 75% of the companies that have
supplied offshore wind in the last
three years have an O&G background
Almost all of the companies that have
supplied offshore wind in the last
three years have an O&G background
Oil and gas sector
synergies
Limited synergies between offshore
wind and O&G
Some synergies between offshore
wind and O&G but significant learning
needed by new entrants
Many synergies between offshore
wind and O&G and some learning
would be needed by new entrants
Strong synergies between offshore
wind and O&G and goods and
services can be supplied to offshore
wind without much learning.
Appetite from offshore
wind (For wind farms
reaching FID in 2015)
Strong competition between five or
more mature players using optimal
technical solutions
Healthy competition between three to
four players using technical solutions
close to optimal
Competition between three to four
players but technical solutions for
some tasks are suboptimal. There is
demand for new solutions from
parallel sectors
Less than three established suppliers
and/or the technical solutions for
critical tasks are suboptimal.
There is demand for new solutions
from parallel sectors
Potential for LCOE benefit
from new involvement by
oil and gas companies (For
wind farms reaching FID in
2020)
Standard technology in offshore wind
is close to optimal with few
opportunities for O&G companies.
Standard technology in offshore wind
is well established with O&G
companies only likely to contribute
about 0.1-0.5% of LCOE reduction to
wind farms
Standard technology in offshore wind
is adequate but oil and gas
companies could contribute between
about 0.6% and 1% of LCOE
reduction to wind farms
Standard technology in offshore wind
is immature or inadequate and oil and
gas companies could contribute more
than 1% of LCOE reduction to wind
farms
Size and timing of
investments by oil and gas
companies (For wind farms
reaching FID in 2017)
Significant investments are needed to
be competitive for projects that need
to be amortised over several orders
Investment must be made before a
confirmed order
Significant investments are needed to
be competitive for projects that need
to be amortised over several orders
Investment can be made before the
first confirmed order
Significant investments are needed to
be competitive for projects but they
can be set against a single project
Investment can be made in response
to a confirmed order
Minor investments can be made
incrementally to be competitive.
Investment in response to a confirmed
order
Size of the opportunity The serviceable market opportunity is
less than 1% of lifetime expenditure
The serviceable market opportunity is
between 1% and 2% of lifetime
expenditure
The serviceable market opportunity is
between 2% and 5% of lifetime
expenditure
The serviceable market opportunity is
greater than 5% of lifetime
expenditure
17/43
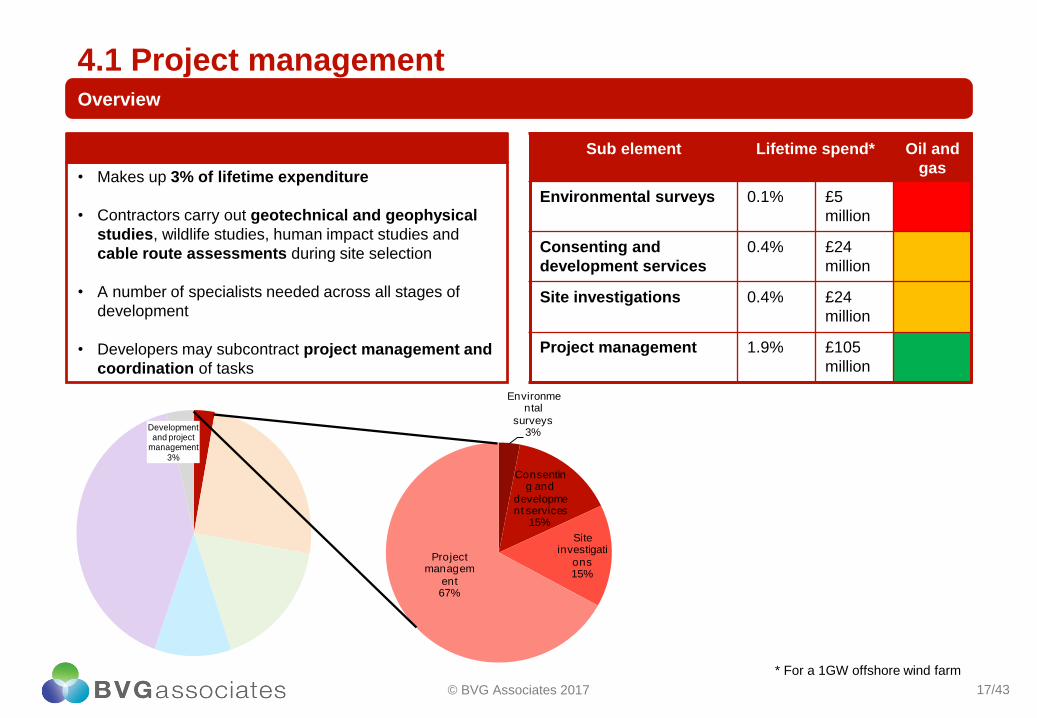
4.1 Project managementOverview
• Makes up 3% of lifetime expenditure
• Contractors carry out geotechnical and geophysical
studies, wildlife studies, human impact studies and
cable route assessments during site selection
• A number of specialists needed across all stages of
development
• Developers may subcontract project management and
coordination of tasks
© BVG Associates 2017
Sub element Lifetime spend* Oil and
gas
Environmental surveys 0.1% £5
million
Consenting and
development services
0.4% £24
million
Site investigations 0.4% £24
million
Project management 1.9% £105
million
* For a 1GW offshore wind farm
Environmental
surveys3%
Consenting and
development services
15%
Site investigati
ons15%
Project managem
ent67%
Development and project
management3%

18/43
4.1 Project managementOpportunities
• Text here
• Bullet list 2
• Bullet list 3
Case study
• Text here
• Bullet list 2
• Bullet list 3
Box header
© BVG Associates 2017
Criteria Comments
Oil and gas track record in
offshore wind
A number of companies with a background in oil and gas have carried out work in offshore
wind.
Oil and gas sector synergies Project management in the marine environment is similar in offshore wind and oil and gas.
The challenges of working in a harsh environment and the ensuing implications for HSE, for
example, mean that oil and gas companies are well placed for work in offshore wind.
Appetite from offshore wind Developers are aware that companies from oil and gas have world class project
management capabilities.
The market is well served in this area, but opportunities do exist for new entrants who
understand the challenges associated with operating in harsh environments.
Potential LCOE benefit from
new involvement by oil and
gas companies
Although developers are always looking for opportunities to run projects quicker and more
effectively, this is not an area where large cost reduction is expected.
Strong project management reduces project risk and will be a factor in cost of capital
calculations.
Size and timing of
investments by oil and gas
companies
Little investment will be required by oil and gas companies to diversify.
Size of the opportunity There is relatively low spend across a number of years so oil and gas companies need to
seek multiple projects to make participation in offshore wind viable.

19/43
4.2 TurbineOverview
• Turbine supply involves design, manufacture and
assembly of all electrical and mechanical components
• WTM assembles the final product using components
that are manufactured in-house or externally sourced
• No part of the turbine supply is graded as a strong
opportunity for oil and gas companies
• Oil and gas suppliers are competing with a supply chain
that has 20 years of offshore wind track-record
© BVG Associates 2017
Sub element Lifetime spend* Oil and
gas
Turbine assembly 1.1% £60
million
Blades 4.6% £255
million
Drivetrain 4.7% £260
million
Power conversion 7.5% £420
million
Large fabrications 1.1% £65
million
Towers 3.1% £175
million
Small components 2.7% £150
million
* For a 1GW offshore wind farm
Turbine assembly
4%
Blades18%
Drive train19%
Power conversion
30%
Large fabrications
5%
Towers13%
Small components
11%
Turbine25%
20/43
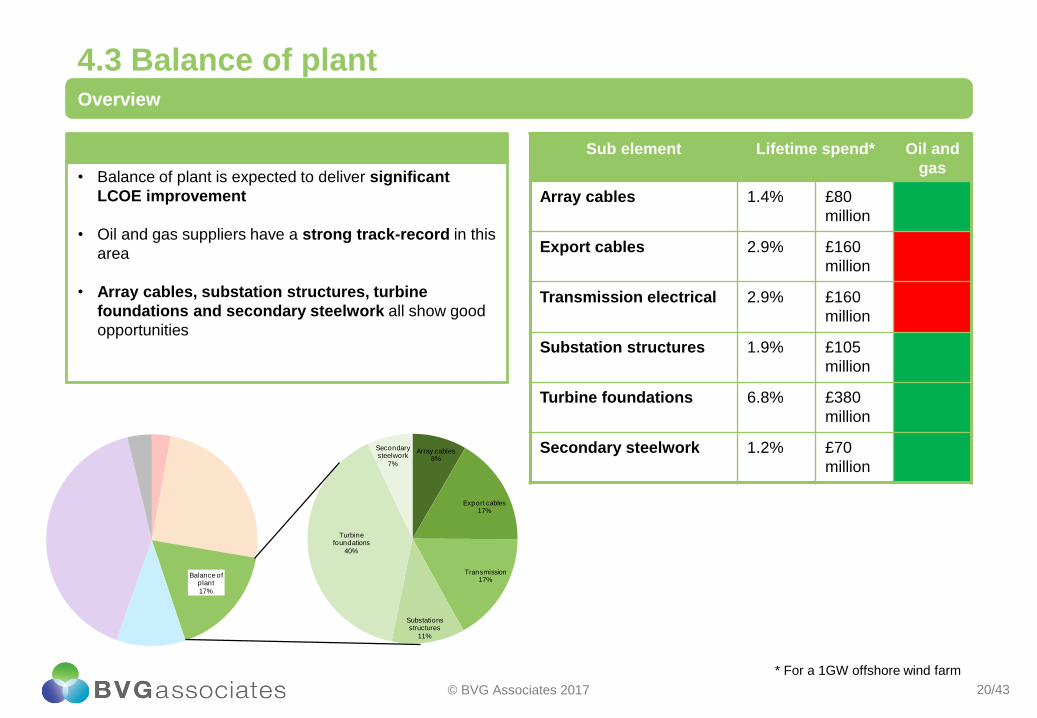
4.3 Balance of plantOverview
• Balance of plant is expected to deliver significant
LCOE improvement
• Oil and gas suppliers have a strong track-record in this
area
• Array cables, substation structures, turbine
foundations and secondary steelwork all show good
opportunities
© BVG Associates 2017
Sub element Lifetime spend* Oil and
gas
Array cables 1.4% £80
million
Export cables 2.9% £160
million
Transmission electrical 2.9% £160
million
Substation structures 1.9% £105
million
Turbine foundations 6.8% £380
million
Secondary steelwork 1.2% £70
million
* For a 1GW offshore wind farm
Array cables8%
Export cables17%
Transmission17%
Substations structures
11%
Turbine foundations
40%
Secondary steelwork
7%
Balance of plant
17%

21/43
4.3 Balance of plantArray cables
• Connect the turbines to each other and the offshore
substation
• Array cable and ancillary equipment demand within
offshore wind is well supported by companies with an oil
and gas background
© BVG Associates 2017

22/43
4.3 Balance of plantArray cables: Opportunities
• Text here
• Bullet list 2
• Bullet list 3
Case study
• Text here
• Bullet list 2
• Bullet list 3
Box header
© BVG Associates 2017
Criteria Comments
Oil and gas track record in
offshore wind
Oil and gas suppliers of ancillary equipment such as cable joints and terminations, cable
protection systems and buoyancy modules are winning business in offshore wind
All array cable suppliers are active in oil and gas
Oil and gas sector synergies Specific need for medium voltage cable testing, large storage capacity and roved jackets
Lower tier cable components such as connectors, terminations, hang-offs and cable
protection have strong synergies with the oil and gas sector
Appetite from offshore wind MV array cable market is already well served by a number of large cable manufacturers
There has been significant market consolidation.
Potential LCOE benefit from
new involvement by oil and
gas companies
Oil and gas cable expertise has the potential to reduce LCOE in areas such as cable
design, reliability and, for floating wind farms in particular, dynamic cables and flotation aids
Size and timing of
investments by oil and gas
companies
Developers view array cables as a commodity item and use competitive tenders for project
specific work packages. DONG uses a framework approach to standardise the cable-
foundation interface for projects
Size of the opportunity The majority of the value in this sub-element comes from the manufacture of the cable
cores

23/43
4.3 Balance of plantSubstation structures
• Offshore wind projects using 33kV with a capacity
larger than 100MW need a substation (or 300MW
if using 66kv)
• Developers may award an engineering,
procurement, construction and installation (EPCI)
contract to an electrical supplier
• Substations are made up of a number of sub-
elements including the platform, secondary steel,
architectural items and the foundation
• High voltage AC substations are used in near-
shore projects but are not generally suitable
beyond 50 miles of transmission
• Far-shore sites will need innovative AC solutions
or will require the introduction of high voltage DC
transmission systems
© BVG Associates 2017
24/43
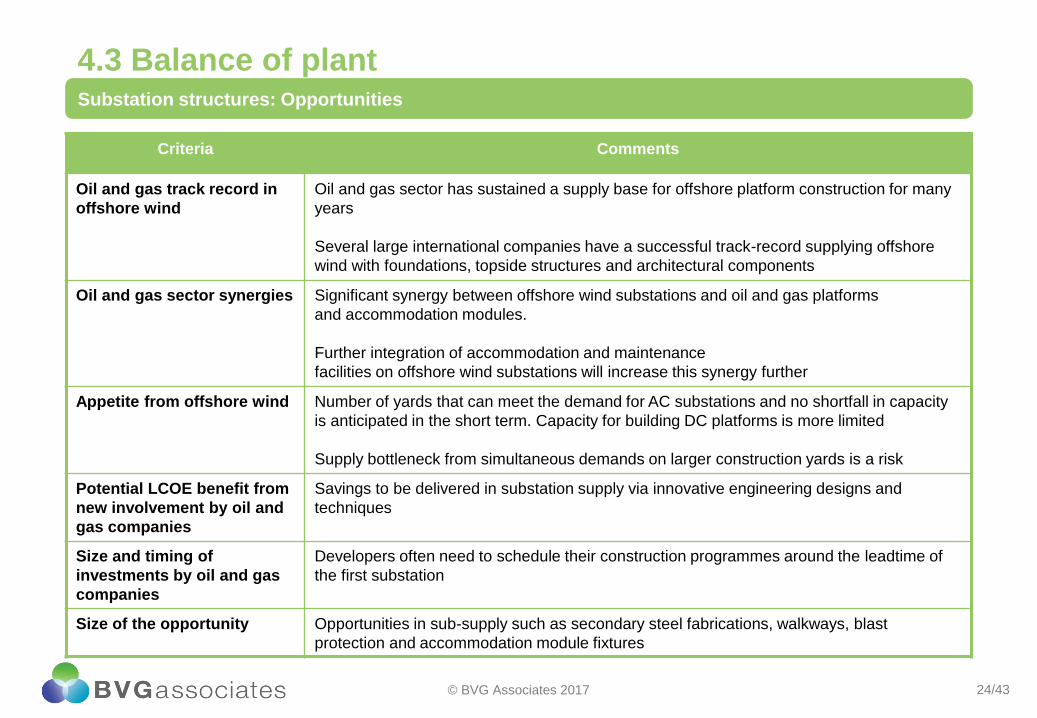
4.3 Balance of plantSubstation structures: Opportunities
• Text here
• Bullet list 2
• Bullet list 3
Case study
• Text here
• Bullet list 2
• Bullet list 3
Box header
© BVG Associates 2017
Criteria Comments
Oil and gas track record in
offshore wind
Oil and gas sector has sustained a supply base for offshore platform construction for many
years
Several large international companies have a successful track-record supplying offshore
wind with foundations, topside structures and architectural components
Oil and gas sector synergies Significant synergy between offshore wind substations and oil and gas platforms
and accommodation modules.
Further integration of accommodation and maintenance
facilities on offshore wind substations will increase this synergy further
Appetite from offshore wind Number of yards that can meet the demand for AC substations and no shortfall in capacity
is anticipated in the short term. Capacity for building DC platforms is more limited
Supply bottleneck from simultaneous demands on larger construction yards is a risk
Potential LCOE benefit from
new involvement by oil and
gas companies
Savings to be delivered in substation supply via innovative engineering designs and
techniques
Size and timing of
investments by oil and gas
companies
Developers often need to schedule their construction programmes around the leadtime of
the first substation
Size of the opportunity Opportunities in sub-supply such as secondary steel fabrications, walkways, blast
protection and accommodation module fixtures

25/43
4.3 Balance of plantTurbine foundations
• Turbine foundations represent a major part of total
CAPEX
• The technology is chosen based on site features,
such as water depth, seabed conditions and
turbine size
• Monopile: More than ¾ of all installed European
offshore wind projects to date have used steel
monopile foundations.
• Jacket: Jacket foundations are cross-braced,
welded, spaceframe structures
• Gravity-based: With concrete, steel and hybrid
options, gravity-base structures (GBSs) can be
assembled onshore and installed without the need
for piling
• Floating: Floating offshore wind provides
opportunities to exploit near-shore deep-water
sites at comparable cost of energy to sites using
fixed foundations
© BVG Associates 2017
Foundation technology in Europe
0
100
200
300
400
500
600
700
'10 '11 '12 '13 '14 '15 '16 '17 '18 '19 '20 '21 '22 '23 '24 '25
Num
ber o
f un
its
Year of foundation supply
Monopile Non-monopile steel Gravity based Floating
Source: BVG Associates
26/43
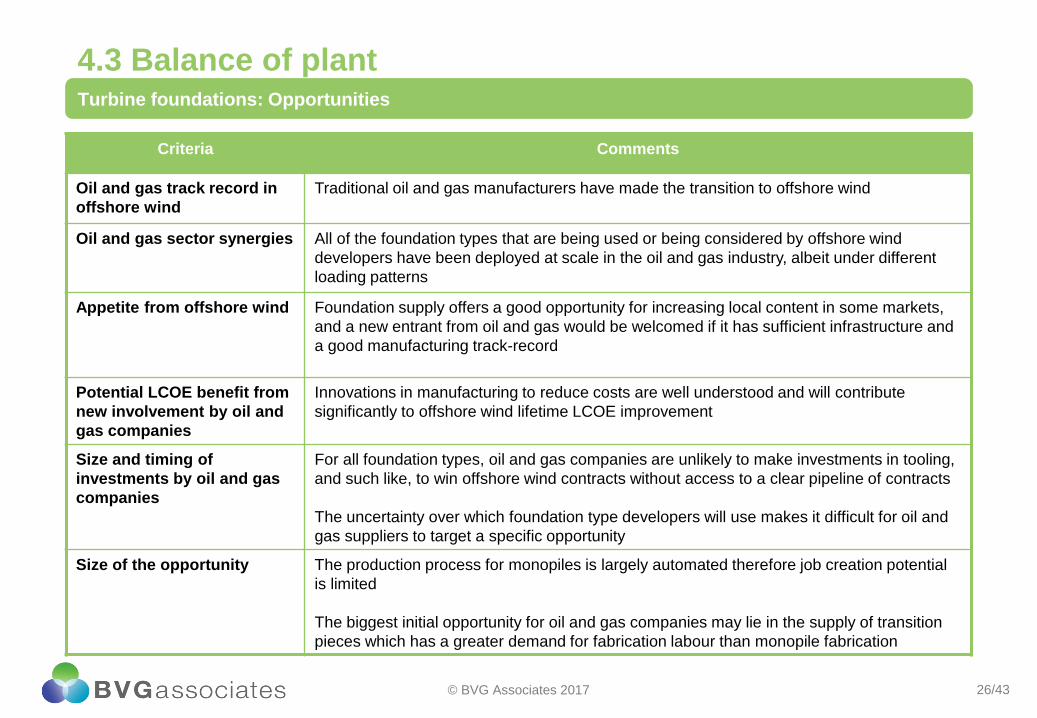
4.3 Balance of plantTurbine foundations: Opportunities
• Text here
• Bullet list 2
• Bullet list 3
Case study
• Text here
• Bullet list 2
• Bullet list 3
Box header
© BVG Associates 2017
Criteria Comments
Oil and gas track record in
offshore wind
Traditional oil and gas manufacturers have made the transition to offshore wind
Oil and gas sector synergies All of the foundation types that are being used or being considered by offshore wind
developers have been deployed at scale in the oil and gas industry, albeit under different
loading patterns
Appetite from offshore wind Foundation supply offers a good opportunity for increasing local content in some markets,
and a new entrant from oil and gas would be welcomed if it has sufficient infrastructure and
a good manufacturing track-record
Potential LCOE benefit from
new involvement by oil and
gas companies
Innovations in manufacturing to reduce costs are well understood and will contribute
significantly to offshore wind lifetime LCOE improvement
Size and timing of
investments by oil and gas
companies
For all foundation types, oil and gas companies are unlikely to make investments in tooling,
and such like, to win offshore wind contracts without access to a clear pipeline of contracts
The uncertainty over which foundation type developers will use makes it difficult for oil and
gas suppliers to target a specific opportunity
Size of the opportunity The production process for monopiles is largely automated therefore job creation potential
is limited
The biggest initial opportunity for oil and gas companies may lie in the supply of transition
pieces which has a greater demand for fabrication labour than monopile fabrication

27/43
4.3 Balance of plantSecondary steelwork
• Secondary steelwork covers the fabrication of small
components within the turbine tower, substation and
foundation
• A number of areas require secondary steel including
cable entry systems, boat landing systems, platforms
and rails, sacrificial anodes, air conditioning systems and
jacket pile sleeves
• Supply is often sub-contracted via competitive tenders
on a project-by-project basis
• There is no real requirement for manufacturers to have
coastal facilities as in many cases the components can
travel by road
• For large volumes, it is advantageous to have at least a
final assembly facility with good quayside access.
• Most secondary steel demand comes from the
foundation.
© BVG Associates 2017

28/43
4.3 Balance of plantSecondary steelwork
• Text here
• Bullet list 2
• Bullet list 3
Case study
• Text here
• Bullet list 2
• Bullet list 3
Box header
© BVG Associates 2017
Criteria Comments
Oil and gas track record in
offshore wind
In many cases, these secondary steel companies are active in several sectors, including
civil engineering, defence and industrial equipment
Oil and gas sector synergies A number of the standards and certifications for supplying offshore marine structures are
common.
Different load strength requirements for offshore wind structures lead to differences in some
areas, for example welding requirements
Further opportunities include the manufacture and supply of ancillary equipment such as
flanges, cable pull and protection equipment and access systems
Appetite from offshore wind Appetite for new entrants is limited; items to be supplied are viewed in the main as
commodity items and there are a large number of fabricators who are capable and willing to
supply
Potential LCOE benefit from
new involvement by oil and
gas companies
Secondary steel supply makes up a small portion of total lifetime spend and as raw material
makes up the bulk of the cost — there is limited LCOE contribution potential
Size and timing of
investments by oil and gas
companies
Oil and gas companies are unlikely to have to invest significantly in infrastructure
Size of the opportunity The lifetime spend as a proportion of an individual project is small, therefore larger
organisations may need to target multiple projects to justify any investment

29/43
4.4 Installation and commissioningOverview
• Few oil and gas companies have a track-record in
turbine and foundation installation
• Vessels used are now bespoke and often high-
specification jack-up vessels built in the Gulf states or
east Asia
• Main opportunities lie in installation equipment and
support services, to engineer efficient offshore
solutions for a range of installation activities
© BVG Associates 2017
Sub element Lifetime spend* Oil and
gas
Installation ports and
logistics
0.5% £30
million
Turbine and foundation
installation
4.4% £245
million
Cable installation 2.2% £120
million
Substation installation 0.4% £20
million
Installation equipment 1.0% £60
million
Installation support
services
1.6% £90
million
Onshore works 0.5% £30
million
* For a 1GW offshore wind farm
Installation ports and logistics
5%
Turbine and foundation
installation41%
Cable installation
21%
Substation installation
3%
Installation equipment
10%
Installation support services
15%
Onshore works
5%
Installation and commissioning
11%
30/43
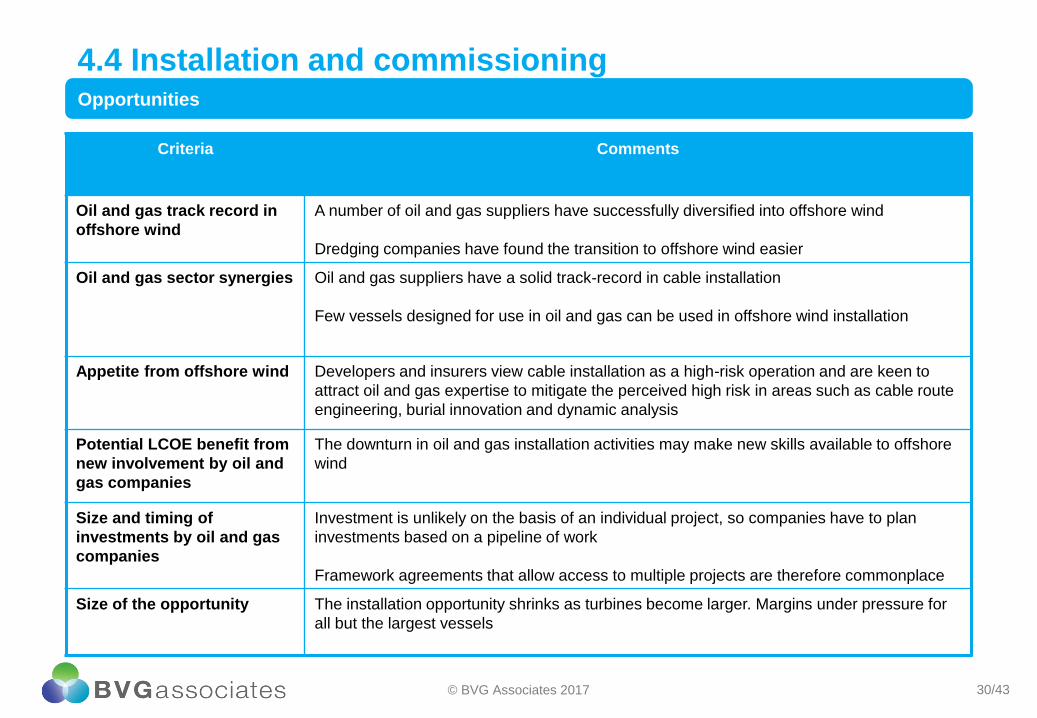
4.4 Installation and commissioningOpportunities
• Text here
• Bullet list 2
• Bullet list 3
Case study
• Text here
• Bullet list 2
• Bullet list 3
Box header
© BVG Associates 2017
Criteria Comments
Oil and gas track record in
offshore wind
A number of oil and gas suppliers have successfully diversified into offshore wind
Dredging companies have found the transition to offshore wind easier
Oil and gas sector synergies Oil and gas suppliers have a solid track-record in cable installation
Few vessels designed for use in oil and gas can be used in offshore wind installation
Appetite from offshore wind Developers and insurers view cable installation as a high-risk operation and are keen to
attract oil and gas expertise to mitigate the perceived high risk in areas such as cable route
engineering, burial innovation and dynamic analysis
Potential LCOE benefit from
new involvement by oil and
gas companies
The downturn in oil and gas installation activities may make new skills available to offshore
wind
Size and timing of
investments by oil and gas
companies
Investment is unlikely on the basis of an individual project, so companies have to plan
investments based on a pipeline of work
Framework agreements that allow access to multiple projects are therefore commonplace
Size of the opportunity The installation opportunity shrinks as turbines become larger. Margins under pressure for
all but the largest vessels
31/43
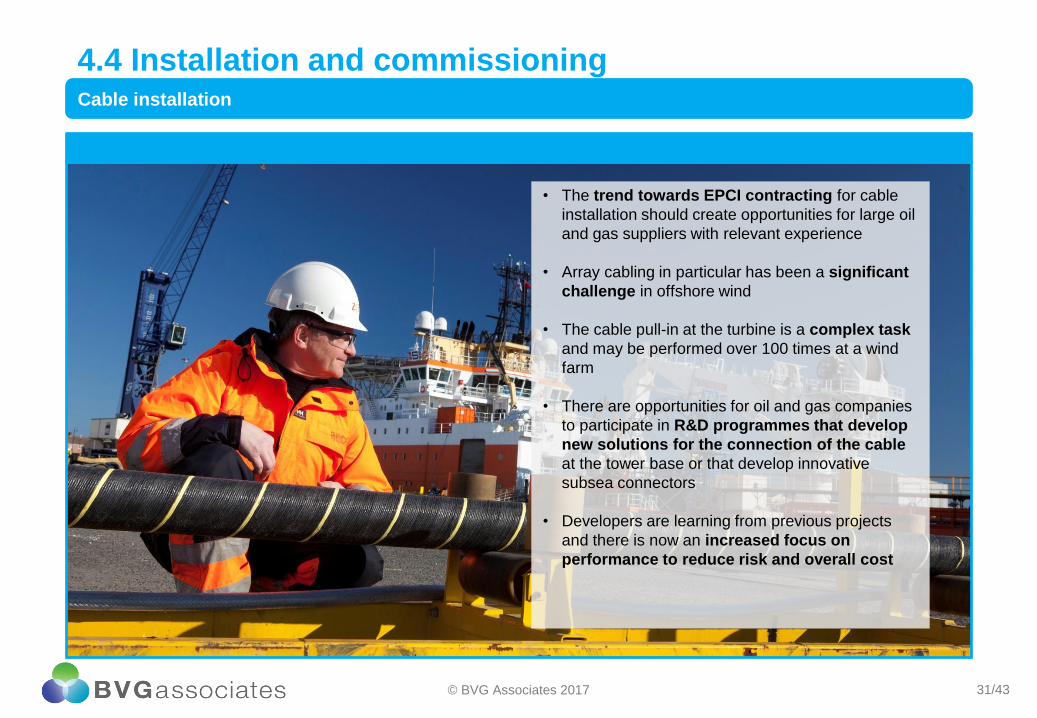
4.4 Installation and commissioningCable installation
© BVG Associates 2017
• The trend towards EPCI contracting for cable
installation should create opportunities for large oil
and gas suppliers with relevant experience
• Array cabling in particular has been a significant
challenge in offshore wind
• The cable pull-in at the turbine is a complex task
and may be performed over 100 times at a wind
farm
• There are opportunities for oil and gas companies
to participate in R&D programmes that develop
new solutions for the connection of the cable
at the tower base or that develop innovative
subsea connectors
• Developers are learning from previous projects
and there is now an increased focus on
performance to reduce risk and overall cost

32/43
4.4 Installation and commissioningCable installation: Opportunities
• Text here
• Bullet list 2
• Bullet list 3
Case study
• Text here
• Bullet list 2
• Bullet list 3
Box header
© BVG Associates 2017
Criteria Comments
Oil and gas track record in
offshore wind
Cable installation is a highly specialised and competitive market and some companies have
experienced financial difficulties or decided to exit from the offshore wind sector
Oil and gas sector synergies Oil and gas suppliers have a solid track-record in cable installation
One of the key areas in which new entrants would have to become familiar is the pull-in of
cables and the much larger geographical installation areas
Appetite from offshore wind Developers and insurers view cable installation as a high-risk operation and are keen to
attract oil and gas expertise to mitigate the perceived high risk in areas such as cable route
engineering, burial innovation and dynamic analysis
Potential LCOE benefit from
new involvement by oil and
gas companies
Opportunities for cost savings in cable installation are limited
The downturn in oil and gas installation activities may reduce vessel day-rates and this can
contribute benefit to offshore wind LCOE
Size and timing of
investments by oil and gas
companies
Investment is unlikely on the basis of an individual project, so companies have to plan
investments based on a pipeline of work
Framework agreements that allow access to multiple projects are therefore commonplace
Size of the opportunity Cable installation makes up a small part of lifetime spend and is concentrated across a
short period of time within the CAPEX life cycle

33/43
4.4 Installation and commissioningInstallation equipment
• Moving and loading components on the quayside
• Securing components in transit, including sea fastenings
and blade racks
• Handling and installing foundations, including piling
templates, pile handling tools, piling hammers and cable
installation equipment including carousels, tensioners,
remotely operated cable trenching and, burial tools and
cable retrieval tools, and
• Turbine installation, including cranes, yokes and hook
stabilisation tools, and turbine access systems
© BVG Associates 2017

34/43
4.4 Installation and commissioningInstallation equipment: Opportunities
• Text here
• Bullet list 2
• Bullet list 3
Case study
• Text here
• Bullet list 2
• Bullet list 3
Box header
© BVG Associates 2017
Criteria Comments
Oil and gas track record in
offshore wind
Oil and gas companies have been successful in supplying the offshore wind industry
Oil and gas sector synergies There are strong synergies because much of the equipment is bespoke and supplied in low
volumes
Cable installation equipment and services are sub-elements already supplied by
oil and gas companies
Appetite from offshore wind There is no shortage of suppliers, but the offshore wind sector would welcome innovative
solutions that can reduce vessel use and bring forward power generation
Potential LCOE benefit from
new involvement by oil and
gas companies
A significant area of promise is vibro-piling, where sub-marine noise levels can be
significantly reduced whilst piling speed and potentially lower fabrication costs can be
realised
Size and timing of
investments by oil and gas
companies
The lead time for most pieces of equipment can be accommodated within the project
lifecycle, although there has been strong demand for large piling hammers
Size of the opportunity The total available market is only a small percentage of CAPEX but a significant proportion
is accessible to oil and gas suppliers

35/43
4.4 Installation and commissioningInstallation support services
© BVG Associates 2017
• Cable pull-in
• Cable route clearance
• Certification
• Crew and safety vessels
• Diving
• Marine logistics
• Provision of personnel
• Port operations
• Subsea surveys
• Removing unexploded ordnance
• Responsibility for contracting these services can
lie with either the developer or the main
installation contractor

36/43
4.4 Installation and commissioningInstallation equipment: Opportunities
• Text here
• Bullet list 2
• Bullet list 3
Case study
• Text here
• Bullet list 2
• Bullet list 3
Box header
© BVG Associates 2017
Criteria Comments
Oil and gas track record in
offshore wind
Oil and gas companies have been successful in winning offshore wind installation service
work
Oil and gas sector synergies Oil and gas skills can be readily applied to offshore wind. An important challenge is how
best to adapt oil and gas best practice for the new sector. A key difference is the number
and area of offshore installations; oil and gas suppliers must clearly communicate how they
can evolve their services to meet this challenge
Appetite from offshore wind The offshore wind sector values the experience gained from oil and gas companies that can
understand and use best practice from actual experience servicing offshore wind
Potential LCOE benefit from
new involvement by oil and
gas companies
Oil and gas service innovations can reduce risk and installation times. Significant cost
savings can be made by reducing the time needed for expensive installation vessels
Size and timing of
investments by oil and gas
companies
Oil and gas companies may need to invest in new equipment but otherwise investments will
be in personnel and capacity to meet demand
Size of the opportunity The total available market is only a small percentage of CAPEX but a significant proportion
is accessible to oil and gas suppliers

37/43
4.5 Operation, maintenance and serviceOverview
• Average spend per MW will drop, gross spend to ramp dramatically to 2030
• Next generation sites will spend less on OMS per MW because:
• Larger turbines means a smaller number of numerical assets in each wind farm
• OMS strategies will be more accurately refined and efficiency of components will increase
© BVG Associates 2017
0
500
1,000
1,500
2,000
0
20
40
60
80
'15 '16 '17 '18 '19 '20 '21 '22 '23 '24 '25 '26 '27 '28 '29 '30
OM
S s
pen
d p
er year i
n E
uro
s (m
il)
Insta
lled c
apaci
ty (G
W)
Total install UK Total install EU
Annual UK OMS spend (Eum) Annual EU OMS spend (Eum)
Source: BVG Associates
38/43
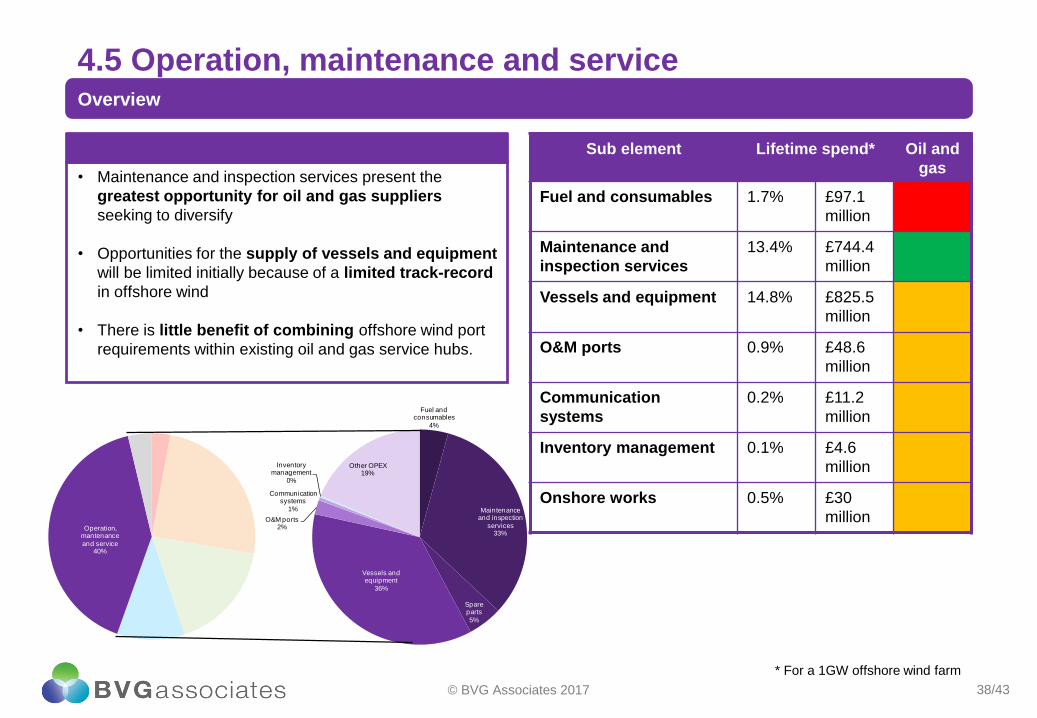
4.5 Operation, maintenance and serviceOverview
• Maintenance and inspection services present the
greatest opportunity for oil and gas suppliers
seeking to diversify
• Opportunities for the supply of vessels and equipment
will be limited initially because of a limited track-record
in offshore wind
• There is little benefit of combining offshore wind port
requirements within existing oil and gas service hubs.
© BVG Associates 2017
Sub element Lifetime spend* Oil and
gas
Fuel and consumables 1.7% £97.1
million
Maintenance and
inspection services
13.4% £744.4
million
Vessels and equipment 14.8% £825.5
million
O&M ports 0.9% £48.6
million
Communication
systems
0.2% £11.2
million
Inventory management 0.1% £4.6
million
Onshore works 0.5% £30
million
* For a 1GW offshore wind farm
Fuel and consumables
4%
Maintenance and inspection
services33%
Spare parts
5%
Vessels and equipment
36%
O&M ports2%
Communication systems
1%
Inventory management
0%
Other OPEX19%
Operation, mantenance
and service40%
39/43
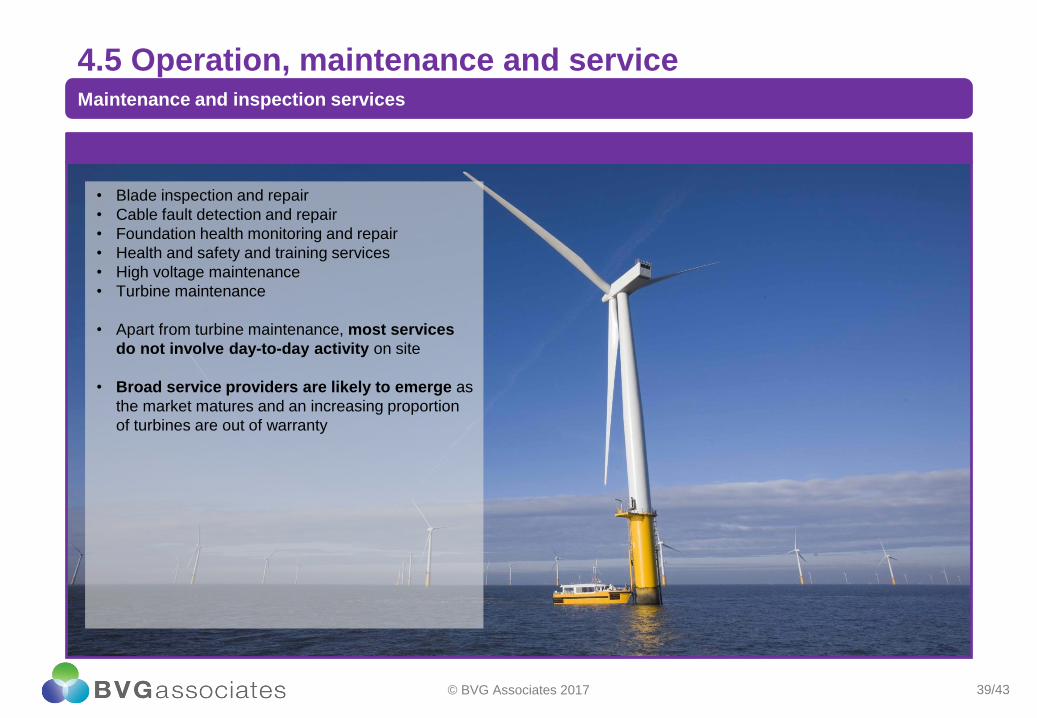
4.5 Operation, maintenance and serviceMaintenance and inspection services
• Blade inspection and repair
• Cable fault detection and repair
• Foundation health monitoring and repair
• Health and safety and training services
• High voltage maintenance
• Turbine maintenance
• Apart from turbine maintenance, most services
do not involve day-to-day activity on site
• Broad service providers are likely to emerge as
the market matures and an increasing proportion
of turbines are out of warranty
© BVG Associates 2017

40/43
4.5 Operation, maintenance and serviceMaintenance and inspection services: Opportunities
• Text here
• Bullet list 2
• Bullet list 3
Case study
• Text here
• Bullet list 2
• Bullet list 3
Box header
© BVG Associates 2017
Criteria Comments
Oil and gas track record in
offshore wind
Oil and gas suppliers have had success in maintenance and inspection services
Oil and gas sector synergies Oil and gas suppliers have a vast amount of experience in maintaining assets in the North
Sea and synergies in terms of defect detection, planned maintenance and asset repair are
extremely high
Oil and gas offshore safety standards and maintenance practices can be transferrable to
offshore wind
A strong oil and gas service supply chain has been developed over a number of years, and
a number of specialist disciplines are highly transferrable
Appetite from offshore wind Developers may look to take in-house or outsource to cheaper third party supply partners in
the future, and oil and gas suppliers have a strong track-record in this area
Potential LCOE benefit from
new involvement by oil and
gas companies
Offshore wind asset uptime is of primary importance, therefore efficient servicing and
innovative repair techniques can contribute significantly to LCOE reduction
Innovative approaches welcomed by offshore wind asset owners
Size and timing of
investments by oil and gas
companies
Bespoke investment for offshore wind is small and capacity can be created incrementally on
a short lead time as contracts for a particular project are secured
Size of the opportunity Lifetime spend is high and over 25 years for a particular project

41/43
5. Challenges to diversificationUnderstand core competence, address supply gaps in offshore wind seeking highest LCOE savings
© BVG Associates 2017
Lack of
track
record
Risk-
adverse
investors
Cost
competitive
ness
Contracts
(lump sum
vs fixed
price)
Warranties
and asset
uptime
linked
reward
Target
multiple
projects
Long-term
OPEX
focus high
local
contentFloating wind
high O&G
structure
synergy
Disruptive
innovation /
cost
competitive
Understand
differences
with clear
strategy

42/43
4. Oil and gas diversification
• Diversification can be a great business strategy - a
targeted move into a new sector can spread risk, generate
new revenue and reduce unit costs.
• Key to successful diversification - ensure there is
capability overlap between “legacy” and “new “ industry.
• The oil & gas overlap - offshore wind open to suppliers
from all sectors but capability correlation between offshore
wind and oil and gas is naturally very high.
• Two-way learning - processes and innovative thinking
developed over decades in oil and gas can be transferred
to offshore wind / rapid cost reduction, standardisation
and faster deployment techniques in offshore wind can
benefit oil and gas.
© BVG Associates 2017

43/43
Thank you
BVG Associates Ltd
The Blackthorn Centre
Purton Road
Cricklade, Swindon
SN6 6HY UK
tel +44 (0) 1793 752 308
@bvgassociates
www.bvgassociates.com
This presentation and its content is copyright of BVG Associates Limited - © BVG Associates 2017. All rights are reserved.
Any redistribution or reproduction of part or all of the contents of this presentation in any form is prohibited other than the following:
• You may print or download to a local hard disk extracts for your personal and non-commercial use only.
• You may copy the content to individual third parties for their personal use, but only if you acknowledge BVG Associates as the source
of the material.
You may not, except with our express written permission, distribute or commercially exploit the content.
© BVG Associates 2017
Tel: +44 1793 799 034
Mob: +44 7984 096 007
Coming soon….
BVG Associates report on
offshore wind opportunities
for Norwegian supply chain..