Embed Size (px)
Citation preview
1IEA 2019. All rights reserved.IEA 2019. All rights reserved.
Oil 2019 – Analysis and Forecast to 2024Neil Atkinson, Kristine PetrosyanTokyo, 26 April 2019, The Institute of Energy Economics, Japan
IEA
IEEJ:April 2019 © IEEJ2019

2IEA 2019. All rights reserved. 2IEA 2019. All rights reserved.
Oil 2019Analysis and Forecast to 2024
IEEJ:April 2019 © IEEJ2019
3IEA 2019. All rights reserved.
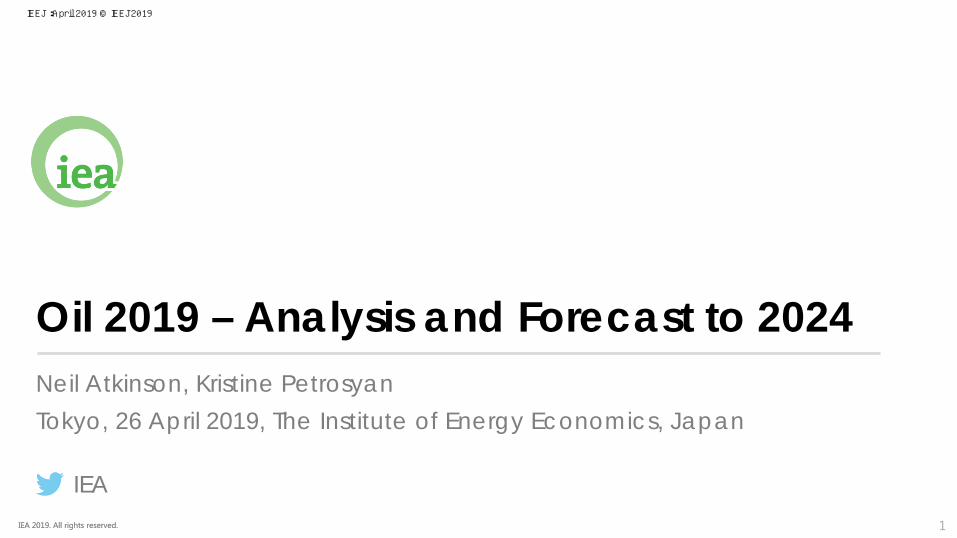
China slowdown reflects structural shift in the economy and environmental policies. Middle East fuel oil demand boosted after IMO 2020. India growth robust: similar to China by 2024.
World oil demand growth easing
World oil demand growth (y-o-y change)
-0.2
0.0
0.2
0.4
0.6
0.8
1.0
1.2
1.4
1.6
2018 2019 2020 2021 2022 2023 2024
mb/d
Rest of the world
Middle East
India
China
IEEJ:April 2019 © IEEJ2019
4IEA 2019. All rights reserved.
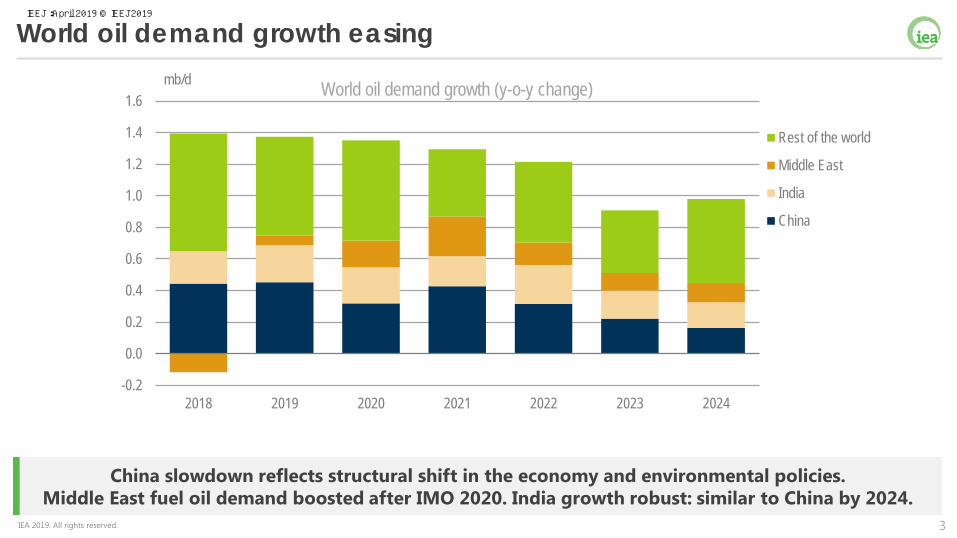
While EVs are in the headlines, electric buses and LNG trucks replace larger volume of oil demand
China’s oil demand transformed by alternative fuels
0
20
40
60
80
100
120
01,0002,0003,0004,0005,0006,0007,0008,0009,000
2012 2013 2014 2015 2016 2017 2018
kb/d1 000 Vehicles
China NGVs China E Cars Gasoline displaced (Right)
0
50
100
150
200
250
300
350
400
0100200300400500600700800900
2012 2013 2014 2015 2016 2017 2018
kb/d1 000 Vehicles
LNG trucks Electric buses Diesel displaced (Right)
Passenger cars vs Trucks and buses
IEEJ:April 2019 © IEEJ2019
5IEA 2019. All rights reserved.
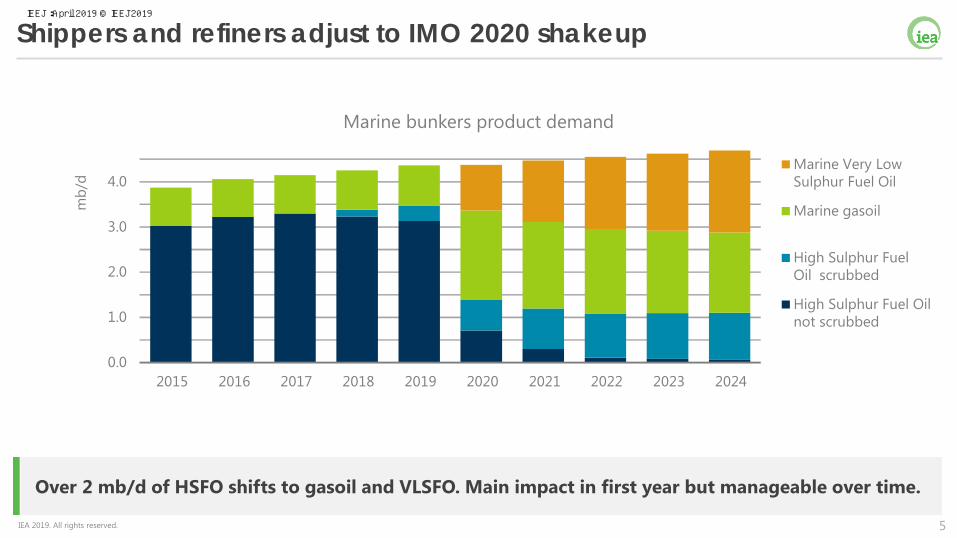
Over 2 mb/d of HSFO shifts to gasoil and VLSFO. Main impact in first year but manageable over time.
Shippers and refiners adjust to IMO 2020 shakeup
0.0
1.0
2.0
3.0
4.0
2015 2016 2017 2018 2019 2020 2021 2022 2023 2024
mb/
d
Marine Very Low Sulphur Fuel Oil
Marine gasoil
High Sulphur Fuel Oil scrubbed
High Sulphur Fuel Oil not scrubbed
Marine bunkers product demand
IEEJ:April 2019 © IEEJ2019
6IEA 2019. All rights reserved.
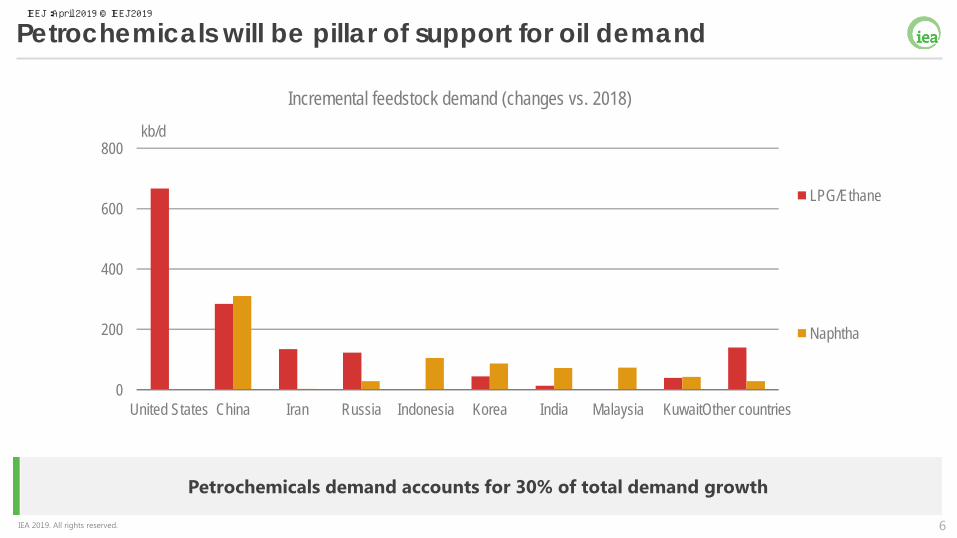
Petrochemicals demand accounts for 30% of total demand growth
Petrochemicals will be pillar of support for oil demand
0
200
400
600
800
United States China Iran Russia Indonesia Korea India Malaysia KuwaitOther countries
kb/d
Incremental feedstock demand (changes vs. 2018)
LPG/Ethane
Naphtha
IEEJ:April 2019 © IEEJ2019
7IEA 2019. All rights reserved.
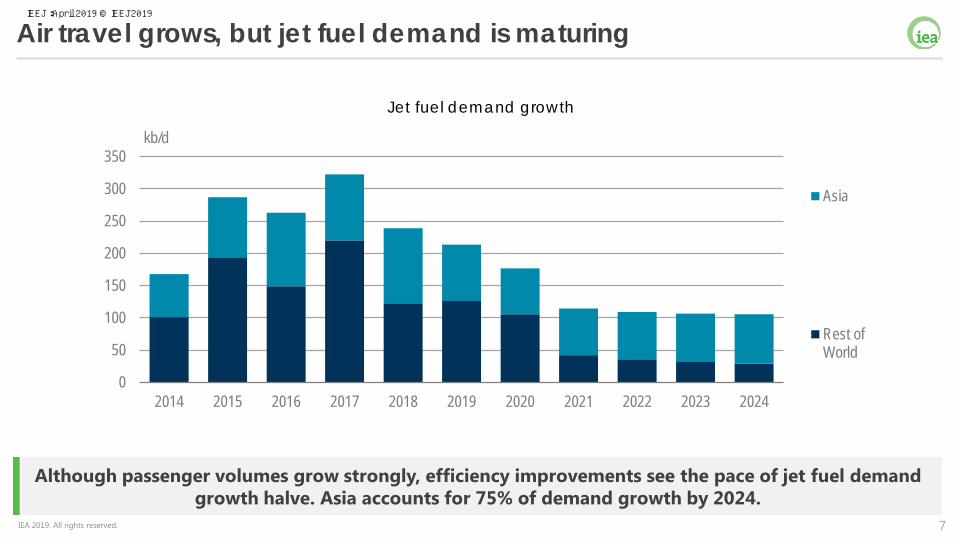
Although passenger volumes grow strongly, efficiency improvements see the pace of jet fuel demand growth halve. Asia accounts for 75% of demand growth by 2024.
Jet fuel demand growth
Air travel grows, but jet fuel demand is maturing
0
50
100
150
200
250
300
350
2014 2015 2016 2017 2018 2019 2020 2021 2022 2023 2024
kb/d
Asia
Rest ofWorld
IEEJ:April 2019 © IEEJ2019
8IEA 2019. All rights reserved.
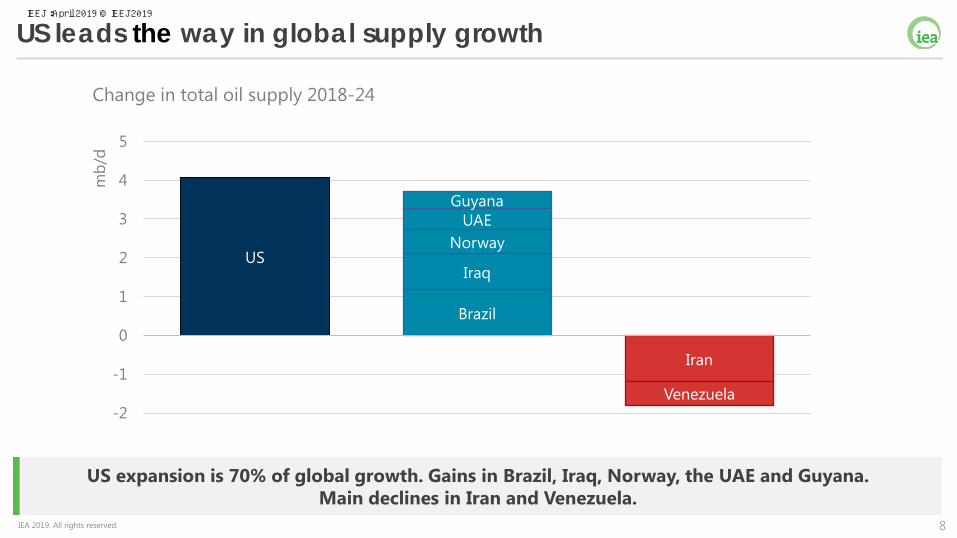
US expansion is 70% of global growth. Gains in Brazil, Iraq, Norway, the UAE and Guyana. Main declines in Iran and Venezuela.
US leads the way in global supply growth
Change in total oil supply 2018-24
US
Brazil
Iraq
NorwayUAE
Guyana
Iran
Venezuela-2
-1
0
1
2
3
4
5
mb/
d
IEEJ:April 2019 © IEEJ2019
9IEA 2019. All rights reserved.
0.0
2.0
4.0
6.0
8.0
10.0
12.0
2010 2011 2012 2013 2014 2015 2016 2017 2018 2019 2020 2021 2022 2023 2024 2025
mb/d
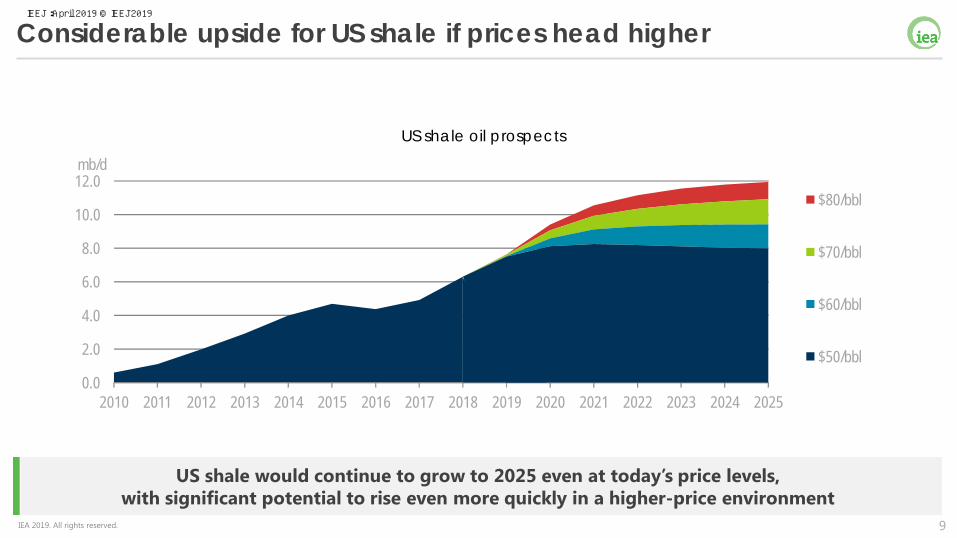
Considerable upside for US shale if prices head higher
US shale would continue to grow to 2025 even at today’s price levels,with significant potential to rise even more quickly in a higher-price environment
$80/bbl
$70/bbl
$60/bbl
$50/bbl
US shale oil prospects
IEEJ:April 2019 © IEEJ2019
10IEA 2019. All rights reserved.
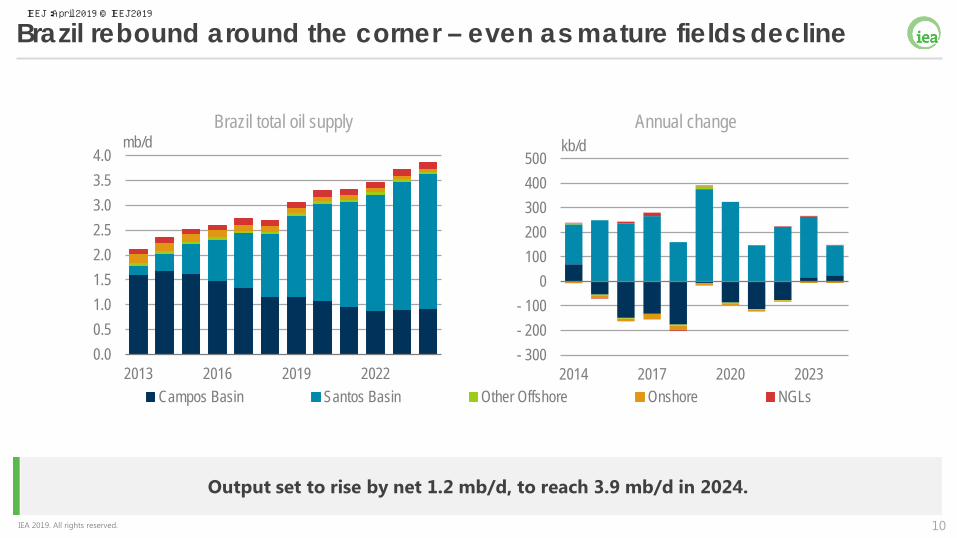
Brazil rebound around the corner – even as mature fields decline
Output set to rise by net 1.2 mb/d, to reach 3.9 mb/d in 2024.
0.00.51.01.52.02.53.03.54.0
2013 2016 2019 2022
mb/d
Campos Basin Santos Basin Other Offshore Onshore NGLs
- 300- 200- 100
0 100 200 300 400 500
2014 2017 2020 2023
kb/dBrazil total oil supply Annual change
IEEJ:April 2019 © IEEJ2019
11IEA 2019. All rights reserved.
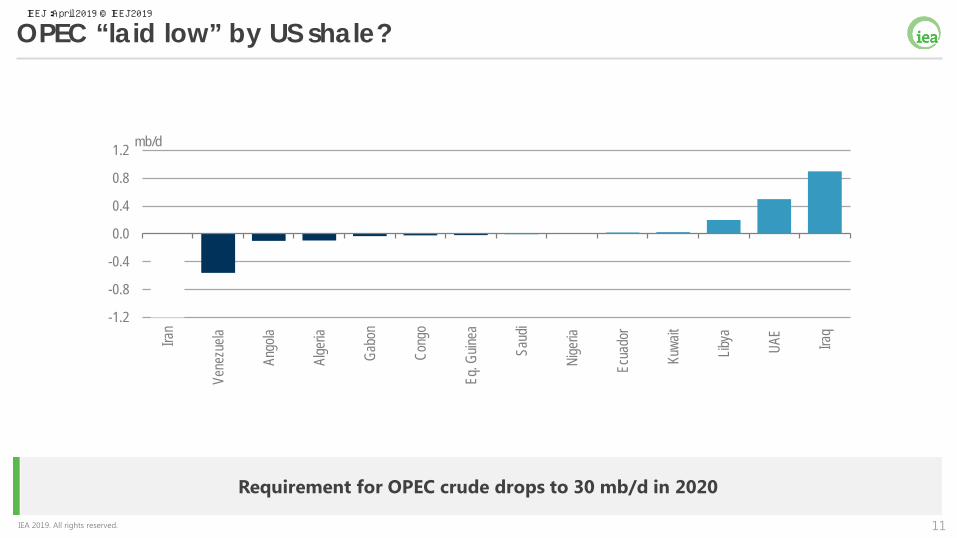
OPEC “laid low” by US shale?
Requirement for OPEC crude drops to 30 mb/d in 2020
-1.2
-0.8
-0.4
0.0
0.4
0.8
1.2Ira
n
Vene
zuela
Ango
la
Alge
ria
Gabo
n
Cong
o
Eq. G
uinea
Saud
i
Nige
ria
Ecua
dor
Kuwa
it
Libya
UAE
Iraq
mb/d
IEEJ:April 2019 © IEEJ2019
12IEA 2019. All rights reserved.
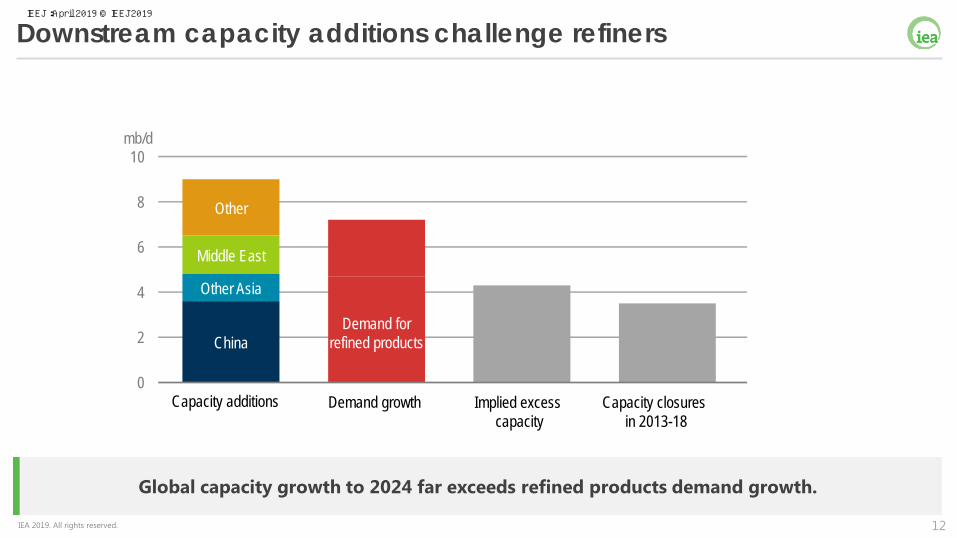
Downstream capacity additions challenge refiners
Global capacity growth to 2024 far exceeds refined products demand growth.
China
Other Asia
Middle East
Other
0
2
4
6
8
10
Capacity additions Demand growth Implied excess capacity
Capacity closuresin 2013-18
mb/d
Demand for refined products
IEEJ:April 2019 © IEEJ2019
13IEA 2019. All rights reserved.
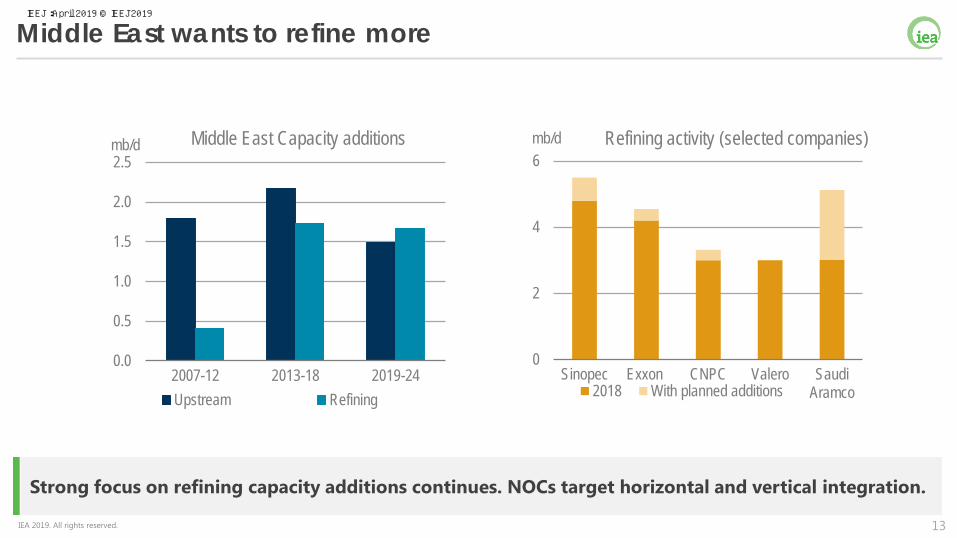
Strong focus on refining capacity additions continues. NOCs target horizontal and vertical integration.
Middle East wants to refine more
0.0
0.5
1.0
1.5
2.0
2.5
2007-12 2013-18 2019-24
mb/d Middle East Capacity additions
Upstream Refining
0
2
4
6
Sinopec Exxon CNPC Valero SaudiAramco
mb/d Refining activity (selected companies)
2018 With planned additions
IEEJ:April 2019 © IEEJ2019
14IEA 2019. All rights reserved.
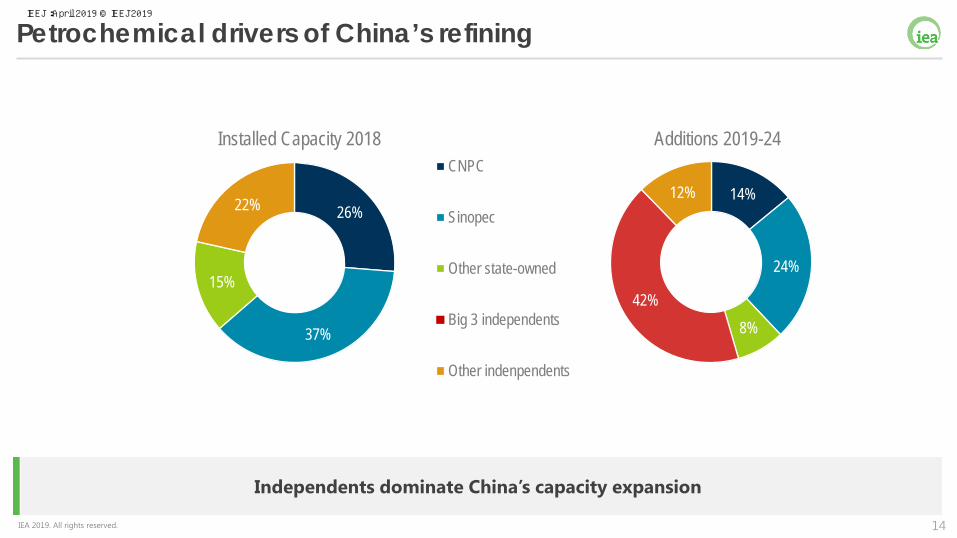
Independents dominate China’s capacity expansion
Petrochemical drivers of China’s refining
26%
37%
15%
22%
Installed Capacity 2018CNPC
Sinopec
Other state-owned
Big 3 independents
Other indenpendents
14%
24%
8%42%
12%
Additions 2019-24
IEEJ:April 2019 © IEEJ2019
15IEA 2019. All rights reserved.
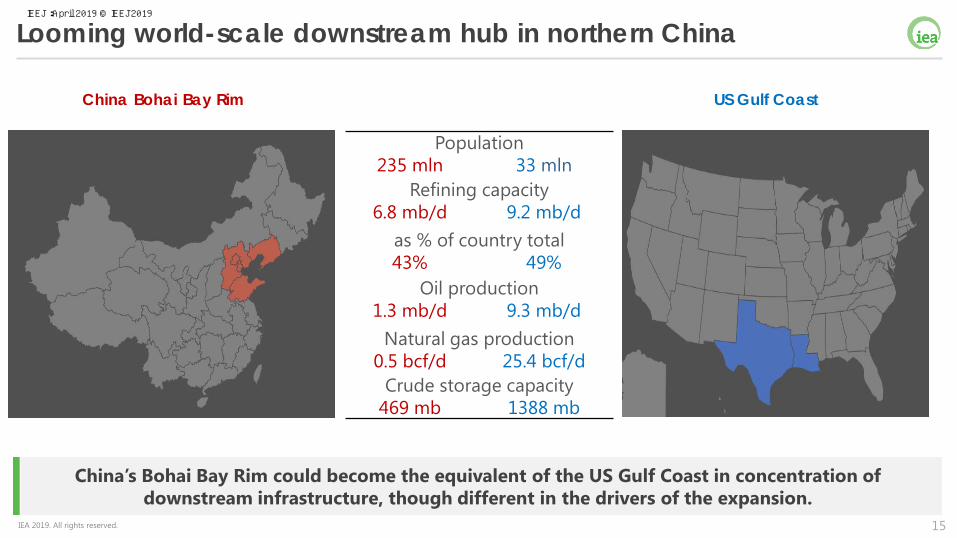
China’s Bohai Bay Rim could become the equivalent of the US Gulf Coast in concentration of downstream infrastructure, though different in the drivers of the expansion.
Looming world-scale downstream hub in northern China
China Bohai Bay Rim US Gulf Coast
Population235 mln 33 mln
Refining capacity6.8 mb/d 9.2 mb/d
as % of country total43% 49%
Oil production1.3 mb/d 9.3 mb/d
Natural gas production0.5 bcf/d 25.4 bcf/d
Crude storage capacity469 mb 1388 mb
IEEJ:April 2019 © IEEJ2019
16IEA 2019. All rights reserved.
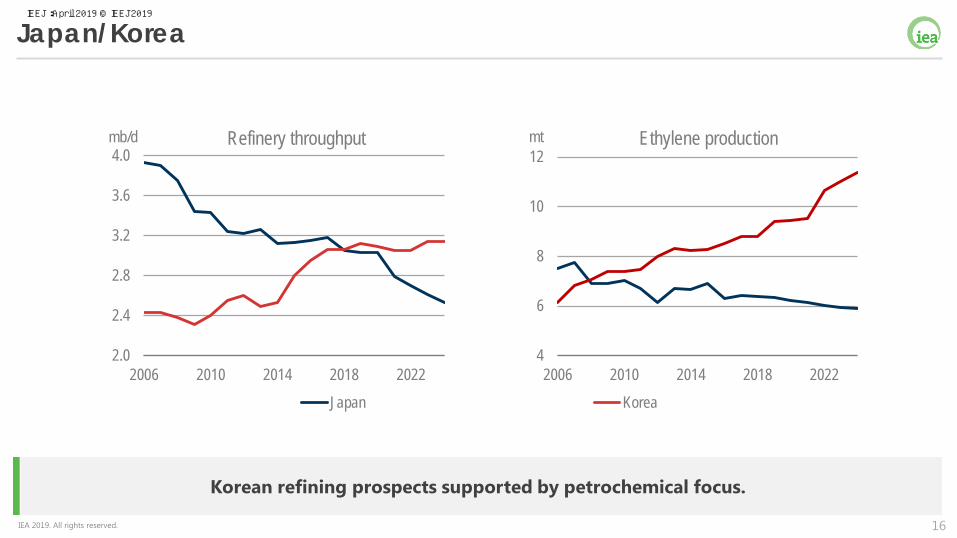
Korean refining prospects supported by petrochemical focus.
Japan/Korea
2.0
2.4
2.8
3.2
3.6
4.0
2006 2010 2014 2018 2022
mb/d Refinery throughput
Japan Korea
4
6
8
10
12
2006 2010 2014 2018 2022
mt Ethylene production
IEEJ:April 2019 © IEEJ2019
17IEA 2019. All rights reserved.
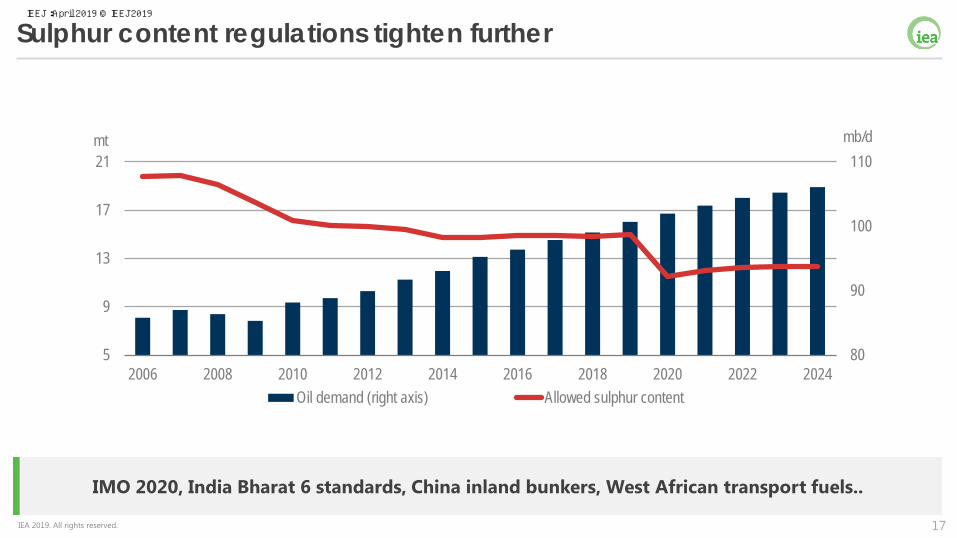
IMO 2020, India Bharat 6 standards, China inland bunkers, West African transport fuels..
Sulphur content regulations tighten further
80
90
100
110
5
9
13
17
21
2006 2008 2010 2012 2014 2016 2018 2020 2022 2024
mt
Oil demand (right axis) Allowed sulphur content
mb/d
IEEJ:April 2019 © IEEJ2019
18IEA 2019. All rights reserved.
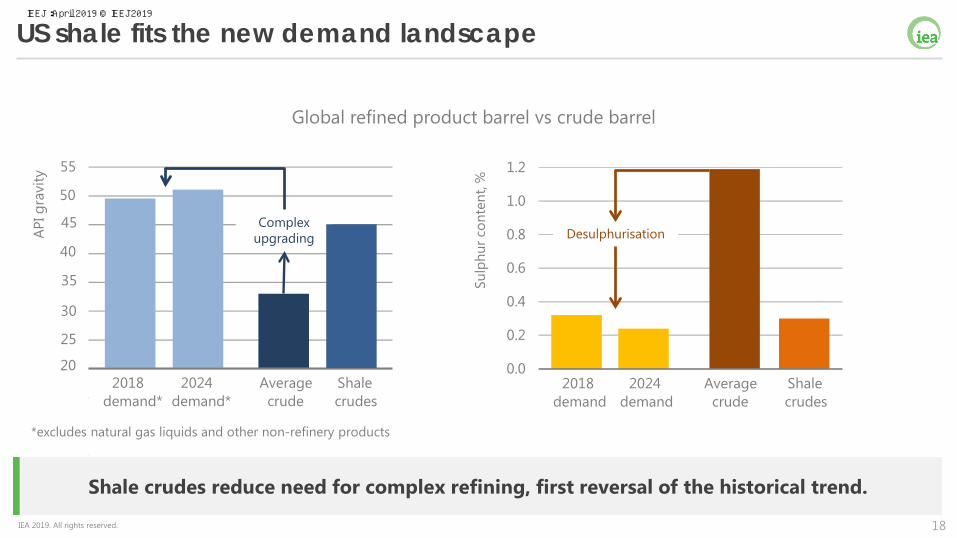
Shale crudes reduce need for complex refining, first reversal of the historical trend.
US shale fits the new demand landscape
0.0
0.2
0.4
0.6
0.8
1.0
1.2
2018demand
2024demand
Averagecrude
Shalecrudes
Sulp
hur c
onte
nt, %
20
25
30
35
40
45
50
55
2024demand*
Averagecrude
Shalecrudes
APIg
ravi
ty
2018demand*
Complex upgrading Desulphurisation
*excludes natural gas liquids and other non-refinery products
Global refined product barrel vs crude barrel
IEEJ:April 2019 © IEEJ2019
19IEA 2019. All rights reserved.
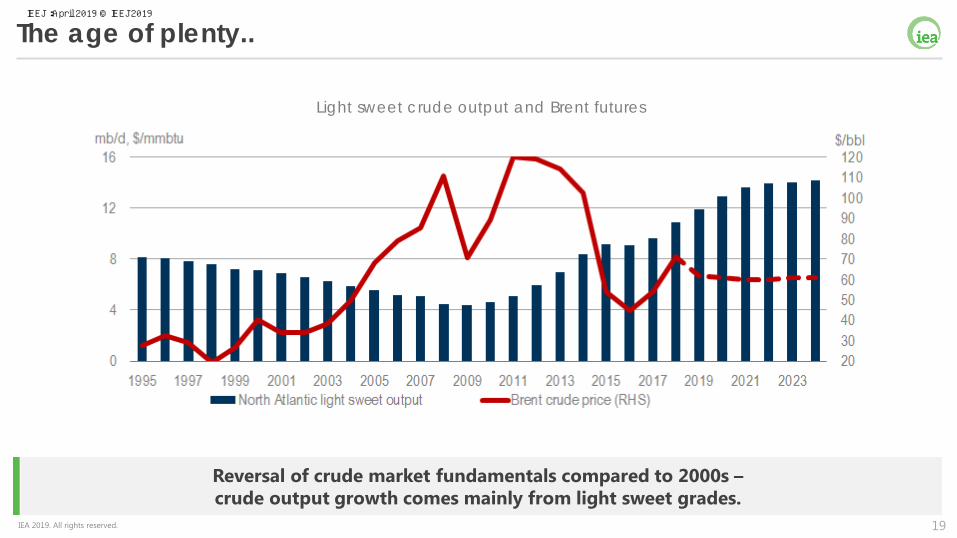
Reversal of crude market fundamentals compared to 2000s –crude output growth comes mainly from light sweet grades.
The age of plenty..
Light sweet crude output and Brent futures
IEEJ:April 2019 © IEEJ2019
20IEA 2019. All rights reserved.
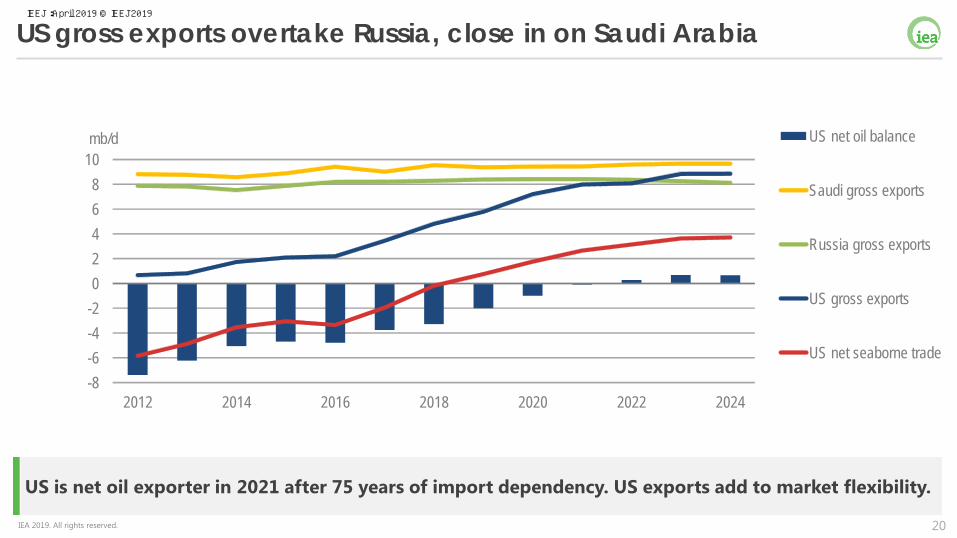
US gross exports overtake Russia, close in on Saudi Arabia
US is net oil exporter in 2021 after 75 years of import dependency. US exports add to market flexibility.
-8-6-4-202468
10
2012 2014 2016 2018 2020 2022 2024
mb/d US net oil balance
Saudi gross exports
Russia gross exports
US gross exports
US net seaborne trade
IEEJ:April 2019 © IEEJ2019
21IEA 2019. All rights reserved.
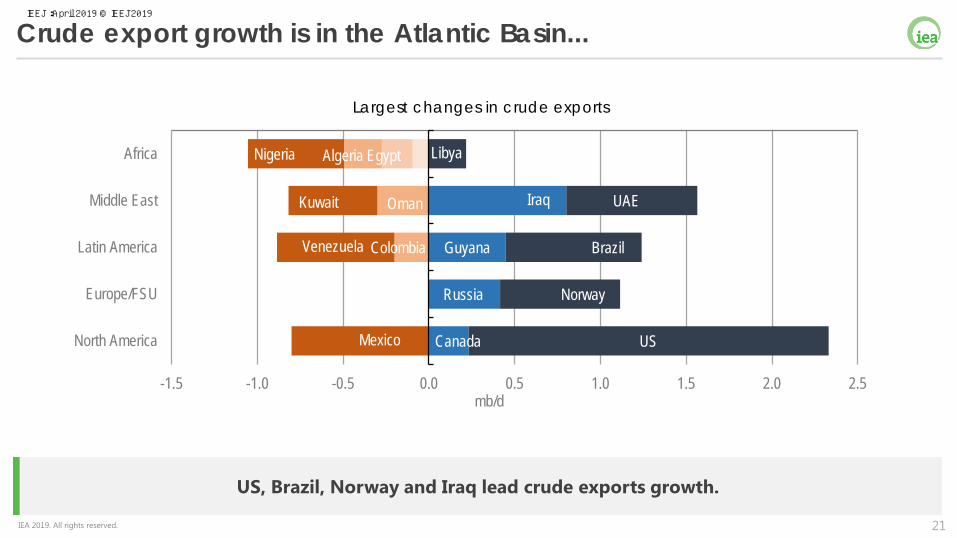
US, Brazil, Norway and Iraq lead crude exports growth.
Crude export growth is in the Atlantic Basin...
Algeria
Oman
Nigeria
Kuwait
Venezuela
Mexico
Egypt
UAE
Colombia
Russia
Canada
Guyana
Libya
Iraq
Brazil
Norway
US
-1.5 -1.0 -0.5 0.0 0.5 1.0 1.5 2.0 2.5
Africa
Middle East
Latin America
Europe/FSU
North America
mb/d
Largest changes in crude exports
IEEJ:April 2019 © IEEJ2019
22IEA 2019. All rights reserved.
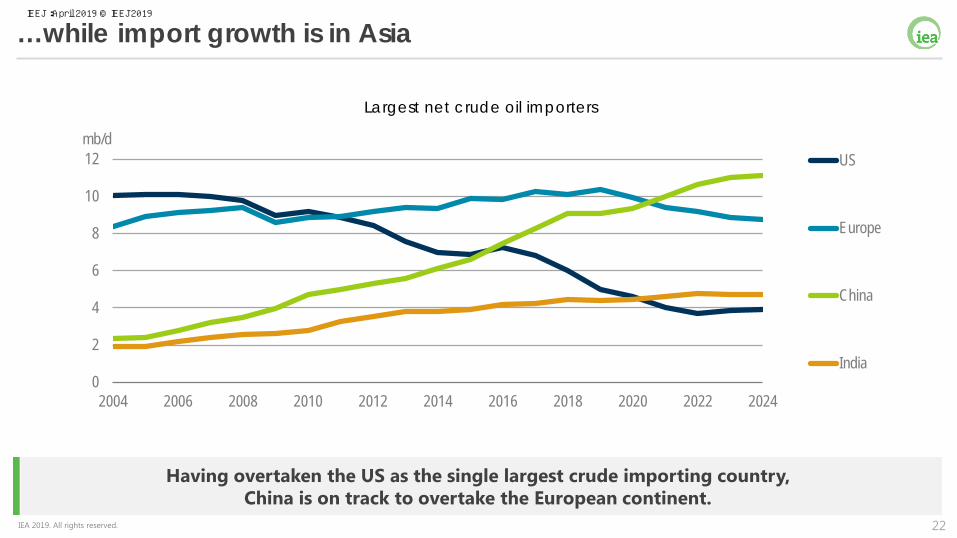
Having overtaken the US as the single largest crude importing country, China is on track to overtake the European continent.
…while import growth is in Asia
0
2
4
6
8
10
12
2004 2006 2008 2010 2012 2014 2016 2018 2020 2022 2024
mb/dUS
Europe
China
India
Largest net crude oil importers
IEEJ:April 2019 © IEEJ2019
23IEA 2019. All rights reserved.
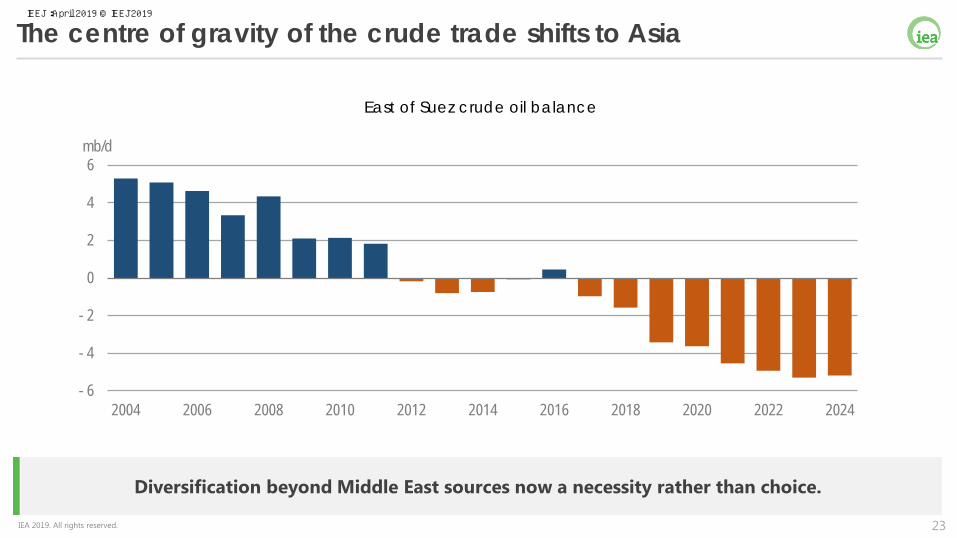
Diversification beyond Middle East sources now a necessity rather than choice.
The centre of gravity of the crude trade shifts to Asia
East of Suez crude oil balance
- 6
- 4
- 2
0
2
4
6
2004 2006 2008 2010 2012 2014 2016 2018 2020 2022 2024
mb/d
IEEJ:April 2019 © IEEJ2019
24IEA 2019. All rights reserved.
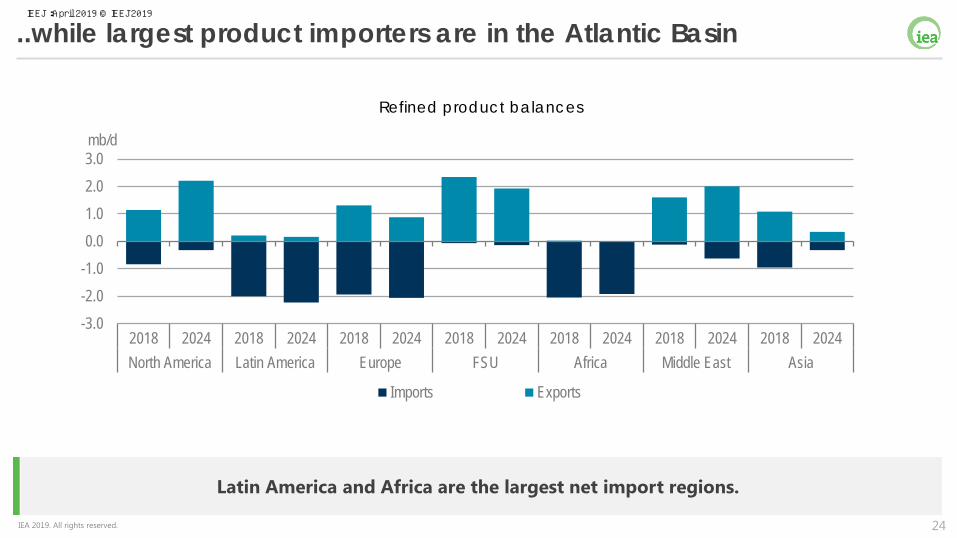
Latin America and Africa are the largest net import regions.
..while largest product importers are in the Atlantic Basin
-3.0-2.0-1.00.01.02.03.0
2018 2024 2018 2024 2018 2024 2018 2024 2018 2024 2018 2024 2018 2024North America Latin America Europe FSU Africa Middle East Asia
mb/d
Imports Exports
Refined product balances
IEEJ:April 2019 © IEEJ2019
25IEA 2019. All rights reserved.
Conclusions
• The United States to provide 70% of the increase in global oil supply over next five years, with Iraq, Brazil, Norway & Guyana other major contributors
• Global oil demand growth to slow modestly, but still average 1.2 mb/d, with petrochemicals a key driver
• The oil industry needs to do more to cut its carbon footprint, including on flaring & methane leakages, and use of CCUS, EOR, hydrogen & renewables
• While there may be teething problems, refiners & shippers are relatively well prepared to respond to the new IMO bunker fuel regulations
• The 2nd wave of the US shale revolution is coming – it will shake-up international oil & gas trade flows, with profound implications for the geopolitics of energy
IEEJ:April 2019 © IEEJ2019
26IEA 2019. All rights reserved. 26IEA 2019. All rights reserved.
Oil Market ReportApril 2019
IEEJ:April 2019 © IEEJ2019
27IEA 2019. All rights reserved.
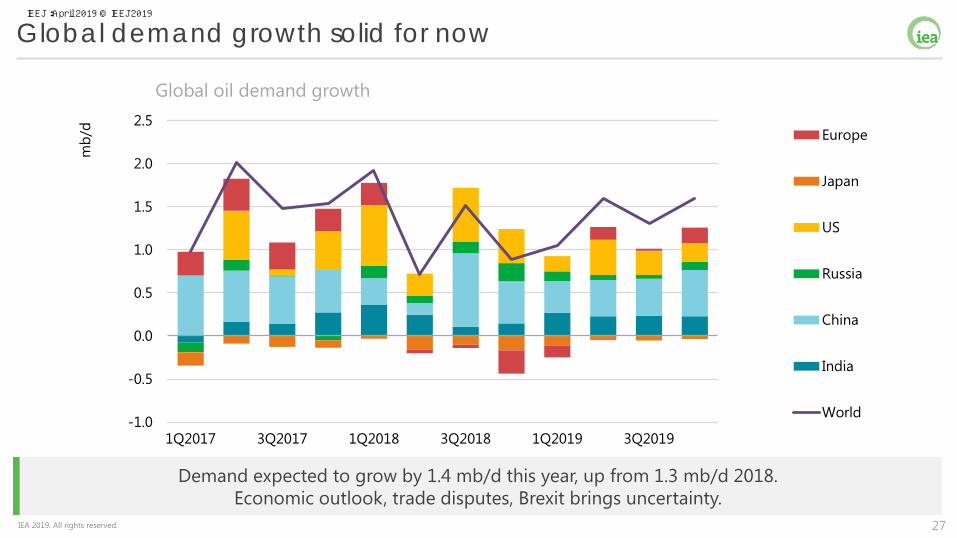
Global demand growth solid for now
Demand expected to grow by 1.4 mb/d this year, up from 1.3 mb/d 2018. Economic outlook, trade disputes, Brexit brings uncertainty.
-1.0
-0.5
0.0
0.5
1.0
1.5
2.0
2.5
1Q2017 3Q2017 1Q2018 3Q2018 1Q2019 3Q2019
mb/
d Europe
Japan
US
Russia
China
India
World
Global oil demand growth
IEEJ:April 2019 © IEEJ2019
28IEA 2019. All rights reserved.
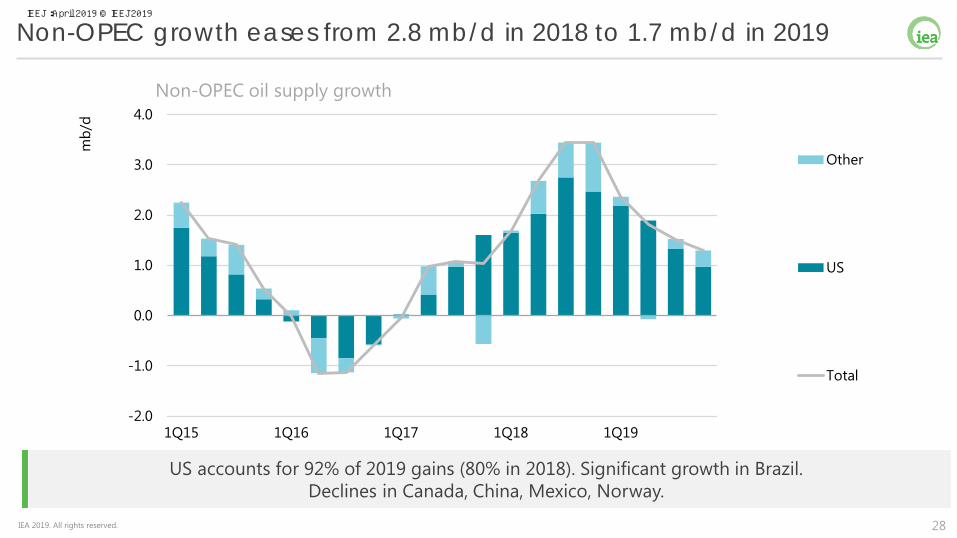
US accounts for 92% of 2019 gains (80% in 2018). Significant growth in Brazil. Declines in Canada, China, Mexico, Norway.
Non-OPEC growth eases from 2.8 mb/d in 2018 to 1.7 mb/d in 2019
-2.0
-1.0
0.0
1.0
2.0
3.0
4.0
1Q15 1Q16 1Q17 1Q18 1Q19
mb/
d
Other
US
Total
Non-OPEC oil supply growth
IEEJ:April 2019 © IEEJ2019
29IEA 2019. All rights reserved.
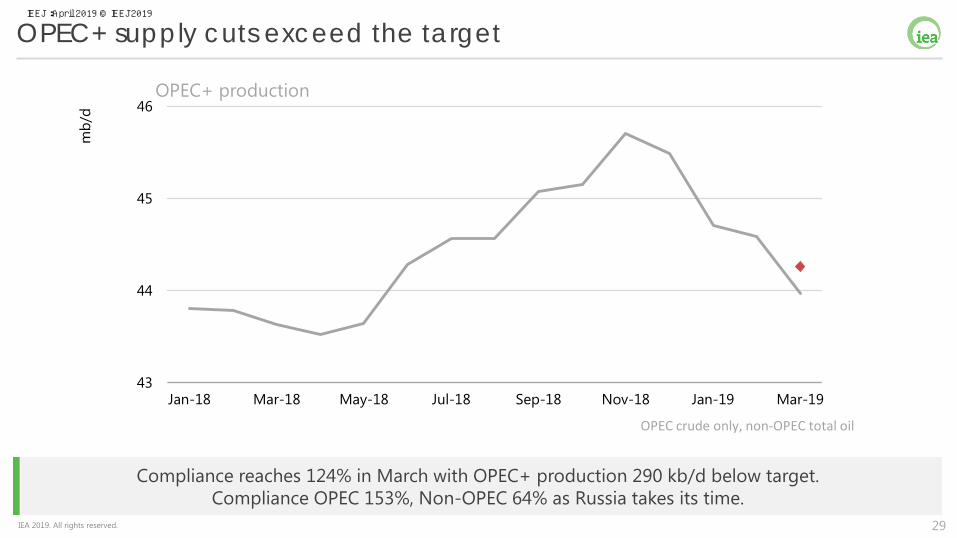
Compliance reaches 124% in March with OPEC+ production 290 kb/d below target. Compliance OPEC 153%, Non-OPEC 64% as Russia takes its time.
OPEC+ supply cuts exceed the target
43
44
45
46
Jan-18 Mar-18 May-18 Jul-18 Sep-18 Nov-18 Jan-19 Mar-19
mb/
d
OPEC crude only, non-OPEC total oil
OPEC+ production
IEEJ:April 2019 © IEEJ2019
30IEA 2019. All rights reserved.
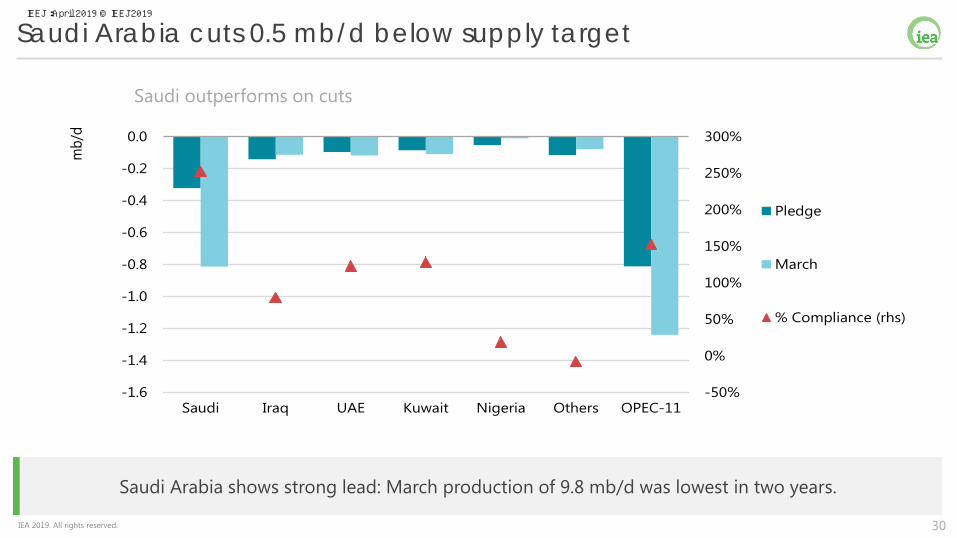
Saudi Arabia shows strong lead: March production of 9.8 mb/d was lowest in two years.
Saudi Arabia cuts 0.5 mb/d below supply target
-50%
0%
50%
100%
150%
200%
250%
300%
-1.6
-1.4
-1.2
-1.0
-0.8
-0.6
-0.4
-0.2
0.0
Saudi Iraq UAE Kuwait Nigeria Others OPEC-11
mb/
d
Pledge
March
% Compliance (rhs)
Saudi outperforms on cuts
IEEJ:April 2019 © IEEJ2019
31IEA 2019. All rights reserved.
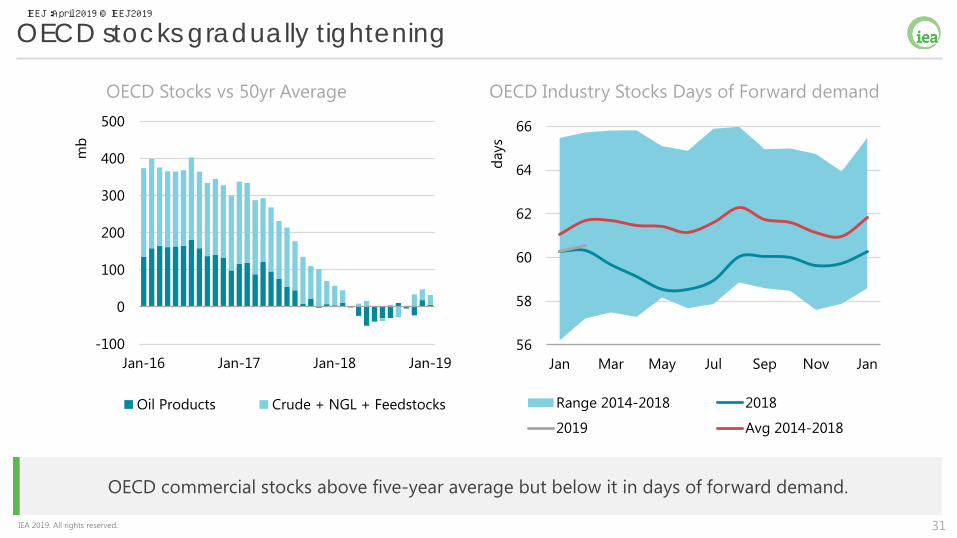
OECD commercial stocks above five-year average but below it in days of forward demand.
OECD stocks gradually tightening
OECD Stocks vs 50yr Average OECD Industry Stocks Days of Forward demand
-100
0
100
200
300
400
500
Jan-16 Jan-17 Jan-18 Jan-19
mb
Oil Products Crude + NGL + Feedstocks
56
58
60
62
64
66
Jan Mar May Jul Sep Nov Jan
days
Range 2014-2018 2018
2019 Avg 2014-2018
IEEJ:April 2019 © IEEJ2019
32IEA 2019. All rights reserved.
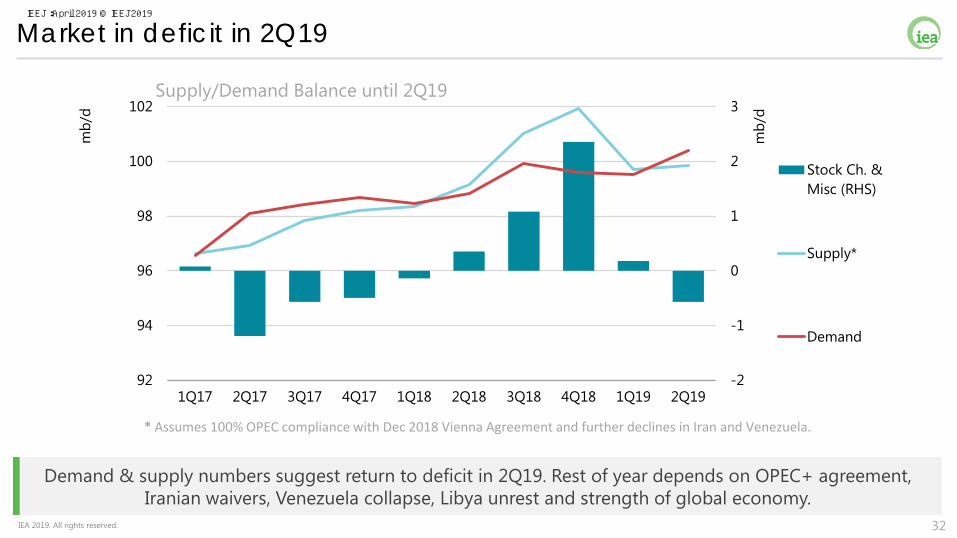
Demand & supply numbers suggest return to deficit in 2Q19. Rest of year depends on OPEC+ agreement, Iranian waivers, Venezuela collapse, Libya unrest and strength of global economy.
Market in deficit in 2Q19
Supply/Demand Balance until 2Q19
-2
-1
0
1
2
3
92
94
96
98
100
102
1Q17 2Q17 3Q17 4Q17 1Q18 2Q18 3Q18 4Q18 1Q19 2Q19
mb/
d
mb/
d
Stock Ch. &Misc (RHS)
Supply*
Demand
* Assumes 100% OPEC compliance with Dec 2018 Vienna Agreement and further declines in Iran and Venezuela.
IEEJ:April 2019 © IEEJ2019
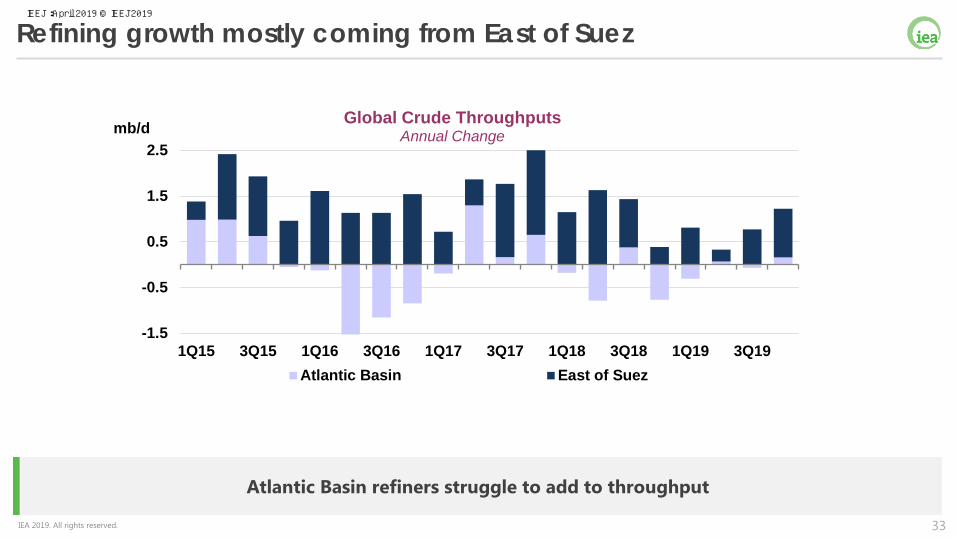
33IEA 2019. All rights reserved.
Atlantic Basin refiners struggle to add to throughput
Refining growth mostly coming from East of Suez
-1.5
-0.5
0.5
1.5
2.5
1Q15 3Q15 1Q16 3Q16 1Q17 3Q17 1Q18 3Q18 1Q19 3Q19
mb/d Global Crude ThroughputsAnnual Change
Atlantic Basin East of Suez
IEEJ:April 2019 © IEEJ2019
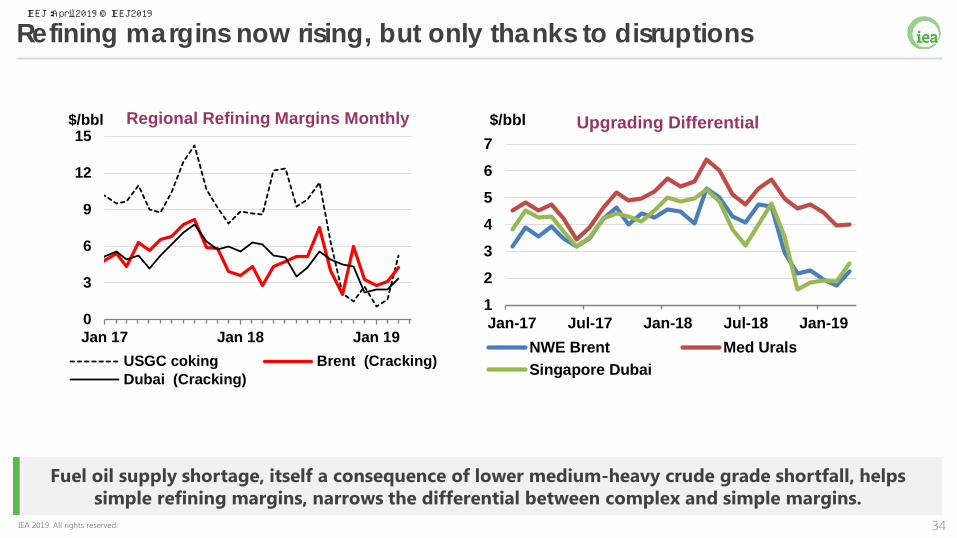
34IEA 2019. All rights reserved.
Fuel oil supply shortage, itself a consequence of lower medium-heavy crude grade shortfall, helps simple refining margins, narrows the differential between complex and simple margins.
Refining margins now rising, but only thanks to disruptions
0
3
6
9
12
15
Jan 17 Jan 18 Jan 19
$/bbl Regional Refining Margins Monthly
USGC coking Brent (Cracking)Dubai (Cracking)
1234567
Jan-17 Jul-17 Jan-18 Jul-18 Jan-19
$/bbl Upgrading Differential
NWE Brent Med UralsSingapore Dubai
IEEJ:April 2019 © IEEJ2019
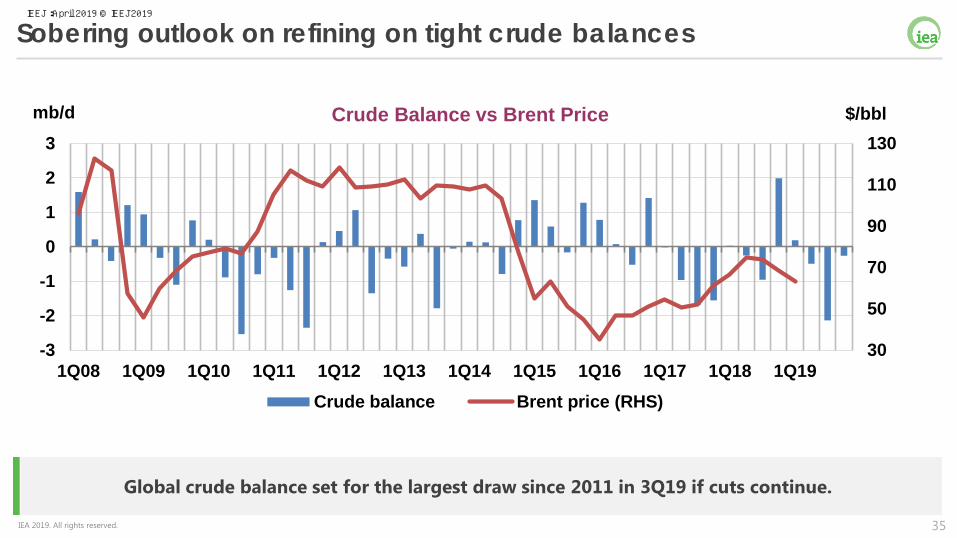
35IEA 2019. All rights reserved.
Global crude balance set for the largest draw since 2011 in 3Q19 if cuts continue.
Sobering outlook on refining on tight crude balances
30
50
70
90
110
130
-3
-2
-1
0
1
2
3
1Q08 1Q09 1Q10 1Q11 1Q12 1Q13 1Q14 1Q15 1Q16 1Q17 1Q18 1Q19
Crude Balance vs Brent Price
Crude balance Brent price (RHS)
mb/d $/bbl
IEEJ:April 2019 © IEEJ2019
36IEA 2019. All rights reserved.
www.iea.orgIEA
IEEJ:April 2019 © IEEJ2019
Contact :[email protected]