Embed Size (px)
Citation preview

TheStateofOhio,AuditorofState
OhioDepartmentofRehabilitationandCorrection
PerformanceAuditJune2015

This page intentionally left blank.

Ohio Department of Rehabilitation and Correction Performance Audit
To the Governor’s Office, General Assembly, Director and Staff of the Ohio Department of Rehabilitation and Correction, Ohio Taxpayers, and Interested Citizens: It is my pleasure to present to you this performance audit of the Ohio Department of Rehabilitation and Correction (ODRC or the Department). This service to ODRC and to the taxpayers of the state of Ohio is being provided pursuant to Ohio Revised Code § 117.46 and is outlined in the letter of engagement signed February 13, 2015. This audit includes an objective review and assessment of selected program areas within ODRC in relation to surrounding states, industry standards, and recommended or leading practices. The Ohio Performance Team (OPT) of the Auditor of State’s (AOS) office managed the project and conducted the work in accordance with Generally Accepted Government Auditing Standards. The objectives of this engagement were completed with an eye toward analyzing the Department, its programs, and service delivery processes for efficiency, cost-effectiveness, and customer responsiveness. The scope of the engagement was confined to the area of Fleet Management. This report has been provided to ODRC and its contents have been discussed with Department leadership, division leadership, program specialists, and other appropriate personnel. The Department is reminded of its responsibilities for public comment, implementation, and reporting related to this performance audit per the requirements outlined under ORC § 117.461 and § 117.462. The Department is also encouraged to use the results of the performance audit as a resource for improving overall operational efficiency as well as service delivery effectiveness. Sincerely, Dave Yost Auditor of State June 23, 2015

This page intentionally left blank.

Additional copies of this report can be requested by calling the Clerk of the Bureau’s office at (614) 466-2310 or toll free at (800) 282-0370. In addition, this report can be accessed online through the Auditor of State of Ohio website at http://www.ohioauditor.gov by choosing the “Audit Search” option.
http://ohioauditor.gov

This page intentionally left blank.

Ohio Department of Rehabilitation and Correction Performance Audit
Table of Contents I. Engagement Purpose and Scope .................................................................................................. 1 II. Performance Audits Overview ................................................................................................... 2 III. Methodology ............................................................................................................................. 2 IV. ODRC Overview ...................................................................................................................... 3 V. Summary of Recommendations and Impact .............................................................................. 6 VI. Audit Results ............................................................................................................................ 7 VII. Fleet Management Background ............................................................................................... 8
1. Data Quality .......................................................................................................................... 14 2. Telematics ............................................................................................................................. 37
VIII. Audit Scope and Objectives Overview ................................................................................ 55 IX. Abbreviated Terms and Acronyms ......................................................................................... 56 X. ODRC Response ...................................................................................................................... 57

Ohio Department of Rehabilitation and Correction Performance Audit
Page | 1
I. Engagement Purpose and Scope
Ohio Revised Code (ORC) § 117.46 provides that the Auditor of State (AOS) shall conduct performance audits of at least four state agencies each budget biennium. In consultation with the Governor and the Speaker and Minority Leader of the House of Representatives and the President and Minority Leader of the Senate, the Auditor of State selected the Ohio Department of Rehabilitation and Correction (ODRC or the Department) for audit during the fiscal year (FY) 2013-15 Biennium, encompassing FY 2013-14 and FY 2014-15. Prior to the formal start of the audit, the Ohio Performance Team (OPT) and ODRC engaged in a collaborative planning process which included initial meetings, discussion, and assessments. Based on these planning activities AOS and ODRC signed a letter of engagement, marking the official start of the performance audit, effective February 13, 2015. The letter of engagement established that the objective of the audit was to review and analyze selected areas of ODRC operations to identify opportunities for improvements to economy, efficiency, and/or effectiveness. The letter of engagement led to OPT planning and scoping work, in consultation with ODRC, which identified the following scope area: Fleet Management. This operational area comprises the scope of the audit as reflected in this report. Based on the established scope, OPT engaged in supplemental planning activities to develop detailed audit objectives for comprehensive analysis. See Section VIII: Audit Scope and Objectives Overview for an overview of this scope area and audit objectives.

Ohio Department of Rehabilitation and Correction Performance Audit
Page | 2
II. Performance Audits Overview
The United States Government Accountability Office develops and promulgates Government Auditing Standards that provide a framework for performing high-quality audit work with competence, integrity, objectivity, and independence to provide accountability and to help improve government operations and services. These standards are commonly referred to as generally accepted government auditing standards (GAGAS). Performance audits are defined as engagements that provide assurance or conclusions based on evaluations of sufficient, appropriate evidence against stated criteria, such as specific requirements, measures, or defined business practices. Performance audits provide objective analysis so that management and those charged with governance and oversight can use the information to improve program performance and operations, reduce costs, facilitate decision making by parties with responsibility to oversee or initiate corrective action, and contribute to public accountability. OPT conducted this performance audit in accordance with GAGAS. These standards require that OPT plan and perform the audit to obtain sufficient, appropriate evidence to provide a reasonable basis for findings and conclusions based on the audit objectives. OPT believes that the evidence obtained provides a reasonable basis for our findings and conclusions based on the audit objectives.
III. Methodology
Audit work was conducted between February 2015 and June 2015. To complete this report, OPT staff worked closely with ODRC staff to gather data and conduct interviews to establish current operating conditions. This data and information was reviewed with staff at multiple levels within ODRC to ensure accuracy and reliability. Where identified, weaknesses in the data obtained are noted within the report where germane to specific assessments. To complete the assessments as defined by the audit scope and objectives, OPT identified sources of criteria against which current operating conditions were compared. Though each source of criteria is unique to each individual assessment, there were common sources of criteria included across the audit as a whole. These common sources of criteria include: statutory requirements contained in the ORC or Ohio Administrative Code (OAC), ODRC internal policies and procedures, policies and procedures of other State agencies, industry standards, and government and private sector leading practices. Although OPT reviewed all sources of criteria to ensure that their use would result in reasonable, appropriate assessments, OPT staff did not conduct the same degree of data reliability assessments as were performed on data and information obtained from ODRC.

Ohio Department of Rehabilitation and Correction Performance Audit
Page | 3
The performance audit process involved information sharing with ODRC staff, including preliminary drafts of findings and proposed recommendations related to the identified scope and objectives. Status meetings were held throughout the engagement to inform the Department of key issues and share proposed recommendations to improve or enhance operations. Input from the Department was solicited and considered when assessing the selected areas and framing recommendations. ODRC provided verbal and written comments in response to various recommendations, which were taken into consideration during the reporting process. Where warranted, the report was modified based on agency comments. This audit report contains recommendations that are intended to provide the Department with options to enhance its operational economy, efficiency, and effectiveness. The reader is encouraged to review the recommendations in their entirety.
IV. ODRC Overview
Responsibilities and Mission ODRC is a cabinet-level Department and, as such, the Director of Rehabilitation and Correction (the Director) is appointed by, and serves at the pleasure of, the Governor. As a State agency, ODRC is charged with maintaining, operating, managing, and governing all state institutions for the custody, control, training, and rehabilitation of persons convicted of a crime and sentenced to correctional institutions. The vision statement of ODRC is to “Reduce crime in Ohio” and the mission statement is to “Reduce recidivism in the lives of those we touch.” ODRC assumes responsibility for all adults convicted of felonies for which the statutory minimum is at least six months, and that come into the State's prison system. OAC 5120 specifies ODRC’s duties and responsibilities for the prison system. Many convicted felons are not, however, sent to prison. Instead, they are supervised in the community through probation or other community corrections alternatives. Convicted felons who have served a specific amount of time in prison can be eligible to be placed back into the community through a system called parole. Parole is a period of supervision prior to full release from the state's correctional system. This function, too, is under the purview of ODRC with duties and responsibilities outlined in OAC 5120:1 Division of Parole and Community Services.

Ohio Department of Rehabilitation and Correction Performance Audit
Page | 4
Organizational Structure ODRC is organized broadly into several large offices that are headed by Managing Directors, with some offices further subdivided into smaller bureaus and offices. Motor vehicle fleet management responsibility resides within the Office of Healthcare and Fiscal Operations, Division of Business Administration. The following chart illustrates the basic organizational structure and the leadership hierarchy of the Department.
ODRC Organizational Chart
Note: While shaded positions and functional areas are customers and stakeholders of fleet management, underlined positions and functional areas have specific day-to-day operational oversight of fleet management.

Ohio Department of Rehabilitation and Correction Performance Audit
Page | 5
Organizational History Since its formal establishment, ODRC has had a long and varied history and today’s Department, both in structure and function, is a product of evolving statutory roles and responsibilities. In 1945 the Ohio Department of Mental Hygiene and Correction was established with purview over Ohio’s correctional facilities. In 1972, this department was dissolved and two separate departments; Rehabilitations and Corrections, and Mental Health were created. Staffing and Budgetary Resources With a total of 12,075 employees, ODRC is the largest of Ohio’s State agencies in terms of staffing. Total estimated expenditures for FY 2014-15 are expected to be approximately $1.62 billion and approximately $1.67 billion for FY 2015-16, an increase of 2.7 percent.

Ohio Department of Rehabilitation and Correction Performance Audit
Page | 6
V. Summary of Recommendations and Impact
The following table shows performance audit recommendations for Fleet Management and totals financial implications for this report.
Table V-1: Summary of Section Recommendations and Impact Report Section Recommendations Annual Impact
Fleet Management Data Quality R.1 N/A Telematics R.2 $202,807
Total Financial Implication $202,807
Ohio Department of Rehabilitation and Correction Performance Audit
Page | 7
VI. Audit Results
The performance audit identified recommendations within the scope area of Fleet Management and is presented in two separate sections including:
Data Quality: This section focuses on analyzing the quality of the fleet-related data generated by ODRC, with the objective of determining the suitability of this data for use in management decision making.
Telematics: This section focuses on the potential for ODRC to implement fleet telematics technology as a cost-effective means of fleet data collection.
Recommendations Overview Recommendation 1.1: ODRC should implement a cost-effective solution that allows the Department to collect accurate and timely fleet data including:
Vehicle mileage and use; Maintenance and repair expense; and Fuel utilization and expense.
Financial Implication 1.1: Though the data collection recommendation does not specify a financial impact, full implementation will enable significant potential savings by allowing ODRC to identify both under-utilized vehicles and more efficient cycling intervals. Recommendation 2.1: ODRC should implement a fleet-wide telematics system which would, in parallel, fulfill the requirements of the Department’s fleet management duties (see R.1 Data Quality), as well as provide valuable fleet management data for use in creating a more efficient and cost effective fleet moving forward. Financial Implication 2.1: Through implementation and effective use of fleet management data collected by telematics hardware, ODRC could reduce costs by $348,807 annually. After using these savings to recoup an initial capital investment of $260,800 in under two years, the annual fees and expenses of a telematics implementation could result in a net annual savings of $202,807. See Section IX: Abbreviated Terms and Acronyms for a list of abbreviations and acronyms used throughout this report.
Ohio Department of Rehabilitation and Correction Performance Audit
Page | 8
VII. Fleet Management Background
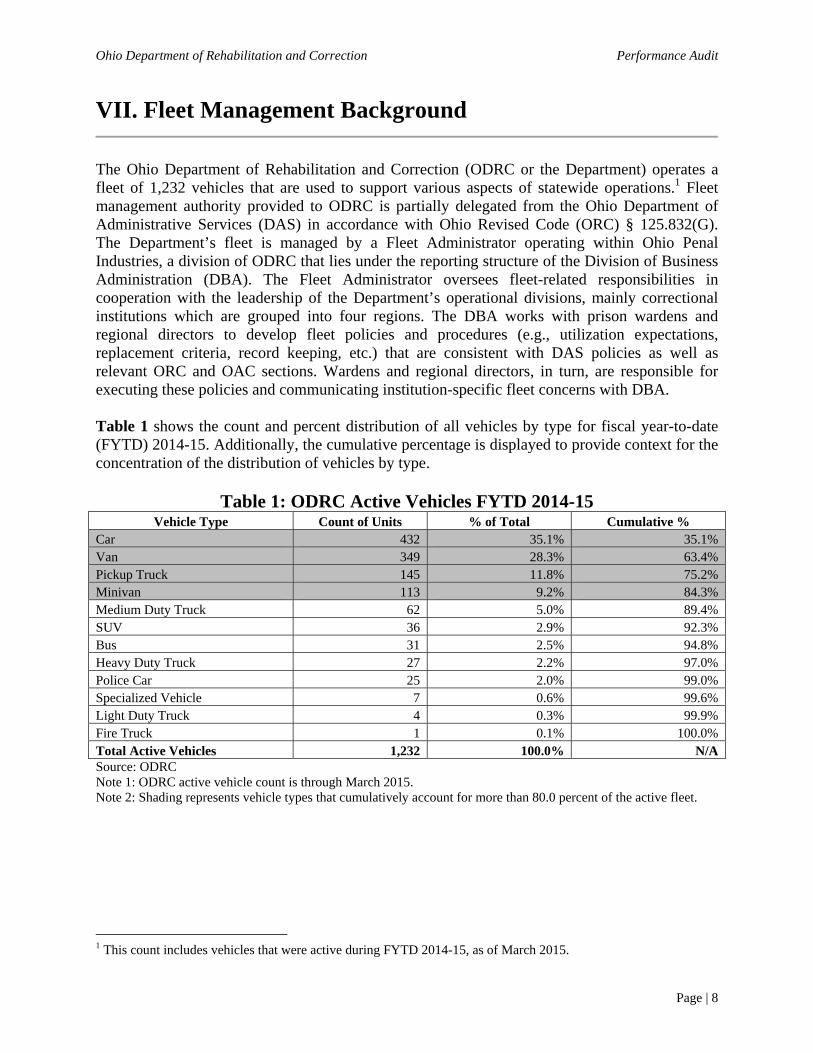
The Ohio Department of Rehabilitation and Correction (ODRC or the Department) operates a fleet of 1,232 vehicles that are used to support various aspects of statewide operations.1 Fleet management authority provided to ODRC is partially delegated from the Ohio Department of Administrative Services (DAS) in accordance with Ohio Revised Code (ORC) § 125.832(G). The Department’s fleet is managed by a Fleet Administrator operating within Ohio Penal Industries, a division of ODRC that lies under the reporting structure of the Division of Business Administration (DBA). The Fleet Administrator oversees fleet-related responsibilities in cooperation with the leadership of the Department’s operational divisions, mainly correctional institutions which are grouped into four regions. The DBA works with prison wardens and regional directors to develop fleet policies and procedures (e.g., utilization expectations, replacement criteria, record keeping, etc.) that are consistent with DAS policies as well as relevant ORC and OAC sections. Wardens and regional directors, in turn, are responsible for executing these policies and communicating institution-specific fleet concerns with DBA. Table 1 shows the count and percent distribution of all vehicles by type for fiscal year-to-date (FYTD) 2014-15. Additionally, the cumulative percentage is displayed to provide context for the concentration of the distribution of vehicles by type.
Table 1: ODRC Active Vehicles FYTD 2014-15 Vehicle Type Count of Units % of Total Cumulative %
Car 432 35.1% 35.1% Van 349 28.3% 63.4% Pickup Truck 145 11.8% 75.2% Minivan 113 9.2% 84.3% Medium Duty Truck 62 5.0% 89.4% SUV 36 2.9% 92.3% Bus 31 2.5% 94.8% Heavy Duty Truck 27 2.2% 97.0% Police Car 25 2.0% 99.0% Specialized Vehicle 7 0.6% 99.6% Light Duty Truck 4 0.3% 99.9% Fire Truck 1 0.1% 100.0% Total Active Vehicles 1,232 100.0% N/A Source: ODRC Note 1: ODRC active vehicle count is through March 2015. Note 2: Shading represents vehicle types that cumulatively account for more than 80.0 percent of the active fleet.
1 This count includes vehicles that were active during FYTD 2014-15, as of March 2015.
Ohio Department of Rehabilitation and Correction Performance Audit
Page | 9
As shown in Table 1, although ODRC’s fleet is large, the majority of units are heavily concentrated within just a few vehicle types. Specifically, the following four types of vehicles account for over 80.0 percent of the total fleet:
Cars – This includes sub-compact, compact, and full-size sedans; used primarily for ODRC employee transport.
Vans – This includes large passenger vans; used primarily by institutions for prisoner transport, but are also used in cargo applications.
Pickup Trucks – This includes roughly an equal mix of half ton, 3/4 ton, and 1 ton models; used mainly within institutions as work trucks.
Minivans – This includes just minivans; used in both personnel and prisoner transport applications.
The use of specific types of vehicles varies across ODRC divisions and is highly dependent on functional need. For the purposes of analyzing the fleet, each operational segment within ODRC was classified as one of the following: an institution, a support division, or the Division of Parole and Community Services (DPCS or Parole and Community Services). Institutions include the prisons as well as the pre-release and reception centers. Support divisions include vehicles assigned to functions such as ODRC’s Central Office, Training Academy, Central Prison School System, Corrections Medical Center, and Ohio Penal Industries. DPCS fulfills a substantially different role than either an institution or a support division, and is included as its own category for the purpose of this summary. The Department does not specifically reference these three categories in its management structure, but ODRC leadership validated the categories’ reasonableness for use in categorizing fleet users into major groups differentiated by operational needs.

Ohio Department of Rehabilitation and Correction Performance Audit
Page | 10
Chart 1 shows the ODRC’s active inventory counts within these three categories.
Chart 1: Distribution of Common Vehicles FYTD 2014-15
Source: ODRC and DAS, Office of Fleet Management Note: Several vehicle categories encompassing rare pieces of equipment are excluded from Chart 1.1. Excluded categories (and inventory counts) include ambulance (1), light duty trucks (4), and specialized vehicles (7). As shown in Chart 1, cars are employed extensively across all division types, while vans and pickup trucks are weighted heavily toward use by institutions. The total FYTD 2014-15 active inventory counts for institutions, DPCS, and support were 816, 135, and 281, respectively. These counts sum to ODRC’s total FYTD 2014-15 active inventory count of 1,232.
Car Van Pickup Truck Minivan Medium DutyTruck
SUV Bus Heavy DutyTruck
Police Car
0
50
100
150
200
250
300
350
400Division Type
InstitutionDPCSSupport

Ohio Department of Rehabilitation and Correction Performance Audit
Page | 11
Table 2 shows the full list of ODRC divisions and operating locations, ordered by total number of vehicles.2
Table 2: Active Vehicles by Division FYTD 2014-15
Division/Operating Location Cars Passenger
Vans Pickup Trucks Minivans
All Other Types
Total Vehicles
Parole and Community Services 81 12 0 18 24 135 Central Office 89 11 4 12 7 123 Ohio Penal Industries (OPI) 7 26 15 8 22 78 Allen Correctional 9 17 10 11 9 56 London Correctional 5 17 14 4 13 53 Pickaway Correctional 10 18 6 4 8 46 Mansfield Correctional 10 15 6 7 5 43 Chillicothe Correctional 13 12 10 4 39 Belmont Correctional 14 13 3 5 4 39 Lebanon Correctional 7 13 11 6 37 Central Reception Center 13 12 6 2 4 37 Southeastern Correctional 8 9 11 8 36 Southern Ohio Correctional 9 7 6 1 10 33 Grafton Correctional 5 12 6 2 8 33 Ross Correctional 15 6 4 4 4 33 Trumbull Correctional 7 15 3 1 4 30 Madison Correctional 8 10 3 6 3 30 Marion Correctional 7 11 5 0 5 28 Ohio Reformatory For Women 4 14 3 2 5 28 Richland Correctional 10 9 2 3 3 27 Toledo Correctional 8 7 2 5 4 26 Noble Correctional 8 9 2 3 3 25 Warren Correctional 7 10 3 2 2 24 Corrections Medical Center 6 14 1 1 2 24 Ohio State Penitentiary 6 11 3 1 2 23 Lorain Correctional 7 8 0 1 6 22 Operation Support Center 20 0 0 0 0 20 Dayton Correctional 9 5 0 2 4 20 Hocking Correctional 6 9 1 2 2 20 Central Office - Hub Vehicles 0 4 0 0 12 16 Correctional Training Academy 9 3 2 0 0 14 Northeast Pre-Release Center 5 3 1 1 0 10 Franklin Pre-Release Center 1 4 0 2 0 7 Montgomery Pre-Release Center 4 1 1 1 0 7 Central Prison School System 5 0 0 1 0 6 North Central Correctional 0 2 1 1 0 4 Total 432 349 145 113 193 1,232 Source: ODRC and DAS, Office of Fleet Management
2 The grouping and identification of divisions and operating locations, as the term is used in this report, mirrors the categories that exist in FleetOhio for the purpose of assigning vehicles within ODRC.

Ohio Department of Rehabilitation and Correction Performance Audit
Page | 12
As shown in Table 2, DPCS is ODRC’s single largest fleet user, followed by the Central Office and OPI.3 The distribution of vehicles across divisions and operating locations has implications for the overall analysis of the fleet. Due to differences in geography and operational needs, divisions and operating locations may vary in practices for fuel purchasing, procurement of maintenance and repairs, and vehicle utilization. For example, institutions do much of their vehicle fueling through bulk fuel tanks and conduct routine maintenance with in-house mechanics, whereas the Central Office vehicles are commonly fueled with Voyager cards and have maintenance conducted by the OPI garage in Columbus, Ohio. Subsequent sections of this performance audit will explore the implications of the differences in operating profiles at a more detailed level. In recent years, ODRC has adjusted the overall size and composition of its vehicle fleet in response to several changes in its operating environment, including:
Policy changes stipulating an increased monitoring burden on former inmates under DPCS supervision, and by extension, workload of parole officers;
Stabilization of the overall inmate population, following a cycle of increasing population during the preceding 10 years; and
Development of internal management initiatives to curtail the amount of employee travel reimbursed for personal vehicle usage.
In total ODRC has increased its overall count of active inventory from 1,123 vehicles in FY 2010-11 to 1,232 vehicles in FY 2014-15. Chart 2 shows an example of the changes over time in four common types of vehicles from FY 2010-11 to FYTD 2014-15.
Chart 2: Inventory of Common Vehicle Types
Source: ODRC and DAS, Office of Fleet Management
3 The grouping of divisions and operating locations in Table 2 are consistent with the current groupings specified in FleetOhio. Operationally, ODRC has recently consolidated Central Office and Operation Support Center into a single functional area. This operational change is still not reflected in FleetOhio. Considered as a single grouping, the consolidated Central Office functional area would represent the largest fleet user in ODRC. For the purpose of comparability across past years, however, the analysis uses FleetOhio’s groupings of divisions and operating locations.
2011 2012 2013 2014 2015
Car 335 365 400 433 432
Van 335 360 324 347 349
Pickup Truck 147 141 147 151 145
Minivan 85 89 113 119 113
0
100
200
300
400
500
Veh
icle
Cou
nt

Ohio Department of Rehabilitation and Correction Performance Audit
Page | 13
As shown in Chart 2, the five-year trend in ownership of common vehicle types has been mostly flat, with the exception of cars, and to a lesser extent, minivans. The increase in car ownership can be attributed to increased staffing levels in the DPCS, which has the highest travel needs of any division or operating location due to the mobile nature of the parole officer job. Furthermore, immaterial growth in the van fleet (i.e., large passenger vans) evident in Chart 2 aligns with the need to balance institutional populations, as these vehicles are used predominantly for prisoner transport.
Ohio Department of Rehabilitation and Correction Performance Audit
Page | 14
1. Data Quality
Section Overview This section focuses on analyzing the quality of the fleet-related data generated by ODRC, with the objective of determining the suitability of this data for use in management decision making. Recommendation Overview Recommendation 1.1: ODRC should implement a cost-effective solution that allows the Department to collect accurate and timely fleet data including:
Vehicle mileage and use; Maintenance and repair expense; and Fuel utilization and expense.
Financial Implication 1.1: Though the data collection recommendation does not specify a financial impact, full implementation will enable significant potential savings by allowing ODRC to identify both under-utilized vehicles and more efficient cycling intervals. Background According to the US General Services Administration (GSA), the entity that provides subject matter expertise on motor vehicle fleet operations to federal agencies, “[the] first step in determining the vehicle needs of your organization is to assess the current fleet.”4 The GSA further states that without proper descriptive information about the current state of an organization’s fleet, a long-term management plan cannot be formulated. Within the context of the performance audit, an assessment of the current state of ODRC’s fleet management system is the first step toward identifying opportunities for economy, efficiency, and effectiveness. The identification of opportunities for economy, efficiency and effectiveness in large motor vehicle fleets is inherently a data-driven exercise. Management decisions in the areas of right-sizing, utilization, cycling, and benchmarking an organization’s cost-effectiveness all require data that is both accurate and sufficiently detailed. With an inventory of over 1,200 vehicles, thousands of daily fleet-related business transactions, and a widely dispersed geographic footprint, the vehicle fleet presents operational challenges for ODRC that can only be met by utilizing appropriate data and tools. DAS provides a platform for management of fleet-related data called FleetOhio that contains tools for recording data on inventory, operating expenses, and mileage as well as a suite of standardized reports. Like other cabinet-level agencies in Ohio, ODRC is required to record certain vehicle information in FleetOhio on a regular basis. This requirement allows DAS to monitor the Department’s compliance with state law and regulations, but also provides ODRC
4 Guide to Federal Fleet Management (US General Services Administration, 2015)

Ohio Department of Rehabilitation and Correction Performance Audit
Page | 15
and outside parties with a repository of data that can be used to populate quantitative fleet analyses. Quantitative analyses conducted in past AOS performance audits of Ohio state agencies have leveraged DAS-required data to identify savings and efficiencies through reductions in two main areas related to fleet management: vehicle inventory and the lifecycle operating costs of vehicles. The primary quantitative analyses used to identify these opportunities for cost reductions have been assessments of utilization and cycling. A utilization analysis can yield savings opportunities by identifying individual vehicles that fail to meet a usage threshold such as annual mileage or hours in operation, and which should subsequently be sold. A cycling analysis can yield savings opportunities by calculating the most cost-effective point in a vehicle’s life at which to replace it with a new vehicle (cycle out). Of the pieces of essential data required to conduct utilization or cycling analyses, some components are required by DAS to be entered into FleetOhio, while other components must be derived from other sources. Below are lists of the minimum data requirements to conduct basic utilization and cycling analyses, distinguished by requirements in FleetOhio. Data in FleetOhio include:
Annual Mileage; Maintenance Costs; Fuel Costs; and Odometer Readings.
Data not required to be recorded in FleetOhio include:
Non-mileage based utilization metrics (e.g. utilization calendars, key-on/key-off, engine hours); and
Market-based residual values and depreciation schedules for the cycling analysis. Methodology In seeking to evaluate the potential for data-driven fleet management efficiencies, such as detailed vehicle utilization and comprehensive fleet cycling, numerous data deficiencies were identified. These data deficiencies were significant and precluded execution of the original planned analyses. Data deficiencies were discussed with ODRC leadership and fleet-management personnel. Further, analysis was conducted that identified specific deficiencies within FleetOhio data, along with counts and locations of the vehicles affected. Data sources were from ODRC’s internal fleet management data as well as from DAS, Office of Fleet Management (i.e., FleetOhio). Analysis focused on data from FY 2010-11 to FYTD 2014-15. For each vehicle, the FleetOhio dataset contained fields specifying vehicle:
Make, model and year; Division or operating location assignment, and date range during which the vehicle was
owned; and Fuel cost, maintenance cost, and annual utilization in miles.

Ohio Department of Rehabilitation and Correction Performance Audit
Page | 16
Additional DAS, Office of Fleet Management datasets used included a FleetOhio query of the most recent ODRC odometer readings, a report on vehicles which have not received fuel within the last 60 days, and the last four fiscal years of Voyager card transactional data. For benchmarking purposes, the FleetOhio data was supplemented with fuel-economy ratings of various common vehicle types and a dataset of market fuel prices over the same time period as the main dataset. Analysis Since this portion of the analysis is focused on evaluating the suitability of ODRC data for use in management decision-making, the data quality evaluation targets only the metrics necessary to populate analyses of under-utilization and operating expense inefficiencies. In FleetOhio, these fields are a vehicle’s annual mileage, maintenance cost, fuel cost, and odometer readings. After evaluating ODRC’s process for generating fleet data, analysis uses quantitative methods to identify zero-value entries and non-zero values suspected of inaccuracy in FleetOhio. Data-Entry Process Two points in the process for aggregating vehicle data into FleetOhio were identified that result in inaccuracies in the database: failure to generate vehicle records at the source and failure to transcribe existing paper records into the electronic FleetOhio portal. Apart from transactions conducted with Voyager cards (which are automatically uploaded to the FleetOhio database) ODRC’s process for data entry into FleetOhio requires manual input of paper records into electronic entries. The main types of paper records used to populate electronic entries are hand-written usage logs and vendor expense receipts. Usage logs refer to the notebooks that travel with each vehicle, in which employees are required to record the odometer reading at the beginning and end of their trip. These usage logs contain information necessary to input miles traveled and odometer readings into FleetOhio. Receipts mainly record the expenses for parts and supplies purchases, and for maintenance activities completed by commercial vendors on ODRC vehicles. The key input flowing into FleetOhio from the paper receipts is a vehicle’s maintenance costs. In a system requiring the transcription of paper records into an electronic database, there are multiple ways data quality is negatively impacted. Simple transcription errors, where the wrong value is inputted into the system or where the correct value is attributed to the wrong vehicle, are one such failure mode. Another source of poor data quality is when a delay occurs between the initial record generation and the data entry function, which results in fleet data that is not current. A third source of inaccuracy is when a record is simply not entered electronically. All three failure modes associated with data entry weaknesses and concerns were present. During the course of the performance audit, ODRC initiated preliminary measures taking a more proactive approach to fleet data entry and to deal with a perceived backlog of paper records. One proposed solution was the creation of a data-entry function within Ohio Penal Industries. In this proposal, ODRC employees would oversee a team of inmates who would input paper records
Ohio Department of Rehabilitation and Correction Performance Audit
Page | 17
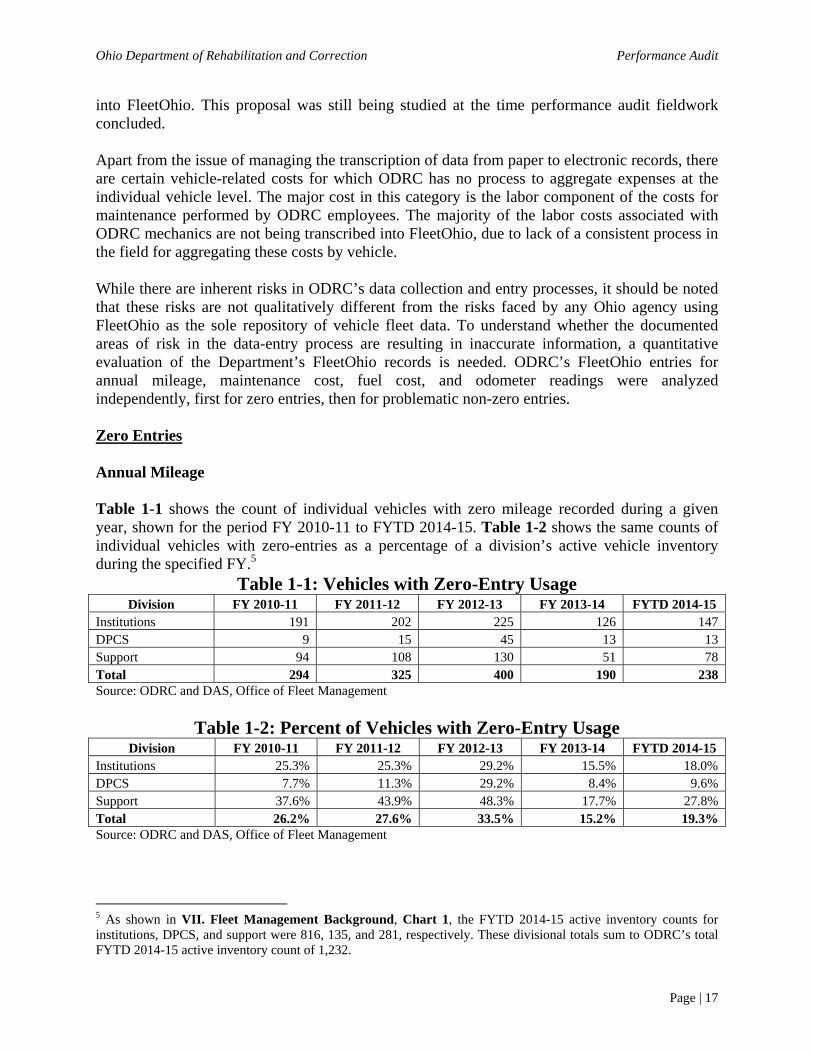
into FleetOhio. This proposal was still being studied at the time performance audit fieldwork concluded. Apart from the issue of managing the transcription of data from paper to electronic records, there are certain vehicle-related costs for which ODRC has no process to aggregate expenses at the individual vehicle level. The major cost in this category is the labor component of the costs for maintenance performed by ODRC employees. The majority of the labor costs associated with ODRC mechanics are not being transcribed into FleetOhio, due to lack of a consistent process in the field for aggregating these costs by vehicle. While there are inherent risks in ODRC’s data collection and entry processes, it should be noted that these risks are not qualitatively different from the risks faced by any Ohio agency using FleetOhio as the sole repository of vehicle fleet data. To understand whether the documented areas of risk in the data-entry process are resulting in inaccurate information, a quantitative evaluation of the Department’s FleetOhio records is needed. ODRC’s FleetOhio entries for annual mileage, maintenance cost, fuel cost, and odometer readings were analyzed independently, first for zero entries, then for problematic non-zero entries. Zero Entries Annual Mileage Table 1-1 shows the count of individual vehicles with zero mileage recorded during a given year, shown for the period FY 2010-11 to FYTD 2014-15. Table 1-2 shows the same counts of individual vehicles with zero-entries as a percentage of a division’s active vehicle inventory during the specified FY.5
Table 1-1: Vehicles with Zero-Entry Usage Division FY 2010-11 FY 2011-12 FY 2012-13 FY 2013-14 FYTD 2014-15
Institutions 191 202 225 126 147 DPCS 9 15 45 13 13 Support 94 108 130 51 78 Total 294 325 400 190 238 Source: ODRC and DAS, Office of Fleet Management
Table 1-2: Percent of Vehicles with Zero-Entry Usage Division FY 2010-11 FY 2011-12 FY 2012-13 FY 2013-14 FYTD 2014-15
Institutions 25.3% 25.3% 29.2% 15.5% 18.0% DPCS 7.7% 11.3% 29.2% 8.4% 9.6% Support 37.6% 43.9% 48.3% 17.7% 27.8% Total 26.2% 27.6% 33.5% 15.2% 19.3% Source: ODRC and DAS, Office of Fleet Management
5 As shown in VII. Fleet Management Background, Chart 1, the FYTD 2014-15 active inventory counts for institutions, DPCS, and support were 816, 135, and 281, respectively. These divisional totals sum to ODRC’s total FYTD 2014-15 active inventory count of 1,232.

Ohio Department of Rehabilitation and Correction Performance Audit
Page | 18
As shown in Table 1-1 and Table 1-2, ODRC’s total vehicles without an annual mileage entry in FleetOhio has ranged from 190 in FY 2013-14 to 400 in FY 2012-13. Of the major division types, DPCS has the least zero-entries within its fleet data both in absolute terms and as a percentage of its total inventory. FY 2013-14 had the least zero-entries of the years under analysis, at 15.2 percent of ODRC’s total inventory. One possible scenario in which annual mileage would result in a zero-entry would be where a new vehicle is delivered near the end of a fiscal year, so it counts as active in ODRC’s inventory, but is not driven before the fiscal year closes. It is also possible that there are a number of unused or inoperable vehicles in ODRC’s inventory that are not driven in any given year. Given the large total number of vehicles affected, however, the most plausible explanation for a majority of zero-mileage entries is failure to record data in FleetOhio. Accepting the FleetOhio mileage data at face-value would imply that ODRC has not used 238 vehicles at any point during the nearly-complete FYTD 2014-15 and could sell these vehicles with little negative operational impact. While it is highly unlikely that 238 is an accurate count of ODRC vehicles that have not been driven, this inaccuracy highlights the fact that the true number of unutilized vehicles is unknown. With lack of data available in FleetOhio, the true count of actual unutilized vehicles will be masked among hundreds of other zero-values. Maintenance Cost Table 1-3 shows the count of individual vehicles with zero maintenance cost recorded during a given year, shown for the period FY 2010-11 to FYTD 2014-15. Table 1-4 shows the same counts of individual vehicles with zero-entries as a percentage of that year’s active vehicle inventory.
Table 1-3: Vehicles with Zero-Entry Maintenance Cost Division FY 2010-11 FY 2011-12 FY 2012-13 FY 2013-14 FYTD 2014-15
Institutions 333 390 387 339 452 DPCS 11 33 59 47 44 Support 110 107 117 105 156 Total 454 530 563 491 652 Source: ODRC and DAS, Office of Fleet Management
Table 1-4: Percent of Vehicles with Zero-Entry Maintenance Cost Division FY 2010-11 FY 2011-12 FY 2012-13 FY 2013-14 FYTD 2014-15
Institutions 44.0% 48.8% 50.3% 41.7% 55.4% DPCS 9.4% 24.8% 38.3% 30.5% 32.6% Support 44.0% 43.5% 43.5% 36.5% 55.5% Total 40.4% 45.0% 47.2% 39.2% 52.9% Source: ODRC and DAS, Office of Fleet Management As shown in Table 1-3 and Table 1-4, the number of zero-value maintenance cost entries exceeded the zero-mileage entries. Unlike the zero-value mileage entries, however, several plausible scenarios could explain why a vehicle legitimately incurred no maintenance cost in a given year. Usage in a particular year may have been low enough that no routine maintenance

Ohio Department of Rehabilitation and Correction Performance Audit
Page | 19
was required during the same time period. For that reason, vehicles with zero values in maintenance costs were filtered against a secondary criterion, annual mileage. Table 1-5 shows the count of individual vehicles with zero maintenance costs that have also recorded over 5,000 miles of use from FY 2010-11 to FYTD 2014-15. The 5,000 mile usage criterion was chosen on the basis that the majority of ODRC’s vehicle types specify an oil-change interval of 5,000 miles or less, at which point maintenance cost is required to be recorded. Table 1-6 show counts of vehicles as a percentage of total vehicle inventory. Table 1-5: Vehicles with Zero-Entry Maintenance Cost and >5,000 Annual Mileage
Division FY 2010-11 FY 2011-12 FY 2012-13 FY 2013-14 FYTD 2014-15 Institutions 62 81 81 94 95 DPCS 1 11 13 11 11 Support 22 15 13 38 35 Total 85 107 107 143 141 Source: ODRC and DAS, Office of Fleet Management Table 1-6: Percent of Vehicles with Zero-Entry Maintenance Cost and >5,000
Annual Mileage Division FY 2010-11 FY 2011-12 FY 2012-13 FY 2013-14 FYTD 2014-15
Institutions 8.2% 10.1% 10.5% 11.6% 11.6% DPCS 0.9% 8.3% 8.4% 7.1% 8.1% Support 8.8% 6.1% 4.8% 13.2% 12.5% Total 7.6% 9.1% 9.0% 11.4% 11.4% Source: ODRC and DAS, Office of Fleet Management As shown in Table 1-5, a large number of zero entries remain even with the more restrictive criteria applied. It is important to note that Table 1-5 should be considered a lower bound for inaccurate maintenance cost data entries, because Table 1-5 does not capture counts that have both missing mileage and missing maintenance cost. Because so many of the annual mileage entries are likely to be actually missing, rather than zero-values, Table 1-5 would inappropriately give these vehicles credit for not needing maintenance.

Ohio Department of Rehabilitation and Correction Performance Audit
Page | 20
Fuel Cost Table 1-7 shows the count of individual vehicles with zero fuel costs recorded during a given year, shown for the period FY 2010-11 to FYTD 2014-15. Table 1-8 shows the same counts of individual vehicles with zero-entries as a percentage of that year’s active vehicle inventory.
Table 1-7: Vehicles with $0 Fuel Cost Division FY 2010-11 FY 2011-12 FY 2012-13 FY 2013-14 FYTD 2014-15
Institutions 326 375 374 280 248 DPCS 5 8 31 39 14 Support 103 113 128 110 73 Total 434 496 533 429 335 Source: ODRC and DAS, Office of Fleet Management
Table 1-8: Percent of Vehicles with $0 Fuel Cost Division FY 2010-11 FY 2011-12 FY 2012-13 FY 2013-14 FYTD 2014-15
Institutions 43.1% 46.9% 48.6% 34.5% 30.4% DPCS 4.3% 6.0% 20.1% 25.3% 10.4% Support 41.2% 45.9% 47.6% 38.2% 26.0% Total 38.6% 42.1% 44.7% 34.2% 27.2% Source: ODRC and DAS, Office of Fleet Management As shown in Table 1-7 and Table 1-8, vehicles with zero recorded fuel costs number higher than vehicles with zero mileage, though the count is lower than vehicles with zero maintenance costs. Again DPCS remains the divisional grouping within ODRC with the lowest amount of zero-entries as a percentage of active inventory. With 27.2 percent of 1,232 total vehicles reporting zero fuel usage in the current year, a substantial portion of fleet operating costs is effectively invisible in FleetOhio. Odometer Readings Table 1-9 shows the count of individual vehicles with zero miles shown on the odometer as of April 2015. Unlike the other three data types under analysis, odometer readings are valuable only in the context of a snapshot in time, as opposed to the sum of activity over the course of a year. For this reason, only FYTD 2014-15 is shown in the table.
Table 1-9: Vehicles with Zero Annual Mileage FYTD 2014-15 Division FYTD 2014-15
Institutions 2DPCS 1Support 1Total 4 Source: ODRC and DAS, Office of Fleet Management As shown in Table 1-9, odometer readings have practically no incidence of zero-values being entered in FleetOhio. Zero-value odometer readings are not a widespread problem for ODRC, however, this should not be construed as concluding the odometer values are accurate and recent.
Ohio Department of Rehabilitation and Correction Performance Audit
Page | 21
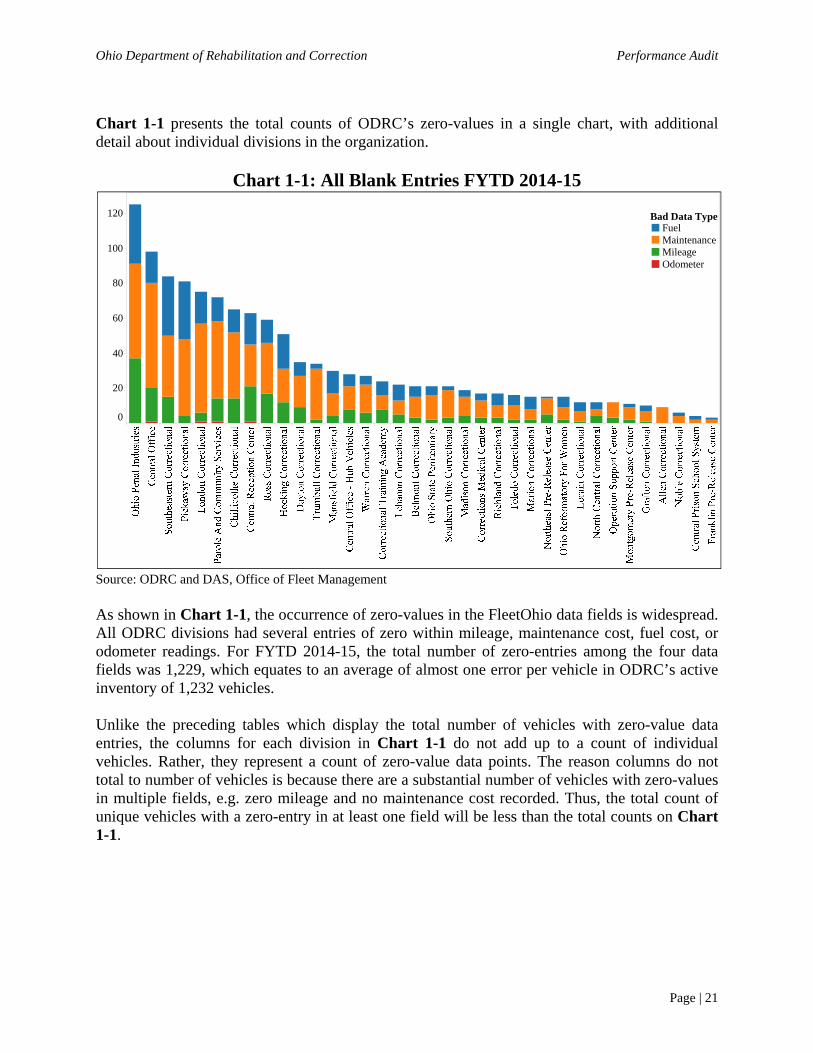
Chart 1-1 presents the total counts of ODRC’s zero-values in a single chart, with additional detail about individual divisions in the organization.
Chart 1-1: All Blank Entries FYTD 2014-15
Source: ODRC and DAS, Office of Fleet Management As shown in Chart 1-1, the occurrence of zero-values in the FleetOhio data fields is widespread. All ODRC divisions had several entries of zero within mileage, maintenance cost, fuel cost, or odometer readings. For FYTD 2014-15, the total number of zero-entries among the four data fields was 1,229, which equates to an average of almost one error per vehicle in ODRC’s active inventory of 1,232 vehicles. Unlike the preceding tables which display the total number of vehicles with zero-value data entries, the columns for each division in Chart 1-1 do not add up to a count of individual vehicles. Rather, they represent a count of zero-value data points. The reason columns do not total to number of vehicles is because there are a substantial number of vehicles with zero-values in multiple fields, e.g. zero mileage and no maintenance cost recorded. Thus, the total count of unique vehicles with a zero-entry in at least one field will be less than the total counts on Chart 1-1.
0
20
40
60
80
100
120 Bad Data TypeFuelMaintenanceMileageOdometer

Ohio Department of Rehabilitation and Correction Performance Audit
Page | 22
Chart 1-2 shows the count of unique vehicles at each division with a zero-value in at least one of the four categories of data.
Chart 1-2: Unique Vehicles with Zero Values in FleetOhio FYTD 2014-15
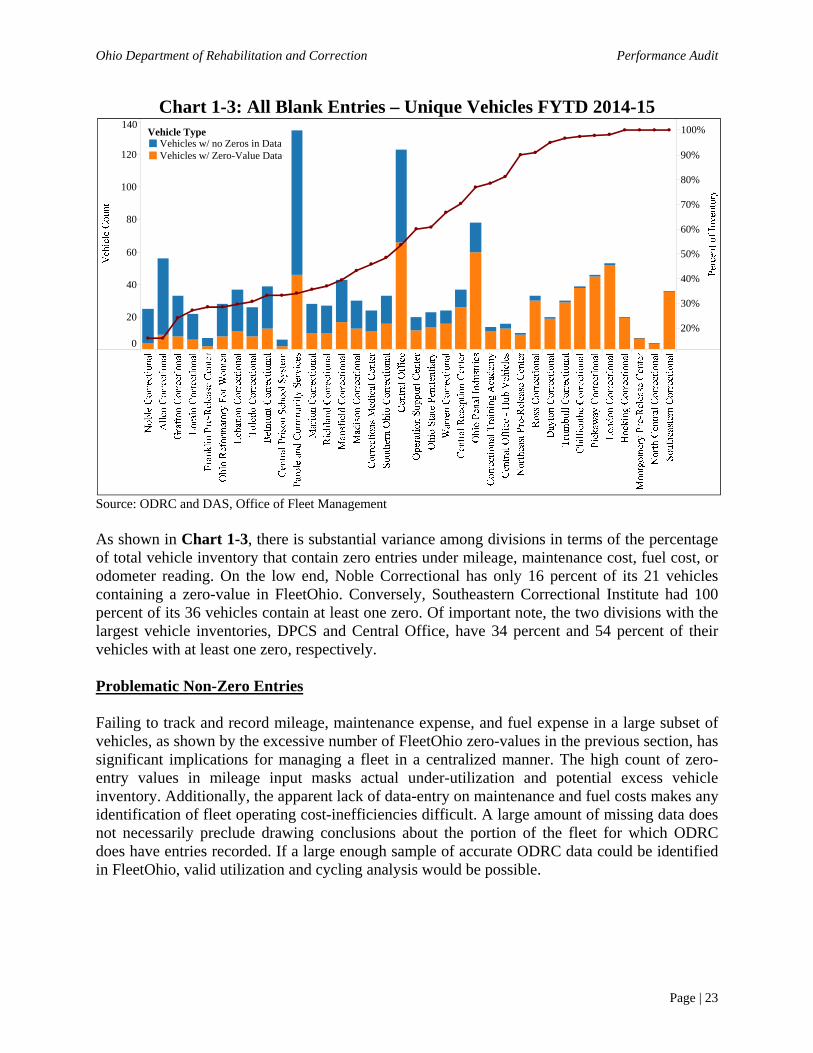
Source: ODRC and DAS, Office of Fleet Management As shown in Chart 1-2, ODRC owns a substantial number of vehicles with at least one zero-value in the FleetOhio under mileage, maintenance cost, fuel cost, or odometer reading. For FYTD 2014-15, the total number of unique vehicles with at least one zero-value in these fields is 701, which equates to an average of 56.9 percent of ODRC’s total active inventory of 1,232 vehicles. An additional analysis reveals how the total vehicle counts in Chart 1-2 compare with the total vehicle inventories of the respective divisions. Calculating this percentage will reveal which divisions have fewer zero-entries in fleet data, relative to fleet size. This analysis is displayed in Chart 1-3, which shows the percentage of vehicles with zero-values in FleetOhio relative to the entire inventory count of a division. The line of Chart 1-3 is associated with the right axis, and represents the percentage of a division’s vehicles that contain at least one zero. Divisions on the left side of the chart therefore have the lowest error rates. The bars are associated with the left axis, and represent the total vehicle inventory of a division. Bars are further color coded to represent the counts of vehicles with zero-entries and vehicles without zero-entries within FY 2014-15 FleetOhio data.
0
10
20
30
40
50
60
70
Ohio Department of Rehabilitation and Correction Performance Audit
Page | 23
Chart 1-3: All Blank Entries – Unique Vehicles FYTD 2014-15
Source: ODRC and DAS, Office of Fleet Management As shown in Chart 1-3, there is substantial variance among divisions in terms of the percentage of total vehicle inventory that contain zero entries under mileage, maintenance cost, fuel cost, or odometer reading. On the low end, Noble Correctional has only 16 percent of its 21 vehicles containing a zero-value in FleetOhio. Conversely, Southeastern Correctional Institute had 100 percent of its 36 vehicles contain at least one zero. Of important note, the two divisions with the largest vehicle inventories, DPCS and Central Office, have 34 percent and 54 percent of their vehicles with at least one zero, respectively. Problematic Non-Zero Entries Failing to track and record mileage, maintenance expense, and fuel expense in a large subset of vehicles, as shown by the excessive number of FleetOhio zero-values in the previous section, has significant implications for managing a fleet in a centralized manner. The high count of zero-entry values in mileage input masks actual under-utilization and potential excess vehicle inventory. Additionally, the apparent lack of data-entry on maintenance and fuel costs makes any identification of fleet operating cost-inefficiencies difficult. A large amount of missing data does not necessarily preclude drawing conclusions about the portion of the fleet for which ODRC does have entries recorded. If a large enough sample of accurate ODRC data could be identified in FleetOhio, valid utilization and cycling analysis would be possible.
0
20
40
60
80
100
120
140
20%
30%
40%
50%
60%
70%
80%
90%
100%Vehicle TypeVehicles w/ no Zeros in DataVehicles w/ Zero-Value Data

Ohio Department of Rehabilitation and Correction Performance Audit
Page | 24
This portion of the analysis follows the same format as the evaluation of zero-values in FleetOhio, with the aim of identifying any problematic data not already flagged as a zero-value. Instead of counting vehicles with zero mileage, maintenance cost, and fuel cost, the following analysis counts vehicles falling outside a range of criteria identified as reasonable thresholds. Annual Mileage The first method used to identify vehicles falling outside of typical usage parameters is to identify any vehicle traveling over 26,000 miles per year, which equates to over 100 miles per business day. Table 1-10 shows the counts of vehicles traveling in excess of 26,000 miles in a given year, shown for the period FY 2010-11 to FYTD 2014-15. Table 1-11 shows the same counts of individual vehicles as a percentage of that year’s active vehicle inventory.
Table 1-10: Vehicles Exceeding 26,000 Annual Mileage Division FY 2010-11 FY 2011-12 FY 2012-13 FY 2013-14 FYTD 2014-15
Institutions 34 52 80 109 63 DPCS 5 7 5 13 2 Support 26 16 21 57 13 Total 65 75 106 179 78 Source: ODRC and DAS, Office of Fleet Management
Table 1-11: Percent of Vehicles Exceeding 26,000 Annual Mileage Division FY 2010-11 FY 2011-12 FY 2012-13 FY 2013-14 FYTD 2014-15
Institutions 4.5% 6.5% 10.4% 13.4% 7.7% DPCS 4.3% 5.3% 3.2% 8.4% 1.5% Support 10.4% 6.5% 7.8% 19.8% 4.6% Total 5.8% 6.4% 8.9% 14.3% 6.3% Source: ODRC and DAS, Office of Fleet Management As shown in Table 1-10 and Table 1-11, a relatively small percentage of ODRC’s total inventory has mileage data indicating usage of over 100 miles per day. Further examination into the composition of vehicle types traveling over 26,000 miles per year revealed that the majority were either prison transport vans or passenger cars. The fact that the highest mileage vehicles identified have a use-case of required travel between institutions across Ohio bolsters the credibility of these data points. It is useful to see an actual distribution of the high-mileage vehicles, however, to see if any individual vehicles contain an unreasonable amount of annual mileage.

Ohio Department of Rehabilitation and Correction Performance Audit
Page | 25
Chart 1-4 shows the individual single-year usage for all 78 vehicles exceeding 26,000 miles traveled during FYTD 2014-15. Chart 1-4: Usage of Vehicles Exceeding 26,000 Annual Mileage FYTD 2014-15
Source: ODRC and DAS, Office of Fleet Management As shown in Chart 1-4, ODRC’s data shows a large number of vehicles with FY 2014-15 mileage in excess of what would be possible under the Department’s normal employee and prisoner transport applications. Several vehicles were reported to have traveled in excess of 300,000 miles. The average mileage of vehicles in Chart 1-4 is 112,573 and the median mileage is 72,784. Achieving the average mileage of 112,573 would require traveling approximately 308 miles per day, 365 days of the year, which is further than the distance between Cleveland and Cincinnati. Additionally, 20 of the vehicles identified in Chart 1-4 report annual mileages in excess of their odometer reading. On probable conclusion from the chart above is that many vehicles identified using the 26,000 mile criteria are, in fact, likely to have inaccurate usage data in FleetOhio. Maintenance Cost In fleet applications, the least expensive type of vehicles to maintain are passenger cars. To be conservative, therefore, a car-based criterion was chosen to screen for suspected inaccuracies in non-zero ODRC maintenance cost data. The US Department of Transportation (USDOT) maintains a data series that surveys the average maintenance cost per mile (CPM) associated with owning passenger cars. The analysis selects the USDOT’s 2011 average maintenance CPM for cars of $0.045, and compares that against ODRC’s maintenance cost data in FleetOhio. Using the USDOT 2011 average value ensures applicability with all years evaluated in the FleetOhio

Ohio Department of Rehabilitation and Correction Performance Audit
Page | 26
dataset, and provides an additional level of conservatism against flagging false-positives in ODRC’s dataset, since the average maintenance CPM has increased since then. As a final layer of conservatism built in to selecting the $0.045 CPM criterion, the USDOT average is stated not to include the cost of tires, while ODRC vehicles would be incurring tire costs on an ongoing basis and required to enter them in FleetOhio. Chart 1-5 provides a visual example of how the $0.045 benchmark is applied to identify potentially inaccurate values in ODRC’s database. Every bar in the chart represents an individual vehicle’s FYTD 2014-15 CPM, the values of which are displayed on the left axis, for mid-sized sedans only. This analysis excludes vehicles with zero-values in maintenance costs, since they were already counted in the prior analysis. The $0.045 benchmark is represented by the dotted horizontal line.
Chart 1-5: Mid-Sized Sedan Maintenance CPM FYTD 2014-15
Source: ODRC and DAS, Office of Fleet Management As shown in Chart 1-5, 106 out of 154 vehicles in the mid-sized sedan category have data entries indicating CPMs below $0.045. These counts are in addition to the 135 zero-values already excluded from the category. In all, 84 percent of ODRC’s mid-sized sedans are identified as having potentially inaccurate maintenance cost values based on either zero-values or CPMs below the benchmark criteria.
$0.00
$0.05
$0.10
$0.15
$0.20
$0.25
Lower Bound CPM
Vehicles
Division TypeInstitutionDPCSSupport

Ohio Department of Rehabilitation and Correction Performance Audit
Page | 27
Table 1-12 shows the counts of all ODRC vehicles with a CPM below $0.045 in a given year, shown for the period FY 2010-11 to FYTD 2014-15. Table 1-13 shows the same counts of individual vehicles as a percentage of that year’s active vehicle inventory.
Table 1-12: Vehicles with $0.00 < CPM < $.045 Division FY 2010-11 FY 2011-12 FY 2012-13 FY 2013-14 FYTD 2014-15
Institutions 167 153 179 248 207 DPCS 51 43 47 57 56 Support 45 43 57 96 75 Total 263 239 283 401 338 Source: ODRC and DAS, Office of Fleet Management
Table 1-13: Percent of Vehicles with $0.00 < CPM < $.045 Division FY 2010-11 FY 2011-12 FY 2012-13 FY 2013-14 FYTD 2014-15
Institutions 22.1% 19.1% 23.2% 30.5% 25.4% DPCS 43.6% 32.3% 30.5% 37.0% 41.5% Support 18.0% 17.5% 21.2% 33.3% 26.7% Total 23.4% 20.3% 23.7% 32.0% 27.4% Source: ODRC and DAS, Office of Fleet Management As shown in Table 1-12 and Table 1-13, the total percentage of ODRC’s fleet with a maintenance CPM between $0.00 and $0.045 has ranged from 20.3 percent in FY 2011-12 to 32.0 percent in FY 2013-14. The support divisions have seen an increase in the percentage of vehicle inventories falling below the $.045 CPM threshold over the period analyzed. The increase may be an indication that the accuracy of the recorded maintenance cost data has degraded during the period reviewed. Fuel Cost Publicly available US Environmental Protection Agency (EPA) fuel-economy ratings were selected as criteria to identify ODRC vehicles with potentially inaccurate fuel cost data in FleetOhio. For each of the major classes of vehicles within ODRC, the EPA rated highway and city miles per gallon (MPG) were used to find outliers in fuel usage among ODRC’s fleet. For each vehicle in FleetOhio, the recorded annual mileage was divided by its recorded annual fuel cost, then multiplied by the average annual market price-per-gallon of fuel specific to the year under analysis. This calculation is the average MPG an ODRC vehicle would have actually achieved in a given year, accepting the FleetOhio data at face-value. To test the reasonableness of the MPG calculated from FleetOhio data, it is compared to the EPA highway and city MPG ratings for the specific make and model under analysis. A vehicle’s annual average miles per gallon achieved should never exceed the highway rating, and should never fall below the city rating in the absence of excessive idling.

Ohio Department of Rehabilitation and Correction Performance Audit
Page | 28
Chart 1-6 demonstrates the concept of comparing the vehicle MPG calculated via FleetOhio data to the EPA highway and city MPG ratings, which are considered the upper and lower bound of reasonable values. ODRC’s full-sized transport vans in FYTD 2014-15 are used as the example set. ODRC vehicles with zero-values in fuel costs are excluded from this analysis, having already been identified in previous analyses. The majority of ODRC’s 349 vans active in FYTD 2014-15 are one-ton Ford and General Motors models, which the EPA rates at 8 and 17 city and highway MPG, respectively. Any ODRC vans with FleetOhio data indicating they achieved a MPG below 8 or over 17 are flagged for potentially erroneous fuel cost data.
Chart 1-6: Vans Miles per Gallon FYTD 2014-15
Source: ODRC and DAS, Office of Fleet Management As shown in Chart 1-6, the majority of ODRC’s vans fall outside of the criteria range. Most of the vans exceed the MPG benchmark on the high side, which would imply under-reported fuel costs in FleetOhio with respect to annual mileage. The highest ODRC van MPG ratings calculated from FleetOhio are nearly infinite, due to small fuel cost entries coupled with high annual mileages. As a result, these are unable to be displayed on Chart 1-6 due to scale. In total, only 49 of ODRC’s vans were calculated to have an average MPG falling within EPA upper and lower fuel economy ratings for the class. That means 300 out of 349 vans, or 86 percent, have either zero values for FleetOhio fuel cost or fuel cost and mileage combinations that imply an implausible MPG achievement.
0
10
20
30
40
50
60
70
80
90
100
Class Highway MPG
Class City MPG
Vehicles
Division TypeInstitutionDPCSSupport

Ohio Department of Rehabilitation and Correction Performance Audit
Page | 29
Table 1-14 shows counts of all ODRC vehicle types outside of their respective MPG benchmarks shown for the period FY 2012-13 to FYTD 2014-15. Table 1-15 shows the same counts, represented as percentages of total inventory. Major classes of vehicles were analyzed separately, so that specific EPA fuel-economy ratings could be targeted toward appropriate vehicles.6 As opposed to the five year time period examined in most of the other data-quality evaluations, the MPG analysis limits the time period examined to three years in order to ensure consistency with the dates used for EPA fuel-economy ratings.
Table 1-14: Vehicles with Implied Fuel Economy Ratings Outside of EPA Benchmarks
Division FY 2012-13 FY 2013-14 FYTD 2014-15 Institutions 241 349 361 DPCS 25 9 18 Support 66 83 104 Total 332 441 483 Source: ODRC and DAS, Office of Fleet Management Table 1-15: Percent of Vehicles with Implied Fuel Economy Ratings Outside
of EPA Benchmarks Division FY 2012-13 FY 2013-14 FYTD 2014-15
Institutions 31.3% 43.0% 44.2% DPCS 16.2% 5.8% 13.3% Support 24.5% 28.8% 37.0% Total 27.8% 35.2% 39.2% Source: ODRC and DAS, Office of Fleet Management As shown in Table 1-14 and Table 1-15, the total percentage of ODRC’s fleet with probable inaccuracies in fuel expense is 39.2 percent for FYTD 2014-15, which has grown from 27.8 percent in FY 2012-13. The relatively low percentage within DPCS is most likely attributable to that division’s high utilization rate of the Voyager card for fuel purchases. Considering that a large number of ODRC vehicles have recorded either zero-values or under-estimates in FleetOhio fuel cost fields, it logically follows that there is a large amount of vehicle-related fuel expense occurring outside the direct visibility of ODRC’s central fleet management program. The relative level of vehicle fuel costs occurring in various channels has implications for what solutions are identified to improve fuel data records. Therefore an analysis was conducted to supplement the data-reliability component. Within ODRC, the two methods that currently exist to fuel vehicles are Voyager cards used at commercial gas stations and bulk fuel tanks within ODRC facilities. The fuel costs arising from
6 Specifically, the methodology obtained EPA fuel economy ratings for compact sedans, mid-size sedans, full-size sedans, SUVs, minivans, 1-ton vans, half-ton pickups, 3/4 ton pickups, and 1-ton pickups. An analysis in the form of Chart 1-8 was separately run for each category of vehicle, with the appropriate upper and lower bound MPG benchmark. Less common vehicle classes were excluded from this portion of the analysis, due to lack of reliable fuel-economy benchmarks. Excluded vehicle classes include buses, medium duty trucks, heavy duty trucks, and specialized vehicles.

Ohio Department of Rehabilitation and Correction Performance Audit
Page | 30
both methods are supposed to be aggregated to the individual-vehicle level and uploaded to FleetOhio, but because of shortcomings in the data-entry process described previously, ODRC believes some portion of the bulk fuel tank costs are never uploaded. Through a comparison of data from three sources, OAKS Business Intelligence reports of bulk fuel purchase transactions, a database of every fuel transaction conducted with Voyager cards, and fuel costs recorded in FleetOhio; a process of elimination can be used to build a complete picture of fuel spending within ODRC. Table 1-16 shows ODRC’s total fuel costs for the period FY 2011-12 to FYTD 2014-15 as well as the breakdown between fuel spending on Voyager cards and spending on bulk fuel. The bulk fuel expense number is derived from OAKS, and the Voyager expense number is derived from the database of Voyager transactions. Added together, they represent the total amount of fleet-related fuel expense at ODRC.7 To align with the ending-date in the FleetOhio dataset used later in the analysis, FYTD 2014-15 expenditures are aggregated through March 2015.
Table 1-16: Voyager and Bulk Fuel Purchases FY 2011-12 FY 2012-13 FY 2013-14 FYTD 2014-15
Total ODRC Fuel Usage $2,365,201 $2,290,816 $2,428,491 $1,972,621 Voyager $478,072 $439,101 $454,264 $346,481 Bulk Fuel Usage $1,887,129 $1,851,715 $1,974,228 $1,626,141
Source: ODRC; DAS, Office of Fleet Management; and OAKS As shown in Table 1-16, the majority of ODRC fleet fueling expense occurred though the bulk fuel tank program. In contrast to Voyager card purchasing, fueling at ODRC bulk fuel tanks is a low-tech process as there is no information technology in place to help automate the recording and data entry of fuel transactions. The table above provides circumstantial evidence as to why a significant amount of fuel costs appear to be missing from FleetOhio. More analysis, however, is needed to determine the value of fuel not recorded in FleetOhio. Starting with the value of total ODRC fuel usage calculated in Table 1-16, Table 1-17 subtracts out the cost of fuel recorded in FleetOhio to determine the remainder of fuel omitted from FleetOhio.
Table 1-17: Fuel Costs Purchase Breakdown FY 2011-12 FY 2012-13 FY 2013-14 FYTD 2014-15 Total ODRC Fuel Usage $2,365,201 $2,290,816 $2,428,491 $1,972,621
FleetOhio $1,248,992 $812,858 $975,052 $705,162 Not Recorded in FleetOhio $1,116,209 $1,477,958 $1,453,439 $1,267,459
Source: ODRC; DAS, Office of Fleet Management; and OAKS As Table 1-17 shows, between approximately 35 and 40 percent of ODRC fuel costs have been recorded in FleetOhio over the period shown. In FY2011-12, however, over half of ODRC’s fuel cost was logged in FleetOhio. No immediate explanations for the outlying year FY 2011-12 were
7 In compiling the total fuel expenditures from OAKS, fuel purchase transactions specifying an agriculture-related use were excluded, as the overall analysis in this report focuses only on plated ODRC vehicles.

Ohio Department of Rehabilitation and Correction Performance Audit
Page | 31
available, but it may warrant further investigation to see if any cost-effective process improvements were utilized in FY 2011-12. Having determined the amount of fuel cost missing from FleetOhio in Table 1-17, one further step in the analysis was needed to determine what portion of the unrecorded fuel cost could be attributed to Voyager purchases versus bulk fuel tank purchases. Though Voyager technically automates the recording of every fuel transaction to individual vehicles’ equipment IDs, this analysis does not automatically assume every Voyager transaction reaches the appropriate FleetOhio equipment ID. There remains the opportunity for human error in the Voyager program at the point of assigning a Voyager card to an individual piece of fleet inventory, because equipment IDs and VINs can be entered incorrectly. An analysis was conducted to match VINs and equipment IDs between the database of Voyager transactions and FleetOhio for FY 2011-12 to FYTD 2014-15. This analysis found $54,302 in Voyager transactions that could not be matched to vehicle IDs in FleetOhio in FY2013-14, and similar amounts in other years. Having calculated the amount of Voyager fuel costs that were both recorded and not recorded in FleetOhio, a simple subtraction of all the known terms allows the breakdown of bulk fuel recorded and not recorded in FleetOhio to be calculated. Table 1-18 summarizes the current state of fuel transactions at ODRC, including the two channels through which fuel is purchased and the extent to which each is being recorded in FleetOhio.
Table 1-18: Voyager vs Bulk Fuel in FleetOhio FY 2011-12 FY 2012-13 FY 2013-14 FYTD 2014-15 Total ODRC Fuel Usage $2,365,201 $2,290,816 $2,428,491 $1,972,621
Voyager - Recorded in FleetOhio $398,957 $364,497 $399,961 $250,722 Voyager - Not in FleetOhio $79,115 $74,604 $54,302 $95,759 Bulk Fuel Usage - Recorded in FleetOhio $850,036 $448,361 $575,091 $454,440 Bulk Fuel Usage - Not in FleetOhio $1,037,094 $1,403,354 $1,399,137 $1,171,700
Source: ODRC and DAS, Office of Fleet Management As shown in Table 1-18, of the two fuel purchase methods, Voyager leaves a more visible data trail in FleetOhio. In terms of the percentages of total costs captured in FleetOhio, in FY 2013-14 88.0 percent of fuel purchases made through Voyager were able to be traced back to FleetOhio whereas only 29.1 percent of bulk fuel costs were recorded in FleetOhio. With more than half of fleet-related fuel expenditures never being entered into FleetOhio, the current picture of fuel usage across ODRC divisions is very incomplete.

Ohio Department of Rehabilitation and Correction Performance Audit
Page | 32
Having produced counts of ODRC vehicles with zero-entries and problematic non-zero entries for the main categories of fleet data, these counts can be aggregated to help evaluate the scale of ODRC’s data quality issues. Chart 1-7 presents a summary of utilization data with probable inaccuracies for FYTD 2014-15. Vehicles with either zero utilization recorded or over 26,000 miles of utilization recorded in FleetOhio are included in these counts.
Chart 1-7: Annual Mileage – Probable Inaccuracies FYTD 2014-15
Source: ODRC and DAS, Office of Fleet Management As shown in Chart 1-7, there are 316 points of data entry with a high probability of inaccuracy in the current fiscal year. Specifically, 238 annual mileage entries were identified as zero-values with the remainder identified as having improbably high mileages. Inaccuracies are widely disbursed across ODRC divisions and vehicle types.
0
5
10
15
20
25
30
35
40
45Vehicle Type
BusCarFire TruckHeavy Duty TruckLight Duty TruckMedium Duty TruckMinivanPickup TruckPolice CarSpecialized VehicleSUVVan

Ohio Department of Rehabilitation and Correction Performance Audit
Page | 33
Chart 1-8 presents a summary of maintenance cost data with probable inaccuracies for FYTD 2014-15. Vehicles with either zero maintenance costs recorded or less than $0.045 maintenance cost per mile recorded in FleetOhio are included in these counts.
Chart 1-8: Maintenance Costs – Probable Inaccuracies FYTD 2014-15
Source: ODRC and DAS, Office of Fleet Management As shown in Chart 1-8, there are 990 points of data entry with a high probability of inaccuracy in the current fiscal year. Of these points of data, 652 maintenance cost entries were identified as zero-values with the remainder identified as having improbably low maintenance costs. Inaccuracies are widely disbursed across ODRC divisions and vehicle types.
0
20
40
60
80
100Vehicle Type
BusCarFire TruckHeavy Duty TruckLight Duty TruckMedium Duty TruckMinivanPickup TruckPolice CarSpecialized VehicleSUVVan

Ohio Department of Rehabilitation and Correction Performance Audit
Page | 34
Chart 1-9 presents a summary of fuel cost data with probable inaccuracies for FYTD 2014-15. Vehicles with either zero fuel costs recorded or with fuel costs that imply a mileage per gallon fuel usage outside the EPA-rated range are included in these counts.
Chart 1-9: Fuel Costs – Probable Inaccuracies FYTD 2014-15
Source: ODRC and DAS, Office of Fleet Management As shown in Chart 1-9, there are 772 points of data entry with a high probability of inaccuracy in the current fiscal year. Of these points of data, 335 fuel cost entries were identified as zero-values with the remainder identified as inconsistent with a reasonable fuel economy rating. Inaccuracies are widely disbursed across ODRC divisions and vehicle types. The previous three charts show the counts of total data points for probable inaccuracies across the three key fields in FleetOhio: annual mileage, maintenance cost and fuel cost. The vehicle counts in these individual charts cannot simply be summed to arrive at the total number of ODRC vehicles identified in the analysis, because some vehicles will have data-reliability issues across multiple categories. For this, a count of unique vehicles is needed.
0
10
20
30
40
50
60Vehicle Type
BusCarFire TruckHeavy Duty TruckLight Duty TruckMedium Duty TruckMinivanPickup TruckPolice CarSpecialized VehicleSUVVan

Ohio Department of Rehabilitation and Correction Performance Audit
Page | 35
Chart 1-10 shows the count of unique ODRC vehicles which were identified as having at least one zero value or probable inaccuracy in FleetOhio entries for annual mileage, maintenance cost, or fuel cost for FYTD 2014-15.
Chart 1-10: Unique ODRC Vehicles Identified in Data Quality Analysis FYTD 2014-15
Source: ODRC and DAS, Office of Fleet Management As shown in Chart 1-10, 1,006 vehicles within ODRC’s inventory have at least one probable data quality issue. This rate signifies that 81.7 percent of the 1,232 fleet inventory is missing at least one essential data point required to run the most basic types of fleet analysis.
0
10
20
30
40
50
60
70
80
90
100

Ohio Department of Rehabilitation and Correction Performance Audit
Page | 36
Conclusion The available data on the Department’s fleet is not sufficiently reliable for use in vehicle utilization and cycling analyses. Qualitative evidence gathered during the engagement established a historical condition indicating insufficient data collection and data entry into FleetOhio. Quantitative analyses revealed a substantial number of blank and zero-values in FleetOhio for required fields such as annual mileage, fuel cost, and maintenance costs. Further, a large additional number of fields with recorded entries in FleetOhio show signs of inaccuracies when compared to reasonable and conservative benchmarks. Because of the deficiencies identified in ODRC’s fleet dataset, it would not be prudent to build quantitative models, based on that data, to make management decisions about fleet size or cycling intervals. Recommendation 1.1: ODRC should implement a cost-effective solution that allows the Department to collect accurate and timely fleet data including:
Vehicle mileage and use; Maintenance and repair expense; and Fuel utilization and expense.
Financial Implication 1.1: Though the data collection recommendation does not specify a financial impact, full implementation will enable significant potential savings by allowing ODRC to identify both under-utilized vehicles and more efficient cycling intervals. Additional Consideration The next section of the report, R.2 Telematics, contains an analysis of an industry-standard technology solution that could automate the collection of much of the problematic data. The cost-effectiveness of implementing telematics in ODRC’s fleet operations will be studied in depth in the next section.

Ohio Department of Rehabilitation and Correction Performance Audit
Page | 37
2. Telematics
Section Overview R.1 Data Quality introduced a data-driven framework for sound fleet management and identified deficiencies in the Ohio Department of Rehabilitation and Correction’s (ODRC or the Department) current fleet data. This section focuses on the potential for ODRC to implement fleet telematics technology as a cost-effective means of fleet data collection. Furthermore, this section will analyze efficiencies arising from telematics in addition to data collection potential, based on the observed implementation results of comparable government fleets. Recommendation Overview Recommendation 2.1: ODRC should implement a fleet-wide telematics system which would, in parallel, fulfill the requirements of the Department’s fleet management duties (see R.1 Data Quality), as well as provide valuable fleet management data for use in creating a more efficient and cost effective fleet. Financial Implication 2.1: Through implementation and effective use of fleet management data collected by telematics hardware, ODRC could reduce costs by $348,807 annually. After using these savings to recoup an initial capital investment, a telematics implementation could result in a net annual savings ranging from $61,527 to $204,807, with $202,807 identified as the most reasonable estimate. Background In order to manage a fleet in an efficient and effective manner, fleet managers must have access to basic operating data such as:
Annual vehicle mileage; Vehicle utilization; Odometer readings; Fuel usage and cost; Maintenance usage and cost; Engine hours; and Preventative maintenance schedules.
Traditionally, fleet managers have relied on paper-based data tracking, observation, and reconciliation processes involving fuel and maintenance invoices to obtain fleet management data. Under this traditional operating model, fleet managers relied on field personnel to operate vehicles in an efficient and cost-effective manner with limited oversight. Advances in Fleet Management Information Systems (FMIS) have enabled a multitude of vehicle operating data to be captured in real-time. Additionally, telematics service providers are now able to build or contract the building of a technological interface between the telematics

Ohio Department of Rehabilitation and Correction Performance Audit
Page | 38
hardware and the FMIS of an end-user. Doing so creates an automated and routine data entry scheme which can drastically reduce the amount of labor-intensive data aggregation and entry that is necessary. Telematics, which encompasses a combination of vehicle-based computer and wireless communications technologies, is a relatively new data collection solution within the sphere of fleet management. The City of St. Louis, Missouri (St. Louis or the City) has been progressively implementing telematics in various portions of its fleet over the last 10 years. In 2014 the City issued a white paper documenting its telematics initiative which includes a brief background of telematics functionality. The report states that while most telematics systems include a global positioning system (GPS) component, the capabilities of modern systems extend beyond location tracking. Once installed in a vehicle, telematics devices are able to monitor vehicle systems such as engine, seat belts, and air bags. In cases where special vehicle equipment is installed, telematics has the capability log data and detect the operation of tailgates, refuse container pick-up arms, and salt spreaders. Over time, the capability of telematics has matured to make critical data points visible and readily available to fleet managers. The overarching field of telematics can be broken down into two types – active systems and passive systems. In an active system, captured vehicle data is uploaded immediately to remote data storage for aggregation and use. Additionally, active systems can be utilized, in real-time, to track vehicle location and/or movement metrics. These capabilities are useful for more efficient operations, such as for vehicle dispatching, or for more effective management, such as for snow removal or refuse collection. Alternatively, telematics can be utilized passively by capturing and collecting data while a vehicle is in use and then wirelessly connecting to a device (e.g., at the end of the day, week, month, etc.) onto which that vehicle’s dataset can be uploaded. At that point, the data can be aggregated, analyzed, and reported on. One of the capabilities which can greatly impact fleet management is the monitoring of a vehicle’s engine. This is achieved by interfacing telematics hardware with the vehicle’s onboard diagnostics (OBD) system. The contemporary OBD system of a vehicle is commonly utilized by mechanics to diagnose and pinpoint problems within the operating system of a vehicle. The reporting of these problems is achieved through “trouble codes” conveyed to the user upon a temporary connection of computer hardware, which maintains the ability to scan the OBD system for issues, to the vehicle. Historically, the evolution of an OBD system’s capability to interface with hardware and facilitate the collection of key fleet management data has happened over the course of the last 40 years Over time, the progression of hardware technology has led to the diagnostic standard OBD-II system with capabilities of detecting engine problems, collecting onboard data, as well as monitoring parts of the chassi, body, and accessory devices. Early iterations of OBD technology and capabilities were useful, but the major innovation for fleet management came with the combination of OBD and GPS tracking systems. Essentially, this combined the ability to track a vehicle’s onboard operating system in real-time, as well as its whereabouts, performance, and functions. By merging GPS technology with onboard hardware
Ohio Department of Rehabilitation and Correction Performance Audit
Page | 39
which monitors a vehicle’s operations, telematics facilitates access to a portfolio of available fleet management data which is nearly comprehensive in nature. Another factor influencing fleet efficiency is driver behavior. Actions taken by a vehicle operator involving speeding, failing to shut off the engine, jack-rabbit starts, and panic stops all have a negative effect on operating cost. Monitoring and minimizing the incidence of these behaviors are all part of effective telematics implementation and are an important component of cost reduction. Telematics facilitates the collection of raw data enabling the fleet manager to aggregate, analyze, report on, and manage to what matters. Further, telematics allows data to be analyzed individually or as a batch, in real time or at a later date, and in spreadsheet form or within pre-determined report formats pushed to the end-user by a service provider. Each of these capabilities is customizable to meet fleet management needs and practices. Additionally, data collected by GPS satellites can be used spatially, in conjunction with mapping or routing technologies, to improve the efficiency of routes utilized during work tasks. Similarly, spatial data of vehicles is often used in conjunction with geo-fencing8 as an added accountability measure for an organization.
8 Geo-fencing is a feature in a software program that uses GPS or radio frequency identification to define a virtual geographical operating boundary.
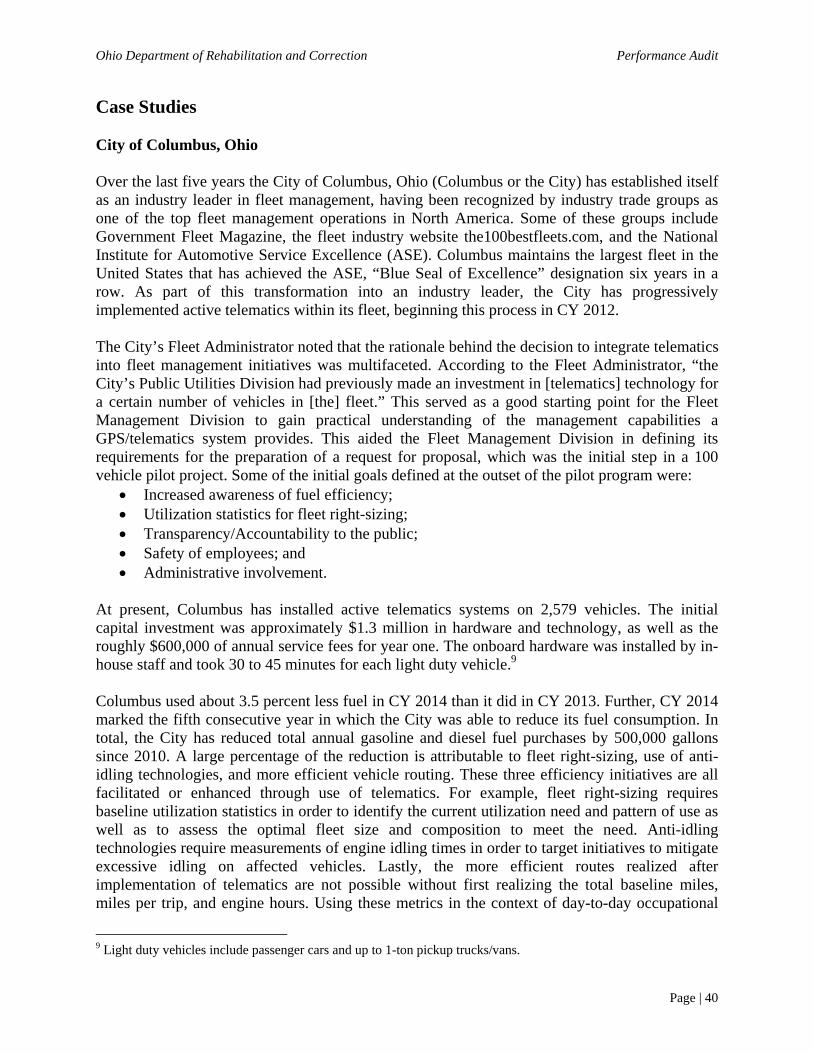
Ohio Department of Rehabilitation and Correction Performance Audit
Page | 40
Case Studies City of Columbus, Ohio Over the last five years the City of Columbus, Ohio (Columbus or the City) has established itself as an industry leader in fleet management, having been recognized by industry trade groups as one of the top fleet management operations in North America. Some of these groups include Government Fleet Magazine, the fleet industry website the100bestfleets.com, and the National Institute for Automotive Service Excellence (ASE). Columbus maintains the largest fleet in the United States that has achieved the ASE, “Blue Seal of Excellence” designation six years in a row. As part of this transformation into an industry leader, the City has progressively implemented active telematics within its fleet, beginning this process in CY 2012. The City’s Fleet Administrator noted that the rationale behind the decision to integrate telematics into fleet management initiatives was multifaceted. According to the Fleet Administrator, “the City’s Public Utilities Division had previously made an investment in [telematics] technology for a certain number of vehicles in [the] fleet.” This served as a good starting point for the Fleet Management Division to gain practical understanding of the management capabilities a GPS/telematics system provides. This aided the Fleet Management Division in defining its requirements for the preparation of a request for proposal, which was the initial step in a 100 vehicle pilot project. Some of the initial goals defined at the outset of the pilot program were:
Increased awareness of fuel efficiency; Utilization statistics for fleet right-sizing; Transparency/Accountability to the public; Safety of employees; and Administrative involvement.
At present, Columbus has installed active telematics systems on 2,579 vehicles. The initial capital investment was approximately $1.3 million in hardware and technology, as well as the roughly $600,000 of annual service fees for year one. The onboard hardware was installed by in-house staff and took 30 to 45 minutes for each light duty vehicle.9 Columbus used about 3.5 percent less fuel in CY 2014 than it did in CY 2013. Further, CY 2014 marked the fifth consecutive year in which the City was able to reduce its fuel consumption. In total, the City has reduced total annual gasoline and diesel fuel purchases by 500,000 gallons since 2010. A large percentage of the reduction is attributable to fleet right-sizing, use of anti-idling technologies, and more efficient vehicle routing. These three efficiency initiatives are all facilitated or enhanced through use of telematics. For example, fleet right-sizing requires baseline utilization statistics in order to identify the current utilization need and pattern of use as well as to assess the optimal fleet size and composition to meet the need. Anti-idling technologies require measurements of engine idling times in order to target initiatives to mitigate excessive idling on affected vehicles. Lastly, the more efficient routes realized after implementation of telematics are not possible without first realizing the total baseline miles, miles per trip, and engine hours. Using these metrics in the context of day-to-day occupational
9 Light duty vehicles include passenger cars and up to 1-ton pickup trucks/vans.
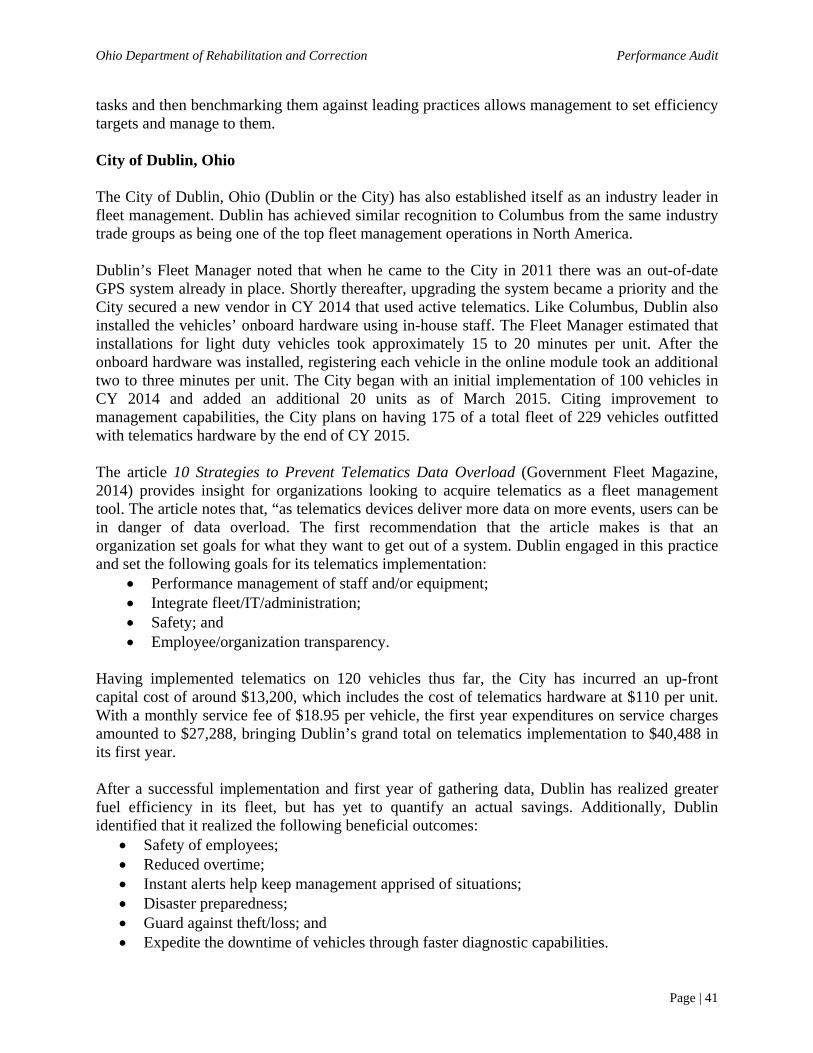
Ohio Department of Rehabilitation and Correction Performance Audit
Page | 41
tasks and then benchmarking them against leading practices allows management to set efficiency targets and manage to them. City of Dublin, Ohio The City of Dublin, Ohio (Dublin or the City) has also established itself as an industry leader in fleet management. Dublin has achieved similar recognition to Columbus from the same industry trade groups as being one of the top fleet management operations in North America. Dublin’s Fleet Manager noted that when he came to the City in 2011 there was an out-of-date GPS system already in place. Shortly thereafter, upgrading the system became a priority and the City secured a new vendor in CY 2014 that used active telematics. Like Columbus, Dublin also installed the vehicles’ onboard hardware using in-house staff. The Fleet Manager estimated that installations for light duty vehicles took approximately 15 to 20 minutes per unit. After the onboard hardware was installed, registering each vehicle in the online module took an additional two to three minutes per unit. The City began with an initial implementation of 100 vehicles in CY 2014 and added an additional 20 units as of March 2015. Citing improvement to management capabilities, the City plans on having 175 of a total fleet of 229 vehicles outfitted with telematics hardware by the end of CY 2015. The article 10 Strategies to Prevent Telematics Data Overload (Government Fleet Magazine, 2014) provides insight for organizations looking to acquire telematics as a fleet management tool. The article notes that, “as telematics devices deliver more data on more events, users can be in danger of data overload. The first recommendation that the article makes is that an organization set goals for what they want to get out of a system. Dublin engaged in this practice and set the following goals for its telematics implementation:
Performance management of staff and/or equipment; Integrate fleet/IT/administration; Safety; and Employee/organization transparency.
Having implemented telematics on 120 vehicles thus far, the City has incurred an up-front capital cost of around $13,200, which includes the cost of telematics hardware at $110 per unit. With a monthly service fee of $18.95 per vehicle, the first year expenditures on service charges amounted to $27,288, bringing Dublin’s grand total on telematics implementation to $40,488 in its first year. After a successful implementation and first year of gathering data, Dublin has realized greater fuel efficiency in its fleet, but has yet to quantify an actual savings. Additionally, Dublin identified that it realized the following beneficial outcomes:
Safety of employees; Reduced overtime; Instant alerts help keep management apprised of situations; Disaster preparedness; Guard against theft/loss; and Expedite the downtime of vehicles through faster diagnostic capabilities.
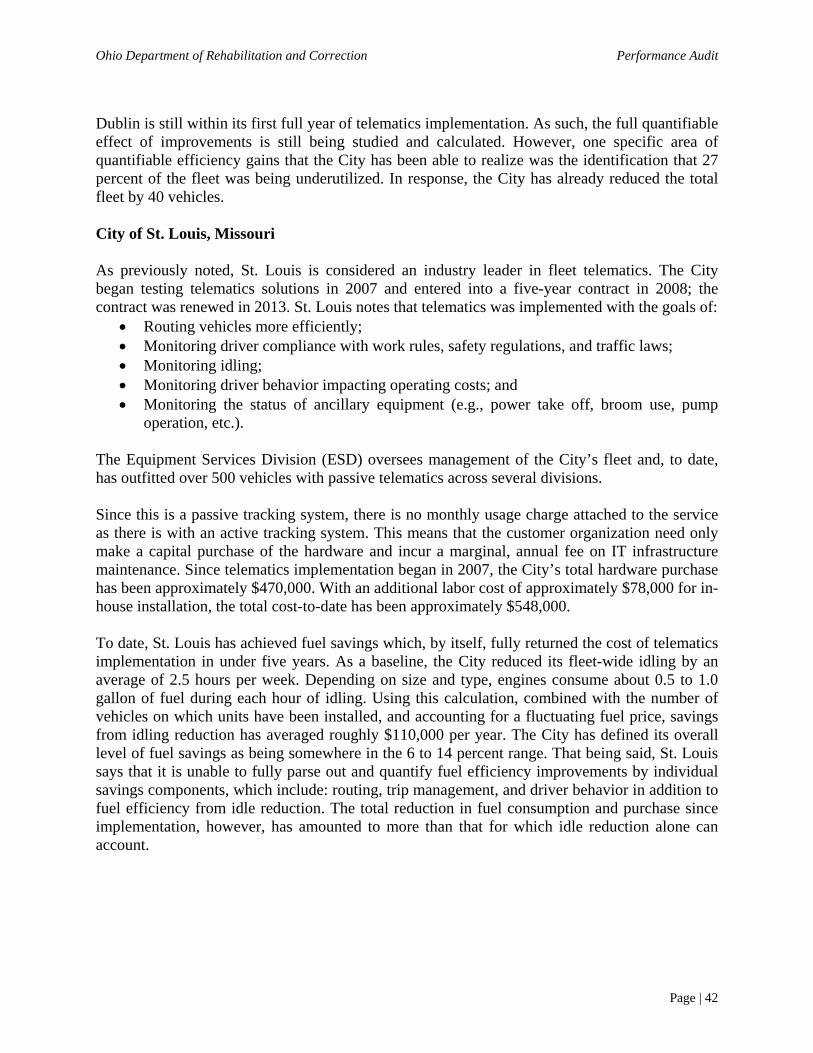
Ohio Department of Rehabilitation and Correction Performance Audit
Page | 42
Dublin is still within its first full year of telematics implementation. As such, the full quantifiable effect of improvements is still being studied and calculated. However, one specific area of quantifiable efficiency gains that the City has been able to realize was the identification that 27 percent of the fleet was being underutilized. In response, the City has already reduced the total fleet by 40 vehicles. City of St. Louis, Missouri As previously noted, St. Louis is considered an industry leader in fleet telematics. The City began testing telematics solutions in 2007 and entered into a five-year contract in 2008; the contract was renewed in 2013. St. Louis notes that telematics was implemented with the goals of:
Routing vehicles more efficiently; Monitoring driver compliance with work rules, safety regulations, and traffic laws; Monitoring idling; Monitoring driver behavior impacting operating costs; and Monitoring the status of ancillary equipment (e.g., power take off, broom use, pump
operation, etc.). The Equipment Services Division (ESD) oversees management of the City’s fleet and, to date, has outfitted over 500 vehicles with passive telematics across several divisions. Since this is a passive tracking system, there is no monthly usage charge attached to the service as there is with an active tracking system. This means that the customer organization need only make a capital purchase of the hardware and incur a marginal, annual fee on IT infrastructure maintenance. Since telematics implementation began in 2007, the City’s total hardware purchase has been approximately $470,000. With an additional labor cost of approximately $78,000 for in-house installation, the total cost-to-date has been approximately $548,000. To date, St. Louis has achieved fuel savings which, by itself, fully returned the cost of telematics implementation in under five years. As a baseline, the City reduced its fleet-wide idling by an average of 2.5 hours per week. Depending on size and type, engines consume about 0.5 to 1.0 gallon of fuel during each hour of idling. Using this calculation, combined with the number of vehicles on which units have been installed, and accounting for a fluctuating fuel price, savings from idling reduction has averaged roughly $110,000 per year. The City has defined its overall level of fuel savings as being somewhere in the 6 to 14 percent range. That being said, St. Louis says that it is unable to fully parse out and quantify fuel efficiency improvements by individual savings components, which include: routing, trip management, and driver behavior in addition to fuel efficiency from idle reduction. The total reduction in fuel consumption and purchase since implementation, however, has amounted to more than that for which idle reduction alone can account.

Ohio Department of Rehabilitation and Correction Performance Audit
Page | 43
St. Louis also highlights improved risk management. Of some of its employees, the City said, “Simple observation, citizen complaints and crash reports supported by telematics data evidence shows that many don’t wear seatbelts, exceed speed limits, make panic stops indicating inattention, and change lanes aggressively. These actions place City employees and the public at unnecessary risk of injury. These actions also expose the City to loss claims under workers compensation and through civil lawsuits.” Risk management is an area where quantifiable savings are not as easily calculated, at least in the short term, since the savings are derived from foregone payments on accidents that never occurred. As noted, driver behavior has an impact on operating and maintenance cost (e.g., tires, brakes, collision repairs, etc.), but this has not been quantified. Finally, St. Louis has experienced positive outcomes in tracking employee efficiency through vehicle telematics. The City noted that, “some City employees abuse the privilege of operating a City vehicle by driving it on personal errands, operating it outside their authorized area of responsibility, parked and sleeping when they should be working, or committing theft or fraud. Many of these behaviors can be identified through review of telematics collected data and that data can be used as supporting evidence for disciplinary actions which may result from further investigation. The use of geo-fencing as a telematics analysis feature is particularly useful in this regard. The City has designated numerous locations throughout the City to report time spent and monitored activities within these zones.” Although this is another area that is hard to quantify in terms of financial savings, there is evidence of quality service delivery to citizens. Arkansas State Highway and Transportation Department The Arkansas State Highway and Transportation Department (ASHTD) has over 3,000 employees and is responsible for management of 16,398 miles of State and US highways. In carrying out this responsibility, ASHTD maintains over 2,400 on-road passenger vehicles used for highway maintenance, transportation, administration, construction, and law enforcement. ASHTD began implementation of telematics in 2012 as a way to streamline fleet management practices and increase accountability. To date, ASHTD has incurred $660,000 in up-front capital purchase of telematics hardware for their 2,400 vehicles. Additionally, ASHTD pays a $21.95 monthly service fee per unit, which equates to an annual cost of $632,160. Prior to awarding a telematics contract, ASHTD defined implementation goals and objectives, including:
Ease of installation of the hardware; Creation of a user-friendly web portal for administration to navigate; Ability to monitor driver behavior; Increased accountability/transparency for the department; Ability to document worker efficiency; Capacity to manage to vehicle cost-efficiency; and Agency compliance.
ASHTD used these goals and objectives as a basis to define system requirements such as a data and automated report need, and ultimately procured an active telematics system. ASHTD reports that since implementation it has used telematics to realize a 2-to-1 return on investment. Savings

Ohio Department of Rehabilitation and Correction Performance Audit
Page | 44
have been realized primarily through fuel efficiency as a result of improved driver behavior. Within ASHTD, telematics implementation and operation is overseen by the Equipment and Procurement Division. The Division Head identified that since implementation, ASHTD is “experiencing considerably [fewer] speeding incidences. Every one mile per hour over the speed limit costs the Department approximately one [percent] in fuel economy as well as decreased life of tires and brakes.” Additionally, fuel savings have been realized through a significant reduction in vehicle idling. Upon implementing telematics it was determined that ASHTD’s fleet averaged 35 percent idle time. According to the Department Head, an “idle time reduction of 10 [percent] can result in an increase of 6 [to] 8 [percent] in MPG. [ASHTD’s] goal was to reduce average idle time to 20 [percent].” Table 2-1 shows ASHTD’s average annual gallons of gasoline and diesel purchased pre- and post-telematics implementation.10 Further, this reduction is quantified using the average post-implementation fuel cost. This type of analysis demonstrates the potential for significant positive gains from implementing telematics.
Table 2-1: ASHTD Telematics Impact on Fuel Purchases Fuel Purchases Pre-Telematics Implementation Total Gallons
Average Annual Gallons of Gasoline Purchased 2,011,872 Average Annual Gallons of Diesel Purchased 2,219,676 Average Annual Total Gallons of Fuel Purchased 4,231,548
Fuel Purchases Post-Telematics Implementation Total GallonsAverage Annual Gallons of Gasoline Purchased 1,715,256 Average Annual Gallons of Diesel Purchased 2,156,700 Average Annual Total Gallons of Fuel Purchased 3,871,956
Post-Implementation Fuel Reduction Savings Gasoline Gallons Purchase Reduction (296,616) Gasoline Gallons Purchase Percent Reduction (14.7%) Average Cost per Gasoline Gallon Post-Implementation $3.31 Total Savings from Gasoline Purchase Avoidance ($981,799) Diesel Gallons Purchased Reduction (62,976) Diesel Gallons Purchased Percent Reduction (2.8%) Average Cost per Diesel Gallon Post-Implementation $3.32 Total Savings from Diesel Purchase Avoidance ($209,080) Total Gallons Purchase Reduction (Gasoline and Diesel) (359,952) Total Gallons Purchase Percent Reduction (Gasoline and Diesel) (8.5%) Total Cost Savings from Fuel Purchase Avoidance (Gasoline and Diesel) ($1,190,879) Source: ASHTD As shown in Table 2-1, ASHTD experienced an average annual total fuel reduction of 359,952 gallons or 8.5 percent. The reduction in fuel purchases amounts to a total annual savings of $1,190,879. The largest gains are from gasoline fuel purchase reductions of $981,799 annually;
10 Average annual purchases pre-implementation are calculated based on the 60-month period encompassing July 2007 to June 2012. Average annual purchases post-implementation are calculated based on the 20 month period from July 2012 to March 2014.

Ohio Department of Rehabilitation and Correction Performance Audit
Page | 45
based on a reduction of 296,616 gallons or 14.7 percent. To a lesser extent, but still significant to the overall gains, are diesel fuel purchase reductions of $209,080 annually; based on a reduction of 62,976 gallons or 2.8 percent. ASHTD also realized a total reduction of 1,733,434 miles after implementation of telematics. In quantifying total savings from a reduction in miles driven, the total cost-per-mile figure provided by ASHTD did not separate out the impact of reduced miles driven from the impact of reduced fuel consumption. Therefore this report does not include ASHTD’s total savings or its savings from a reduction in miles driven as a benchmark, to avoid double-counting the savings already reported. That being said, the reduction in number of miles driven most certainly had an impact on cost for ASHTD, but it remains unquantifiable at this time. Methodology This section of the performance audit enumerates the costs associated with ODRC’s current-state management and collection of fleet data, and contrasts the current costs with the cost of using a telematics solution for data collection. The quality of fleet data and management oversight was identified as an area of concern both by the Department administration and through the quantitative evaluation in R.1 Data Quality, set forth earlier in this report. Once ODRC’s potential need for a different approach to fleet data collection was established, a review of the possible solutions included implementation of telematics systems. As this was something ODRC administration was already considering, the first steps toward determining an ROI involved sizing the unit cost of implementation. Several vendors were researched for the purposes of benchmarking the cost structure of a product that fit ODRC’s data collection needs. This proposal is used only as a proxy cost in the following analysis, as practical acquisition of such a system by ODRC would involve a formal bid process. Data and information was provided by the Department assist in estimating the labor hours from various job titles tasked with aggregating fleet data. Financial data associated with ODRC fleet management and travel reimbursement was obtained through the Ohio Administrative Knowledge System (OAKS), and personnel data was acquired through the Ohio Hiring Management System (OHMS). Additional data and criteria was gathered from industry leading public organizations, telematics service providers, and fleet publications for use in the calculation of potential savings to be realized through the potential implementation of a GPS/telematics system. This was supplemented by the testimonial evidence from ODRC administrative staff, fleet management personnel, and staff supervisors who act as end-users of fleet data to facilitate operational management. Data and analysis focused on fleet and travel expenses for FY 2012-13 through FYTD 2014-15.
Once costs for telematics implementation were established, criteria for potential savings based on other organizations’ practical experience implementing telematics was gathered. The savings realized by these organizations was applied to ODRC’s current operating structure to obtain a potential payback period for an investment in a data collection solution.
Ohio Department of Rehabilitation and Correction Performance Audit
Page | 46
Analysis Effective implementation of telematics has been linked to positive outcomes in government fleets. Some of these outcomes are easily measured and can be categorized as quantifiable outcomes. Quantifiable outcomes are the main focus of the analysis to follow. Other outcomes are less easily quantified and can be categorized as beneficial outcomes. Beneficial outcomes generally include:
Increased safety for employees and the general public; Increased accountability and transparency for a public organization; Improved disaster preparedness; and Increased operational visibility for management.
Given that ODRC is tasked with effectively managing and controlling offenders’ movements inside and outside of institutional facilities, the beneficial outcomes of increased safety and visibility may be especially desirable for the Department. Real-time visibility into vehicle locations and movements could be particularly valuable in monitoring the transport of offenders between institutional locations and in tracking parole officers who regularly visit offenders once outside of institutions. Although beneficial outcomes should be weighted into the decision to invest in fleet telematics, when assessing the potential return on investment (ROI), the quantifiable savings take precedent. Quantifiable savings typically take the form of:
Reductions in labor required for data management; Decreases in fuel cost; and Improvements in vehicle utilization (e.g., more efficient use of fewer vehicles and
avoidance of unnecessary cost such as mileage reimbursements when vehicles are going unused).
Telematics Implementation and Operating Cost As previously mentioned, the cost of a telematics system can vary based on multiple factors including:
Service provider; Type of hardware being installed; Number of units being installed; Outsourced or in-house installation; Passive versus Active tracking system; and IT interoperability with organizational network.
R.1 Data Quality identified a number of ODRC’s current fleet data management deficiencies. These deficiencies, coupled with the identified causes of the deficiencies, help to inform and define the likely system requirements that the Department would seek in procuring telematics. As there are a number of potential service providers in the telematics industry, ODRC should undertake an evaluation of these providers as well as examples of contracts in place with other governmental entities to more fully understand the up-front and ongoing investment cost.

Ohio Department of Rehabilitation and Correction Performance Audit
Page | 47
Table 2-2 shows the vendor cost structure for implementing telematics systems at four comparable government entities in recent years. Pricing information includes the unit cost of both up-front capital costs and ongoing operating fees, and was provided by both government entities and service providers. For comparability, each pricing model uses 1,200 as a proxy number of vehicles to which a vendor’s unit-cost structure is applied.
Table 2-2: Example Service Provider Implementation Cost Proposal Entity A Entity B Entity C Entity D
Up-Front Capital Cost per Unit $125.00 $209.00 $110.00 $110.00 Up-Front Capital Cost for IT Infrastructure N/A $10,000 N/A N/A
Number of Vehicles with Installed Units 1,200 1,200 1,200 1,200 Total Up-Front Cost $150,000 $260,800 $132,000 $324,000
Monthly Cost per Vehicle $10.00 $10.00 $18.95 $19.95
Number of Months 12 12 12 12
Follow-on IT Maintenance Cost N/A $2,000 N/A N/A
Number of Vehicles with Installed Units 1,200 1,200 1,200 1,200
Total Ongoing Operating Cost $144,000 $146,000 $272,880 $287,280 Source: Telematics service providers and government entities As shown in Table 2-2, the mix of up-front and ongoing operating costs varied among the four government entities. Entity A and Entity B attained the lowest pricing in the comparable set. It is highly likely that the lower pricing shown for Entity A and Entity B is a more realistic estimate of the pricing terms ODRC could achieve when compared to Entity C and Entity D. In the bid process, Entity C and Entity D both required the chosen vendor to provide a custom integration with an existing information-technology system, which is a dynamic that would not be relevant to ODRC. ODRC’s Labor Cost of Data Collection According to ODRC’s Fleet Administrator, the Department has 29 separate vehicle operating locations; each of which is required to record, aggregate, and enter vehicle data into a centralized system. For example, each operating location is required to report monthly on: bulk fuel purchases, fuel tank utilization, vehicle utilization, non-bulk fuel purchases and utilization, and vehicle maintenance purchases. The Fleet Administrator estimates that the labor effort required to accomplish this data collection, aggregation, and reporting amounts to approximately 3 percent of total time for the business administrator at each location. Table 2-3 shows a calculation of the cost associated with the minimum fleet management data collection, aggregation, and reporting requirement for each ODRC operating location. The Business Administrator 3 position accounted for 26 of the 29 employees in the business administrator classification based on FY 2014-15 payroll. As such, the lower-bound of hourly wage for the Business Administrator 3 position was used to calculate a conservative labor cost for fleet data management.

Ohio Department of Rehabilitation and Correction Performance Audit
Page | 48
Table 2-3: Operating Location Labor Cost for Fleet Data Management
Business Administrator 3 Minimum Hourly Wage 1 $39.81 Average Hours Worked per Month 173.33 Estimated Percent of Time Spent on Fleet Data Management per Month 3.0% Estimated Hours Spent on Fleet Data Management per Month 5.20 Annual Hours Spent on Fleet Data Management 62.40 Business Administrator 3 Total Annual Cost $2,484.23 Operating Locations Reporting Fleet Data 29 Total Annual Operating Location Cost for Fleet Data Management $72,043 Source: ODRC, Ohio Hiring Management System, and OAKS 1 Includes a base hourly wage of $27.93 and ODRC’s benefits percentage of 42.54 percent (i.e., $11.88 per hour). As shown in Table 2-3, when aggregating the estimated labor across all ODRC operating locations responsible for fleet data management there is an annual total labor effort of 1,809.6 hours (calculated by 62.4 hours per employee across 29 locations) at a total cost of $72,043. Once fleet data is collected and aggregated at each operating location it is then reported to the Fleet Administrator in Columbus, Ohio. During the course of the audit it was noted that at one point the Fleet Administrator had an account clerk that was specifically responsible for entering and aggregating reported fleet data into FleetOhio as well as any system of documentation internal to ODRC. As highlighted in R.1 Data Quality, there are significant portions of fleet data that are either missing or are clearly incorrect. As such, there may be a need for this type of position should ODRC choose to proceed with the current manner of manually fulfilling data collection and reporting requirements. Under a telematics solution, however, the automation of data-entry would likely negate the need to utilize this account clerk. Table 2-4 shows the cost associated with a Central Office account clerk with the role of entering and aggregating fleet data. The Account Clerk 2 position accounted for 139 of the 142 employees in the account clerk classification based on FY 2014-15 payroll. As such, the lower-bound of hourly wage for the Account Clerk 2 position was used to calculate a conservative labor cost for fleet data management.
Table 2-4: Central Office Fleet Data Entry Labor Cost Account Clerk 2 Minimum Hourly Wage 1 $22.26 Total Compensated Hours per Year 2,080 Total Annual Cost for Central Office Fleet Data Entry $46,311 Source: ODRC, Ohio Hiring Management System, and OAKS 1 Includes a base hourly wage of $15.62 and ODRC’s benefits percentage of 42.54 percent (i.e., $6.64 per hour). As shown in Table 2-4, the cost of an account clerk to assist with Central Office fleet data entry is $43,311 per year.

Ohio Department of Rehabilitation and Correction Performance Audit
Page | 49
Annual ODRC Fuel Cost for Vehicle Usage Within the group of telematics’ “quantifiable outcomes”, one of the most readily and commonly quantifiable areas is fuel cost. Ways in which telematics reduces fuel consumption include the identification and elimination of:
Unnecessary speeding events (meaning vehicles traveling in excess of the speed at which fuel economy is optimized);
Avoidable acceleration events; Unnecessary idling times; Unnecessary mileage; and Untimely preventative maintenance activities (e.g., engine care, tire pressure, etc.)
Items in this grouping fall under the category of driver behavior, and as such, realizing the resulting fuel savings requires visibility into these incidents, setting goals to reduce them, and holding employees accountable. While the mechanisms for achieving fuel savings require detailed data at the level of individual drivers, the available benchmarks for quantifying savings are derived based on reductions of overall fleet fuel costs. To arrive at ODRC’s overall fleet fuel costs, the ROI analysis uses the Department’s total fleet-related fuel expense derived in R.1 Data Quality, which was calculated as the sum of bulk fuel purchases in OAKS and Voyager card transactions. Table 2-5 shows the total amount spent on vehicle fuel from Voyager and OAKS bulk fuel purchase records for the last three complete fiscal years, FY 2011-12 to FY 2013-14, as well as FYTD 2014-15. As FYTD 2014-15 is an incomplete total, an average of the last three complete fiscal years was taken for the purposes of this analysis.
Table 2-5: ODRC Fuel Purchases FY 2011-12 FY 2012-13 FY 2013-14 FYTD 2014-15 1
Voyager Fuel Purchases $478,072.10 $439,101.41 $454,263.50 $346,480.69Bulk Vehicle Fuel Purchases $1,887,129.35 $1,851,715.04 $1,974,227.61 $1,626,140.51Total ODRC Fleet Fuel Purchase $2,365,201.45 $2,290,816.45 $2,428,491.11 $1,972,621.20Source: OAKS and DAS Note: Includes fuel for on and off-road passenger vehicles only. 1 FYTD 2014-15 totals are as of the end of March 2015. As shown in Table 2-5, ODRC’s total annual fuel cost has remained fairly consistent within the last three, complete fiscal years. Further, FYTD 2015 is on a similar trajectory as previous years. The average total ODRC fleet fuel purchase for the period FY 2011-12 through FY 2013-14 was $2,361,503. Cost of Mileage Reimbursement Above DAS Break-Even Point Ohio Revised Code § 125.832(O)(2) states that DAS must annually establish the number of business miles an employee of a state agency must drive in order to qualify for approval of an assigned vehicle. This number is based on various operating cost factors and, as such, fluctuates

Ohio Department of Rehabilitation and Correction Performance Audit
Page | 50
annually. It is published by DAS in the Fleet Plan Guide issued prior to the start of each fiscal year. For the last three fiscal years, the break-even mileages were:
FY 2012-13: 8,037 miles; FY 2013-14: 8,200 miles; and FY 2014-15: 6,800 miles.
For each of the last three complete fiscal years, ODRC has had at least 30 employees who were reimbursed mileage over and above the DAS threshold. This means that for these 30 employees it would have been more cost-effective to have assigned a vehicle rather than have paid mileage. Further, for all three years, between 87 and 95 percent of these individuals were identified as being part of ODRC’s Division of Parole and Community Services (DPCS or the Division). This is not unexpected as many staff within this Division have roles that require an extensive amount of driving as part of the everyday job duties. At present, the Division is organized into seven geographic regions with five support centers. Every geographic region has a pool of vehicles available for use by Division personnel. However, given the current shortcomings of fleet management data (see R.1 Data Quality), it is difficult for ODRC to measure current vehicle demand and then properly size vehicle pools to meet demand efficiently. DPCS management’s perception is that the demand for regional pool vehicles frequently outstrips the supply of vehicles, necessitating personal mileage use by parole officers. This perception was reaffirmed, at least for one region, through a study of the Division’s Franklin County Office. Parole officers’ personal mileage was compared to the mileage used on the seven pool vehicles available to them during FY 2013-14. These seven shared cars accumulated 118,374 miles during the year, while 21 parole officers on staff were reimbursed for an additional 41,212 miles. Based on the DAS guidance for FY 2013-14, owning a pool car would break even financially if utilized to absorb at least 8,200 miles in personal mileage reimbursement. With 41,212 personal miles available to absorb, it is likely that at least one additional pool car could have been utilized in excess of the break-even mileage. Reaching a definitive answer on whether additional pool cars could have been utilized would require granular detail on the availability and utilization of the existing pool cars by calendar day. Telematics could automate the collection of the needed data as well as automate the analysis so that the Fleet Administrator could easily reach these types of decisions regarding the correct size of vehicle pools. The calendar-day level of data captured by telematics could just as easily identify vehicle pools within ODRC where the pool size is too large relative to current demand. During the course of the audit, ODRC staff suggested that the Central Office pool may be underutilized. As a result, an additional study was performed; this time with the benefit of a printed calendar that showed available pool vehicles and reservations for each day of the year for calendar year (CY) 2014. The total inventory of the central office pool averaged 16 cars during CY 2014, and analysis showed that there was at least 1 car sitting idle on 223 out of 251 business days, or 88.8 percent of business days. Furthermore, there were more than 5 idle cars on 132 days of 251 business days, or 52.6 percent, and the overall utilization rate of the pool was 62.0 percent. Finding complementary matches between pools that may be undersized, such as DPCS’ Franklin County Office pool, and oversized, such as the Central Office pool, likely can identify vehicle

Ohio Department of Rehabilitation and Correction Performance Audit
Page | 51
efficiencies that have the potential to effectively replace the need for personal mileage at no additional cost to the Department. Unlocking this potential requires the ability to analyze these opportunities in an automated fashion. This is a standard capability of telematics and one of the significant opportunities for telematics to earn additional returns. By analyzing historical data on employee personal mileage reimbursements, it is possible to quantify a portion of the opportunity-size for this aspect of telematics. Table 2-6 shows ODRC’s total mileage reimbursements for all employees exceeding the DAS break-even threshold for the last two complete fiscal years, FY 2012-13 and FY 2013-14, as well as FYTD 2014-15. Since FYTD 2014-15 is an incomplete total as of March 2015, a projected total was calculated based on employee use-rates.
Table 2-6: Total Cost of Mileage Reimbursement Above DAS Break-Even Count of
Individuals Total Miles Reimbursed Reimbursement Rate Total Reimbursement
FY 2012-13 42 462,042 $0.45 $207,918 FY 2013-14 30 357,458 $0.52 $185,878 FY 2014-15 1 34 308,927 $0.52 $160,641 Source: ODRC 1 Total miles reimbursed and total reimbursement are projected based on the employee use-rates through the first three quarters of FY 2014-15. As shown in Table 2-6, the total annual value of reimbursement for just individuals who exceeded the DAS break-even mileage ranged from as low as $160,641 in FY 2014-15 to as high as $207,918 in FY 2012-13. This is a significant opportunity to reduce cost, especially considering that it may be achievable through reallocation of existing vehicles. Provided with more comprehensive fleet management data, ODRC should be able to right-size the various groups of pooled vehicles within the organization and avoid this substantial personal mileage reimbursement. Telematics Return on Investment A small portion of the required fleet management data, such as maintenance costs not being recorded by a Voyager card, will still require some amount of labor input (e.g., account clerk and business administrator labor). As such, a complete reduction of labor costs cannot be assumed. However, a good portion of the labor committed to the aggregation and entry of fleet data would be mitigated by utilizing telematics. Additionally, attempting to estimate the potential for a reduction in fuel expense based on the experience of other organizations can result in unsuitable comparisons. Any number of factors can be misaligned and result in an incongruity. For example, the type of fuel used, type and size of vehicles, use profile, or level of implementation may result in an invalid comparison. The range of percent fuel savings identified for use in this analysis has been realized by a combination of organizations which have an overall fleet profile that is suitable for comparison to that of ODRC. Furthermore, the overall 8.5 percent fuel savings used from ASHTD is a combination of an almost 15.0 percent savings on gasoline and just under 3.0 percent savings on diesel fuel. Given the fact that the number of vehicles utilized by ODRC which require the use of unleaded gasoline is substantially higher than that which requires diesel fuel, the opportunity to realize a number closer to ASHTD’s unleaded gasoline savings exists.

Ohio Department of Rehabilitation and Correction Performance Audit
Page | 52
However, lacking the ability to statistically pinpoint exactly how much fuel purchased was unleaded gasoline and how much was diesel fuel, use of the 8.5 percent combined savings is a conservative starting number. Lastly, the potential savings derived from an increased ability to cost-effectively manage vehicle pools and personal mileage reimbursements is conservatively modeled on real-world passenger vehicle operating expenditures from the Ohio Department of Transportation (ODOT). ODOT maintains a robust and extensive dataset on which to base a reliable cost of maintenance and operation of vehicles. Table 2-7 shows the potential to derive savings from improved pool vehicle management to reduce mileage reimbursement. This model assumes ODRC is balancing supply and demand for pooled vehicles as a result of better management data. The ownership cost is based on a cost of $0.18 per mile operating cost of mid-size sedans realized by ODOT for the mileage range at which ODRC cycles out vehicles. Further, this analysis only takes into account those employees that were reimbursed for personal mileage in excess of the DAS break-even point.
Table 2-7: Potential Savings from Reduced Mileage Reimbursement Count of
Individuals Reimbursed Mileage Cost
Alternative Vehicle Cost Cost Savings
FY 2012-13 42 $207,918 $150,660 ($57,257) FY 2013-14 30 $185,878 $115,714 ($70,163) FYTD 2014-15 1 34 $160,641 $90,669 ($69,971) Three-Year Average 35 $184,812 $119,015 ($65,797) Source: OAKS and GasBuddy Note 1: Assumes 24 miles per gallon based on EPA “Combined MPG” for ODRC’s three most common mid-size sedans. Note 2: Fuel cost per gallon is based on historical unleaded gasoline prices from retail vendors. As shown in Table 2-7, the three-year average annual savings is $65,797.77. This amount is used in Table 2-8 as part of the potential savings attributed to telematics implementation.

Ohio Department of Rehabilitation and Correction Performance Audit
Page | 53
Table 2-8 shows a breakdown of the component parts which make up the sum of potential savings to be realized upon implementation of a telematics solution. The potential savings exist in the areas of labor, fuel, and mileage reimbursement reduction.
Table 2-8: Telematics Savings Breakdown Potential Labor Reduction Savings
Business Administrator 3 Labor Cost $72,042.75 Percent Reduction in Labor Need (50.0%) Operating Locations Reduction in Labor Cost ($36,021.37) Account Clerk 2 Labor Cost $46,310.68 Central Office Reduction in Labor Cost ($46,310.68) Total Reduction in Labor Cost ($82,332.05)
Potential Fuel Reduction Savings Avg. Annual Total Fuel Expenditure $2,361,503.00 Percent Reduction in Fuel Use (8.5%) Total Reduction in Fuel Cost ($200,727.76)
Potential Mileage Reimbursement Savings Total Reduction in Mileage Reimbursement ($65,797) Telematics Total Potential Savings $348,807.58 Source: ODRC, DAS, and OAKS As shown in Table 2-8, the telematics total potential savings from the three areas presented is $348,807.58. This is a gross savings amount before telematics capital payback and annual fees and expenses. Table 2-9 provides a range of potential net savings, accounting for telematics vendor costs in addition to the potential gross savings, for the four vendor cost structures previously surveyed in Table 2-2. The net savings is equal to the ‘Cost Reduction Result of Telematics’ minus ‘Total Ongoing Operating Cost.’
Table 2-9: Range of Net Savings Resulting from Telematics Entity A Entity B Entity C Entity D
Monthly Cost per Vehicle $10.00 $10.00 $18.95 $19.95
Number of months 12 12 12 12
Follow-on IT Maintenance Cost N/A $2,000 N/A N/A
Number of Cars 1,200 1,200 1,200 1,200
Total Ongoing Operating Cost $144,000 $146,000 $272,880 $287,280
Cost Reduction Result of Telematics $348,807 $348,807 $348,807 $348,807
Net Savings $204,807 $202,807 $75,927 $61,527 Source: ODRC, DAS, OAKS, government entities, and telematics service providers

Ohio Department of Rehabilitation and Correction Performance Audit
Page | 54
As shown in Table 2-9, investment in telematics produces a positive net savings under all four pricing scenarios. The telematics costs of Entity A and Entity B were previously determined to be the most realistic benchmark for what ODRC could achieve, and so the more conservative net savings calculation among those comparables is used as the baseline estimate of ODRC’s likely net savings: $202,807 under the pricing of Entity B. Under the analysis’ saving assumptions and the pricing assumptions under Entity B, ODRC would fully recoup capital costs of telematics implementation during the second year of operations. By only quantifying the most immediate benefits of telematics (e.g., reduced fuel consumption, labor cost avoidance related to data entry, and more efficient pool car management) this analysis takes a conservative approach to estimating the payback period and potential annual savings. In reality, there are even more opportunities that exist to realize savings in areas such as maintenance, net fleet reductions, reduction in miles traveled, and employee efficiency. Conclusion ODRC’s current fleet data collection and entry process have resulted in deficiencies in FleetOhio records (see R.1 Data Quality). Based on available data, implementing a telematics solution is a cost-effective way for the Department to address its data collection deficiencies while also enabling additional fleet management improvements. These additional fleet management improvements will not only help to more effectively manage the fleet, but will also result in efficiencies and cost savings as the fleet is improved over time. Recommendation 2.1: ODRC should implement a fleet-wide telematics system which would, in parallel, fulfill the requirements of the Department’s fleet management duties (see R.1 Data Quality), as well as provide valuable fleet management data for use in creating a more efficient and cost effective fleet. Financial Implication 2.1: Through implementation and effective use of fleet management data collected by telematics hardware, ODRC could reduce costs by $348,807 annually. After using these savings to recoup an initial capital investment, a telematics implementation could result in a net annual savings ranging from $61,527 to $204,807, with $202,807 identified as the most reasonable estimate. Additional Consideration It may be prudent to implement fleet telematics with a phased approach, by conducting a trial period on one subset of vehicles, divisions, or operating locations before installing hardware on all ODRC vehicles. Conducting a trial period could allow ODRC leadership to develop policies, procedures, and goals for implementation. Further, Department leadership and staff would also have the opportunity to work with a vendor to refine systems and reports as needed. Ultimately, a phased approach would allow the Department to minimize implementation risk while still realizing the incremental efficiency gains associated with telematics.

Ohio Department of Rehabilitation and Correction Performance Audit
Page | 55
VIII. Audit Scope and Objectives Overview
Generally accepted government auditing standards require that a performance audit be planned and performed so as to obtain sufficient, appropriate evidence to provide a reasonable basis for findings and conclusions based on audit objectives. Objectives are what the audit is intended to accomplish and can be thought of as questions about the program that the auditors seek to answer based on evidence obtained and assessed against criteria. AOS and ODRC signed a letter of engagement effective February 13, 2015. The original letter of engagement led to OPT planning and scoping work, in consultation with ODRC, which identified the area of Fleet Management. Based on the agreed upon scope, OPT developed objectives designed to identify improvements to economy, efficiency, and/or effectiveness. Table VIII-1 shows the objectives assessed in this performance audit and references the corresponding recommendation(s) when applicable.
Table VIII-1: Audit Objectives and Recommendations Objective Recommendation(s)
Fleet Management What opportunities exist for ODRC’s fleet management to improve efficiency and/or effectiveness in relation to industry standards and/or leading practices? R.1 & R.2
Ohio Department of Rehabilitation and Correction Performance Audit
Page | 56
IX. Abbreviated Terms and Acronyms
AOS - Auditor of State ASE - Automotive Service Excellence ASHTD - Arkansas State Highway and Transportation Department Columbus or the City - City of Columbus, Ohio CPM - Cost Per Mile CY - Calendar Year DAS - Ohio Department of Administrative Services DBA - Division of Business Administration DPCS or Parole and Community Services - Division of Parole and Community Services Director - Director of Rehabilitation and Correction Dublin or the City - City of Dublin, Ohio EPA - US Environmental Protection Agency ESD - Equipment Services Division FMIS - Fleet Management Information Systems FY - Fiscal Year FYTD - Fiscal Year-To-Date GAGAS - Generally Accepted Government Auditing Standards GPS - Global Positioning System GSA - US General Services Administration MPG - Miles Per Gallon OAC - Ohio Administrative Code OAKS - Ohio Administrative Knowledge System OBD - Onboard Diagnostics ODOT - Ohio Department of Transportation ODRC or the Department - Ohio Department of Rehabilitation and Correction OHMS - Ohio Hiring Management System OPI - Ohio Penal Industries OPT - Ohio Performance Team ORC - Ohio Revised Code PTO - Power-Take-Off ROI - Return On Investment St. Louis or the City - City of St. Louis, Missouri USDOT - US Department of Transportation
Ohio Department of Rehabilitation and Correction Performance Audit
Page | 57
X. ODRC Response
The letter that follows is ODRC’s official response to the performance audit. Throughout the audit process, staff met with Department officials to ensure substantial agreement on the factual information presented in the report. When the Department disagreed with information contained in the report and provided supporting documentation, revisions were made to the audit report.

Operation Support Center · 770 W. Broad Street · Columbus, Ohio 43222
www.drc.ohio.gov
To: David Yost, Auditor of State
From: Gary C. Mohr, Director
Date: June 22, 2015
Re: Fleet Performance Consultation
The Ohio Department of Rehabilitation and Correction (DRC) would like to thank you and your staff on the Ohio
Performance Team regarding opportunities to improve management of DRC fleet resources. Everyday DRC’s
fleet of inmate transport vans and buses, Parole Officer vehicles, perimeter security automobiles, and specialty
maintenance trucks are utilized to support safe and secure operations of correctional facilities and community
supervision services. Clearly, it is crucial to DRC that we have a fleet which efficiently meets the complex
requirements of our statewide 24 hour per day, 365 day operation, and is responsive to the needs of our staff.
The recommendations included in the report will be reviewed in conjunction with the Department of
Administrative Services’ (DAS) Office of Fleet Management. After careful analysis of the needs of the DRC fleet, I
intend to address the deficiencies of data collection in order to improve efficiencies and accountability within
the organization. I support the recommendation to explore the utilization of technology to better track and
report on fleet utilization which has great potential to increase efficiency and enhance safety.
We will post your report on our website, offering employees and the public the opportunity to provide
feedback.
DRC looks forward to continuing our partnerships with DAS and Auditor of State and would like thank you again
for your assistance.

This page intentionally left blank.

88 East Broad Street, Fourth Floor, Columbus, Ohio 43215-3506 Phone: 614-466-4514 or 800-282-0370 Fax: 614-466-4490 www.ohioauditor.gov
OHIO DEPARTMENT OF REHABILITATION AND CORRECTION
FRANKLIN COUNTY
CLERK’S CERTIFICATION This is a true and correct copy of the report which is required to be filed in the Office of the Auditor of State pursuant to Section 117.26, Revised Code, and which is filed in Columbus, Ohio.
CLERK OF THE BUREAU CERTIFIED JUNE 23, 2015