Embed Size (px)
Citation preview

Ohio Continuing Higher Education Association
March 11, 2010

Driving Ohio’s Economy
Strategic Plan for Higher Education
Higher
Education
Driving
Ohio’s
Economy
Strategic Plan for Higher Education
View and download online at:
www.uso.edu

Strategic Plan for Higher Education
University System of Ohio is aligned
with Ohio Department of Development
Driving Ohio’s Economy

Strategic Plan for Higher Education
University System of Ohio is aligned
with Ohio Department of Development
Driving Ohio’s Economy

Raise the Educational Attainment of Ohio
Total Degrees Awarded 72,657 74,127 100,000
Associate 18,156 18,930 28,000
Bachelor’s 37,816 38,233 52,000
Graduate and Professional 16,685 16,964 20,000
BaselineFY 2006
Current Level
FY 2008Target2017
Graduating more studentsGoal #1

Raise the Educational Attainment of Ohio
Percentage of graduates living in Ohio 3 years after graduation 66.26% -- 70.00%
Associate 81.84% -- 85.00%
Bachelor’s 62.71% -- 66.67%
Graduate and Professional 56.44% -- 60.00%
BaselineFY 2006
Current Level
FY 2008Target2017
Keeping graduates in OhioGoal #2

Raise the Educational Attainment of Ohio
Attracting more talent to Ohio
Number of degree holders entering the state minus number leaving each year (age 22-64)
-9,120 -- 10,000
Associate - 400 -- 2,000
Bachelor’s - 5,826 -- 5,000
Graduate and Professional - 2,894 -- 3,000
BaselineFY 2006
Current Level
FY 2008Target2017
Goal #3

University System of Ohio
Sector and InstitutionFall 2007
EnrollmentFY 2008
Degrees Awarded
University Main Campuses 257,867 57,034
University Regional Campuses 48,700 2,588
Community Colleges 177,101 14,505
University System of Ohio TOTALColleges + Universities
483,668 74,127
Adult Workforce Education (AWE) 114,194
Adult Basic and Literacy Education (ABLE) 47,462
University System of Ohio TOTALColleges + Universities + AWE/ABLE
645,324
University System of OhioSize and Scope
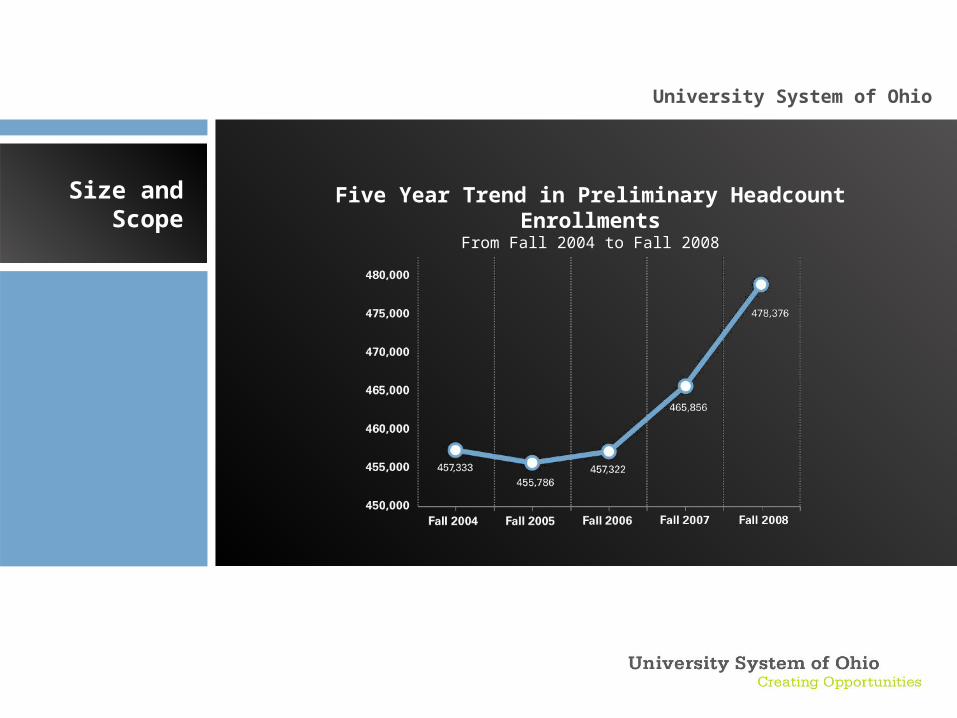
University System of Ohio
Five Year Trend in Preliminary Headcount EnrollmentsFrom Fall 2004 to Fall 2008
Size and Scope

University System of Ohio
Percentage Growth in Preliminary Headcount EnrollmentsFrom Fall 2004 to Fall 2008
Percentage Change
07-0804-08Total
Change
Main Campuses
+2.2% +3.6%
Regional Campuses
+4.6% +4.0%
Community Colleges
+3.0% +6.3%
Size and Scope

University System of Ohio
8,054 degrees(associate, bachelor’s, master’s, doctorate, and professional)
161 online degrees
3,364 online courses
2007-2008 Degrees OfferedSize and
Scope

University System of Ohio
Size and Scope

Quality
University System of Ohio
Affordability Flexibility
Keys to Success of the
System

University System of Ohio
Voluntary System of Accountability
Centers of Excellence
Choose Ohio First Scholarships
Co-ops and internships
HigherQuality

University System of Ohio
US News & World Report
Only two states have more top tier
public national universities than
Ohio
Top Tier Public National UniversitiesHigherQuality

University System of Ohio
Ohio ranks sixth in total, public
and private, top tier national universities
US News & World Report
Number of Top Tier National Universities (Top 8)HigherQuality

University System of Ohio
Total Public Institutions R&D Expenditures (Top Ten)
Dollar amounts in Billions
HigherQuality

University System of Ohio
Total Academic R&D Expenditures (Public and Private)
Dollar amounts in Billions
HigherQuality

University System of Ohio
HigherQuality
2007 R&D Expenditures (Top Ten)
Dollar amounts in Billions

University System of Ohio
Seniors to Sophomores
GI Promise
Textbook Initiatives
30-Mile Promise
Division of Affordability and Efficiency
Efficiency Benchmarking/Continuous Improvement
MoreAffordable

University System of Ohio
The University System of Ohio has entered into an agreement with the nation’s six largest commercial publishers to offer Ohio college students significant discounts on electronic textbook purchases.
Two new programs that will find innovative ways to reduce the price of textbooks for students across the System:
Textbook Affordability Grants
Faculty Innovator Awards
MoreAffordable

38%
University System of Ohio
of university full-time students paidless than $5,00046%
of community college full-time students actually hadzero tuition costs
Based on pilot study for tuition and fees
MoreAffordable

University System of Ohio
OSUSticker Price Comparison
Penn State2007-2008, freshman and sophomore instate tuition & fees
$13,014
University of IllinoisEntering freshman 2008, instate tuition & fees
$12,240
University of Michigan2008-2009, freshman and sophomore instate tuition & fees
$11,037
Michigan State University2008-2009, freshman instate tuition & fees
$10,264
Ohio State University2008-2009 instate tuition & fees
$8,679
University of MarylandTuition & fees
$8,005
Indiana University2008-2009, instate tuition & mandatory fees
$7,800
University of Kentucky2008-2009, students with less than 60 hrs, instate tuition & fees
$7,736
University of Wisconsin2008-2009, instate tuition & fees
$7,569
MoreAffordable

State Ranking: Lowest Tuition Increases
2008-09 Avg. Tuition
2007-08 Avg. Tuition
% Tuition Increase
Ohio $ 3,516 $ 3,515 0%
New Hampshire $ 5,609 $ 5,609 0%
California $ 634 $ 633 0.20%
New Mexico $ 1,150 $ 1,143 0.60%
Alabama $ 2,827 $ 2,809 0.60%
Maine $ 3,156 $ 3,120 1.20%
Louisiana $ 1,957 $ 1,915 2.20%
Maryland $ 3,339 $ 3,252 2.70%
Minnesota $ 4,568 $ 4,446 2.70%
Washington $ 2,962 $ 2,879 2.90%
University System of Ohio
Public Two-Year CollegesMoreAffordable

University System of Ohio
State Ranking: Lowest Tuition Increases
2008-09 Avg. Tuition
2007-08 Avg. Tuition
% Tuition Increase
Ohio $ 8,482 $ 8,426 0.20%
Montana $ 5,335 $ 5,302 0.60%
New York $ 5,126 $ 5,076 1.00%
Maryland $ 7,395 $ 7,314 1.10%
Wyoming $ 3,621 $ 3,554 1.90%
North Carolina $ 4,416 $ 4,306 2.60%
Iowa $ 6,435 $ 6,218 3.50%
Mississippi $ 4,936 $ 4,757 3.80%
Massachusetts $ 8,184 $ 7,887 4.90%
Oregon $ 6,238 $ 5,946 4.90%
Public Four-Year CollegesMoreAffordable

University System of Ohio
Tuition Costs: College Board
“Trends in College Pricing 2008”
Original Rankings
Public Two-Year Tuition
‘07-’08 Tuition: $3,515‘07-’08 Rank: 44
‘07-’08 Tuition: $3,515‘07-’08 Rank: 44
‘08-’09 Tuition: $3,516‘08-’09 Rank: 40
‘08-’09 Tuition: $3,095‘08-’09 Rank: 33
Public Four-Year Tuition
‘07-’08 Tuition: $8,462‘07-’08 Rank: 44
‘07-’08 Tuition: $8,017‘07-’08 Rank: 44
‘08-’09 Tuition: $8,482‘08-’09 Rank: 43
‘08-’09 Tuition: $8,017‘08-’09 Rank: 38
Revised Rankings
MoreAffordable

University System of Ohio
1% efficiency goal met for University System of Ohio institutions for 2008
3% efficiency goal mandated for 2009
HB 251 mandates a 20% reduction in BTU consumption by 2014
MoreAffordable

University System of Ohio
30-Mile Promise
Articulation and Transfer
Adult Career and Technical Education/ Adult Basic and Literacy Education
Integrated Technology Infrastructure
MoreFlexible

University System of Ohio
Ohio Innovation Partnership- Ohio Research Scholars- Choose Ohio First Scholarships- Co-ops and Internships
Division of Economic Advancement
International Recruitment
Ohio Skills Bank
Ohio Means Home
Driving Economic
Growth

University System of Ohio
Ohio will join the global initiative, using the
International Student Barometer to evaluate and track the international student
experience in Ohio.
Driving Economic
Growth

University System of Ohio
IndependentColleges and
Universities
State investment in independent colleges and universities:
State Grants and Scholarships (FY 2008) = over $80 million
Choose Ohio First Scholarships = over $7 million
Ohio Research Scholar Awards = over $23 million
Action Fund = over $500,000
Research Incentive Total = over $1.7 million

We will not back away from our strategic plan.
We will not retreat.We will meet
our goals.
We will innovate.

Educational Attainment
Strategic Plan Baseline (2006)
Current Level(2007)
% Ranking % Ranking
Current Workforce (Ages 25-64)
Associate Degree and Higher 33.41% 38 34.65% 36
Bachelor's Degree and Higher 25.17% 37 26.28% 35
Graduate Degree and Higher 8.93% 29 9.4% 26
Future Workforce (Ages 25-64)
Associate Degree and Higher 34.71% 32 36.37% 26
Bachelor's Degree and Higher 26.61% 30 27.66% 27
Graduate Degree and Higher 7.66% 17 7.75% 22
Ohio’s National
Rankings

Accountability Measures
AccessStrategic
PlanBaseline
CurrentLevel
2017Target
Total post-secondary enrollment 472,694 483,668 702,694
Total STEMM degrees awarded 23,392 24,472 46,784
Total enrollees age 25 and older 171,294 173,973 351,347
Total degrees awarded to first generation college students
19,418 19,279 33,333
Percent of total degrees awarded to Black and Hispanic students
8.63% 8.74% 13.98%
Access
Quality
Affordability& Efficiency
Economic Leadership
Measurementsof Success

Accountability Measures
QualityStrategic
PlanBaseline
CurrentLevel
2017Target
Improvement in actual graduation rate over expected graduation rate (2007 as baseline)
Same NA +10%
Measuring the system’s reputation: Number of first time enrollees in the top 20% SAT/ACT (at University Main Campuses)
13,866 13,394 20,799
Percent of facilities in satisfactory condition or needing only minor rehabilitation
64.07% 64.90% 70%
Total size of endowments and foundations per FTE $10,573 NA $21,146
Federally financed research spending per capita – national rank
30 NA Top 10
Access
Quality
Affordability& Efficiency
Economic Leadership
Measurementsof Success

Accountability Measures
Affordability & EfficiencyStrategic
PlanBaseline
CurrentLevel
2017Target
Average out of pocket cost TBD TBD TBD
Tuition and fees of a combined associate and bachelor’s degree offered on a community college or university regional campus – national rank
TBD TBD Top 10
State funding per FTE – relationship to the national average
-$420 Million
NA +$1
Percentage of first time enrollees below age 21 with equivalent of one semester or more of college credit earned during high school
5.50% 5.80% 20%
Percentage of bachelor’s degree recipients with at least one year of credit from a community college
8.80% 9.60% 25%
Access
Quality
Affordability& Efficiency
Economic Leadership
Measurementsof Success

Accountability Measures
Economic Leadership Strategic PlanBaseline
CurrentLevel
2017Target
Industrially financed research spending per capita – national rank
5 NA 1
Globalization measure: Total international students/Ohio students studying abroad annually
13,538 / 6,328
15,424 / 6,717
35,134 / 16,413
Knowledge Transfer Metric- TBD TBD TBD TBD
Business satisfaction - measured through survey
TBD TBD TBD
Number of students engaged in internships and co-ops
46,443 49,863 100,000
Measurementsof Success
Access
Quality
Affordability& Efficiency
Economic Leadership

William B. Russell Associate Vice Chancellor Adult Education Ohio Board of Regents
614 752-9487