Embed Size (px)
Citation preview
OH 5-1
Agenda
Questions regarding Chapter 2 & 3 workbook
Chapter 4: Cost-Volume-Profit Relationships PowerPoint Workbook
Chapter 5: PowerPoint Workbook
Next week
OH 5-2
Cost-Volume-Profit Relationships
Controlling Foodservice Costs
4OH 5-2
OH 5-3
Chapter Learning Objectives
Explain Variable Costs
Describe the variable rate
Describe the components of the contribution margin
Describe the contribution margin
Calculate the variable cost and rate, contribution margin and rate, and calculate the break-even point in sales dollars and sales units
Determine which formula to use for various calculations
OH 5-4
Components of Sales
Dollar terms: Without understanding where sales revenue is spent, it is hard to control costs and create profitability.
Since profitability is why most operations are in business, formulas to calculate profit are needed.
OH 5-5
Variable Costs
Costs that will change with the increase or decrease in the volume of business
Examples: food & beverage costs, supplies, wages & benefits Do variable costs include salaried employees?
Actual cost of the product and service that is for sale
OH 5-6
Contribution Margin
Contribution Margin is composed of fixed costs and the profit generated by sales
Fixed costs: Examples: salaried employees & their benefits, rent,
equipment depreciation, insurance, utilities, etc.
Profit generated by sales – Bottom line
OH 5-7
Examples of Contribution Margin
Example of an actual Contribution Analysis used
Let’s turn to page 48 in the text; example problem
OH 5-8
Components of Sales
Percentage terms: The percent of each dollar in sales that goes towards different expenses is needed in forecasting, planning and analysis of financial data.
OH 5-9
Variable Rate and Contribution Rate
In Chapters 2, what was the formula we used to calculate the food cost percent?
When comparing variable rate and contribution rate to sales, we use the exact same formula.
Let’s turn to page 50 in the text book
The variable rate is the percent of costs that we can control
OH 5-10
Break-Even Point
This formula is used to calculate either the dollar sales, or unit sales, needed to break even in a business.
Let’s turn to page 52 of the text
How does profit fit into the break even analysis?
Why would you need to know the number of units to be sold in a break even analysis?
OH 5-11
Average Variable Costs
Average contribution margins take into account the number of sales of each item as well as the contribution margin of each item. This information is used to compare one item to another and to analyze overall financial data
Let’s turn to page 54 in the text, example problem
OH 5-12
Improving Profit by Changing the Break-Even Point
Three items we can control Raise prices
Variable cost
Evaluate quality
OH 5-13
Workbook Chapter 4
OH 5-14
Controlling Food Costs in Purchasing
Controlling Foodservice Costs
5OH 5-14
OH 5-15
Chapter Learning Objectives
Explain how a specification becomes a control in the purchasing function.
Explain the parts of a purchase specification and a purchase order (Purchase Specification).
Explain various purchasing methods and their effect on the price of goods.
Use formulas including:
Periodic ordering amount, Perpetual ordering amount, As purchased (AP), Edible portion (EP) for both food quantity and food cost.
OH 5-16
Chapter Learning Objectives continued
Calculate a yield test that identifies the difference between as purchased (AP) price and edible portion (EP) cost.
Identify factors that affect the purchase price of goods.
Distinguish between perishable and nonperishable goods and their relationship to the purchasing cycle.
Calculate the amount of goods to purchase for catered events.
OH 5-17
Who Purchases?
Purchasing agent
Manager
Chef
Head cook
Trusted staff member
The buyer maintains quality standards!
OH 5-18
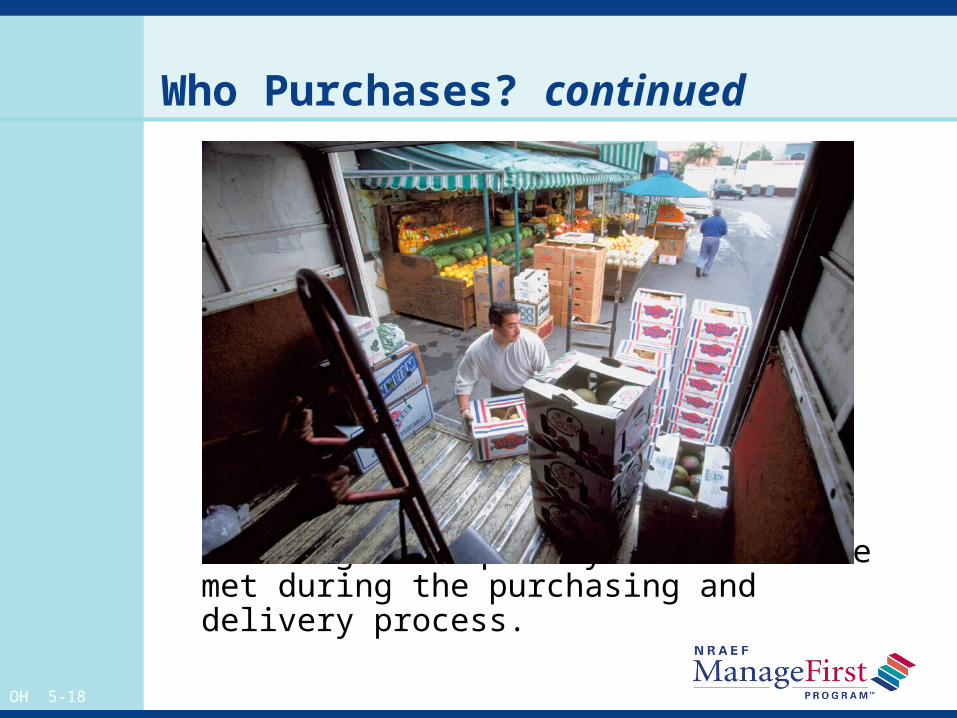
Who Purchases? continued
The buyer is responsible for ensuring that quality standards are met during the purchasing and delivery process.
OH 5-19
The Food Specification
Is a control device
Lists the product’s name
Lists its intended use
Identifies the desired brand and grade
Identifies the desired size
Identifies the desired variety
Identifies packing requirements
Details delivery requirements
Explains payment terms
OH 5-20
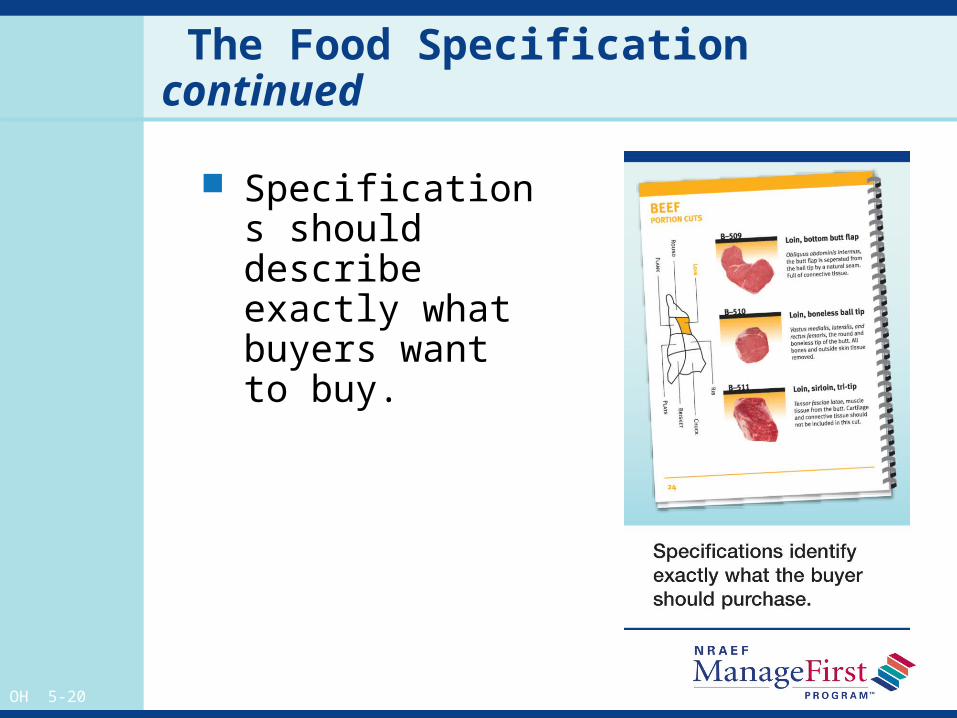
The Food Specification continued
Specifications should describe exactly what buyers want to buy.
OH 5-21
Purchase Orders
The official written record of the items the buyer wants to purchase
OH 5-22
Purchase Order Information
A unique identification number
The name and address of the restaurant
Date of the order
Signature of the buyer
The supplier’s contact information
Date of delivery
The name, quantity, and delivery unit of each item ordered
Total (extended) cost of the order
OH 5-23
Ordering Methods page 21 workbook
Periodic order method – example p. 62 text
Minimum par level
Perpetual ordering method
Safety stock
OH 5-24
Inventory Methods page 21 workbook
Perpetual inventory method
Physical inventory method
OH 5-25
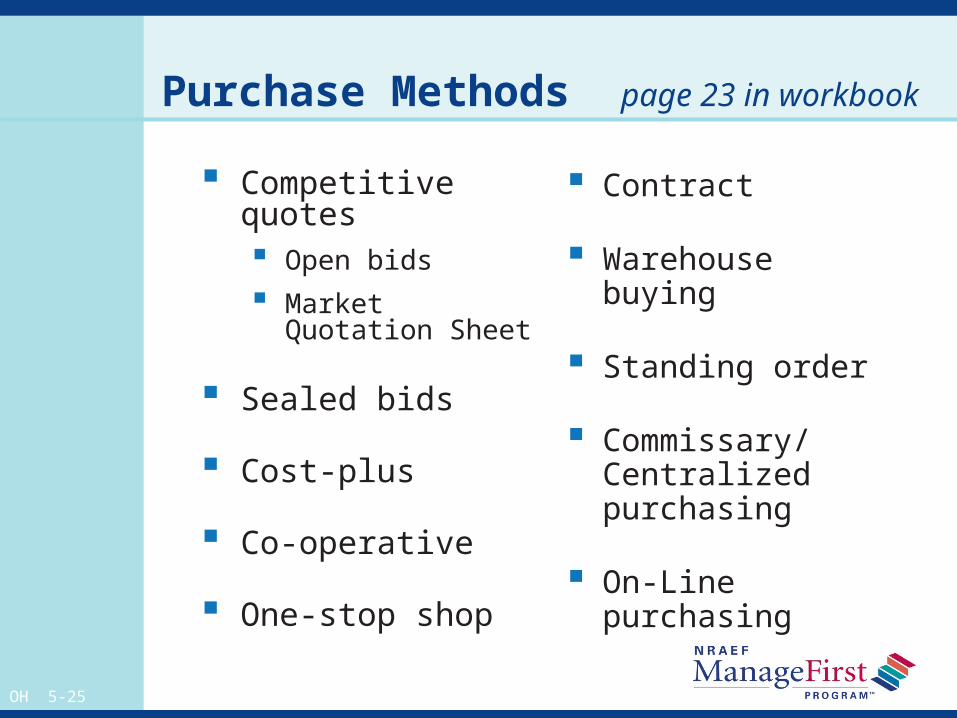
Purchase Methods page 23 in workbook
Competitive quotes Open bids Market Quotation
Sheet
Sealed bids
Cost-plus
Co-operative
One-stop shop
Contract
Warehouse buying
Standing order
Commissary/Centralized purchasing
On-Line purchasing
OH 5-26
What to Buy
Avoid buying the “cheapest.”
Use purchase specifications.
Buy at the best cost from sellers who meet or exceed the purchase specifications.
Consider both AP price and EP cost.
OH 5-27
Two Kinds of Costs
As purchased (AP)—the cost of food as delivered to the restaurant
Edible portion (EP)—the cost of food as served to the guest
OH 5-28
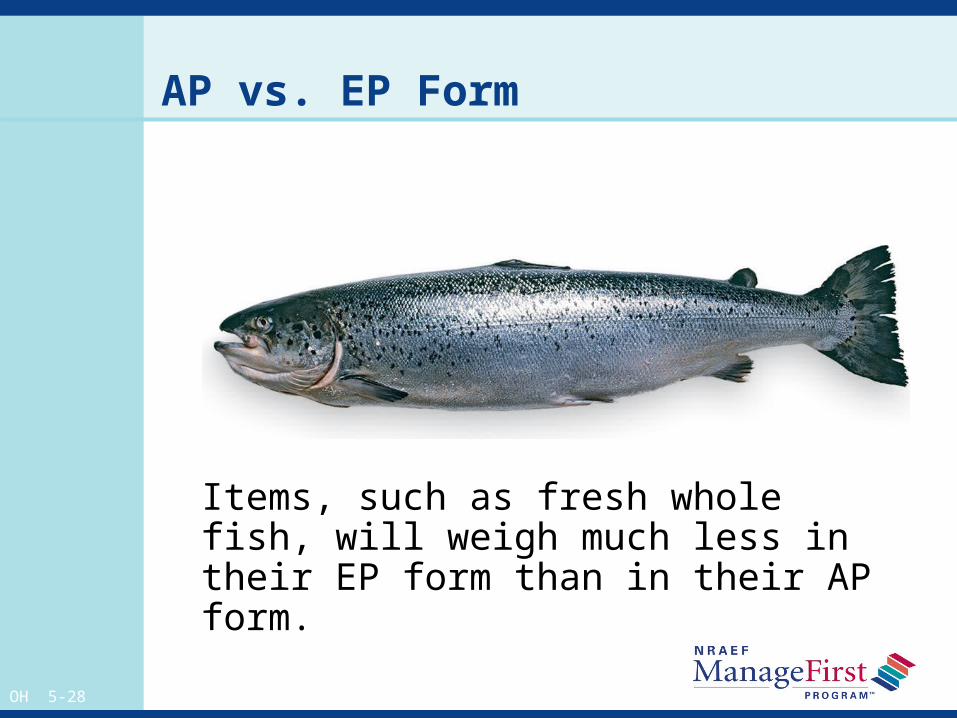
AP vs. EP Form
Items, such as fresh whole fish, will weigh much less in their EP form than in their AP form.
OH 5-29
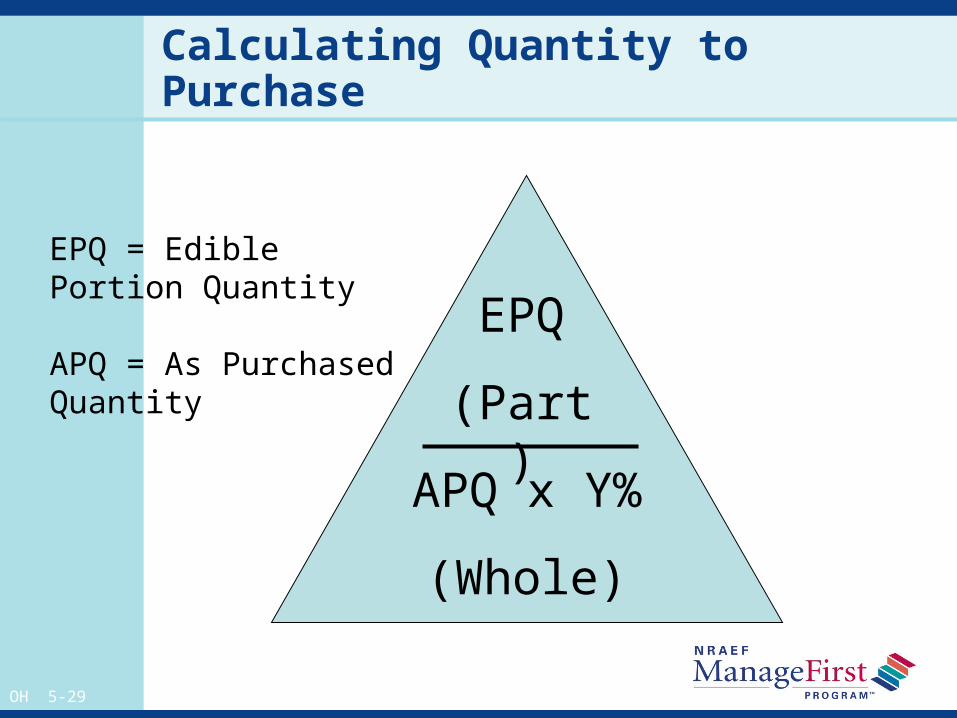
Calculating Quantity to Purchase
EPQ
(Part)
APQ x Y%
(Whole)
EPQ = Edible Portion Quantity
APQ = As Purchased Quantity
OH 5-30
Yield % Charts
Yield % Charts Approximate Weight/Each
Item description
Yield %
Other resources Book of Yields - Francis Talyn Lynch
Culinary Calculators
OH 5-31
Using Yield % Charts
Yield % charts are only approximate
You must do your own yield tests on the actual product you are using in order to get completely accurate figures.
Some factors that affect yield:
Employee skill level
Size of the product
Condition or quality of the product
OH 5-32
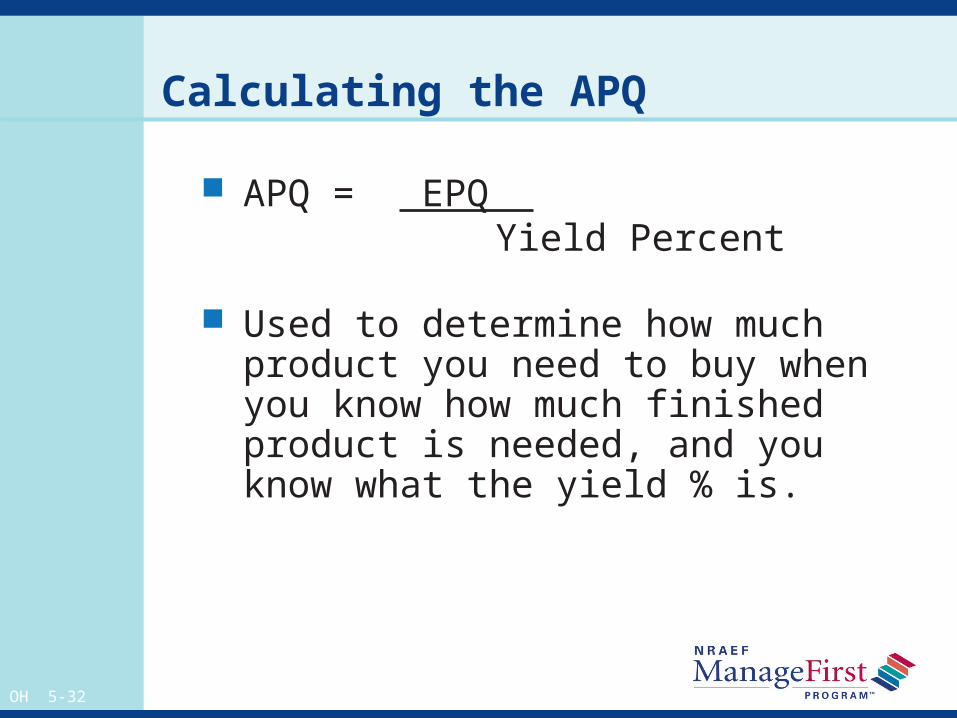
Calculating the APQ
APQ = EPQ Yield Percent
Used to determine how much product you need to buy when you know how much finished product is needed, and you know what the yield % is.
OH 5-33
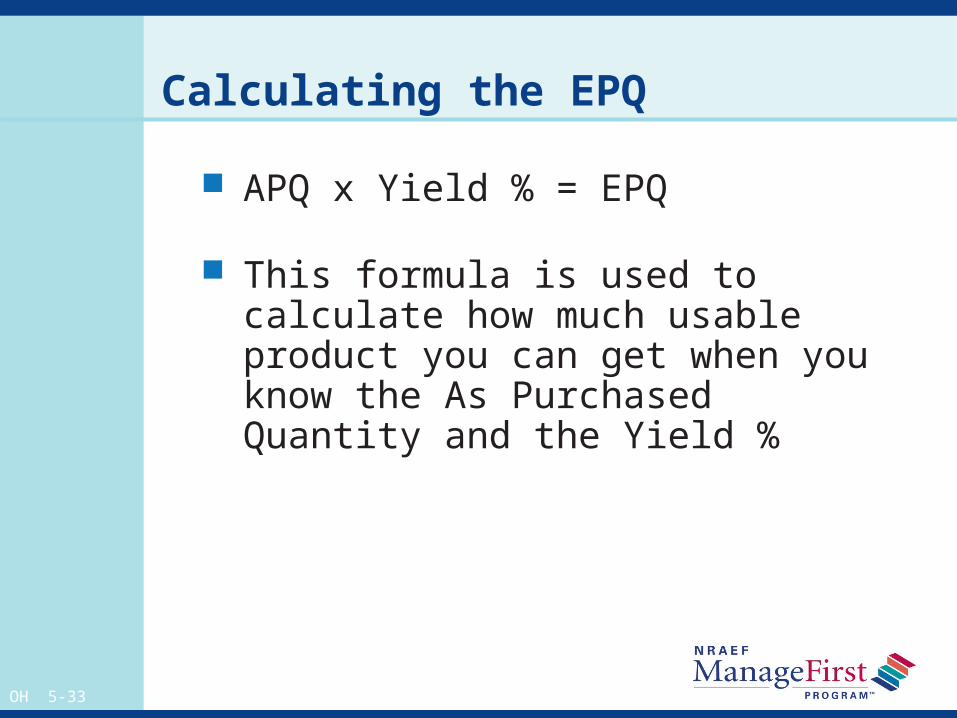
Calculating the EPQ
APQ x Yield % = EPQ
This formula is used to calculate how much usable product you can get when you know the As Purchased Quantity and the Yield %
OH 5-34
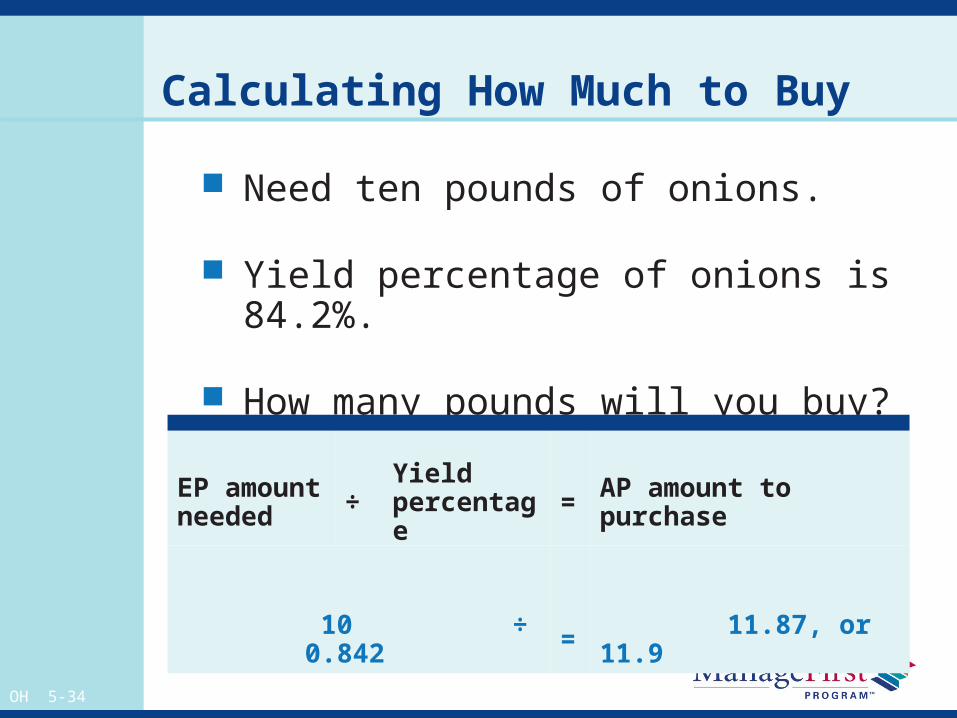
Calculating How Much to Buy
Need ten pounds of onions.
Yield percentage of onions is 84.2%.
How many pounds will you buy?
EP amount needed ÷ Yield
percentage = AP amount to purchase
10 ÷ 0.842 = 11.87, or 11.9
OH 5-35
Calculating Quantity to Purchase
Let’s turn to page 70 in the text
What is the difference 10 lbs. of carrots, peeled and sliced
10 lbs. of peeled and sliced carrots
How do you calculate how much to purchase in each one?
OH 5-36
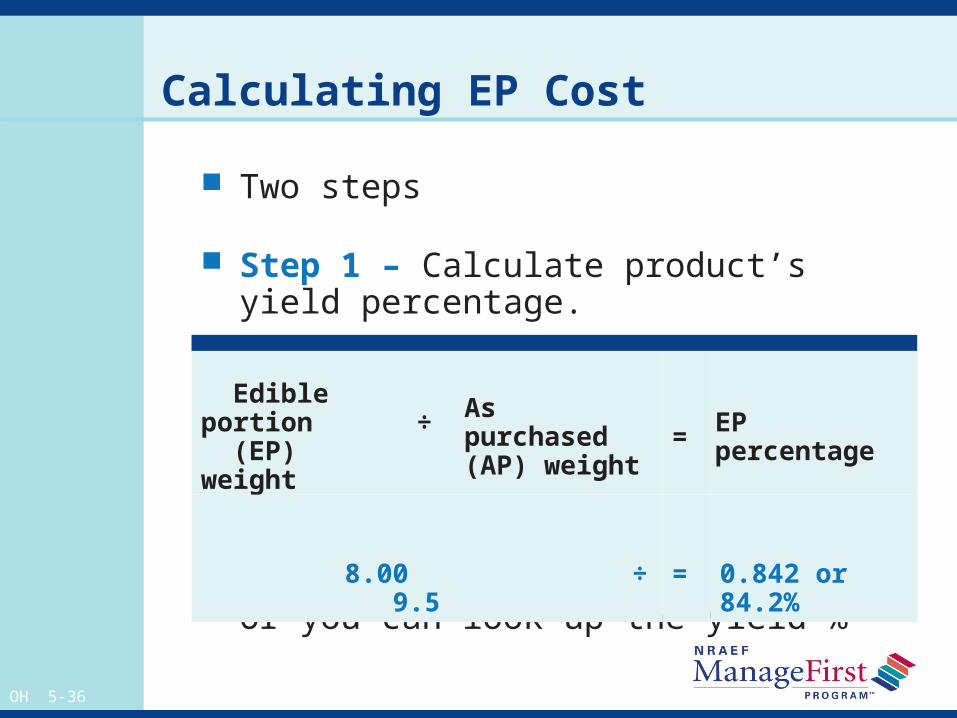
Calculating EP Cost
Two steps
Step 1 – Calculate product’s yield percentage.
Or you can look up the yield %
Edible portion
(EP) weight÷ As purchased
(AP) weight = EP percentage
8.00 ÷ 9.5 = 0.842 or 84.2%
OH 5-37
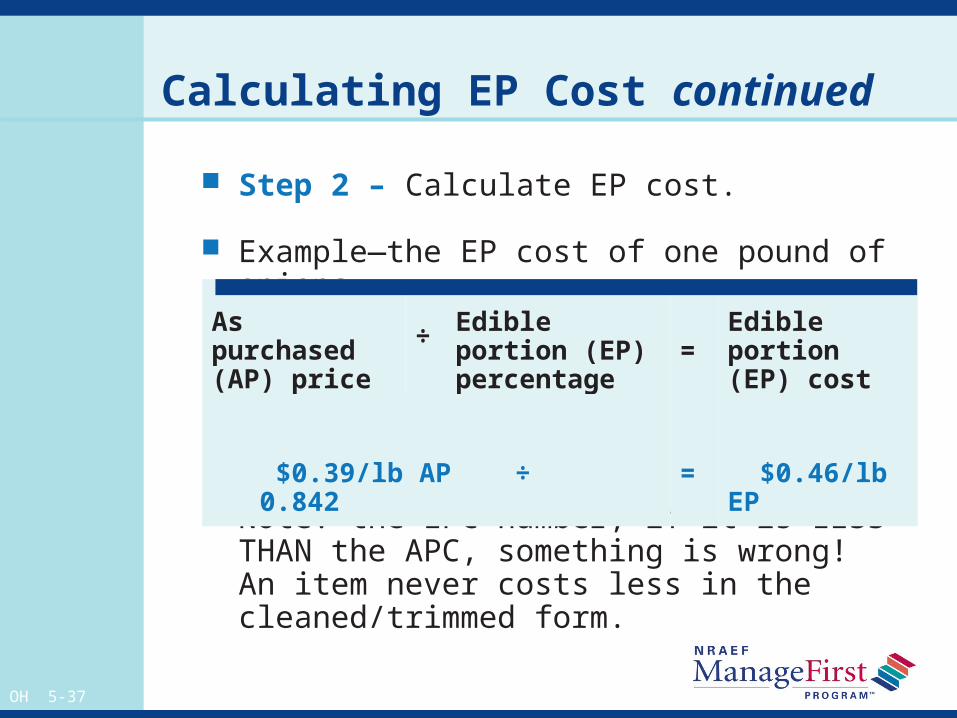
Calculating EP Cost continued
Step 2 – Calculate EP cost.
Example—the EP cost of one pound of onions
Note: the EPC number, if it is LESS THAN the APC, something is wrong! An item never costs less in the cleaned/trimmed form.
As purchased (AP) price
÷
Edible portion (EP) percentage = Edible portion
(EP) cost
$0.39/lb AP ÷ 0.842 = $0.46/lb EP
OH 5-38
Other Factors Affecting Purchasing
Management complacency
Payment history
Gift acceptance policies
OH 5-39
When to Buy
Purchase perishable items daily or every few days.
Purchase nonperishable items weekly or monthly.
OH 5-40
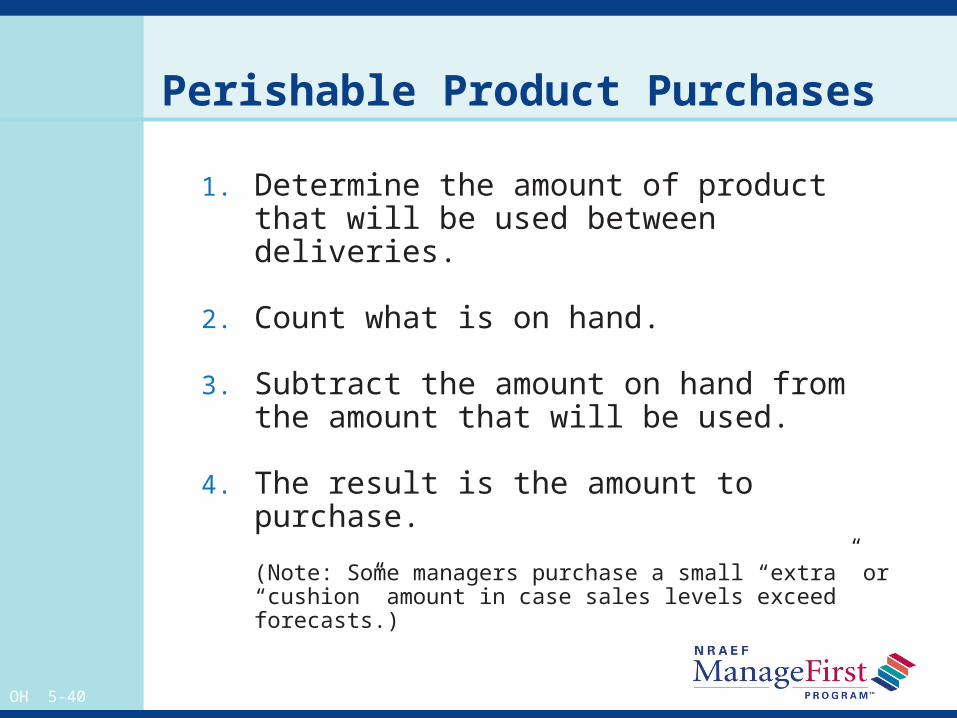
Perishable Product Purchases
1. Determine the amount of product that will be used between deliveries.
2. Count what is on hand.
3. Subtract the amount on hand from the amount that will be used.
4. The result is the amount to purchase.
(Note: Some managers purchase a small “extra” or “cushion” amount in case sales levels exceed forecasts.)
OH 5-41
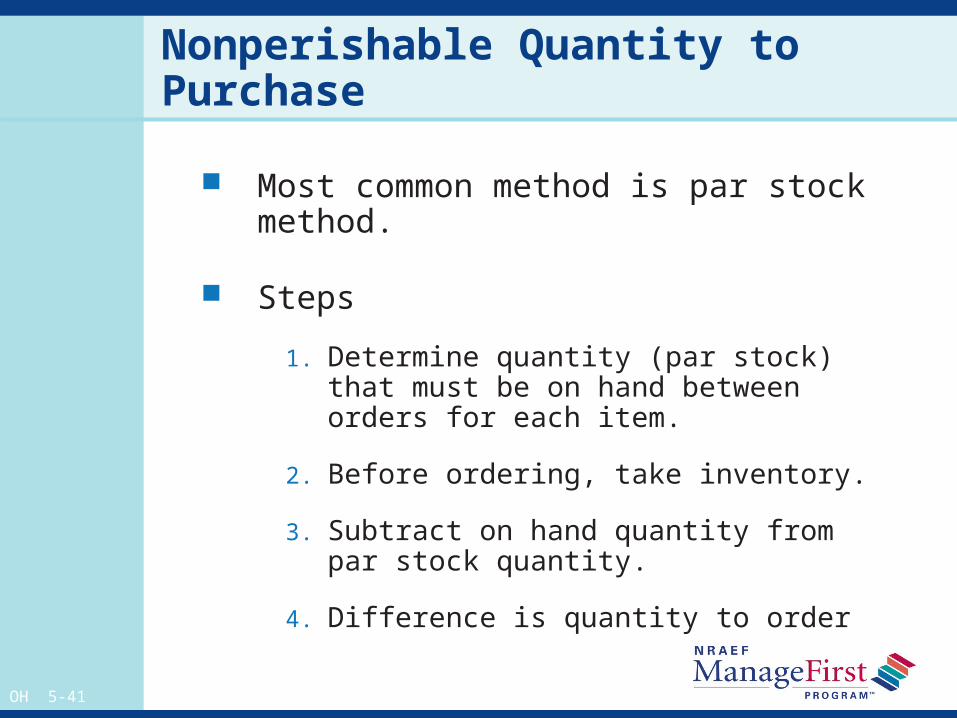
Nonperishable Quantity to Purchase
Most common method is par stock method.
Steps
1. Determine quantity (par stock) that must be on hand between orders for each item.
2. Before ordering, take inventory.
3. Subtract on hand quantity from par stock quantity.
4. Difference is quantity to order
OH 5-42
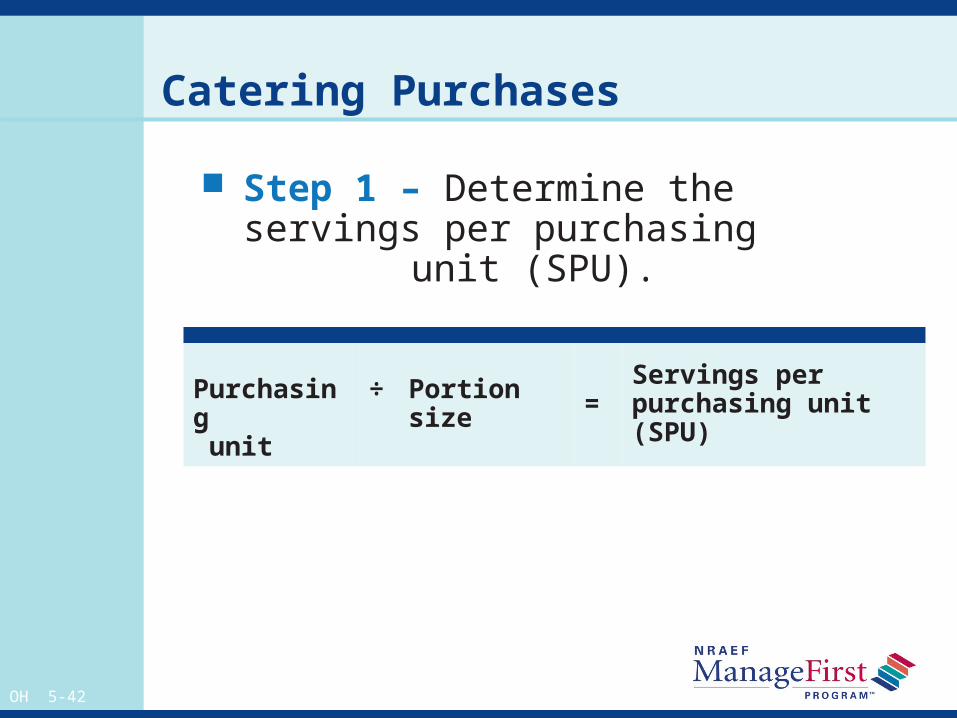
Catering Purchases
Step 1 – Determine the servings per purchasing unit (SPU).
Purchasing
unit
÷ Portion size = Servings per
purchasing unit (SPU)
OH 5-43
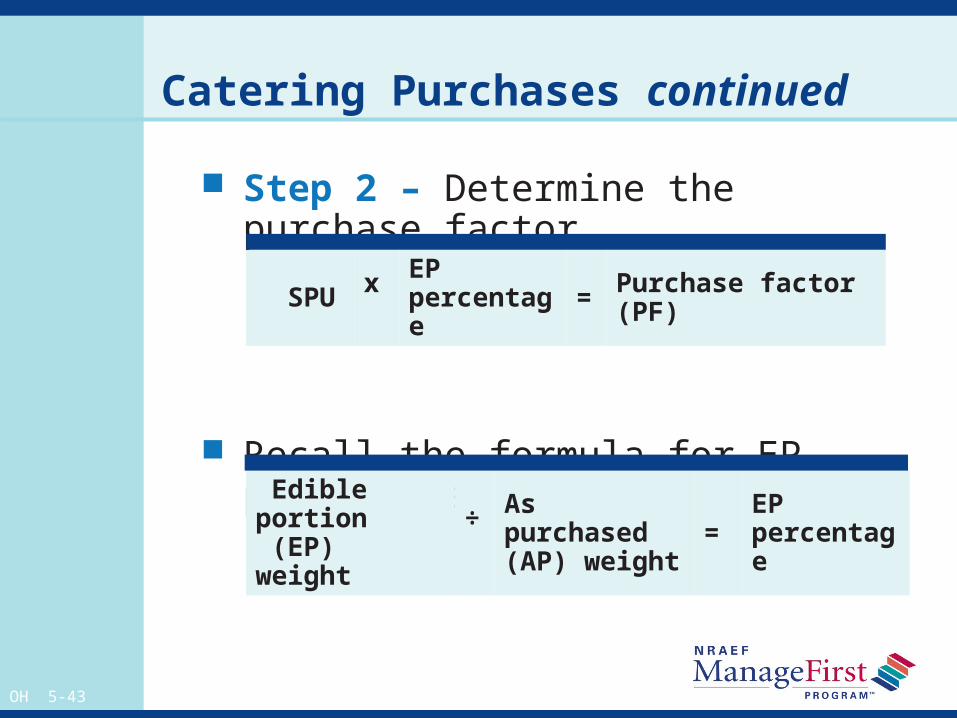
Catering Purchases continued
Step 2 – Determine the purchase factor.
Recall the formula for EP percentage.
SPU x EP percentage = Purchase factor
(PF)
Edible portion (EP) weight
÷
As purchased (AP) weight = EP
percentage
OH 5-44
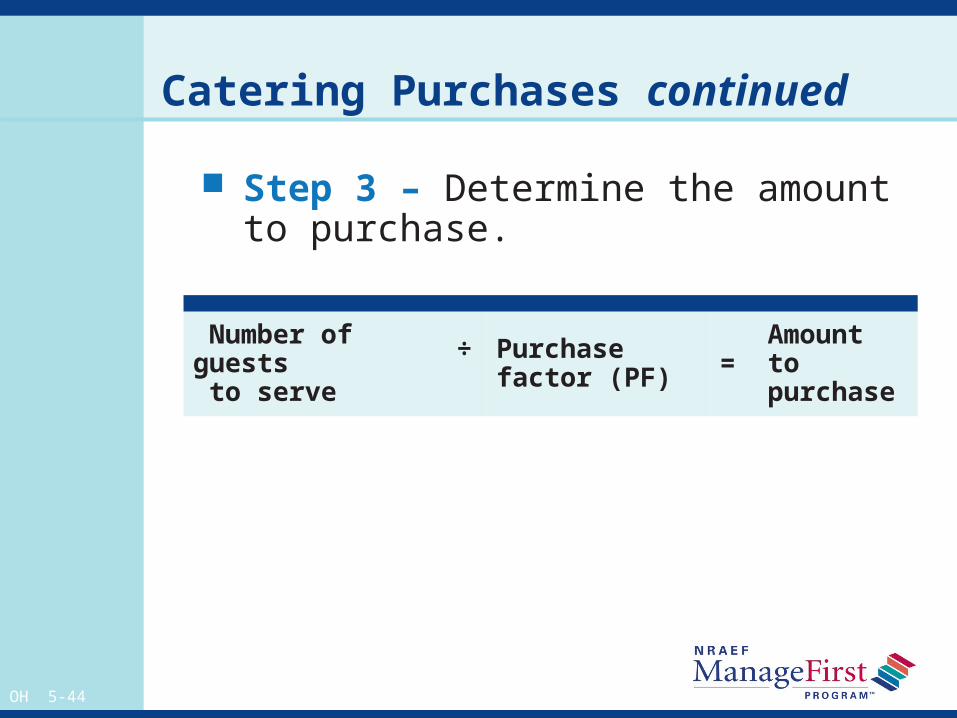
Catering Purchases continued
Step 3 – Determine the amount to purchase.
Number of guests to serve
÷
Purchase factor (PF) = Amount to
purchase
OH 5-45
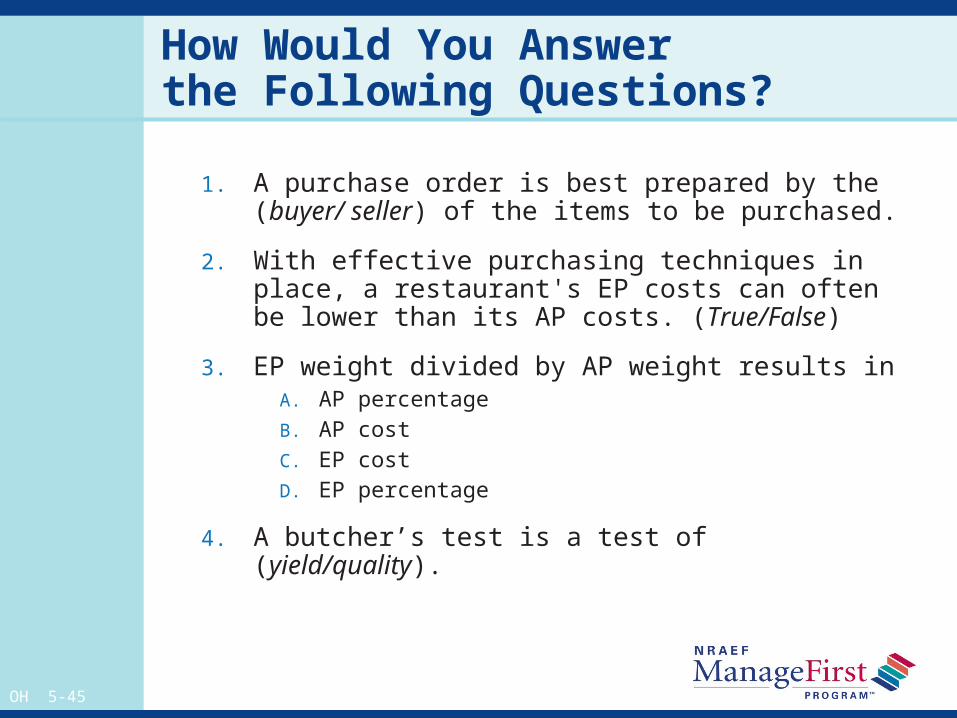
How Would You Answer the Following Questions?
1. A purchase order is best prepared by the (buyer/ seller) of the items to be purchased.
2. With effective purchasing techniques in place, a restaurant's EP costs can often be lower than its AP costs. (True/False)
3. EP weight divided by AP weight results in A. AP percentageB. AP costC. EP costD. EP percentage
4. A butcher’s test is a test of (yield/quality).
OH 5-46
Key Term Review
As served (AS)
Buyer
Commissary
Competitive quotes
Cost plus
Invoice
OH 5-47
Key Term Review continued
Market quotation sheet
Nonperishable goods
One-stop shop
Par stock
Perishable goods
Purchase order
Quotes
OH 5-48
Key Term Review continued
Sealed bid
Specification
Standing order
Yield chart
Yield percentage
Yield test
OH 5-49
Chapter Learning Objectives— What Did You Learn?
Explain how a specification becomes a control in the purchasing function.
Explain the parts of a purchase specification and of a purchase order.
Explain various purchasing methods and their effect on the price of goods.
Calculate a yield test that identifies the difference between AP price and EP cost.
OH 5-50
Chapter Learning Objectives—What Did You Learn? continued
Identify factors that affect the purchase price of goods.
Distinguish between perishable and nonperishable goods and their relationship to the purchasing cycle.
Calculate the par stock amount of an item to order.
Calculate the amount to purchase, using EP amount and yield percent.
OH 5-51
Calculate the amount of goods to purchase for catered events.
Calculate a butcher test, or meat yield test.
Describe the proper procedures for receiving goods.
Chapter Learning Objectives—What Did You Learn? continued