Embed Size (px)
Citation preview

Offshore Wind Energy:Offshore Wind Energy:Status, Issues, & Status, Issues, &
Comparisons With U.S. Comparisons With U.S. OnOn--Land Development Land Development
Potential in Coastal AreasPotential in Coastal Areas
Bruce BaileyAWS Truewind LLC
Albany, [email protected] Stanford University, April 26, 2004

Over half the population lives in coastal counties
24% of nation’s
electric load
6% of nation’s
electric load
7% of nation’s
electric load

State Incentives
http://www.dsireusa.org
Public Benefit Funds
Renewables Portfolio Standards
Can enough wind be built on land in the Northeast?

Why Go Offshore?• No windy lands near
many load centers • Transmission
barriers on land for long distances
• Strong winds reside offshore; good load matching too
• Offshore wind can help satisfy RPS and SBC initiatives and still be cost-competitive with other renewables

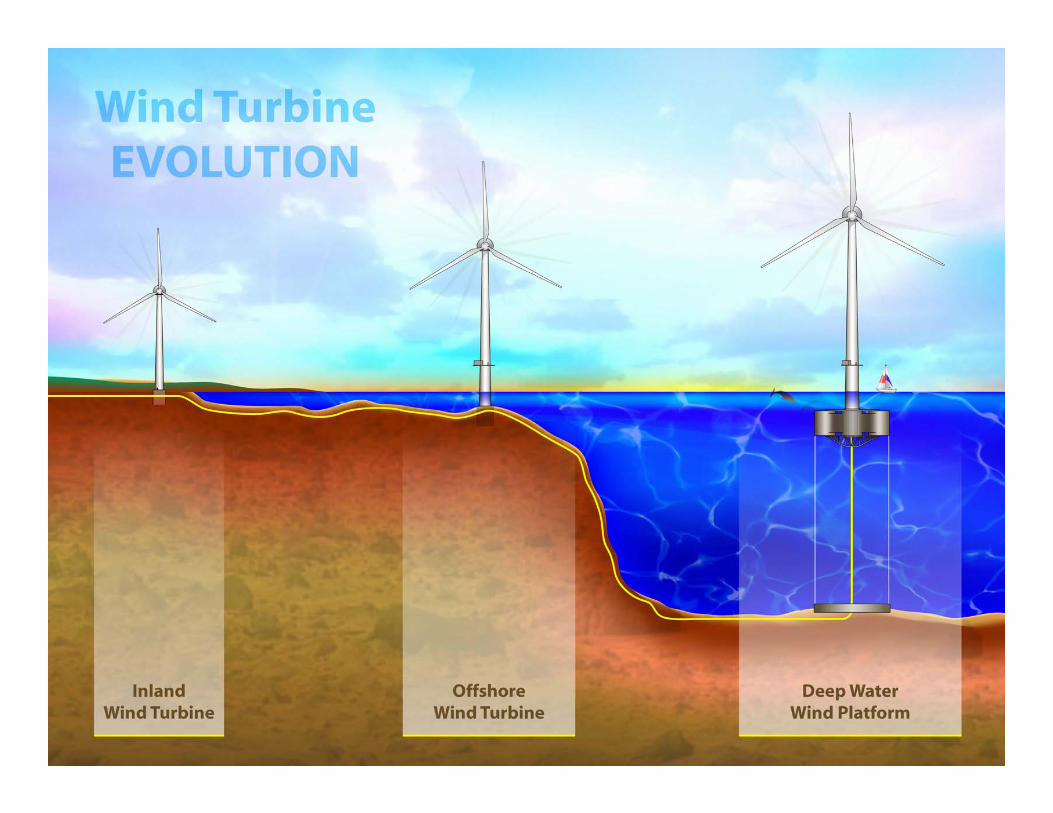
Offshore Components• Tower heights >200 ft (60 m)
• Turbines rated 2 -5 MW
• Spaced 1/3 to ½ mile apart
• Rotor diameters 250-350 ft
• Foundations• Substation &
marine cable • Port facilities
Nysted Project, Denmark

Key Design/Siting Factors
• Water Depth• Extreme
Wind/Waves• Seabottom
Geology• Distance to
Transmission• Installation
Equipment

Why Europe is Pursuing Offshore Wind
Strong, aggressive government policies promoting green energyShrinking opportunities on landWidespread acceptance/ familiarity with land-based wind projectsShallow waters well offshore
160 MW Horns Rev
Project, Denmark

U.S. in Contrast
• Only two serious pending projects
• Independent pioneers
• Almost no wind projects on nearby land
• Fickle renewable energy support
Cape Wind Associates
Long Island Power Authority

Land vs Offshore Potential In Coastal Areas
• Compare amount of windy areas in coastal states and offshore
• Assume higher threshold wind resource for offshore projects
• Assume maximum water depths for offshore projects in near-term
• Contrast public with private lands

New England Wind Power Class Map
• Commercial Land Wind Projects Require Class 4+ Wind Class
• Offshore Wind Projects Require Class 5+ Due to Higher Construction Costs

New England Water Depths
• Most Offshore Projects Have Been Built in Waters <50 ft Deep
• Some New Offshore Projects Are In Waters Up to 75 ft Deep
• Deep-Water Foundation Designs Are Under Development

New England Windy Areas
• Windy Lands (Class 4+) With and WithoutParks/Govt. Forests
• 28% of windy lands are in parks/govt. forests
• Windy Waters (Class 5+) with depths <70 ft
• 40% of windy waters beyond 3-mile limit

Mid-Atlantic Wind Power Class Map
• Commercial Land Wind Projects Require Class 4+ Wind Class
• Offshore Wind Projects Require Class 5+ Due to Higher Construction Costs

Mid-Atlantic Water Depths
• Most Offshore Projects Have Been Built in Waters <50 ft Deep
• Some New Offshore Projects Are In Waters Up to 75 ft Deep
• Deep-Water Foundation Designs Are Under Development

Mid-Atlantic Windy Areas
• Windy Lands (Class 4+) With and WithoutParks/Govt. Forests
• 42% of windy lands are in parks/govt. forests
• Windy Waters (Class 5+) with depths <70 ft
• 80% of windy waters beyond 3-mile limit

West Coast – Wind Power Class

West Coast – Water Depths
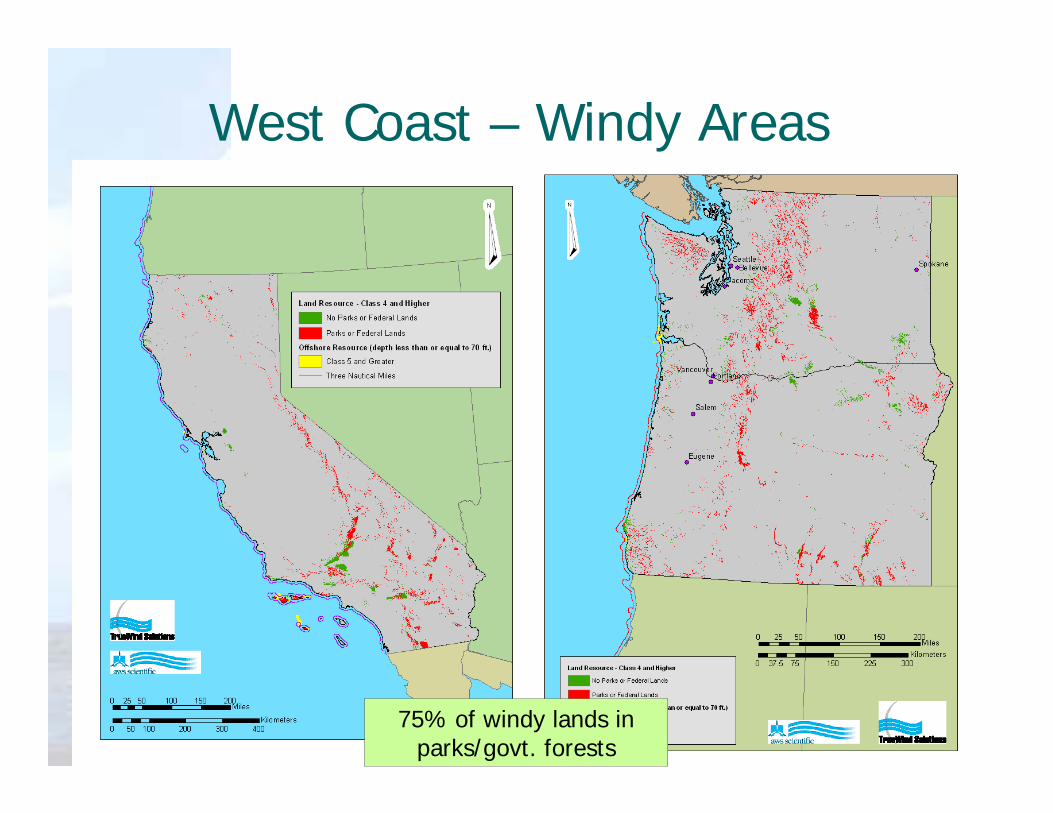
West Coast – Windy Areas
75% of windy lands in parks/govt. forests

Available Windy Area
0
2000
4000
6000
8000
10000
12000
14000
16000
N.Engl Mid-Atl Calif Pac.NW
LandOffshore
Squa
re K
ilom
eter
s
*Class 4+ on Land; Class 5+ Offshore and Water Depths <70 ft; No land use exclusions

Economics of Offshore
0
2
4
6
8
10
12
1990
CO
E (¢
/kW
h [c
onst
ant 2
000
$])
Low speed land sites
1995 2000 2005 2010 2015 2020
High speed land sites
Offshore sites
?
Bulk Power Competitive Price
Band
Source: Dept. of Energy
COE for other RenewablesLandfill Gas: 3¢ – 8¢/kWhBiomass: 5¢ – 9¢Photovoltaics: 17¢ – 25¢Geothermal: 4¢ – 8¢

Offshore Wind Matches Peak Load Profiles
0
1000
2000
3000
4000
5000
6000
7000
8000
0 1 2 3 4 5 6 7 8 9 10 11 12 13 14 15 16 17 18 19 20 21 22 23 24 25
Hour
Coas
tal U
tility
Loa
d (M
W)
0.00
10.00
20.00
30.00
40.00
50.00
60.00
Pla
nt C
apac
ity F
acto
r (%
)
LoadCapacity Factor
Typical Peak Load Day, Coastal New Jersey, 1999-2003
Typical summer peak day afternoon capacity factor for
offshore NJ wind plant >50%

Conclusions
• East coast has large energy appetite but relatively little windy land
• Offshore offers large wind development opportunities, for many eastern states
• Offshore can be cost-competitive with other renewables and can help wind fulfill RPS and SBC initiatives
• West coast has strong offshore wind resources but very deep water; offshore deep water foundations not yet available

Conclusions
• Many barriers to overcome• Need for more public familiarity with wind
power, particularly in eastern US• Include offshore wind in the visions of
state and federal energy policies• Earmark R&D funds to address offshore
engineering & development issues• Learn from European experiences and
support international collaboration

Thank You!
Questions?
Samsø Project, Denmark