Embed Size (px)
Citation preview

MARINE ECOLOGY PROGRESS SERIES Mar. Ecol. Prog. Ser.
Published September 8
Offshore diet of grey seals Halichoerus grypus near Sable Island, Canada
W. D. Bowen, G . D. Harrison
Marine Fish Division, Bedford Institute of Oceanography, Department of Fisheries and Oceans, Dartmouth, Nova Scotia, Canada B2Y 4A2
ABSTRACT: Many pinnipeds forage considerable distances from mainland haul-out sites for much of the year, yet little is known about the composition of their offshore diets. This may result in an incom- plete and potentially biased view of the diet of wide-ranging species such as the grey seal Halichoerus grypus. On the Scotian Shelf, offshore fish assemblages differ from those nearer the coastal mainland sites and thus we expected that grey seal diets would also differ. We studied the composition of grey seal diets at Sable Island, an offshore site 160 km east of Nova Scotia, Canada. Otoliths, squid beaks and other hard parts, representing more than 24 types of prey, were recovered from 365 of 393 grey seal faeces collected between July 1991 and January 1993. Despite the large number of taxa found, 3 prey - sand lance Ammodytes dubius (69.2%), Atlantic cod Gadus morhua (15.5%) and flatfishes (Pleuronectiformes, 10.7 %) - accounted for 95.4 % of the estimated wet weight food consumed by grey seals. Despite within-year vanation in the species composition of grey seal diets, sand lance was the most important food in all months sampled. Comparisons of prey species abundance in research trawl surveys to that in grey seal diets indicated that more abundant and more widely distributed species accounted for most of the prey eaten.
KEY WORDS: Grey seal . Halichoerus grypus . Diet . Prey size . Otolith - Sable Island
INTRODUCTION
In recent years, considerable effort has been devoted to obtaining quantitative estimates of seasonal and geographic variation in the species composition of pinniped diets (Bailey & Ainley 1982, Perez & Bigg 1986, Harkonen 1987, Hammond & Prime 1990, Ole- siuk et al. 1990, Pierce et al. 1990a, Prime & Hammond 1990, Bowen et al. 1993). Generally these data have been collected from mainland haul-out sites or from sites on coastal islands, with the result that the compo- sition of offshore diets may not be adequately re- presented. The limitations of such sampling may be of relatively little concern in some species, but they could be a significant source of uncertainty about the compo- sition of the diets in a species with a broad offshore dis- tribution, such as the grey seal Halichoerus grypus, where prey assemblages may differ significantly from those nearer to coastal mainland foraging areas.
In the northwest Atlantic, grey seals inhabit coastal and offshore waters of the continental shelf from the
Gulf of Maine to southern Labrador and the Gulf of St. Lawrence (Mansfield & Beck 1977). More than 90 % of grey seal births in the northwest Atlantic take place on Sable Island on the Scotian Shelf and on the ice in the southern Gulf of St. Lawrence during the period from late December to early February (Stobo & Zwa- nenburg 1990). Returns of tags suggest that grey seals are widely distributed throughout their range outside of the breeding season (Stobo et al. 1990). However, on the eastern Scotian Shelf, a significant fraction of the grey seal population is thought to use Sable Island and surrounding waters throughout the year.
Using data from research vessel surveys, Mahon & Smith (1989) concluded that the offshore banks of the Scotian Shelf, such as Sable Island Bank, support per- sistent demersal fish assemblages which differ from the more nearshore areas adjacent to mainland Nova Scotia in both species composition and relative abundance of dominant species. Located approximately 160 km east of mainland Nova Scotia, Sable Island provides an un- usual opportunity to study the offshore diet of grey seals
8 Inter-Research 1994 Resale of full article not permitted

Mar. Ecol. Prog. Ser. 112: 1-11, 1994
on the Scotian Shelf. The maximum daily foraging range of grey seals is about 80 km, therefore, we are confident that our samples come from a different prey assemblage (i.e. the Eastern Banks assemblage; Mahon & Smith 1989) than samples collected at or near mainland haul- out sites (Bowen et al. 1993).
Estimates of pup production in the Gulf of St. Lawrence and censuses of pups conducted on Sable Island indicate that production has been increasing since the late 1960s (Zwanenburg & Bowen 1990). Pup production on Sable Island increased by more than 20-fold between the early 1960s and 1989 (Stobo & Zwanenburg 1990, Zwanenburg & Bowen 1990). The total number of grey seals in eastern Canada has also increased substantially over the past several decades. Zwanenburg & Bowen (1990) estimated the 1987 pop- ulation at 106 000 seals, with nominal confidence limits of 84 000 to 130 000.
The increasing number of grey seals in eastern Canada, coupled with existing information which sug- gests that commercial species are often consumed by grey seals (Mansfield & Beck 1977, Benoit & Bowen 1990, Murie & Lavigne 1992, Bowen et al. 1993), has highlighted the potential for competitive interactions between grey seals and commercial fisheries. Assess- ment of these interactions requires reliable quantita- tive data on the diet of grey seals at both mainland and offshore locations. Few quantitative studies of grey seal diets have been conducted in eastern Canada (Benoit & Bowen 1990, Murie & Lavigne 1992, Bowen et al. 1993) and for the most part the samples collected in these studies have come from mainland locations.
The purpose of our study was 2-fold: first, to deter- mine the species composition and size of prey con- sumed by grey seals offshore, and the extent to which diets might vary temporally; and second, to examine diet composition in relation to the estimates of prey abundance and distribution near Sable Island.
METHODS
On 8 occasions between July 1991 and January 1993, 393 faecal samples were collected at grey seal haul-out sites on Sable Island, Canada (Fig. 1). Given that grey seals and harbour seals Phoca vitulina generally use different parts of the island and that grey seal faeces are larger than those of harbour seals, we were con- fident that only grey seal faeces were collected. Indi- vidual samples were placed in labelled plastic bags and stored at -20°C. Each sample was placed in a jar of water, thawed at room temperature for about 12 h, and then blended for 30 to 60 s using a Sorvall Omni-mixer to break up the faecal material. The contents of the jar were then poured into a plastic
0 July 1992
Fig. 1 . Location of Sable Island (Canada) on the Scotian Shelf and of research fishing stations, within approximately 78 km of Sable Island, from research trawl surveys conducted by the Marine Fish Division, Bedford Institute of Oceanography in
1991 and 1992
tray and inspected for the presence of shrimp and other invertebrate remains, some of which tended to float. This solution was poured off, leaving the heavier material which included hard parts such as otoliths and squid beaks. The volume of this material was reduced by gently running water through the tilted tray. The remaining sediment was then examined under a dissecting microscope to maximize the number of otoliths recovered. A photographic print of a micro- meter was mounted on the base of the microscope to permit otoliths and squid beaks to be measured to the nearest 0.1 mm. Of the otoliths recovered, only sagittae were counted and measured. Otoliths and squid beaks were transferred to individually labelled vials containing a solution of 70% EtOH, 25 % water and 5% glycerine for storage. To test the efficacy of our otolith recovery technique, we passed the dis- carded fluid from 6 scat samples, from which several hundred otoliths had been removed, through a fine (0.165 pm) mesh screen and recovered no otoliths or other prey hard parts. Otoliths were identified by comparing them with a reference collection of otoliths from the Scotian Shelf. Red hake Urophycis chuss and white hake U. tenuis were lumped in our study because most of the otoliths recovered of these species were small and could not be reliably distinguished. Squid beaks were identified using Clarke (1986). Skates Raja spp. were identified by the thorns found on the dorsal surface of the body of most species.

Bowen & Harrison: Offshore diet of grey seals
We attempted to identify the number of right and left otoliths (and upper and lower squid beaks) of each species to estimate the number of individual prey rep- resented in each sample. Unmatched otoliths and beaks were counted as one prey. In cases of badly eroded otoliths or where large numbers precluded matching the number of left and right otoliths (e.g. sand lance Arnrnodytes dubius), the total number of otoliths of each species was divided by 2 to derive the number of prey in the sample.
Otoliths are eroded by gastric fluids as they pass through the gastro-intestinal tract. This can bias esti- mates of prey size and thus the importance of different species in the diet. In this study, we attempted to mini- mize this problem by not measuring severely eroded otoliths, many of which could not be identified to species in any case. In practice, this meant measuring only those otoliths, regardless of size, with surface features such as the sulcus or lobation relatively intact. These features are usually the first to erode during digestion and are the most reliable indicators of otolith condition.
To estimate fish prey size, otolith length was meas- ured from the anterior edge to the posterior edge through the center (nucleus) of the otolith. In the case of squid, the lower rostral length of lower beaks was measured to estimate prey weight following Clarke (1986). Only 1 otolith or beak was measured for each individual prey. In deriving estimates of total weight of each species consumed, the size distribution of un- measured otoliths from individual faecal samples within each month was assumed to be equal to that of otoliths which were measured. Regression equations used to estimate prey length and prey weight are given in Table 1. The equations developed in this study are based on fish collected on the Scotian Shelf (Fig. 1).
The large number of sand lance otoliths recovered (n = 27 676) made it impractical to consider measuring all of them. To determine a reasonable subsample of otoliths to measure, we applied a components of variance technique for 2-stage sampling described by Snedecor & Cochrane (1967, p. 528). A total of 6 sand lance otoliths from each of 12 faecal samples were randomly selected and measured to the nearest 0.1 mm. Using an ANOVA, we found that within- sample variability in otolith length (MS = 0.078) was low relative to the variability among samples (MS = 0.779). Using these variance estimates, we determined that measuring a maximum of 5 otoliths per faecal sample was sufficient to limit the SE of the mean to < 0.1 % with 95 % confidence.
To some extent, the diet of grey seals ought to reflect the relative abundance and distribution of prey. An estimate of prey distribution and abundance was ob- tained from research surveys conducted by the Marine Fish Division, Bedford Institute of Oceanography, on the Scotian Shelf in March and July of the years covered by our faecal collections. Conducted since 1970, these stratified-random surveys use a bottom trawl that is equipped with a 0.25 inch (6.4 mm) mesh liner to retain small fish that would not be retained by the trawls used in commercial fisheries. Thus, these surveys provide a measure of the abundance and dis- tribution of all sizes of prey that might be available to grey seals. Our current understanding of the structure of demersal fish assemblages on the Scotian Shelf is based on the analysis of 18 of these surveys conducted between 1970 and 1981 (Mahon & Smith 1989).
To compare the abundance of prey species in bottom- trawl surveys with their importance in the diet of grey seals, we selected only those research fishing stations
Table 1. Regression equations used to estimate fork length (FL) and wet weight (W) from fish otolith length (OL) and squid beak lower rostral length (LRL)
Species Fork length (cm) Wet we~ght (g)
Atlantic cod Gadus morhua ln(FL) = 3.3138 + 1.6235 ln(OL, W = 0 0 1 2 4 ( ~ ~ ) ~ ' ~ Haddock Melanogrammus aeglefinus + ln(FL) = 2.9775 + 1.5846 ln(OL, cm)' W = 0 0071(FL)~ 'O
Pollock Pollachius virens ln(FL) = 3.2510 + 1.6251 ln(OL, cm)" W = 0 . 0 1 3 4 ( ~ ~ ) ~ ~ ~ Silver hake Merluccius bilinearis ln(FL) = 3.0111 + 1.0276 ln(OL, W = 0 . 0 0 5 9 ( ~ ~ ) ~ ~ ~ White hake Urophycis tenuis FL = 1.5250(0L, mm)' 1456 c W = 0.003998(FL) I7l8 c
American plaice Hippoglossoidesplatessoides ln(FL) = 4.0339 + 1.2425 ln(OL, cm)' W = 0.0023(FL)3 36
Yellowtail flounder Limanda ferruginea FL = -6.979 + 6.709(0L, mm)g W = 0.0023(FL) 36
Witch flounder Glyptocephalus cynoglossus W = 0.0770(0L)4 Winter flounder Pseudopleuronectes amencanus FL= -8.559 + 8.389(0L, mm)g W = 0.0079(FL)3 l2 Sand lance Ammodytes spp. FL = -4.377 + 9.024(0L, mm)g W = 0.1248(FL)' 75
Redfish Sebastes spp. ln(FL) = 3.1273 + 1.1436 ln(OL, W = 0 . 0 1 3 0 ( ~ ~ ) ~ ~ ~ ~ Atlantic herring Clupea harengus log(W) = 0.03 + 3.28 log(0L)g Capelin Mallotus villosus W = 0.93(0L) O5
Squid Illex illecebrocus ln(W) = 1.773 + 2.40 ln(LRL, mm)'
'Hunt (1992); bJ. J. Hunt pers. comm.; 'Clay & Clay (1991); dHark6nen (1986); eRoss (1992); 'Clarke (1986); gThis study

4 Mar. Ecol. Prog. Ser. 112: 1-11, 1994
that were within approximately 78 km of Sable Island. This is based on our estimate of the daily foraging range of grey seals around Sable Island. Recent satellite tracking data from 3 adult grey seals indicate a minimum average swimming speed of 0.9 m S-'
(McConnell et al. 1992). These data suggested that a grey seal might travel up to 78 km d-'. Based on food passage time in experiments on seals, we assumed that grey seals could have deposited faeces on Sable Island no more than 24 h after feeding (Prime 1979, Harvey 1989).
RESULTS
Overall composition of the diet
Otoliths, squid beaks and other hard parts, repre- senting 124 types of prey, were found in 365 of the 393 scats collected (Table 2). The 28 samples that con-
tained no identifiable prey were distributed through- out all 8 months sampled, suggesting no pattern to their occurrence. Unidentified flatfishes, gadoids, and clupeids accounted for 158 of 791 or 20.0% of prey occurrences in the 365 scats containing prey hard parts. Only 36 fish occurrences could not be identified even to this level. Of the identified prey items, sand lance (39.2 %), silver hake Merluccius bilinearis (6.8 %) and Atlantic cod Gadus morhua (5.5 %) occurred most frequently. Sand lance dominated the diet in terms of the estimated number of individual prey consumed, followed by cod, redfish Sebastes spp., silver hake and capelin Mallotus villosus (Table 2). Expressed as per- cent wet weight, sand lance (80.9 %), cod (1 1.0 %), and silver hake (2.6%) accounted for 94.5 % of the identi- fied prey consumed by grey seals over the study period (Table 2).
Unknown flatfish and otoliths from gadid species that are difficult to distinguish (i.e. cod, pollock and had- dock) represented 81 and 42% of the total number of
Table 2. Halichoerus grypus. Frequency of occurrence, number of prey, number of otoliths and estimated wet weight (wt) of prey consumed by grey seals
Speciesa No. of Percentage Est. no. of % of total No. of otoliths % of otoliths Est. prey % of occurrences occurrence prey Prey found measured wt (kg) total wt
Sand lance 321 39.2 13 838 93.3 27 636 3.2 187.1 80.9 Atlantic cod 45 5.5 140 0.9 254 31.9 25.5 11.0 Silver hake 56 6.8 97 0.3 158 19.0 5.9 2.6 American plaice 20 2.4 25 0.2 43 53.5 3.2 1.4 Redfish 31 3.8 98 0.7 180 39.4 3.0 1.3 Yellowtail flounder 22 2.7 28 0.2 43 62.8 2.5 1.1 Witch flounder 4 0.5 5 <O.l 9 55.6 1.0 0.4 Capelin 16 2.0 72 0.5 133 21.8 0.9 0.4 Squid (beaks) 6 0.7 11 0.1 14 35.7 0.7 0.3 Hake Urophycis spp. 13 1.6 24 0.2 40 37.5 0.6 0.2 Pollock 4 0.5 5 10.1 8 62.5 0.4 0.2 Atlantic herring 3 0.4 3 c0.1 3 100.0 0.4 0.2 Winter flounder 1 0.1 1 10.1 1 100.0 0.1 <0.1 Haddock 2 0.2 3 <0.1 3 100.0 <0.1 <0.1 Unknown flatfish 98 12.0 251 1.7 444 Unknown gadid 59 7.2 114 0.8 190 Unknown fish 36 4.4 52 0.4 7 l Windowpane flounderb 3 0.4 5 <0.1 8 Mailed sculpin C 2 0.2 3 <0.1 4 Atlantic halibutd 1 0.1 1 10.1 2 Ocean poute 1 0.1 1 10.1 2 Atlantic sea raven' 1 0.1 1 10.1 2 Unknown clupeid 1 0.1 1 10.1 1 Skate Raja spp. 20 2.4 20 0.1 Clam spp. 7 0.9 11 0.1 Sea urchin spp. 10 1.2 10 0.1 Crab spp. 6 0.7 6 Shrimp spp. 2 0.2 2
No prey found 28 3.4
Totals 819 100.0 14828 100.0 29 249 4.2 231.3 100.0
' Genus and species given in Table 1 and as noted; bScophthalrnus aquosus; CTnglops murrayi; d~ippoglossus hippoglossus; 'Macrozoarces americanus; 'Hernitripterus arnericanus
Bowen & Harrison: Offshore diet of grey seals 5
otoliths recovered from these 2 taxa, respectively. We felt that excluding these otoliths from further analysis would tend to underestimate the importance of these prey in the diet. In the case of flatfish, we prorated the unknown flatfish by the proportion of each species in the identified sample each month to obtain an estimate of the total numbers of each flatfish species eaten. We then used the regressions of individual flatfish species in Table 1 to estimate the wet weight of the unidentified flatfish. Because the majority of the flatfish otoliths were unknown, we felt that it was more appropriate to express the final result simply as flatfish rather than by individual species. We used the same approach in deal- ing with the unknown gadids, but as most of these otoliths were identified as cod or pollock, we felt we could use individual species in subsequent analyses.
Temporal variation
Variation over the 8 sampled months in both the numbers and percent wet weight of prey species con- sumed is shown in Table 3. Sand lance accounted for between 87 and 96% of the total number of prey eaten by grey seals in all months sampled between July 1991 and January 1993. Cod, flatfish, silver hake and redfish combined accounted for another 4 to 10% of the number of prey eaten. Sand lance accounted for 49.7 to 85.3% of the food eaten by weight, followed by cod (1.6 to 44.1 %), flatfish (2.9 to 19.4%) and silver hake (0 to 5.6 %).
With the exception of sand lance, the estimated number of individuals consumed within each month was insufficient to attempt statistical analysis of monthly variation. We used a logit model to investigate sea- sonal variation in the number of sand lance consumed. The model has the following form:
log[pijk/(l - pijk)] = Mean + Month effectk +
where p is the proportion of prey species i in scat j in month k and ek is the error term. To test the null hypothesis of no month effect, we compared the change in deviance between the mean model and the model including month. The change in deviance of 129.1 with df 7 indicated a significant month effect. However, the residuals from the model exceeded those expected from a standard normal distribution, indi- cating that the data were overdispersed. This over- dispersion may reflect the fact that samples tended to be collected in clusters (i.e. a number of samples collected on the same day). To account for this over- dispersion, we used a scaled logit model in which the dispersion parameter (equal to 1 in the logit model) was estimated by fitting the model. The estimated dis- persion parameter was 22.6. When the effect of this overdispersion was included in the model, there was no significant month effect (x2 = 5.71, df = 7, p = 0.57).
There was more evidence of temporal variation when the diet was expressed as percent wet weight of prey consumed (Table 3). Although statistical analysis of these data was not possible because we could only
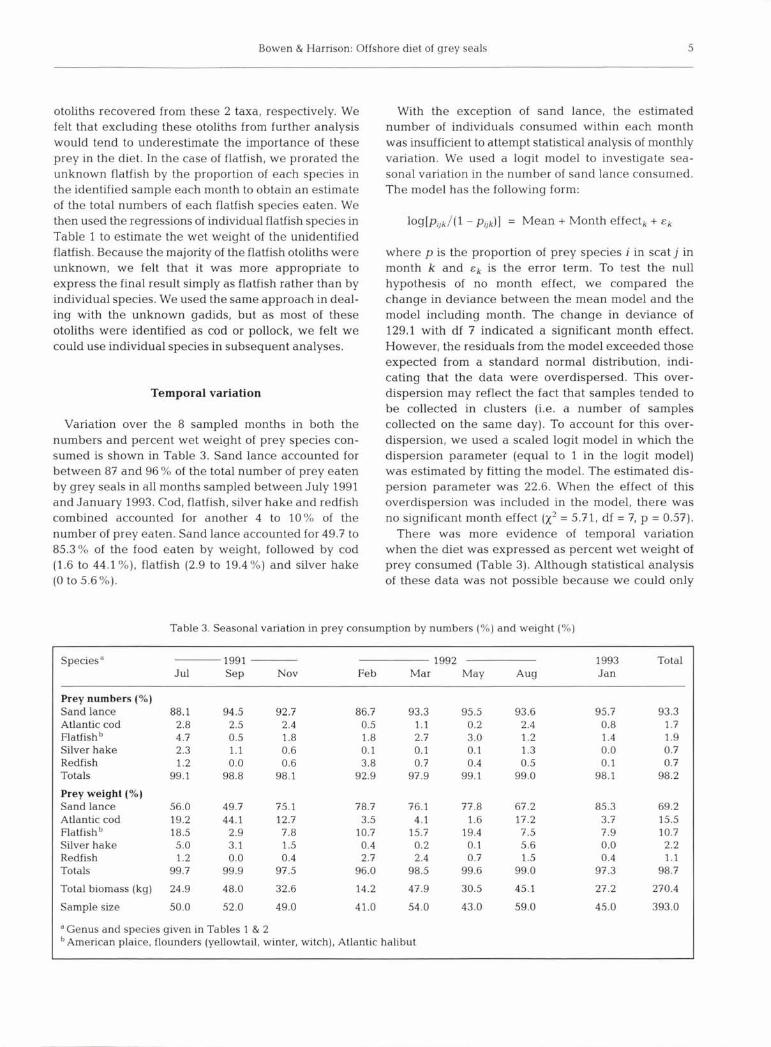
Table 3. Seasonal variation in prey consumption by numbers (%) and weight (%)
Species' 1991 - 1992 1993 Total Jul Sep Nov Feb Mar May Aug Jan
Prey numbers (%) Sand lance 88.1 94.5 92.7 86.7 93.3 95.5 93.6 95.7 93.3 Atlantic cod 2.8 2.5 2.4 0.5 1.1 0.2 2.4 0.8 1.7 ~laf f ish 4.7 0.5 1.8 1.8 2.7 3.0 1.2 1.4 1.9 Silver hake 2.3 1.1 0.6 0.1 0.1 0.1 1.3 0.0 0.7 Redfish 1.2 0.0 0.6 3.8 0.7 0.4 0.5 0.1 0.7 Totals 99.1 98.8 98.1 92.9 97.9 99.1 99.0 98.1 98.2
Prey weight (76) Sand lance 56.0 49.7 75.1 78.7 76.1 77.8 67.2 85.3 69.2 Atlantic cod 19.2 44.1 12.7 3.5 4.1 1.6 17.2 3.7 15.5 Flatfishb 18.5 2.9 7.8 10.7 15.7 19.4 7.5 7.9 10.7 Silver hake 5.0 3.1 1.5 0.4 0.2 0.1 5.6 0.0 2.2 Redfish 1.2 0.0 0.4 2.7 2.4 0.7 1.5 0.4 1.1 Totals 99.7 99.9 97.5 96.0 98.5 99.6 99.0 97.3 98.7
Total biomass (kg) 24.9 48.0 32.6 14.2 47.9 30.5 45.1 27.2 270.4
Sample size 50.0 52.0 49.0 41.0 54.0 43.0 59.0 45.0 393.0
a Genus and species given in Tables 1 & 2 bAmerican plaice, flounders (yellowtail, winter, witch), Atlantic halibut
6 Mar. Ecol. Prog. Ser. 112: 1-11, 1994
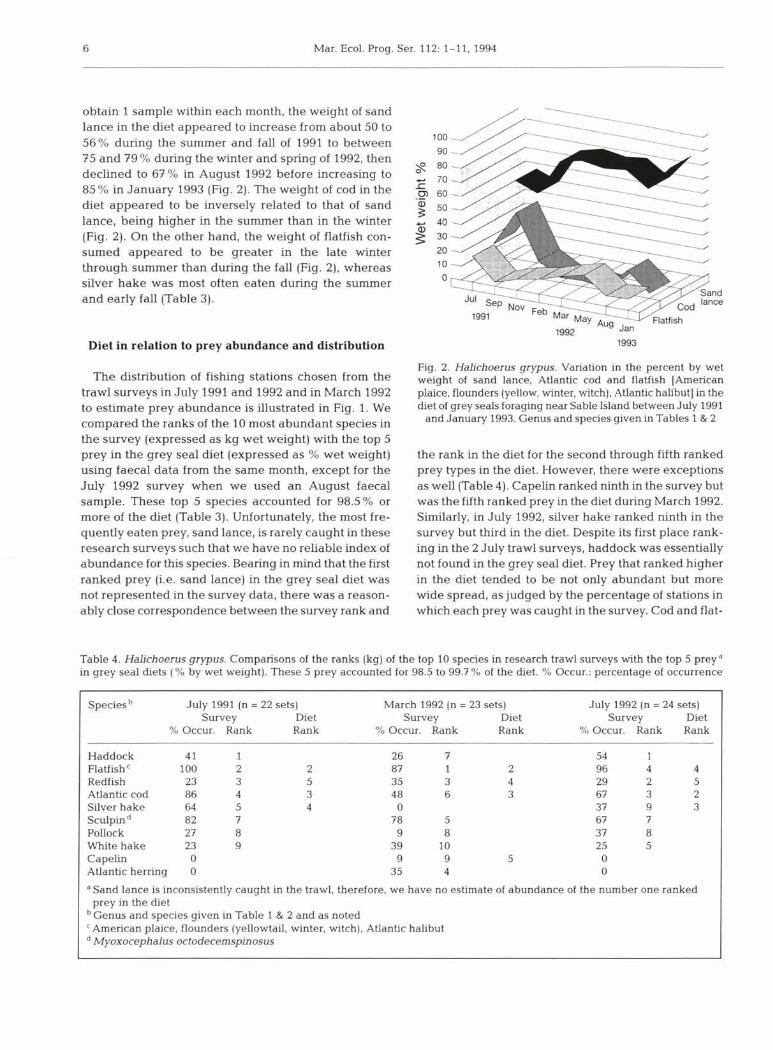
obtain 1 sample within each month, the weight of sand lance in the diet appeared to increase from about 50 to 56% during the summer and fall of 1991 to between 75 and 79 % during the winter and spring of 1992, then declined to 67% in August 1992 before increasing to 85 % in January 1993 (Fig. 2). The weight of cod in the diet appeared to be inversely related to that of sand lance, being higher in the summer than in the winter (Fig. 2). On the other hand, the weight of flatfish con- sumed appeared to be greater in the late winter through summer than during the fall (Fig. 2), whereas silver hake was most often eaten during the summer and early fall (Table 3).
Diet in relation to prey abundance and distribution
The distribution of fishing stations chosen from the trawl surveys in July 1991 and 1992 and in March 1992 to estimate prey abundance is illustrated in Fig. 1. We compared the ranks of the 10 most abundant species in the survey (expressed as kg wet weight) with the top 5 prey in the grey seal diet (expressed as % wet weight) using faecal data from the same month, except for the July 1992 survey when we used an August faecal sample. These top 5 species accounted for 98.5% or more of the diet (Table 3). Unfortunately, the most fre- quently eaten prey, sand lance, is rarely caught in these research surveys such that we have no reliable index of abundance for this species. Bearing in mind that the first ranked prey (i.e. sand lance) in the grey seal diet was not represented in the survey data, there was a reason- ably close correspondence between the survey rank and
Fig. 2. Halichoerus grypus. Variation in the percent by wet weight of sand lance, Atlantic cod and flatfish [American plaice, flounders (yellow, winter, witch), Atlantic halibut] in the diet of grey seals foraging near Sable Island between July 1991
and January 1993. Genus and species given in Tables 1 & 2
the rank in the diet for the second through fifth ranked prey types in the diet. However, there were exceptions as well (Table 4). Capelin ranked ninth in the survey but was the fifth ranked prey in the diet during March 1992. Similarly, in July 1992, silver hake ranked ninth in the survey but third in the diet. Despite its first place rank- ing in the 2 July trawl surveys, haddock was essentially not found in the grey seal diet. Prey that ranked higher in the diet tended to be not only abundant but more wide spread, as judged by the percentage of stations in which each prey was caught in the survey. Cod and flat-
Table 4. Halichoerus grypus. Comparisons of the ranks (kg) of the top 10 species in research trawl surveys with the top 5 preya in grey seal diets ( % by wet weight). These 5 prey accounted for 98.5 to 99.7 % of the diet. % Occur.: percentage of occurrence
Species July 1991 (n = 22 sets) March 1992 (n = 23 sets) July 1992 (n = 24 sets) Survey Diet Survey Diet Survey Diet
% Occur. Rank Rank % Occur. Rank Rank % Occur. Rank Rank
Haddock 4 1 1 26 7 54 1 FlatfishC 100 2 2 87 1 2 96 4 4 Redfish 23 3 5 35 3 4 29 2 5 Atlantic cod 86 4 3 48 6 3 67 3 2 Silver hake 64 5 4 0 37 9 3 Sculpin 82 7 78 5 67 7 Pollock 27 8 9 8 37 8 White hake 23 9 39 10 25 5 Capelin 0 9 9 U 0 Atlantic herring 0 35 4 0
"Sand lance is inconsistently caught in the trawl, therefore, we have no estimate of abundance of the number one ranked prey in the diet Genus and species given in Table 1 & 2 and as noted
CAmerican plaice, flounders (yellowtail, winter, witch), Atlantic halibut Myoxocephalus octodecem~pinosus
Bowen & Harrison: Offshore diet of grey seals
fish occurred in an average of 81 % (range 48 to 100 %) of the stations in each survey, compared to redfish, silver hake and capelin which on average occurred in only 33 % (range 9 to 64 %) of the stations (Table 4).
Prey size
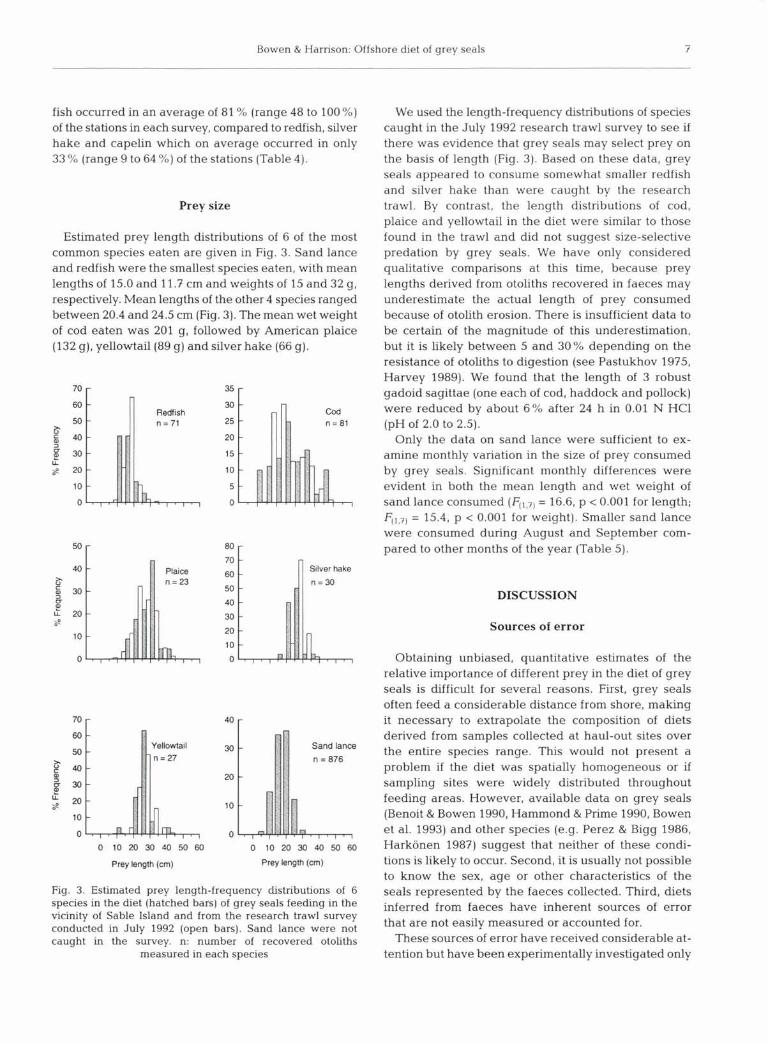
Estimated prey length distributions of 6 of the most common species eaten are given in Fig. 3. Sand lance and redfish were the smallest species eaten, with mean lengths of 15.0 and 1 l .? cm and weights of 15 and 32 g, respectively. Mean lengths of the other 4 species ranged between 20.4 and 24.5 cm (Fig. 3). The mean wet weight of cod eaten was 201 g, followed by American plaice (132 g), yellowtail (89 g) and silver hake (66 g).
40 Silver hake
B J B 20 Z
30
10 20
10
0 0
Yellowtail 30
20
F S 10
10
0 0
Prey length (cm)
Fig. 3. Estimated prey length-frequency distributions of 6 species in the diet (hatched bars) of grey seals feeding in the vicinity of Sable Island and from the research trawl survey conducted in July 1992 (open bars). Sand lance were not caught in the survey. n: number of recovered otoliths
measured in each species
We used the length-frequency distributions of species caught in the July 1992 research trawl survey to see if there was evidence that grey seals may select prey on the basis of length (Fig. 3). Based on these data, grey seals appeared to consume somewhat smaller redfish and silver hake than were caught by the research trawl. By contrast, the length distributions of cod, plaice and yellowtail in the diet were similar to those found in the trawl and did not suggest size-selective predation by grey seals. We have only considered qualitative comparisons at this time, because prey lengths derived from otoliths recovered in faeces may underestimate the actual length of prey consumed because of otolith erosion. There is insufficient data to be certain of the magnitude of this underestimation, but it is likely between 5 and 30% depending on the resistance of otoliths to digestion (see Pastukhov 1975, Harvey 1989). We found that the length of 3 robust gadoid sagittae (one each of cod, haddock and pollock) were reduced by about 6% after 24 h in 0.01 N HC1 (pH of 2.0 to 2.5).
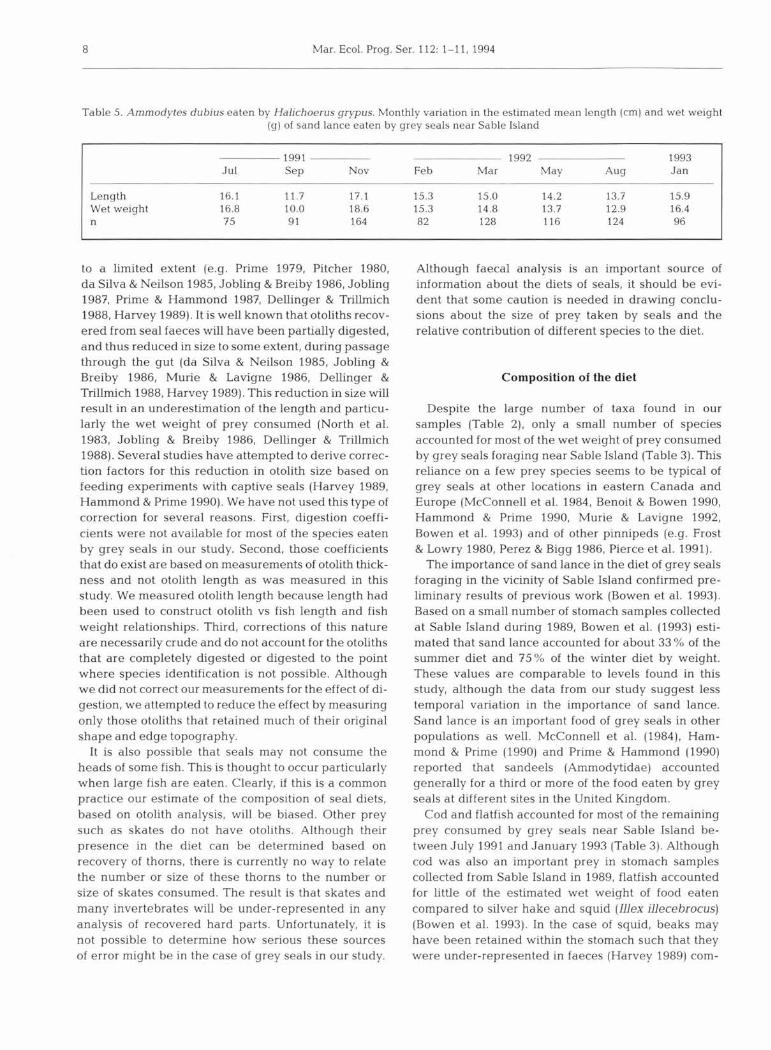
Only the data on sand lance were sufficient to ex- amine monthly variation in the size of prey consumed by grey seals. Significant monthly differences were evident in both the mean length and wet weight of sand lance consumed = 16.6, p < 0.001 for length;
= 15.4, p < 0.001 for weight). Smaller sand lance were consumed during August and September com- pared to other months of the year (Table 5).
DISCUSSION
Sources of error
Obtaining unbiased, quantitative estimates of the relative importance of different prey in the diet of grey seals is difficult for several reasons. First, grey seals often feed a considerable distance from shore, making it necessary to extrapolate the composition of diets derived from samples collected at haul-out sites over the entire species range. This would not present a problem if the diet was spatially homogeneous or if sampling sites were widely distributed throughout feeding areas. However, available data on grey seals (Benoit & Bowen 1990, Hamrnond & Prime 1990, Bowen et al. 1993) and other species (e.g. Perez & Bigg 1986, Harkonen 1987) suggest that neither of these condi- tions is likely to occur. Second, it is usually not possible to know the sex, age or other characteristics of the seals represented by the faeces collected. Third, diets inferred from faeces have inherent sources of error that are not easily measured or accounted for.
These sources of error have received considerable at- tention but have been experimentally investigated only
Mar. Ecol. Prog. Ser. 112: 1-1 1, 1994
Table 5. Ammodytes dubius eaten by Halichoerus grypus. Monthly variation in the estimated mean length (cm) and wet weight (g) of sand lance eaten by grey seals near Sable Island
1991 1992 1993 Jul S ~ P Nov Feb Mar May *ug Jan
Length 16.1 11.7 17.1 15.3 15.0 14.2 13.7 15.9 Wet weight 16.8 10.0 18.6 15.3 14.8 13.7 12.9 16.4 n 75 91 164 82 128 116 124 96
to a limited extent (e.g. Prime 1979, Pitcher 1980, Although faecal analysis is an important source of da Silva & Neilson 1985, Jobling & Breiby 1986, Jobling information about the diets of seals, it should be evi- 1987, Prime & Harnmond 1987, Dellinger & Trillrnich dent that some caution is needed in drawing conclu- 1988, Harvey 1989). It is well known that otoliths recov- sions about the size of prey taken by seals and the ered from seal faeces will have been partially digested, relative contribution of different species to the diet. and thus reduced in size to some extent, during passage through the gut (da Silva & Neilson 1985, Jobling & Breiby 1986, Murie & Lavigne 1986, Dellinger & Composition of the diet Trillmich 1988, Harvey 1989). This reduction in size will result in an underestimation of the length and particu- Despite the large number of taxa found in our larly the wet weight of prey consumed (North et al. samples (Table 2), only a small number of species 1983, Jobling & Breiby 1986, Dellinger & Trillrnich accounted for most of the wet weight of prey consumed 1988). Several studies have attempted to derive correc- by grey seals foraging near Sable Island (Table 3). This tion factors for this reduction in otolith size based on reliance on a few prey species seems to be typical of feeding experiments with captive seals (Harvey 1989, grey seals at other locations in eastern Canada and Hammond & Prime 1990). We have not used this type of Europe (McConnell et al. 1984, Benoit & Bowen 1990, correction for several reasons. First, digestion coeffi- Hammond & Prime 1990, Murie & Lavigne 1992, cients were not available for most of the species eaten Bowen et al. 1993) and of other pinnipeds (e.g. Frost by grey seals in our study. Second, those coefficients & Lowry 1980, Perez & Bigg 1986, Pierce et al. 1991). that do exist are based on measurements of otolith thick- The importance of sand lance in the diet of grey seals ness and not otolith length as was measured in this foraging in the vicinity of Sable Island confirmed pre- study. We measured otolith length because length had liminary results of previous work (Bowen et al. 1993). been used to construct otolith vs fish length and fish Based on a small number of stomach samples collected weight relationships. Third, corrections of this nature at Sable Island during 1989, Bowen et al. (1993) esti- are necessarily crude and do not account for the otoliths mated that sand lance accounted for about 33 % of the that are completely digested or digested to the point summer diet and 75% of the winter diet by weight. where species identification is not possible. Although These values are comparable to levels found in this we did not correct our measurements for the effect of di- study, although the data from our study suggest less gestion, we attempted to reduce the effect by measuring temporal variation in the importance of sand lance. only those otoliths that retained much of their original Sand lance is an important food of grey seals in other shape and edge topography. populations as well. McConnell et al. (1984), Ham-
It is also possible that seals may not consume the mond & Prime (1990) and Prime & Hammond (1990) heads of some fish. This is thought to occur particularly reported that sandeels (Ammodytidae) accounted when large fish are eaten. Clearly, if this is a common generally for a third or more of the food eaten by grey practice our estimate of the composition of seal diets, seals at different sites in the United Kingdom. based on otolith analysis, will be biased. Other prey Cod and flatfish accounted for most of the remaining such as skates do not have otoliths. Although their prey consumed by grey seals near Sable Island be- presence in the diet can be determined based on tween July 1991 and January 1993 (Table 3). Although recovery of thorns, there is currently no way to relate cod was also an important prey m stomach samples the number or size of these thorns to the number or collected from Sable Island in 1989, flatfish accounted size of skates consumed. The result is that skates and for llttle of the estimated wet weight of food eaten many invertebrates will be under-represented in any compared to silver hake and squid (Illex illecebrocus) analysis of recovered hard parts. Unfortunately, it is (Bowen et al. 1993). In the case of squid, beaks may not possible to determine how serious these sources have been retained within the stomach such that they of error might be in the case of grey seals in our study. were under-represented in faeces (Harvey 1989) com-

Bowen & Harrison: Offshore diet of grey seals
pared to the 1989 stomach data. Although we have no direct estimates, it is also possible that these differ- ences reflect a change in the abundance of squid on the Scotian Shelf, as squid abundance varies greatly among years.
Temporal variation in the species composition of grey seal diets is well documented (Benoit & Bowen 1990, Hammond & Prime 1990, Bowen et al. 1993). Evi- dence of temporal variation in the relative importance of different species in the diet was apparent in this study as well (Table 3, Fig. 2). Although important throughout the year, sand lance accounted for a greater percentage of the diet by weight during the winter than during the summer months. Cod and silver hake were consumed primarily during the late summer and fall when both species move into shallower water over the offshore banks surrounding Sable Island. This temporal variation in the diet suggests a seasonal effect. However, additional data are needed to confirm that this pattern is indeed seasonal.
The results of our study also confirm that diet of grey seals foraging near Sable Island differs from that observed at haul-outs along the Nova Scotia mainland. At these inshore sites, Bowen et al. (1993) found that herring and mackerel replaced sand lance and flatfish as important foods. These differences are consistent with differences in the demersal fish assemblages near Sable Island compared to those nearer to the mainland (Mahon & Smith 1989). Yellowtail flounder, an abun- dant member of the Eastern Banks assemblage, was also a significant prey of grey seals near Sable Island (about 50% of flatfish eaten by weight), but was absent from the diet near mainland sites (Bowen et al. 1993) where this species is uncommon. Research vessel survey results show that sand lance is most abundant on the offshore banks of the eastern Scotian Shelf but is uncommon nearer to the mainland (Simon & Comeau in press).
Factors affecting diet composition
We know relatively little about the factors that affect the composition of grey seal diets. However, encounter rate between predator and prey, and prey profitability (defined as net energy value of prey divided by hand- ling time; Stephens & Krebs 1986) affect prey choice in other predators (e.g. Stephens & Krebs 1986) and thus are likely to influence the composition of grey seal diets as well. Although we do not have the handling time data to estimate the relative profitability of prey to grey seals, the broad-scale spatial distribution, degree of clumping, and numerical abundance of prey in research trawl surveys can be used to roughly estimate possible differences in encounter rates between seals
and their prey. Research, bottom-trawl surveys provide an index of relative abundance and coarse spatial dis- tribution of some of the more common grey seal prey. Unfortunately, the species (i.e. sand lance) that accounted for most of the grey seal diet by weight is infrequently caught in these surveys, and thus we have no comparable estimate of sand lance abundance on the Scotian Shelf. Nevertheless, these surveys do show many of the largest catches of sand lance in the sur- veys were made in the vicinity of Sable Island (Simon & Comeau in press), suggesting that the species was relatively abundant in the study area. For other spe- cies, comparison of the rank abundance of other prey in survey data to that in grey seal diets suggests that more abundant species account for more of the diet than less abundant ones. Studies of other pinniped species also suggest that the abundance of prey is an important factor determining diet composition. For example, Bailey & Ainley (1982) reported that the decline in sea lion Zalophus californianus predation on Pacific hake Merluccius productus was apparently related to a decline in the abundance of 2 to 4 yr old hake, the most common ages eaten by sea lions. By contrast, when these age classes were abundant, hake dominated the sea lion diet. Sinclair et al. (1994) found that interannual variation in the importance of pollock Theragra chalcogramma in the diet of fur seals Cal- lorhinus ursinus was positively related to year-class strength of pollock.
The absence of haddock from the grey seal diet is a notable exception to our observation that more abun- dant species were more prominent in the diet. It is possible that we failed to properly identify haddock otoliths, however, blind tests showed that one of us (G.D.H.) could reliably identify cod, haddock and pol- lock otoliths. A more likely explanation is that since most of the haddock caught in surveys came from stations near the southern limit of our estimated for- aging range of grey seals, haddock meals may simply have not been observed in faeces collected on Sable Island. We might have expected to see more redfish in the diet, based on their abundance in the surveys, however, redfish catches were highly clumped (i.e. only a third or less of the research stations) and, like haddock, were caught at the edge of the area from which redfish otoliths were likely to have been found in faecal samples collected from the island.
The estimated length frequencies of prey eaten by grey seals in this study suggest that fish less than 40 cm are the main target of predation (Fig. 3). These data confirm the results of several other studies of grey seals (Benoit & Bowen 1990, Hammond & Prime 1990, Murie & Lavigne 1992, Bowen et al. 1993). Thus, length- specific abundance may be a more sensitive measure of prey availability to seals than total abundance. The
Mar. Ecol. Prog. Ser. 112: 1-11, 1994
comparison of our otolith-reconstructed length fre- quencies to those from research trawl surveys indi- cated that grey seals apparently consumed smaller redfish a n d silver hake than were caught in the surveys. By contrast, the length distributions of cod, yellowtail flounder a n d American plaice ea ten by seals were similar to those caught in the surveys. These results must b e regarded a s tentative because the small sample of prey lengths from the diet required us to compare survey data, taken over a single month, with diet da ta combined over the entire study period. Additional research is needed to clarify the extent to which grey seals show size-selective predation.
There can b e little doubt that w e face considerable difficulties in attempting to determine the diets of grey seals a n d other pinnipeds. Our Sable Island da ta likely provide a reasonable picture of the diet of grey seals on the offshore banks of the eastern Scotian Shelf, given that this a rea appears to represent a relatively homogeneous assemblage of demersal fishes (Mahon & Smith 1989). However, grey seals foraging o n the western Scotia Shelf will encounter different demersal fish assemblages (Mahon & Smith 1989) from those on the eastern shelf, a n d therefore, w e might expect t he diet to differ from that reported here. Finally, given the potential for obtaining biased results from the use of otoliths a n d other hard parts, it is important that other methods b e developed to complement t he da ta ob- tained from current approaches. For example, Pierce e t al. (1990b) have reported some success in the develop- ment of serological methods for prey identification. It may also b e possible to determine the composition of seal diets based on the analysis of fatty acid signatures in lipids collected from seal tissues such a s blood, blubber, a n d milk (Iverson 1988, 1993).
Acknowledgements. We are grateful to B. Beck for collecting the faecal samples from Sable Island and for recovering the otoliths and other hard parts from the samples in the labora- tory. This study would not have been possible were it not for his efforts. S. Campana kindly provided access to his refer- ence collection of otoliths from Scoban Shelf fishes. B. Beck and J. Hunt provlded advice on prey identification. We thank S. Smith and B. Field for suggesting the logit model and for help with the analysis. S. J . Iverson and K. Zwanenburg and 3 referees provided helpful comments on an earlier draft of the manuscript.
LlTE!RATURE CITED
Bailey, K. M., Ainley, D. G. (1982). The dynamics of California sea lion predation on pacific hake. Fish. Res. 1: 163-176
Benoit, D., Bowen, W. D. (1990). Seasonal and geographic variation in the diet of grey seals (Halicheorus grypus) in eastern Canada. Can. Bull. Fish. Aquat. Sci. 222: 215-226
Bowen, W. D., Lawson, J. W., Beck, B. (1993). Seasonal and geographic variation in the species composition and size
of prey consumed by grey seals (Halichoerus grypus) on the Scotian shelf. Can. J. Fish. Aquat. Sci. 50: 1768-1778
Clarke, M. R. (1986). A handbook for the identification of cephalopod beaks. Clarendon Press, Oxford
Clay, D., Clay, H. (1991). Determination of age and growth of white hake (Urophycis tenuis Mitchell) from the southern Gulf of St. Lawrence, Canada (including techniques for commercial sampling). Can. Tech. Rep. Fish. Aquat. Sci. No. 1828
da Silva, J., Neilson, J. (1985). Limitations of using otoliths recovered in scats to estimate prey consumption in seals. Can. J. Fish. Aquat. Sci. 42: 1439-1442
Dellinger, T., TriLlmich, F. (1988). Estimating diet composition from scat analysis in otariid seals (Otariidae): is it reliable? Can. J. Zool. 66: 1865-1870
Frost, K. J., Lowry, L. F. (1980). Feeding of ribbon seal (Phoca fasciata) in the Bering Sea in spring. Can. J. Zool. 58: 1601-1607
Hammond, P. S., Prime, J. H. (1990). The diet of British grey seals (Halicheorus grypus) in eastern Canada. Can. Bull. Fish. Aquat. Sci. 222: 234-254
Harkonen, T. J. (1986). Guide to the otoliths of the bony fishes of the Northeast Atlantic. Danbiu ApS. Biological Consul- tants, Hellerup, Denmark
Harkonen, T. J. (1987). Seasonal and regional variations in the feeding habits of the harbour seal, Phoca vitulina, in the Skagerrak and the Kattegat. J. Zool., Lond. 213: 535-543
Harvey, J. T. (1989). Assessment of errors associated with harbour seal (Phoca vitulina) faecal sampling. J. Zool., Lond. 219: 101-111
Hunt, J. J. (1992). Morphological characteristics of otoliths for selected fish in the Northwest Atlantic. J. NW Atlant. Fish. Sci. 13: 63-75
Iverson, S. J. (1988). Composition, intake and gastric diges- tion of milk lipids in pinnipeds. Ph.D. thesis, University of Maryland, College Park
Iverson, S. J. (1993). Milk secretion in marine mammals in relation to foraging: can milk fatty acids predict diet? Symp. Zool. Soc. Lond. 66: 263-291
Jobling, M. (1987). Marine mammal faecal samples as indi- cators of prey importance-a source of error in bio- energetics studies. Sarsia 72: 255-260
Jobling, M., Breiby, A. (1986). The use and abuse of fish otoliths in studies of feeding habits of marine piscivores. Sarsia 71: 265-274
Mahon, R., Smith, R. W. (1989). Demersal fish assemblages on the Scotian Shelf. northwest Atlantic: s~a t i a l distribution and persistence. Can. J. Fish. Aquat. Sa. (Suppl. 1): 134-152
Mansfield, A. W., Beck, B. (1977). The grey seal in eastern Canada. Fish Mar. Sew. Tech. Rep. 704
McConnell, B. J., Chambers, C., Nicholas, K. S., Fedak, M. A. (1992). Satellite tracking of grey seals (Halichoerus grypus). J. Zool., Lond. 226: 271-282
McConnell, B. J., Prime, J. H., Hiby, A. R., Harwood, J. (1984). Grey seal diet. Natural Environmental Research Council, Cambridge
Murie, D. J., Lavigne, D. M. (1986). Interpretation of otoliths in stomach content analysis of phocid seals: quantifying fish consumption. Can. J. Zool. 64: 1152-1157
Murie, D. J., Lavigne, D. M. (1992). Growth and feeding habits of grey seals (Halichoerus grypus) In the north- western Gulf of St. Lawrence, Canada. Can. J. 2001. 70: 1604-1613
North, A. W., Croxall, J. P., Doidge, D. W. (1983). Fish prey of the Antarctic fur seal Arctocephalus gazella at South Georgia. Br. Antarct. Surv. Bull. 61: 27-37
Bowen & Harrison: Offshore diet of grey seals
Olesiuk, P. F., Bigg, M. A., Ellis, G. M,, Crockford, S. J., Wigen, R. J . (1990). An assessment of the feeding habits of harbour seals (Phoca vitulina) in the Strait of Georgia, British Columbia, based on scat analysis. Can. Tech. Rep. Fish. Aquat. Sci. No. 1730
Pastukhov, V. N. (1975). Number and distribution of the post- parturent females of the Baikal seal. Morsk. Mlekopi- tayushchiye 41: 39-41
Perez, M. A., Bigg, M. A. (1986). Diet of northern fur seals (Callorhinus ursinus) off western North America. Fish. Bull. U.S. 84: 957-971
Pierce, G. J . , Boyle, P. R., Diack, J . S. W. (1991). Digestive tract contents of seals in Scottish waters: comparison of samples from salmon nets elsewhere. J . Zool., Lond. 225: 670-676
Pierce, G. J., Boyle, P. R., Thompson, P. M. (1990a). Diet selec- tion by seals. In: Barnes, M., Gibson, R. N. (eds.) Trophic relationships in the marine environment. Aberdeen Uni- versity Press, Aberdeen, p. 222-238
Pierce, G. J., Diack. J. S. W., Boyle, P. R. (1990b). Application of serological methods to identification of fish prey in diets of seals and dolphins. J . exp. mar. Biol. Ecol. 137: 123-140
Pitcher, K. W. (1980). Stomach contents and faeces as indica- tors of harbor seal, Phoca vitulina, foods in the Gulf of Alaska. Fish. Bull. U.S. 78: 797-798
Prime, J . H. (1979). Observations on the digestion of some ganoid fish otoliths by a young common seal. Comm. Meet. int. Coun. Explor. Sea C.M.-ICES/N: 14
Prime, J. H., Hammond, P. S. (1987). Quantitative assessment of gray seal diet from faecal analysis In: Huntley, A. C.,
Costa, D. P., Worthy, G. A. J. , Castellini, M. A. (eds.) Approaches to marine mammal energetics. Allen Press, Lawrence, KS, p. 165-179
Pnme, J. H., Hammond, P. S. (1990). The diet of grey seals from the south-western North Sea assessed from analyses of hard parts found in faeces. J . appl. Ecol. 27: 435-447
Ross, S.-A. (1992). Diet of the hooded seal, Cystophora cristata. M.Sc. thesis, Memorial Univ. of Newfoundland, St. John's
Simon, J. E., Comeau, P. A. (in press). Summer distribution and abundance trends of species caught on the Scotian Shelf from 1970-92, by the research vessel groundfish survey. Tech. Rep. Fish. Aquat. Sci. No. 1953
Sinclair, E., Loughlin, T., Pearcy, W. (1994). Prey selection by northern fur seals (CaUorhinus ursinus) in the eastern Bering Sea. Fish. Bull. U.S. 92: 144-156
Snedecor, G. W., Cochrane, W. G. (1967). Statistical methods. Iowa State University Press, Ames
Stephens, D. W., Krebs, J. R. (1986) Foraging theory. In: Krebs, J. R., Clutton-brock, T. (eds.) Monographs in behavior and ecology. Princeton University Press, Princeton
Stobo, W. T., Zwanenburg, K. C. T. (1990). Grey seal (Hali- choerus grypus) pup production on Sable Island and estimates of recent production in the Northwest Atlantic. Can. Bull. Fish. Aquat. Sci. 222: 171-184
Stobo, W. T., Beck, B., Horne, J. K. (1990). Seasonal move- ments of grey seals (HaLichoerus grypus) in the Northwest Atlantic. Can. Bull. J. Fish. Aquat. Sci. 222: 199-213
Zwanenburg, K. C. T., Bowen, W. D. (1990). Population trends of the grey seal (Halichoerus grypus) in eastern Canada. Can. Bull. J . Fish. Aquat. Sci. 222: 185-197
This article was submitted to the editor Manuscript first received: November 9, 1993 Revised version accepted: June 22, 1994