Embed Size (px)
Citation preview
Bima House, 12th FloorHarambee AvenueP. O. Box 35616 - 00100 Nairobi, KenyaTel: +254 (0) 20 318939, 2211056Fax: +254 (0) 20 2211920Email: [email protected]: www.cob.go.ke
REPUBLIC OF KENYA
OFFICE OF THE CONTROLLER OF BUDGET
COUNTY GOVERNMENTSBUDGET IMPLEMENTATION REVIEW
REPORT
FIRST QUARTERFY 2015/16
NOVEMBER 2015
REPUBLIC OF KENYA
OFFICE OF THE CONTROLLER OF BUDGET
COUNTY GOVERNMENTS
BUDGET IMPLEMENTATION REVIEW REPORT
FIRST QUARTER
FY 2015/2016
NOVEMBER 2015
OFFICE OF THE CONTROLLER OF BUDGET
COUNTY GOVERNMENTS BUDGET IMPLEMENTATION REVIEW REPORT FIRST QUARTER FY 2015/16ii
PREFACE
It is with great pleasure that the office of the controller of budget presents the first quarter County Governments Budget Implementation Review Report (CBIRR) for the FY 2015/16. The report has been prepared in line with Article 228(6) of the Constitution of Kenya 2010, which requires the Office of the Controller of Budget to submit to each House of Parliament a report on the implementation of the budgets of the National and County Governments every four months.
This is the first report in FY 2015/16 and presents information on budget performance by the County Governments in the period July to September, 2015. Information on budget performance is presented at two levels - the aggregate level by the County Governments, and individual County Government performance. The report also includes performance trends, which present a useful trajectory of revenue and expenditure performance.
During preparation of this report, the Office relied largely on financial reports submitted by the County Governments for the reporting period. These reports were further augmented by information from regular activities undertaken by the Office in monitoring budget implementation by the Counties. Reports from the Integrated Financial Management System (IFMIS) were also used to inform the report. The Office is grateful to staff in the Budget Implementation Directorate and County Treasuries who were instrumental in the preparation of this report.
The information contained in this report is useful to many stakeholders and members of the public who have interest in monitoring budget implementation by the County Governments. This report can assist in assessing individual County Government performance in budget implementation and may also form a basis for performing comparison among counties.
Mrs. Agnes OdhiamboController of Budget
OFFICE OF THE CONTROLLER OF BUDGET
COUNTY GOVERNMENTS BUDGET IMPLEMENTATION REVIEW REPORT FIRST QUARTER FY 2015/16 iii
TABLE OF CONTENTS
PREFACE ................................................................................................................................................ iiLIST OF ABBREVIATIONS/ACRONYMS ........................................................................................ vLIST OF FIGURES ................................................................................................................................ viLIST OF TABLES ................................................................................................................................... xvEXECUTIVE SUMMARY ..................................................................................................................... xviiiKEY HIGHLIGHTS ............................................................................................................................... xxi1.0 INTRODUCTION....................................................................................................................... 12.0 FINANCIAL ANALYSIS OF COUNTY BUDGET IMPLEMENTATION IN FIRST QUARTER OF FY 2015/16 ........................................................................................................ 22.1 Introduction ............................................................................................................................... 22.2 FY 2015/16 Aggregate County Budgets and Revenue Analysis ............................................... 22.3 Funds Released to the Counties ................................................................................................ 52.4 Expenditure Analysis ................................................................................................................ 102.5 Development Expenditure ........................................................................................................ 142.6 Recurrent Expenditure .............................................................................................................. 163.0 INDIVIDUAL COUNTY BUDGET PERFORMANCE.......................................................... 233.1 Introduction ............................................................................................................................... 233.2 Baringo County ......................................................................................................................... 233.3 Bomet County ........................................................................................................................... 283.4 Bungoma County ...................................................................................................................... 333.5 Busia County ............................................................................................................................. 393.6 Elgeyo Marakwet County ......................................................................................................... 443.7 Embu County ............................................................................................................................ 503.8 Garissa County .......................................................................................................................... 543.9 Homa Bay County ..................................................................................................................... 593.10 Isiolo County ............................................................................................................................. 653.11 Kajiado County ......................................................................................................................... 703.12 Kakamega County ..................................................................................................................... 763.13 Kericho County ......................................................................................................................... 823.14 Kiambu County ......................................................................................................................... 873.15 Kilifi County ............................................................................................................................. 933.16 Kirinyaga County ...................................................................................................................... 983.17 Kisii County .............................................................................................................................. 1053.18 Kisumu County ......................................................................................................................... 1103.19 Kitui County.............................................................................................................................. 116
OFFICE OF THE CONTROLLER OF BUDGET
COUNTY GOVERNMENTS BUDGET IMPLEMENTATION REVIEW REPORT FIRST QUARTER FY 2015/16iv
3.20 Kwale County ........................................................................................................................... 1243.21 Laikipia County ........................................................................................................................ 1293.22 Lamu County ............................................................................................................................ 1343.23 Machakos County ..................................................................................................................... 1393.24 Makueni County ........................................................................................................................ 1453.25 Mandera County ........................................................................................................................ 1513.26 Marsabit County ........................................................................................................................ 1563.27 Meru County ............................................................................................................................. 1623.28 Migori County ........................................................................................................................... 1663.29 Mombasa County ...................................................................................................................... 1723.30 Murang’a County ...................................................................................................................... 1773.31 Nairobi City County .................................................................................................................. 1823.32 Nakuru County .......................................................................................................................... 1883.33 Nandi County ............................................................................................................................ 1933.34 Narok County ............................................................................................................................ 1983.35 Nyamira County ........................................................................................................................ 2043.36 Nyandarua County .................................................................................................................... 2103.37 Nyeri County ............................................................................................................................. 2163.38 Samburu County ....................................................................................................................... 2213.38 Siaya County ............................................................................................................................. 2263.40 Taita Taveta County .................................................................................................................. 2313.41 Tana River County .................................................................................................................... 2363.42 Tharaka Nithi County ............................................................................................................... 2423.43 Trans Nzoia County .................................................................................................................. 2473.44 Turkana County ......................................................................................................................... 2513.45 Uasin Gishu County .................................................................................................................. 2573.46 Vihiga County ........................................................................................................................... 2633.47 Wajir County ............................................................................................................................. 2673.48 West Pokot County.................................................................................................................... 2724.0 KEY CHALLENGES, RECOMMENDATIONS AND CONCLUSIONS ............................. 2784.1 Introduction ............................................................................................................................... 2784.2 Key Challenges and Recommendations .................................................................................... 2785.0 CONCLUSION ........................................................................................................................... 2816.0 ANNEXES ................................................................................................................................... 282
OFFICE OF THE CONTROLLER OF BUDGET
COUNTY GOVERNMENTS BUDGET IMPLEMENTATION REVIEW REPORT FIRST QUARTER FY 2015/16 v
LIST OF ABBREVIATIONS/ACRONYMS
BQ Bills of QuantitiesBROP Budget Review and Outlook PaperCA County AssemblyCE County ExecutiveCARPS Capacity Assessment and Rationalization of the Public ServiceCBEF County Budget and Economic ForumCBK Central Bank of KenyaCBROP County Budget Review and Outlook PaperCEC County Executive CommitteeCECM-F County Executive Committee Member for FinanceCILOR Contribution In Lieu of RatesCOB Controller of BudgetCPSB County Public Service BoardCRA Commission on Revenue AllocationCRF County Revenue FundCTTI County Technical Training InstituteDANIDA Danish International Development AgencyECDE Early Childhood Development EducationE-G Electronic GovernanceF.I.F Facility Improvement FundFY Financial YearGoK Government of KenyaG-PAY Government Payment SystemHSSF Health Sector Services FundICT Information Communication TechnologyIFMIS Integrated Financial Management SystemMCA Member of County AssemblyMTEF Medium Term Expenditure FrameworkM&E Monitoring and EvaluationO&M Operations and MaintenanceOCOB Office of the Controller of BudgetPE Personnel EmolumentsPFM Act Public Finance Management Act, 2012SMEs Small and Medium Enterprises
OFFICE OF THE CONTROLLER OF BUDGET
COUNTY GOVERNMENTS BUDGET IMPLEMENTATION REVIEW REPORT FIRST QUARTER FY 2015/16vi
LIST OF FIGURESFigure 2.1: Monthly Local Revenue collection for the First Quarter of FY 2014/15 and FY 2015/16 ...............................3
Figure 2.2: Monthly Expenditure in the First Quarter of FY 2014/15 and FY 2015/16 ....................................................13
Figure 3.1: Baringo County, Trend in Local Revenue Collection by Quarters from the First Quarter of FY
2013/14 to the First Quarter of FY 2015/16 ....................................................................................................24
Figure 3.2: Baringo County, Expenditure by Economic Classification for First Quarter of FY 2014/15 and
FY 2015/16 ......................................................................................................................................................25
Figure 3.3: Baringo County, Operations and Maintenance Expenditure for the First Quarter of FY 2015/16 .................26
Figure 3.4: Baringo County, Summary of Development Expenditure for the First Quarter of FY 2015/16 .....................26
Figure 3.5: Bomet County, Trend in Local Revenue Collection by Quarter from the First Quarter of
FY 2013/14 to the First Quarter of FY 2015/16 ..............................................................................................29
Figure 3.6: Bomet County, Expenditure by Economic Classification for the First Quarters of FY 2014/15 and
FY 2015/16 ......................................................................................................................................................30
Figure 3.7: Bomet County, Operations and Maintenance Expenditure for the First Quarter of FY 2015/16 ....................31
Figure 3.8: Bomet County, Summary of Development Expenditure for the First Quarter of FY 2015/16 .......................31
Figure 3.9: Bungoma County, Trend in Local Revenue Collection by Quarter from the First Quarter of ...........................
FY 2013/14 to the First Quarter of FY 2015/16 ..............................................................................................34
Figure 3.10: Bungoma County, Expenditure by Economic Classification for the first quarters of FY 2014/15
to FY 2015/16 .................................................................................................................................................35
Figure 3.11: Bungoma County, Operations and Maintenance Expenditure for the First Quarter of FY 2015/16 ...............36
Figure 3.12: Bungoma County, Analysis of Development Expenditure for the First Quarter of FY 2015/16 ....................36
Figure 3.13: Busia County, Trend in Local Revenue collection by Quarters from the First Quarter of
FY 2013/14 to the First Quarter of FY 2015/16 ..............................................................................................39
Figure 3.14: Busia County, Expenditure by Economic Classification for First Quarters of FY 2014/15 and
FY 2015/16 ......................................................................................................................................................40
Figure 3.15: Busia County, Operations and Maintenance Expenditure for the First Quarter of FY 2015/16 .....................41
Figure 3.16: Busia County, Analysis of Development Expenditure for the First Quarter of FY 2015/16 ...........................42
Figure 3.17: Elgeyo Marakwet County, Trend in Local Revenue collection by Quarters from First
Quarter of FY 2013/14 to First Quarter of FY 2015/16 ..................................................................................45
Figure 3.18: Elgeyo Marakwet County, Expenditure by Economic Classification for the First Quarter of
OFFICE OF THE CONTROLLER OF BUDGET
COUNTY GOVERNMENTS BUDGET IMPLEMENTATION REVIEW REPORT FIRST QUARTER FY 2015/16 vii
FY 2014/15 and FY 2015/16 ...........................................................................................................................46
Figure 3.19: Elgeyo Marakwet County, Operations and Maintenance Expenditure for the first quarter of
FY 2015/16 ......................................................................................................................................................47
Figure 3.20: Elgeyo Marakwet County, Summary of Development Expenditure for the First Quarter of
FY 2015/16 ......................................................................................................................................................48
Figure 3.21: Embu County, Trend in Local Revenue Collection by Quarter from first quarter of FY 2013/14
to the first quarter of FY 2015/16 ....................................................................................................................50
Figure 3.22: Embu County Expenditure by Economic Classification for the first quarter of FY 2014/15 and
FY 2015/16 ......................................................................................................................................................51
Figure 3.23: Embu County, Operations and Maintenance expenditure for the First Quarter of FY 2015/16 .....................52
Figure 3.24: Embu County Analysis of Development Expenditure for first Quarter of FY 2015/16 ..................................53
Figure 3.25: Garissa County, Trend in Local Revenue Collection by Quarter from First Quarter
of FY 2013/14 to the first quarter of FY 2015/16 ...........................................................................................55
Figure 3.26: Garissa County, Expenditure by Economic Classification for First Quarter of FY 2014/15
and FY 2015/16 ...............................................................................................................................................56
Figure 3.27: Garissa County, Operations and Maintenance Expenditure for the first quarter of FY 2015/16 ....................57
Figure 3.28: Garissa County, Summary of Development Expenditure for the First Quarter of FY 2015/16 ......................58
Figure 3.29: Homa Bay County, Trend in Local Revenue Collection by Quarter from the first quarter
of FY 2013/14 to the first quarter of FY 2015/16 ...........................................................................................60
Figure 3.30: Homa Bay County, Expenditure by Economic Classification for the First Quarter
of FY 2014/15 and FY 2015/16 ......................................................................................................................61
Figure 3.31: Homa Bay County, Operations and Maintenance Expenditure for the First Quarter
of FY 2015/16.................................................................................................................................................62
Figure 3.32: Homa Bay County, Summary of Development Expenditure for the First Quarter
of FY 2015/16................................................................................................................................................63
Figure 3.33: Isiolo County, Trend in Local Revenue collection by Quarter from the First Quarter of
FY 2013/14 to the First Qaurter of FY 2015/16 ..............................................................................................66
Figure 3.34: Isiolo County, Expenditure by Economic Classification for First Quarter of FY 2014/15 and
FY 2015/16 ......................................................................................................................................................67
Figure 3.35: Isiolo County, Operations and Maintenance Expenditure for the First Quarter of FY 2015/16 ....................68
Figure 3.36: Kajiado County, Trend in Local Revenue Collection by Quarter from the First Quarter of
FY 2013/14 to the First Quarter of FY 2015/16 .............................................................................................71
Figure 3.37: Kajiado County, Expenditure by Economic Classification for First Quarters of FY 2014/15 and 2015/16 ...72
Figure 3.38: Kajiado County, Operations and Maintenance Expenditure for the First of Quarter FY 2015/16 ..................73

OFFICE OF THE CONTROLLER OF BUDGET
COUNTY GOVERNMENTS BUDGET IMPLEMENTATION REVIEW REPORT FIRST QUARTER FY 2015/16viii
Figure 3.39: Kajiado County, Summary of Development Expenditure for the First Quarter of FY 2015/16 ....................74
Figure 3.40: Kakamega County, Trend in Local Revenue collection by Quarter from First Quarter
of FY 2013/14 to First Quarter of FY 2015/16 ..............................................................................................77
Figure 3.41: Kakamega County, Expenditure by Economic Classification for First quarter of
FY 2014/15 and FY 2015/16 ...........................................................................................................................78
Figure 3.42: Kakamega County, Operations and Maintenance Expenditure for the First Quarter of FY 2015/16 ............79
Figure 3.43: Kakamega County, Summary of Development Expenditure for the First Quarter of FY 2015/16 .................80
Figure 3.44: Kericho County, Trend in Local Revenue Collection by Quarters from the FY 2013/14 to the
first quarter of FY 2015/16 ..............................................................................................................................83
Figure 3.45: Kericho County, Expenditure by Economic Classification for First Quarter of FY 2014/15
and FY 2015/16 ...............................................................................................................................................84
Figure 3.46: Kericho County, Operations and Maintenance Expenditure for the First Quarter of FY 2015/16 .................85
Figure 3.47: Kericho County, Summary of Development Expenditure for the First Quarter of FY 2015/16 .....................85
Figure 3.48: Kiambu County, Trend in Local Revenue Collection by Quarters from the first quarter of
FY 2013/14 to the first quarter of FY 2015/16 ................................................................................................88
Figure 3.49: Kiambu County, Expenditure by Economic Classification for First Quarter of FY 2014/15 and
FY 2015/16 ......................................................................................................................................................89
Figure 3.50: Kiambu County, Operations and Maintenance Expenditure for the First Quarter FY 2015/16 ......................90
Figure 3.51: Kiambu County, Summary of Development Expenditure for the First Quarter FY 2015/16 .........................91
Figure 3.52: Kilifi County, Trend in Local Revenue Collection by Quarter from the First Quarter of
FY 2013/14 to the First Quarter of FY 2015/16 .............................................................................................94
Figure 3.53: Kilifi County, Expenditure by Economic Classification for First Quarter of FY 2014/15 and ..........................
FY 2015/16 ......................................................................................................................................................95
Figure 3.54: Kilifi County, FY 2014/15 Operations and Maintenance Expenditure for the First Quarter of .........................
FY 2015/16 ......................................................................................................................................................96
Figure 3.55: Kirinyaga County, Trend in Local Revenue Collection by Quarter from FY 2013/14 to the
first quarter of FY 2015/2016 ........................................................................................................................100
Figure 3.56: Kirinyaga County, Expenditure by Economic Classification for First quarter of FY 2014/15
and FY 2015/16 .............................................................................................................................................101
Figure 3.57: Kirinyaga County, Operations and Maintenance Expenditure for the First Quarter of FY 2015/16 ............102
Figure 3.58: Kirinyaga County, Summary of Development Expenditure for the First Quarter of FY 2015/16 ................103
Figure 3.59: Kisii County, Trend in Local Revenue Collection by Quarter from the first quarter of
FY 2013/14 to the first quarter of FY 2015/16 ..............................................................................................105
OFFICE OF THE CONTROLLER OF BUDGET
COUNTY GOVERNMENTS BUDGET IMPLEMENTATION REVIEW REPORT FIRST QUARTER FY 2015/16 ix
Figure 3.60: Kisii County, Expenditure by Economic Classification for First quarter of FY 2014/15 and
FY 2015/16 ....................................................................................................................................................106
Figure 3.61: Kisii County, Operations and Maintenance Expenditure for the First Quarter of FY 2015/16 .....................107
Figure 3.62: Kisii County, Summary of Development Expenditure for the First Quarter of FY 2015/16 ........................108
Figure 3.63: Kisumu County, Trend in Local Revenue Collection by Quarters from FY 2013/14 to the
first quarter of FY 2015/16 ............................................................................................................................ 111
Figure 3.64: Kisumu County, Expenditure by Economic Classification for First Quarters of FY 2014/15
and FY 2015/16 .............................................................................................................................................112
Figure 3.65: Kisumu County, Operations and Maintenance Expenditure for the First Quarter of FY 2015/16 ................113
Figure 3.66: Kisumu County, Summary of Development Expenditure for the First Quarter of FY 2015/16 ..................114
Figure 3.67: Kitui County, Trend in Local Revenue collection by Quarter since First Quarter FY 2013/14
to First Quarter FY 2015/16 ..........................................................................................................................117
Figure 3.68: Kitui County, Expenditure by Economic Classification for First Quarter FY 2013/14,
FY 2014/15 and FY 2015/16 .........................................................................................................................118
Figure 3.69: Recurrent Expenditure Trend from first quarter of FY 2013/14 to first quarter of FY 2015/16 ...................119
Figure 3.70: Trend of Sitting Allowances and Domestic & Foreign Travel Expenditure from FY 2013/14
to First Quarter FY 2015/16 ..........................................................................................................................120
Figure 3.71: Kitui County, Operations and Maintenance Expenditure for the first Quarter of FY 2015/16 .....................120
Figure 3.72: Kitui County, Analysis of Development Expenditure for the First Quarter of FY 2015/16 .........................121
Figure 3.73: Kwale County, Trend in Local Revenue Collection by Quarters from FY 2013/14 to first
Quarter of FY 2015/16 ..................................................................................................................................124
Figure 3.74: Kwale County, Expenditure by Economic Classification for the First Quarter of FY 2014/15
and FY 2015/16 .............................................................................................................................................125
Figure 3.75: Kwale County, Operations and Maintenance Expenditure for the First Quarter of FY 2015/16 ..................126
Figure 3.76: Kwale County, FY 2015/16 Analysis of Development Expenditure for the First Quarter of
FY 2015/16 ....................................................................................................................................................127
Figure 3.77: Laikipia County, Trend in Local Revenue Collection by Quarters from the First Quarter of
FY 2013/14 to the First Quarter of FY 2015/16 ...........................................................................................130
Figure 3.78: Laikipia County, Expenditure by Economic Classification for First Quarter of FY 2014/15 and
FY 2015/16 ....................................................................................................................................................131
Figure 3.79: Laikipia County, Operations and Maintenance Expenditure for the First Quarter of FY 2015/16 ...............132
Figure 3.80: Laikipia County, Summary of Development Expenditure for the First Quarter of FY 2015/16 ...................132
OFFICE OF THE CONTROLLER OF BUDGET
COUNTY GOVERNMENTS BUDGET IMPLEMENTATION REVIEW REPORT FIRST QUARTER FY 2015/16x
Figure 3.81: Lamu County, Trend in Local Revenue collection by Quarter from FY 2013/14 to First
Quarter of FY 2015/16 ..................................................................................................................................135
Figure 3.82: Lamu County, Expenditure by Economic Classification for the First quarter of FY 2014/15
and FY 2015/16 .............................................................................................................................................136
Figure 3.83: Lamu County, Operations and Maintenance Expenditure for the First Quarter of FY 2015/16 ...................137
Figure 3.84: Lamu County, Summary of Development Expenditure for the First Quarter of FY 2015/16 ......................137
Figure 3.85: Machakos County, Trend in Local Revenue Collection by Quarter from the First Quarter of
FY 2013/14 to the First Quarter of FY 2015/16 ............................................................................................140
Figure 3.86: Machakos County, Expenditure by Economic Classification for First Quarter of FY 2014/15
and FY 2015/16 .............................................................................................................................................141
Figure 3.87: Machakos County, Operations and Maintenance Expenditure for the First Quarter of FY 2015/16 ............142
Figure 3.88: Machakos County, Summary of Development Expenditure for the First Quarter of FY 2015/16 ...............143
Figure 3.89: Makueni County, Trend in Local Revenue Collection by Quarter from the First Quarter of
FY 2013/14 to the First Quarter of FY 2015/2016 ........................................................................................146
Figure 3.90: Makueni County, Expenditure by Economic Classification for the First Quarters of FY 2013/14
to FY 2015/16 ................................................................................................................................................147
Figure 3.91: Makueni County, Operations and Maintenance Expenditure for the First Quarter of FY 2015/16 ..............148
Figure 3.92: Makueni County, Summary of Development Expenditure for the First Quarter of FY 2015/16 ..................149
Figure 3.93: Mandera County, Trend in Local Revenue Collection by Quarter from the First Quarter of
FY 2013/14 to the First Quarter of FY 2015/16 ............................................................................................152
Figure 3.94: Mandera County, Expenditure by Economic Classification for the first quarter of FY 2014/15
and FY 2015/16 ............................................................................................................................................153
Figure 3.95: Mandera County, FY 2015/16 Operations and Maintenance Expenditure for the First Quarter of ...................
FY 2015/16 ....................................................................................................................................................154
Figure 3.96: Marsabit County, Trend in Local Revenue Collection by quarters from the First Quarter of
FY 2013/14 to First Quarter of FY 2015/16 ..................................................................................................157
Figure 3.97: Marsabit County, Expenditure by Economic classification for the First Quarter of FY 2014/15
and FY 2015/16 .............................................................................................................................................158
Figure 3.98: Marsabit County, Operations and Maintenance Expenditure for the First Quarter of FY 2015/16 ..............159
Figure 3.99: Marsabit County, Summary of Development Expenditure for the First Quarter FY 2015/16 ......................160
Figure 3.100: Meru County, Trend in Local Revenue Collection by Quarters from the First Quarter of
FY 2013/14 to the First Quarter of FY 2015/2016 ........................................................................................162
Figure 3.101: Meru County, Expenditure by Economic Classification for First Quarter of FY 2014/15 and
OFFICE OF THE CONTROLLER OF BUDGET
COUNTY GOVERNMENTS BUDGET IMPLEMENTATION REVIEW REPORT FIRST QUARTER FY 2015/16 xi
FY 2015/16 ....................................................................................................................................................163
Figure 3.102: Meru County, Operations and Maintenance Expenditure for the first quarter of FY 2015/16 ......................164
Figure 3.103: Meru County, Summary of Development Expenditure for the First Quarter of FY 2015/16 .......................165
Figure 3.104: Migori County, Trend in Local Revenue collection by Quarters from FY 2014/15 to the
first quarter of FY 2015/16 ............................................................................................................................167
Figure 3.105: Migori County, Expenditure by Economic Classification for the first quarter of FY 2014/15
and FY 2015/16 .............................................................................................................................................168
Figure 3.106: Migori County, Operations and Maintenance Expenditure for the First Quarter of FY 2015/16 .................169
Figure 3.107: Migori County, Summary of Development Expenditure for the First Quarter of FY 2015/16 .....................170
Figure 3.108: Mombasa County, Trend in Local Revenue Collection by Quarter from the First Quarter of
FY 2013/14 to the First Quarter of FY 2015/16 ............................................................................................173
Figure 3.109: Mombasa County, Expenditure by Economic Classification for First Quarter of FY 2014/15
and FY 2015/16 .............................................................................................................................................174
Figure 3.110: Mombasa County, Operations and Maintenance Expenditure for the First Quarter of FY 2015/16 .............175
Figure 3.111: Mombasa County, Summary of Development Expenditure for the First Quarter of FY 2015/16 ................176
Figure 3.112: Murang’a County, Trend in Local Revenue Collection by Quarter from the First Quarter of
FY 2013/14 to the First Quarter of 2015/16 ..................................................................................................178
Figure 3.113: Expenditure by Economic Classification for First Quarters of FY 2014/15 and FY 2015/16 ......................179
Figure 3.114: Murang’a County, Operations and Maintenance Expenditure for the First Quarter of FY 2015/16 .............180
Figure 3.115: Murang’a County, Summary of Development Expenditure for the First Quarter of FY 2015/16 ................181
Figure 3.116: Nairobi County, Trend in Local Revenue collection by Quarter from First Quarter of FY ...............................
2013/14 to first quarter of FY 2015/16 ..........................................................................................................183
Figure 3.117 Nairobi City County, Expenditure by Economic Classification for the First Quarters of
FY 2014/15 and FY 2015/16. ........................................................................................................................184
Figure 3.118: Nairobi City County, Operations and Maintenance Expenditure for the First Quarter of
FY 2015/16 ....................................................................................................................................................185
Figure 3.119: Nairobi County, Summary of Development Expenditure for the First Quarter of FY 2015/16 ....................186
Figure 3.120: Nakuru County, Trend in Local Revenue Collection by Quarters from the First Quarter of
FY 2013/14 to the First Quarter of FY 2015/16 ...........................................................................................189
Figure 3.121: Nakuru County, Expenditure by Economic Classification for First Quarter of FY 2014/15 and
FY 2015/16 ....................................................................................................................................................190
Figure 3.122: Nakuru County, Operations and Maintenance Expenditure for the First Quarter FY 2015/16 .....................191
OFFICE OF THE CONTROLLER OF BUDGET
COUNTY GOVERNMENTS BUDGET IMPLEMENTATION REVIEW REPORT FIRST QUARTER FY 2015/16xii
Figure 3.123: Nakuru County, Summary of Development Expenditure for the First Quarter FY 2015/16 ........................192
Figure 3.124: Nandi County, Trend in Local Revenue collection by Quarter from the First Quarter of ..................................
FY 2014/15 to First Quarter of FY 2015/16 ..................................................................................................194
Figure 3.125: Nandi County, Expenditure by Economic Classification for the first quarter of FY 2014/15 and
FY 2015/16 ....................................................................................................................................................195
Figure 3.126: Analysis of Operations and Maintenance Expenditure for the first quarter of FY 2015/16 ..........................196
Figure 3.127: Narok County, Trend in Local Revenue collection by Quarter from the First Quarter of
FY 2013/14 to First Quarter of FY 2015/16 ..................................................................................................199
Figure 3.128: Narok County, Expenditure by Economic Classification for the first quarters of FY 2014/15 to
FY 2015/16 ....................................................................................................................................................200
Figure 3.129: Narok County, Operations and Maintenance Expenditure for the First Quarter of FY 2015/16 ..................201
Figure 3.130: Narok County, Analysis of Development Expenditure for the First Quarter of FY 2015/16 ........................202
Figure 3.131: Nyamira County, Trend in Local Revenue collection by Quarter from FY 2013/14 to First .............................
Quarter of FY 2015/16 ..................................................................................................................................205
Figure 3.132: Nyamira County, Expenditure by Economic Classification for the First quarter of FY 2014/15
and FY 2015/16 .............................................................................................................................................206
Figure 3.133: Nyamira County, Operations and Maintenance Expenditure, for the First Quarter of
FY 2015/16 ....................................................................................................................................................207
Figure 3.134: Nyamira County, Analysis of Development Expenditure for the First Quarter of FY 2015/16 ....................209
Figure 3.135: Nyandarua County, Trend in Local Revenue collection by Quarter from the First Quarter of
FY 2013/14 to the First Quarter of FY 2015/16 ............................................................................................211
Figure 3.136: Nyandarua County, Expenditure by Economic Classification for the First Quarter of ......................................
FY 2013/14 to the First Quarter of FY 2015/16 ............................................................................................212
Figure 3.137: Nyandarua County, Operations and Maintenance Expenditure for the First Quarter of
FY 2015/16 ....................................................................................................................................................213
Figure 3.138: Nyandarua County, Analysis of Development Expenditure for the First Quarter of FY 2015/16 ................214
Figure 3.139: Nyeri County, Trend in Local Revenue Collection by Quarter from FY 2013/14 to First Quarter ...................
of FY 2015/16................................................................................................................................................217
Figure 3.140: Nyeri County Expenditure by Economic Classification for the First quarter of FY 2014/15
and First Quarter of FY 2015/16 ...................................................................................................................218
Figure 3.141: Nyeri County, Operations and Maintenance Expenditure for the First Quarter of FY 2015/16 ...................219
Figure 3.142: Samburu County, Trend in local revenue collection by Quarters from FY 2013/14 to the first ........................
quarter of FY 2015/16 ...................................................................................................................................222
Figure 3.143: Samburu County, Expenditure by Economic classification for the First Quarter of FY 2014/15
OFFICE OF THE CONTROLLER OF BUDGET
COUNTY GOVERNMENTS BUDGET IMPLEMENTATION REVIEW REPORT FIRST QUARTER FY 2015/16 xiii
and FY 2015/16 .............................................................................................................................................223
Figure 3.144: Samburu County, FY 2014/15 Operations and Maintenance Expenditure for the First Quarter of ...................
FY 2015/16 ....................................................................................................................................................224
Figure 3.145: Samburu County, Summary of Development Expenditure for the First Quarter of FY 2015/16 .................224
Figure 3.146: Siaya County, Trend in Local Revenue collection by Quarter from the first quarter of FY ..............................
2013/14 to the first quarter of FY 2015/16 ....................................................................................................227
Figure 3.147: Siaya County, Expenditure by Economic Classification for First Quarter of FY 2014/15 and
FY 2015/16 ....................................................................................................................................................228
Figure 3.148: Siaya County, Operations and Maintenance Expenditure for the first quarter of FY 2015/16 .....................229
Figure 3.149: Taita Taveta County, Trend in Local revenue collection by Quarters from the first quarter of
FY 2013/2014 to the first quarter of FY 2015/16 ..........................................................................................232
Figure 3.150: Taita Taveta County, Expenditure by Economic Classification for First Quarter of FY 2014/15
and FY 2015/16 .............................................................................................................................................233
Figure 3.151: Taita Taveta Country, Operations and Maintenance Expenditure for the First Quarter of FY 2015/16 ..........234
Figure 3.152: Tana River County, Trend in Local Revenue Collection by Quarter from the first quarter of
FY 2013/14 to the first quarter of FY 2015/16 ..............................................................................................237
Figure 3.153: Tana River County, Expenditure by Economic Classification for First Quarter of FY 2014/15
and FY 2015/16 .............................................................................................................................................238
Figure 3.154: Tana River County, Operations and Maintenance Expenditure for the First Quarter FY 2015/16 ...............239
Figure 3.155: Tana River County, Summary of Development Expenditure for the First Quarter FY 2015/16 ...................240
Figure 3.156: Tharaka Nithi County Trend in Local Revenue Collection by Quarter from the First Quarter of
FY 2013/14 to the First Quarter of FY 2015/16 ............................................................................................243
Figure 3.157: Tharaka Nithi County, Expenditure by Economic Classification for the First Quarter of
FY 2014/15 and FY 2015/16 .........................................................................................................................244
Figure 3.158: Tharaka Nithi County, Operations and Maintenance Expenditure, for the First Quarter of ..............................
FY 2015/16 ....................................................................................................................................................245
Figure 3.159: Trans Nzoia County, Trend in Local Revenue collection by Quarters from the First Quarter of
FY 2013/14 to the First Quarter of FY 2015/16 ...........................................................................................248
Figure 3.160: Trans Nzoia County, Expenditure by Economic Classification for first Quarters of FY 2014/15 ....................
and FY 2015/16 .............................................................................................................................................249
Figure 3.161: Trans Nzoia County, Operations and Maintenance Expenditure for the First Quarter of FY 2015/16 .........250
Figure 3.162: Turkana County, Trend in Local Revenue Collection by Quarter from FY 2013/14 to the first ........................
Quarter of FY 2015/16 ..................................................................................................................................252
OFFICE OF THE CONTROLLER OF BUDGET
COUNTY GOVERNMENTS BUDGET IMPLEMENTATION REVIEW REPORT FIRST QUARTER FY 2015/16xiv
Figure 3.163: Turkana County, FY 2015/16 Expenditure by Economic Classification for the first Quarter of
FY 2014/15 and FY 2015/16 .........................................................................................................................253
Figure 3.164: Turkana County, Operations and Maintenance Expenditure for the First Quarter of FY 2015/16 ..............254
Figure 3.165: Turkana County, Summary of Development Expenditure for the First Quarter of FY 2015/2016 ...............255
Figure 3.166: Uasin Gishu County, Trend in Local Revenue Collection by Quarters from FY 2013/14 to the .......................
First Quarter 2015/16 ....................................................................................................................................257
Figure 3.167: Uasin Gishu County, Expenditure by Economic Classification for the First quarter of FY ..............................
2014/15 and FY 2015/16 ...............................................................................................................................259
Figure 3.168: Uasin Gishu County, Operations and Maintenance for the First Quarter of FY 2015/16 .............................260
Figure 3.169: Uasin Gishu County, Summary of Development Expenditure for the First Quarter of
FY 2015/16 ....................................................................................................................................................261
Figure 3.170: Vihiga County, Trend in Local Revenue collection by Quarter from first Quarter of FY 2013/14
to the first Quarter of FY 2015/16 ................................................................................................................264
Figure 3.171: Vihiga County Expenditure by Economic Classification for the first Quarters of .............................................
FY 2014/15 and FY 2015/16 .........................................................................................................................265
Figure 3.172: Vihiga County, FY 2015/16 Operations and Maintenance Expenditure for the first Quarter of
FY 2015/16 ....................................................................................................................................................265
Figure 3.173: Wajir County, Trend in Local Revenue Collection by Quarters from the First Quarter of
FY 2013/14 to the First Quarter of FY 2015/16 ............................................................................................268
Figure 3.174: Wajir County, Expenditure by Economic Classification for the first quarter of FY 2014/15 and
FY 2015/16 ....................................................................................................................................................269
Figure 3.175: Wajir County, Operations and Maintenance Expenditure for the First Quarter of FY 2015/16 ...................270
Figure 3.176: Wajir County Summary of Development Expenditure for the First Quarter of FY 2015/16 ........................270
Figure 3.177: West Pokot County, Trend in Local Revenue collection by Quarters from the First Quarter of
FY 2013/14 to the First Quarter of FY 2015/16 ............................................................................................273
Figure 3.178: West Pokot County, Expenditure by Economic Classification for First Quarter of FY 2014/15
and FY 2015/16 .............................................................................................................................................274
Figure 3.179: West Pokot County, Operations and Maintenance Expenditure for the First Quarter of FY 2015/16 ..........275
Figure 3.180: West Pokot County, Analysis of Development Expenditure for the First Quarter of FY 2015/16 ...............276
OFFICE OF THE CONTROLLER OF BUDGET
COUNTY GOVERNMENTS BUDGET IMPLEMENTATION REVIEW REPORT FIRST QUARTER FY 2015/16 xv
LIST OF TABLESTable 2.1: Monthly Local Revenue collection for the First Quarter of FY 2014/15 and FY 2015/16 ...............................4
Table 2.2: Disbursement of Equitable Share of Revenue and Conditional Allocations in the ............................................ First Quarter of FY 2015/16 ..............................................................................................................................6
Table 2.3: The Exchequer Issues to the County Assemblies and County Executive in the ................................................ First Quarter of FY 2015/16 ..............................................................................................................................8
Table 2.4: Expenditure by Economic Classification for the First Quarter of FY 2015/16 ...............................................10
Table 2.5: County budget allocation, expenditure and absorption rate for the First Quarter of .......................................... FY 2015/16 ......................................................................................................................................................14
Table 2.6: Budget allocation and expenditures on MCAs’ sitting allowances, First Quarter of ......................................... FY 2015/16 ......................................................................................................................................................18
Table 2.7: Expenditure on Domestic and Foreign travel by the County Assembly and the ................................................ County Executive for the First Quarter of FY 2015/16 (Kshs.million) ..........................................................20
Table 3.1: Baringo County, Annual Budget and First Quarter Budget Performance by Department ................................. for FY 2015/16 ................................................................................................................................................27
Table 3.2: Bomet County, Annual Budget and First Quarter Budget Performance for FY 2015/16 by Department ......................................................................................................................................................32
Table 3.3: Bungoma County, Annual Budget and Budget Performance by Department for .............................................. First Quarter of FY 2015/16 ............................................................................................................................37
Table 3.4: Busia County, Annual Budget and Budget Performance Analysis for the First Quarter of FY 2015/16 by Department .............................................................................................................................43
Table 3.5: Elgeyo Marakwet County, Annual Budget and First Quarter Budget Performance .......................................... by Department for FY 2015/16 .......................................................................................................................48
Table 3.6: Embu County, Annual Budget and First Quarter of FY 2015/16 Budget Performance by Department ......................................................................................................................................................53
Table 3.7: Garissa County, Annual Budget and First Quarter Budget Performance for ................................................... FY 2015/16 by Department .............................................................................................................................58
Table 3.8: Homa Bay County, Annual Budget and Budget Performance by Department for ............................................. First Quarter of FY 2015/16 ............................................................................................................................64
Table 3.9: Isiolo County, Annual Budget and Budget Performance Analysis by Department ............................................ for the First Quarter of FY 2015/16 ................................................................................................................69
Table 3.10: Kajiado County, FY 2015/16 Annual Budget and Budget perfomance by ........................................................ Department for First Quarter of FY 2015/16 ..................................................................................................74
Table 3.11: Kakamega County, Annual Budget and First Quarter Budget Performance for ................................................ FY 2015/16 by Department .............................................................................................................................80
OFFICE OF THE CONTROLLER OF BUDGET
COUNTY GOVERNMENTS BUDGET IMPLEMENTATION REVIEW REPORT FIRST QUARTER FY 2015/16xvi
Table 3.12: Kericho County, Annual Budget and First Quarter of FY 2015/16 Budget ....................................................... Performance by Department ............................................................................................................................86
Table 3.13: Kiambu County, Annual Budget and Budget Performance by Department for ................................................. First Quarter of FY 2015/16 ...........................................................................................................................92
Table 3.14: Kilifi County, Annual Budget and Budget Perfomance by Department for the ................................................. First Quarter of FY 2015/16 ............................................................................................................................97
Table 3.15: Kirinyaga County, Conditional Allocations for the FY 2015/16 .....................................................................99
Table 3.16: Kirinyaga County, Annual Budget and Budget Performance by Department for .............................................. First Quarter of FY 2015/16 ..........................................................................................................................103
Table 3.17: Kisii County, Annual Budget and Budget Performance by Department for ...................................................... First Quarter of FY 2015/16 ..........................................................................................................................109
Table 3.18: Kisumu County, Annual Budget and First Quarter Budget Performance for ..................................................... FY 2015/16 by Department ...........................................................................................................................115
Table 3.19: Kitui County, Annual Budget and Budget Performance by Department for the ................................................ First Quarter of FY 2015/16 ..........................................................................................................................122
Table 3.20: Kwale County, Annual Budget and Budget Performance by Department for the .............................................. First Quarter of FY 2015/16 ..........................................................................................................................128
Table 3.21: Laikipia County, Annual Budget and Budget Performance Analysis for the ..................................................... First Quarter of FY 2015/16 by Department .................................................................................................133
Table 3.22: Lamu County, Annual Budget and First Quarter Budget Performance for ........................................................ FY 2015/16 by Department ...........................................................................................................................138
Table 3.23: Machakos County, FY 2015/16 Annual Budget and First Quarter of FY 2015/16 ........................................... budget performance by Department ..............................................................................................................144
Table 3.24: Makueni County, Annual Budget and Budget Performance by Department for ............................................... First Quarter of FY 2015/16 .........................................................................................................................149
Table 3.25: Mandera County, Annual Budget and First Quarter Budget Performance for ................................................... FY 2015/16 by Department ...........................................................................................................................155
Table 3.26: Marsabit County, Annual Budget and Budget Performance by Department in the ........................................... First Quarter of FY 2015/16 ..........................................................................................................................160
Table 3.27: Meru County, Annual Budget and Budget Performance by Department for ..................................................... First Quarter of FY 2015/16 ..........................................................................................................................165
Table 3.28: Migori County, Annual Budget and Budget Performance Analysis by department for the First Quarter of FY 2015/16 ..........................................................................................................................171
Table 3.29: Mombasa County, Annual Budget and Budget Peformance by Department for ................................................ First Quarter of FY 2015/16 ..........................................................................................................................176
Table 3.30: Murang’a County, Annual Budget and Budget Performance by Department for the ........................................ First Quarter of FY 2015/16 ..........................................................................................................................181
Table 3.31: Nairobi County, Annual Budget and Budget Performance Analysis by .............................................................
OFFICE OF THE CONTROLLER OF BUDGET
COUNTY GOVERNMENTS BUDGET IMPLEMENTATION REVIEW REPORT FIRST QUARTER FY 2015/16 xvii
Department for the First Quarter of FY 2015/16 ...........................................................................................187
Table 3.32: Nakuru County, Annual Budget and Budget Performance Analysis by ............................................................. Department for the First Quarter of FY 2015/16 ...........................................................................................192
Table 3.33: Nandi County, Annual Budget and Expenditure by Department for the ............................................................ First Quarter of FY 2015/16 ..........................................................................................................................197
Table 3.34: Narok County, Annual Budget and Budget Performance by Department for the .............................................. First Quarter of FY 2015/16 ..........................................................................................................................202
Table 3.35: Nyamira County, Annual Budget and and Budget Performance by Department for ......................................... the First Quarter of FY 2015/16 ....................................................................................................................208
Table 3.36: Nyandarua County, Annual Budget and Budget Performance by Department for ............................................ First Quarter of FY 2015/16 ..........................................................................................................................214
Table 3.37: Nyeri County, Annual Budget and Budget Performance by Departments for the ............................................. First Quarter of FY 2015/16 ..........................................................................................................................219
Table 3.38: Samburu County, FY 2015/16 Annual Budget and First Quarter of ................................................................. FY 2015/16 budget performance by Department ..........................................................................................225
Table 3.39: Siaya County, Annual Budget and Budget Performance by Department for the ............................................... First Quarter of FY 2015/2016 ......................................................................................................................230
Table 3.40: Taita Taveta County, Annual Budget and Budget Performance by Department for ........................................... the First Quarter of FY 2015/16 ....................................................................................................................235
Table 3.41: Tana River County, Annual Budget and Budget Performance Analysis for the ................................................. First Quarter of FY 2015/16 by Department .................................................................................................241
Table 3.42: Tharaka Nithi County, Annual Budget and Budget Performance by Department for the First Quarter of FY 2015/16 ..........................................................................................................................245
Table 3.43: Trans Nzoia County, Annual Budget and Budget Perfomance by Department for the ...................................... First Quarter of FY 2015/16 .........................................................................................................................250
Table 3.44: Turkana County, Annual Budget and Budget Performance by Department for the ........................................... First Quarter of FY 2015/16 ..........................................................................................................................255
Table 3.45: Uasin Gishu County, FY 2015/16 Annual Budget and Budget Performance for the ......................................... First Quarter of FY 2015/16 by Department .................................................................................................261
Table 3.46: Vihiga County, FY 2014/15 Annual Budget and Budget Performance Analysis by .......................................... Department for the first Quarter of FY 2015/16 ............................................................................................266
Table 3.47: Wajir County, Annual Budget and Budget Performance by Department for ..................................................... First Quarter of FY 2015/16 ..........................................................................................................................271
Table 3.48: West Pokot County, Annual Budget and First Quarter Budget Performance for ............................................... FY 2015/16 by Department ...........................................................................................................................276
OFFICE OF THE CONTROLLER OF BUDGET
COUNTY GOVERNMENTS BUDGET IMPLEMENTATION REVIEW REPORT FIRST QUARTER FY 2015/16xviii
EXECUTIVE SUMMARYThis first quarter of FY 2015/16 County Budget Implementation Review Report (CBIRR) is prepared in fulfilment of Article 228 of the Constitution of Kenya, 2010, which requires the office to oversee and report on the implementation of the budgets of both National and County Governments. It highlights the progress made in budget implementation by each of the 47 County Governments. Specifically, revenue and expenditure performance is analyzed and compared against targets contained in the FY 2015/16 Approved Budgets. The key challenges that faced budget implementation during the reporting period have been identified and appropriate recommendations to overcome the challenges made.
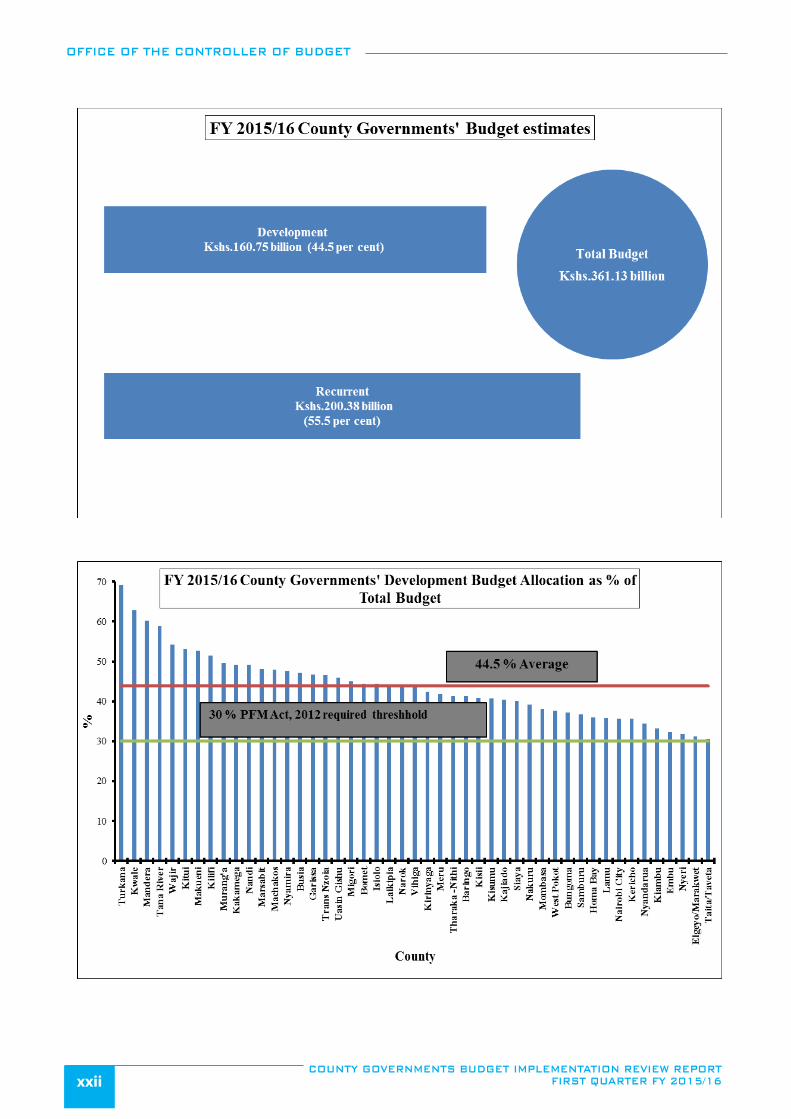
The aggregate Budget Estimates for the 47 County governments in FY 2015/16 amounted to Kshs.361.13 billion and comprised of Kshs.200.38 billion (55.5 per cent) allocation for recurrent expenditure and Kshs.160.75 billion (44.5 per cent) for development expenditure. The development expenditure allocation conforms to Section 107 (2(b)) of the PFM Act, 2012, which requires that at least 30 per cent of budget must be allocated for development programs. In order to finance FY 2015/16 Budget, County Governments expect to receive Kshs.259.77 billion from the National Government as equitable share of revenue, receive Kshs.16.60 billion as conditional allocation from the National Government, receive Kshs.10.67 billion as additional conditional allocation from loans and grants from development partners, generate Kshs.56.61 billion from local sources, and utilize the projected unspent funds carried forward from FY 2014/15 of Kshs.30.17 billion.
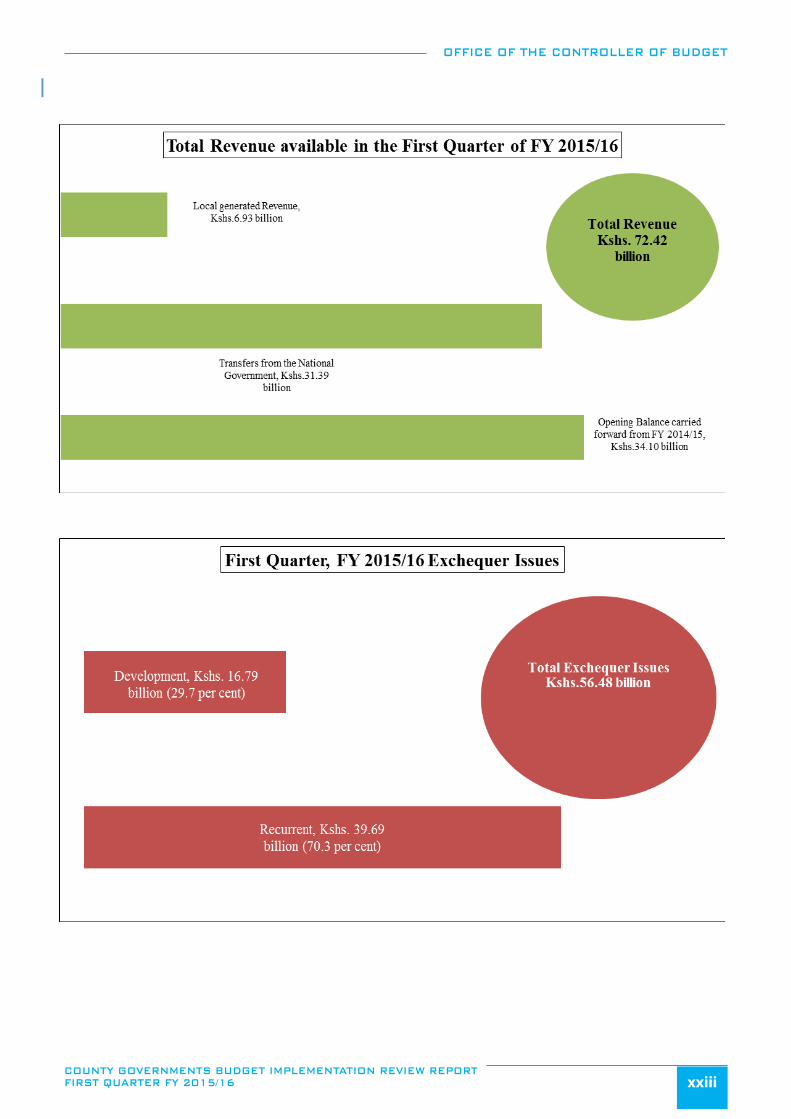
During the first Quarter of FY 2015/16, a total of Kshs.72.42 billion was available to the County Governments. Out of this amount, Kshs.31.39 billion related to direct transfers from the National Government to respective County Revenue Fund (CRF) accounts. The transfers comprised of equitable share of revenue raised nationally of Kshs.30.91 billion, and Kshs.477.45 million as conditional grant to Level 5 Hospitals. Kshs.34.10 billion was the actual cash balance brought forward from FY 2014/15 and Kshs.6.93 billion was generated from local revenue streams.
The local revenue of Kshs.6.93 billion generated during the period under review accounted for 12.2 per cent of the annual local revenue target of Kshs.56.61 billion and an increase
OFFICE OF THE CONTROLLER OF BUDGET
COUNTY GOVERNMENTS BUDGET IMPLEMENTATION REVIEW REPORT FIRST QUARTER FY 2015/16 xix
from Kshs.6.25 billion collected in a similar period of FY 2014/15. Counties that generated the highest amounts of local revenue in absolute terms were Nairobi City, Narok, Kiambu, Nakuru and Mombasa at Kshs.2.23 billion, Kshs.617.26 million, Kshs.493.35 million, Kshs.436.18 million and Kshs.384.17 million respectively. Conversely, West Pokot, Mandera, Nyamira, Lamu and Tana River Counties generated the lowest local revenue at Kshs.21.65 million, Kshs.18.45 million, Kshs.17.30 million, Kshs.7.70 million and Kshs.3.38 million respectively.
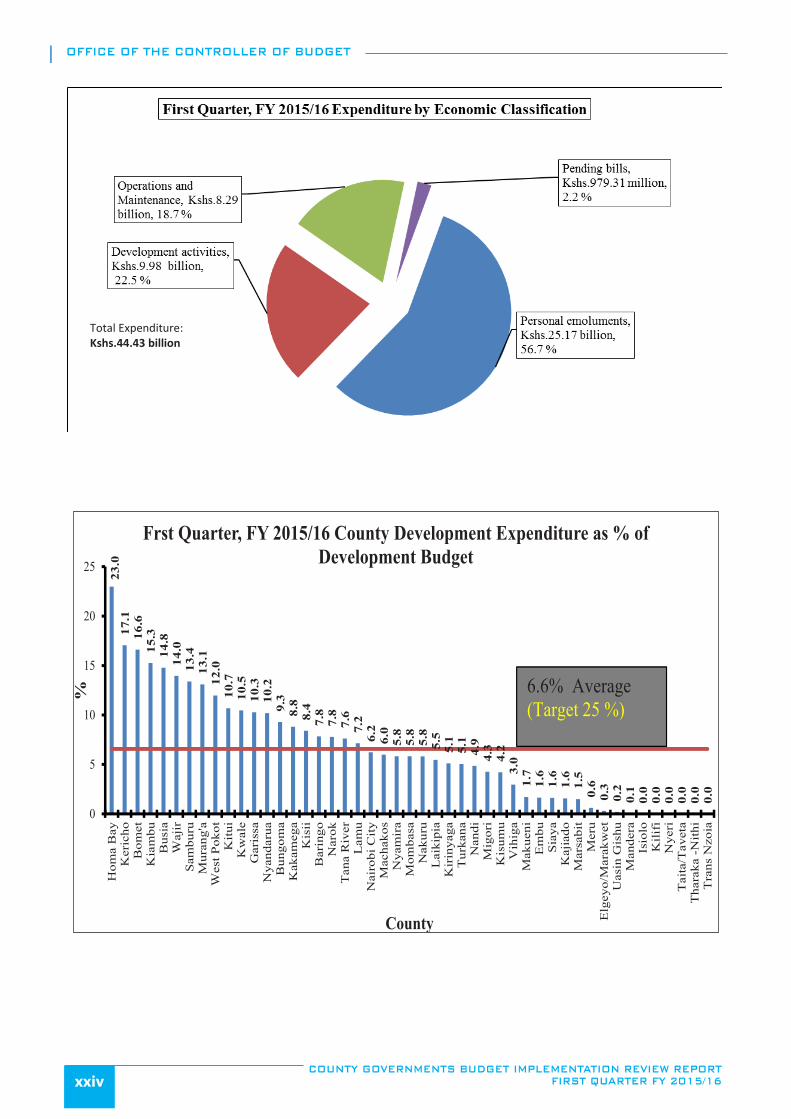
During the reporting period, the Controller of Budget authorized withdrawal of Kshs.56.48 billion from the County Revenue Funds (CRF) representing 15.6 per cent of the total County governments Budget Estimates for FY 2015/16. This amount comprised of Kshs.39.69 billion (70.3 per cent) for recurrent and Kshs.16.79 billion (29.7 per cent) for development activities. Actual expenditure was Kshs.44.43 billion, which was 78.7 per cent of the total funds released for operations. This expenditure comprised of Kshs.34.12 billion for recurrent activities (76.8 per cent) and Kshs.10.31 billion (23.2 per cent) for development activities.
The overall County governments’ expenditure represented an absorption rate of 12.3 per cent of the aggregate annual County governments’ budget estimates. Recurrent expenditure was 17.0 per cent of the annual recurrent budget, a decrease from an absorption rate of 18.5 per cent recorded in a similar period of FY 2014/15, while development expenditure translated to an absorption rate of 6.4 per cent, which was also a decline from 8.5 per cent recorded in the comparable period of FY 2014/15 where expenditure stood at Kshs.11.41 billion.
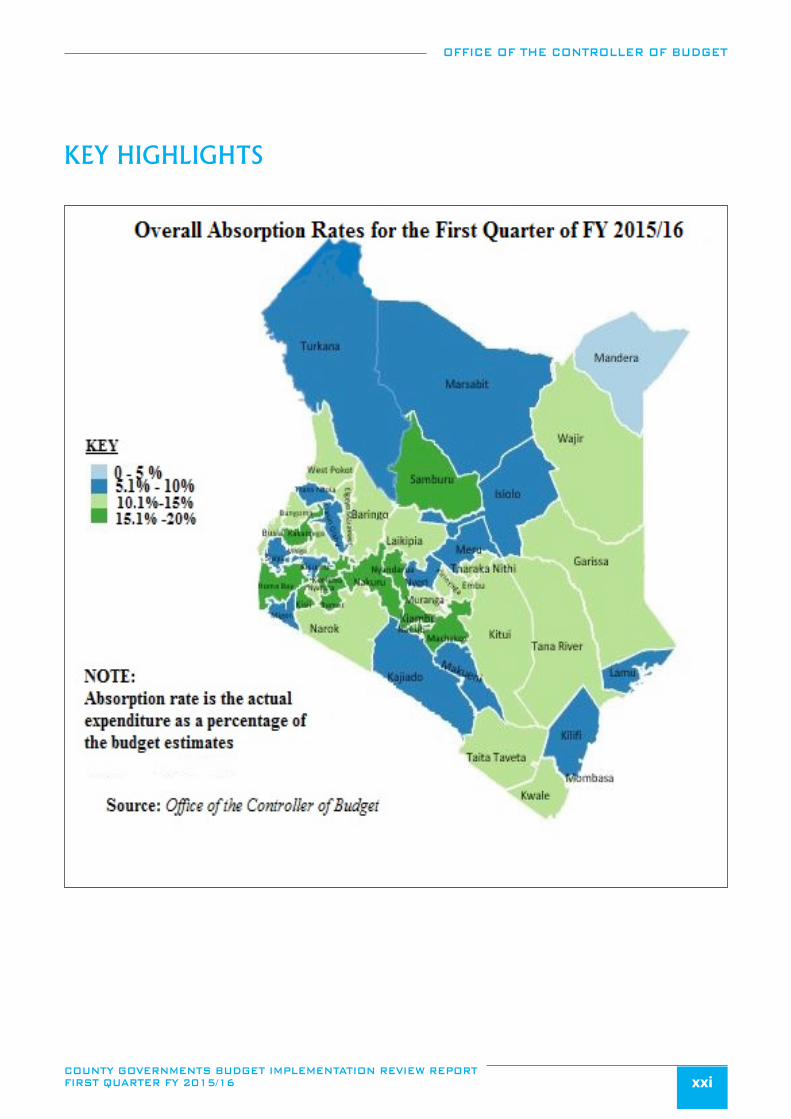
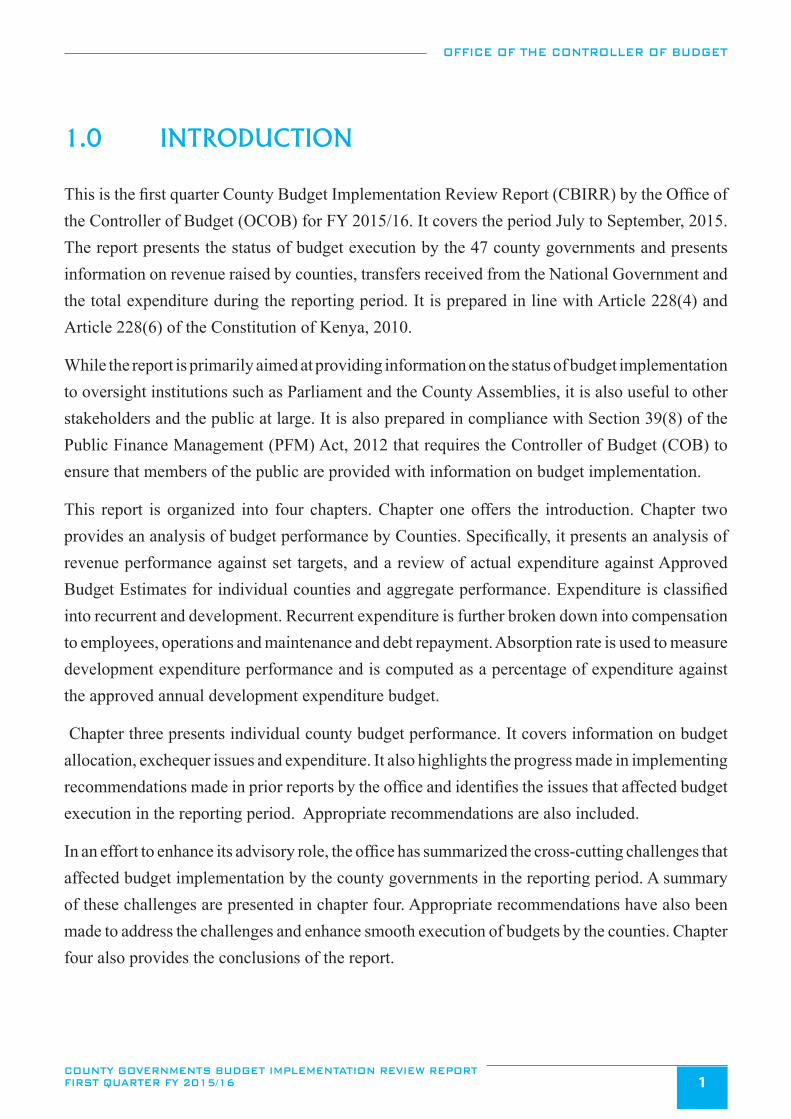
Counties that recorded the highest aggregate absorption rates were; Kisii, Machakos and Nyandarua at 16.9 per cent, 16.8 per cent, and 16.8 per cent respectively against a pro-rated target absorption rate of 25 per cent. Conversely, Turkana, Kilifi, and Mandera recorded the lowest absorption rates at 7.3 per cent, 5.3 per cent and 2.3 per cent respectively. Analysis of the development expenditure as a proportion of the development budget estimates indicates that Homa bay, Kericho, Bomet and Kiambu had the highest absorption rates at 23.0 per cent, 17.1 per cent, 16.6 per cent and 15.3 per cent respectively. Meru, Elgeyo Marakwet, Uasin Gishu and Mandera Counties had the lowest absorption rates of their development budget estimates at 0.6 per cent, 0.3 per cent, 0.2 per cent and 0.1 per cent respectively. Four Counties namely Nyeri, Taita Taveta, Tharaka Nithi and Trans Nzoia
OFFICE OF THE CONTROLLER OF BUDGET
COUNTY GOVERNMENTS BUDGET IMPLEMENTATION REVIEW REPORT FIRST QUARTER FY 2015/16xx
did not request funds to undertake development activities.
The Office has observed that most counties have made progress in addressing some of the challenges highlighted in the previous CBIRRs, such as; (i) adoption of the Integrated Financial Management Information System (IFMIS), (ii) building capacity of technical staff (iii) compliance with budgetary timelines, and (iv) designation of departmental accounting officers. However, there still exist challenges that continue to hamper effective budget execution that require attention. These include; (i) inadequate internal audit arrangements and Internal Audit Committees, (ii) inadequate administration and reporting on public funds established by the Counties, (iii) high expenditure on personnel emoluments (iv), capacity challenges in the use of the IFMIS E-procurement module, and (v) delay in disbursement of funds by the National Treasury.
In order to address these challenges, counties should ensure the following: (i) establish appropriate arrangements for conducting internal audits, which will require the National Treasury to assist in building the capacities of the established Internal Audit Departments and Internal Audit Committees, (ii) all established county public Funds are managed by a designated Administrator who should prepare quarterly financial reports in line with Section 168 of the PFM Act, 2012, (iii) expenditure on personnel emoluments is contained at sustainable levels and, where necessary, counties should liaise with the National Treasury and Salaries and Remuneration Commission (SRC) to address this challenge, (iv) the IFMIS directorate should liaise with county governments to assess user capacity and at the same time develop a training programme to build user capacity, especially for the Procurement Officers, and (v) the National Treasury should ensure that the national shareable revenue is released in line with the County Allocation of Revenue Act (CARA), 2015 and the disbursement schedule approved by the Senate to ensure that budget implementation is not adversely affected. Further, the Counties should ensure that all locally generated revenue is deposited in the County Revenue Fund (CRF) as required by Article 207 of the Constitution of Kenya 2010.
OFFICE OF THE CONTROLLER OF BUDGET
COUNTY GOVERNMENTS BUDGET IMPLEMENTATION REVIEW REPORT FIRST QUARTER FY 2015/16 xxi
KEY HIGHLIGHTS
OFFICE OF THE CONTROLLER OF BUDGET
COUNTY GOVERNMENTS BUDGET IMPLEMENTATION REVIEW REPORT FIRST QUARTER FY 2015/16xxii
OFFICE OF THE CONTROLLER OF BUDGET
COUNTY GOVERNMENTS BUDGET IMPLEMENTATION REVIEW REPORT FIRST QUARTER FY 2015/16 xxiii
OFFICE OF THE CONTROLLER OF BUDGET
COUNTY GOVERNMENTS BUDGET IMPLEMENTATION REVIEW REPORT FIRST QUARTER FY 2015/16xxiv
Total Expenditure: Kshs.44.43 billion
23.0
17.1
16.6
15.3
14.8
14.0
13.4
13.1
12.0
10.7
10.5
10.3
10.2
9.3
8.8
8.4
7.8
7.8
7.6
7.2
6.2
6.0
5.8
5.8
5.8
5.5
5.1
5.1
4.9
4.3
4.2
3.0
1.7
1.6
1.6
1.6
1.5
0.6
0.3
0.2
0.1
0.0
0.0
0.0
0.0
0.0
0.0
0
5
10
15
20
25
Hom
a B
ayK
eric
hoB
omet
Kia
mbu
Bus
iaW
ajir
Sam
buru
Mur
ang'
aW
est P
okot
Kit
uiK
wal
eG
aris
saN
yand
arua
Bun
gom
aK
akam
ega
Kis
iiB
arin
goN
arok
Tan
a R
iver
Lam
uN
airo
bi C
ity
Mac
hako
sN
yam
ira
Mom
basa
Nak
uru
Lai
kipi
aK
irin
yaga
Tur
kana
Nan
diM
igor
iK
isum
uV
ihig
aM
akue
niE
mbu
Sia
yaK
ajia
doM
arsa
bit
Mer
uE
lgey
o/M
arak
wet
Uas
in G
ishu
Man
dera
Isio
loK
ilifi
Nye
riT
aita
/Tav
eta
Tha
raka
-N
ithi
Tra
ns N
zoia
%
County
Frst Quarter, FY 2015/16 County Development Expenditure as % of Development Budget
6.6% Average (Target 25 %)
OFFICE OF THE CONTROLLER OF BUDGET
COUNTY GOVERNMENTS BUDGET IMPLEMENTATION REVIEW REPORT FIRST QUARTER FY 2015/16 1
1.0 INTRODUCTION
This is the first quarter County Budget Implementation Review Report (CBIRR) by the Office of the Controller of Budget (OCOB) for FY 2015/16. It covers the period July to September, 2015. The report presents the status of budget execution by the 47 county governments and presents information on revenue raised by counties, transfers received from the National Government and the total expenditure during the reporting period. It is prepared in line with Article 228(4) and Article 228(6) of the Constitution of Kenya, 2010.
While the report is primarily aimed at providing information on the status of budget implementation to oversight institutions such as Parliament and the County Assemblies, it is also useful to other stakeholders and the public at large. It is also prepared in compliance with Section 39(8) of the Public Finance Management (PFM) Act, 2012 that requires the Controller of Budget (COB) to ensure that members of the public are provided with information on budget implementation.
This report is organized into four chapters. Chapter one offers the introduction. Chapter two provides an analysis of budget performance by Counties. Specifically, it presents an analysis of revenue performance against set targets, and a review of actual expenditure against Approved Budget Estimates for individual counties and aggregate performance. Expenditure is classified into recurrent and development. Recurrent expenditure is further broken down into compensation to employees, operations and maintenance and debt repayment. Absorption rate is used to measure development expenditure performance and is computed as a percentage of expenditure against the approved annual development expenditure budget.
Chapter three presents individual county budget performance. It covers information on budget allocation, exchequer issues and expenditure. It also highlights the progress made in implementing recommendations made in prior reports by the office and identifies the issues that affected budget execution in the reporting period. Appropriate recommendations are also included.
In an effort to enhance its advisory role, the office has summarized the cross-cutting challenges that affected budget implementation by the county governments in the reporting period. A summary of these challenges are presented in chapter four. Appropriate recommendations have also been made to address the challenges and enhance smooth execution of budgets by the counties. Chapter four also provides the conclusions of the report.
OFFICE OF THE CONTROLLER OF BUDGET
COUNTY GOVERNMENTS BUDGET IMPLEMENTATION REVIEW REPORT FIRST QUARTER FY 2015/162
2.0 FINANCIAL ANALYSIS OF COUNTY BUDGET IMPLEMENTATION IN FIRST QUARTER OF FY2015/16
2.1 Introduction
This chapter presents the financial analysis of county budget implementation in the first quarter of FY 2015/2016.
2.2 FY 2015/16 Aggregate County Budgets and Revenue Analysis
In the FY 2015/16, the consolidated County Governments’ budget estimates as approved by the respective County Assemblies, amounted to Kshs.361.13 billion and comprised of Kshs.200.38 billion (55.5 per cent) allocation to recurrent expenditure and Kshs.160.75 billion (44.5 per cent) to development expenditure. In order to finance this budget, the County Governments expected to receive transfers from the National Government amounting to Kshs.287.04 billion; raise revenue from local sources amounting to Kshs.56.61 billion as well as utilize cash balance brought forward from FY 2014/15 of Kshs.30.17 billion.
In the first quarter of FY 2015/16, the total funds available to the County governments amounted to Kshs.72.42 billion, out of which, Kshs.31.39 billion (43.3 per cent of the total available revenue) was transfers from the National Government, Kshs.6.93 billion (9.6 per cent) was revenue raised from local sources and Kshs.34.10 billion (47.1 per cent) was cash balance brought forward from the FY 2014/15.
2.2.1 FY 2015/16 Aggregate Transfers from the National Government
The total transfers from the National Government in FY 2015/16 as per the County Allocation of Revenue Act (CARA), 2015 amounts to Kshs.287.04 billion. This amount consists of Kshs.259.77 billion as equitable share of revenue raised nationally; Kshs.3.60 billion as conditional allocation to Level 5 Hospitals; and Kshs.4.30 billion as conditional allocation for Free Maternal Health Care. Other conditional allocations were Kshs.900 million as conditional allocation for compensation to the county health facilities for forgone user fees; Kshs.4.50 billion as conditional allocation for leasing of specialised medical equipment; Kshs.3.30 billion as conditional allocation from Road Maintenance Fuel Levy Fund; Kshs.508.25 million as World Bank grant to supplement financing of county health facilities; Kshs.844.71 million as DANIDA grant to supplement financing for county health facilities, and Kshs.9.32 billion as conditional allocation from other loans and grants.
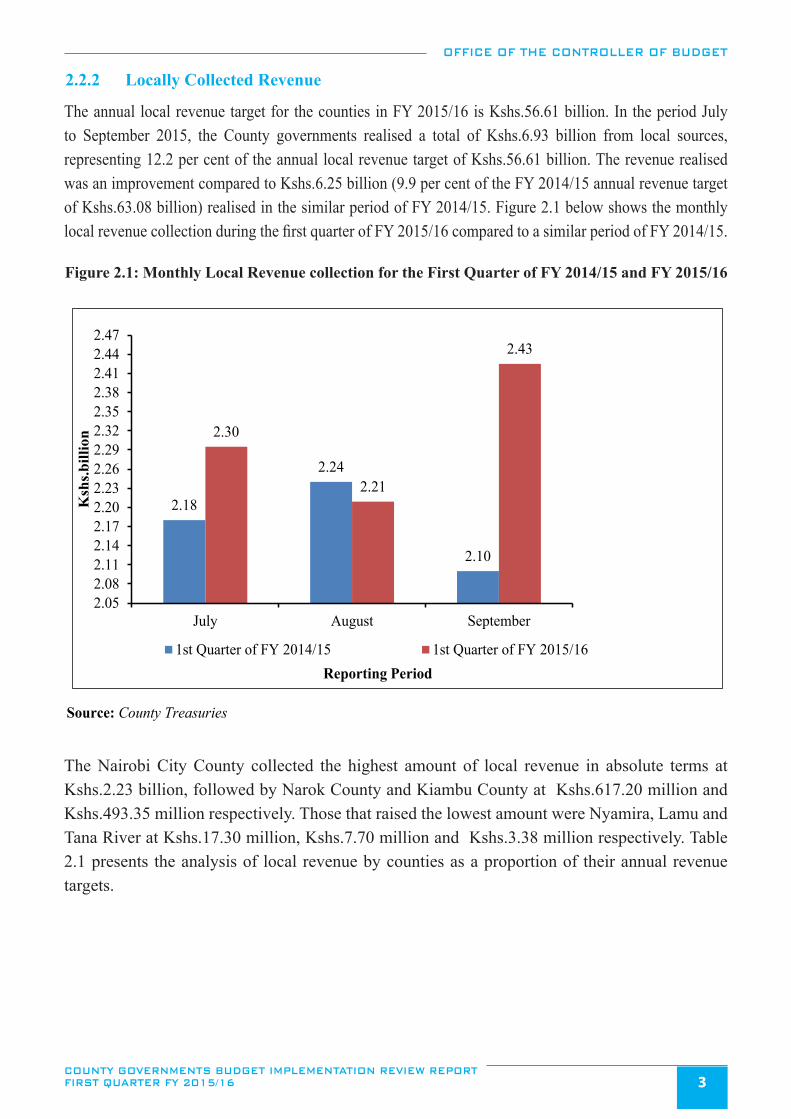
OFFICE OF THE CONTROLLER OF BUDGET
COUNTY GOVERNMENTS BUDGET IMPLEMENTATION REVIEW REPORT FIRST QUARTER FY 2015/16 3
2.2.2 Locally Collected Revenue
The annual local revenue target for the counties in FY 2015/16 is Kshs.56.61 billion. In the period July to September 2015, the County governments realised a total of Kshs.6.93 billion from local sources, representing 12.2 per cent of the annual local revenue target of Kshs.56.61 billion. The revenue realised was an improvement compared to Kshs.6.25 billion (9.9 per cent of the FY 2014/15 annual revenue target of Kshs.63.08 billion) realised in the similar period of FY 2014/15. Figure 2.1 below shows the monthly local revenue collection during the first quarter of FY 2015/16 compared to a similar period of FY 2014/15.
Figure 2.1: Monthly Local Revenue collection for the First Quarter of FY 2014/15 and FY 2015/16
2.18
2.24
2.10
2.30
2.21
2.43
2.052.082.112.142.172.202.232.262.292.322.352.382.412.442.47
July August September
Ksh
s.bi
llion
Reporting Period1st Quarter of FY 2014/15 1st Quarter of FY 2015/16
Source: County Treasuries
The Nairobi City County collected the highest amount of local revenue in absolute terms at Kshs.2.23 billion, followed by Narok County and Kiambu County at Kshs.617.20 million and Kshs.493.35 million respectively. Those that raised the lowest amount were Nyamira, Lamu and Tana River at Kshs.17.30 million, Kshs.7.70 million and Kshs.3.38 million respectively. Table 2.1 presents the analysis of local revenue by counties as a proportion of their annual revenue targets.
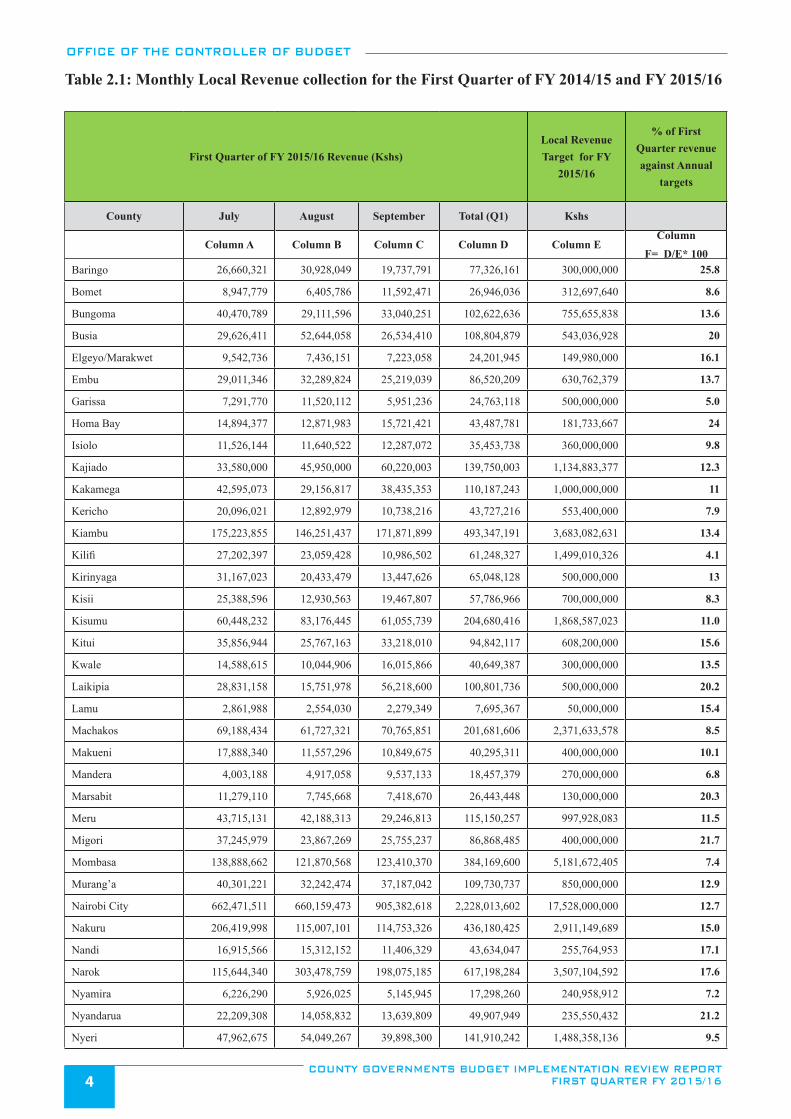
OFFICE OF THE CONTROLLER OF BUDGET
COUNTY GOVERNMENTS BUDGET IMPLEMENTATION REVIEW REPORT FIRST QUARTER FY 2015/164
Table 2.1: Monthly Local Revenue collection for the First Quarter of FY 2014/15 and FY 2015/16
First Quarter of FY 2015/16 Revenue (Kshs)Local Revenue Target for FY
2015/16
% of First Quarter revenue against Annual
targets
County July August September Total (Q1) Kshs
Column A Column B Column C Column D Column EColumn
F= D/E* 100Baringo 26,660,321 30,928,049 19,737,791 77,326,161 300,000,000 25.8
Bomet 8,947,779 6,405,786 11,592,471 26,946,036 312,697,640 8.6
Bungoma 40,470,789 29,111,596 33,040,251 102,622,636 755,655,838 13.6
Busia 29,626,411 52,644,058 26,534,410 108,804,879 543,036,928 20
Elgeyo/Marakwet 9,542,736 7,436,151 7,223,058 24,201,945 149,980,000 16.1
Embu 29,011,346 32,289,824 25,219,039 86,520,209 630,762,379 13.7
Garissa 7,291,770 11,520,112 5,951,236 24,763,118 500,000,000 5.0
Homa Bay 14,894,377 12,871,983 15,721,421 43,487,781 181,733,667 24
Isiolo 11,526,144 11,640,522 12,287,072 35,453,738 360,000,000 9.8
Kajiado 33,580,000 45,950,000 60,220,003 139,750,003 1,134,883,377 12.3
Kakamega 42,595,073 29,156,817 38,435,353 110,187,243 1,000,000,000 11
Kericho 20,096,021 12,892,979 10,738,216 43,727,216 553,400,000 7.9
Kiambu 175,223,855 146,251,437 171,871,899 493,347,191 3,683,082,631 13.4
Kilifi 27,202,397 23,059,428 10,986,502 61,248,327 1,499,010,326 4.1
Kirinyaga 31,167,023 20,433,479 13,447,626 65,048,128 500,000,000 13
Kisii 25,388,596 12,930,563 19,467,807 57,786,966 700,000,000 8.3
Kisumu 60,448,232 83,176,445 61,055,739 204,680,416 1,868,587,023 11.0
Kitui 35,856,944 25,767,163 33,218,010 94,842,117 608,200,000 15.6
Kwale 14,588,615 10,044,906 16,015,866 40,649,387 300,000,000 13.5
Laikipia 28,831,158 15,751,978 56,218,600 100,801,736 500,000,000 20.2
Lamu 2,861,988 2,554,030 2,279,349 7,695,367 50,000,000 15.4
Machakos 69,188,434 61,727,321 70,765,851 201,681,606 2,371,633,578 8.5
Makueni 17,888,340 11,557,296 10,849,675 40,295,311 400,000,000 10.1
Mandera 4,003,188 4,917,058 9,537,133 18,457,379 270,000,000 6.8
Marsabit 11,279,110 7,745,668 7,418,670 26,443,448 130,000,000 20.3
Meru 43,715,131 42,188,313 29,246,813 115,150,257 997,928,083 11.5
Migori 37,245,979 23,867,269 25,755,237 86,868,485 400,000,000 21.7
Mombasa 138,888,662 121,870,568 123,410,370 384,169,600 5,181,672,405 7.4
Murang’a 40,301,221 32,242,474 37,187,042 109,730,737 850,000,000 12.9
Nairobi City 662,471,511 660,159,473 905,382,618 2,228,013,602 17,528,000,000 12.7
Nakuru 206,419,998 115,007,101 114,753,326 436,180,425 2,911,149,689 15.0
Nandi 16,915,566 15,312,152 11,406,329 43,634,047 255,764,953 17.1
Narok 115,644,340 303,478,759 198,075,185 617,198,284 3,507,104,592 17.6
Nyamira 6,226,290 5,926,025 5,145,945 17,298,260 240,958,912 7.2
Nyandarua 22,209,308 14,058,832 13,639,809 49,907,949 235,550,432 21.2
Nyeri 47,962,675 54,049,267 39,898,300 141,910,242 1,488,358,136 9.5
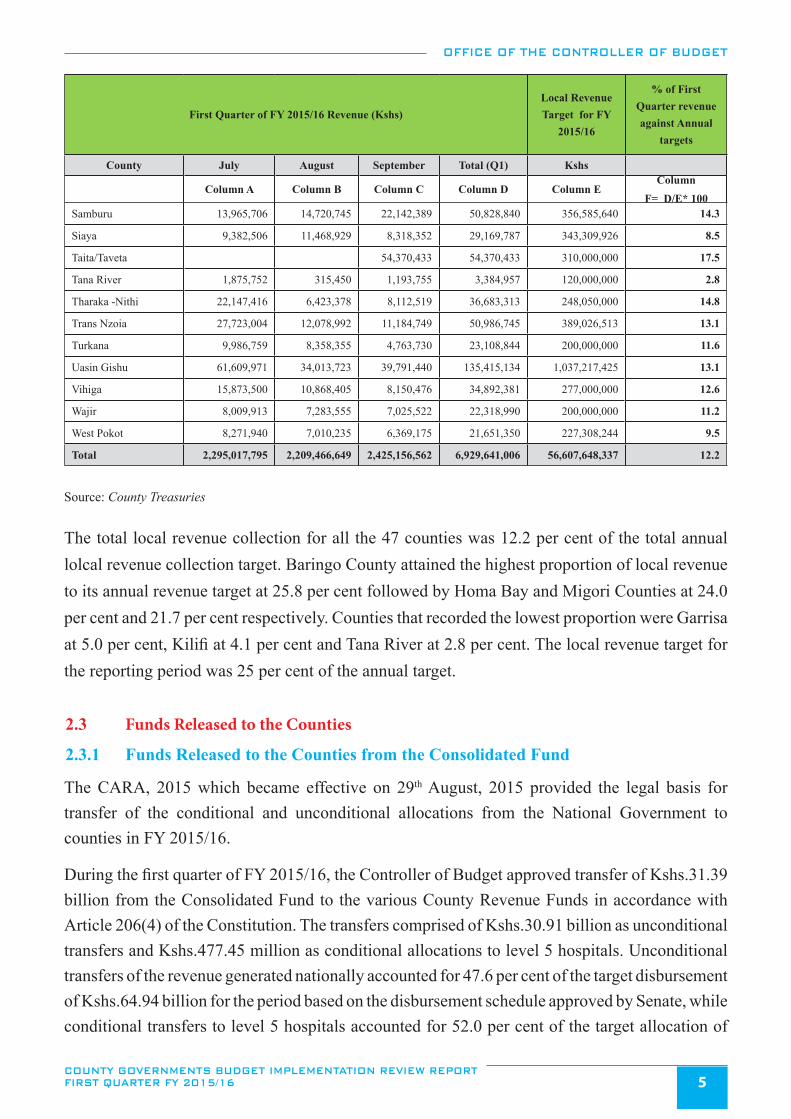
OFFICE OF THE CONTROLLER OF BUDGET
COUNTY GOVERNMENTS BUDGET IMPLEMENTATION REVIEW REPORT FIRST QUARTER FY 2015/16 5
First Quarter of FY 2015/16 Revenue (Kshs)Local Revenue Target for FY
2015/16
% of First Quarter revenue against Annual
targets
County July August September Total (Q1) Kshs
Column A Column B Column C Column D Column EColumn
F= D/E* 100Samburu 13,965,706 14,720,745 22,142,389 50,828,840 356,585,640 14.3
Siaya 9,382,506 11,468,929 8,318,352 29,169,787 343,309,926 8.5
Taita/Taveta 54,370,433 54,370,433 310,000,000 17.5
Tana River 1,875,752 315,450 1,193,755 3,384,957 120,000,000 2.8
Tharaka -Nithi 22,147,416 6,423,378 8,112,519 36,683,313 248,050,000 14.8
Trans Nzoia 27,723,004 12,078,992 11,184,749 50,986,745 389,026,513 13.1
Turkana 9,986,759 8,358,355 4,763,730 23,108,844 200,000,000 11.6
Uasin Gishu 61,609,971 34,013,723 39,791,440 135,415,134 1,037,217,425 13.1
Vihiga 15,873,500 10,868,405 8,150,476 34,892,381 277,000,000 12.6
Wajir 8,009,913 7,283,555 7,025,522 22,318,990 200,000,000 11.2
West Pokot 8,271,940 7,010,235 6,369,175 21,651,350 227,308,244 9.5
Total 2,295,017,795 2,209,466,649 2,425,156,562 6,929,641,006 56,607,648,337 12.2
Source: County Treasuries
The total local revenue collection for all the 47 counties was 12.2 per cent of the total annual lolcal revenue collection target. Baringo County attained the highest proportion of local revenue to its annual revenue target at 25.8 per cent followed by Homa Bay and Migori Counties at 24.0 per cent and 21.7 per cent respectively. Counties that recorded the lowest proportion were Garrisa at 5.0 per cent, Kilifi at 4.1 per cent and Tana River at 2.8 per cent. The local revenue target for the reporting period was 25 per cent of the annual target.
2.3 Funds Released to the Counties
2.3.1 Funds Released to the Counties from the Consolidated Fund
The CARA, 2015 which became effective on 29th August, 2015 provided the legal basis for transfer of the conditional and unconditional allocations from the National Government to counties in FY 2015/16.
During the first quarter of FY 2015/16, the Controller of Budget approved transfer of Kshs.31.39 billion from the Consolidated Fund to the various County Revenue Funds in accordance with Article 206(4) of the Constitution. The transfers comprised of Kshs.30.91 billion as unconditional transfers and Kshs.477.45 million as conditional allocations to level 5 hospitals. Unconditional transfers of the revenue generated nationally accounted for 47.6 per cent of the target disbursement of Kshs.64.94 billion for the period based on the disbursement schedule approved by Senate, while conditional transfers to level 5 hospitals accounted for 52.0 per cent of the target allocation of
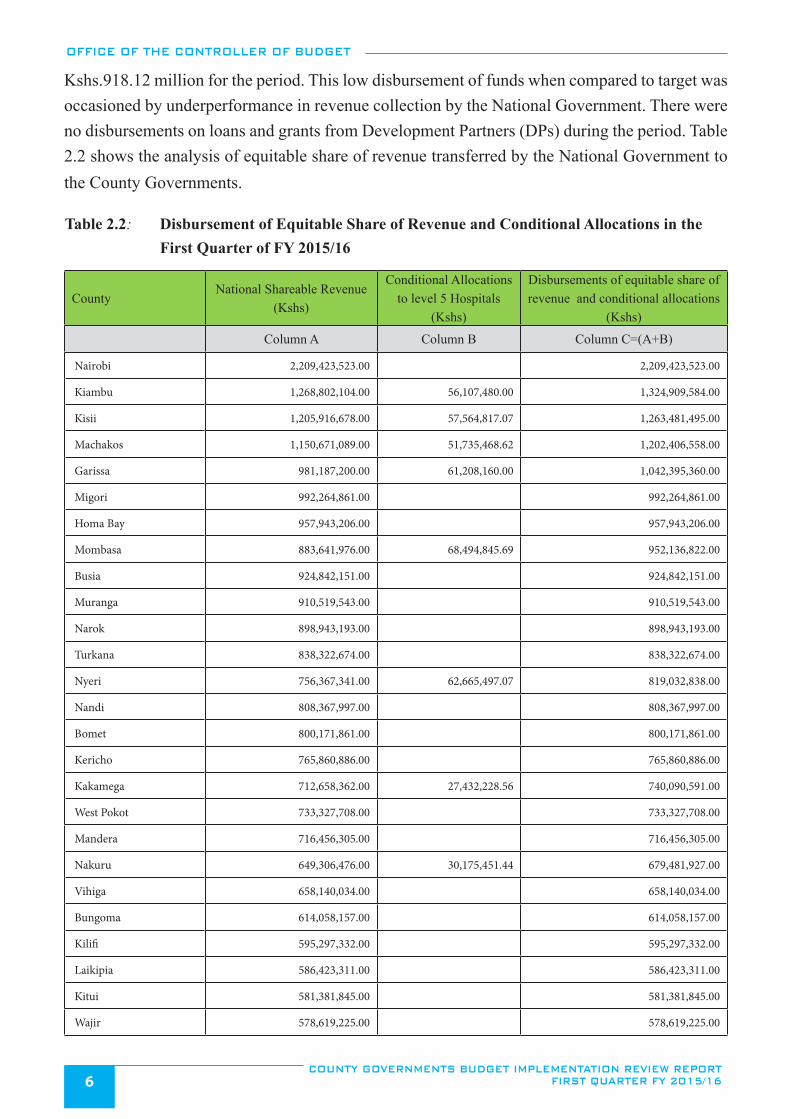
OFFICE OF THE CONTROLLER OF BUDGET
COUNTY GOVERNMENTS BUDGET IMPLEMENTATION REVIEW REPORT FIRST QUARTER FY 2015/166
Kshs.918.12 million for the period. This low disbursement of funds when compared to target was occasioned by underperformance in revenue collection by the National Government. There were no disbursements on loans and grants from Development Partners (DPs) during the period. Table 2.2 shows the analysis of equitable share of revenue transferred by the National Government to the County Governments.
Table 2.2: Disbursement of Equitable Share of Revenue and Conditional Allocations in the First Quarter of FY 2015/16
CountyNational Shareable Revenue
(Kshs)
Conditional Allocations to level 5 Hospitals
(Kshs)
Disbursements of equitable share of revenue and conditional allocations
(Kshs)
Column A Column B Column C=(A+B)
Nairobi 2,209,423,523.00 2,209,423,523.00
Kiambu 1,268,802,104.00 56,107,480.00 1,324,909,584.00
Kisii 1,205,916,678.00 57,564,817.07 1,263,481,495.00
Machakos 1,150,671,089.00 51,735,468.62 1,202,406,558.00
Garissa 981,187,200.00 61,208,160.00 1,042,395,360.00
Migori 992,264,861.00 992,264,861.00
Homa Bay 957,943,206.00 957,943,206.00
Mombasa 883,641,976.00 68,494,845.69 952,136,822.00
Busia 924,842,151.00 924,842,151.00
Muranga 910,519,543.00 910,519,543.00
Narok 898,943,193.00 898,943,193.00
Turkana 838,322,674.00 838,322,674.00
Nyeri 756,367,341.00 62,665,497.07 819,032,838.00
Nandi 808,367,997.00 808,367,997.00
Bomet 800,171,861.00 800,171,861.00
Kericho 765,860,886.00 765,860,886.00
Kakamega 712,658,362.00 27,432,228.56 740,090,591.00
West Pokot 733,327,708.00 733,327,708.00
Mandera 716,456,305.00 716,456,305.00
Nakuru 649,306,476.00 30,175,451.44 679,481,927.00
Vihiga 658,140,034.00 658,140,034.00
Bungoma 614,058,157.00 614,058,157.00
Kilifi 595,297,332.00 595,297,332.00
Laikipia 586,423,311.00 586,423,311.00
Kitui 581,381,845.00 581,381,845.00
Wajir 578,619,225.00 578,619,225.00
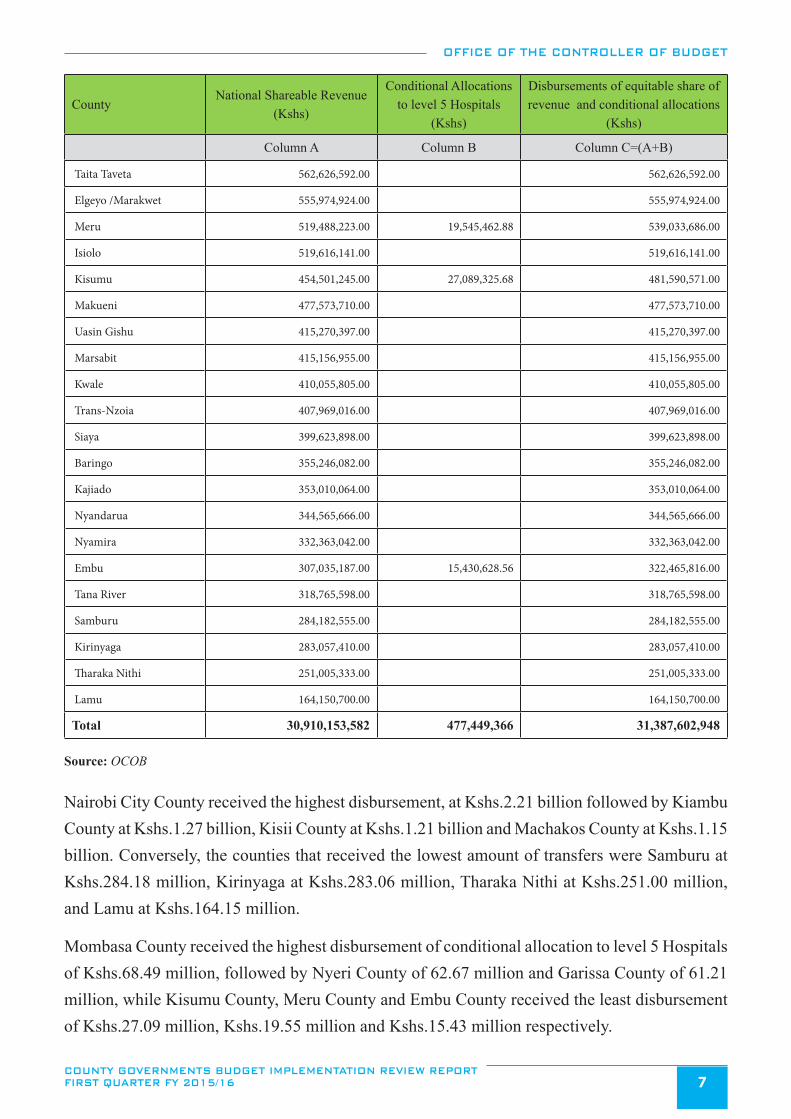
OFFICE OF THE CONTROLLER OF BUDGET
COUNTY GOVERNMENTS BUDGET IMPLEMENTATION REVIEW REPORT FIRST QUARTER FY 2015/16 7
CountyNational Shareable Revenue
(Kshs)
Conditional Allocations to level 5 Hospitals
(Kshs)
Disbursements of equitable share of revenue and conditional allocations
(Kshs)
Column A Column B Column C=(A+B)
Taita Taveta 562,626,592.00 562,626,592.00
Elgeyo /Marakwet 555,974,924.00 555,974,924.00
Meru 519,488,223.00 19,545,462.88 539,033,686.00
Isiolo 519,616,141.00 519,616,141.00
Kisumu 454,501,245.00 27,089,325.68 481,590,571.00
Makueni 477,573,710.00 477,573,710.00
Uasin Gishu 415,270,397.00 415,270,397.00
Marsabit 415,156,955.00 415,156,955.00
Kwale 410,055,805.00 410,055,805.00
Trans-Nzoia 407,969,016.00 407,969,016.00
Siaya 399,623,898.00 399,623,898.00
Baringo 355,246,082.00 355,246,082.00
Kajiado 353,010,064.00 353,010,064.00
Nyandarua 344,565,666.00 344,565,666.00
Nyamira 332,363,042.00 332,363,042.00
Embu 307,035,187.00 15,430,628.56 322,465,816.00
Tana River 318,765,598.00 318,765,598.00
Samburu 284,182,555.00 284,182,555.00
Kirinyaga 283,057,410.00 283,057,410.00
Tharaka Nithi 251,005,333.00 251,005,333.00
Lamu 164,150,700.00 164,150,700.00
Total 30,910,153,582 477,449,366 31,387,602,948
Source: OCOB
Nairobi City County received the highest disbursement, at Kshs.2.21 billion followed by Kiambu County at Kshs.1.27 billion, Kisii County at Kshs.1.21 billion and Machakos County at Kshs.1.15 billion. Conversely, the counties that received the lowest amount of transfers were Samburu at Kshs.284.18 million, Kirinyaga at Kshs.283.06 million, Tharaka Nithi at Kshs.251.00 million, and Lamu at Kshs.164.15 million.
Mombasa County received the highest disbursement of conditional allocation to level 5 Hospitals of Kshs.68.49 million, followed by Nyeri County of 62.67 million and Garissa County of 61.21 million, while Kisumu County, Meru County and Embu County received the least disbursement of Kshs.27.09 million, Kshs.19.55 million and Kshs.15.43 million respectively.
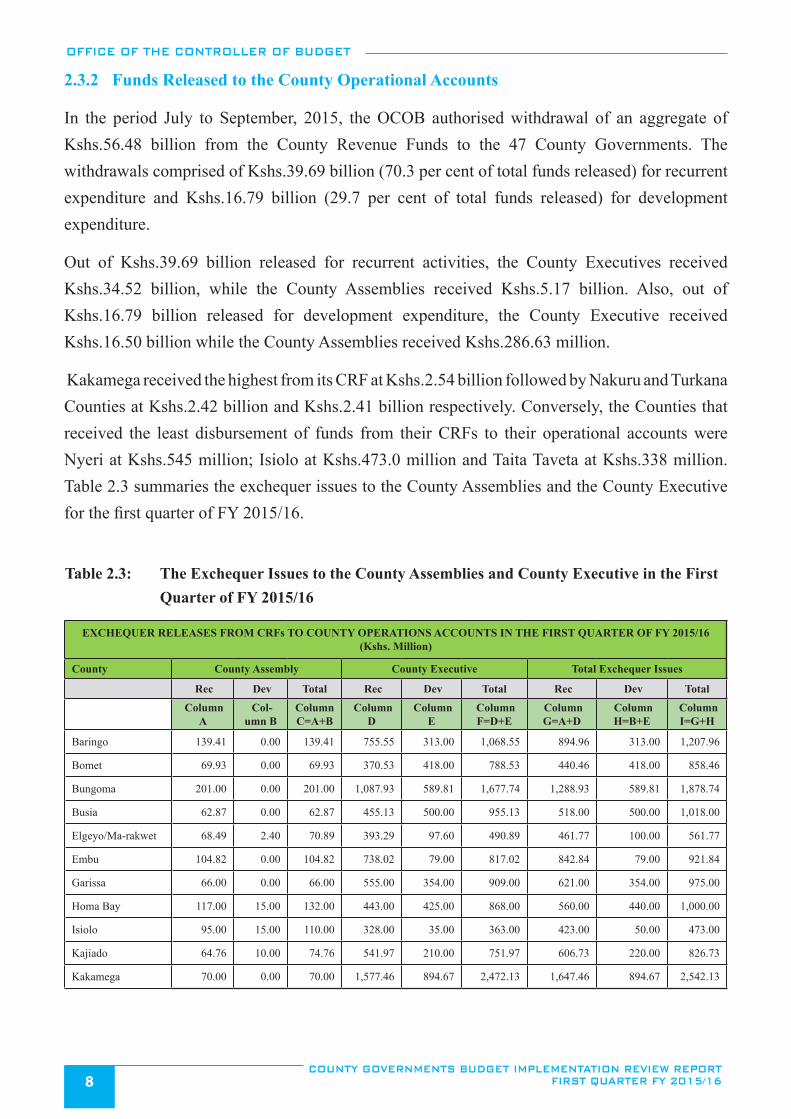
OFFICE OF THE CONTROLLER OF BUDGET
COUNTY GOVERNMENTS BUDGET IMPLEMENTATION REVIEW REPORT FIRST QUARTER FY 2015/168
2.3.2 Funds Released to the County Operational Accounts
In the period July to September, 2015, the OCOB authorised withdrawal of an aggregate of Kshs.56.48 billion from the County Revenue Funds to the 47 County Governments. The withdrawals comprised of Kshs.39.69 billion (70.3 per cent of total funds released) for recurrent expenditure and Kshs.16.79 billion (29.7 per cent of total funds released) for development expenditure.
Out of Kshs.39.69 billion released for recurrent activities, the County Executives received Kshs.34.52 billion, while the County Assemblies received Kshs.5.17 billion. Also, out of Kshs.16.79 billion released for development expenditure, the County Executive received Kshs.16.50 billion while the County Assemblies received Kshs.286.63 million.
Kakamega received the highest from its CRF at Kshs.2.54 billion followed by Nakuru and Turkana Counties at Kshs.2.42 billion and Kshs.2.41 billion respectively. Conversely, the Counties that received the least disbursement of funds from their CRFs to their operational accounts were Nyeri at Kshs.545 million; Isiolo at Kshs.473.0 million and Taita Taveta at Kshs.338 million. Table 2.3 summaries the exchequer issues to the County Assemblies and the County Executive for the first quarter of FY 2015/16.
Table 2.3: The Exchequer Issues to the County Assemblies and County Executive in the First Quarter of FY 2015/16
EXCHEQUER RELEASES FROM CRFs TO COUNTY OPERATIONS ACCOUNTS IN THE FIRST QUARTER OF FY 2015/16 (Kshs. Million)
County County Assembly County Executive Total Exchequer Issues
Rec Dev Total Rec Dev Total Rec Dev Total
Column A
Col-umn B
Column C=A+B
Column D
Column E
Column F=D+E
Column G=A+D
Column H=B+E
Column I=G+H
Baringo 139.41 0.00 139.41 755.55 313.00 1,068.55 894.96 313.00 1,207.96
Bomet 69.93 0.00 69.93 370.53 418.00 788.53 440.46 418.00 858.46
Bungoma 201.00 0.00 201.00 1,087.93 589.81 1,677.74 1,288.93 589.81 1,878.74
Busia 62.87 0.00 62.87 455.13 500.00 955.13 518.00 500.00 1,018.00
Elgeyo/Ma-rakwet 68.49 2.40 70.89 393.29 97.60 490.89 461.77 100.00 561.77
Embu 104.82 0.00 104.82 738.02 79.00 817.02 842.84 79.00 921.84
Garissa 66.00 0.00 66.00 555.00 354.00 909.00 621.00 354.00 975.00
Homa Bay 117.00 15.00 132.00 443.00 425.00 868.00 560.00 440.00 1,000.00
Isiolo 95.00 15.00 110.00 328.00 35.00 363.00 423.00 50.00 473.00
Kajiado 64.76 10.00 74.76 541.97 210.00 751.97 606.73 220.00 826.73
Kakamega 70.00 0.00 70.00 1,577.46 894.67 2,472.13 1,647.46 894.67 2,542.13
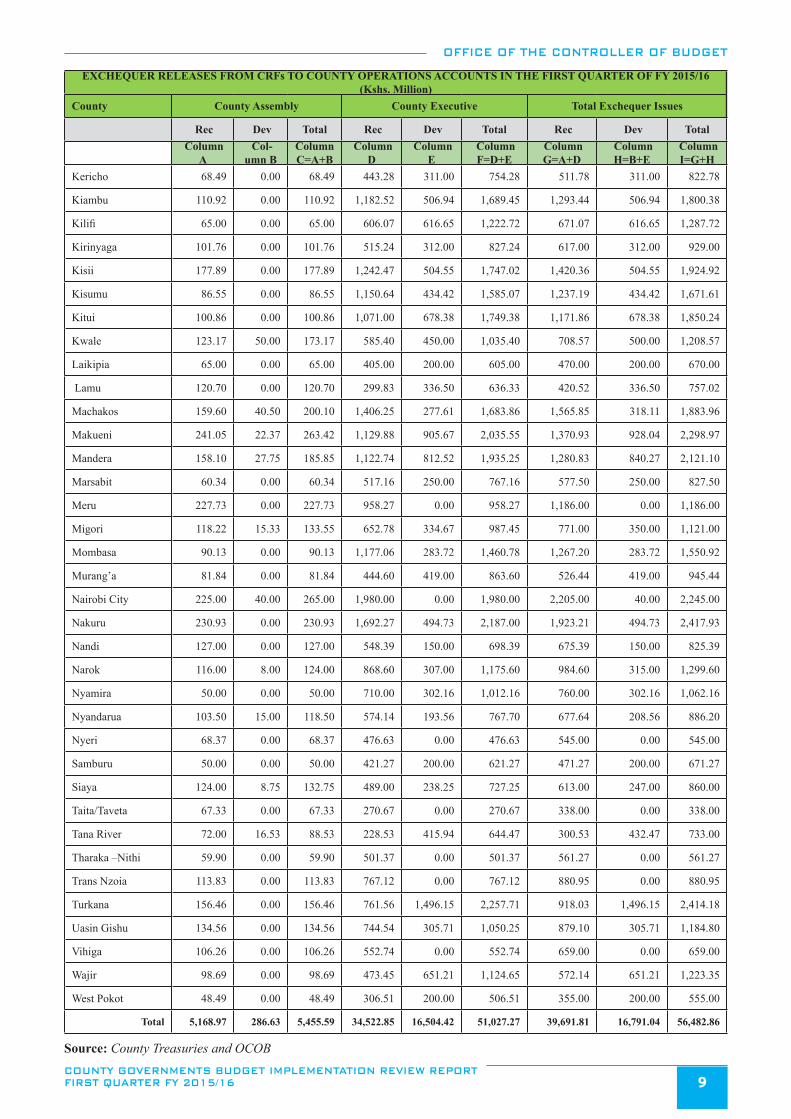
OFFICE OF THE CONTROLLER OF BUDGET
COUNTY GOVERNMENTS BUDGET IMPLEMENTATION REVIEW REPORT FIRST QUARTER FY 2015/16 9
EXCHEQUER RELEASES FROM CRFs TO COUNTY OPERATIONS ACCOUNTS IN THE FIRST QUARTER OF FY 2015/16 (Kshs. Million)
County County Assembly County Executive Total Exchequer Issues
Rec Dev Total Rec Dev Total Rec Dev Total
Column A
Col-umn B
Column C=A+B
Column D
Column E
Column F=D+E
Column G=A+D
Column H=B+E
Column I=G+H
Kericho 68.49 0.00 68.49 443.28 311.00 754.28 511.78 311.00 822.78
Kiambu 110.92 0.00 110.92 1,182.52 506.94 1,689.45 1,293.44 506.94 1,800.38
Kilifi 65.00 0.00 65.00 606.07 616.65 1,222.72 671.07 616.65 1,287.72
Kirinyaga 101.76 0.00 101.76 515.24 312.00 827.24 617.00 312.00 929.00
Kisii 177.89 0.00 177.89 1,242.47 504.55 1,747.02 1,420.36 504.55 1,924.92
Kisumu 86.55 0.00 86.55 1,150.64 434.42 1,585.07 1,237.19 434.42 1,671.61
Kitui 100.86 0.00 100.86 1,071.00 678.38 1,749.38 1,171.86 678.38 1,850.24
Kwale 123.17 50.00 173.17 585.40 450.00 1,035.40 708.57 500.00 1,208.57
Laikipia 65.00 0.00 65.00 405.00 200.00 605.00 470.00 200.00 670.00
Lamu 120.70 0.00 120.70 299.83 336.50 636.33 420.52 336.50 757.02
Machakos 159.60 40.50 200.10 1,406.25 277.61 1,683.86 1,565.85 318.11 1,883.96
Makueni 241.05 22.37 263.42 1,129.88 905.67 2,035.55 1,370.93 928.04 2,298.97
Mandera 158.10 27.75 185.85 1,122.74 812.52 1,935.25 1,280.83 840.27 2,121.10
Marsabit 60.34 0.00 60.34 517.16 250.00 767.16 577.50 250.00 827.50
Meru 227.73 0.00 227.73 958.27 0.00 958.27 1,186.00 0.00 1,186.00
Migori 118.22 15.33 133.55 652.78 334.67 987.45 771.00 350.00 1,121.00
Mombasa 90.13 0.00 90.13 1,177.06 283.72 1,460.78 1,267.20 283.72 1,550.92
Murang’a 81.84 0.00 81.84 444.60 419.00 863.60 526.44 419.00 945.44
Nairobi City 225.00 40.00 265.00 1,980.00 0.00 1,980.00 2,205.00 40.00 2,245.00
Nakuru 230.93 0.00 230.93 1,692.27 494.73 2,187.00 1,923.21 494.73 2,417.93
Nandi 127.00 0.00 127.00 548.39 150.00 698.39 675.39 150.00 825.39
Narok 116.00 8.00 124.00 868.60 307.00 1,175.60 984.60 315.00 1,299.60
Nyamira 50.00 0.00 50.00 710.00 302.16 1,012.16 760.00 302.16 1,062.16
Nyandarua 103.50 15.00 118.50 574.14 193.56 767.70 677.64 208.56 886.20
Nyeri 68.37 0.00 68.37 476.63 0.00 476.63 545.00 0.00 545.00
Samburu 50.00 0.00 50.00 421.27 200.00 621.27 471.27 200.00 671.27
Siaya 124.00 8.75 132.75 489.00 238.25 727.25 613.00 247.00 860.00
Taita/Taveta 67.33 0.00 67.33 270.67 0.00 270.67 338.00 0.00 338.00
Tana River 72.00 16.53 88.53 228.53 415.94 644.47 300.53 432.47 733.00
Tharaka –Nithi 59.90 0.00 59.90 501.37 0.00 501.37 561.27 0.00 561.27
Trans Nzoia 113.83 0.00 113.83 767.12 0.00 767.12 880.95 0.00 880.95
Turkana 156.46 0.00 156.46 761.56 1,496.15 2,257.71 918.03 1,496.15 2,414.18
Uasin Gishu 134.56 0.00 134.56 744.54 305.71 1,050.25 879.10 305.71 1,184.80
Vihiga 106.26 0.00 106.26 552.74 0.00 552.74 659.00 0.00 659.00
Wajir 98.69 0.00 98.69 473.45 651.21 1,124.65 572.14 651.21 1,223.35
West Pokot 48.49 0.00 48.49 306.51 200.00 506.51 355.00 200.00 555.00
Total 5,168.97 286.63 5,455.59 34,522.85 16,504.42 51,027.27 39,691.81 16,791.04 56,482.86
Source: County Treasuries and OCOB
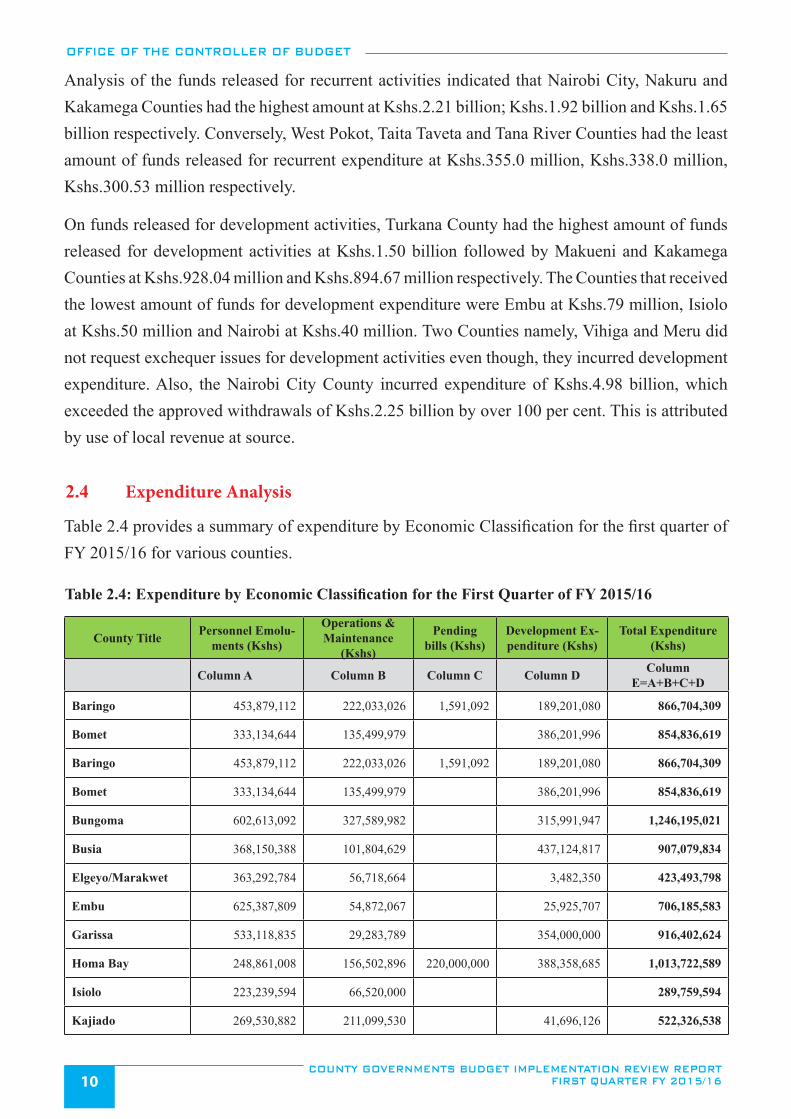
OFFICE OF THE CONTROLLER OF BUDGET
COUNTY GOVERNMENTS BUDGET IMPLEMENTATION REVIEW REPORT FIRST QUARTER FY 2015/1610
Analysis of the funds released for recurrent activities indicated that Nairobi City, Nakuru and Kakamega Counties had the highest amount at Kshs.2.21 billion; Kshs.1.92 billion and Kshs.1.65 billion respectively. Conversely, West Pokot, Taita Taveta and Tana River Counties had the least amount of funds released for recurrent expenditure at Kshs.355.0 million, Kshs.338.0 million, Kshs.300.53 million respectively.
On funds released for development activities, Turkana County had the highest amount of funds released for development activities at Kshs.1.50 billion followed by Makueni and Kakamega Counties at Kshs.928.04 million and Kshs.894.67 million respectively. The Counties that received the lowest amount of funds for development expenditure were Embu at Kshs.79 million, Isiolo at Kshs.50 million and Nairobi at Kshs.40 million. Two Counties namely, Vihiga and Meru did not request exchequer issues for development activities even though, they incurred development expenditure. Also, the Nairobi City County incurred expenditure of Kshs.4.98 billion, which exceeded the approved withdrawals of Kshs.2.25 billion by over 100 per cent. This is attributed by use of local revenue at source.
2.4 Expenditure Analysis
Table 2.4 provides a summary of expenditure by Economic Classification for the first quarter of FY 2015/16 for various counties.
Table 2.4: Expenditure by Economic Classification for the First Quarter of FY 2015/16
County Title Personnel Emolu-ments (Kshs)
Operations & Maintenance
(Kshs)
Pending bills (Kshs)
Development Ex-penditure (Kshs)
Total Expenditure (Kshs)
Column A Column B Column C Column D Column E=A+B+C+D
Baringo 453,879,112 222,033,026 1,591,092 189,201,080 866,704,309
Bomet 333,134,644 135,499,979 386,201,996 854,836,619
Baringo 453,879,112 222,033,026 1,591,092 189,201,080 866,704,309
Bomet 333,134,644 135,499,979 386,201,996 854,836,619
Bungoma 602,613,092 327,589,982 315,991,947 1,246,195,021
Busia 368,150,388 101,804,629 437,124,817 907,079,834
Elgeyo/Marakwet 363,292,784 56,718,664 3,482,350 423,493,798
Embu 625,387,809 54,872,067 25,925,707 706,185,583
Garissa 533,118,835 29,283,789 354,000,000 916,402,624
Homa Bay 248,861,008 156,502,896 220,000,000 388,358,685 1,013,722,589
Isiolo 223,239,594 66,520,000 289,759,594
Kajiado 269,530,882 211,099,530 41,696,126 522,326,538
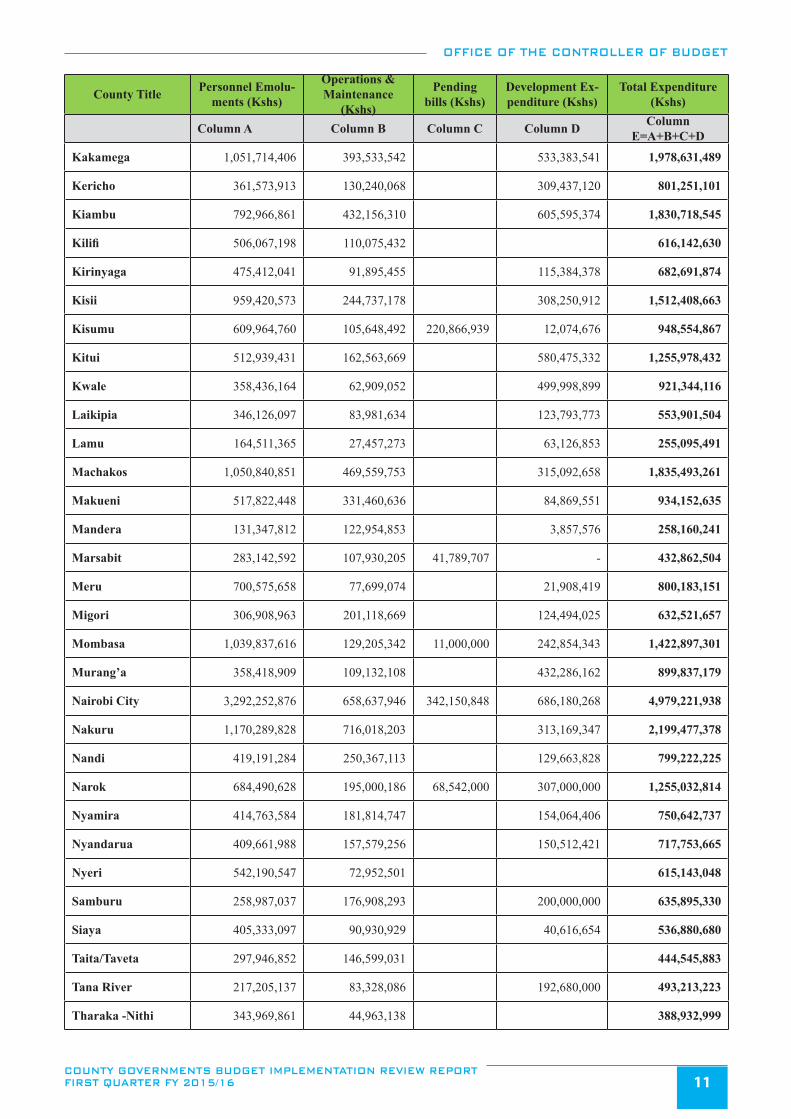
OFFICE OF THE CONTROLLER OF BUDGET
COUNTY GOVERNMENTS BUDGET IMPLEMENTATION REVIEW REPORT FIRST QUARTER FY 2015/16 11
County Title Personnel Emolu-ments (Kshs)
Operations & Maintenance
(Kshs)
Pending bills (Kshs)
Development Ex-penditure (Kshs)
Total Expenditure (Kshs)
Column A Column B Column C Column D Column E=A+B+C+D
Kakamega 1,051,714,406 393,533,542 533,383,541 1,978,631,489
Kericho 361,573,913 130,240,068 309,437,120 801,251,101
Kiambu 792,966,861 432,156,310 605,595,374 1,830,718,545
Kilifi 506,067,198 110,075,432 616,142,630
Kirinyaga 475,412,041 91,895,455 115,384,378 682,691,874
Kisii 959,420,573 244,737,178 308,250,912 1,512,408,663
Kisumu 609,964,760 105,648,492 220,866,939 12,074,676 948,554,867
Kitui 512,939,431 162,563,669 580,475,332 1,255,978,432
Kwale 358,436,164 62,909,052 499,998,899 921,344,116
Laikipia 346,126,097 83,981,634 123,793,773 553,901,504
Lamu 164,511,365 27,457,273 63,126,853 255,095,491
Machakos 1,050,840,851 469,559,753 315,092,658 1,835,493,261
Makueni 517,822,448 331,460,636 84,869,551 934,152,635
Mandera 131,347,812 122,954,853 3,857,576 258,160,241
Marsabit 283,142,592 107,930,205 41,789,707 - 432,862,504
Meru 700,575,658 77,699,074 21,908,419 800,183,151
Migori 306,908,963 201,118,669 124,494,025 632,521,657
Mombasa 1,039,837,616 129,205,342 11,000,000 242,854,343 1,422,897,301
Murang’a 358,418,909 109,132,108 432,286,162 899,837,179
Nairobi City 3,292,252,876 658,637,946 342,150,848 686,180,268 4,979,221,938
Nakuru 1,170,289,828 716,018,203 313,169,347 2,199,477,378
Nandi 419,191,284 250,367,113 129,663,828 799,222,225
Narok 684,490,628 195,000,186 68,542,000 307,000,000 1,255,032,814
Nyamira 414,763,584 181,814,747 154,064,406 750,642,737
Nyandarua 409,661,988 157,579,256 150,512,421 717,753,665
Nyeri 542,190,547 72,952,501 615,143,048
Samburu 258,987,037 176,908,293 200,000,000 635,895,330
Siaya 405,333,097 90,930,929 40,616,654 536,880,680
Taita/Taveta 297,946,852 146,599,031 444,545,883
Tana River 217,205,137 83,328,086 192,680,000 493,213,223
Tharaka -Nithi 343,969,861 44,963,138 388,932,999
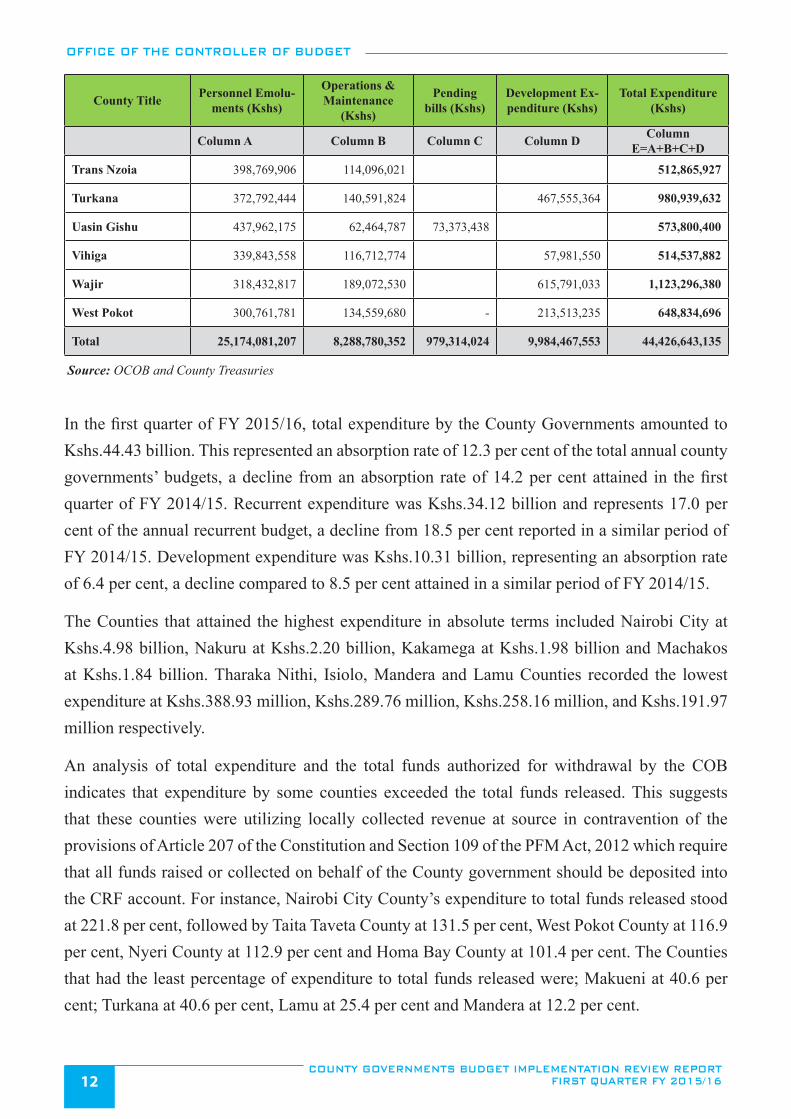
OFFICE OF THE CONTROLLER OF BUDGET
COUNTY GOVERNMENTS BUDGET IMPLEMENTATION REVIEW REPORT FIRST QUARTER FY 2015/1612
County Title Personnel Emolu-ments (Kshs)
Operations & Maintenance
(Kshs)
Pending bills (Kshs)
Development Ex-penditure (Kshs)
Total Expenditure (Kshs)
Column A Column B Column C Column D Column E=A+B+C+D
Trans Nzoia 398,769,906 114,096,021 512,865,927
Turkana 372,792,444 140,591,824 467,555,364 980,939,632
Uasin Gishu 437,962,175 62,464,787 73,373,438 573,800,400
Vihiga 339,843,558 116,712,774 57,981,550 514,537,882
Wajir 318,432,817 189,072,530 615,791,033 1,123,296,380
West Pokot 300,761,781 134,559,680 - 213,513,235 648,834,696
Total 25,174,081,207 8,288,780,352 979,314,024 9,984,467,553 44,426,643,135
Source: OCOB and County Treasuries
In the first quarter of FY 2015/16, total expenditure by the County Governments amounted to Kshs.44.43 billion. This represented an absorption rate of 12.3 per cent of the total annual county governments’ budgets, a decline from an absorption rate of 14.2 per cent attained in the first quarter of FY 2014/15. Recurrent expenditure was Kshs.34.12 billion and represents 17.0 per cent of the annual recurrent budget, a decline from 18.5 per cent reported in a similar period of FY 2014/15. Development expenditure was Kshs.10.31 billion, representing an absorption rate of 6.4 per cent, a decline compared to 8.5 per cent attained in a similar period of FY 2014/15.
The Counties that attained the highest expenditure in absolute terms included Nairobi City at Kshs.4.98 billion, Nakuru at Kshs.2.20 billion, Kakamega at Kshs.1.98 billion and Machakos at Kshs.1.84 billion. Tharaka Nithi, Isiolo, Mandera and Lamu Counties recorded the lowest expenditure at Kshs.388.93 million, Kshs.289.76 million, Kshs.258.16 million, and Kshs.191.97 million respectively.
An analysis of total expenditure and the total funds authorized for withdrawal by the COB indicates that expenditure by some counties exceeded the total funds released. This suggests that these counties were utilizing locally collected revenue at source in contravention of the provisions of Article 207 of the Constitution and Section 109 of the PFM Act, 2012 which require that all funds raised or collected on behalf of the County government should be deposited into the CRF account. For instance, Nairobi City County’s expenditure to total funds released stood at 221.8 per cent, followed by Taita Taveta County at 131.5 per cent, West Pokot County at 116.9 per cent, Nyeri County at 112.9 per cent and Homa Bay County at 101.4 per cent. The Counties that had the least percentage of expenditure to total funds released were; Makueni at 40.6 per cent; Turkana at 40.6 per cent, Lamu at 25.4 per cent and Mandera at 12.2 per cent.
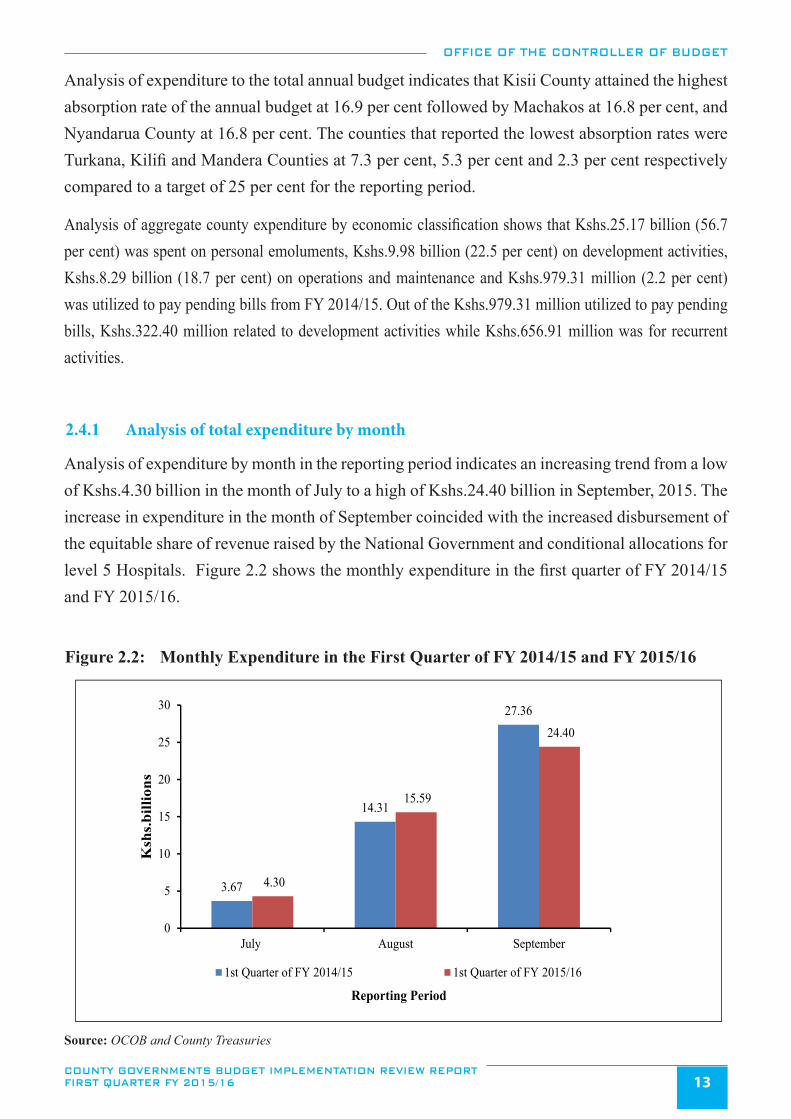
OFFICE OF THE CONTROLLER OF BUDGET
COUNTY GOVERNMENTS BUDGET IMPLEMENTATION REVIEW REPORT FIRST QUARTER FY 2015/16 13
Analysis of expenditure to the total annual budget indicates that Kisii County attained the highest absorption rate of the annual budget at 16.9 per cent followed by Machakos at 16.8 per cent, and Nyandarua County at 16.8 per cent. The counties that reported the lowest absorption rates were Turkana, Kilifi and Mandera Counties at 7.3 per cent, 5.3 per cent and 2.3 per cent respectively compared to a target of 25 per cent for the reporting period.
Analysis of aggregate county expenditure by economic classification shows that Kshs.25.17 billion (56.7 per cent) was spent on personal emoluments, Kshs.9.98 billion (22.5 per cent) on development activities, Kshs.8.29 billion (18.7 per cent) on operations and maintenance and Kshs.979.31 million (2.2 per cent) was utilized to pay pending bills from FY 2014/15. Out of the Kshs.979.31 million utilized to pay pending bills, Kshs.322.40 million related to development activities while Kshs.656.91 million was for recurrent activities.
2.4.1 Analysis of total expenditure by month
Analysis of expenditure by month in the reporting period indicates an increasing trend from a low of Kshs.4.30 billion in the month of July to a high of Kshs.24.40 billion in September, 2015. The increase in expenditure in the month of September coincided with the increased disbursement of the equitable share of revenue raised by the National Government and conditional allocations for level 5 Hospitals. Figure 2.2 shows the monthly expenditure in the first quarter of FY 2014/15 and FY 2015/16.
Figure 2.2: Monthly Expenditure in the First Quarter of FY 2014/15 and FY 2015/16
3.67
14.31
27.36
4.30
15.59
24.40
0
5
10
15
20
25
30
July August September
Ksh
s.bi
llion
s
Reporting Period
1st Quarter of FY 2014/15 1st Quarter of FY 2015/16
Source: OCOB and County Treasuries
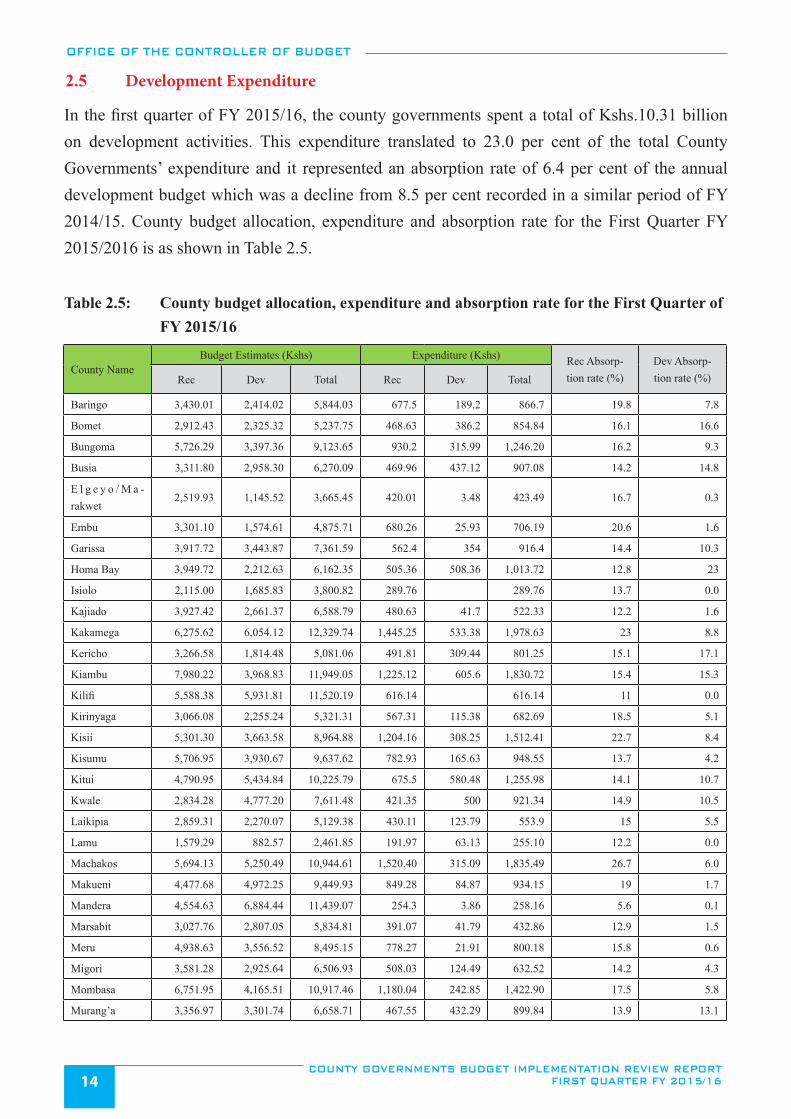
OFFICE OF THE CONTROLLER OF BUDGET
COUNTY GOVERNMENTS BUDGET IMPLEMENTATION REVIEW REPORT FIRST QUARTER FY 2015/1614
2.5 Development Expenditure
In the first quarter of FY 2015/16, the county governments spent a total of Kshs.10.31 billion on development activities. This expenditure translated to 23.0 per cent of the total County Governments’ expenditure and it represented an absorption rate of 6.4 per cent of the annual development budget which was a decline from 8.5 per cent recorded in a similar period of FY 2014/15. County budget allocation, expenditure and absorption rate for the First Quarter FY 2015/2016 is as shown in Table 2.5.
Table 2.5: County budget allocation, expenditure and absorption rate for the First Quarter of FY 2015/16
County NameBudget Estimates (Kshs) Expenditure (Kshs) Rec Absorp-
tion rate (%)Dev Absorp-tion rate (%)Rec Dev Total Rec Dev Total
Baringo 3,430.01 2,414.02 5,844.03 677.5 189.2 866.7 19.8 7.8
Bomet 2,912.43 2,325.32 5,237.75 468.63 386.2 854.84 16.1 16.6
Bungoma 5,726.29 3,397.36 9,123.65 930.2 315.99 1,246.20 16.2 9.3
Busia 3,311.80 2,958.30 6,270.09 469.96 437.12 907.08 14.2 14.8
E l g e y o / M a -rakwet
2,519.93 1,145.52 3,665.45 420.01 3.48 423.49 16.7 0.3
Embu 3,301.10 1,574.61 4,875.71 680.26 25.93 706.19 20.6 1.6
Garissa 3,917.72 3,443.87 7,361.59 562.4 354 916.4 14.4 10.3
Homa Bay 3,949.72 2,212.63 6,162.35 505.36 508.36 1,013.72 12.8 23
Isiolo 2,115.00 1,685.83 3,800.82 289.76 289.76 13.7 0.0
Kajiado 3,927.42 2,661.37 6,588.79 480.63 41.7 522.33 12.2 1.6
Kakamega 6,275.62 6,054.12 12,329.74 1,445.25 533.38 1,978.63 23 8.8
Kericho 3,266.58 1,814.48 5,081.06 491.81 309.44 801.25 15.1 17.1
Kiambu 7,980.22 3,968.83 11,949.05 1,225.12 605.6 1,830.72 15.4 15.3
Kilifi 5,588.38 5,931.81 11,520.19 616.14 616.14 11 0.0
Kirinyaga 3,066.08 2,255.24 5,321.31 567.31 115.38 682.69 18.5 5.1
Kisii 5,301.30 3,663.58 8,964.88 1,204.16 308.25 1,512.41 22.7 8.4
Kisumu 5,706.95 3,930.67 9,637.62 782.93 165.63 948.55 13.7 4.2
Kitui 4,790.95 5,434.84 10,225.79 675.5 580.48 1,255.98 14.1 10.7
Kwale 2,834.28 4,777.20 7,611.48 421.35 500 921.34 14.9 10.5
Laikipia 2,859.31 2,270.07 5,129.38 430.11 123.79 553.9 15 5.5
Lamu 1,579.29 882.57 2,461.85 191.97 63.13 255.10 12.2 0.0
Machakos 5,694.13 5,250.49 10,944.61 1,520.40 315.09 1,835.49 26.7 6.0
Makueni 4,477.68 4,972.25 9,449.93 849.28 84.87 934.15 19 1.7
Mandera 4,554.63 6,884.44 11,439.07 254.3 3.86 258.16 5.6 0.1
Marsabit 3,027.76 2,807.05 5,834.81 391.07 41.79 432.86 12.9 1.5
Meru 4,938.63 3,556.52 8,495.15 778.27 21.91 800.18 15.8 0.6
Migori 3,581.28 2,925.64 6,506.93 508.03 124.49 632.52 14.2 4.3
Mombasa 6,751.95 4,165.51 10,917.46 1,180.04 242.85 1,422.90 17.5 5.8
Murang’a 3,356.97 3,301.74 6,658.71 467.55 432.29 899.84 13.9 13.1
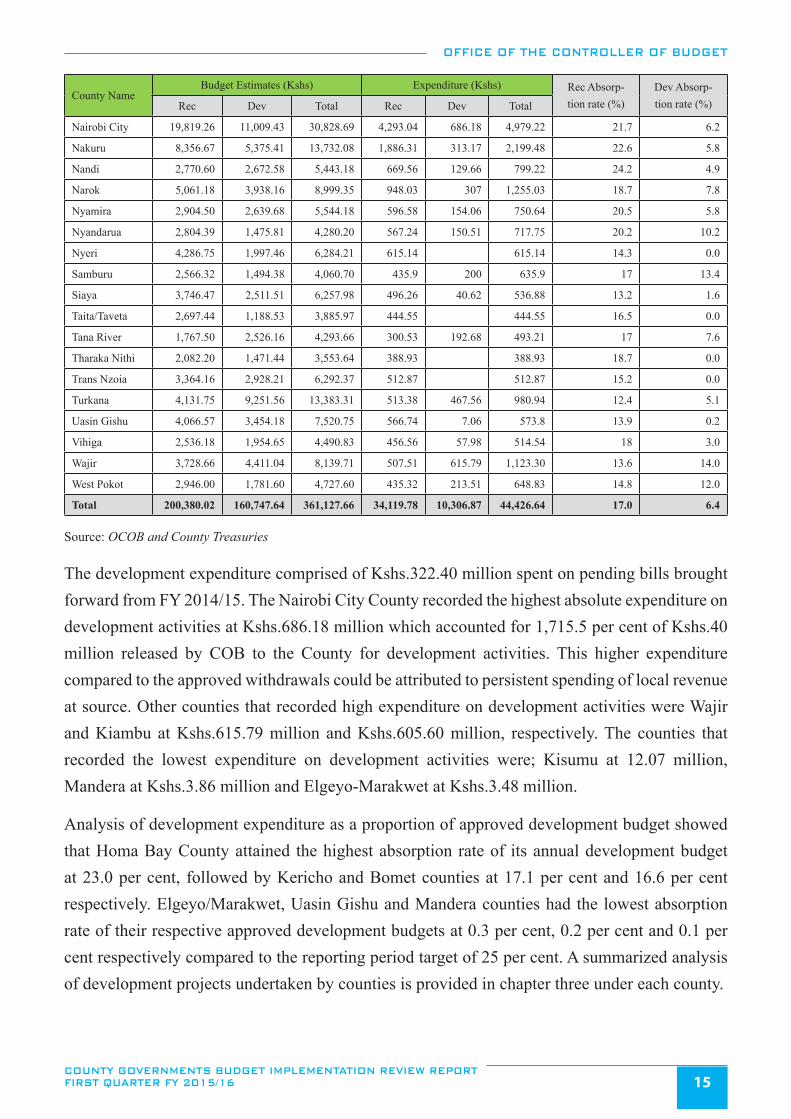
OFFICE OF THE CONTROLLER OF BUDGET
COUNTY GOVERNMENTS BUDGET IMPLEMENTATION REVIEW REPORT FIRST QUARTER FY 2015/16 15
Source: OCOB and County Treasuries
The development expenditure comprised of Kshs.322.40 million spent on pending bills brought forward from FY 2014/15. The Nairobi City County recorded the highest absolute expenditure on development activities at Kshs.686.18 million which accounted for 1,715.5 per cent of Kshs.40 million released by COB to the County for development activities. This higher expenditure compared to the approved withdrawals could be attributed to persistent spending of local revenue at source. Other counties that recorded high expenditure on development activities were Wajir and Kiambu at Kshs.615.79 million and Kshs.605.60 million, respectively. The counties that recorded the lowest expenditure on development activities were; Kisumu at 12.07 million, Mandera at Kshs.3.86 million and Elgeyo-Marakwet at Kshs.3.48 million.
Analysis of development expenditure as a proportion of approved development budget showed that Homa Bay County attained the highest absorption rate of its annual development budget at 23.0 per cent, followed by Kericho and Bomet counties at 17.1 per cent and 16.6 per cent respectively. Elgeyo/Marakwet, Uasin Gishu and Mandera counties had the lowest absorption rate of their respective approved development budgets at 0.3 per cent, 0.2 per cent and 0.1 per cent respectively compared to the reporting period target of 25 per cent. A summarized analysis of development projects undertaken by counties is provided in chapter three under each county.
County NameBudget Estimates (Kshs) Expenditure (Kshs) Rec Absorp-
tion rate (%)Dev Absorp-tion rate (%)Rec Dev Total Rec Dev Total
Nairobi City 19,819.26 11,009.43 30,828.69 4,293.04 686.18 4,979.22 21.7 6.2
Nakuru 8,356.67 5,375.41 13,732.08 1,886.31 313.17 2,199.48 22.6 5.8
Nandi 2,770.60 2,672.58 5,443.18 669.56 129.66 799.22 24.2 4.9
Narok 5,061.18 3,938.16 8,999.35 948.03 307 1,255.03 18.7 7.8
Nyamira 2,904.50 2,639.68 5,544.18 596.58 154.06 750.64 20.5 5.8
Nyandarua 2,804.39 1,475.81 4,280.20 567.24 150.51 717.75 20.2 10.2
Nyeri 4,286.75 1,997.46 6,284.21 615.14 615.14 14.3 0.0
Samburu 2,566.32 1,494.38 4,060.70 435.9 200 635.9 17 13.4
Siaya 3,746.47 2,511.51 6,257.98 496.26 40.62 536.88 13.2 1.6
Taita/Taveta 2,697.44 1,188.53 3,885.97 444.55 444.55 16.5 0.0
Tana River 1,767.50 2,526.16 4,293.66 300.53 192.68 493.21 17 7.6
Tharaka Nithi 2,082.20 1,471.44 3,553.64 388.93 388.93 18.7 0.0
Trans Nzoia 3,364.16 2,928.21 6,292.37 512.87 512.87 15.2 0.0
Turkana 4,131.75 9,251.56 13,383.31 513.38 467.56 980.94 12.4 5.1
Uasin Gishu 4,066.57 3,454.18 7,520.75 566.74 7.06 573.8 13.9 0.2
Vihiga 2,536.18 1,954.65 4,490.83 456.56 57.98 514.54 18 3.0
Wajir 3,728.66 4,411.04 8,139.71 507.51 615.79 1,123.30 13.6 14.0
West Pokot 2,946.00 1,781.60 4,727.60 435.32 213.51 648.83 14.8 12.0
Total 200,380.02 160,747.64 361,127.66 34,119.78 10,306.87 44,426.64 17.0 6.4
OFFICE OF THE CONTROLLER OF BUDGET
COUNTY GOVERNMENTS BUDGET IMPLEMENTATION REVIEW REPORT FIRST QUARTER FY 2015/1616
2.6 Recurrent Expenditure
During the reporting period, the county governments spent an aggregate of Kshs.34.12 billion on recurrent activities. This expenditure comprised of Kshs.656.91 million on pending bills related to recurrent expenditure from FY 2014/15.
The recurrent expenditure translated to 76.8 per cent of the total expenditure and represented an absorption rate of 17.0 per cent of the annual recurrent budget, which was a decline from 18.6 per cent recorded in a similar period of FY 2014/15.
The counties that reported the highest expenditure on recurrent activities were Nairobi City at Kshs.4.29 billion followed by Nakuru and Machakos at Kshs.1.89 billion and Kshs.1.52 billion respectively while Isiolo, Mandera and Lamu reported the lowest recurrent expenditure at Kshs.289.76 million, Kshs.254.30 million and Kshs.191.97 million respectively.
In the same period, Machakos County reported the highest expenditure to its approved recurrent budget estimate at 26.7 per cent followed by Nandi at 24.2 per cent and Kakamega at 23.0 per cent. The counties that registered the lowest expenditure to their respective Approved Budget Estimates were Lamu at 12.2 per cent, Kilifi at 11.0 per cent and Kisumu at 5.6 per cent. The target performance for the period was 25 per cent.
2.6.1 Personnel Emoluments
The county governments spent a total of Kshs.25.17 billion on personnel emoluments, which translated to 56.2 per cent of aggregate County Governments’ expenditure for the period compared 51.2 per cent reported in a similar period of FY 2014/15. The Counties that reported the highest expenditure on personnel emoluments were Nairobi City at Kshs.3.29 billion followed by Nakuru at Kshs.1.17 billion and Kakamega at Kshs.1.05 billion. Tana River, Lamu and Mandera Counties incurred the lowest expenditure on personnel emoluments at Kshs.217.21 million, Kshs.164.51 million and Kshs.131.35 million respectively.
Analysis of personnel emoluments as a proportion of the total recurrent expenditure showed that Embu County recorded the highest proportion at 88.6 per cent followed by Tharaka Nithi County at 88.4 per cent and Nyeri County at 88.1 per cent. Turkana, Wajir and Homa Bay Counties had the lowest proportion of their expenditure on personnel emoluments at 38.0 per cent, 28.3 per cent and 24.5 per cent, respectively.
OFFICE OF THE CONTROLLER OF BUDGET
COUNTY GOVERNMENTS BUDGET IMPLEMENTATION REVIEW REPORT FIRST QUARTER FY 2015/16 17
2.6.2 Operations and Maintenance
On aggregate, the County governments spent a total of Kshs.8.29 billion on operations and maintenance, which represented 18.7 per cent of the total county governments’ recurrent expenditure for the period under review. Nakuru County registered the highest expenditure on operations and maintenance at Kshs.716.02 million followed by Nairobi City County at Kshs.658.64 million, and Machakos County at Kshs.469.56 million. The counties that reported the least expenditure on operations and maintenance were Tharaka Nithi, Garissa and Lamu at Kshs.44.96 million, Kshs.29.28 million and Kshs.27.46 million, respectively.
Analysis of expenditure on operations and maintenance expenditure as a percentage of total expenditure incurred in the reporting period indicates that Mandera County attained the highest percentage of operations and maintenance to the total recurrent expenditure at 47.6 per cent followed by Kajiado County at 40.4 per cent and Makueni County at 35.5 per cent. Those that attained the lowest percentage were Embu at 7.8 per cent, Kwale at 6.8 per cent and Garissa at 3.2 per cent.
2.6.3 Analysis of MCAs Sitting Allowances
During the reporting period, the County Assemblies spent a total of Kshs.632.91 million on MCAs’ sitting allowances. This expenditure translated to 17.4 per cent of the approved annual allocation for MCAs’ sitting allowances, compared to 18.4 per cent reported in the similar period of FY 2014/15 when expenditure on MCAs’ sitting allowances was Kshs.599.73 million. The analysis of MCAs’ sitting allowances for the first quarter of FY 2015/16 does not include expenditure returns for Vihiga and Nyamira County Assemblies. The Vihiga County Treasury did not provide the expenditure on MCA’s siting allowances while Nyamira County report indicated that the members had not been paid any sitting allowances during the first quarter of FY 2015/16 even though the County Assembly was in session throughout the reporting period.
Table 2.6 shows the budgetary allocation and the expenditure for MCAs’ including Speakers’ sitting allowance during the period under review.
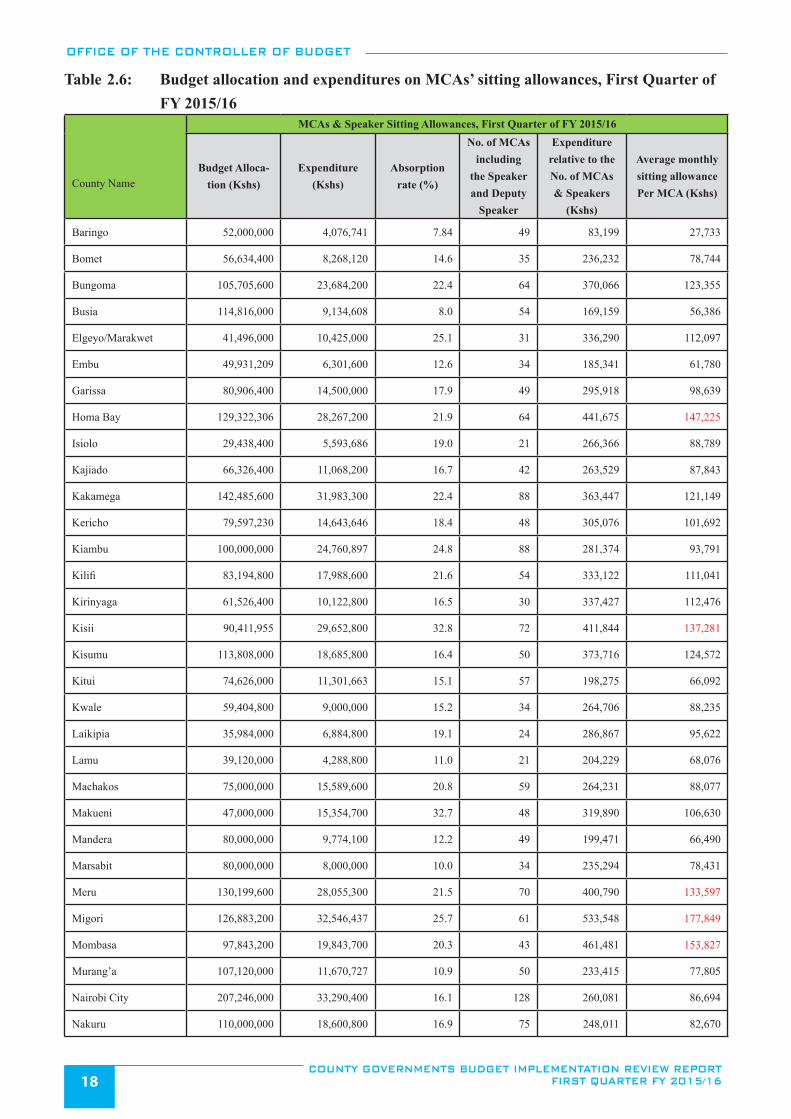
OFFICE OF THE CONTROLLER OF BUDGET
COUNTY GOVERNMENTS BUDGET IMPLEMENTATION REVIEW REPORT FIRST QUARTER FY 2015/1618
Table 2.6: Budget allocation and expenditures on MCAs’ sitting allowances, First Quarter of FY 2015/16
County Name
MCAs & Speaker Sitting Allowances, First Quarter of FY 2015/16
Budget Alloca-tion (Kshs)
Expenditure (Kshs)
Absorption rate (%)
No. of MCAs including
the Speaker and Deputy
Speaker
Expenditure relative to the No. of MCAs & Speakers
(Kshs)
Average monthly sitting allowance Per MCA (Kshs)
Baringo 52,000,000 4,076,741 7.84 49 83,199 27,733
Bomet 56,634,400 8,268,120 14.6 35 236,232 78,744
Bungoma 105,705,600 23,684,200 22.4 64 370,066 123,355
Busia 114,816,000 9,134,608 8.0 54 169,159 56,386
Elgeyo/Marakwet 41,496,000 10,425,000 25.1 31 336,290 112,097
Embu 49,931,209 6,301,600 12.6 34 185,341 61,780
Garissa 80,906,400 14,500,000 17.9 49 295,918 98,639
Homa Bay 129,322,306 28,267,200 21.9 64 441,675 147,225
Isiolo 29,438,400 5,593,686 19.0 21 266,366 88,789
Kajiado 66,326,400 11,068,200 16.7 42 263,529 87,843
Kakamega 142,485,600 31,983,300 22.4 88 363,447 121,149
Kericho 79,597,230 14,643,646 18.4 48 305,076 101,692
Kiambu 100,000,000 24,760,897 24.8 88 281,374 93,791
Kilifi 83,194,800 17,988,600 21.6 54 333,122 111,041
Kirinyaga 61,526,400 10,122,800 16.5 30 337,427 112,476
Kisii 90,411,955 29,652,800 32.8 72 411,844 137,281
Kisumu 113,808,000 18,685,800 16.4 50 373,716 124,572
Kitui 74,626,000 11,301,663 15.1 57 198,275 66,092
Kwale 59,404,800 9,000,000 15.2 34 264,706 88,235
Laikipia 35,984,000 6,884,800 19.1 24 286,867 95,622
Lamu 39,120,000 4,288,800 11.0 21 204,229 68,076
Machakos 75,000,000 15,589,600 20.8 59 264,231 88,077
Makueni 47,000,000 15,354,700 32.7 48 319,890 106,630
Mandera 80,000,000 9,774,100 12.2 49 199,471 66,490
Marsabit 80,000,000 8,000,000 10.0 34 235,294 78,431
Meru 130,199,600 28,055,300 21.5 70 400,790 133,597
Migori 126,883,200 32,546,437 25.7 61 533,548 177,849
Mombasa 97,843,200 19,843,700 20.3 43 461,481 153,827
Murang’a 107,120,000 11,670,727 10.9 50 233,415 77,805
Nairobi City 207,246,000 33,290,400 16.1 128 260,081 86,694
Nakuru 110,000,000 18,600,800 16.9 75 248,011 82,670
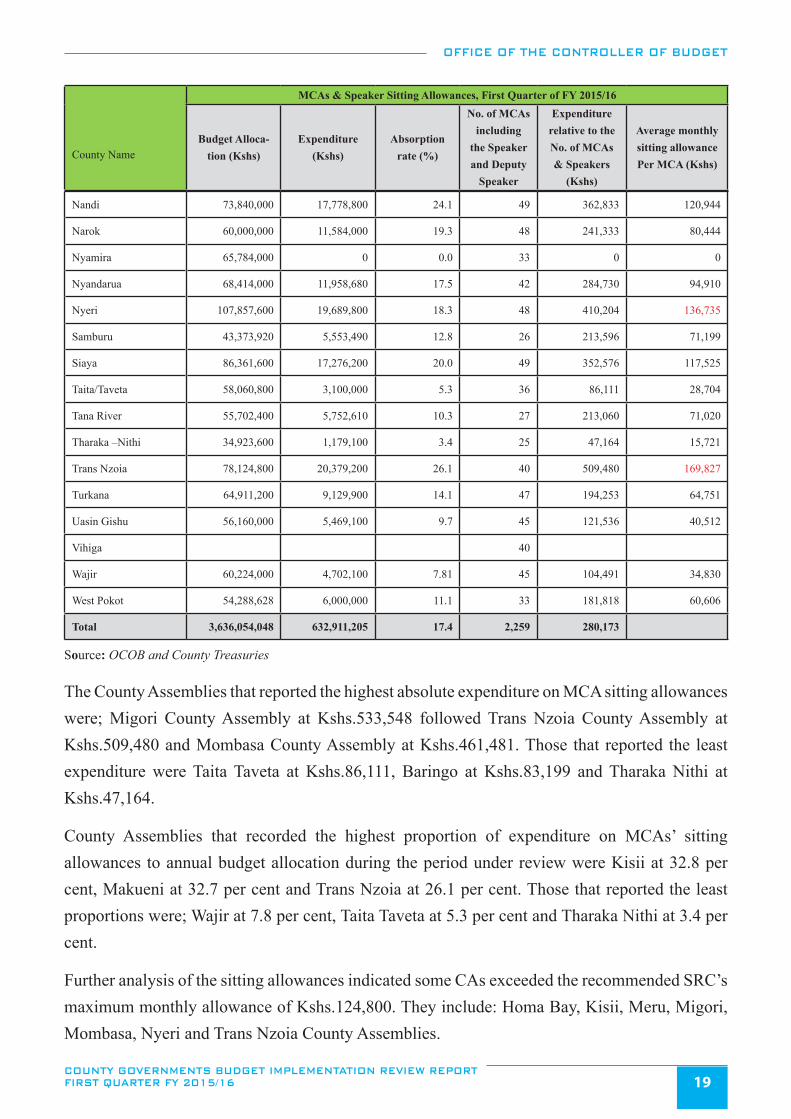
OFFICE OF THE CONTROLLER OF BUDGET
COUNTY GOVERNMENTS BUDGET IMPLEMENTATION REVIEW REPORT FIRST QUARTER FY 2015/16 19
Nandi 73,840,000 17,778,800 24.1 49 362,833 120,944
Narok 60,000,000 11,584,000 19.3 48 241,333 80,444
Nyamira 65,784,000 0 0.0 33 0 0
Nyandarua 68,414,000 11,958,680 17.5 42 284,730 94,910
Nyeri 107,857,600 19,689,800 18.3 48 410,204 136,735
Samburu 43,373,920 5,553,490 12.8 26 213,596 71,199
Siaya 86,361,600 17,276,200 20.0 49 352,576 117,525
Taita/Taveta 58,060,800 3,100,000 5.3 36 86,111 28,704
Tana River 55,702,400 5,752,610 10.3 27 213,060 71,020
Tharaka –Nithi 34,923,600 1,179,100 3.4 25 47,164 15,721
Trans Nzoia 78,124,800 20,379,200 26.1 40 509,480 169,827
Turkana 64,911,200 9,129,900 14.1 47 194,253 64,751
Uasin Gishu 56,160,000 5,469,100 9.7 45 121,536 40,512
Vihiga 40
Wajir 60,224,000 4,702,100 7.81 45 104,491 34,830
West Pokot 54,288,628 6,000,000 11.1 33 181,818 60,606
Total 3,636,054,048 632,911,205 17.4 2,259 280,173
Source: OCOB and County Treasuries
The County Assemblies that reported the highest absolute expenditure on MCA sitting allowances were; Migori County Assembly at Kshs.533,548 followed Trans Nzoia County Assembly at Kshs.509,480 and Mombasa County Assembly at Kshs.461,481. Those that reported the least expenditure were Taita Taveta at Kshs.86,111, Baringo at Kshs.83,199 and Tharaka Nithi at Kshs.47,164.
County Assemblies that recorded the highest proportion of expenditure on MCAs’ sitting allowances to annual budget allocation during the period under review were Kisii at 32.8 per cent, Makueni at 32.7 per cent and Trans Nzoia at 26.1 per cent. Those that reported the least proportions were; Wajir at 7.8 per cent, Taita Taveta at 5.3 per cent and Tharaka Nithi at 3.4 per cent.
Further analysis of the sitting allowances indicated some CAs exceeded the recommended SRC’s maximum monthly allowance of Kshs.124,800. They include: Homa Bay, Kisii, Meru, Migori, Mombasa, Nyeri and Trans Nzoia County Assemblies.
County Name
MCAs & Speaker Sitting Allowances, First Quarter of FY 2015/16
Budget Alloca-tion (Kshs)
Expenditure (Kshs)
Absorption rate (%)
No. of MCAs including
the Speaker and Deputy
Speaker
Expenditure relative to the No. of MCAs & Speakers
(Kshs)
Average monthly sitting allowance Per MCA (Kshs)
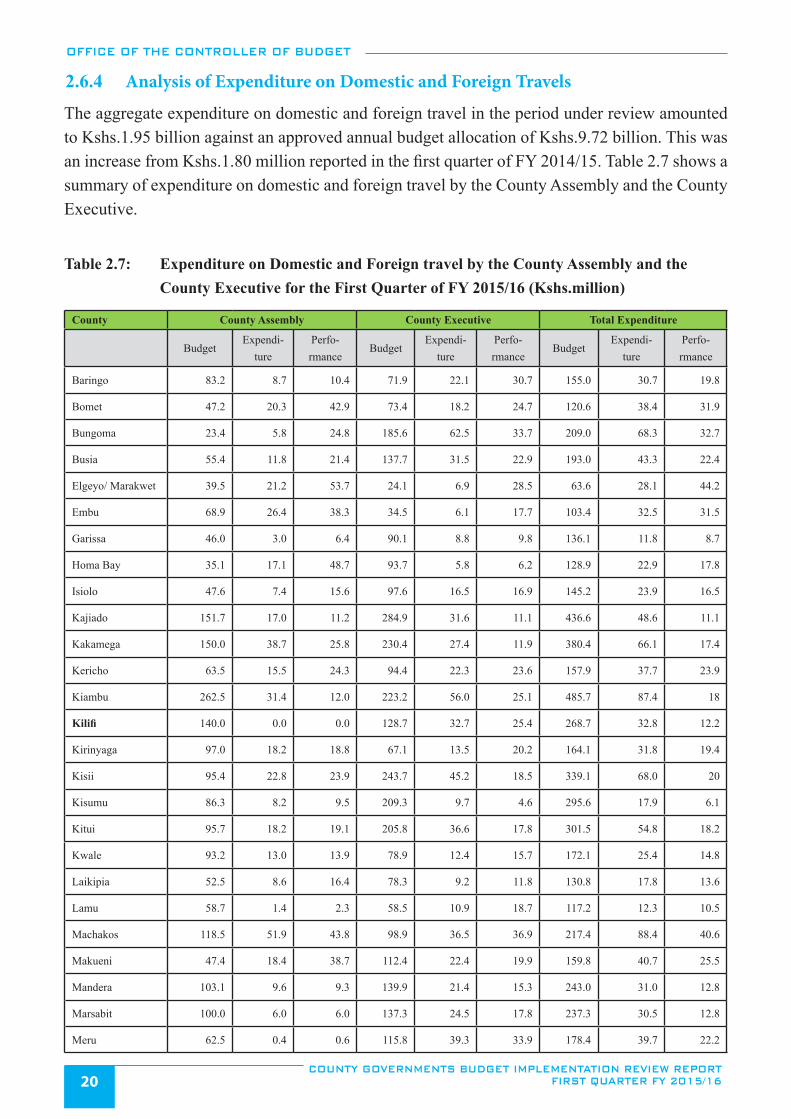
OFFICE OF THE CONTROLLER OF BUDGET
COUNTY GOVERNMENTS BUDGET IMPLEMENTATION REVIEW REPORT FIRST QUARTER FY 2015/1620
2.6.4 Analysis of Expenditure on Domestic and Foreign Travels
The aggregate expenditure on domestic and foreign travel in the period under review amounted to Kshs.1.95 billion against an approved annual budget allocation of Kshs.9.72 billion. This was an increase from Kshs.1.80 million reported in the first quarter of FY 2014/15. Table 2.7 shows a summary of expenditure on domestic and foreign travel by the County Assembly and the County Executive.
Table 2.7: Expenditure on Domestic and Foreign travel by the County Assembly and the County Executive for the First Quarter of FY 2015/16 (Kshs.million)
County County Assembly County Executive Total Expenditure
BudgetExpendi-
turePerfo-rmance
BudgetExpendi-
turePerfo-rmance
BudgetExpendi-
turePerfo-rmance
Baringo 83.2 8.7 10.4 71.9 22.1 30.7 155.0 30.7 19.8
Bomet 47.2 20.3 42.9 73.4 18.2 24.7 120.6 38.4 31.9
Bungoma 23.4 5.8 24.8 185.6 62.5 33.7 209.0 68.3 32.7
Busia 55.4 11.8 21.4 137.7 31.5 22.9 193.0 43.3 22.4
Elgeyo/ Marakwet 39.5 21.2 53.7 24.1 6.9 28.5 63.6 28.1 44.2
Embu 68.9 26.4 38.3 34.5 6.1 17.7 103.4 32.5 31.5
Garissa 46.0 3.0 6.4 90.1 8.8 9.8 136.1 11.8 8.7
Homa Bay 35.1 17.1 48.7 93.7 5.8 6.2 128.9 22.9 17.8
Isiolo 47.6 7.4 15.6 97.6 16.5 16.9 145.2 23.9 16.5
Kajiado 151.7 17.0 11.2 284.9 31.6 11.1 436.6 48.6 11.1
Kakamega 150.0 38.7 25.8 230.4 27.4 11.9 380.4 66.1 17.4
Kericho 63.5 15.5 24.3 94.4 22.3 23.6 157.9 37.7 23.9
Kiambu 262.5 31.4 12.0 223.2 56.0 25.1 485.7 87.4 18
Kilifi 140.0 0.0 0.0 128.7 32.7 25.4 268.7 32.8 12.2
Kirinyaga 97.0 18.2 18.8 67.1 13.5 20.2 164.1 31.8 19.4
Kisii 95.4 22.8 23.9 243.7 45.2 18.5 339.1 68.0 20
Kisumu 86.3 8.2 9.5 209.3 9.7 4.6 295.6 17.9 6.1
Kitui 95.7 18.2 19.1 205.8 36.6 17.8 301.5 54.8 18.2
Kwale 93.2 13.0 13.9 78.9 12.4 15.7 172.1 25.4 14.8
Laikipia 52.5 8.6 16.4 78.3 9.2 11.8 130.8 17.8 13.6
Lamu 58.7 1.4 2.3 58.5 10.9 18.7 117.2 12.3 10.5
Machakos 118.5 51.9 43.8 98.9 36.5 36.9 217.4 88.4 40.6
Makueni 47.4 18.4 38.7 112.4 22.4 19.9 159.8 40.7 25.5
Mandera 103.1 9.6 9.3 139.9 21.4 15.3 243.0 31.0 12.8
Marsabit 100.0 6.0 6.0 137.3 24.5 17.8 237.3 30.5 12.8
Meru 62.5 0.4 0.6 115.8 39.3 33.9 178.4 39.7 22.2
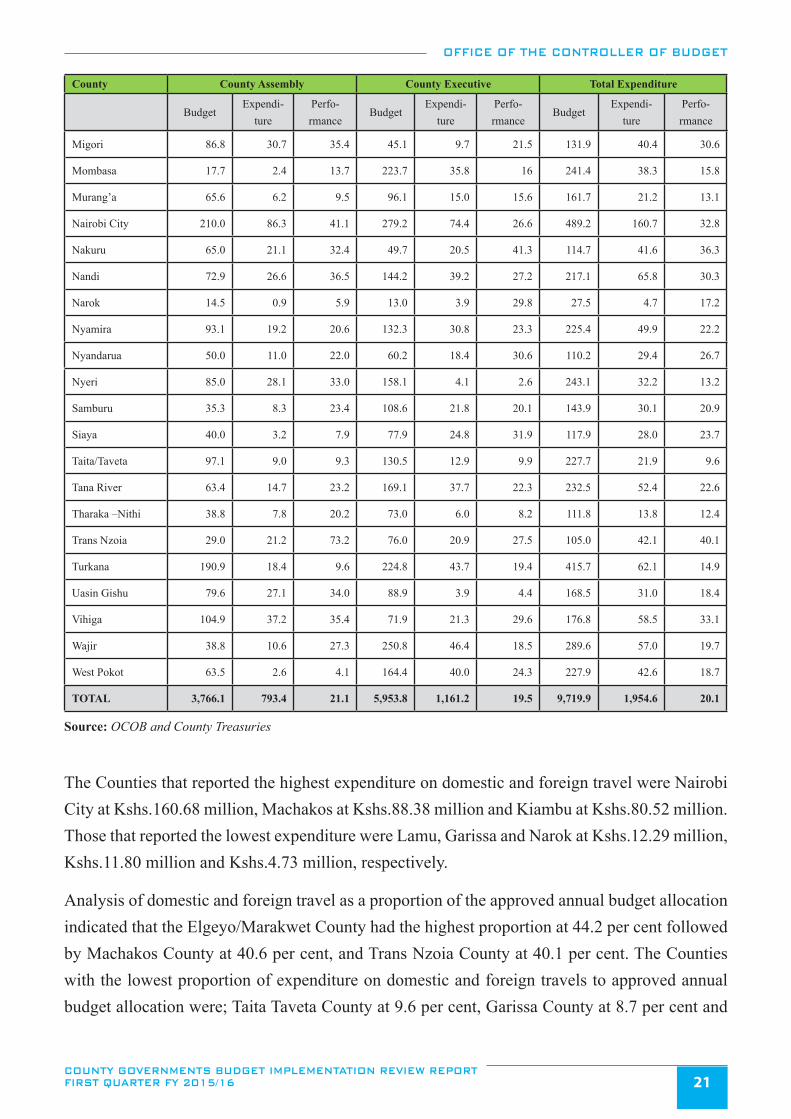
OFFICE OF THE CONTROLLER OF BUDGET
COUNTY GOVERNMENTS BUDGET IMPLEMENTATION REVIEW REPORT FIRST QUARTER FY 2015/16 21
Migori 86.8 30.7 35.4 45.1 9.7 21.5 131.9 40.4 30.6
Mombasa 17.7 2.4 13.7 223.7 35.8 16 241.4 38.3 15.8
Murang’a 65.6 6.2 9.5 96.1 15.0 15.6 161.7 21.2 13.1
Nairobi City 210.0 86.3 41.1 279.2 74.4 26.6 489.2 160.7 32.8
Nakuru 65.0 21.1 32.4 49.7 20.5 41.3 114.7 41.6 36.3
Nandi 72.9 26.6 36.5 144.2 39.2 27.2 217.1 65.8 30.3
Narok 14.5 0.9 5.9 13.0 3.9 29.8 27.5 4.7 17.2
Nyamira 93.1 19.2 20.6 132.3 30.8 23.3 225.4 49.9 22.2
Nyandarua 50.0 11.0 22.0 60.2 18.4 30.6 110.2 29.4 26.7
Nyeri 85.0 28.1 33.0 158.1 4.1 2.6 243.1 32.2 13.2
Samburu 35.3 8.3 23.4 108.6 21.8 20.1 143.9 30.1 20.9
Siaya 40.0 3.2 7.9 77.9 24.8 31.9 117.9 28.0 23.7
Taita/Taveta 97.1 9.0 9.3 130.5 12.9 9.9 227.7 21.9 9.6
Tana River 63.4 14.7 23.2 169.1 37.7 22.3 232.5 52.4 22.6
Tharaka –Nithi 38.8 7.8 20.2 73.0 6.0 8.2 111.8 13.8 12.4
Trans Nzoia 29.0 21.2 73.2 76.0 20.9 27.5 105.0 42.1 40.1
Turkana 190.9 18.4 9.6 224.8 43.7 19.4 415.7 62.1 14.9
Uasin Gishu 79.6 27.1 34.0 88.9 3.9 4.4 168.5 31.0 18.4
Vihiga 104.9 37.2 35.4 71.9 21.3 29.6 176.8 58.5 33.1
Wajir 38.8 10.6 27.3 250.8 46.4 18.5 289.6 57.0 19.7
West Pokot 63.5 2.6 4.1 164.4 40.0 24.3 227.9 42.6 18.7
TOTAL 3,766.1 793.4 21.1 5,953.8 1,161.2 19.5 9,719.9 1,954.6 20.1
Source: OCOB and County Treasuries
The Counties that reported the highest expenditure on domestic and foreign travel were Nairobi City at Kshs.160.68 million, Machakos at Kshs.88.38 million and Kiambu at Kshs.80.52 million. Those that reported the lowest expenditure were Lamu, Garissa and Narok at Kshs.12.29 million, Kshs.11.80 million and Kshs.4.73 million, respectively.
Analysis of domestic and foreign travel as a proportion of the approved annual budget allocation indicated that the Elgeyo/Marakwet County had the highest proportion at 44.2 per cent followed by Machakos County at 40.6 per cent, and Trans Nzoia County at 40.1 per cent. The Counties with the lowest proportion of expenditure on domestic and foreign travels to approved annual budget allocation were; Taita Taveta County at 9.6 per cent, Garissa County at 8.7 per cent and
County County Assembly County Executive Total Expenditure
BudgetExpendi-
turePerfo-rmance
BudgetExpendi-
turePerfo-rmance
BudgetExpendi-
turePerfo-rmance
OFFICE OF THE CONTROLLER OF BUDGET
COUNTY GOVERNMENTS BUDGET IMPLEMENTATION REVIEW REPORT FIRST QUARTER FY 2015/1622
Kisumu County at 6.1 per cent.
2.6.5 Expenditure on Pending bills
In the first quarter of FY 2015/16, the county governments spent an aggregate of Kshs.979.31 million on pending bills related to recurrent and development activities from FY 2014/15. This represented 2.2 per cent of the total expenditure for the period under review and an increase compared to 0.9 per cent reported in a similar period of FY 2014/15. The counties that incurred expenditure on pending bills were; (i) Nairobi City at Kshs.342.15 million, (ii) Kisumu at Kshs.220.87 million, (iii) Homa Bay at Kshs.220 million, (iv) Uasin Gishu at Kshs.73.37 million, (v) Narok at Kshs.68.54 million, (vi) Marsabit at Kshs.41.79 million, (vii) Mombasa at Kshs.11 million, and (viii) Baringo at Kshs.1.59 million.
Analysis of expenditure on pending bills as a percentage of the total expenditure incurred in the reporting period indicates that, Kisumu County incurred the highest percentage of expenditure on pending bills to its total expenditure at 23.3 per cent followed by Homa Bay County at 21.7 per cent and Uasin Gishu County at 12.8 per cent. Out of the eight counties that incurred expenditure on pending bills, Marsabit, Mombasa and Baringo Counties had the least percentage of expenditure at 5.1 per cent, 0.8 per cent and 0.2 per cent respectively.
OFFICE OF THE CONTROLLER OF BUDGET
COUNTY GOVERNMENTS BUDGET IMPLEMENTATION REVIEW REPORT FIRST QUARTER FY 2015/16 23
3.0 INDIVIDUAL COUNTY BUDGET PERFORMANCE 3.1 Introduction
This chapter provides individual County budget performance during the First Quarter of FY 2015/16. The 47 counties are presented in alphabetical order.
3.2 Baringo County
3.2.1 Overview of the FY 2015/16 Budget
During the FY 2015/16, the approved budget for Baringo County was Kshs.5.84 billion, with Kshs.3.43 billion (58.7 per cent) allocated to recurrent expenditure and Kshs.2.41 billion (41.3 per cent) to development expenditure.
In order to finance the budget, the County expects to receive Kshs.4.44 billion (76.0 per cent) as transfers from the National Government and collect Kshs.300 million (5.1 per cent) from local sources. The County also expects to receive Kshs.95.74 million (1.6 per cent) as conditional allocation for leasing of medical equipment, Kshs.65.75 million (1.1 per cent) as conditional allocation for maternal healthcare, Kshs.56.41 million (9.7 per cent) as conditional allocations for Roads Maintenance Fuel Levy Fund.
The County also expects to receive Kshs.17.22 million (0.3per cent) as a World Bank support to Health Facilities, Kshs.25.97 million (0.4 per cent) as a conditional grant from DANIDA to supplement financing for county health facilities, and Kshs.831.91 million (14.2 per cent) as projected cash balance from FY 2014/15. 3.2.2 Revenue Analysis
During the period under review, the County received Kshs.355.25 million from the National Government as a direct transfer to the CRF account, raised Kshs.77.32 million from local sources, and had Kshs.831.91 million as actual cash balance brought forward from FY 2014/15. The local revenue raised in the first quarter of FY 2015/16 was Kshs.77.32 million which was an improvement from Kshs.72.86 million collected in FY 2014/15, and accounted for 25.8 per cent of the annual local revenue target. Figure 3.1 shows the trend of local revenue for each quarter from the first quarter of FY 2013/14 to the first quarter of FY 2015/16.
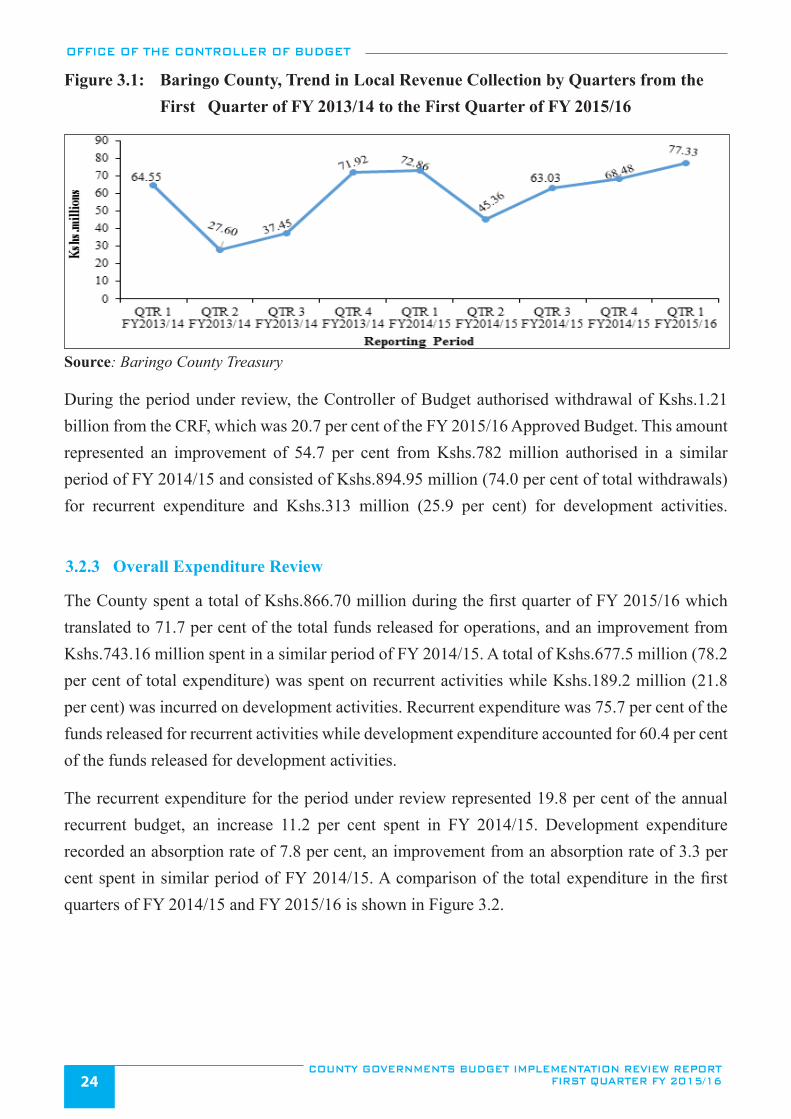
OFFICE OF THE CONTROLLER OF BUDGET
COUNTY GOVERNMENTS BUDGET IMPLEMENTATION REVIEW REPORT FIRST QUARTER FY 2015/1624
Figure 3.1: Baringo County, Trend in Local Revenue Collection by Quarters from the First Quarter of FY 2013/14 to the First Quarter of FY 2015/16
Source: Baringo County Treasury
During the period under review, the Controller of Budget authorised withdrawal of Kshs.1.21 billion from the CRF, which was 20.7 per cent of the FY 2015/16 Approved Budget. This amount represented an improvement of 54.7 per cent from Kshs.782 million authorised in a similar period of FY 2014/15 and consisted of Kshs.894.95 million (74.0 per cent of total withdrawals) for recurrent expenditure and Kshs.313 million (25.9 per cent) for development activities.
3.2.3 Overall Expenditure Review
The County spent a total of Kshs.866.70 million during the first quarter of FY 2015/16 which translated to 71.7 per cent of the total funds released for operations, and an improvement from Kshs.743.16 million spent in a similar period of FY 2014/15. A total of Kshs.677.5 million (78.2 per cent of total expenditure) was spent on recurrent activities while Kshs.189.2 million (21.8 per cent) was incurred on development activities. Recurrent expenditure was 75.7 per cent of the funds released for recurrent activities while development expenditure accounted for 60.4 per cent of the funds released for development activities.
The recurrent expenditure for the period under review represented 19.8 per cent of the annual recurrent budget, an increase 11.2 per cent spent in FY 2014/15. Development expenditure recorded an absorption rate of 7.8 per cent, an improvement from an absorption rate of 3.3 per cent spent in similar period of FY 2014/15. A comparison of the total expenditure in the first quarters of FY 2014/15 and FY 2015/16 is shown in Figure 3.2.
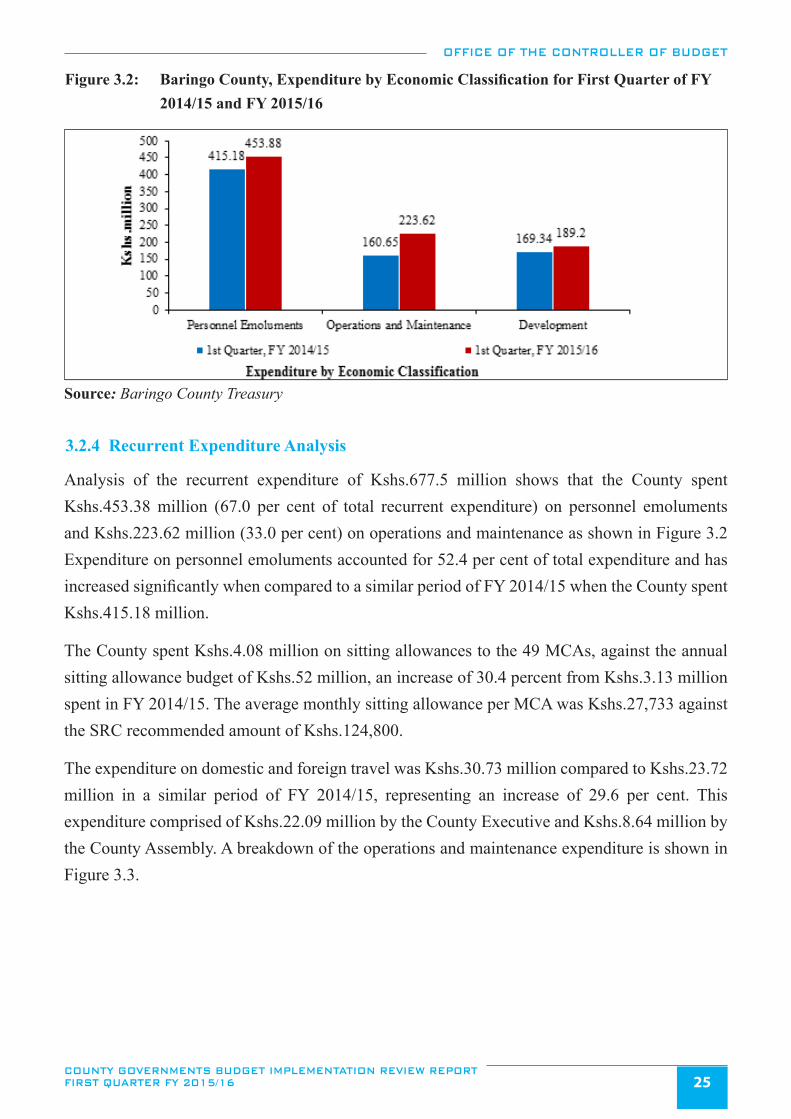
OFFICE OF THE CONTROLLER OF BUDGET
COUNTY GOVERNMENTS BUDGET IMPLEMENTATION REVIEW REPORT FIRST QUARTER FY 2015/16 25
Figure 3.2: Baringo County, Expenditure by Economic Classification for First Quarter of FY 2014/15 and FY 2015/16
Source: Baringo County Treasury
3.2.4 Recurrent Expenditure Analysis
Analysis of the recurrent expenditure of Kshs.677.5 million shows that the County spent Kshs.453.38 million (67.0 per cent of total recurrent expenditure) on personnel emoluments and Kshs.223.62 million (33.0 per cent) on operations and maintenance as shown in Figure 3.2 Expenditure on personnel emoluments accounted for 52.4 per cent of total expenditure and has increased significantly when compared to a similar period of FY 2014/15 when the County spent Kshs.415.18 million.
The County spent Kshs.4.08 million on sitting allowances to the 49 MCAs, against the annual sitting allowance budget of Kshs.52 million, an increase of 30.4 percent from Kshs.3.13 million spent in FY 2014/15. The average monthly sitting allowance per MCA was Kshs.27,733 against the SRC recommended amount of Kshs.124,800.
The expenditure on domestic and foreign travel was Kshs.30.73 million compared to Kshs.23.72 million in a similar period of FY 2014/15, representing an increase of 29.6 per cent. This expenditure comprised of Kshs.22.09 million by the County Executive and Kshs.8.64 million by the County Assembly. A breakdown of the operations and maintenance expenditure is shown in Figure 3.3.
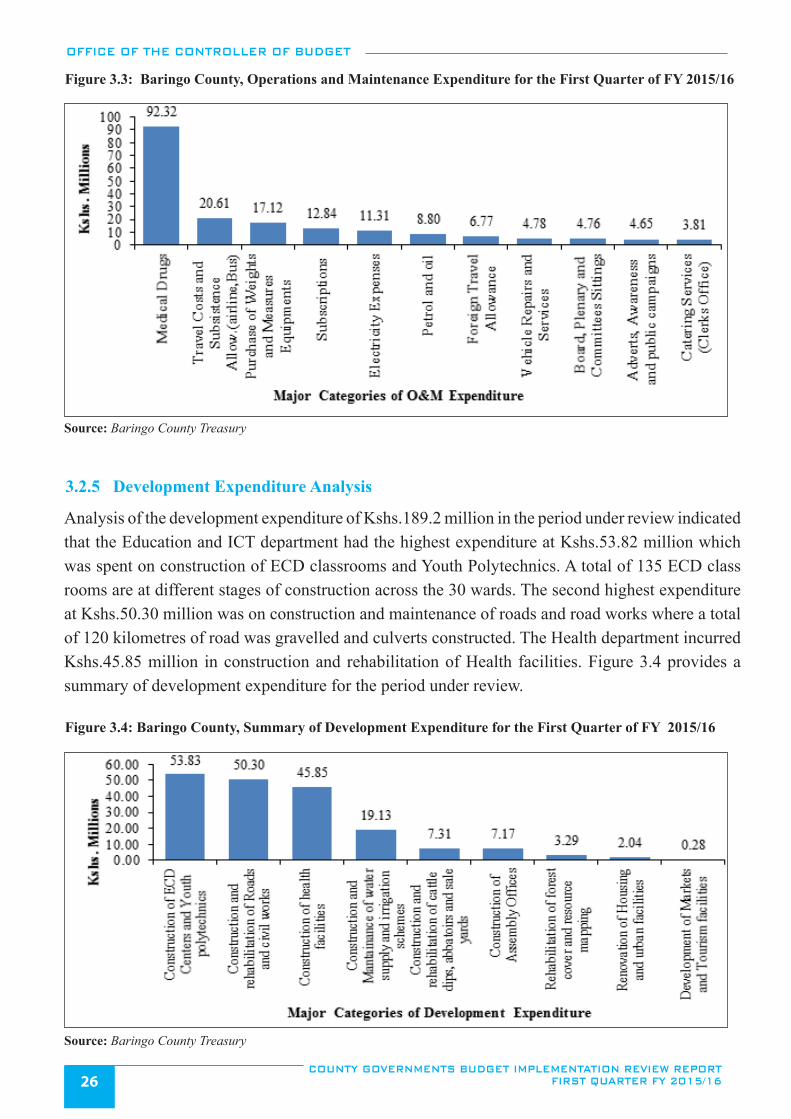
OFFICE OF THE CONTROLLER OF BUDGET
COUNTY GOVERNMENTS BUDGET IMPLEMENTATION REVIEW REPORT FIRST QUARTER FY 2015/1626
Figure 3.3: Baringo County, Operations and Maintenance Expenditure for the First Quarter of FY 2015/16
Source: Baringo County Treasury
3.2.5 Development Expenditure Analysis
Analysis of the development expenditure of Kshs.189.2 million in the period under review indicated that the Education and ICT department had the highest expenditure at Kshs.53.82 million which was spent on construction of ECD classrooms and Youth Polytechnics. A total of 135 ECD class rooms are at different stages of construction across the 30 wards. The second highest expenditure at Kshs.50.30 million was on construction and maintenance of roads and road works where a total of 120 kilometres of road was gravelled and culverts constructed. The Health department incurred Kshs.45.85 million in construction and rehabilitation of Health facilities. Figure 3.4 provides a summary of development expenditure for the period under review.
Figure 3.4: Baringo County, Summary of Development Expenditure for the First Quarter of FY 2015/16
Source: Baringo County Treasury
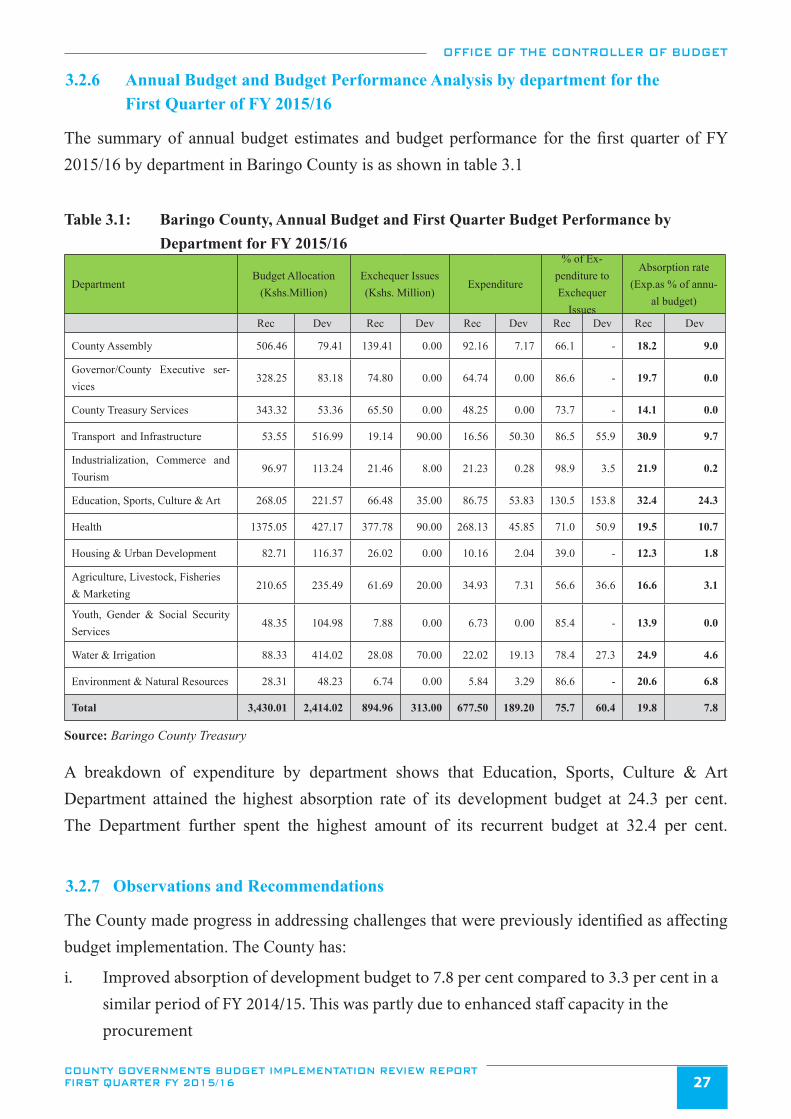
OFFICE OF THE CONTROLLER OF BUDGET
COUNTY GOVERNMENTS BUDGET IMPLEMENTATION REVIEW REPORT FIRST QUARTER FY 2015/16 27
3.2.6 Annual Budget and Budget Performance Analysis by department for the First Quarter of FY 2015/16
The summary of annual budget estimates and budget performance for the first quarter of FY 2015/16 by department in Baringo County is as shown in table 3.1
Table 3.1: Baringo County, Annual Budget and First Quarter Budget Performance by Department for FY 2015/16
DepartmentBudget Allocation
(Kshs.Million)Exchequer Issues (Kshs. Million)
Expenditure
% of Ex-penditure to Exchequer
Issues
Absorption rate (Exp.as % of annu-
al budget)
Rec Dev Rec Dev Rec Dev Rec Dev Rec Dev
County Assembly 506.46 79.41 139.41 0.00 92.16 7.17 66.1 - 18.2 9.0
Governor/County Executive ser-vices
328.25 83.18 74.80 0.00 64.74 0.00 86.6 - 19.7 0.0
County Treasury Services 343.32 53.36 65.50 0.00 48.25 0.00 73.7 - 14.1 0.0
Transport and Infrastructure 53.55 516.99 19.14 90.00 16.56 50.30 86.5 55.9 30.9 9.7
Industrialization, Commerce and Tourism
96.97 113.24 21.46 8.00 21.23 0.28 98.9 3.5 21.9 0.2
Education, Sports, Culture & Art 268.05 221.57 66.48 35.00 86.75 53.83 130.5 153.8 32.4 24.3
Health 1375.05 427.17 377.78 90.00 268.13 45.85 71.0 50.9 19.5 10.7
Housing & Urban Development 82.71 116.37 26.02 0.00 10.16 2.04 39.0 - 12.3 1.8
Agriculture, Livestock, Fisheries & Marketing
210.65 235.49 61.69 20.00 34.93 7.31 56.6 36.6 16.6 3.1
Youth, Gender & Social Security Services
48.35 104.98 7.88 0.00 6.73 0.00 85.4 - 13.9 0.0
Water & Irrigation 88.33 414.02 28.08 70.00 22.02 19.13 78.4 27.3 24.9 4.6
Environment & Natural Resources 28.31 48.23 6.74 0.00 5.84 3.29 86.6 - 20.6 6.8
Total 3,430.01 2,414.02 894.96 313.00 677.50 189.20 75.7 60.4 19.8 7.8
Source: Baringo County Treasury
A breakdown of expenditure by department shows that Education, Sports, Culture & Art Department attained the highest absorption rate of its development budget at 24.3 per cent. The Department further spent the highest amount of its recurrent budget at 32.4 per cent.
3.2.7 Observations and Recommendations
The County made progress in addressing challenges that were previously identified as affecting budget implementation. The County has:
i. Improved absorption of development budget to 7.8 per cent compared to 3.3 per cent in a similar period of FY 2014/15. This was partly due to enhanced staff capacity in the procurement
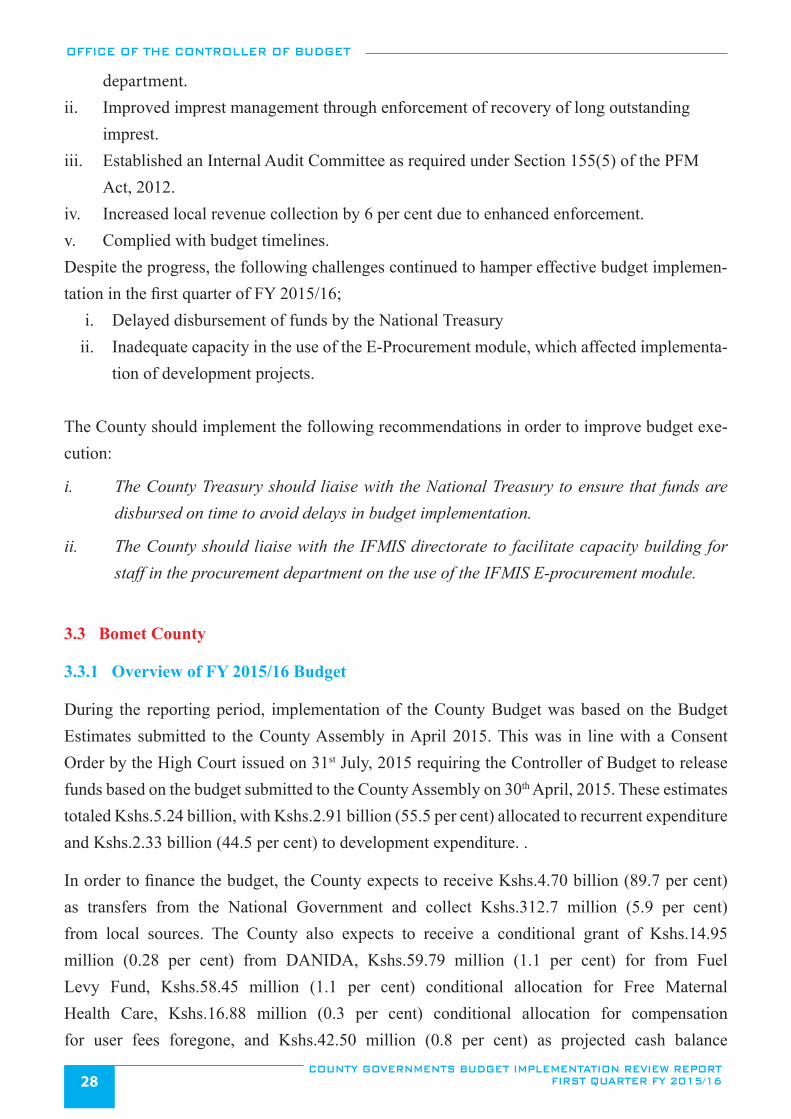
OFFICE OF THE CONTROLLER OF BUDGET
COUNTY GOVERNMENTS BUDGET IMPLEMENTATION REVIEW REPORT FIRST QUARTER FY 2015/1628
department. ii. Improved imprest management through enforcement of recovery of long outstanding
imprest. iii. Established an Internal Audit Committee as required under Section 155(5) of the PFM
Act, 2012.iv. Increased local revenue collection by 6 per cent due to enhanced enforcement.v. Complied with budget timelines. Despite the progress, the following challenges continued to hamper effective budget implemen-tation in the first quarter of FY 2015/16;
i. Delayed disbursement of funds by the National Treasury ii. Inadequate capacity in the use of the E-Procurement module, which affected implementa-
tion of development projects.
The County should implement the following recommendations in order to improve budget exe-cution:
i. The County Treasury should liaise with the National Treasury to ensure that funds are disbursed on time to avoid delays in budget implementation.
ii. The County should liaise with the IFMIS directorate to facilitate capacity building for staff in the procurement department on the use of the IFMIS E-procurement module.
3.3 Bomet County
3.3.1 Overview of FY 2015/16 Budget
During the reporting period, implementation of the County Budget was based on the Budget Estimates submitted to the County Assembly in April 2015. This was in line with a Consent Order by the High Court issued on 31st July, 2015 requiring the Controller of Budget to release funds based on the budget submitted to the County Assembly on 30th April, 2015. These estimates totaled Kshs.5.24 billion, with Kshs.2.91 billion (55.5 per cent) allocated to recurrent expenditure and Kshs.2.33 billion (44.5 per cent) to development expenditure. .
In order to finance the budget, the County expects to receive Kshs.4.70 billion (89.7 per cent) as transfers from the National Government and collect Kshs.312.7 million (5.9 per cent) from local sources. The County also expects to receive a conditional grant of Kshs.14.95 million (0.28 per cent) from DANIDA, Kshs.59.79 million (1.1 per cent) for from Fuel Levy Fund, Kshs.58.45 million (1.1 per cent) conditional allocation for Free Maternal Health Care, Kshs.16.88 million (0.3 per cent) conditional allocation for compensation for user fees foregone, and Kshs.42.50 million (0.8 per cent) as projected cash balance
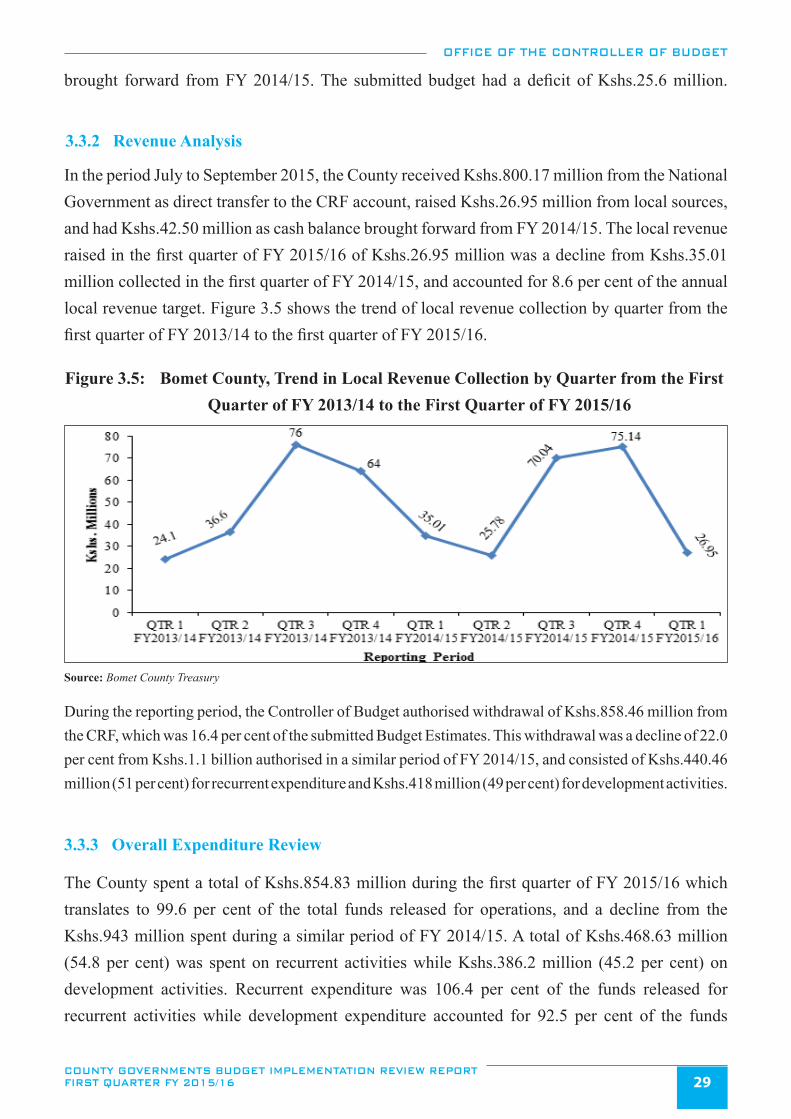
OFFICE OF THE CONTROLLER OF BUDGET
COUNTY GOVERNMENTS BUDGET IMPLEMENTATION REVIEW REPORT FIRST QUARTER FY 2015/16 29
brought forward from FY 2014/15. The submitted budget had a deficit of Kshs.25.6 million.
3.3.2 Revenue Analysis
In the period July to September 2015, the County received Kshs.800.17 million from the National Government as direct transfer to the CRF account, raised Kshs.26.95 million from local sources, and had Kshs.42.50 million as cash balance brought forward from FY 2014/15. The local revenue raised in the first quarter of FY 2015/16 of Kshs.26.95 million was a decline from Kshs.35.01 million collected in the first quarter of FY 2014/15, and accounted for 8.6 per cent of the annual local revenue target. Figure 3.5 shows the trend of local revenue collection by quarter from the first quarter of FY 2013/14 to the first quarter of FY 2015/16.
Figure 3.5: Bomet County, Trend in Local Revenue Collection by Quarter from the First Quarter of FY 2013/14 to the First Quarter of FY 2015/16
Source: Bomet County Treasury
During the reporting period, the Controller of Budget authorised withdrawal of Kshs.858.46 million from the CRF, which was 16.4 per cent of the submitted Budget Estimates. This withdrawal was a decline of 22.0 per cent from Kshs.1.1 billion authorised in a similar period of FY 2014/15, and consisted of Kshs.440.46 million (51 per cent) for recurrent expenditure and Kshs.418 million (49 per cent) for development activities.
3.3.3 Overall Expenditure Review
The County spent a total of Kshs.854.83 million during the first quarter of FY 2015/16 which translates to 99.6 per cent of the total funds released for operations, and a decline from the Kshs.943 million spent during a similar period of FY 2014/15. A total of Kshs.468.63 million (54.8 per cent) was spent on recurrent activities while Kshs.386.2 million (45.2 per cent) on development activities. Recurrent expenditure was 106.4 per cent of the funds released for recurrent activities while development expenditure accounted for 92.5 per cent of the funds
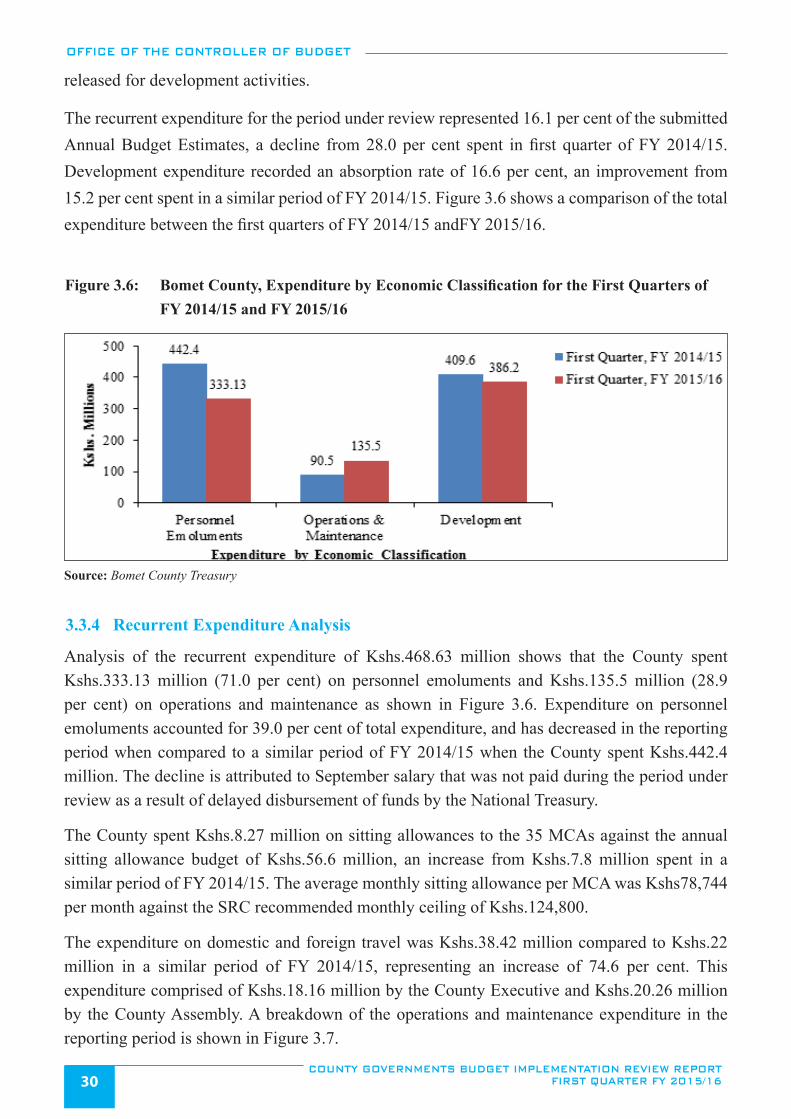
OFFICE OF THE CONTROLLER OF BUDGET
COUNTY GOVERNMENTS BUDGET IMPLEMENTATION REVIEW REPORT FIRST QUARTER FY 2015/1630
released for development activities.
The recurrent expenditure for the period under review represented 16.1 per cent of the submitted Annual Budget Estimates, a decline from 28.0 per cent spent in first quarter of FY 2014/15. Development expenditure recorded an absorption rate of 16.6 per cent, an improvement from 15.2 per cent spent in a similar period of FY 2014/15. Figure 3.6 shows a comparison of the total expenditure between the first quarters of FY 2014/15 andFY 2015/16.
Figure 3.6: Bomet County, Expenditure by Economic Classification for the First Quarters of FY 2014/15 and FY 2015/16
Source: Bomet County Treasury
3.3.4 Recurrent Expenditure Analysis
Analysis of the recurrent expenditure of Kshs.468.63 million shows that the County spent Kshs.333.13 million (71.0 per cent) on personnel emoluments and Kshs.135.5 million (28.9 per cent) on operations and maintenance as shown in Figure 3.6. Expenditure on personnel emoluments accounted for 39.0 per cent of total expenditure, and has decreased in the reporting period when compared to a similar period of FY 2014/15 when the County spent Kshs.442.4 million. The decline is attributed to September salary that was not paid during the period under review as a result of delayed disbursement of funds by the National Treasury.
The County spent Kshs.8.27 million on sitting allowances to the 35 MCAs against the annual sitting allowance budget of Kshs.56.6 million, an increase from Kshs.7.8 million spent in a similar period of FY 2014/15. The average monthly sitting allowance per MCA was Kshs78,744 per month against the SRC recommended monthly ceiling of Kshs.124,800.
The expenditure on domestic and foreign travel was Kshs.38.42 million compared to Kshs.22 million in a similar period of FY 2014/15, representing an increase of 74.6 per cent. This expenditure comprised of Kshs.18.16 million by the County Executive and Kshs.20.26 million by the County Assembly. A breakdown of the operations and maintenance expenditure in the reporting period is shown in Figure 3.7.
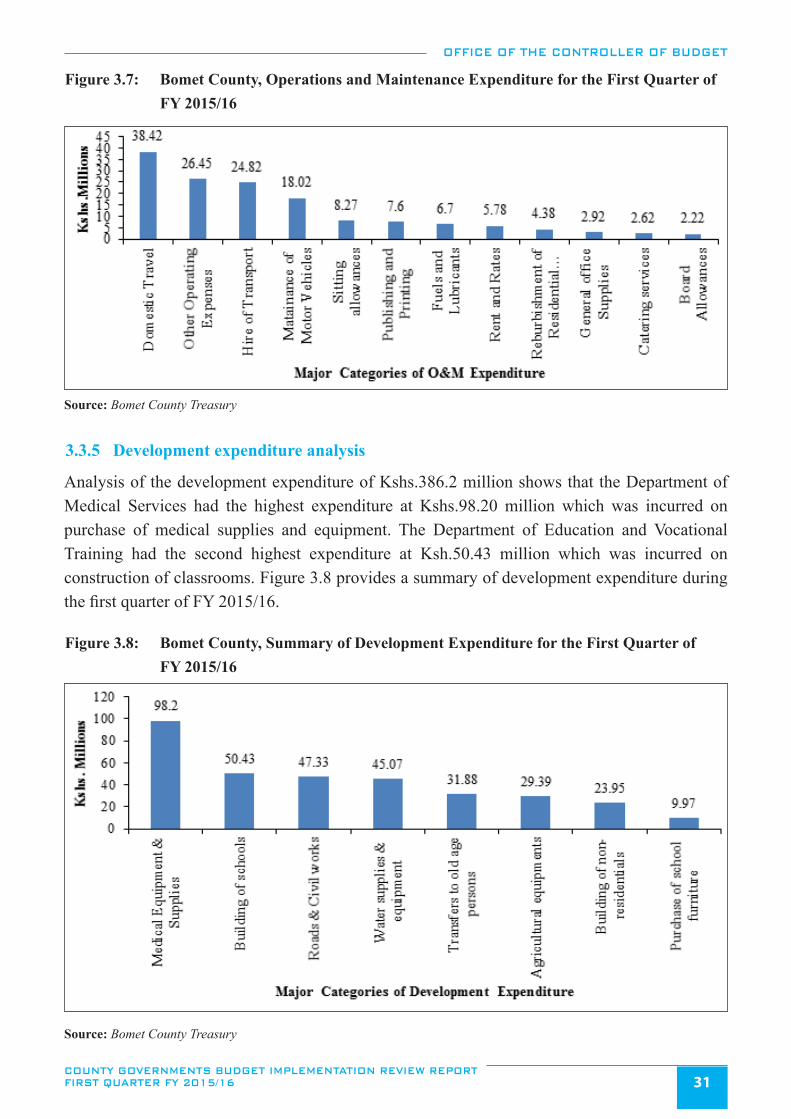
OFFICE OF THE CONTROLLER OF BUDGET
COUNTY GOVERNMENTS BUDGET IMPLEMENTATION REVIEW REPORT FIRST QUARTER FY 2015/16 31
Figure 3.7: Bomet County, Operations and Maintenance Expenditure for the First Quarter of FY 2015/16
Source: Bomet County Treasury
3.3.5 Development expenditure analysis
Analysis of the development expenditure of Kshs.386.2 million shows that the Department of Medical Services had the highest expenditure at Kshs.98.20 million which was incurred on purchase of medical supplies and equipment. The Department of Education and Vocational Training had the second highest expenditure at Ksh.50.43 million which was incurred on construction of classrooms. Figure 3.8 provides a summary of development expenditure during the first quarter of FY 2015/16.
Figure 3.8: Bomet County, Summary of Development Expenditure for the First Quarter of FY 2015/16
Source: Bomet County Treasury
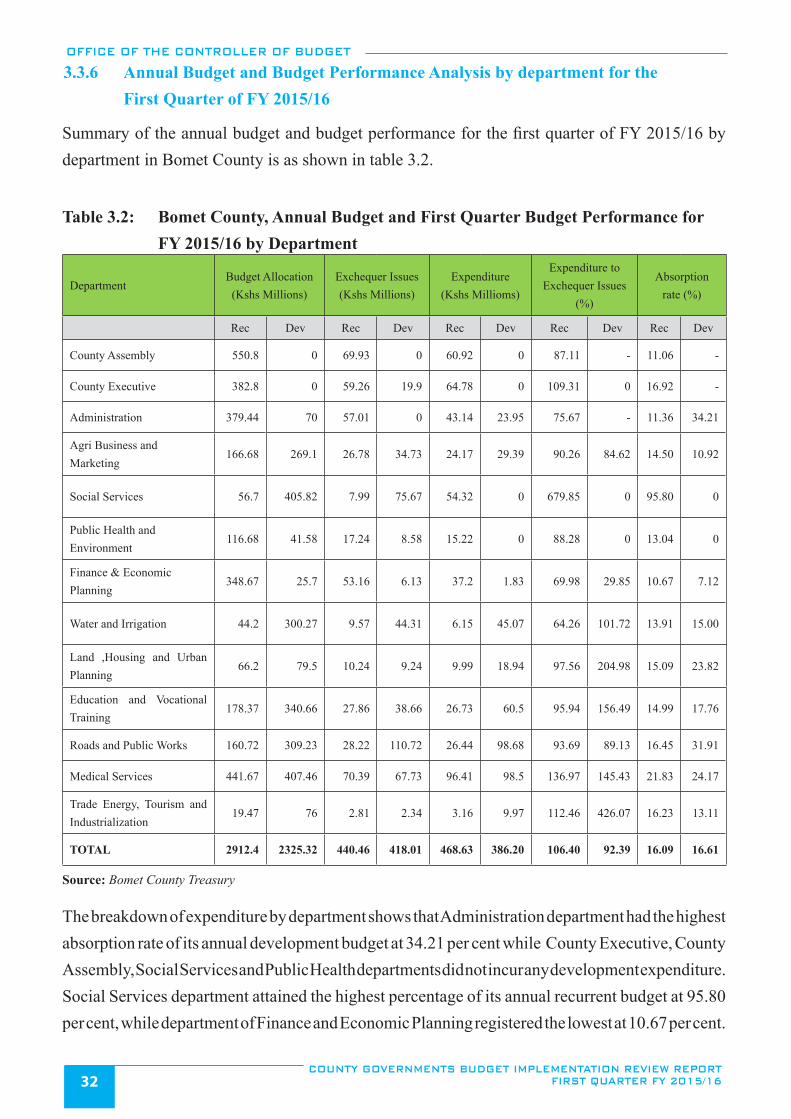
OFFICE OF THE CONTROLLER OF BUDGET
COUNTY GOVERNMENTS BUDGET IMPLEMENTATION REVIEW REPORT FIRST QUARTER FY 2015/1632
3.3.6 Annual Budget and Budget Performance Analysis by department for the First Quarter of FY 2015/16
Summary of the annual budget and budget performance for the first quarter of FY 2015/16 by department in Bomet County is as shown in table 3.2.
Table 3.2: Bomet County, Annual Budget and First Quarter Budget Performance for FY 2015/16 by Department
DepartmentBudget Allocation (Kshs Millions)
Exchequer Issues (Kshs Millions)
Expenditure (Kshs Millioms)
Expenditure to Exchequer Issues
(%)
Absorption rate (%)
Rec Dev Rec Dev Rec Dev Rec Dev Rec Dev
County Assembly 550.8 0 69.93 0 60.92 0 87.11 - 11.06 -
County Executive 382.8 0 59.26 19.9 64.78 0 109.31 0 16.92 -
Administration 379.44 70 57.01 0 43.14 23.95 75.67 - 11.36 34.21
Agri Business and Marketing
166.68 269.1 26.78 34.73 24.17 29.39 90.26 84.62 14.50 10.92
Social Services 56.7 405.82 7.99 75.67 54.32 0 679.85 0 95.80 0
Public Health and Environment
116.68 41.58 17.24 8.58 15.22 0 88.28 0 13.04 0
Finance & Economic Planning
348.67 25.7 53.16 6.13 37.2 1.83 69.98 29.85 10.67 7.12
Water and Irrigation 44.2 300.27 9.57 44.31 6.15 45.07 64.26 101.72 13.91 15.00
Land ,Housing and Urban Planning
66.2 79.5 10.24 9.24 9.99 18.94 97.56 204.98 15.09 23.82
Education and Vocational Training
178.37 340.66 27.86 38.66 26.73 60.5 95.94 156.49 14.99 17.76
Roads and Public Works 160.72 309.23 28.22 110.72 26.44 98.68 93.69 89.13 16.45 31.91
Medical Services 441.67 407.46 70.39 67.73 96.41 98.5 136.97 145.43 21.83 24.17
Trade Energy, Tourism and Industrialization
19.47 76 2.81 2.34 3.16 9.97 112.46 426.07 16.23 13.11
TOTAL 2912.4 2325.32 440.46 418.01 468.63 386.20 106.40 92.39 16.09 16.61
Source: Bomet County Treasury
The breakdown of expenditure by department shows that Administration department had the highest absorption rate of its annual development budget at 34.21 per cent while County Executive, County Assembly, Social Services and Public Health departments did not incur any development expenditure. Social Services department attained the highest percentage of its annual recurrent budget at 95.80 per cent, while department of Finance and Economic Planning registered the lowest at 10.67 per cent.
OFFICE OF THE CONTROLLER OF BUDGET
COUNTY GOVERNMENTS BUDGET IMPLEMENTATION REVIEW REPORT FIRST QUARTER FY 2015/16 33
3.3.7 Observations and Recommendations
Bomet County has made progress in addressing some of the challenges that were previously identified as affecting budget implementation. The County has:
i. Constituted an internal audit committee to oversee internal audit operations.ii. Continued to develop capacity of its technical staff through training.iii. Submitted financial reports on time as required by Section 166 of the PFM Act, 2012.
Despite the progress, the following challenges affected budget implementation during the reporting period:
i. Delay in release of funds by the National Treasury that resulted in inability to meet financial obligations in time, such as the September, 2015 salaries.
ii. Failure by the County Assembly to fully use IFMIS in processing of financial transactions.
The County should implement the following recommendations in order to improve budget execution:i. The County should liaise with the National Treasury to ensure timely transfer of the County’s
equitable share of revenue in accordance with Section 17 of the PFM Act, 2012 and the disbursement schedule approved by the Senate.
ii. The County Assembly should fully embrace the use of IFMIS and should liaise with the County Treasury and the IFMIS Directorate in case of any operational challenges.
3.4 Bungoma County
3.4.1 Overview of the FY 2015/16 County Budget
The Approved Budget Estimates for Bungoma County for FY 2015/16 amounts to Kshs.9.12 billion, with Kshs.5.73 billion (62.8 per cent) allocated to recurrent expenditure and Kshs.3.39 billion (37.2 per cent) to development expenditure. In order to finance this budget, the County expects to receive Kshs.7.68 billion (84.2 per cent) as transfers from the National Government and collect Kshs.755.66 million (8.3 per cent) from local sources. There was no cash balance from FY 2014/15. Nonetheless, the County did not budget for additional grants as provided for in CARA, 2015 which includes Kshs.38.01 million as compensation for user fees forgone; Kshs.97.5 million from the road maintenance levy fund, Kshs.170.63 million for free maternal health care, Kshs.95.74 million for leasing of medical equipment, Kshs.182 million as conditional allocations for other loans/grants, and Kshs.14.75 million as DANIDA grant to supplement financing of county health facilities.
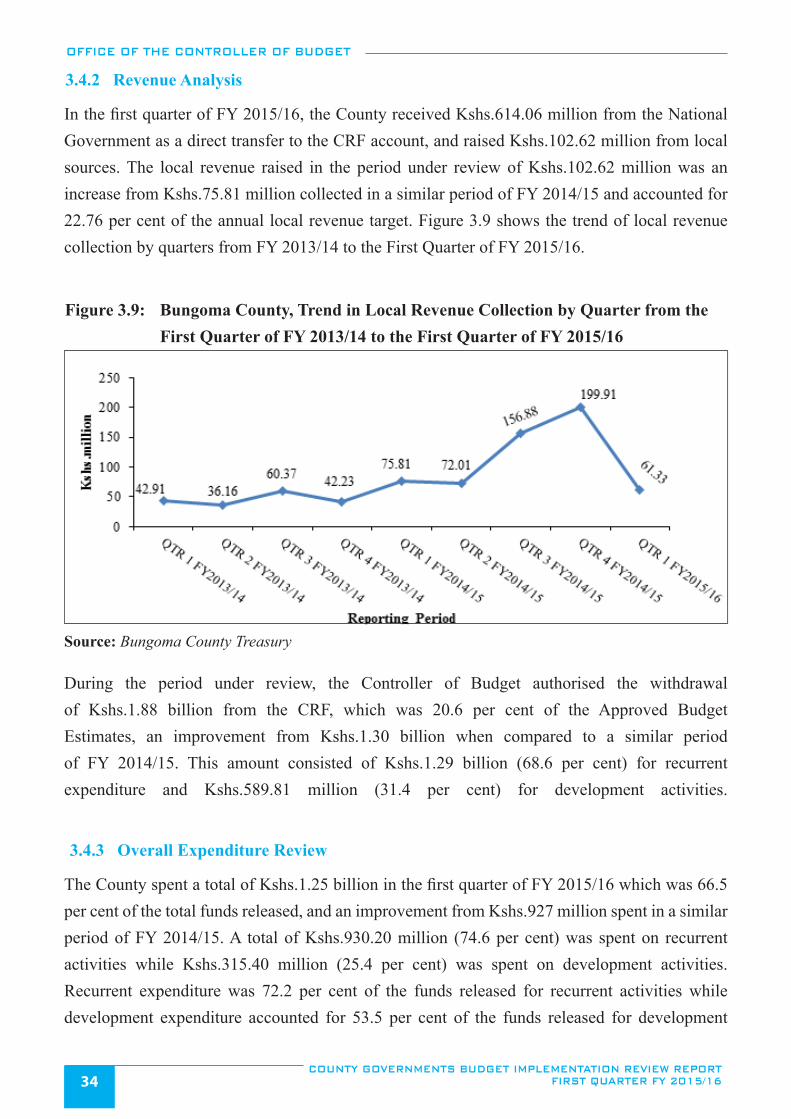
OFFICE OF THE CONTROLLER OF BUDGET
COUNTY GOVERNMENTS BUDGET IMPLEMENTATION REVIEW REPORT FIRST QUARTER FY 2015/1634
3.4.2 Revenue Analysis
In the first quarter of FY 2015/16, the County received Kshs.614.06 million from the National Government as a direct transfer to the CRF account, and raised Kshs.102.62 million from local sources. The local revenue raised in the period under review of Kshs.102.62 million was an increase from Kshs.75.81 million collected in a similar period of FY 2014/15 and accounted for 22.76 per cent of the annual local revenue target. Figure 3.9 shows the trend of local revenue collection by quarters from FY 2013/14 to the First Quarter of FY 2015/16.
Figure 3.9: Bungoma County, Trend in Local Revenue Collection by Quarter from the First Quarter of FY 2013/14 to the First Quarter of FY 2015/16
Source: Bungoma County Treasury
During the period under review, the Controller of Budget authorised the withdrawal of Kshs.1.88 billion from the CRF, which was 20.6 per cent of the Approved Budget Estimates, an improvement from Kshs.1.30 billion when compared to a similar period of FY 2014/15. This amount consisted of Kshs.1.29 billion (68.6 per cent) for recurrent expenditure and Kshs.589.81 million (31.4 per cent) for development activities.
3.4.3 Overall Expenditure Review
The County spent a total of Kshs.1.25 billion in the first quarter of FY 2015/16 which was 66.5 per cent of the total funds released, and an improvement from Kshs.927 million spent in a similar period of FY 2014/15. A total of Kshs.930.20 million (74.6 per cent) was spent on recurrent activities while Kshs.315.40 million (25.4 per cent) was spent on development activities. Recurrent expenditure was 72.2 per cent of the funds released for recurrent activities while development expenditure accounted for 53.5 per cent of the funds released for development
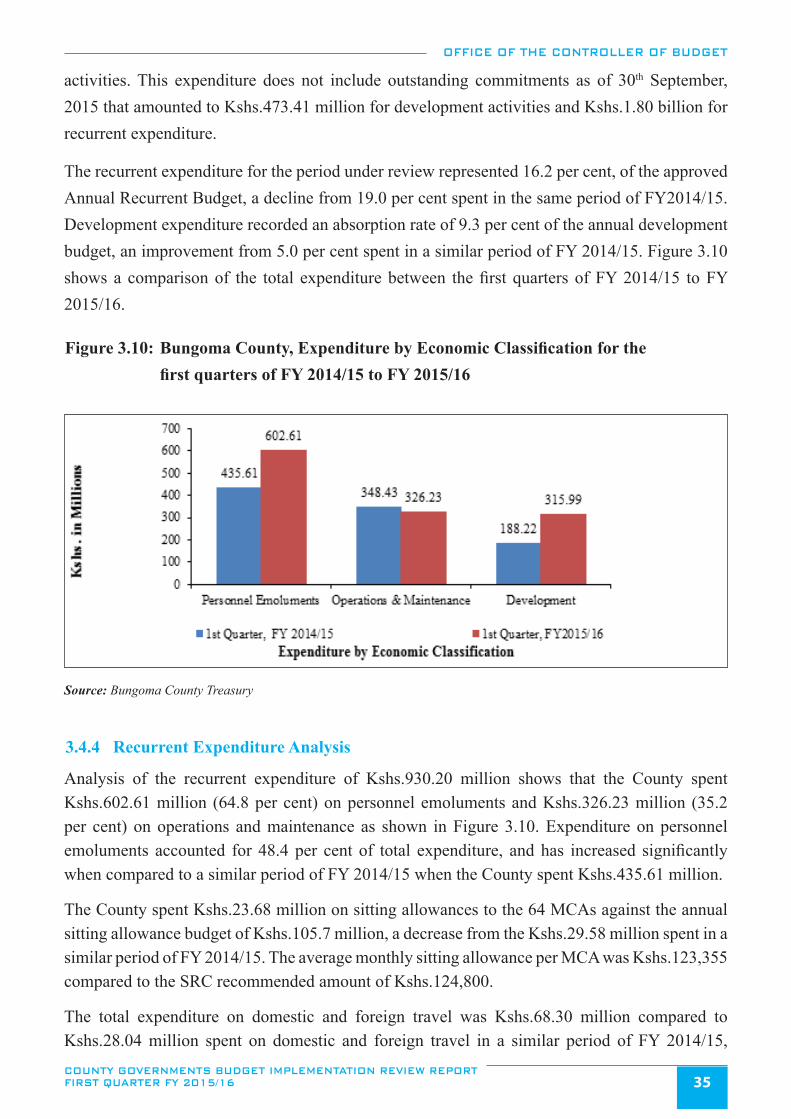
OFFICE OF THE CONTROLLER OF BUDGET
COUNTY GOVERNMENTS BUDGET IMPLEMENTATION REVIEW REPORT FIRST QUARTER FY 2015/16 35
activities. This expenditure does not include outstanding commitments as of 30th September, 2015 that amounted to Kshs.473.41 million for development activities and Kshs.1.80 billion for recurrent expenditure.
The recurrent expenditure for the period under review represented 16.2 per cent, of the approved Annual Recurrent Budget, a decline from 19.0 per cent spent in the same period of FY2014/15. Development expenditure recorded an absorption rate of 9.3 per cent of the annual development budget, an improvement from 5.0 per cent spent in a similar period of FY 2014/15. Figure 3.10 shows a comparison of the total expenditure between the first quarters of FY 2014/15 to FY 2015/16.
Figure 3.10: Bungoma County, Expenditure by Economic Classification for the first quarters of FY 2014/15 to FY 2015/16
Source: Bungoma County Treasury
3.4.4 Recurrent Expenditure Analysis
Analysis of the recurrent expenditure of Kshs.930.20 million shows that the County spent Kshs.602.61 million (64.8 per cent) on personnel emoluments and Kshs.326.23 million (35.2 per cent) on operations and maintenance as shown in Figure 3.10. Expenditure on personnel emoluments accounted for 48.4 per cent of total expenditure, and has increased significantly when compared to a similar period of FY 2014/15 when the County spent Kshs.435.61 million.
The County spent Kshs.23.68 million on sitting allowances to the 64 MCAs against the annual sitting allowance budget of Kshs.105.7 million, a decrease from the Kshs.29.58 million spent in a similar period of FY 2014/15. The average monthly sitting allowance per MCA was Kshs.123,355 compared to the SRC recommended amount of Kshs.124,800.
The total expenditure on domestic and foreign travel was Kshs.68.30 million compared to Kshs.28.04 million spent on domestic and foreign travel in a similar period of FY 2014/15,
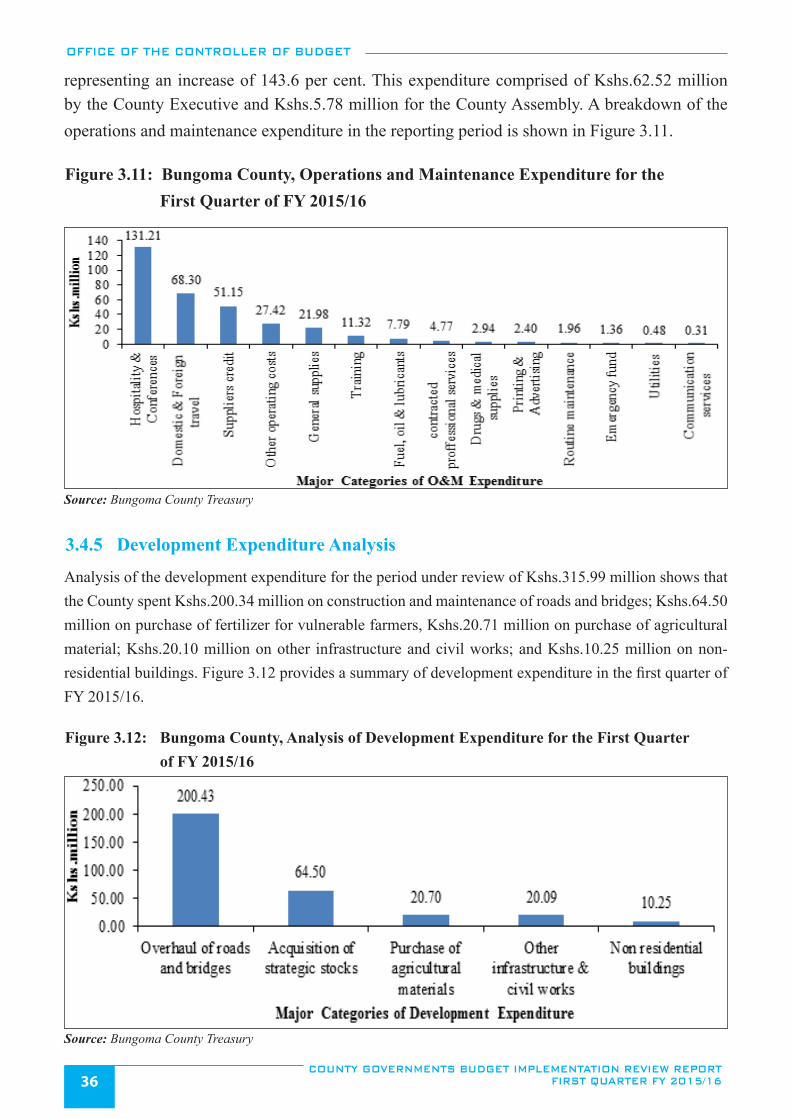
OFFICE OF THE CONTROLLER OF BUDGET
COUNTY GOVERNMENTS BUDGET IMPLEMENTATION REVIEW REPORT FIRST QUARTER FY 2015/1636
representing an increase of 143.6 per cent. This expenditure comprised of Kshs.62.52 million by the County Executive and Kshs.5.78 million for the County Assembly. A breakdown of the operations and maintenance expenditure in the reporting period is shown in Figure 3.11.
Figure 3.11: Bungoma County, Operations and Maintenance Expenditure for the First Quarter of FY 2015/16
Source: Bungoma County Treasury
3.4.5 Development Expenditure Analysis
Analysis of the development expenditure for the period under review of Kshs.315.99 million shows that the County spent Kshs.200.34 million on construction and maintenance of roads and bridges; Kshs.64.50 million on purchase of fertilizer for vulnerable farmers, Kshs.20.71 million on purchase of agricultural material; Kshs.20.10 million on other infrastructure and civil works; and Kshs.10.25 million on non-residential buildings. Figure 3.12 provides a summary of development expenditure in the first quarter of FY 2015/16.
Figure 3.12: Bungoma County, Analysis of Development Expenditure for the First Quarter of FY 2015/16
Source: Bungoma County Treasury
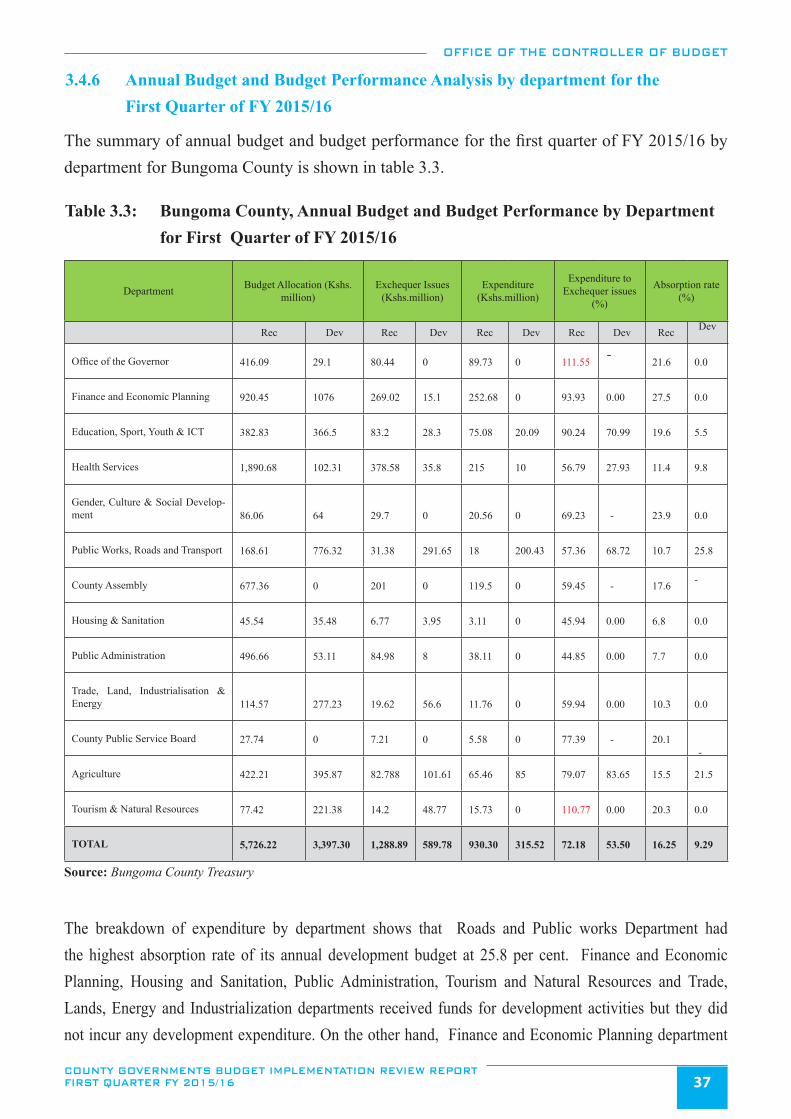
OFFICE OF THE CONTROLLER OF BUDGET
COUNTY GOVERNMENTS BUDGET IMPLEMENTATION REVIEW REPORT FIRST QUARTER FY 2015/16 37
3.4.6 Annual Budget and Budget Performance Analysis by department for the First Quarter of FY 2015/16
The summary of annual budget and budget performance for the first quarter of FY 2015/16 by department for Bungoma County is shown in table 3.3.
Table 3.3: Bungoma County, Annual Budget and Budget Performance by Department for First Quarter of FY 2015/16
Department Budget Allocation (Kshs.million)
Exchequer Issues (Kshs.million)
Expenditure (Kshs.million)
Expenditure to Exchequer issues
(%)
Absorption rate (%)
Rec Dev Rec Dev Rec Dev Rec Dev Rec Dev
Office of the Governor 416.09 29.1 80.44 0 89.73 0 111.55 - 21.6 0.0
Finance and Economic Planning 920.45 1076 269.02 15.1 252.68 0 93.93 0.00 27.5 0.0
Education, Sport, Youth & ICT 382.83 366.5 83.2 28.3 75.08 20.09 90.24 70.99 19.6 5.5
Health Services 1,890.68 102.31 378.58 35.8 215 10 56.79 27.93 11.4 9.8
Gender, Culture & Social Develop-ment 86.06 64 29.7 0 20.56 0 69.23 - 23.9 0.0
Public Works, Roads and Transport 168.61 776.32 31.38 291.65 18 200.43 57.36 68.72 10.7 25.8
County Assembly 677.36 0 201 0 119.5 0 59.45 - 17.6 -
Housing & Sanitation 45.54 35.48 6.77 3.95 3.11 0 45.94 0.00 6.8 0.0
Public Administration 496.66 53.11 84.98 8 38.11 0 44.85 0.00 7.7 0.0
Trade, Land, Industrialisation & Energy 114.57 277.23 19.62 56.6 11.76 0 59.94 0.00 10.3 0.0
County Public Service Board 27.74 0 7.21 0 5.58 0 77.39 - 20.1 -
Agriculture 422.21 395.87 82.788 101.61 65.46 85 79.07 83.65 15.5 21.5
Tourism & Natural Resources 77.42 221.38 14.2 48.77 15.73 0 110.77 0.00 20.3 0.0
TOTAL 5,726.22 3,397.30 1,288.89 589.78 930.30 315.52 72.18 53.50 16.25 9.29
Source: Bungoma County Treasury
The breakdown of expenditure by department shows that Roads and Public works Department had the highest absorption rate of its annual development budget at 25.8 per cent. Finance and Economic Planning, Housing and Sanitation, Public Administration, Tourism and Natural Resources and Trade, Lands, Energy and Industrialization departments received funds for development activities but they did not incur any development expenditure. On the other hand, Finance and Economic Planning department
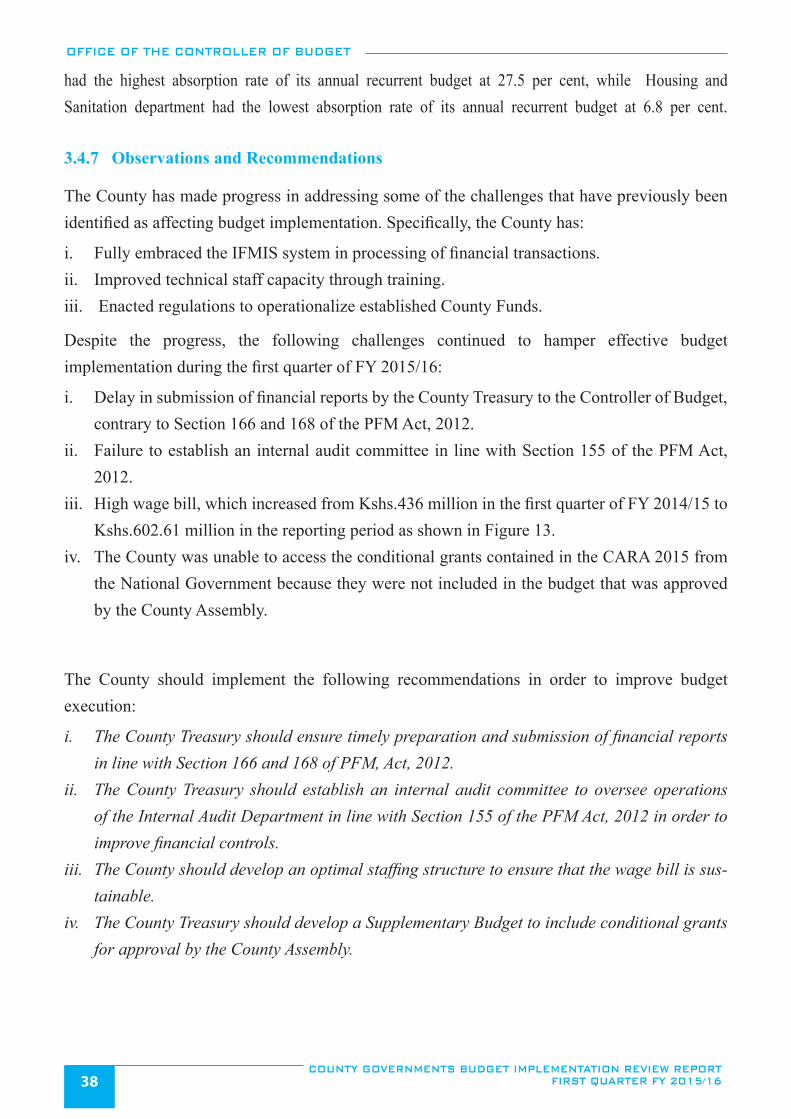
OFFICE OF THE CONTROLLER OF BUDGET
COUNTY GOVERNMENTS BUDGET IMPLEMENTATION REVIEW REPORT FIRST QUARTER FY 2015/1638
had the highest absorption rate of its annual recurrent budget at 27.5 per cent, while Housing and Sanitation department had the lowest absorption rate of its annual recurrent budget at 6.8 per cent.
3.4.7 Observations and Recommendations
The County has made progress in addressing some of the challenges that have previously been identified as affecting budget implementation. Specifically, the County has:
i. Fully embraced the IFMIS system in processing of financial transactions.ii. Improved technical staff capacity through training.iii. Enacted regulations to operationalize established County Funds.
Despite the progress, the following challenges continued to hamper effective budget implementation during the first quarter of FY 2015/16:
i. Delay in submission of financial reports by the County Treasury to the Controller of Budget, contrary to Section 166 and 168 of the PFM Act, 2012.
ii. Failure to establish an internal audit committee in line with Section 155 of the PFM Act, 2012.
iii. High wage bill, which increased from Kshs.436 million in the first quarter of FY 2014/15 to Kshs.602.61 million in the reporting period as shown in Figure 13.
iv. The County was unable to access the conditional grants contained in the CARA 2015 from the National Government because they were not included in the budget that was approved by the County Assembly.
The County should implement the following recommendations in order to improve budget execution:
i. The County Treasury should ensure timely preparation and submission of financial reports in line with Section 166 and 168 of PFM, Act, 2012.
ii. The County Treasury should establish an internal audit committee to oversee operations of the Internal Audit Department in line with Section 155 of the PFM Act, 2012 in order to improve financial controls.
iii. The County should develop an optimal staffing structure to ensure that the wage bill is sus-tainable.
iv. The County Treasury should develop a Supplementary Budget to include conditional grants for approval by the County Assembly.
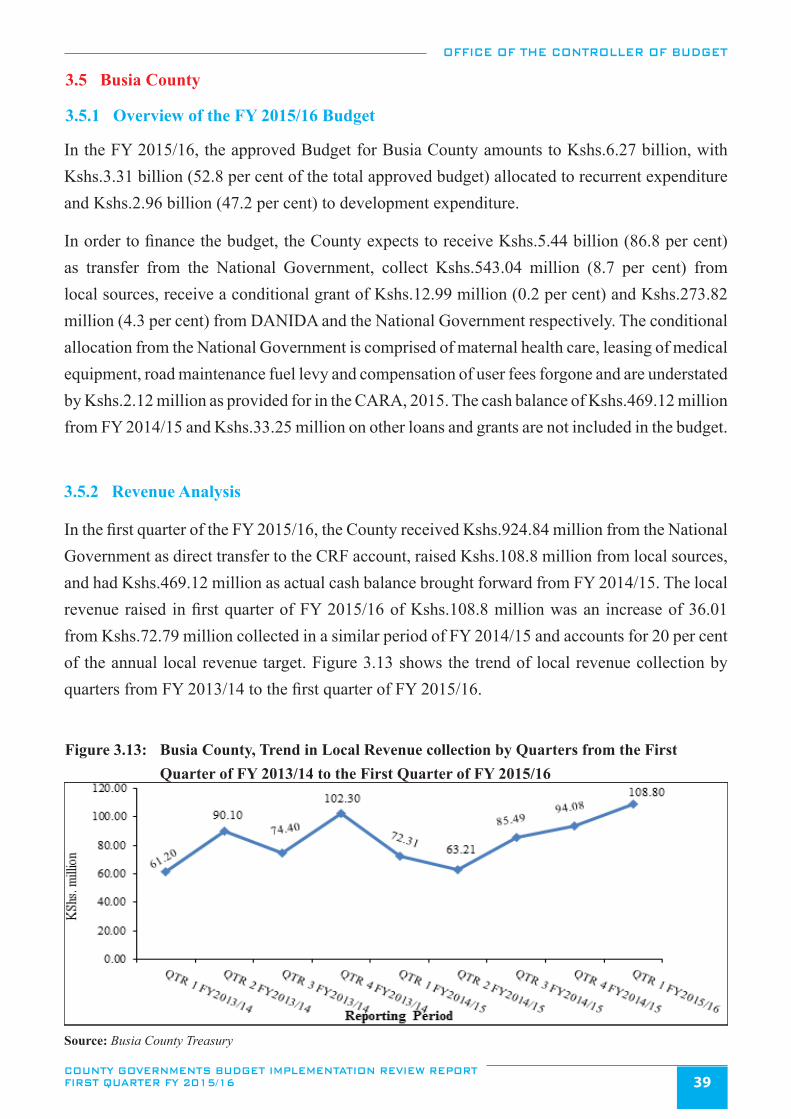
OFFICE OF THE CONTROLLER OF BUDGET
COUNTY GOVERNMENTS BUDGET IMPLEMENTATION REVIEW REPORT FIRST QUARTER FY 2015/16 39
3.5 Busia County
3.5.1 Overview of the FY 2015/16 Budget
In the FY 2015/16, the approved Budget for Busia County amounts to Kshs.6.27 billion, with Kshs.3.31 billion (52.8 per cent of the total approved budget) allocated to recurrent expenditure and Kshs.2.96 billion (47.2 per cent) to development expenditure.
In order to finance the budget, the County expects to receive Kshs.5.44 billion (86.8 per cent) as transfer from the National Government, collect Kshs.543.04 million (8.7 per cent) from local sources, receive a conditional grant of Kshs.12.99 million (0.2 per cent) and Kshs.273.82 million (4.3 per cent) from DANIDA and the National Government respectively. The conditional allocation from the National Government is comprised of maternal health care, leasing of medical equipment, road maintenance fuel levy and compensation of user fees forgone and are understated by Kshs.2.12 million as provided for in the CARA, 2015. The cash balance of Kshs.469.12 million from FY 2014/15 and Kshs.33.25 million on other loans and grants are not included in the budget.
3.5.2 Revenue Analysis
In the first quarter of the FY 2015/16, the County received Kshs.924.84 million from the National Government as direct transfer to the CRF account, raised Kshs.108.8 million from local sources, and had Kshs.469.12 million as actual cash balance brought forward from FY 2014/15. The local revenue raised in first quarter of FY 2015/16 of Kshs.108.8 million was an increase of 36.01 from Kshs.72.79 million collected in a similar period of FY 2014/15 and accounts for 20 per cent of the annual local revenue target. Figure 3.13 shows the trend of local revenue collection by quarters from FY 2013/14 to the first quarter of FY 2015/16.
Figure 3.13: Busia County, Trend in Local Revenue collection by Quarters from the First Quarter of FY 2013/14 to the First Quarter of FY 2015/16
Source: Busia County Treasury
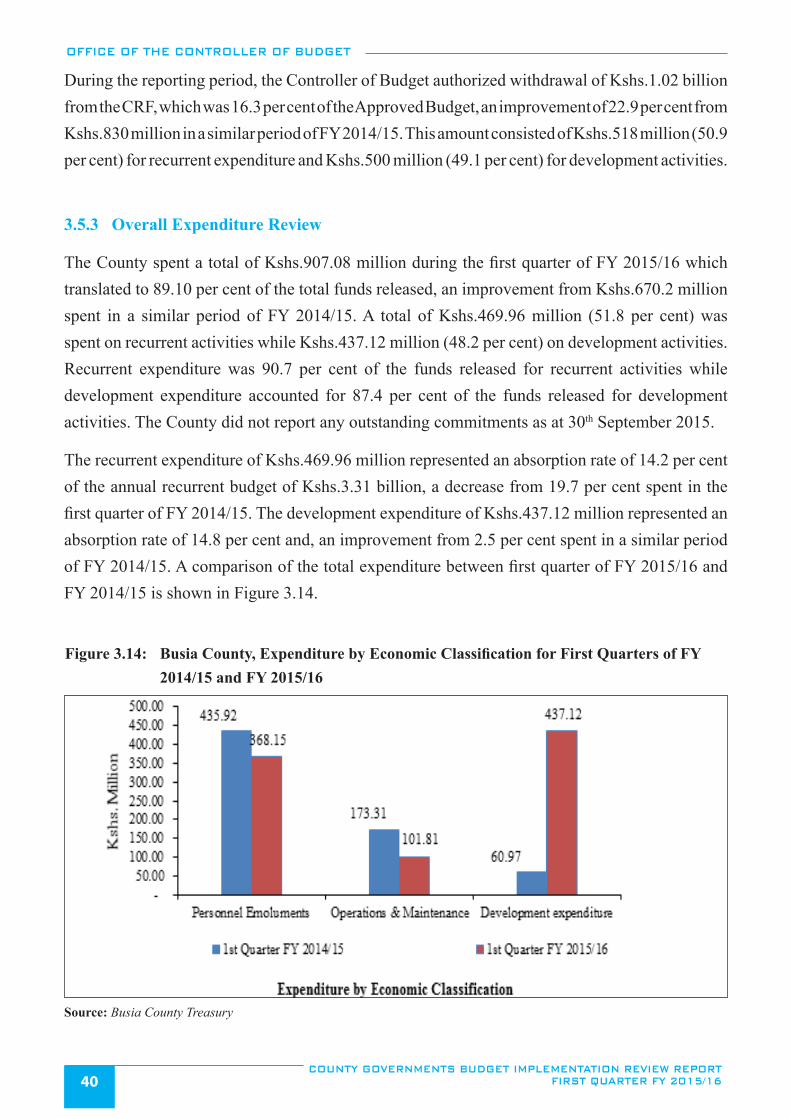
OFFICE OF THE CONTROLLER OF BUDGET
COUNTY GOVERNMENTS BUDGET IMPLEMENTATION REVIEW REPORT FIRST QUARTER FY 2015/1640
During the reporting period, the Controller of Budget authorized withdrawal of Kshs.1.02 billion from the CRF, which was 16.3 per cent of the Approved Budget, an improvement of 22.9 per cent from Kshs.830 million in a similar period of FY 2014/15. This amount consisted of Kshs.518 million (50.9 per cent) for recurrent expenditure and Kshs.500 million (49.1 per cent) for development activities.
3.5.3 Overall Expenditure Review
The County spent a total of Kshs.907.08 million during the first quarter of FY 2015/16 which translated to 89.10 per cent of the total funds released, an improvement from Kshs.670.2 million spent in a similar period of FY 2014/15. A total of Kshs.469.96 million (51.8 per cent) was spent on recurrent activities while Kshs.437.12 million (48.2 per cent) on development activities. Recurrent expenditure was 90.7 per cent of the funds released for recurrent activities while development expenditure accounted for 87.4 per cent of the funds released for development activities. The County did not report any outstanding commitments as at 30th September 2015.
The recurrent expenditure of Kshs.469.96 million represented an absorption rate of 14.2 per cent of the annual recurrent budget of Kshs.3.31 billion, a decrease from 19.7 per cent spent in the first quarter of FY 2014/15. The development expenditure of Kshs.437.12 million represented an absorption rate of 14.8 per cent and, an improvement from 2.5 per cent spent in a similar period of FY 2014/15. A comparison of the total expenditure between first quarter of FY 2015/16 and FY 2014/15 is shown in Figure 3.14.
Figure 3.14: Busia County, Expenditure by Economic Classification for First Quarters of FY 2014/15 and FY 2015/16
Source: Busia County Treasury
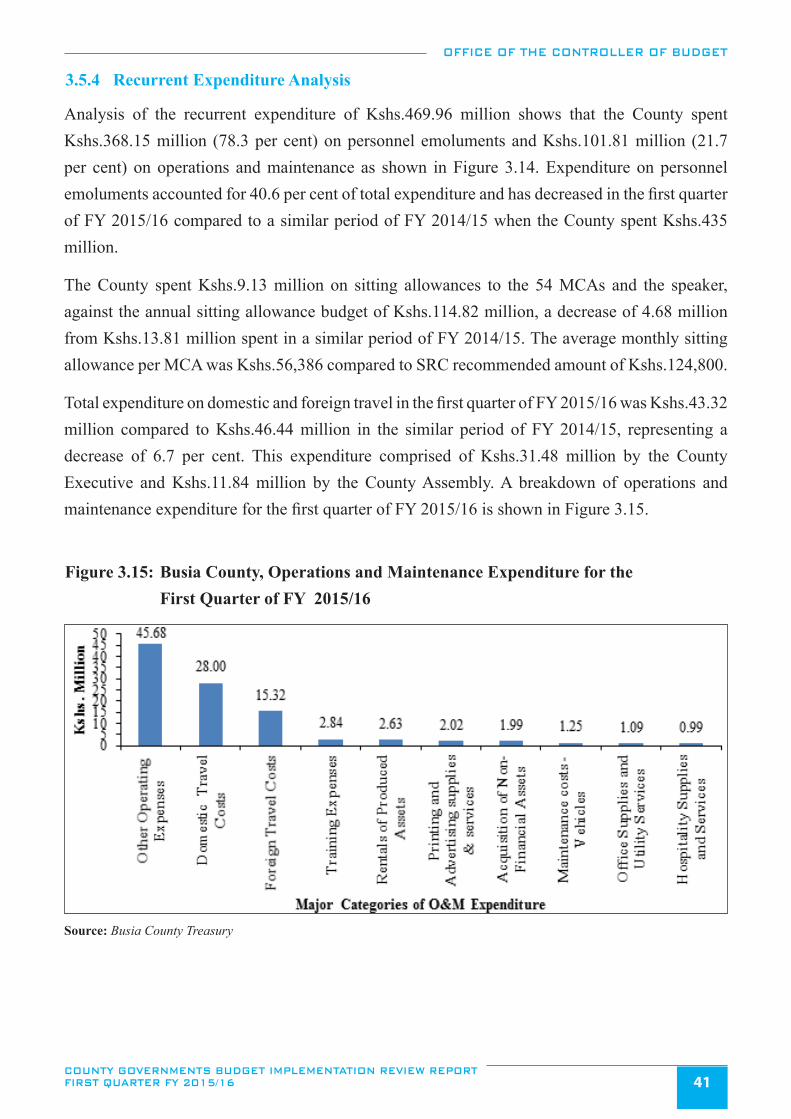
OFFICE OF THE CONTROLLER OF BUDGET
COUNTY GOVERNMENTS BUDGET IMPLEMENTATION REVIEW REPORT FIRST QUARTER FY 2015/16 41
3.5.4 Recurrent Expenditure Analysis
Analysis of the recurrent expenditure of Kshs.469.96 million shows that the County spent Kshs.368.15 million (78.3 per cent) on personnel emoluments and Kshs.101.81 million (21.7 per cent) on operations and maintenance as shown in Figure 3.14. Expenditure on personnel emoluments accounted for 40.6 per cent of total expenditure and has decreased in the first quarter of FY 2015/16 compared to a similar period of FY 2014/15 when the County spent Kshs.435 million.
The County spent Kshs.9.13 million on sitting allowances to the 54 MCAs and the speaker, against the annual sitting allowance budget of Kshs.114.82 million, a decrease of 4.68 million from Kshs.13.81 million spent in a similar period of FY 2014/15. The average monthly sitting allowance per MCA was Kshs.56,386 compared to SRC recommended amount of Kshs.124,800.
Total expenditure on domestic and foreign travel in the first quarter of FY 2015/16 was Kshs.43.32 million compared to Kshs.46.44 million in the similar period of FY 2014/15, representing a decrease of 6.7 per cent. This expenditure comprised of Kshs.31.48 million by the County Executive and Kshs.11.84 million by the County Assembly. A breakdown of operations and maintenance expenditure for the first quarter of FY 2015/16 is shown in Figure 3.15.
Figure 3.15: Busia County, Operations and Maintenance Expenditure for the First Quarter of FY 2015/16
Source: Busia County Treasury
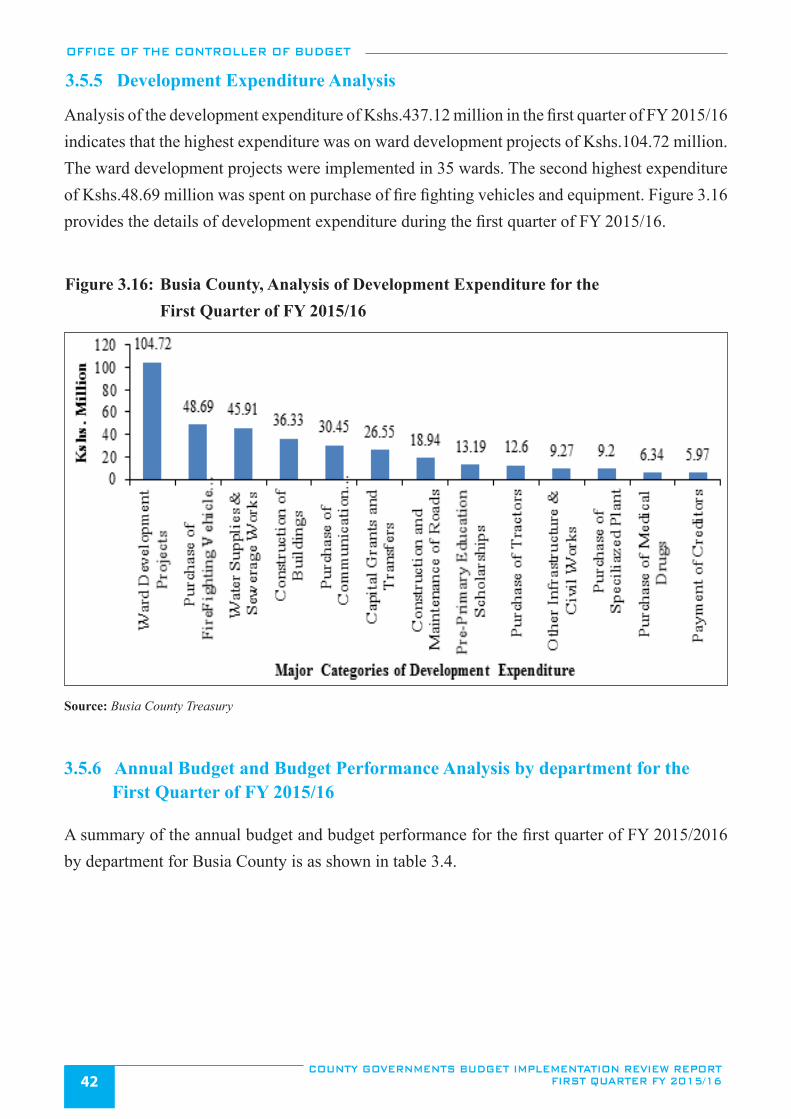
OFFICE OF THE CONTROLLER OF BUDGET
COUNTY GOVERNMENTS BUDGET IMPLEMENTATION REVIEW REPORT FIRST QUARTER FY 2015/1642
3.5.5 Development Expenditure Analysis
Analysis of the development expenditure of Kshs.437.12 million in the first quarter of FY 2015/16 indicates that the highest expenditure was on ward development projects of Kshs.104.72 million. The ward development projects were implemented in 35 wards. The second highest expenditure of Kshs.48.69 million was spent on purchase of fire fighting vehicles and equipment. Figure 3.16 provides the details of development expenditure during the first quarter of FY 2015/16.
Figure 3.16: Busia County, Analysis of Development Expenditure for the First Quarter of FY 2015/16
Source: Busia County Treasury
3.5.6 Annual Budget and Budget Performance Analysis by department for the First Quarter of FY 2015/16
A summary of the annual budget and budget performance for the first quarter of FY 2015/2016 by department for Busia County is as shown in table 3.4.
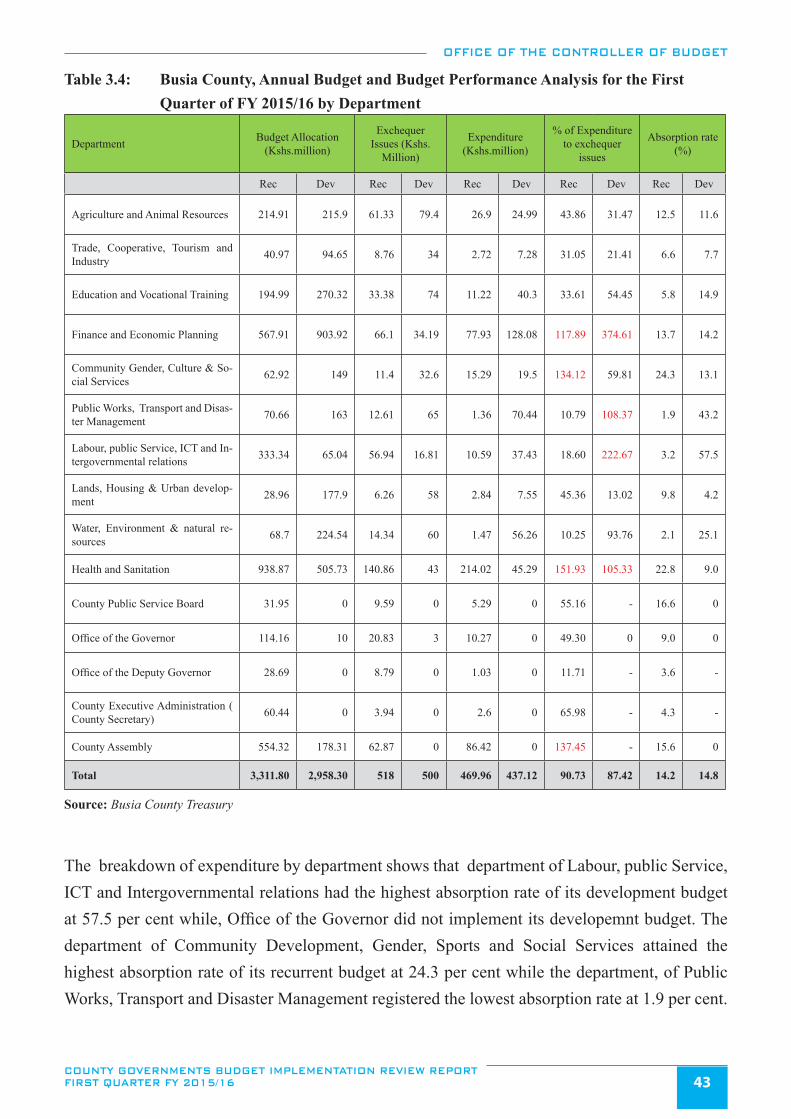
OFFICE OF THE CONTROLLER OF BUDGET
COUNTY GOVERNMENTS BUDGET IMPLEMENTATION REVIEW REPORT FIRST QUARTER FY 2015/16 43
Table 3.4: Busia County, Annual Budget and Budget Performance Analysis for the First Quarter of FY 2015/16 by Department
Department Budget Allocation (Kshs.million)
Exchequer Issues (Kshs.
Million)
Expenditure (Kshs.million)
% of Expenditure to exchequer
issues
Absorption rate (%)
Rec Dev Rec Dev Rec Dev Rec Dev Rec Dev
Agriculture and Animal Resources 214.91 215.9 61.33 79.4 26.9 24.99 43.86 31.47 12.5 11.6
Trade, Cooperative, Tourism and Industry 40.97 94.65 8.76 34 2.72 7.28 31.05 21.41 6.6 7.7
Education and Vocational Training 194.99 270.32 33.38 74 11.22 40.3 33.61 54.45 5.8 14.9
Finance and Economic Planning 567.91 903.92 66.1 34.19 77.93 128.08 117.89 374.61 13.7 14.2
Community Gender, Culture & So-cial Services 62.92 149 11.4 32.6 15.29 19.5 134.12 59.81 24.3 13.1
Public Works, Transport and Disas-ter Management 70.66 163 12.61 65 1.36 70.44 10.79 108.37 1.9 43.2
Labour, public Service, ICT and In-tergovernmental relations 333.34 65.04 56.94 16.81 10.59 37.43 18.60 222.67 3.2 57.5
Lands, Housing & Urban develop-ment 28.96 177.9 6.26 58 2.84 7.55 45.36 13.02 9.8 4.2
Water, Environment & natural re-sources 68.7 224.54 14.34 60 1.47 56.26 10.25 93.76 2.1 25.1
Health and Sanitation 938.87 505.73 140.86 43 214.02 45.29 151.93 105.33 22.8 9.0
County Public Service Board 31.95 0 9.59 0 5.29 0 55.16 - 16.6 0
Office of the Governor 114.16 10 20.83 3 10.27 0 49.30 0 9.0 0
Office of the Deputy Governor 28.69 0 8.79 0 1.03 0 11.71 - 3.6 -
County Executive Administration ( County Secretary) 60.44 0 3.94 0 2.6 0 65.98 - 4.3 -
County Assembly 554.32 178.31 62.87 0 86.42 0 137.45 - 15.6 0
Total 3,311.80 2,958.30 518 500 469.96 437.12 90.73 87.42 14.2 14.8
Source: Busia County Treasury
The breakdown of expenditure by department shows that department of Labour, public Service, ICT and Intergovernmental relations had the highest absorption rate of its development budget at 57.5 per cent while, Office of the Governor did not implement its developemnt budget. The department of Community Development, Gender, Sports and Social Services attained the highest absorption rate of its recurrent budget at 24.3 per cent while the department, of Public Works, Transport and Disaster Management registered the lowest absorption rate at 1.9 per cent.
OFFICE OF THE CONTROLLER OF BUDGET
COUNTY GOVERNMENTS BUDGET IMPLEMENTATION REVIEW REPORT FIRST QUARTER FY 2015/1644
3.5.7 Observations and Recommendations
Busia County has made progress in addressing some of the challenges that affected budget implementation, such as improvement in absorption of development funds from 2.5 per cent in the first quarter of FY 2014/15 to 14.8 per cent in the period under review. This progress has been attributed to good procurement planning and improved staff capacity that has been attained through progressive training.
Despite the progress, the following challenges continue to hamper effective budget implementation:
i. The County Treasury is yet to develop a Supplementary Budget for approval by the County Assem-bly to authorize expenditure on conditional transfers from the National government contained in the CARA, 2015. Also, the County is yet to authorize spending of the cash balance from FY 2014/15. This means that, the County lacks authority to spend on both the conditional transfers and opening balance.
ii. Failure to establish an internal audit committee to oversee the internal audit arrangements as per Sec-tion 155 of the PFM Act 2012.
iii. Delay in submission of monthly and quarterly revenue and expenditure reports to the Office of the Controller of Budget.
The County should implement the following recommendations in order to improve budget execution:
i. The County should prepare a Supplementary Budget to include all conditional transfers contained in the CARA, 2015 as well as include the unspent balances from FY 2014/15 for approval by the County Assembly.
ii. The County should establish an internal audit committee to strengthen the internal audit function in line with Section 155 of the PFM Act, 2012.
iii. The County Treasury should ensure timely preparation and submission of financial reports to the OCOB in line with Section 166 and 168 of PFM, Act, 2012.
3.6 Elgeyo Marakwet County
3.6.1 Overview of the FY 2015/16 County Budget
The approved budget for Elgeyo Marakwet County for the FY 2015/16 amounts to Kshs.3.67 billion, with Kshs.2.52 billion (68.7 per cent) allocated to recurrent expenditure and Kshs.1.15 billion (31.3 per cent) to development expenditure.
In order to finance the budget, the County expects to receive Kshs.3.19 billion (87.1 per cent) as transfers from the National Government and collect Kshs.149.98 million (4.1 per cent) from local sources. The County also expects to receive a conditional grant (DANIDA and World Bank) of Kshs.40.98 million (1.1 per cent), receive other government grants (Fuel levy, maternal
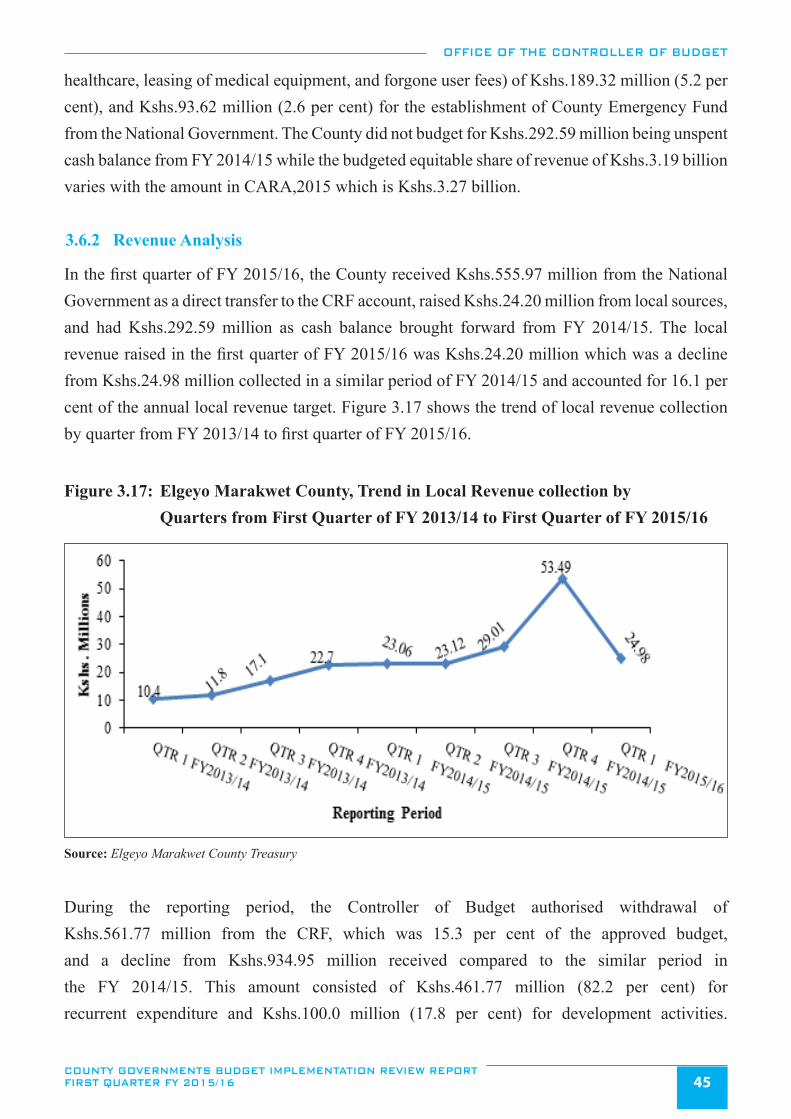
OFFICE OF THE CONTROLLER OF BUDGET
COUNTY GOVERNMENTS BUDGET IMPLEMENTATION REVIEW REPORT FIRST QUARTER FY 2015/16 45
healthcare, leasing of medical equipment, and forgone user fees) of Kshs.189.32 million (5.2 per cent), and Kshs.93.62 million (2.6 per cent) for the establishment of County Emergency Fund from the National Government. The County did not budget for Kshs.292.59 million being unspent cash balance from FY 2014/15 while the budgeted equitable share of revenue of Kshs.3.19 billion varies with the amount in CARA,2015 which is Kshs.3.27 billion.
3.6.2 Revenue Analysis
In the first quarter of FY 2015/16, the County received Kshs.555.97 million from the National Government as a direct transfer to the CRF account, raised Kshs.24.20 million from local sources, and had Kshs.292.59 million as cash balance brought forward from FY 2014/15. The local revenue raised in the first quarter of FY 2015/16 was Kshs.24.20 million which was a decline from Kshs.24.98 million collected in a similar period of FY 2014/15 and accounted for 16.1 per cent of the annual local revenue target. Figure 3.17 shows the trend of local revenue collection by quarter from FY 2013/14 to first quarter of FY 2015/16.
Figure 3.17: Elgeyo Marakwet County, Trend in Local Revenue collection by Quarters from First Quarter of FY 2013/14 to First Quarter of FY 2015/16
Source: Elgeyo Marakwet County Treasury
During the reporting period, the Controller of Budget authorised withdrawal of Kshs.561.77 million from the CRF, which was 15.3 per cent of the approved budget, and a decline from Kshs.934.95 million received compared to the similar period in the FY 2014/15. This amount consisted of Kshs.461.77 million (82.2 per cent) for recurrent expenditure and Kshs.100.0 million (17.8 per cent) for development activities.
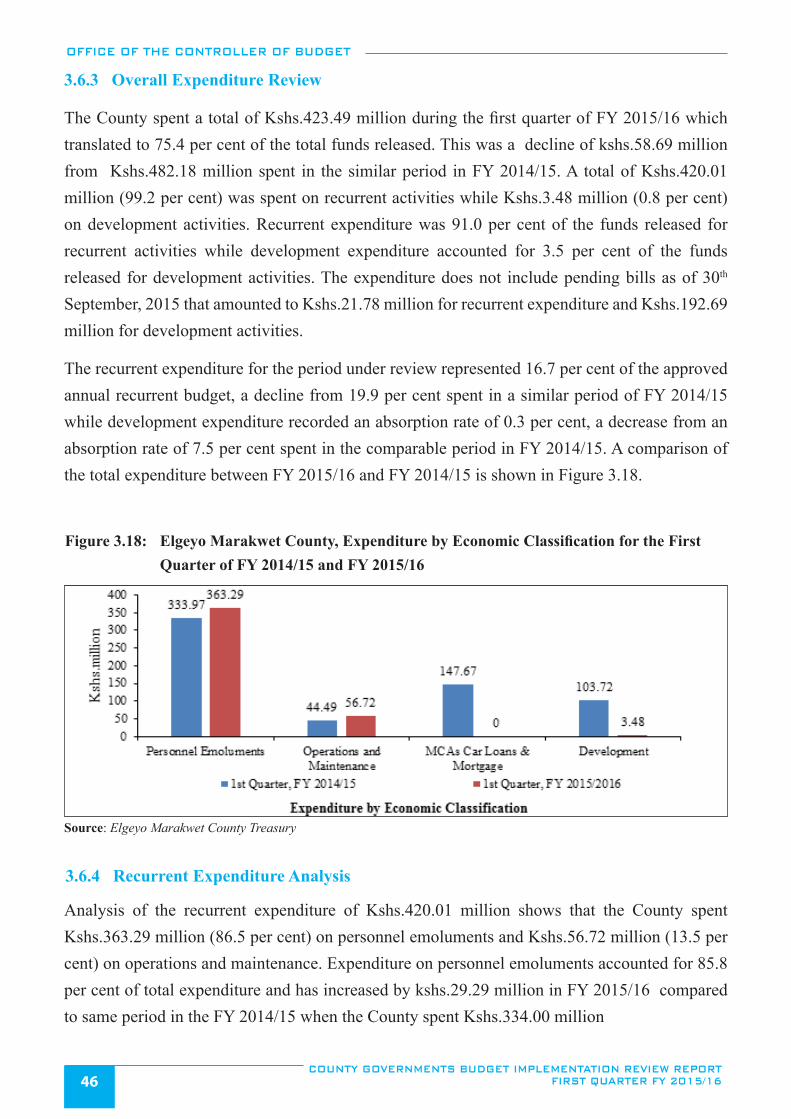
OFFICE OF THE CONTROLLER OF BUDGET
COUNTY GOVERNMENTS BUDGET IMPLEMENTATION REVIEW REPORT FIRST QUARTER FY 2015/1646
3.6.3 Overall Expenditure Review
The County spent a total of Kshs.423.49 million during the first quarter of FY 2015/16 which translated to 75.4 per cent of the total funds released. This was a decline of kshs.58.69 million from Kshs.482.18 million spent in the similar period in FY 2014/15. A total of Kshs.420.01 million (99.2 per cent) was spent on recurrent activities while Kshs.3.48 million (0.8 per cent) on development activities. Recurrent expenditure was 91.0 per cent of the funds released for recurrent activities while development expenditure accounted for 3.5 per cent of the funds released for development activities. The expenditure does not include pending bills as of 30th September, 2015 that amounted to Kshs.21.78 million for recurrent expenditure and Kshs.192.69 million for development activities.
The recurrent expenditure for the period under review represented 16.7 per cent of the approved annual recurrent budget, a decline from 19.9 per cent spent in a similar period of FY 2014/15 while development expenditure recorded an absorption rate of 0.3 per cent, a decrease from an absorption rate of 7.5 per cent spent in the comparable period in FY 2014/15. A comparison of the total expenditure between FY 2015/16 and FY 2014/15 is shown in Figure 3.18.
Figure 3.18: Elgeyo Marakwet County, Expenditure by Economic Classification for the First Quarter of FY 2014/15 and FY 2015/16
Source: Elgeyo Marakwet County Treasury
3.6.4 Recurrent Expenditure Analysis
Analysis of the recurrent expenditure of Kshs.420.01 million shows that the County spent Kshs.363.29 million (86.5 per cent) on personnel emoluments and Kshs.56.72 million (13.5 per cent) on operations and maintenance. Expenditure on personnel emoluments accounted for 85.8 per cent of total expenditure and has increased by kshs.29.29 million in FY 2015/16 compared to same period in the FY 2014/15 when the County spent Kshs.334.00 million
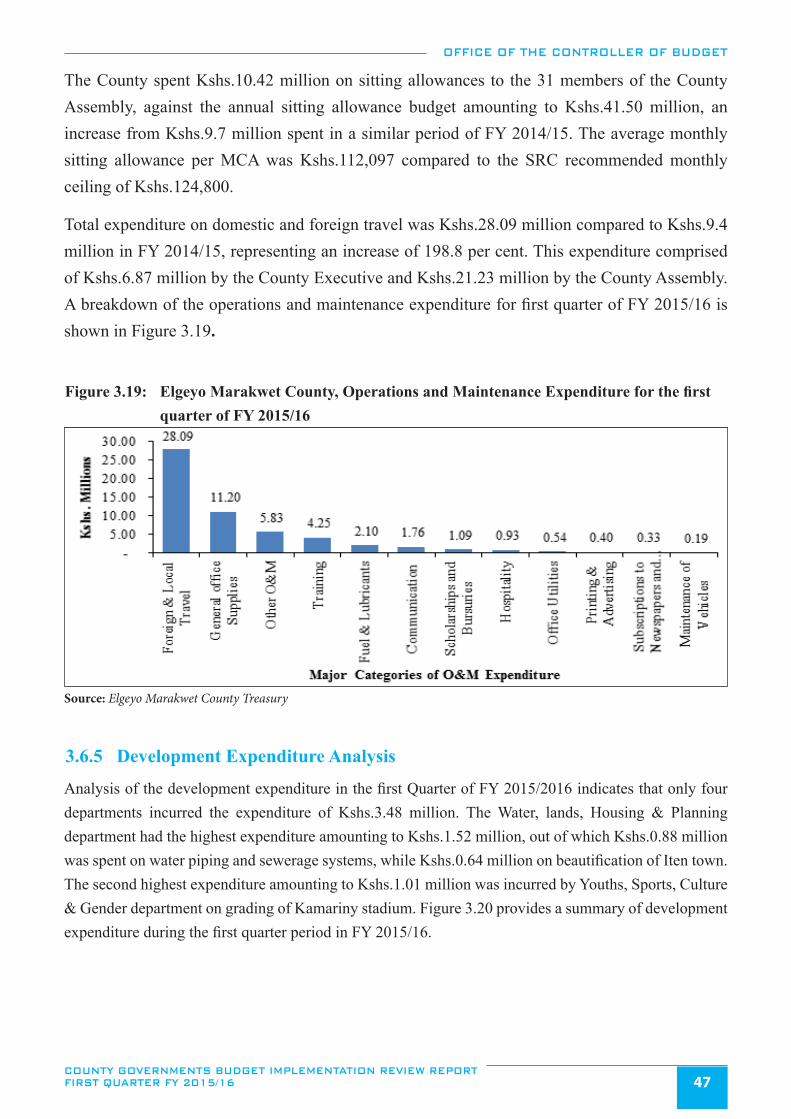
OFFICE OF THE CONTROLLER OF BUDGET
COUNTY GOVERNMENTS BUDGET IMPLEMENTATION REVIEW REPORT FIRST QUARTER FY 2015/16 47
The County spent Kshs.10.42 million on sitting allowances to the 31 members of the County Assembly, against the annual sitting allowance budget amounting to Kshs.41.50 million, an increase from Kshs.9.7 million spent in a similar period of FY 2014/15. The average monthly sitting allowance per MCA was Kshs.112,097 compared to the SRC recommended monthly ceiling of Kshs.124,800.
Total expenditure on domestic and foreign travel was Kshs.28.09 million compared to Kshs.9.4 million in FY 2014/15, representing an increase of 198.8 per cent. This expenditure comprised of Kshs.6.87 million by the County Executive and Kshs.21.23 million by the County Assembly. A breakdown of the operations and maintenance expenditure for first quarter of FY 2015/16 is shown in Figure 3.19.
Figure 3.19: Elgeyo Marakwet County, Operations and Maintenance Expenditure for the first quarter of FY 2015/16
Source: Elgeyo Marakwet County Treasury
3.6.5 Development Expenditure Analysis
Analysis of the development expenditure in the first Quarter of FY 2015/2016 indicates that only four departments incurred the expenditure of Kshs.3.48 million. The Water, lands, Housing & Planning department had the highest expenditure amounting to Kshs.1.52 million, out of which Kshs.0.88 million was spent on water piping and sewerage systems, while Kshs.0.64 million on beautification of Iten town. The second highest expenditure amounting to Kshs.1.01 million was incurred by Youths, Sports, Culture & Gender department on grading of Kamariny stadium. Figure 3.20 provides a summary of development expenditure during the first quarter period in FY 2015/16.
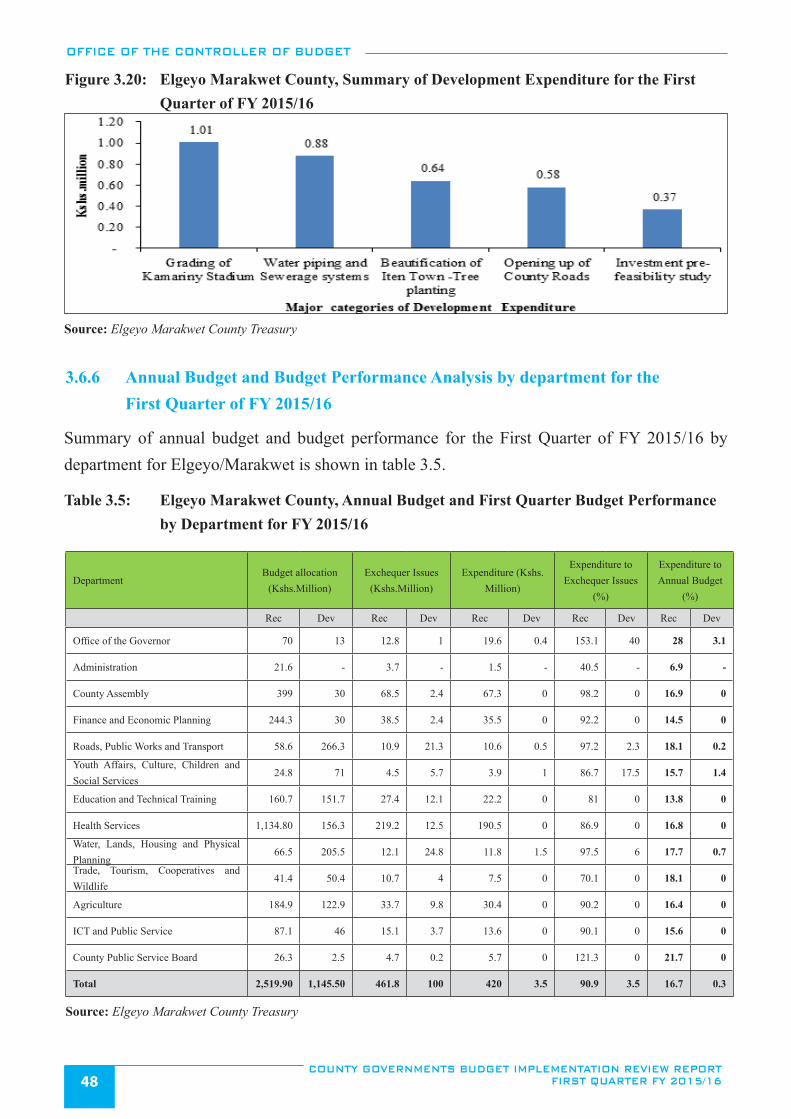
OFFICE OF THE CONTROLLER OF BUDGET
COUNTY GOVERNMENTS BUDGET IMPLEMENTATION REVIEW REPORT FIRST QUARTER FY 2015/1648
Figure 3.20: Elgeyo Marakwet County, Summary of Development Expenditure for the First Quarter of FY 2015/16
Source: Elgeyo Marakwet County Treasury
3.6.6 Annual Budget and Budget Performance Analysis by department for the First Quarter of FY 2015/16
Summary of annual budget and budget performance for the First Quarter of FY 2015/16 by department for Elgeyo/Marakwet is shown in table 3.5.
Table 3.5: Elgeyo Marakwet County, Annual Budget and First Quarter Budget Performance by Department for FY 2015/16
DepartmentBudget allocation
(Kshs.Million)Exchequer Issues
(Kshs.Million)Expenditure (Kshs.
Million)
Expenditure to Exchequer Issues
(%)
Expenditure to Annual Budget
(%)
Rec Dev Rec Dev Rec Dev Rec Dev Rec Dev
Office of the Governor 70 13 12.8 1 19.6 0.4 153.1 40 28 3.1
Administration 21.6 - 3.7 - 1.5 - 40.5 - 6.9 -
County Assembly 399 30 68.5 2.4 67.3 0 98.2 0 16.9 0
Finance and Economic Planning 244.3 30 38.5 2.4 35.5 0 92.2 0 14.5 0
Roads, Public Works and Transport 58.6 266.3 10.9 21.3 10.6 0.5 97.2 2.3 18.1 0.2
Youth Affairs, Culture, Children and Social Services
24.8 71 4.5 5.7 3.9 1 86.7 17.5 15.7 1.4
Education and Technical Training 160.7 151.7 27.4 12.1 22.2 0 81 0 13.8 0
Health Services 1,134.80 156.3 219.2 12.5 190.5 0 86.9 0 16.8 0
Water, Lands, Housing and Physical Planning
66.5 205.5 12.1 24.8 11.8 1.5 97.5 6 17.7 0.7
Trade, Tourism, Cooperatives and Wildlife
41.4 50.4 10.7 4 7.5 0 70.1 0 18.1 0
Agriculture 184.9 122.9 33.7 9.8 30.4 0 90.2 0 16.4 0
ICT and Public Service 87.1 46 15.1 3.7 13.6 0 90.1 0 15.6 0
County Public Service Board 26.3 2.5 4.7 0.2 5.7 0 121.3 0 21.7 0
Total 2,519.90 1,145.50 461.8 100 420 3.5 90.9 3.5 16.7 0.3
Source: Elgeyo Marakwet County Treasury
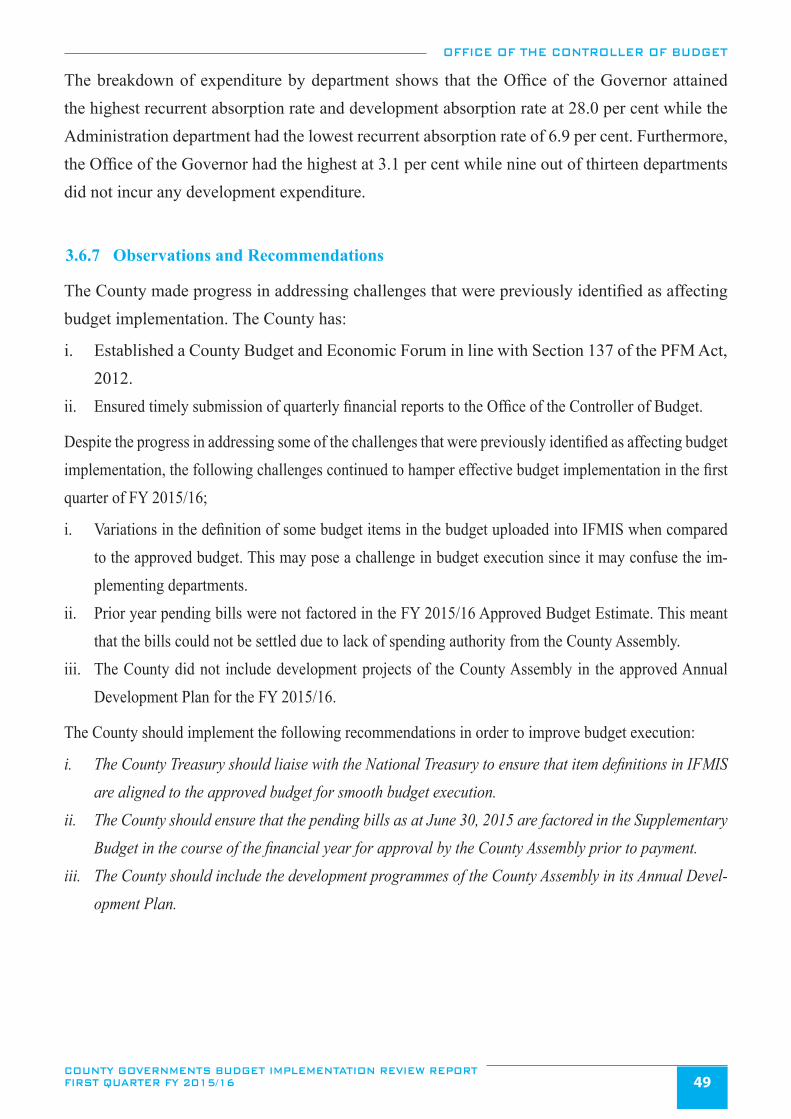
OFFICE OF THE CONTROLLER OF BUDGET
COUNTY GOVERNMENTS BUDGET IMPLEMENTATION REVIEW REPORT FIRST QUARTER FY 2015/16 49
The breakdown of expenditure by department shows that the Office of the Governor attained the highest recurrent absorption rate and development absorption rate at 28.0 per cent while the Administration department had the lowest recurrent absorption rate of 6.9 per cent. Furthermore, the Office of the Governor had the highest at 3.1 per cent while nine out of thirteen departments did not incur any development expenditure.
3.6.7 Observations and Recommendations
The County made progress in addressing challenges that were previously identified as affecting budget implementation. The County has:
i. Established a County Budget and Economic Forum in line with Section 137 of the PFM Act, 2012.
ii. Ensured timely submission of quarterly financial reports to the Office of the Controller of Budget.
Despite the progress in addressing some of the challenges that were previously identified as affecting budget implementation, the following challenges continued to hamper effective budget implementation in the first quarter of FY 2015/16;
i. Variations in the definition of some budget items in the budget uploaded into IFMIS when compared to the approved budget. This may pose a challenge in budget execution since it may confuse the im-plementing departments.
ii. Prior year pending bills were not factored in the FY 2015/16 Approved Budget Estimate. This meant that the bills could not be settled due to lack of spending authority from the County Assembly.
iii. The County did not include development projects of the County Assembly in the approved Annual Development Plan for the FY 2015/16.
The County should implement the following recommendations in order to improve budget execution:
i. The County Treasury should liaise with the National Treasury to ensure that item definitions in IFMIS are aligned to the approved budget for smooth budget execution.
ii. The County should ensure that the pending bills as at June 30, 2015 are factored in the Supplementary Budget in the course of the financial year for approval by the County Assembly prior to payment.
iii. The County should include the development programmes of the County Assembly in its Annual Devel-opment Plan.
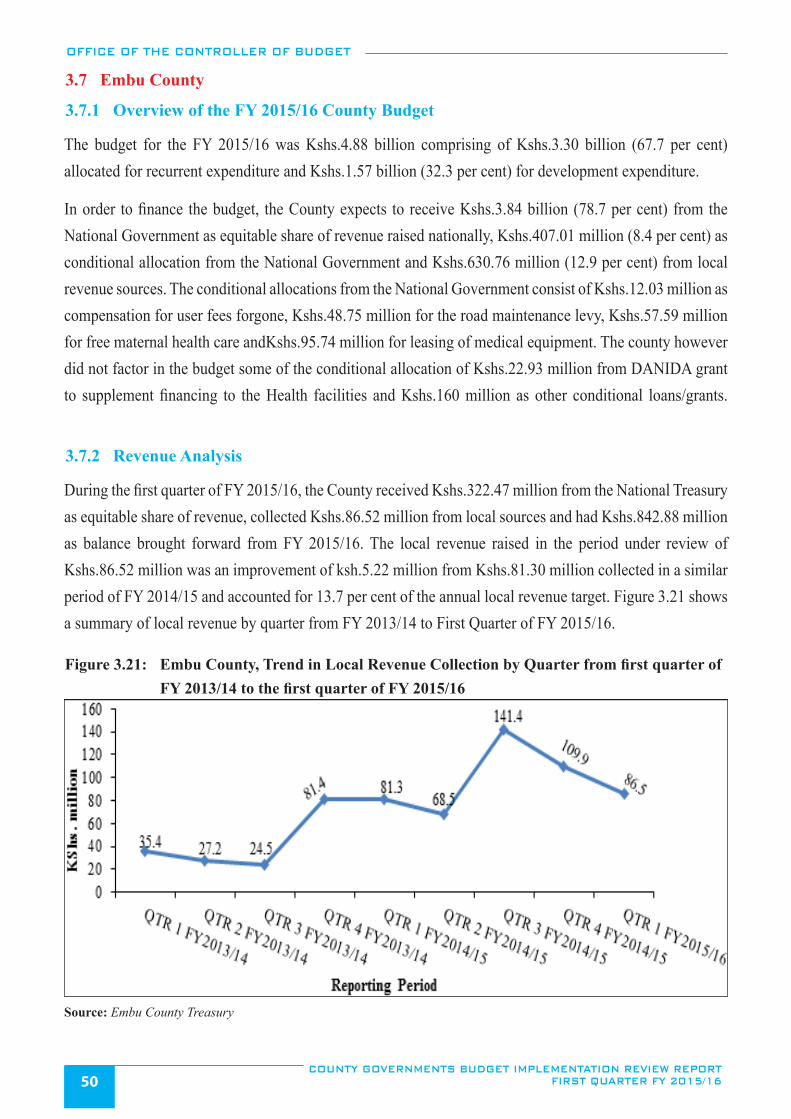
OFFICE OF THE CONTROLLER OF BUDGET
COUNTY GOVERNMENTS BUDGET IMPLEMENTATION REVIEW REPORT FIRST QUARTER FY 2015/1650
3.7 Embu County
3.7.1 Overview of the FY 2015/16 County Budget
The budget for the FY 2015/16 was Kshs.4.88 billion comprising of Kshs.3.30 billion (67.7 per cent) allocated for recurrent expenditure and Kshs.1.57 billion (32.3 per cent) for development expenditure.
In order to finance the budget, the County expects to receive Kshs.3.84 billion (78.7 per cent) from the National Government as equitable share of revenue raised nationally, Kshs.407.01 million (8.4 per cent) as conditional allocation from the National Government and Kshs.630.76 million (12.9 per cent) from local revenue sources. The conditional allocations from the National Government consist of Kshs.12.03 million as compensation for user fees forgone, Kshs.48.75 million for the road maintenance levy, Kshs.57.59 million for free maternal health care andKshs.95.74 million for leasing of medical equipment. The county however did not factor in the budget some of the conditional allocation of Kshs.22.93 million from DANIDA grant to supplement financing to the Health facilities and Kshs.160 million as other conditional loans/grants.
3.7.2 Revenue Analysis
During the first quarter of FY 2015/16, the County received Kshs.322.47 million from the National Treasury as equitable share of revenue, collected Kshs.86.52 million from local sources and had Kshs.842.88 million as balance brought forward from FY 2015/16. The local revenue raised in the period under review of Kshs.86.52 million was an improvement of ksh.5.22 million from Kshs.81.30 million collected in a similar period of FY 2014/15 and accounted for 13.7 per cent of the annual local revenue target. Figure 3.21 shows a summary of local revenue by quarter from FY 2013/14 to First Quarter of FY 2015/16.
Figure 3.21: Embu County, Trend in Local Revenue Collection by Quarter from first quarter of FY 2013/14 to the first quarter of FY 2015/16
Source: Embu County Treasury
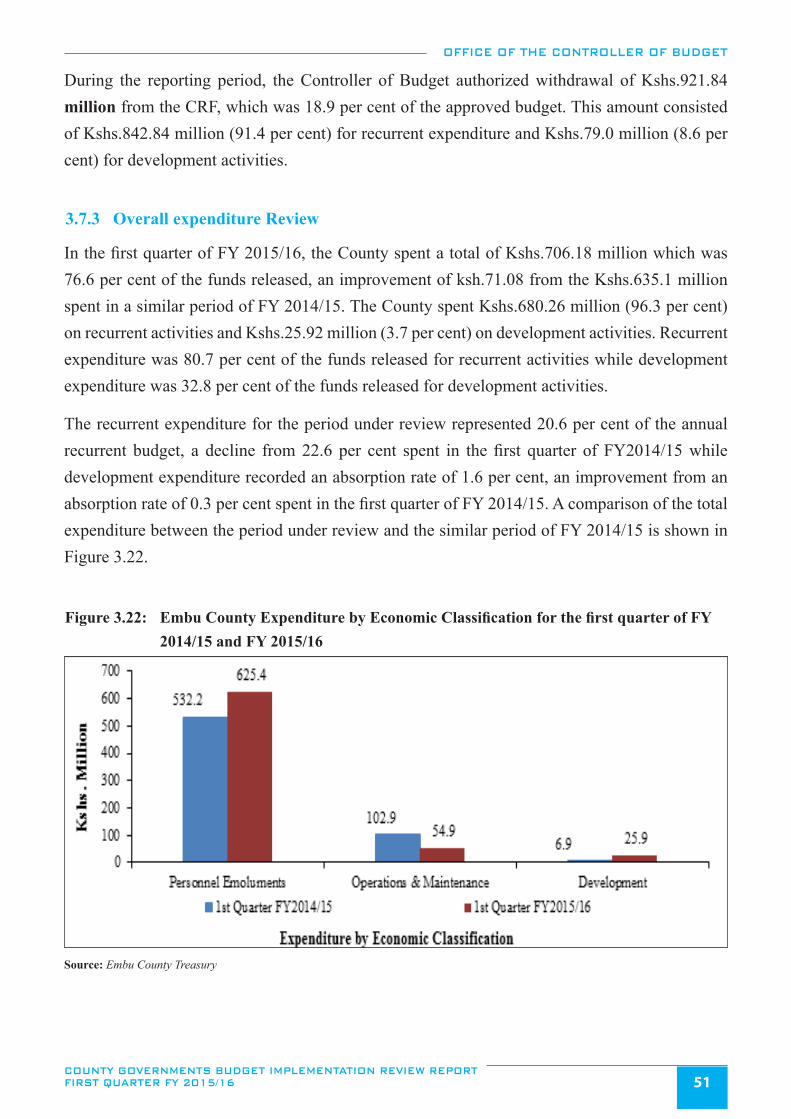
OFFICE OF THE CONTROLLER OF BUDGET
COUNTY GOVERNMENTS BUDGET IMPLEMENTATION REVIEW REPORT FIRST QUARTER FY 2015/16 51
During the reporting period, the Controller of Budget authorized withdrawal of Kshs.921.84 million from the CRF, which was 18.9 per cent of the approved budget. This amount consisted of Kshs.842.84 million (91.4 per cent) for recurrent expenditure and Kshs.79.0 million (8.6 per cent) for development activities.
3.7.3 Overall expenditure Review
In the first quarter of FY 2015/16, the County spent a total of Kshs.706.18 million which was 76.6 per cent of the funds released, an improvement of ksh.71.08 from the Kshs.635.1 million spent in a similar period of FY 2014/15. The County spent Kshs.680.26 million (96.3 per cent) on recurrent activities and Kshs.25.92 million (3.7 per cent) on development activities. Recurrent expenditure was 80.7 per cent of the funds released for recurrent activities while development expenditure was 32.8 per cent of the funds released for development activities.
The recurrent expenditure for the period under review represented 20.6 per cent of the annual recurrent budget, a decline from 22.6 per cent spent in the first quarter of FY2014/15 while development expenditure recorded an absorption rate of 1.6 per cent, an improvement from an absorption rate of 0.3 per cent spent in the first quarter of FY 2014/15. A comparison of the total expenditure between the period under review and the similar period of FY 2014/15 is shown in Figure 3.22.
Figure 3.22: Embu County Expenditure by Economic Classification for the first quarter of FY 2014/15 and FY 2015/16
Source: Embu County Treasury
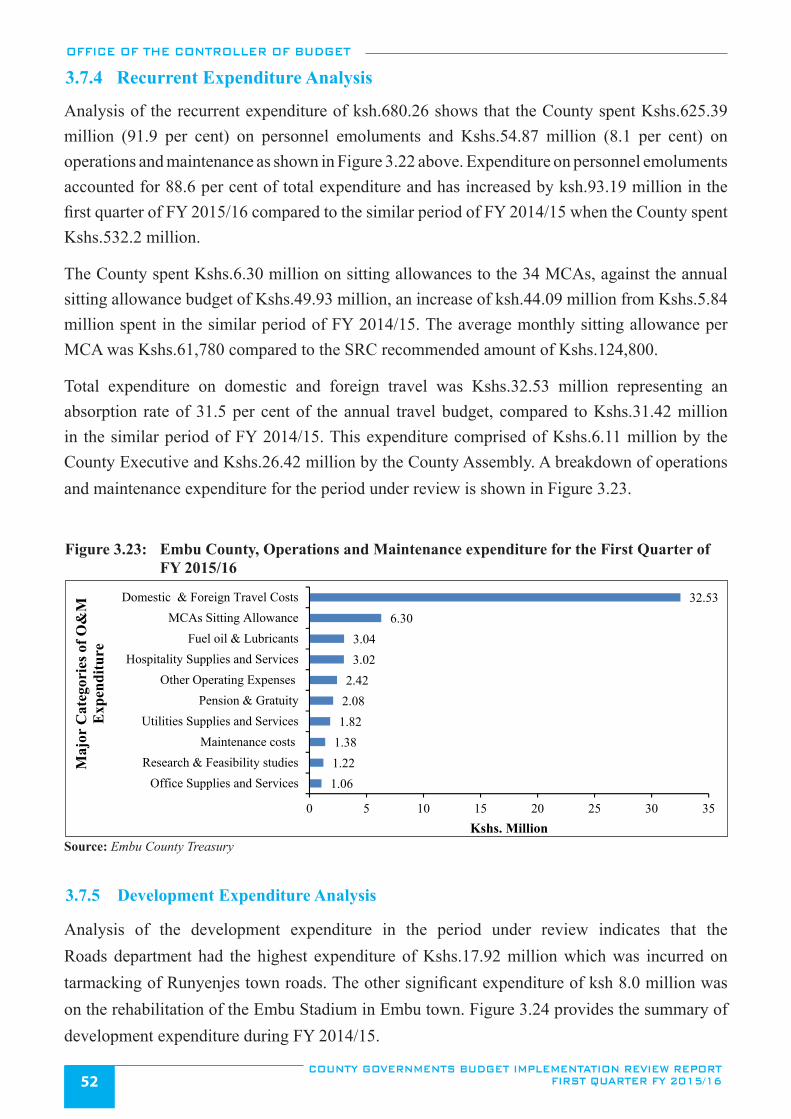
OFFICE OF THE CONTROLLER OF BUDGET
COUNTY GOVERNMENTS BUDGET IMPLEMENTATION REVIEW REPORT FIRST QUARTER FY 2015/1652
3.7.4 Recurrent Expenditure Analysis
Analysis of the recurrent expenditure of ksh.680.26 shows that the County spent Kshs.625.39 million (91.9 per cent) on personnel emoluments and Kshs.54.87 million (8.1 per cent) on operations and maintenance as shown in Figure 3.22 above. Expenditure on personnel emoluments accounted for 88.6 per cent of total expenditure and has increased by ksh.93.19 million in the first quarter of FY 2015/16 compared to the similar period of FY 2014/15 when the County spent Kshs.532.2 million.
The County spent Kshs.6.30 million on sitting allowances to the 34 MCAs, against the annual sitting allowance budget of Kshs.49.93 million, an increase of ksh.44.09 million from Kshs.5.84 million spent in the similar period of FY 2014/15. The average monthly sitting allowance per MCA was Kshs.61,780 compared to the SRC recommended amount of Kshs.124,800.
Total expenditure on domestic and foreign travel was Kshs.32.53 million representing an absorption rate of 31.5 per cent of the annual travel budget, compared to Kshs.31.42 million in the similar period of FY 2014/15. This expenditure comprised of Kshs.6.11 million by the County Executive and Kshs.26.42 million by the County Assembly. A breakdown of operations and maintenance expenditure for the period under review is shown in Figure 3.23.
Figure 3.23: Embu County, Operations and Maintenance expenditure for the First Quarter of FY 2015/16
1.061.221.381.822.082.42
3.023.04
6.3032.53
0 5 10 15 20 25 30 35
Office Supplies and ServicesResearch & Feasibility studies
Maintenance costsUtilities Supplies and Services
Pension & GratuityOther Operating Expenses
Hospitality Supplies and ServicesFuel oil & Lubricants
MCAs Sitting AllowanceDomestic & Foreign Travel Costs
Kshs. Million
Maj
or C
ateg
orie
s of O
&M
E
xpen
ditu
re
Source: Embu County Treasury
3.7.5 Development Expenditure Analysis
Analysis of the development expenditure in the period under review indicates that the Roads department had the highest expenditure of Kshs.17.92 million which was incurred on tarmacking of Runyenjes town roads. The other significant expenditure of ksh 8.0 million was on the rehabilitation of the Embu Stadium in Embu town. Figure 3.24 provides the summary of development expenditure during FY 2014/15.
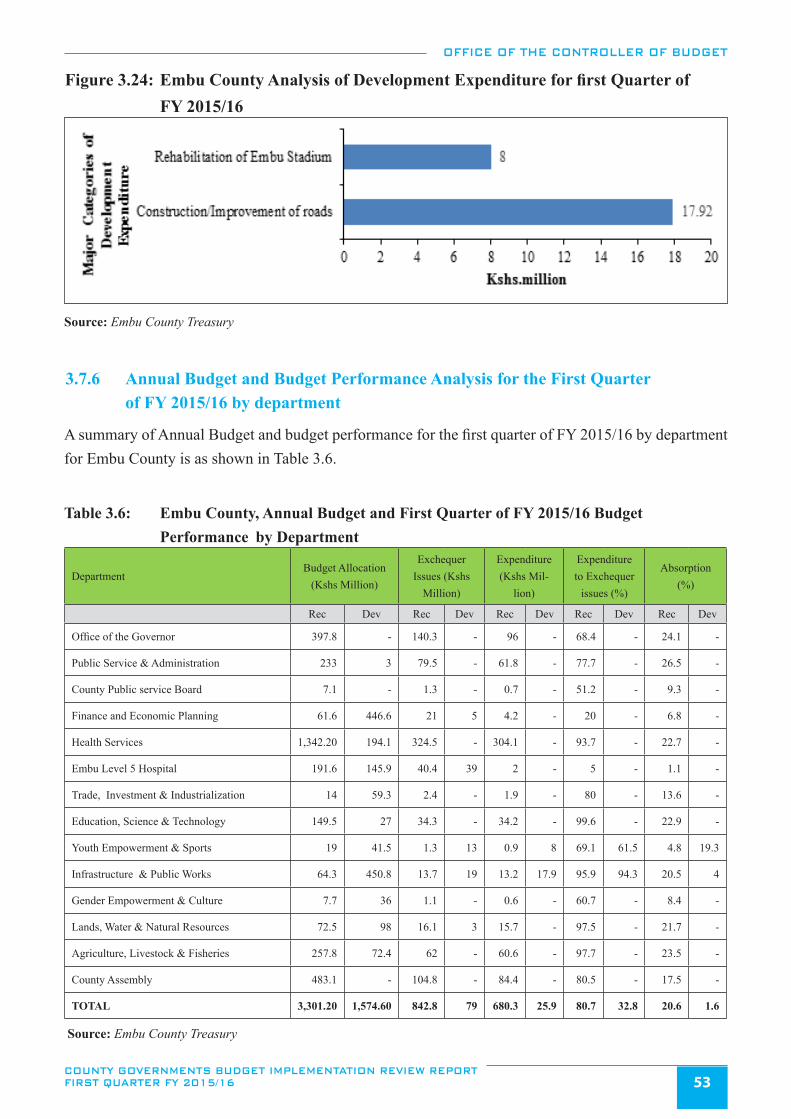
OFFICE OF THE CONTROLLER OF BUDGET
COUNTY GOVERNMENTS BUDGET IMPLEMENTATION REVIEW REPORT FIRST QUARTER FY 2015/16 53
Figure 3.24: Embu County Analysis of Development Expenditure for first Quarter of FY 2015/16
Source: Embu County Treasury
3.7.6 Annual Budget and Budget Performance Analysis for the First Quarter of FY 2015/16 by department
A summary of Annual Budget and budget performance for the first quarter of FY 2015/16 by department for Embu County is as shown in Table 3.6.
Table 3.6: Embu County, Annual Budget and First Quarter of FY 2015/16 Budget Performance by Department
DepartmentBudget Allocation
(Kshs Million)
Exchequer Issues (Kshs
Million)
Expenditure (Kshs Mil-
lion)
Expenditure to Exchequer
issues (%)
Absorption (%)
Rec Dev Rec Dev Rec Dev Rec Dev Rec Dev
Office of the Governor 397.8 - 140.3 - 96 - 68.4 - 24.1 -
Public Service & Administration 233 3 79.5 - 61.8 - 77.7 - 26.5 -
County Public service Board 7.1 - 1.3 - 0.7 - 51.2 - 9.3 -
Finance and Economic Planning 61.6 446.6 21 5 4.2 - 20 - 6.8 -
Health Services 1,342.20 194.1 324.5 - 304.1 - 93.7 - 22.7 -
Embu Level 5 Hospital 191.6 145.9 40.4 39 2 - 5 - 1.1 -
Trade, Investment & Industrialization 14 59.3 2.4 - 1.9 - 80 - 13.6 -
Education, Science & Technology 149.5 27 34.3 - 34.2 - 99.6 - 22.9 -
Youth Empowerment & Sports 19 41.5 1.3 13 0.9 8 69.1 61.5 4.8 19.3
Infrastructure & Public Works 64.3 450.8 13.7 19 13.2 17.9 95.9 94.3 20.5 4
Gender Empowerment & Culture 7.7 36 1.1 - 0.6 - 60.7 - 8.4 -
Lands, Water & Natural Resources 72.5 98 16.1 3 15.7 - 97.5 - 21.7 -
Agriculture, Livestock & Fisheries 257.8 72.4 62 - 60.6 - 97.7 - 23.5 -
County Assembly 483.1 - 104.8 - 84.4 - 80.5 - 17.5 -
TOTAL 3,301.20 1,574.60 842.8 79 680.3 25.9 80.7 32.8 20.6 1.6
Source: Embu County Treasury
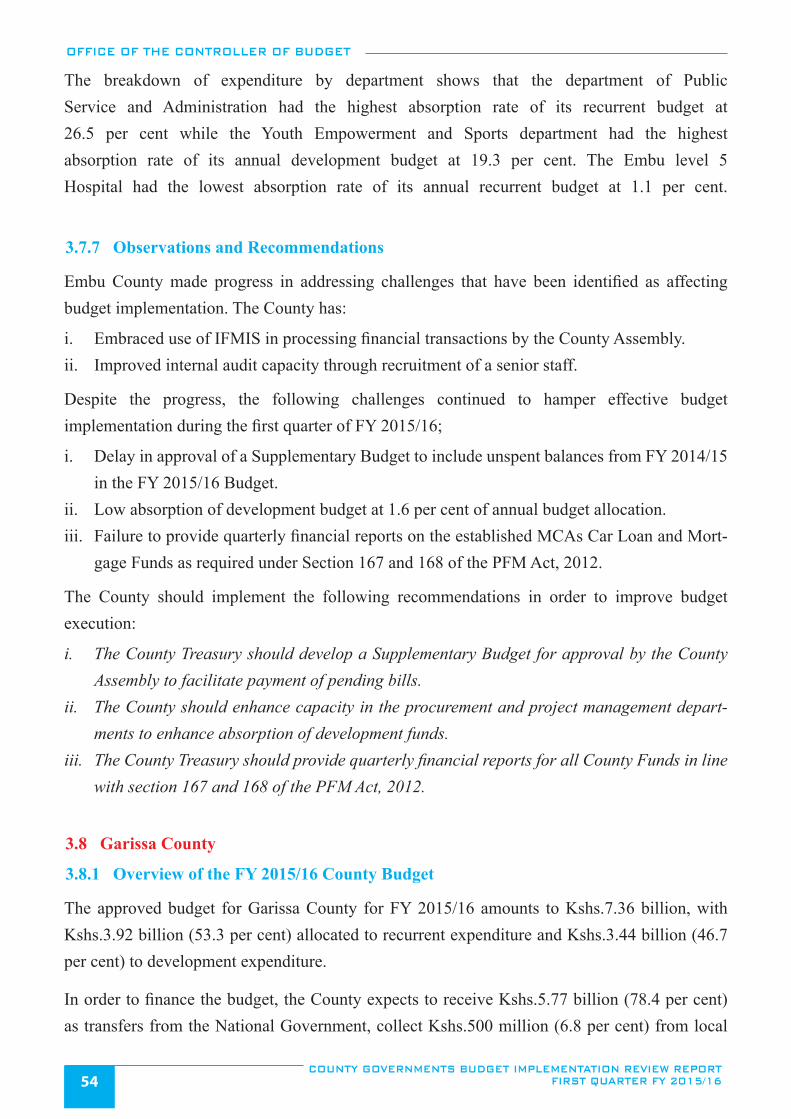
OFFICE OF THE CONTROLLER OF BUDGET
COUNTY GOVERNMENTS BUDGET IMPLEMENTATION REVIEW REPORT FIRST QUARTER FY 2015/1654
The breakdown of expenditure by department shows that the department of Public Service and Administration had the highest absorption rate of its recurrent budget at 26.5 per cent while the Youth Empowerment and Sports department had the highest absorption rate of its annual development budget at 19.3 per cent. The Embu level 5 Hospital had the lowest absorption rate of its annual recurrent budget at 1.1 per cent.
3.7.7 Observations and Recommendations
Embu County made progress in addressing challenges that have been identified as affecting budget implementation. The County has:
i. Embraced use of IFMIS in processing financial transactions by the County Assembly.ii. Improved internal audit capacity through recruitment of a senior staff.
Despite the progress, the following challenges continued to hamper effective budget implementation during the first quarter of FY 2015/16;
i. Delay in approval of a Supplementary Budget to include unspent balances from FY 2014/15 in the FY 2015/16 Budget.
ii. Low absorption of development budget at 1.6 per cent of annual budget allocation.iii. Failure to provide quarterly financial reports on the established MCAs Car Loan and Mort-
gage Funds as required under Section 167 and 168 of the PFM Act, 2012.
The County should implement the following recommendations in order to improve budget execution:
i. The County Treasury should develop a Supplementary Budget for approval by the County Assembly to facilitate payment of pending bills.
ii. The County should enhance capacity in the procurement and project management depart-ments to enhance absorption of development funds.
iii. The County Treasury should provide quarterly financial reports for all County Funds in line with section 167 and 168 of the PFM Act, 2012.
3.8 Garissa County
3.8.1 Overview of the FY 2015/16 County Budget
The approved budget for Garissa County for FY 2015/16 amounts to Kshs.7.36 billion, with Kshs.3.92 billion (53.3 per cent) allocated to recurrent expenditure and Kshs.3.44 billion (46.7 per cent) to development expenditure.
In order to finance the budget, the County expects to receive Kshs.5.77 billion (78.4 per cent) as transfers from the National Government, collect Kshs.500 million (6.8 per cent) from local
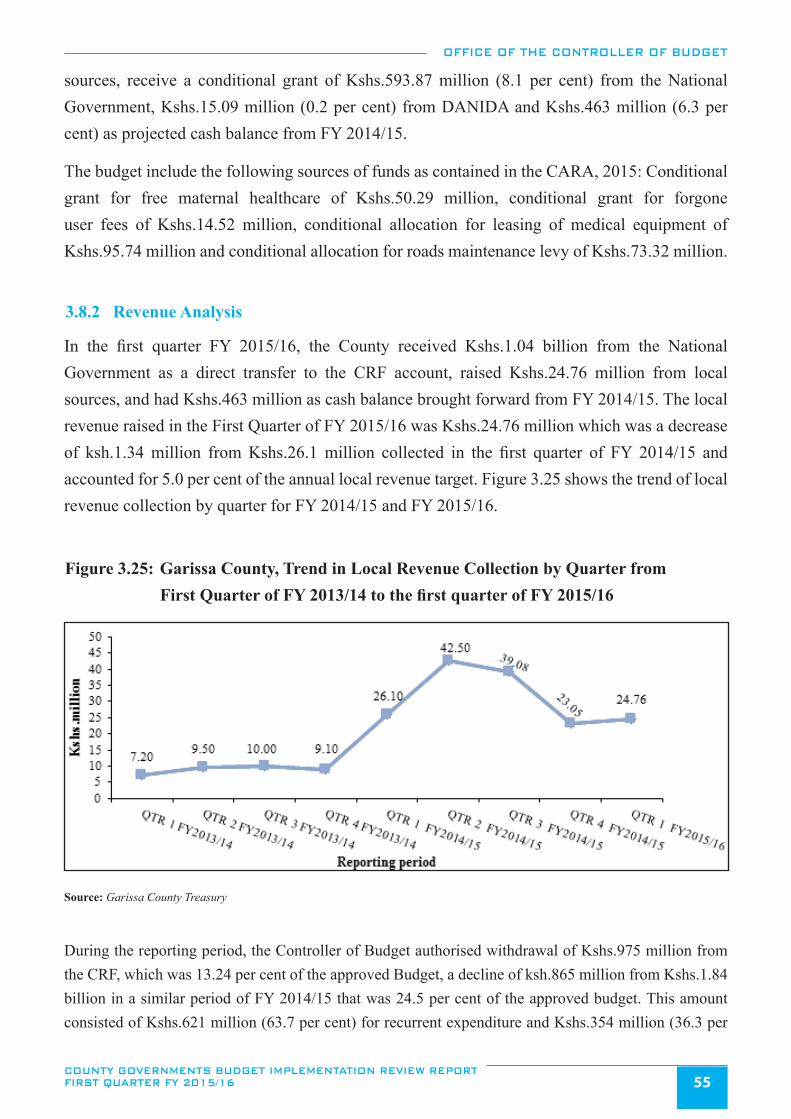
OFFICE OF THE CONTROLLER OF BUDGET
COUNTY GOVERNMENTS BUDGET IMPLEMENTATION REVIEW REPORT FIRST QUARTER FY 2015/16 55
sources, receive a conditional grant of Kshs.593.87 million (8.1 per cent) from the National Government, Kshs.15.09 million (0.2 per cent) from DANIDA and Kshs.463 million (6.3 per cent) as projected cash balance from FY 2014/15.
The budget include the following sources of funds as contained in the CARA, 2015: Conditional grant for free maternal healthcare of Kshs.50.29 million, conditional grant for forgone user fees of Kshs.14.52 million, conditional allocation for leasing of medical equipment of Kshs.95.74 million and conditional allocation for roads maintenance levy of Kshs.73.32 million.
3.8.2 Revenue Analysis
In the first quarter FY 2015/16, the County received Kshs.1.04 billion from the National Government as a direct transfer to the CRF account, raised Kshs.24.76 million from local sources, and had Kshs.463 million as cash balance brought forward from FY 2014/15. The local revenue raised in the First Quarter of FY 2015/16 was Kshs.24.76 million which was a decrease of ksh.1.34 million from Kshs.26.1 million collected in the first quarter of FY 2014/15 and accounted for 5.0 per cent of the annual local revenue target. Figure 3.25 shows the trend of local revenue collection by quarter for FY 2014/15 and FY 2015/16.
Figure 3.25: Garissa County, Trend in Local Revenue Collection by Quarter from First Quarter of FY 2013/14 to the first quarter of FY 2015/16
Source: Garissa County Treasury
During the reporting period, the Controller of Budget authorised withdrawal of Kshs.975 million from the CRF, which was 13.24 per cent of the approved Budget, a decline of ksh.865 million from Kshs.1.84 billion in a similar period of FY 2014/15 that was 24.5 per cent of the approved budget. This amount consisted of Kshs.621 million (63.7 per cent) for recurrent expenditure and Kshs.354 million (36.3 per
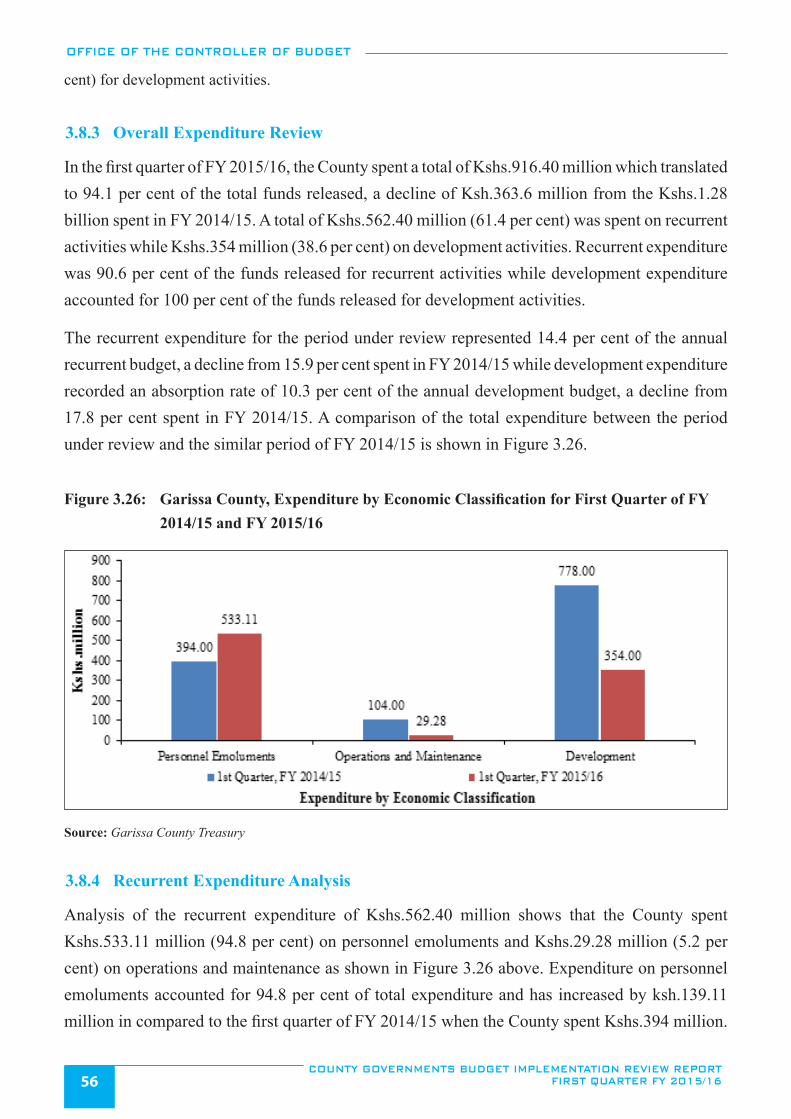
OFFICE OF THE CONTROLLER OF BUDGET
COUNTY GOVERNMENTS BUDGET IMPLEMENTATION REVIEW REPORT FIRST QUARTER FY 2015/1656
cent) for development activities.
3.8.3 Overall Expenditure Review
In the first quarter of FY 2015/16, the County spent a total of Kshs.916.40 million which translated to 94.1 per cent of the total funds released, a decline of Ksh.363.6 million from the Kshs.1.28 billion spent in FY 2014/15. A total of Kshs.562.40 million (61.4 per cent) was spent on recurrent activities while Kshs.354 million (38.6 per cent) on development activities. Recurrent expenditure was 90.6 per cent of the funds released for recurrent activities while development expenditure accounted for 100 per cent of the funds released for development activities.
The recurrent expenditure for the period under review represented 14.4 per cent of the annual recurrent budget, a decline from 15.9 per cent spent in FY 2014/15 while development expenditure recorded an absorption rate of 10.3 per cent of the annual development budget, a decline from 17.8 per cent spent in FY 2014/15. A comparison of the total expenditure between the period under review and the similar period of FY 2014/15 is shown in Figure 3.26.
Figure 3.26: Garissa County, Expenditure by Economic Classification for First Quarter of FY 2014/15 and FY 2015/16
Source: Garissa County Treasury
3.8.4 Recurrent Expenditure Analysis
Analysis of the recurrent expenditure of Kshs.562.40 million shows that the County spent Kshs.533.11 million (94.8 per cent) on personnel emoluments and Kshs.29.28 million (5.2 per cent) on operations and maintenance as shown in Figure 3.26 above. Expenditure on personnel emoluments accounted for 94.8 per cent of total expenditure and has increased by ksh.139.11 million in compared to the first quarter of FY 2014/15 when the County spent Kshs.394 million.
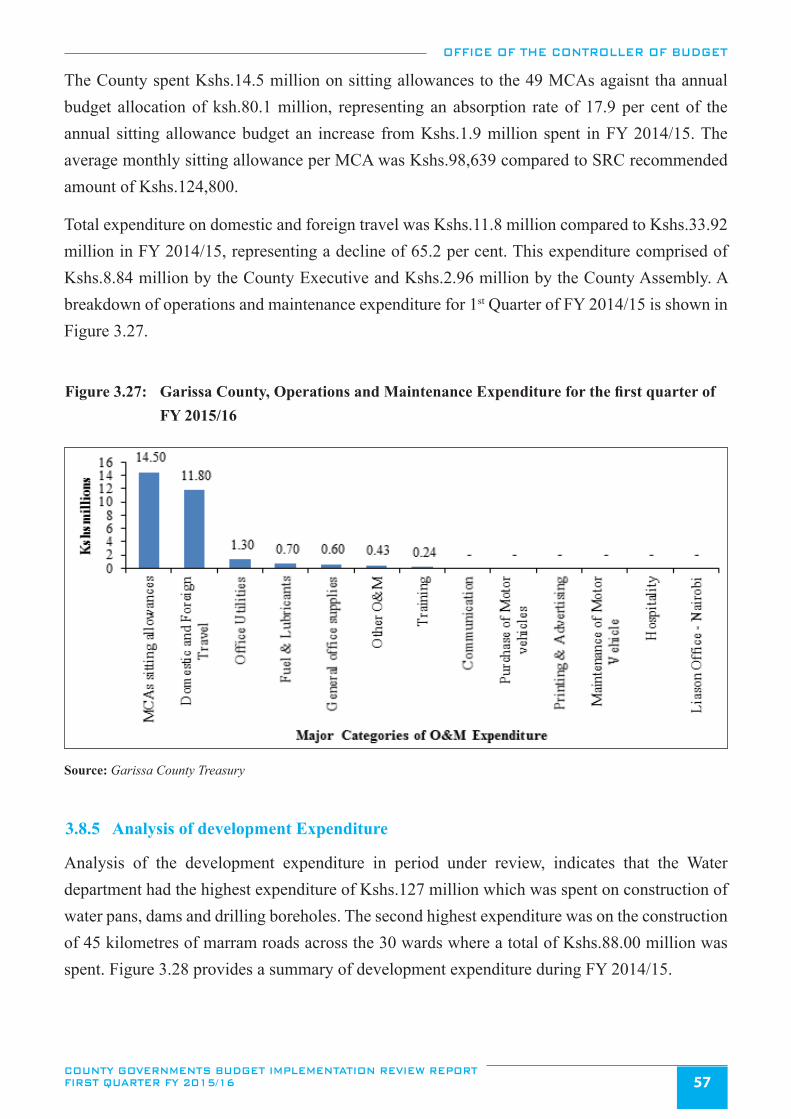
OFFICE OF THE CONTROLLER OF BUDGET
COUNTY GOVERNMENTS BUDGET IMPLEMENTATION REVIEW REPORT FIRST QUARTER FY 2015/16 57
The County spent Kshs.14.5 million on sitting allowances to the 49 MCAs agaisnt tha annual budget allocation of ksh.80.1 million, representing an absorption rate of 17.9 per cent of the annual sitting allowance budget an increase from Kshs.1.9 million spent in FY 2014/15. The average monthly sitting allowance per MCA was Kshs.98,639 compared to SRC recommended amount of Kshs.124,800.
Total expenditure on domestic and foreign travel was Kshs.11.8 million compared to Kshs.33.92 million in FY 2014/15, representing a decline of 65.2 per cent. This expenditure comprised of Kshs.8.84 million by the County Executive and Kshs.2.96 million by the County Assembly. A breakdown of operations and maintenance expenditure for 1st Quarter of FY 2014/15 is shown in Figure 3.27.
Figure 3.27: Garissa County, Operations and Maintenance Expenditure for the first quarter of FY 2015/16
Source: Garissa County Treasury
3.8.5 Analysis of development Expenditure
Analysis of the development expenditure in period under review, indicates that the Water department had the highest expenditure of Kshs.127 million which was spent on construction of water pans, dams and drilling boreholes. The second highest expenditure was on the construction of 45 kilometres of marram roads across the 30 wards where a total of Kshs.88.00 million was spent. Figure 3.28 provides a summary of development expenditure during FY 2014/15.
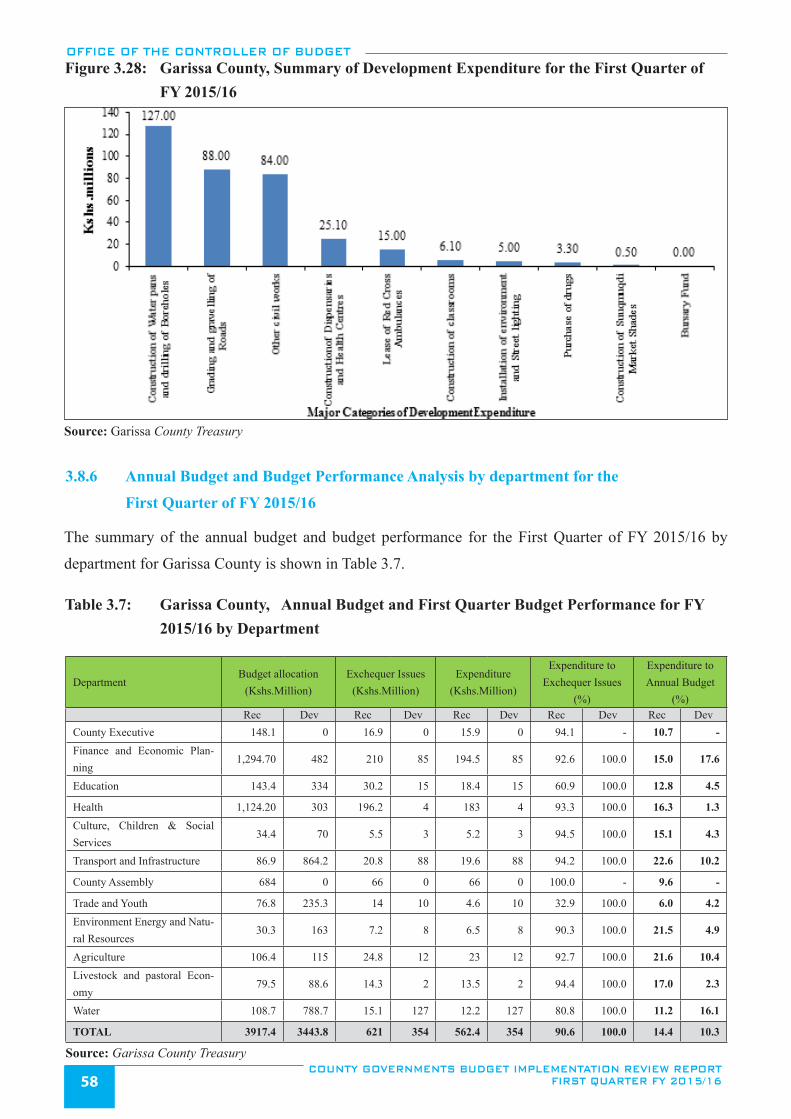
OFFICE OF THE CONTROLLER OF BUDGET
COUNTY GOVERNMENTS BUDGET IMPLEMENTATION REVIEW REPORT FIRST QUARTER FY 2015/1658
Figure 3.28: Garissa County, Summary of Development Expenditure for the First Quarter of FY 2015/16
Source: Garissa County Treasury
3.8.6 Annual Budget and Budget Performance Analysis by department for the
First Quarter of FY 2015/16
The summary of the annual budget and budget performance for the First Quarter of FY 2015/16 by
department for Garissa County is shown in Table 3.7.
Table 3.7: Garissa County, Annual Budget and First Quarter Budget Performance for FY 2015/16 by Department
DepartmentBudget allocation
(Kshs.Million)Exchequer Issues
(Kshs.Million)Expenditure
(Kshs.Million)
Expenditure to Exchequer Issues
(%)
Expenditure to Annual Budget
(%)Rec Dev Rec Dev Rec Dev Rec Dev Rec Dev
County Executive 148.1 0 16.9 0 15.9 0 94.1 - 10.7 - Finance and Economic Plan-ning
1,294.70 482 210 85 194.5 85 92.6 100.0 15.0 17.6
Education 143.4 334 30.2 15 18.4 15 60.9 100.0 12.8 4.5
Health 1,124.20 303 196.2 4 183 4 93.3 100.0 16.3 1.3Culture, Children & Social Services
34.4 70 5.5 3 5.2 3 94.5 100.0 15.1 4.3
Transport and Infrastructure 86.9 864.2 20.8 88 19.6 88 94.2 100.0 22.6 10.2
County Assembly 684 0 66 0 66 0 100.0 - 9.6 -
Trade and Youth 76.8 235.3 14 10 4.6 10 32.9 100.0 6.0 4.2Environment Energy and Natu-ral Resources
30.3 163 7.2 8 6.5 8 90.3 100.0 21.5 4.9
Agriculture 106.4 115 24.8 12 23 12 92.7 100.0 21.6 10.4Livestock and pastoral Econ-omy
79.5 88.6 14.3 2 13.5 2 94.4 100.0 17.0 2.3
Water 108.7 788.7 15.1 127 12.2 127 80.8 100.0 11.2 16.1
TOTAL 3917.4 3443.8 621 354 562.4 354 90.6 100.0 14.4 10.3
Source: Garissa County Treasury
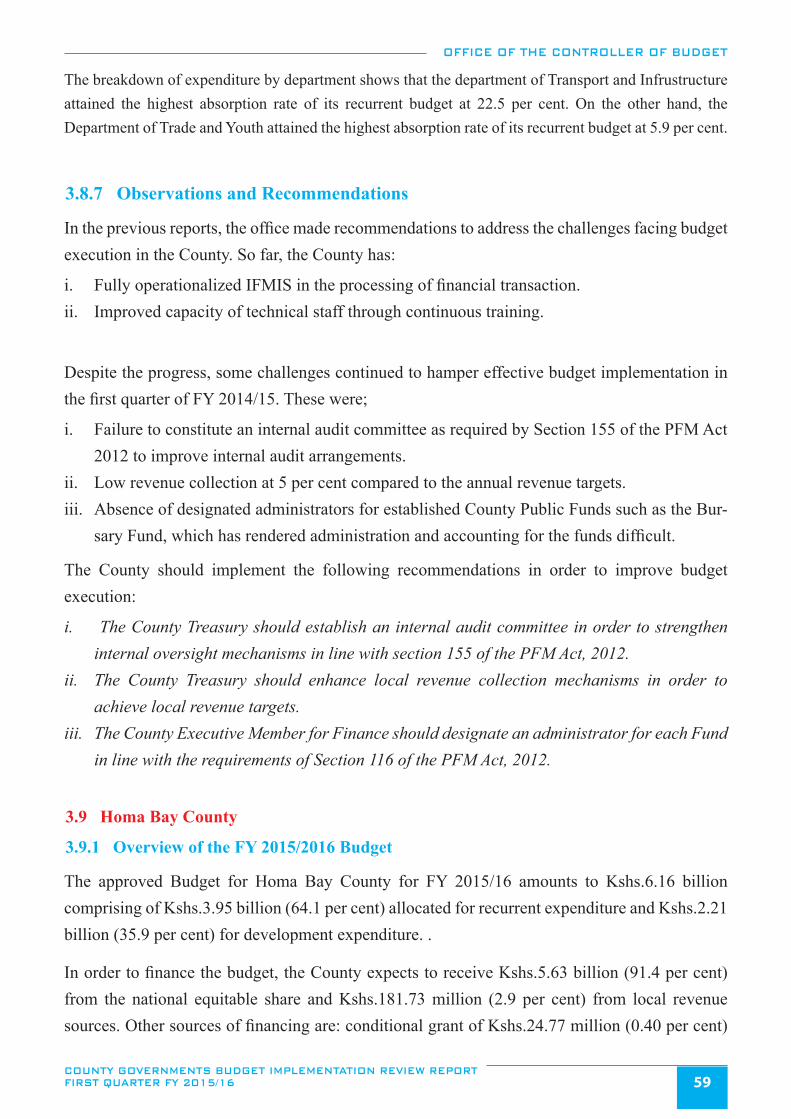
OFFICE OF THE CONTROLLER OF BUDGET
COUNTY GOVERNMENTS BUDGET IMPLEMENTATION REVIEW REPORT FIRST QUARTER FY 2015/16 59
The breakdown of expenditure by department shows that the department of Transport and Infrustructure attained the highest absorption rate of its recurrent budget at 22.5 per cent. On the other hand, the Department of Trade and Youth attained the highest absorption rate of its recurrent budget at 5.9 per cent.
3.8.7 Observations and Recommendations
In the previous reports, the office made recommendations to address the challenges facing budget execution in the County. So far, the County has:
i. Fully operationalized IFMIS in the processing of financial transaction.ii. Improved capacity of technical staff through continuous training.
Despite the progress, some challenges continued to hamper effective budget implementation in the first quarter of FY 2014/15. These were;
i. Failure to constitute an internal audit committee as required by Section 155 of the PFM Act 2012 to improve internal audit arrangements.
ii. Low revenue collection at 5 per cent compared to the annual revenue targets.iii. Absence of designated administrators for established County Public Funds such as the Bur-
sary Fund, which has rendered administration and accounting for the funds difficult.
The County should implement the following recommendations in order to improve budget execution:
i. The County Treasury should establish an internal audit committee in order to strengthen internal oversight mechanisms in line with section 155 of the PFM Act, 2012.
ii. The County Treasury should enhance local revenue collection mechanisms in order to achieve local revenue targets.
iii. The County Executive Member for Finance should designate an administrator for each Fund in line with the requirements of Section 116 of the PFM Act, 2012.
3.9 Homa Bay County
3.9.1 Overview of the FY 2015/2016 Budget
The approved Budget for Homa Bay County for FY 2015/16 amounts to Kshs.6.16 billion comprising of Kshs.3.95 billion (64.1 per cent) allocated for recurrent expenditure and Kshs.2.21 billion (35.9 per cent) for development expenditure. .
In order to finance the budget, the County expects to receive Kshs.5.63 billion (91.4 per cent) from the national equitable share and Kshs.181.73 million (2.9 per cent) from local revenue sources. Other sources of financing are: conditional grant of Kshs.24.77 million (0.40 per cent)
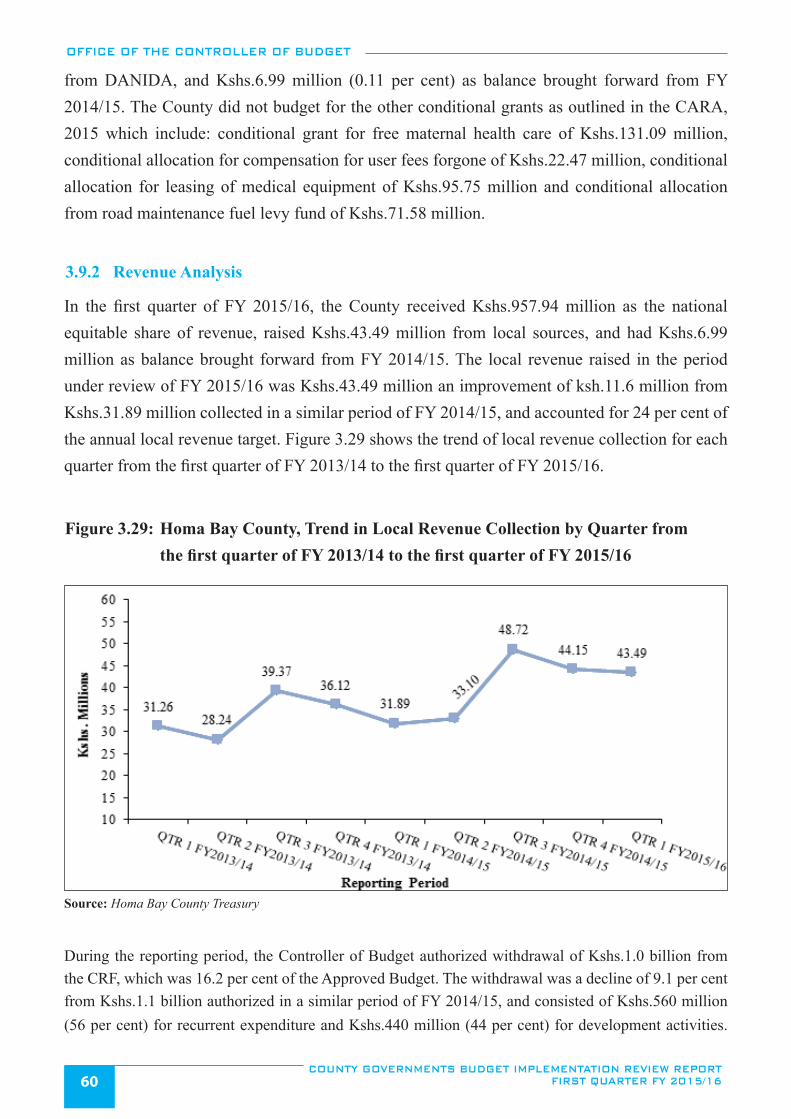
OFFICE OF THE CONTROLLER OF BUDGET
COUNTY GOVERNMENTS BUDGET IMPLEMENTATION REVIEW REPORT FIRST QUARTER FY 2015/1660
from DANIDA, and Kshs.6.99 million (0.11 per cent) as balance brought forward from FY 2014/15. The County did not budget for the other conditional grants as outlined in the CARA, 2015 which include: conditional grant for free maternal health care of Kshs.131.09 million, conditional allocation for compensation for user fees forgone of Kshs.22.47 million, conditional allocation for leasing of medical equipment of Kshs.95.75 million and conditional allocation from road maintenance fuel levy fund of Kshs.71.58 million.
3.9.2 Revenue Analysis
In the first quarter of FY 2015/16, the County received Kshs.957.94 million as the national equitable share of revenue, raised Kshs.43.49 million from local sources, and had Kshs.6.99 million as balance brought forward from FY 2014/15. The local revenue raised in the period under review of FY 2015/16 was Kshs.43.49 million an improvement of ksh.11.6 million from Kshs.31.89 million collected in a similar period of FY 2014/15, and accounted for 24 per cent of the annual local revenue target. Figure 3.29 shows the trend of local revenue collection for each quarter from the first quarter of FY 2013/14 to the first quarter of FY 2015/16.
Figure 3.29: Homa Bay County, Trend in Local Revenue Collection by Quarter from the first quarter of FY 2013/14 to the first quarter of FY 2015/16
Source: Homa Bay County Treasury
During the reporting period, the Controller of Budget authorized withdrawal of Kshs.1.0 billion from the CRF, which was 16.2 per cent of the Approved Budget. The withdrawal was a decline of 9.1 per cent from Kshs.1.1 billion authorized in a similar period of FY 2014/15, and consisted of Kshs.560 million (56 per cent) for recurrent expenditure and Kshs.440 million (44 per cent) for development activities.
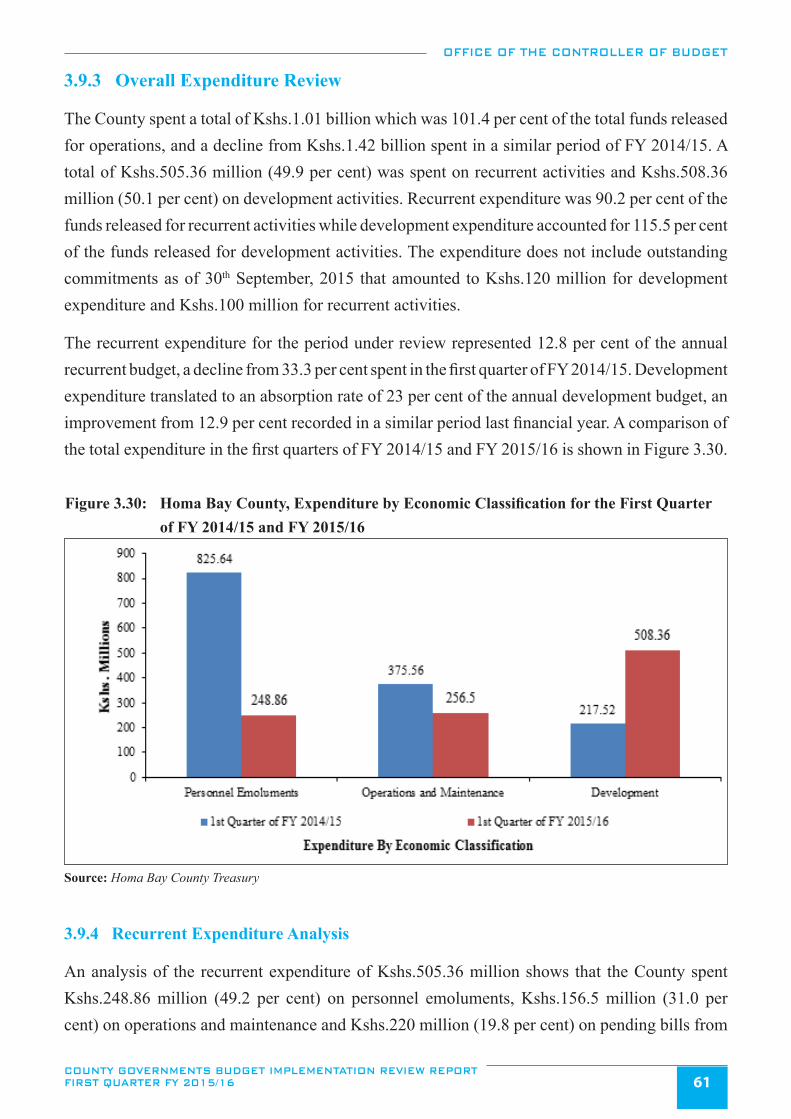
OFFICE OF THE CONTROLLER OF BUDGET
COUNTY GOVERNMENTS BUDGET IMPLEMENTATION REVIEW REPORT FIRST QUARTER FY 2015/16 61
3.9.3 Overall Expenditure Review
The County spent a total of Kshs.1.01 billion which was 101.4 per cent of the total funds released for operations, and a decline from Kshs.1.42 billion spent in a similar period of FY 2014/15. A total of Kshs.505.36 million (49.9 per cent) was spent on recurrent activities and Kshs.508.36 million (50.1 per cent) on development activities. Recurrent expenditure was 90.2 per cent of the funds released for recurrent activities while development expenditure accounted for 115.5 per cent of the funds released for development activities. The expenditure does not include outstanding commitments as of 30th September, 2015 that amounted to Kshs.120 million for development expenditure and Kshs.100 million for recurrent activities.
The recurrent expenditure for the period under review represented 12.8 per cent of the annual recurrent budget, a decline from 33.3 per cent spent in the first quarter of FY 2014/15. Development expenditure translated to an absorption rate of 23 per cent of the annual development budget, an improvement from 12.9 per cent recorded in a similar period last financial year. A comparison of the total expenditure in the first quarters of FY 2014/15 and FY 2015/16 is shown in Figure 3.30.
Figure 3.30: Homa Bay County, Expenditure by Economic Classification for the First Quarter of FY 2014/15 and FY 2015/16
Source: Homa Bay County Treasury
3.9.4 Recurrent Expenditure Analysis
An analysis of the recurrent expenditure of Kshs.505.36 million shows that the County spent Kshs.248.86 million (49.2 per cent) on personnel emoluments, Kshs.156.5 million (31.0 per cent) on operations and maintenance and Kshs.220 million (19.8 per cent) on pending bills from
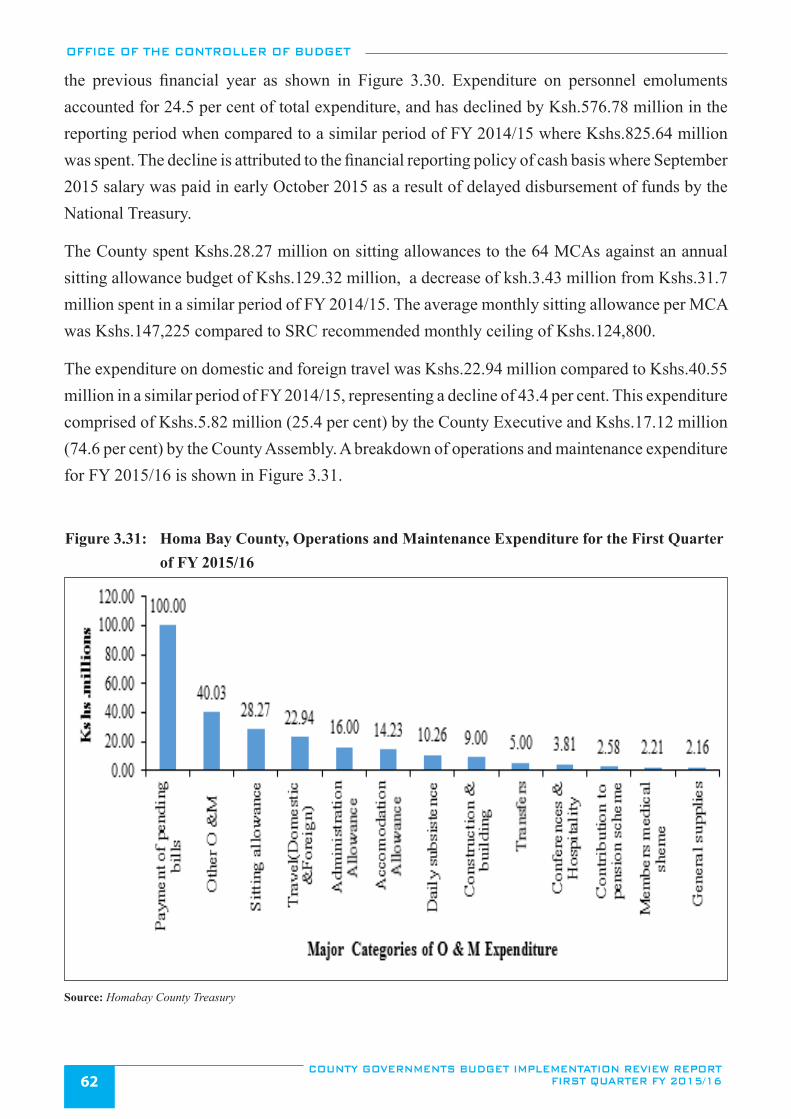
OFFICE OF THE CONTROLLER OF BUDGET
COUNTY GOVERNMENTS BUDGET IMPLEMENTATION REVIEW REPORT FIRST QUARTER FY 2015/1662
the previous financial year as shown in Figure 3.30. Expenditure on personnel emoluments accounted for 24.5 per cent of total expenditure, and has declined by Ksh.576.78 million in the reporting period when compared to a similar period of FY 2014/15 where Kshs.825.64 million was spent. The decline is attributed to the financial reporting policy of cash basis where September 2015 salary was paid in early October 2015 as a result of delayed disbursement of funds by the National Treasury.
The County spent Kshs.28.27 million on sitting allowances to the 64 MCAs against an annual sitting allowance budget of Kshs.129.32 million, a decrease of ksh.3.43 million from Kshs.31.7 million spent in a similar period of FY 2014/15. The average monthly sitting allowance per MCA was Kshs.147,225 compared to SRC recommended monthly ceiling of Kshs.124,800.
The expenditure on domestic and foreign travel was Kshs.22.94 million compared to Kshs.40.55 million in a similar period of FY 2014/15, representing a decline of 43.4 per cent. This expenditure comprised of Kshs.5.82 million (25.4 per cent) by the County Executive and Kshs.17.12 million (74.6 per cent) by the County Assembly. A breakdown of operations and maintenance expenditure for FY 2015/16 is shown in Figure 3.31.
Figure 3.31: Homa Bay County, Operations and Maintenance Expenditure for the First Quarter of FY 2015/16
Source: Homabay County Treasury
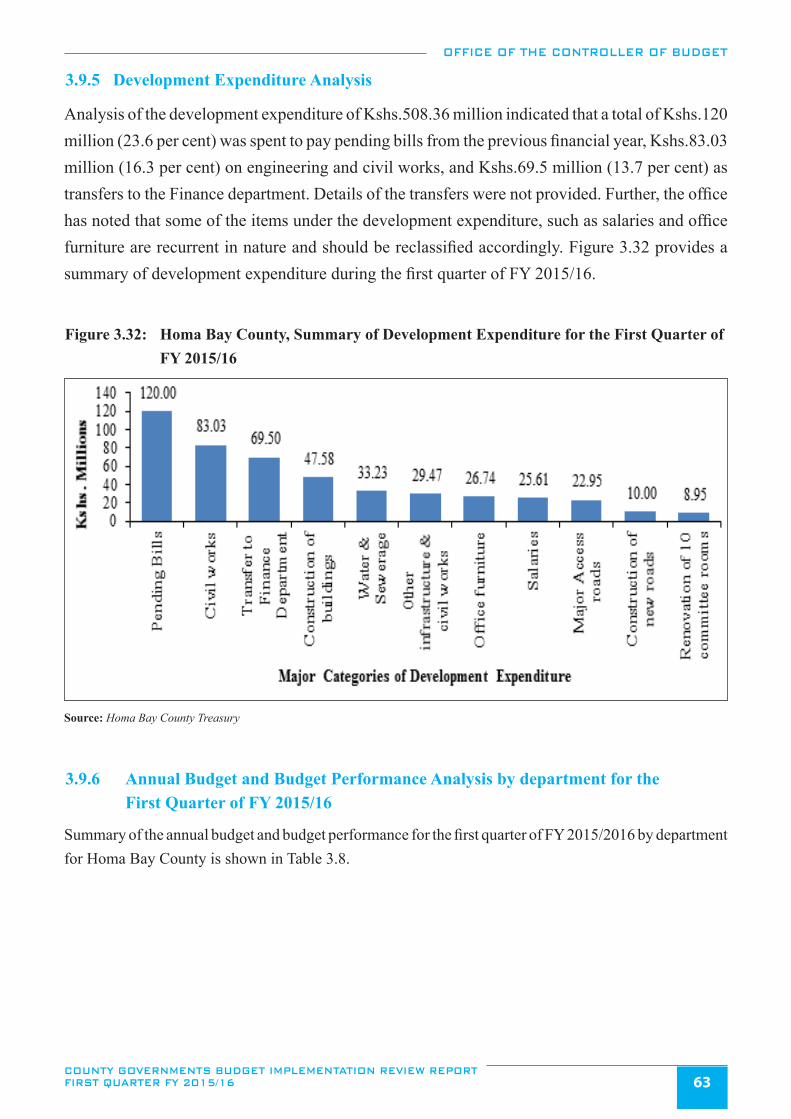
OFFICE OF THE CONTROLLER OF BUDGET
COUNTY GOVERNMENTS BUDGET IMPLEMENTATION REVIEW REPORT FIRST QUARTER FY 2015/16 63
3.9.5 Development Expenditure Analysis
Analysis of the development expenditure of Kshs.508.36 million indicated that a total of Kshs.120 million (23.6 per cent) was spent to pay pending bills from the previous financial year, Kshs.83.03 million (16.3 per cent) on engineering and civil works, and Kshs.69.5 million (13.7 per cent) as transfers to the Finance department. Details of the transfers were not provided. Further, the office has noted that some of the items under the development expenditure, such as salaries and office furniture are recurrent in nature and should be reclassified accordingly. Figure 3.32 provides a summary of development expenditure during the first quarter of FY 2015/16.
Figure 3.32: Homa Bay County, Summary of Development Expenditure for the First Quarter of FY 2015/16
Source: Homa Bay County Treasury
3.9.6 Annual Budget and Budget Performance Analysis by department for the First Quarter of FY 2015/16
Summary of the annual budget and budget performance for the first quarter of FY 2015/2016 by department for Homa Bay County is shown in Table 3.8.
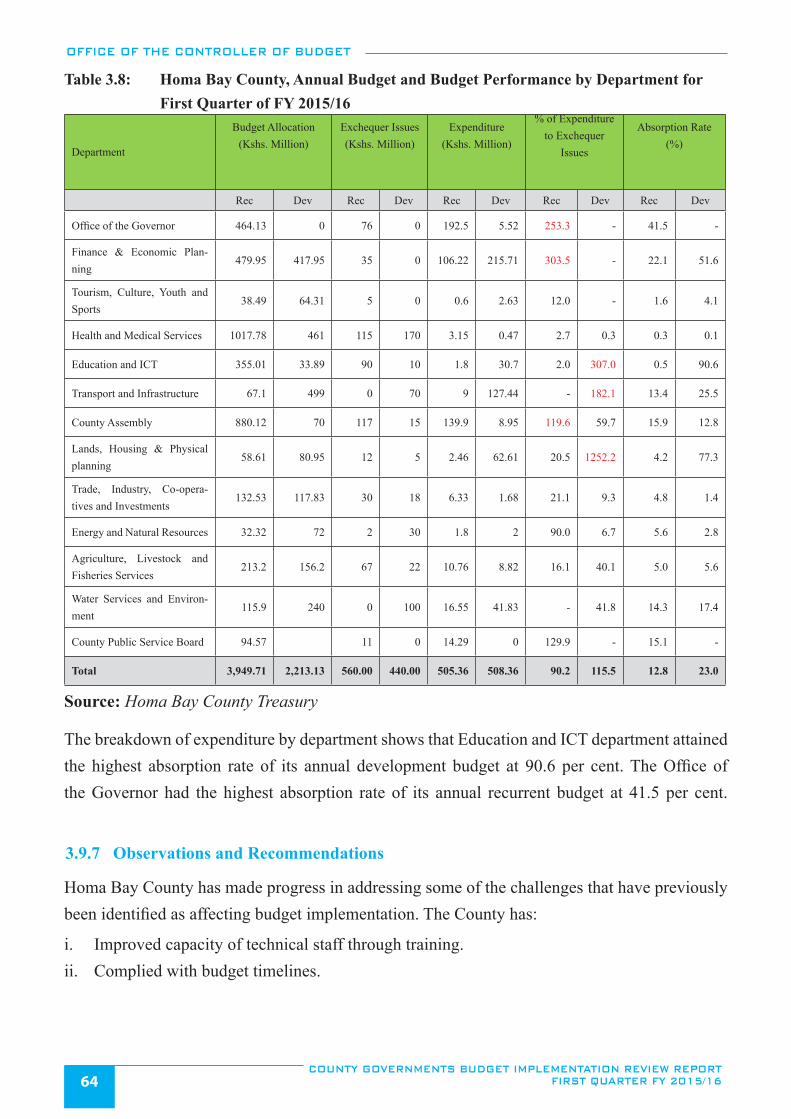
OFFICE OF THE CONTROLLER OF BUDGET
COUNTY GOVERNMENTS BUDGET IMPLEMENTATION REVIEW REPORT FIRST QUARTER FY 2015/1664
Table 3.8: Homa Bay County, Annual Budget and Budget Performance by Department for First Quarter of FY 2015/16
Department
Budget Allocation (Kshs. Million)
Exchequer Issues (Kshs. Million)
Expenditure (Kshs. Million)
% of Expenditure to Exchequer
Issues
Absorption Rate (%)
Rec Dev Rec Dev Rec Dev Rec Dev Rec Dev
Office of the Governor 464.13 0 76 0 192.5 5.52 253.3 - 41.5 -
Finance & Economic Plan-ning
479.95 417.95 35 0 106.22 215.71 303.5 - 22.1 51.6
Tourism, Culture, Youth and Sports
38.49 64.31 5 0 0.6 2.63 12.0 - 1.6 4.1
Health and Medical Services 1017.78 461 115 170 3.15 0.47 2.7 0.3 0.3 0.1
Education and ICT 355.01 33.89 90 10 1.8 30.7 2.0 307.0 0.5 90.6
Transport and Infrastructure 67.1 499 0 70 9 127.44 - 182.1 13.4 25.5
County Assembly 880.12 70 117 15 139.9 8.95 119.6 59.7 15.9 12.8
Lands, Housing & Physical planning
58.61 80.95 12 5 2.46 62.61 20.5 1252.2 4.2 77.3
Trade, Industry, Co-opera-tives and Investments
132.53 117.83 30 18 6.33 1.68 21.1 9.3 4.8 1.4
Energy and Natural Resources 32.32 72 2 30 1.8 2 90.0 6.7 5.6 2.8
Agriculture, Livestock and Fisheries Services
213.2 156.2 67 22 10.76 8.82 16.1 40.1 5.0 5.6
Water Services and Environ-ment
115.9 240 0 100 16.55 41.83 - 41.8 14.3 17.4
County Public Service Board 94.57 11 0 14.29 0 129.9 - 15.1 -
Total 3,949.71 2,213.13 560.00 440.00 505.36 508.36 90.2 115.5 12.8 23.0
Source: Homa Bay County Treasury
The breakdown of expenditure by department shows that Education and ICT department attained the highest absorption rate of its annual development budget at 90.6 per cent. The Office of the Governor had the highest absorption rate of its annual recurrent budget at 41.5 per cent.
3.9.7 Observations and Recommendations
Homa Bay County has made progress in addressing some of the challenges that have previously been identified as affecting budget implementation. The County has:
i. Improved capacity of technical staff through training.ii. Complied with budget timelines.
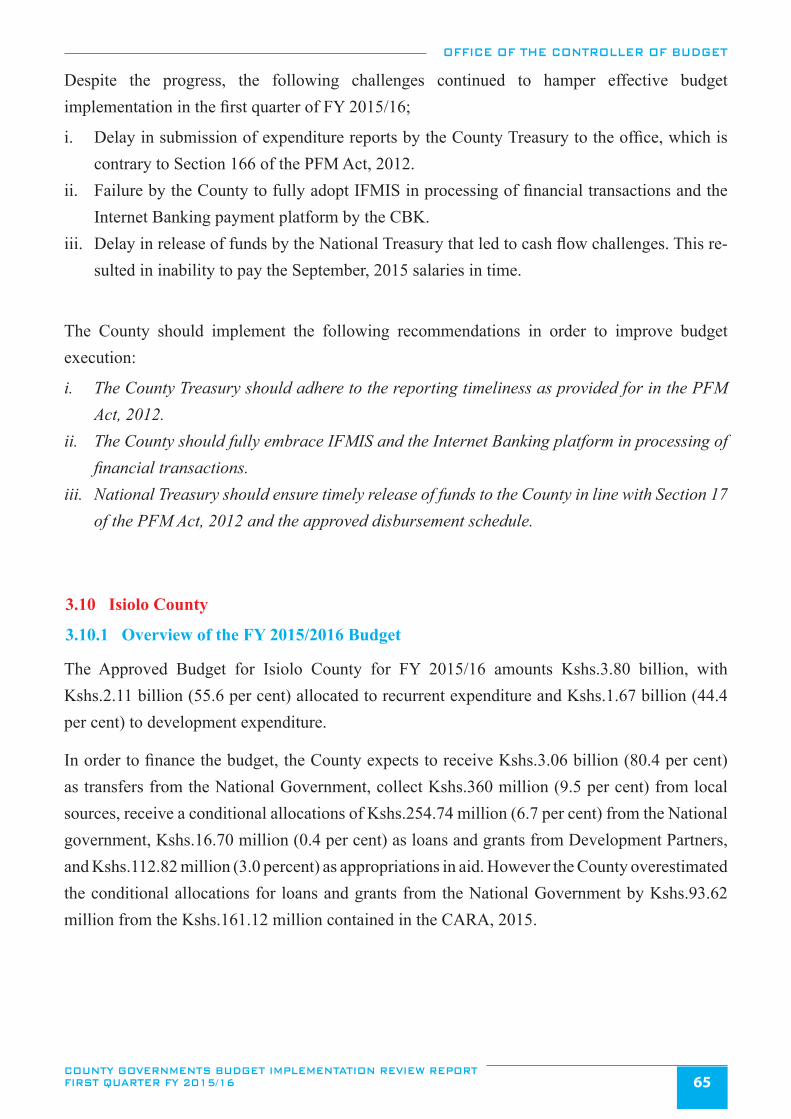
OFFICE OF THE CONTROLLER OF BUDGET
COUNTY GOVERNMENTS BUDGET IMPLEMENTATION REVIEW REPORT FIRST QUARTER FY 2015/16 65
Despite the progress, the following challenges continued to hamper effective budget implementation in the first quarter of FY 2015/16;
i. Delay in submission of expenditure reports by the County Treasury to the office, which is contrary to Section 166 of the PFM Act, 2012.
ii. Failure by the County to fully adopt IFMIS in processing of financial transactions and the Internet Banking payment platform by the CBK.
iii. Delay in release of funds by the National Treasury that led to cash flow challenges. This re-sulted in inability to pay the September, 2015 salaries in time.
The County should implement the following recommendations in order to improve budget execution:
i. The County Treasury should adhere to the reporting timeliness as provided for in the PFM Act, 2012.
ii. The County should fully embrace IFMIS and the Internet Banking platform in processing of financial transactions.
iii. National Treasury should ensure timely release of funds to the County in line with Section 17 of the PFM Act, 2012 and the approved disbursement schedule.
3.10 Isiolo County
3.10.1 Overview of the FY 2015/2016 Budget
The Approved Budget for Isiolo County for FY 2015/16 amounts Kshs.3.80 billion, with Kshs.2.11 billion (55.6 per cent) allocated to recurrent expenditure and Kshs.1.67 billion (44.4 per cent) to development expenditure.
In order to finance the budget, the County expects to receive Kshs.3.06 billion (80.4 per cent) as transfers from the National Government, collect Kshs.360 million (9.5 per cent) from local sources, receive a conditional allocations of Kshs.254.74 million (6.7 per cent) from the National government, Kshs.16.70 million (0.4 per cent) as loans and grants from Development Partners, and Kshs.112.82 million (3.0 percent) as appropriations in aid. However the County overestimated the conditional allocations for loans and grants from the National Government by Kshs.93.62 million from the Kshs.161.12 million contained in the CARA, 2015.
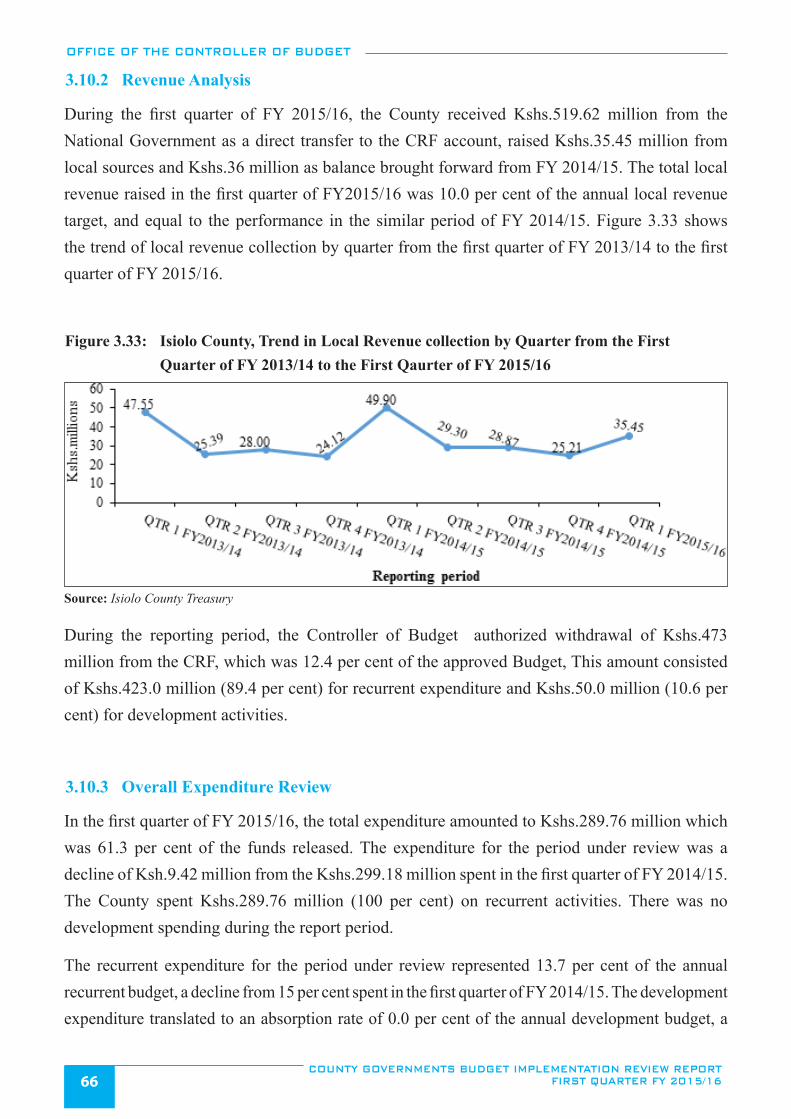
OFFICE OF THE CONTROLLER OF BUDGET
COUNTY GOVERNMENTS BUDGET IMPLEMENTATION REVIEW REPORT FIRST QUARTER FY 2015/1666
3.10.2 Revenue Analysis
During the first quarter of FY 2015/16, the County received Kshs.519.62 million from the National Government as a direct transfer to the CRF account, raised Kshs.35.45 million from local sources and Kshs.36 million as balance brought forward from FY 2014/15. The total local revenue raised in the first quarter of FY2015/16 was 10.0 per cent of the annual local revenue target, and equal to the performance in the similar period of FY 2014/15. Figure 3.33 shows the trend of local revenue collection by quarter from the first quarter of FY 2013/14 to the first quarter of FY 2015/16.
Figure 3.33: Isiolo County, Trend in Local Revenue collection by Quarter from the First Quarter of FY 2013/14 to the First Qaurter of FY 2015/16
Source: Isiolo County Treasury
During the reporting period, the Controller of Budget authorized withdrawal of Kshs.473 million from the CRF, which was 12.4 per cent of the approved Budget, This amount consisted of Kshs.423.0 million (89.4 per cent) for recurrent expenditure and Kshs.50.0 million (10.6 per cent) for development activities.
3.10.3 Overall Expenditure Review
In the first quarter of FY 2015/16, the total expenditure amounted to Kshs.289.76 million which was 61.3 per cent of the funds released. The expenditure for the period under review was a decline of Ksh.9.42 million from the Kshs.299.18 million spent in the first quarter of FY 2014/15. The County spent Kshs.289.76 million (100 per cent) on recurrent activities. There was no development spending during the report period.
The recurrent expenditure for the period under review represented 13.7 per cent of the annual recurrent budget, a decline from 15 per cent spent in the first quarter of FY 2014/15. The development expenditure translated to an absorption rate of 0.0 per cent of the annual development budget, a
OFFICE OF THE CONTROLLER OF BUDGET
COUNTY GOVERNMENTS BUDGET IMPLEMENTATION REVIEW REPORT FIRST QUARTER FY 2015/16 67
decrease from absorption rate of 1.3 per cent recorded in the similar period of FY 2014/15. A comparison of the total expenditure between the period under review and a similar period last financial year is shown in Figure 3.34.
Figure 3.34: Isiolo County, Expenditure by Economic Classification for First Quarter of FY 2014/15 and FY 2015/16
Source: Isiolo County Treasury
3.10.4 Recurrent Expenditure Analysis
Analysis of the recurrent expenditure of Kshs.289.76 Million shows that the county spent Kshs.223.24 million on personnel emoluments which translates to 77.0 per cent of the total recurrent expenditure and Kshs.66.52 million on operations and maintenance expenditure which was 23.0 per cent of the total recurrent expenditure for the period as shown in Figure 3.34.
The County spent Kshs.5.59 million on payment of sitting allowances to the 21 MCAs against the annual sitting allowance budget of Kshs.29.44 million. The County did not provide information on expenditure incurred on MCAs sitting allowances during the first quarter of FY 2014/15. The average monthly sitting allowance per MCA for the quarter was Kshs.88,789 compared to SRC recommended amount of Kshs.124,800.
The total expenditure on domestic and foreign travel in the first quarter of FY 2015/16 was Kshs.23.92 million compared to Kshs.23.45 million incurred in a similar period of FY 2014/15, which represented a slight increase of 2.0 per cent. This expenditure comprised of Kshs.16.48 million (68.9 per cent)
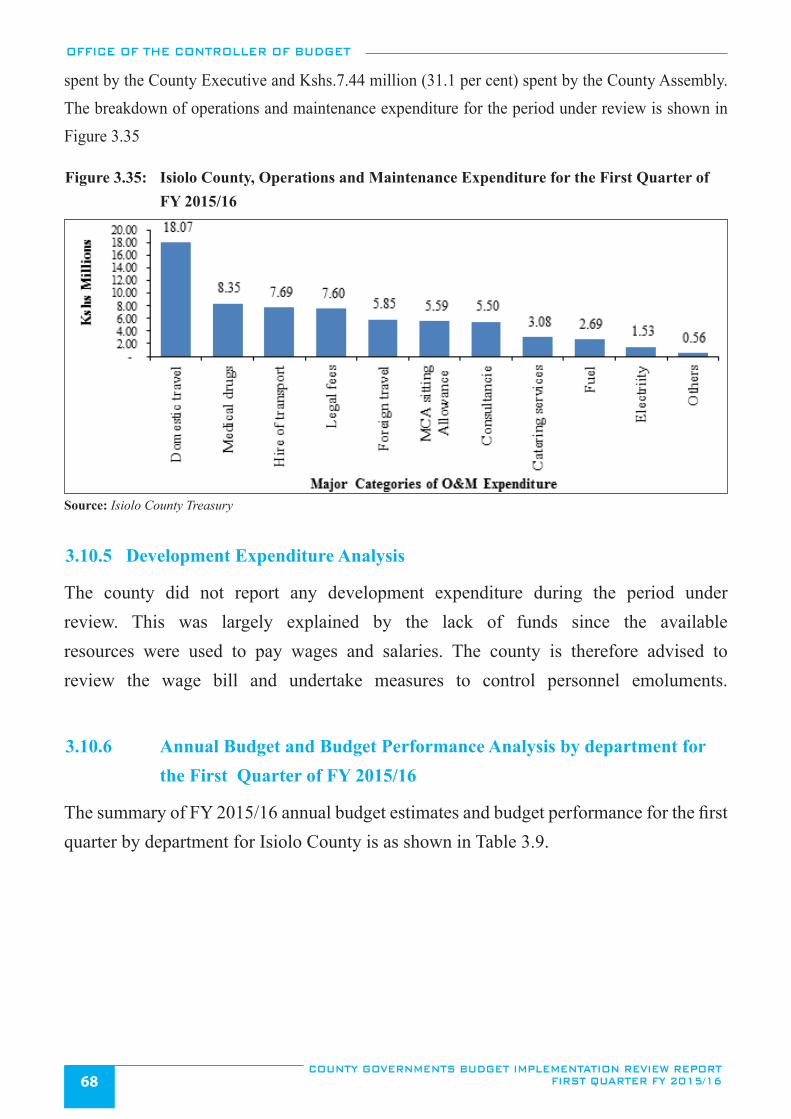
OFFICE OF THE CONTROLLER OF BUDGET
COUNTY GOVERNMENTS BUDGET IMPLEMENTATION REVIEW REPORT FIRST QUARTER FY 2015/1668
spent by the County Executive and Kshs.7.44 million (31.1 per cent) spent by the County Assembly. The breakdown of operations and maintenance expenditure for the period under review is shown in Figure 3.35
Figure 3.35: Isiolo County, Operations and Maintenance Expenditure for the First Quarter of FY 2015/16
Source: Isiolo County Treasury
3.10.5 Development Expenditure Analysis
The county did not report any development expenditure during the period under review. This was largely explained by the lack of funds since the available resources were used to pay wages and salaries. The county is therefore advised to review the wage bill and undertake measures to control personnel emoluments.
3.10.6 Annual Budget and Budget Performance Analysis by department for the First Quarter of FY 2015/16
The summary of FY 2015/16 annual budget estimates and budget performance for the first quarter by department for Isiolo County is as shown in Table 3.9.
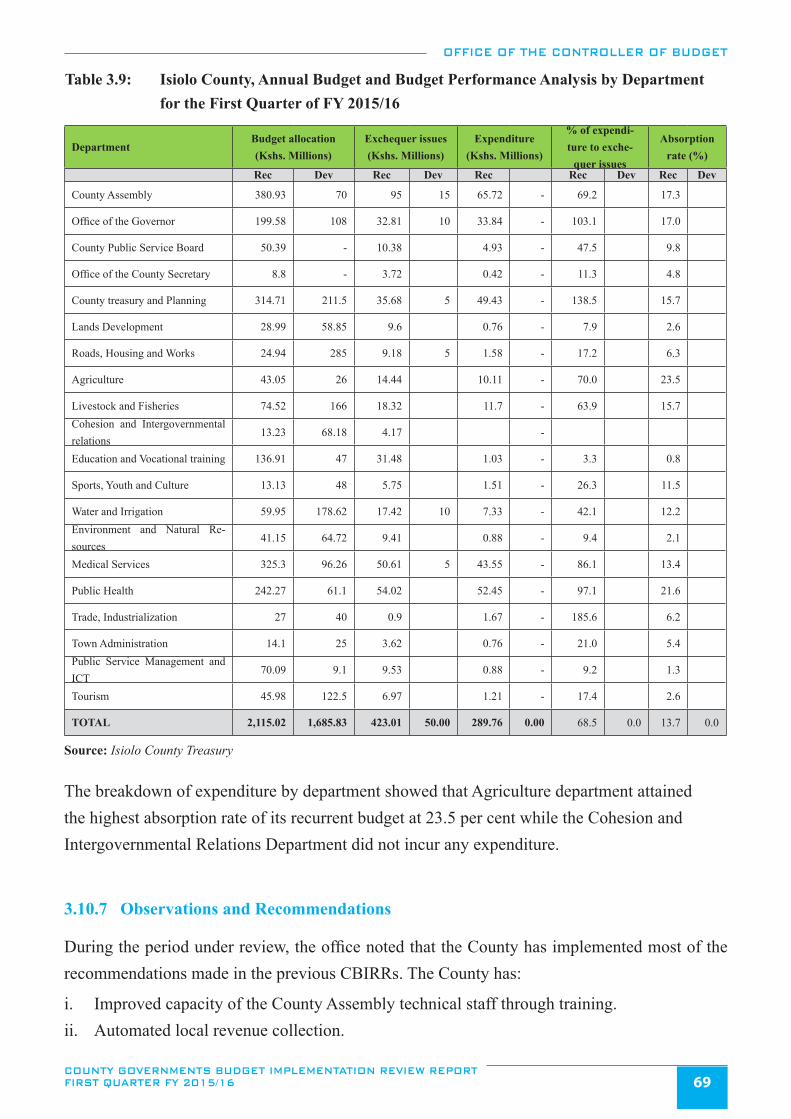
OFFICE OF THE CONTROLLER OF BUDGET
COUNTY GOVERNMENTS BUDGET IMPLEMENTATION REVIEW REPORT FIRST QUARTER FY 2015/16 69
Table 3.9: Isiolo County, Annual Budget and Budget Performance Analysis by Department for the First Quarter of FY 2015/16
DepartmentBudget allocation (Kshs. Millions)
Exchequer issues (Kshs. Millions)
Expenditure (Kshs. Millions)
% of expendi-ture to exche-
quer issues
Absorption rate (%)
Rec Dev Rec Dev Rec Rec Dev Rec Dev
County Assembly 380.93 70 95 15 65.72 - 69.2 17.3
Office of the Governor 199.58 108 32.81 10 33.84 - 103.1 17.0
County Public Service Board 50.39 - 10.38 4.93 - 47.5 9.8
Office of the County Secretary 8.8 - 3.72 0.42 - 11.3 4.8
County treasury and Planning 314.71 211.5 35.68 5 49.43 - 138.5 15.7
Lands Development 28.99 58.85 9.6 0.76 - 7.9 2.6
Roads, Housing and Works 24.94 285 9.18 5 1.58 - 17.2 6.3
Agriculture 43.05 26 14.44 10.11 - 70.0 23.5
Livestock and Fisheries 74.52 166 18.32 11.7 - 63.9 15.7 Cohesion and Intergovernmental relations
13.23 68.18 4.17 -
Education and Vocational training 136.91 47 31.48 1.03 - 3.3 0.8
Sports, Youth and Culture 13.13 48 5.75 1.51 - 26.3 11.5
Water and Irrigation 59.95 178.62 17.42 10 7.33 - 42.1 12.2 Environment and Natural Re-sources
41.15 64.72 9.41 0.88 - 9.4 2.1
Medical Services 325.3 96.26 50.61 5 43.55 - 86.1 13.4
Public Health 242.27 61.1 54.02 52.45 - 97.1 21.6
Trade, Industrialization 27 40 0.9 1.67 - 185.6 6.2
Town Administration 14.1 25 3.62 0.76 - 21.0 5.4 Public Service Management and ICT
70.09 9.1 9.53 0.88 - 9.2 1.3
Tourism 45.98 122.5 6.97 1.21 - 17.4 2.6
TOTAL 2,115.02 1,685.83 423.01 50.00 289.76 0.00 68.5 0.0 13.7 0.0
Source: Isiolo County Treasury
The breakdown of expenditure by department showed that Agriculture department attained the highest absorption rate of its recurrent budget at 23.5 per cent while the Cohesion and Intergovernmental Relations Department did not incur any expenditure.
3.10.7 Observations and Recommendations
During the period under review, the office noted that the County has implemented most of the recommendations made in the previous CBIRRs. The County has:
i. Improved capacity of the County Assembly technical staff through training.ii. Automated local revenue collection.
OFFICE OF THE CONTROLLER OF BUDGET
COUNTY GOVERNMENTS BUDGET IMPLEMENTATION REVIEW REPORT FIRST QUARTER FY 2015/1670
Despite the progress, the following challenges continued to hamper effective budget implementation in the first quarter of FY 2015/16:
i. Failure by the County Assembly to adopt IFMIS in processing financial transactions.ii. High wage bill due to an increase in workforce.iii. Delays in submission of expenditure and revenue reports as well as failure to submit quarter-
ly financial reports for established County Funds (County Assembly Mortgage and Car Loan Fund) to the OCOB.
The County should implement the following recommendations in order to improve budget execution:
i. The County Assembly should always use IFMIS to process financial operations. All newly recruited staff in the County Assembly’s Treasury Department should be trained on use of the IFMIS system to ensure smooth operations.
ii. The County Treasury in liaison with the County Public Service Board should review the wage bill, staff establishment and devise strategies to ensure sustainability.
iii. The County Treasury should put in place mechanisms that will enable timely production of financial reports. Also, Administrators of all established County Funds should submit Fund report as required by Section 168 of the PFM Act 2012.
3.11 Kajiado County
3.11.1 Overview of the FY 2015/16 Budget
The Approved Budget for Kajiado County for FY 2015/16 amounts to Kshs.6.59 billion, with Kshs.3.93 billion (59.6 per cent) allocated to recurrent expenditure and Kshs.2.66 billion (40.4 per cent) to development expenditure.
In order to finance the budget, the County expects to receive Kshs.4.41 billion (67.0 per cent) as transfers from the National Government and also to collect Kshs.1.13 billion (17.2 per cent) from local sources. Other revenue sources are; a conditional grant of Kshs.15.51 million (0.2 per cent) from DANIDA, Kshs.41.33 million as HSSF (0.6 per cent), and Kshs.984.80 million (14.9 per cent) as cash balance brought forward from FY 2014/15. Nonetheless, the County did not budget for the conditional allocations as provided for in CARA, 2015 which include; Kshs.16.02 million as compensation for user fees forgone, Kshs.56.06 million for the road maintenance levy, Kshs.49.86 million for free maternal health care, Kshs.95.74 million for leasing of medical equipment, Kshs.40 million as other conditional loans/grants, and Kshs.31.64 million as World Bank loan to supplement financing of the County health facilities. In addition, the DANIDA grant was under budgeted by Kshs.2.38 million.
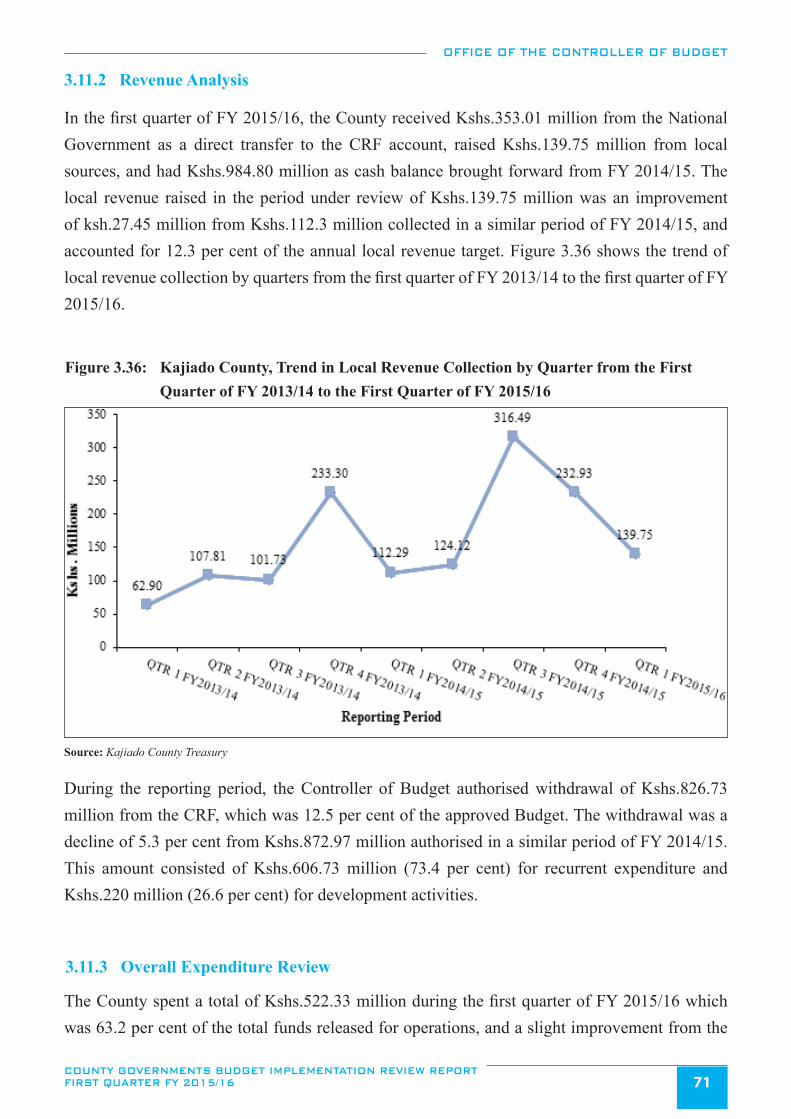
OFFICE OF THE CONTROLLER OF BUDGET
COUNTY GOVERNMENTS BUDGET IMPLEMENTATION REVIEW REPORT FIRST QUARTER FY 2015/16 71
3.11.2 Revenue Analysis
In the first quarter of FY 2015/16, the County received Kshs.353.01 million from the National Government as a direct transfer to the CRF account, raised Kshs.139.75 million from local sources, and had Kshs.984.80 million as cash balance brought forward from FY 2014/15. The local revenue raised in the period under review of Kshs.139.75 million was an improvement of ksh.27.45 million from Kshs.112.3 million collected in a similar period of FY 2014/15, and accounted for 12.3 per cent of the annual local revenue target. Figure 3.36 shows the trend of local revenue collection by quarters from the first quarter of FY 2013/14 to the first quarter of FY 2015/16.
Figure 3.36: Kajiado County, Trend in Local Revenue Collection by Quarter from the First Quarter of FY 2013/14 to the First Quarter of FY 2015/16
Source: Kajiado County Treasury
During the reporting period, the Controller of Budget authorised withdrawal of Kshs.826.73 million from the CRF, which was 12.5 per cent of the approved Budget. The withdrawal was a decline of 5.3 per cent from Kshs.872.97 million authorised in a similar period of FY 2014/15. This amount consisted of Kshs.606.73 million (73.4 per cent) for recurrent expenditure and Kshs.220 million (26.6 per cent) for development activities.
3.11.3 Overall Expenditure Review
The County spent a total of Kshs.522.33 million during the first quarter of FY 2015/16 which was 63.2 per cent of the total funds released for operations, and a slight improvement from the
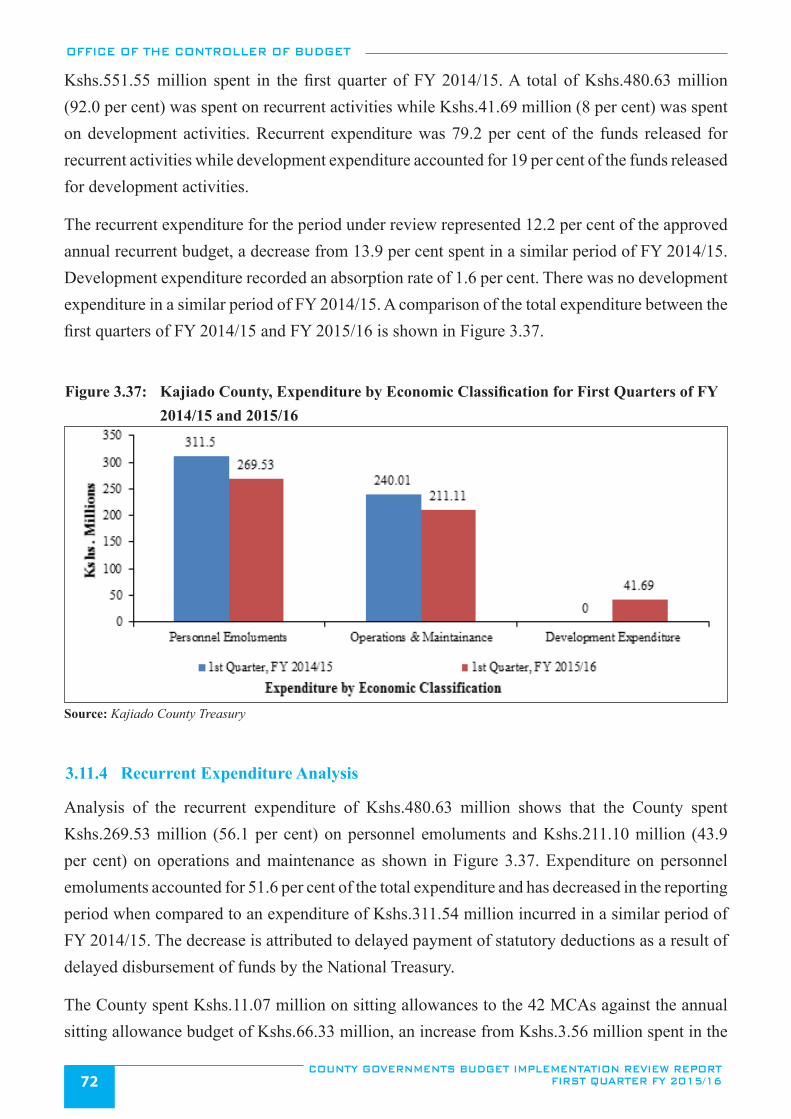
OFFICE OF THE CONTROLLER OF BUDGET
COUNTY GOVERNMENTS BUDGET IMPLEMENTATION REVIEW REPORT FIRST QUARTER FY 2015/1672
Kshs.551.55 million spent in the first quarter of FY 2014/15. A total of Kshs.480.63 million (92.0 per cent) was spent on recurrent activities while Kshs.41.69 million (8 per cent) was spent on development activities. Recurrent expenditure was 79.2 per cent of the funds released for recurrent activities while development expenditure accounted for 19 per cent of the funds released for development activities.
The recurrent expenditure for the period under review represented 12.2 per cent of the approved annual recurrent budget, a decrease from 13.9 per cent spent in a similar period of FY 2014/15. Development expenditure recorded an absorption rate of 1.6 per cent. There was no development expenditure in a similar period of FY 2014/15. A comparison of the total expenditure between the first quarters of FY 2014/15 and FY 2015/16 is shown in Figure 3.37.
Figure 3.37: Kajiado County, Expenditure by Economic Classification for First Quarters of FY 2014/15 and 2015/16
Source: Kajiado County Treasury
3.11.4 Recurrent Expenditure Analysis
Analysis of the recurrent expenditure of Kshs.480.63 million shows that the County spent Kshs.269.53 million (56.1 per cent) on personnel emoluments and Kshs.211.10 million (43.9 per cent) on operations and maintenance as shown in Figure 3.37. Expenditure on personnel emoluments accounted for 51.6 per cent of the total expenditure and has decreased in the reporting period when compared to an expenditure of Kshs.311.54 million incurred in a similar period of FY 2014/15. The decrease is attributed to delayed payment of statutory deductions as a result of delayed disbursement of funds by the National Treasury.
The County spent Kshs.11.07 million on sitting allowances to the 42 MCAs against the annual sitting allowance budget of Kshs.66.33 million, an increase from Kshs.3.56 million spent in the
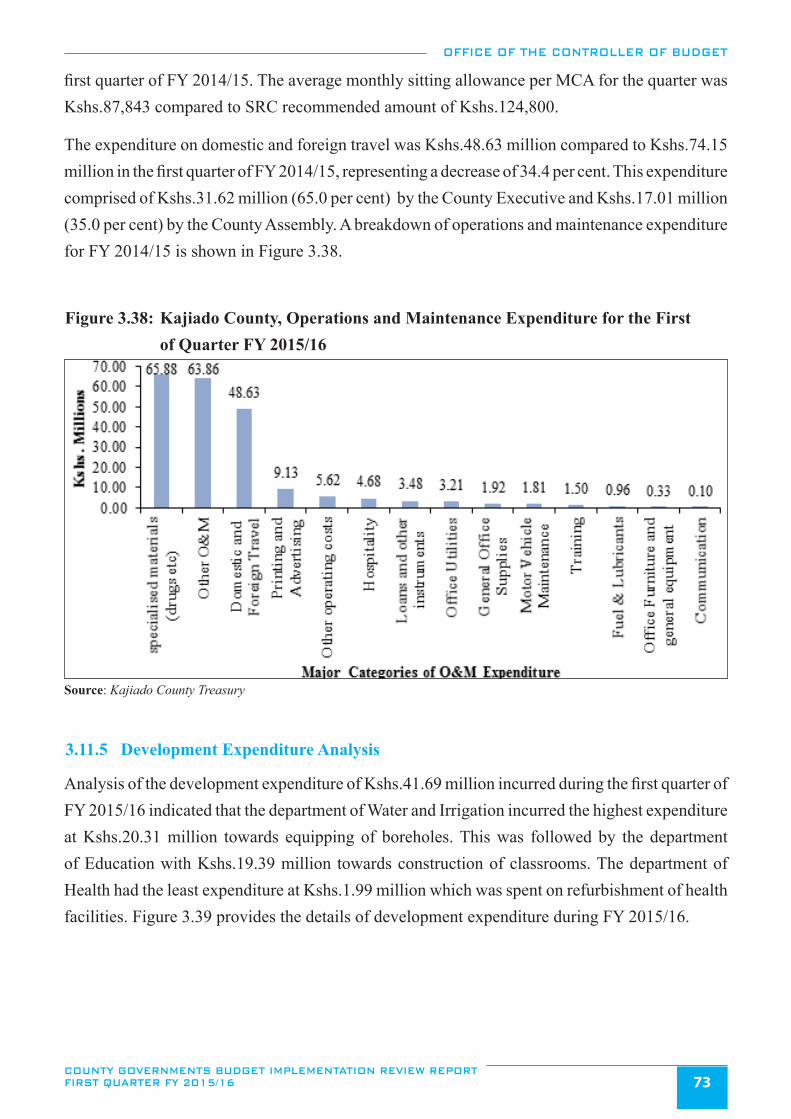
OFFICE OF THE CONTROLLER OF BUDGET
COUNTY GOVERNMENTS BUDGET IMPLEMENTATION REVIEW REPORT FIRST QUARTER FY 2015/16 73
first quarter of FY 2014/15. The average monthly sitting allowance per MCA for the quarter was Kshs.87,843 compared to SRC recommended amount of Kshs.124,800.
The expenditure on domestic and foreign travel was Kshs.48.63 million compared to Kshs.74.15 million in the first quarter of FY 2014/15, representing a decrease of 34.4 per cent. This expenditure comprised of Kshs.31.62 million (65.0 per cent) by the County Executive and Kshs.17.01 million (35.0 per cent) by the County Assembly. A breakdown of operations and maintenance expenditure for FY 2014/15 is shown in Figure 3.38.
Figure 3.38: Kajiado County, Operations and Maintenance Expenditure for the First of Quarter FY 2015/16
Source: Kajiado County Treasury
3.11.5 Development Expenditure Analysis
Analysis of the development expenditure of Kshs.41.69 million incurred during the first quarter of FY 2015/16 indicated that the department of Water and Irrigation incurred the highest expenditure at Kshs.20.31 million towards equipping of boreholes. This was followed by the department of Education with Kshs.19.39 million towards construction of classrooms. The department of Health had the least expenditure at Kshs.1.99 million which was spent on refurbishment of health facilities. Figure 3.39 provides the details of development expenditure during FY 2015/16.
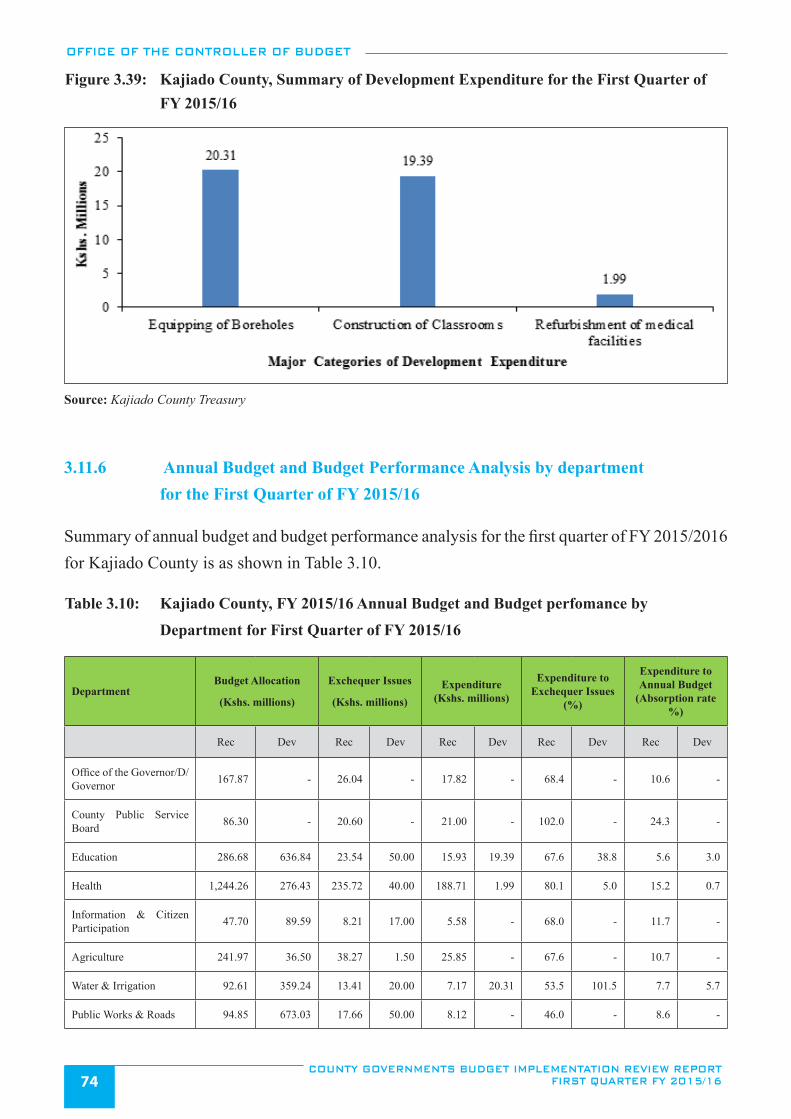
OFFICE OF THE CONTROLLER OF BUDGET
COUNTY GOVERNMENTS BUDGET IMPLEMENTATION REVIEW REPORT FIRST QUARTER FY 2015/1674
Figure 3.39: Kajiado County, Summary of Development Expenditure for the First Quarter of FY 2015/16
Source: Kajiado County Treasury
3.11.6 Annual Budget and Budget Performance Analysis by department for the First Quarter of FY 2015/16
Summary of annual budget and budget performance analysis for the first quarter of FY 2015/2016 for Kajiado County is as shown in Table 3.10.
Table 3.10: Kajiado County, FY 2015/16 Annual Budget and Budget perfomance by
Department for First Quarter of FY 2015/16
DepartmentBudget Allocation
(Kshs. millions)
Exchequer Issues
(Kshs. millions)Expenditure
(Kshs. millions)
Expenditure to Exchequer Issues
(%)
Expenditure to Annual Budget
(Absorption rate %)
Rec Dev Rec Dev Rec Dev Rec Dev Rec Dev
Office of the Governor/D/Governor 167.87 - 26.04 - 17.82 - 68.4 - 10.6 -
County Public Service Board 86.30 - 20.60 - 21.00 - 102.0 - 24.3 -
Education 286.68 636.84 23.54 50.00 15.93 19.39 67.6 38.8 5.6 3.0
Health 1,244.26 276.43 235.72 40.00 188.71 1.99 80.1 5.0 15.2 0.7
Information & Citizen Participation 47.70 89.59 8.21 17.00 5.58 - 68.0 - 11.7 -
Agriculture 241.97 36.50 38.27 1.50 25.85 - 67.6 - 10.7 -
Water & Irrigation 92.61 359.24 13.41 20.00 7.17 20.31 53.5 101.5 7.7 5.7
Public Works & Roads 94.85 673.03 17.66 50.00 8.12 - 46.0 - 8.6 -
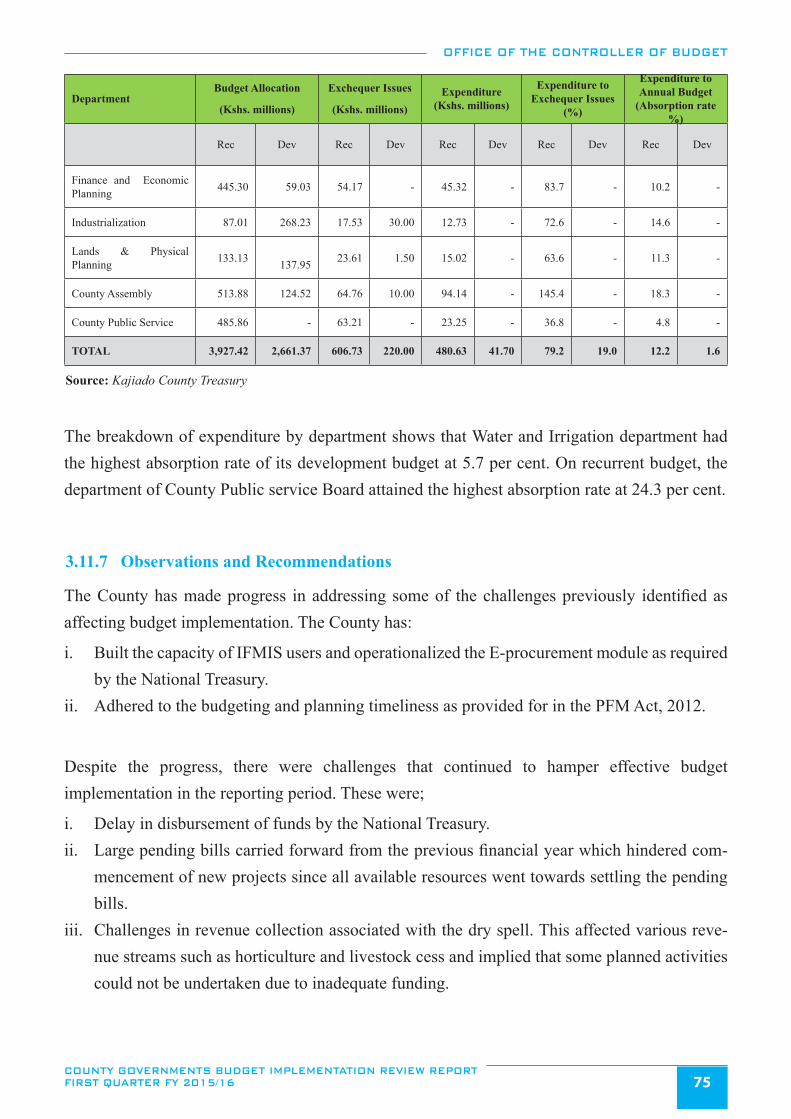
OFFICE OF THE CONTROLLER OF BUDGET
COUNTY GOVERNMENTS BUDGET IMPLEMENTATION REVIEW REPORT FIRST QUARTER FY 2015/16 75
Source: Kajiado County Treasury
The breakdown of expenditure by department shows that Water and Irrigation department had the highest absorption rate of its development budget at 5.7 per cent. On recurrent budget, the department of County Public service Board attained the highest absorption rate at 24.3 per cent.
3.11.7 Observations and Recommendations
The County has made progress in addressing some of the challenges previously identified as affecting budget implementation. The County has:
i. Built the capacity of IFMIS users and operationalized the E-procurement module as required by the National Treasury.
ii. Adhered to the budgeting and planning timeliness as provided for in the PFM Act, 2012.
Despite the progress, there were challenges that continued to hamper effective budget implementation in the reporting period. These were;
i. Delay in disbursement of funds by the National Treasury.ii. Large pending bills carried forward from the previous financial year which hindered com-
mencement of new projects since all available resources went towards settling the pending bills.
iii. Challenges in revenue collection associated with the dry spell. This affected various reve-nue streams such as horticulture and livestock cess and implied that some planned activities could not be undertaken due to inadequate funding.
DepartmentBudget Allocation
(Kshs. millions)
Exchequer Issues
(Kshs. millions)Expenditure
(Kshs. millions)
Expenditure to Exchequer Issues
(%)
Expenditure to Annual Budget
(Absorption rate %)
Rec Dev Rec Dev Rec Dev Rec Dev Rec Dev
Finance and Economic Planning 445.30 59.03 54.17 - 45.32 - 83.7 - 10.2 -
Industrialization 87.01 268.23 17.53 30.00 12.73 - 72.6 - 14.6 -
Lands & Physical Planning 133.13
137.95 23.61 1.50 15.02 - 63.6 - 11.3 -
County Assembly 513.88 124.52 64.76 10.00 94.14 - 145.4 - 18.3 -
County Public Service 485.86 - 63.21 - 23.25 - 36.8 - 4.8 -
TOTAL 3,927.42 2,661.37 606.73 220.00 480.63 41.70 79.2 19.0 12.2 1.6
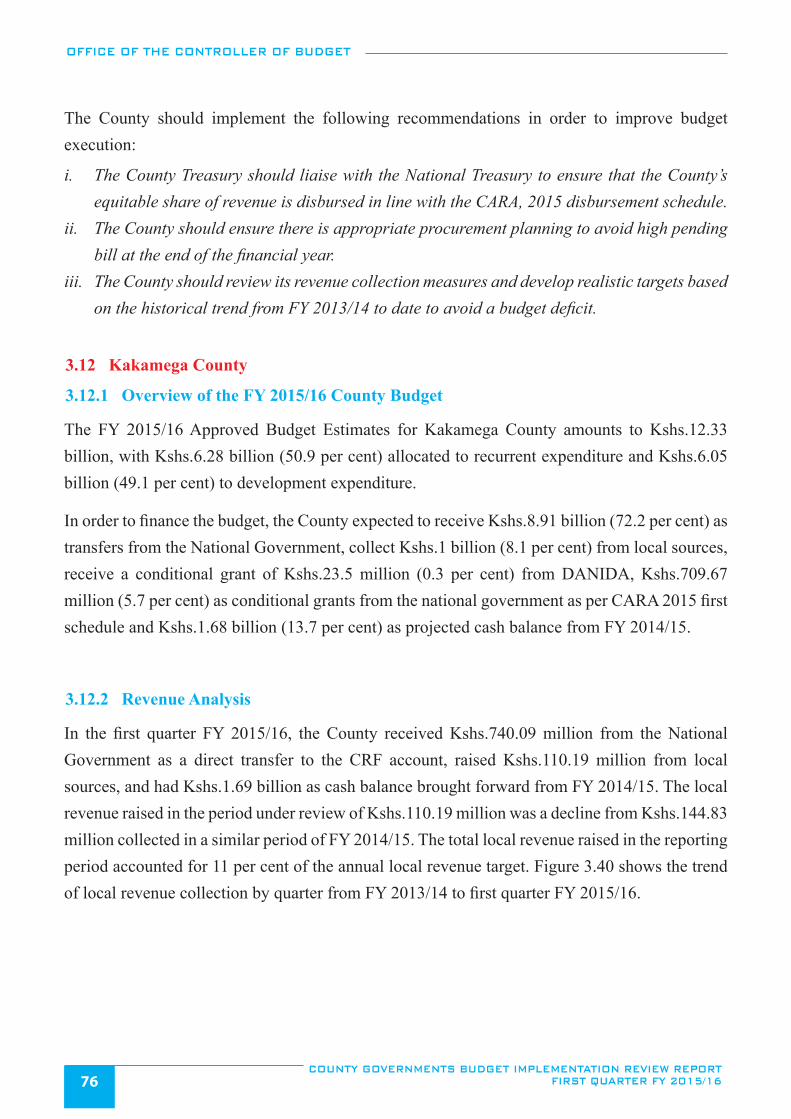
OFFICE OF THE CONTROLLER OF BUDGET
COUNTY GOVERNMENTS BUDGET IMPLEMENTATION REVIEW REPORT FIRST QUARTER FY 2015/1676
The County should implement the following recommendations in order to improve budget execution:
i. The County Treasury should liaise with the National Treasury to ensure that the County’s equitable share of revenue is disbursed in line with the CARA, 2015 disbursement schedule.
ii. The County should ensure there is appropriate procurement planning to avoid high pending bill at the end of the financial year.
iii. The County should review its revenue collection measures and develop realistic targets based on the historical trend from FY 2013/14 to date to avoid a budget deficit.
3.12 Kakamega County
3.12.1 Overview of the FY 2015/16 County Budget
The FY 2015/16 Approved Budget Estimates for Kakamega County amounts to Kshs.12.33 billion, with Kshs.6.28 billion (50.9 per cent) allocated to recurrent expenditure and Kshs.6.05 billion (49.1 per cent) to development expenditure.
In order to finance the budget, the County expected to receive Kshs.8.91 billion (72.2 per cent) as transfers from the National Government, collect Kshs.1 billion (8.1 per cent) from local sources, receive a conditional grant of Kshs.23.5 million (0.3 per cent) from DANIDA, Kshs.709.67 million (5.7 per cent) as conditional grants from the national government as per CARA 2015 first schedule and Kshs.1.68 billion (13.7 per cent) as projected cash balance from FY 2014/15.
3.12.2 Revenue Analysis
In the first quarter FY 2015/16, the County received Kshs.740.09 million from the National Government as a direct transfer to the CRF account, raised Kshs.110.19 million from local sources, and had Kshs.1.69 billion as cash balance brought forward from FY 2014/15. The local revenue raised in the period under review of Kshs.110.19 million was a decline from Kshs.144.83 million collected in a similar period of FY 2014/15. The total local revenue raised in the reporting period accounted for 11 per cent of the annual local revenue target. Figure 3.40 shows the trend of local revenue collection by quarter from FY 2013/14 to first quarter FY 2015/16.
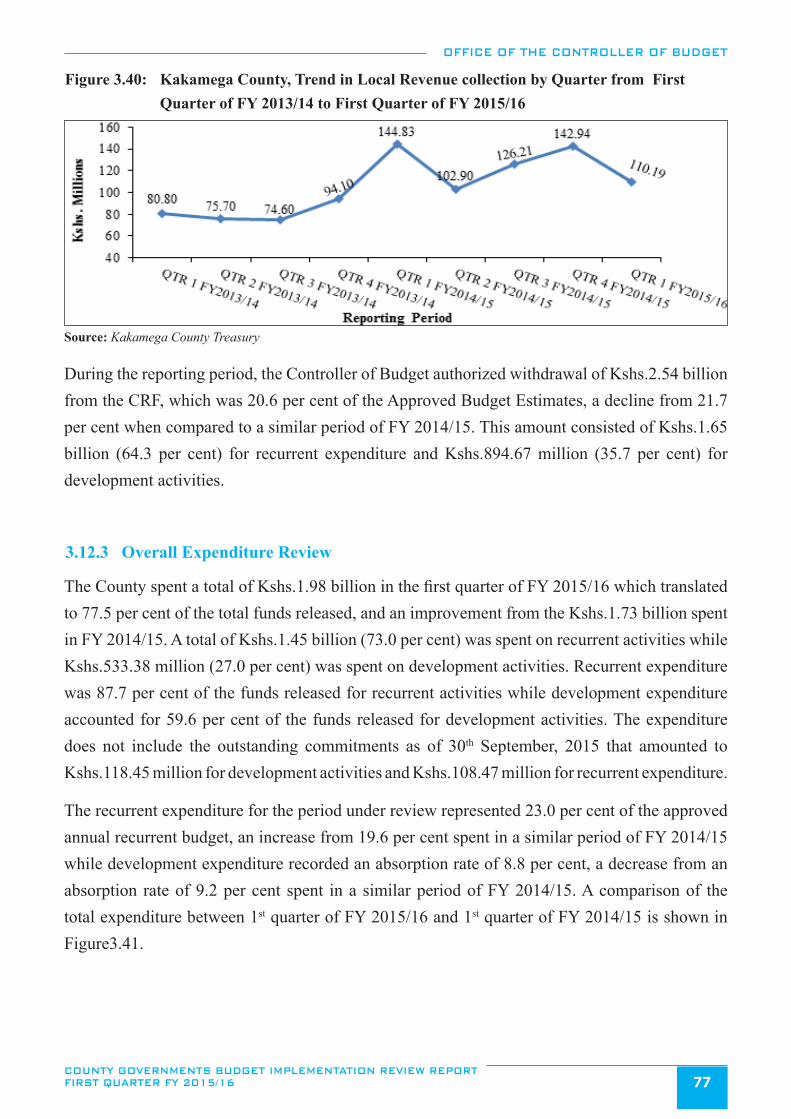
OFFICE OF THE CONTROLLER OF BUDGET
COUNTY GOVERNMENTS BUDGET IMPLEMENTATION REVIEW REPORT FIRST QUARTER FY 2015/16 77
Figure 3.40: Kakamega County, Trend in Local Revenue collection by Quarter from First Quarter of FY 2013/14 to First Quarter of FY 2015/16
Source: Kakamega County Treasury
During the reporting period, the Controller of Budget authorized withdrawal of Kshs.2.54 billion from the CRF, which was 20.6 per cent of the Approved Budget Estimates, a decline from 21.7 per cent when compared to a similar period of FY 2014/15. This amount consisted of Kshs.1.65 billion (64.3 per cent) for recurrent expenditure and Kshs.894.67 million (35.7 per cent) for development activities.
3.12.3 Overall Expenditure Review
The County spent a total of Kshs.1.98 billion in the first quarter of FY 2015/16 which translated to 77.5 per cent of the total funds released, and an improvement from the Kshs.1.73 billion spent in FY 2014/15. A total of Kshs.1.45 billion (73.0 per cent) was spent on recurrent activities while Kshs.533.38 million (27.0 per cent) was spent on development activities. Recurrent expenditure was 87.7 per cent of the funds released for recurrent activities while development expenditure accounted for 59.6 per cent of the funds released for development activities. The expenditure does not include the outstanding commitments as of 30th September, 2015 that amounted to Kshs.118.45 million for development activities and Kshs.108.47 million for recurrent expenditure.
The recurrent expenditure for the period under review represented 23.0 per cent of the approved annual recurrent budget, an increase from 19.6 per cent spent in a similar period of FY 2014/15 while development expenditure recorded an absorption rate of 8.8 per cent, a decrease from an absorption rate of 9.2 per cent spent in a similar period of FY 2014/15. A comparison of the total expenditure between 1st quarter of FY 2015/16 and 1st quarter of FY 2014/15 is shown in Figure3.41.
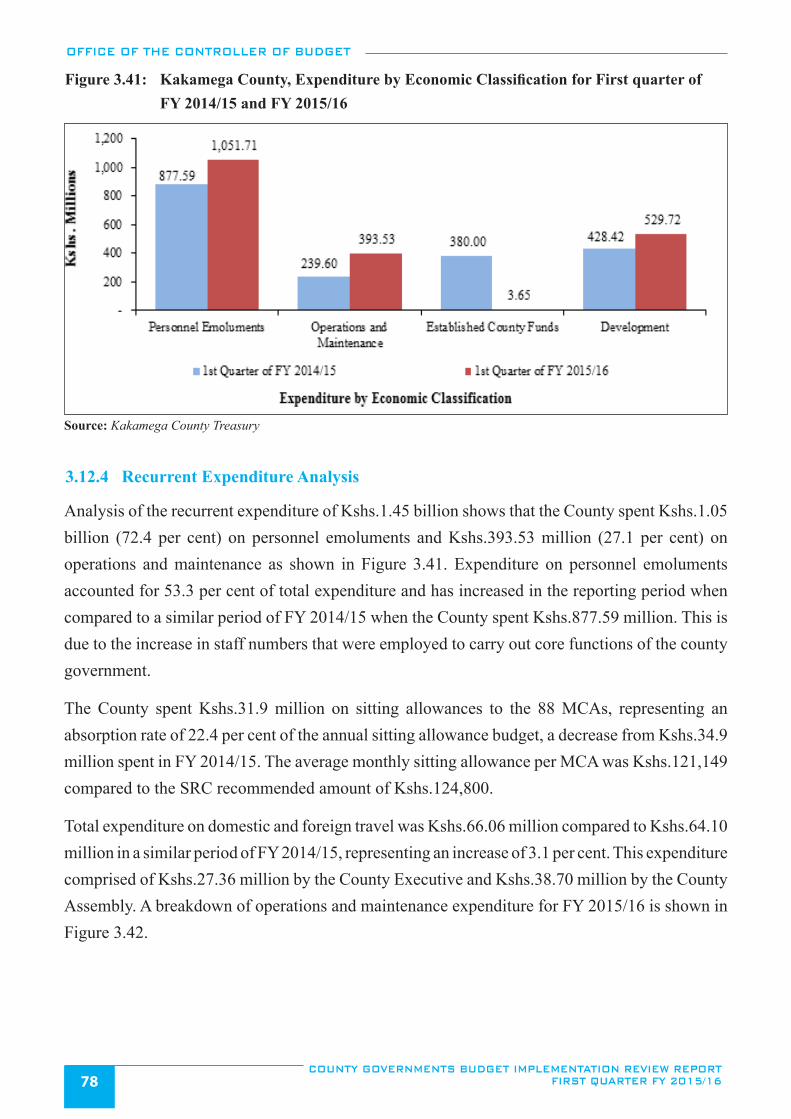
OFFICE OF THE CONTROLLER OF BUDGET
COUNTY GOVERNMENTS BUDGET IMPLEMENTATION REVIEW REPORT FIRST QUARTER FY 2015/1678
Figure 3.41: Kakamega County, Expenditure by Economic Classification for First quarter of FY 2014/15 and FY 2015/16
Source: Kakamega County Treasury
3.12.4 Recurrent Expenditure Analysis
Analysis of the recurrent expenditure of Kshs.1.45 billion shows that the County spent Kshs.1.05 billion (72.4 per cent) on personnel emoluments and Kshs.393.53 million (27.1 per cent) on operations and maintenance as shown in Figure 3.41. Expenditure on personnel emoluments accounted for 53.3 per cent of total expenditure and has increased in the reporting period when compared to a similar period of FY 2014/15 when the County spent Kshs.877.59 million. This is due to the increase in staff numbers that were employed to carry out core functions of the county government.
The County spent Kshs.31.9 million on sitting allowances to the 88 MCAs, representing an absorption rate of 22.4 per cent of the annual sitting allowance budget, a decrease from Kshs.34.9 million spent in FY 2014/15. The average monthly sitting allowance per MCA was Kshs.121,149 compared to the SRC recommended amount of Kshs.124,800.
Total expenditure on domestic and foreign travel was Kshs.66.06 million compared to Kshs.64.10 million in a similar period of FY 2014/15, representing an increase of 3.1 per cent. This expenditure comprised of Kshs.27.36 million by the County Executive and Kshs.38.70 million by the County Assembly. A breakdown of operations and maintenance expenditure for FY 2015/16 is shown in Figure 3.42.
OFFICE OF THE CONTROLLER OF BUDGET
COUNTY GOVERNMENTS BUDGET IMPLEMENTATION REVIEW REPORT FIRST QUARTER FY 2015/16 79
Figure 3.42: Kakamega County, Operations and Maintenance Expenditure for the First Quarter of FY 2015/16
Source: Kakamega County Treasury
3.12.5 Development Expenditure Analysis
Analysis of the development expenditure of Kshs.533.38 million in the period under review indicated that the department of Lands, Housing, Urban Areas & Physical planning had the highest absorption rate of the development expenditure at 19.7 per cent with the least being the office of the Governor and the County Assembly which did not utilize the development funds allocated to them by the OCOB. A further analysis of the development expenditure during the period under review indicated that the rural roads maintenance had the highest expenditure of Kshs.67.36 million while the second highest expenditure of Kshs.58.29 million was incurred in the Health department on the ongoing projects. Figure 3.43 provides a summary of development expenditure during the first quarter period of FY 2015/16.
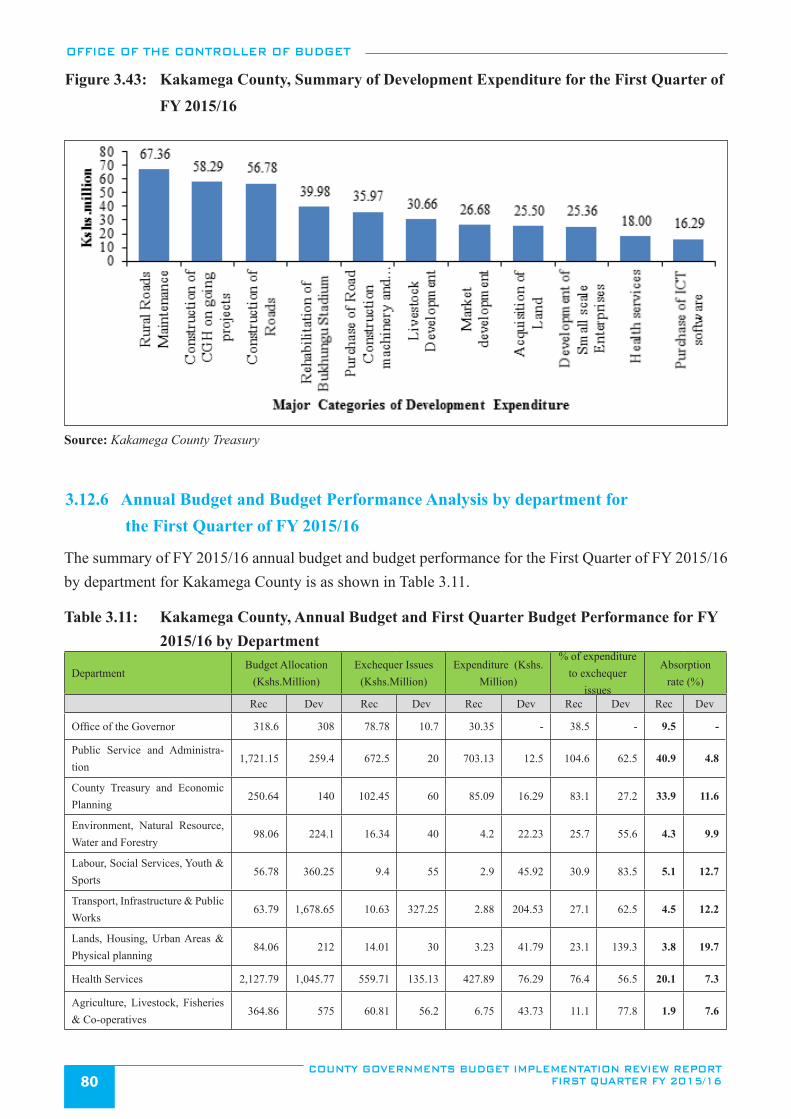
OFFICE OF THE CONTROLLER OF BUDGET
COUNTY GOVERNMENTS BUDGET IMPLEMENTATION REVIEW REPORT FIRST QUARTER FY 2015/1680
Figure 3.43: Kakamega County, Summary of Development Expenditure for the First Quarter of
FY 2015/16
Source: Kakamega County Treasury
3.12.6 Annual Budget and Budget Performance Analysis by department for the First Quarter of FY 2015/16
The summary of FY 2015/16 annual budget and budget performance for the First Quarter of FY 2015/16 by department for Kakamega County is as shown in Table 3.11.
Table 3.11: Kakamega County, Annual Budget and First Quarter Budget Performance for FY 2015/16 by Department
DepartmentBudget Allocation
(Kshs.Million)Exchequer Issues
(Kshs.Million)Expenditure (Kshs.
Million)
% of expenditure to exchequer
issues
Absorption rate (%)
Rec Dev Rec Dev Rec Dev Rec Dev Rec Dev
Office of the Governor 318.6 308 78.78 10.7 30.35 - 38.5 - 9.5 -
Public Service and Administra-tion
1,721.15 259.4 672.5 20 703.13 12.5 104.6 62.5 40.9 4.8
County Treasury and Economic Planning
250.64 140 102.45 60 85.09 16.29 83.1 27.2 33.9 11.6
Environment, Natural Resource, Water and Forestry
98.06 224.1 16.34 40 4.2 22.23 25.7 55.6 4.3 9.9
Labour, Social Services, Youth & Sports
56.78 360.25 9.4 55 2.9 45.92 30.9 83.5 5.1 12.7
Transport, Infrastructure & Public Works
63.79 1,678.65 10.63 327.25 2.88 204.53 27.1 62.5 4.5 12.2
Lands, Housing, Urban Areas & Physical planning
84.06 212 14.01 30 3.23 41.79 23.1 139.3 3.8 19.7
Health Services 2,127.79 1,045.77 559.71 135.13 427.89 76.29 76.4 56.5 20.1 7.3
Agriculture, Livestock, Fisheries & Co-operatives
364.86 575 60.81 56.2 6.75 43.73 11.1 77.8 1.9 7.6
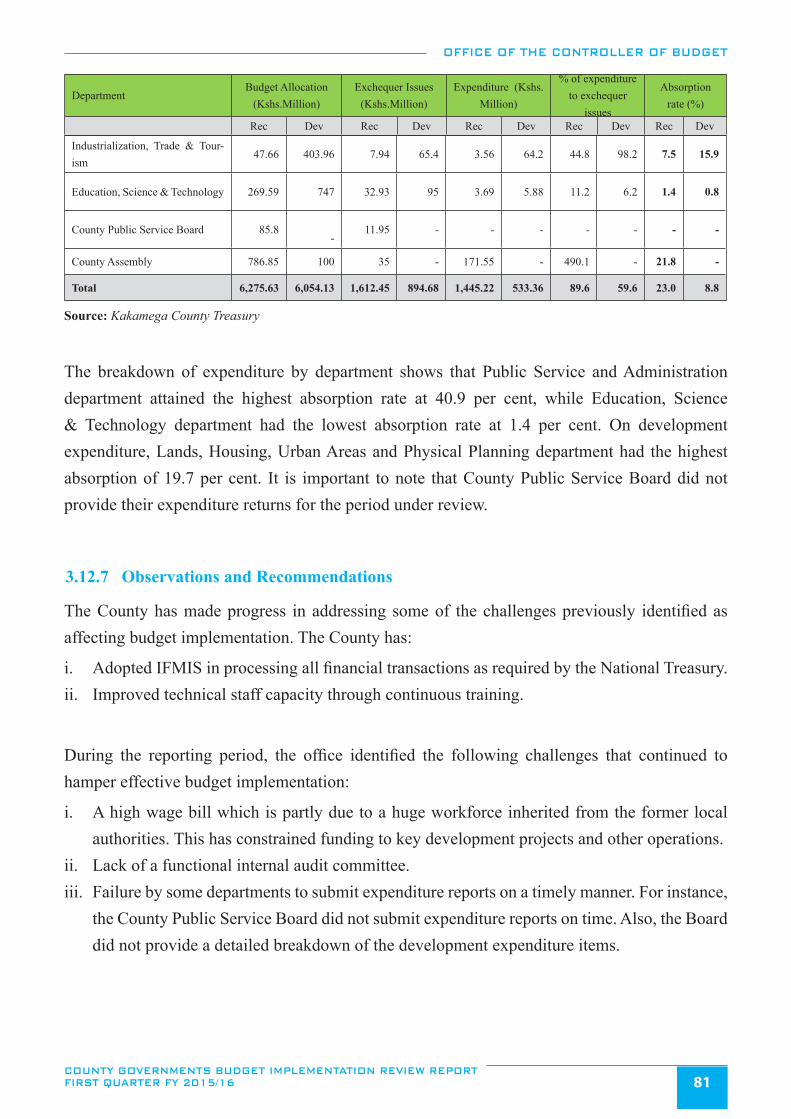
OFFICE OF THE CONTROLLER OF BUDGET
COUNTY GOVERNMENTS BUDGET IMPLEMENTATION REVIEW REPORT FIRST QUARTER FY 2015/16 81
Industrialization, Trade & Tour-ism
47.66 403.96 7.94 65.4 3.56 64.2 44.8 98.2 7.5 15.9
Education, Science & Technology 269.59 747 32.93 95 3.69 5.88 11.2 6.2 1.4 0.8
County Public Service Board 85.8
- 11.95 - - - - - - -
County Assembly 786.85 100 35 - 171.55 - 490.1 - 21.8 -
Total 6,275.63 6,054.13 1,612.45 894.68 1,445.22 533.36 89.6 59.6 23.0 8.8
Source: Kakamega County Treasury
The breakdown of expenditure by department shows that Public Service and Administration department attained the highest absorption rate at 40.9 per cent, while Education, Science & Technology department had the lowest absorption rate at 1.4 per cent. On development expenditure, Lands, Housing, Urban Areas and Physical Planning department had the highest absorption of 19.7 per cent. It is important to note that County Public Service Board did not provide their expenditure returns for the period under review.
3.12.7 Observations and Recommendations
The County has made progress in addressing some of the challenges previously identified as affecting budget implementation. The County has:
i. Adopted IFMIS in processing all financial transactions as required by the National Treasury.ii. Improved technical staff capacity through continuous training.
During the reporting period, the office identified the following challenges that continued to hamper effective budget implementation:
i. A high wage bill which is partly due to a huge workforce inherited from the former local authorities. This has constrained funding to key development projects and other operations.
ii. Lack of a functional internal audit committee.iii. Failure by some departments to submit expenditure reports on a timely manner. For instance,
the County Public Service Board did not submit expenditure reports on time. Also, the Board did not provide a detailed breakdown of the development expenditure items.
DepartmentBudget Allocation
(Kshs.Million)Exchequer Issues
(Kshs.Million)Expenditure (Kshs.
Million)
% of expenditure to exchequer
issues
Absorption rate (%)
Rec Dev Rec Dev Rec Dev Rec Dev Rec Dev
OFFICE OF THE CONTROLLER OF BUDGET
COUNTY GOVERNMENTS BUDGET IMPLEMENTATION REVIEW REPORT FIRST QUARTER FY 2015/1682
The County should implement the following recommendations in order to improve budget execution:
i. The County Treasury and the County Public Service Board should liaise with the National Government to devise strategies of ensuring a sustainable work force.
ii. The County should establish an Internal Audit Committee in order to strengthen internal oversight mechanisms in line with the Section 155 of the PFM Act, 2012.
iii. The County Treasury should liaise with all departments to provide financial reports on a timely basis to the OCOB.
3.13 Kericho County
3.13.1 Overview of the FY 2015/16 Budget
The approved Budget for Kericho County for FY 2015/16 amounts to Kshs.5.08 billion, with Kshs.3.27 billion (64.3 per cent) allocated to recurrent expenditure and Kshs.1.81 billion (35.7 per cent) to development expenditure.
In order to finance the budget, the County expected to receive Kshs.4.51 billion (88.7 per cent) as transfers from the National Government, collect Kshs.553.40 million (10.9 per cent) from local sources, and receive a conditional grant of Kshs.22.60 million (0.40 per cent) from DANIDA. However, Kshs.425.18 million representing the opening cash balance from FY 2014/15 was not factored in the FY 2015/16. Further, the County did not budget for the additional conditional grants from the National Government of Kshs.269.50 million as contained in CARA, 2015 for free maternal care, compensation for user fees forgone, leasing of medical equipment and road maintenance fuel levy fund.
3.13.2 Revenue Analysis
In the first quarter of FY 2015/16, the County received Kshs.765.86 million from the National Government as direct transfer to the CRF account, raised Kshs.43.73 million from local sources, and had a cash balance of Kshs.425.18 million brought forward from FY 2014/15. The local revenue raised in the period under review of Kshs.43.73 million was a decline from Kshs.67.33 million collected in a similar period of FY 2014/15 and accounted for 7.9 per cent of the annual local revenue target. Figure 3.44 shows the trend of local revenue collection for each quarter from first quarter of the FY 2013/14 to the first quarter of FY 2015/16.
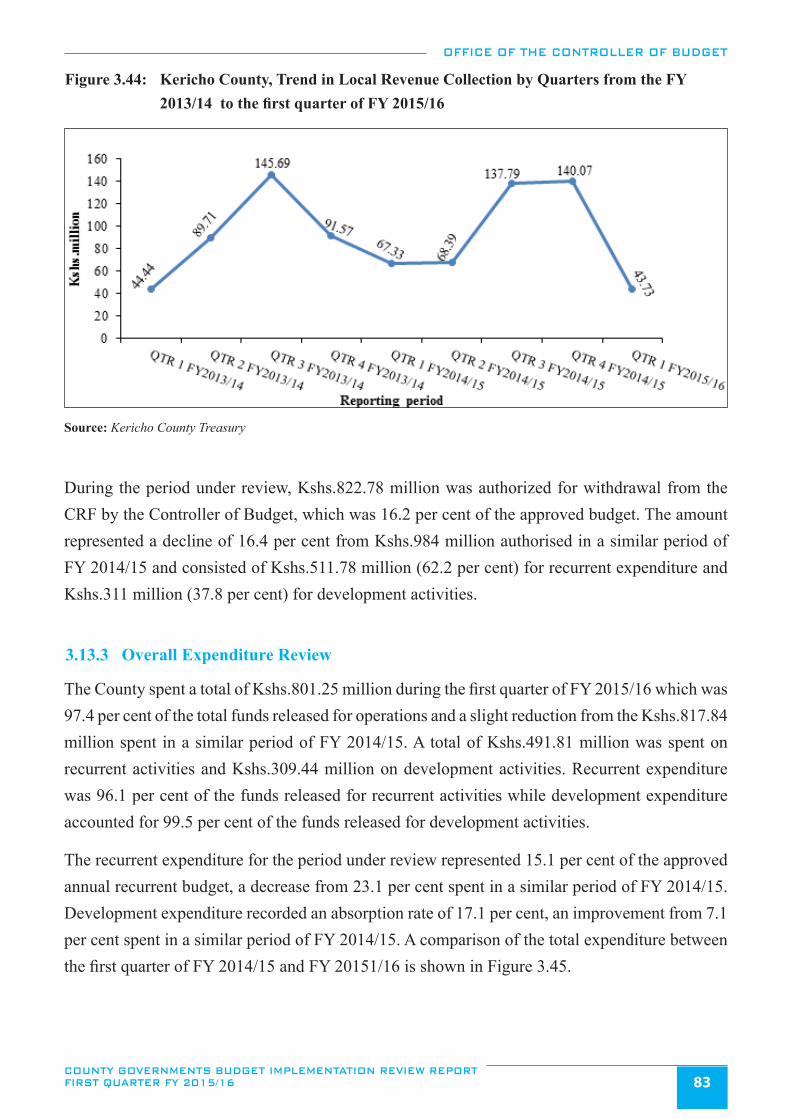
OFFICE OF THE CONTROLLER OF BUDGET
COUNTY GOVERNMENTS BUDGET IMPLEMENTATION REVIEW REPORT FIRST QUARTER FY 2015/16 83
Figure 3.44: Kericho County, Trend in Local Revenue Collection by Quarters from the FY 2013/14 to the first quarter of FY 2015/16
Source: Kericho County Treasury
During the period under review, Kshs.822.78 million was authorized for withdrawal from the CRF by the Controller of Budget, which was 16.2 per cent of the approved budget. The amount represented a decline of 16.4 per cent from Kshs.984 million authorised in a similar period of FY 2014/15 and consisted of Kshs.511.78 million (62.2 per cent) for recurrent expenditure and Kshs.311 million (37.8 per cent) for development activities.
3.13.3 Overall Expenditure Review
The County spent a total of Kshs.801.25 million during the first quarter of FY 2015/16 which was 97.4 per cent of the total funds released for operations and a slight reduction from the Kshs.817.84 million spent in a similar period of FY 2014/15. A total of Kshs.491.81 million was spent on recurrent activities and Kshs.309.44 million on development activities. Recurrent expenditure was 96.1 per cent of the funds released for recurrent activities while development expenditure accounted for 99.5 per cent of the funds released for development activities.
The recurrent expenditure for the period under review represented 15.1 per cent of the approved annual recurrent budget, a decrease from 23.1 per cent spent in a similar period of FY 2014/15. Development expenditure recorded an absorption rate of 17.1 per cent, an improvement from 7.1 per cent spent in a similar period of FY 2014/15. A comparison of the total expenditure between the first quarter of FY 2014/15 and FY 20151/16 is shown in Figure 3.45.
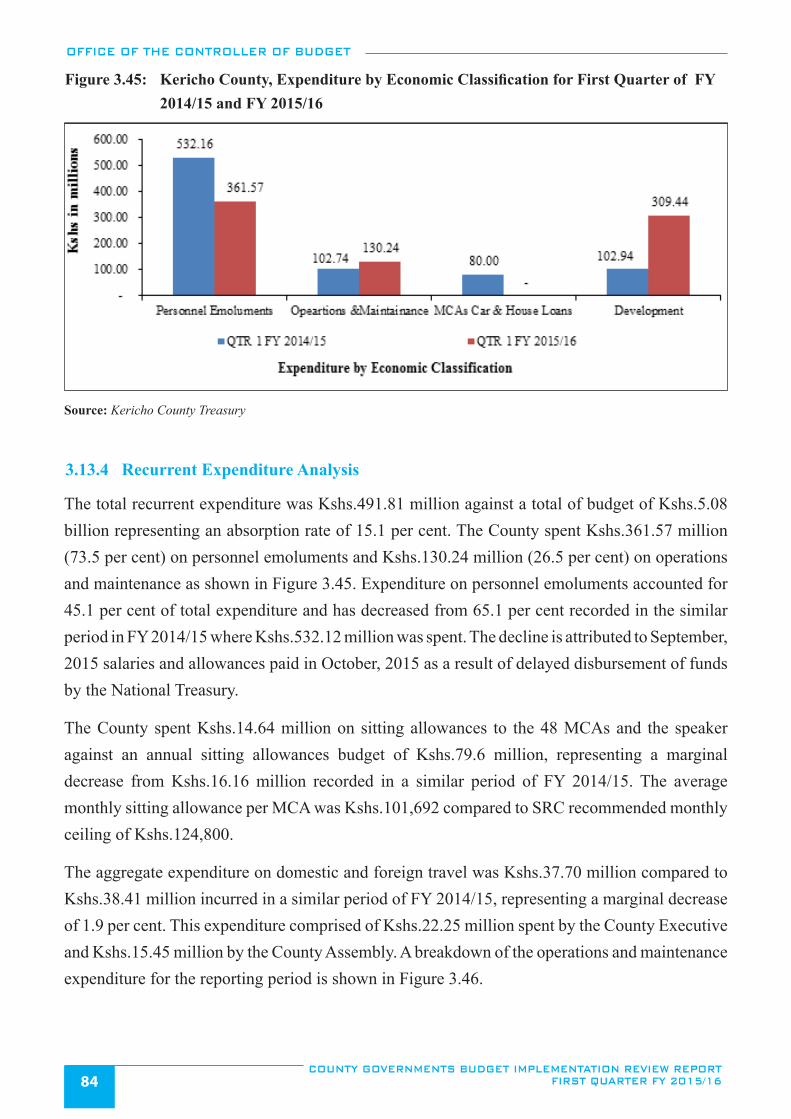
OFFICE OF THE CONTROLLER OF BUDGET
COUNTY GOVERNMENTS BUDGET IMPLEMENTATION REVIEW REPORT FIRST QUARTER FY 2015/1684
Figure 3.45: Kericho County, Expenditure by Economic Classification for First Quarter of FY 2014/15 and FY 2015/16
Source: Kericho County Treasury
3.13.4 Recurrent Expenditure Analysis
The total recurrent expenditure was Kshs.491.81 million against a total of budget of Kshs.5.08 billion representing an absorption rate of 15.1 per cent. The County spent Kshs.361.57 million (73.5 per cent) on personnel emoluments and Kshs.130.24 million (26.5 per cent) on operations and maintenance as shown in Figure 3.45. Expenditure on personnel emoluments accounted for 45.1 per cent of total expenditure and has decreased from 65.1 per cent recorded in the similar period in FY 2014/15 where Kshs.532.12 million was spent. The decline is attributed to September, 2015 salaries and allowances paid in October, 2015 as a result of delayed disbursement of funds by the National Treasury.
The County spent Kshs.14.64 million on sitting allowances to the 48 MCAs and the speaker against an annual sitting allowances budget of Kshs.79.6 million, representing a marginal decrease from Kshs.16.16 million recorded in a similar period of FY 2014/15. The average monthly sitting allowance per MCA was Kshs.101,692 compared to SRC recommended monthly ceiling of Kshs.124,800.
The aggregate expenditure on domestic and foreign travel was Kshs.37.70 million compared to Kshs.38.41 million incurred in a similar period of FY 2014/15, representing a marginal decrease of 1.9 per cent. This expenditure comprised of Kshs.22.25 million spent by the County Executive and Kshs.15.45 million by the County Assembly. A breakdown of the operations and maintenance expenditure for the reporting period is shown in Figure 3.46.
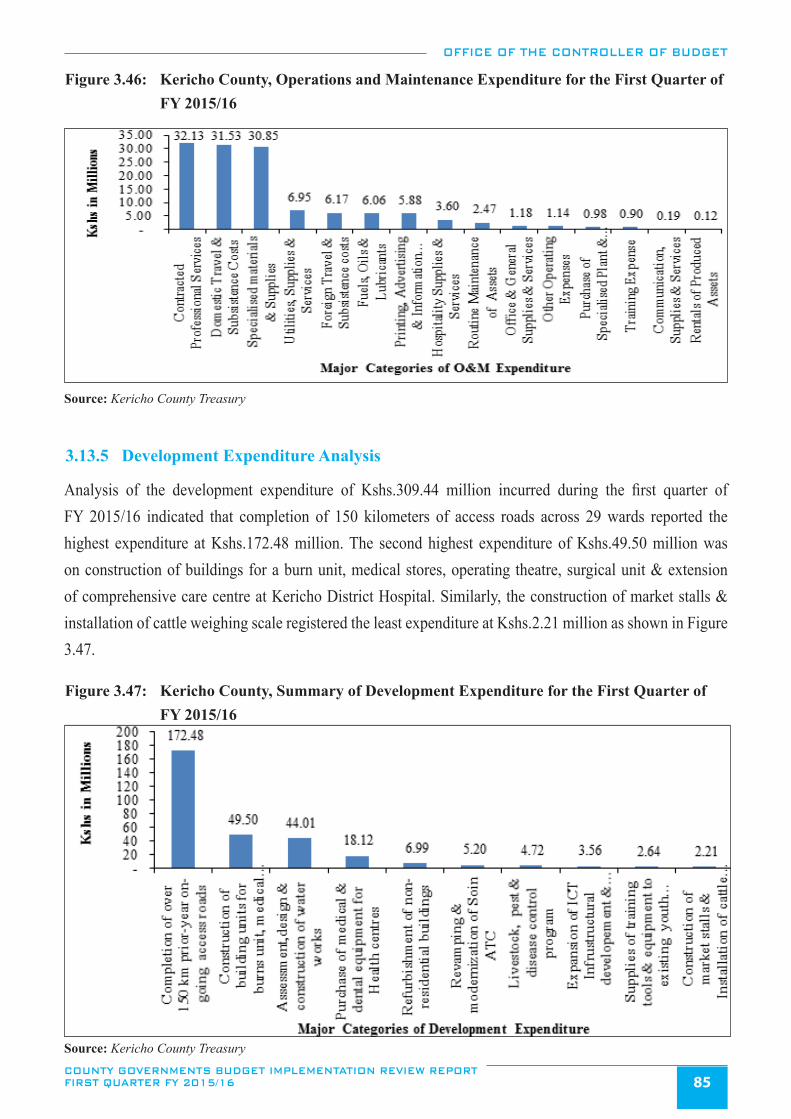
OFFICE OF THE CONTROLLER OF BUDGET
COUNTY GOVERNMENTS BUDGET IMPLEMENTATION REVIEW REPORT FIRST QUARTER FY 2015/16 85
Figure 3.46: Kericho County, Operations and Maintenance Expenditure for the First Quarter of FY 2015/16
Source: Kericho County Treasury
3.13.5 Development Expenditure Analysis
Analysis of the development expenditure of Kshs.309.44 million incurred during the first quarter of FY 2015/16 indicated that completion of 150 kilometers of access roads across 29 wards reported the highest expenditure at Kshs.172.48 million. The second highest expenditure of Kshs.49.50 million was on construction of buildings for a burn unit, medical stores, operating theatre, surgical unit & extension of comprehensive care centre at Kericho District Hospital. Similarly, the construction of market stalls & installation of cattle weighing scale registered the least expenditure at Kshs.2.21 million as shown in Figure 3.47.
Figure 3.47: Kericho County, Summary of Development Expenditure for the First Quarter of FY 2015/16
Source: Kericho County Treasury
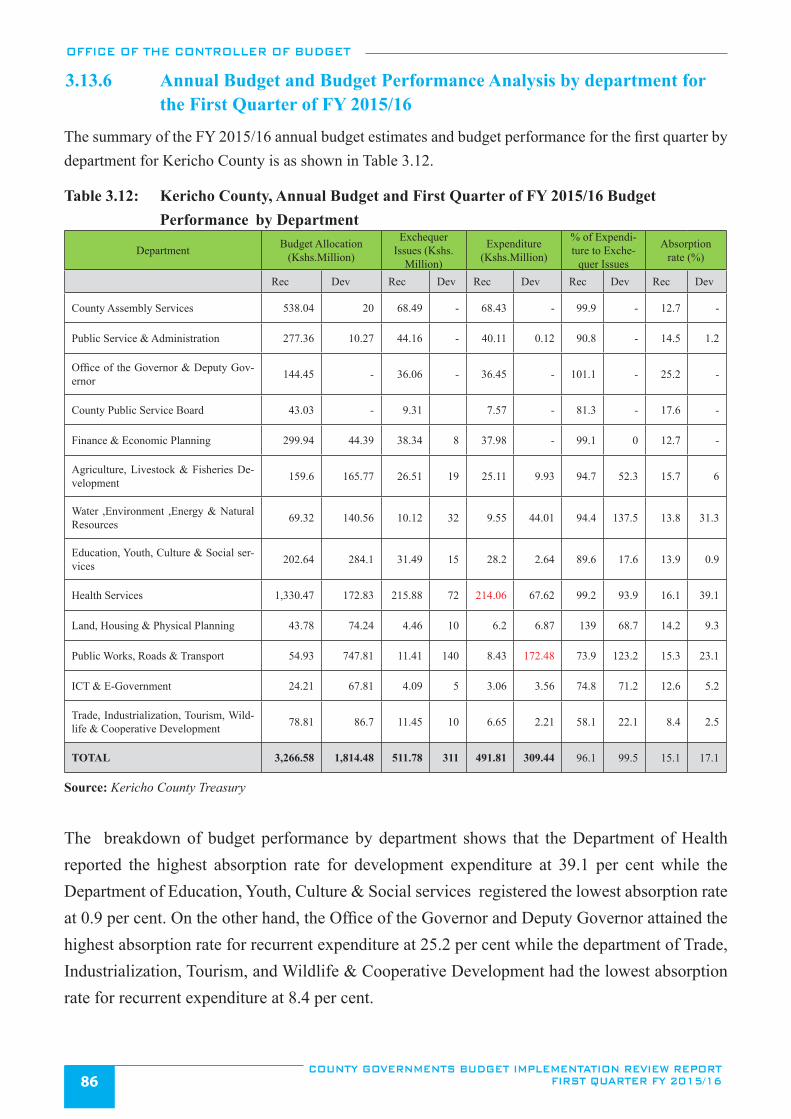
OFFICE OF THE CONTROLLER OF BUDGET
COUNTY GOVERNMENTS BUDGET IMPLEMENTATION REVIEW REPORT FIRST QUARTER FY 2015/1686
3.13.6 Annual Budget and Budget Performance Analysis by department for the First Quarter of FY 2015/16
The summary of the FY 2015/16 annual budget estimates and budget performance for the first quarter by department for Kericho County is as shown in Table 3.12.
Table 3.12: Kericho County, Annual Budget and First Quarter of FY 2015/16 Budget Performance by Department
Department Budget Allocation (Kshs.Million)
Exchequer Issues (Kshs.
Million)
Expenditure (Kshs.Million)
% of Expendi-ture to Exche-
quer Issues
Absorption rate (%)
Rec Dev Rec Dev Rec Dev Rec Dev Rec Dev
County Assembly Services 538.04 20 68.49 - 68.43 - 99.9 - 12.7 -
Public Service & Administration 277.36 10.27 44.16 - 40.11 0.12 90.8 - 14.5 1.2
Office of the Governor & Deputy Gov-ernor 144.45 - 36.06 - 36.45 - 101.1 - 25.2 -
County Public Service Board 43.03 - 9.31 7.57 - 81.3 - 17.6 -
Finance & Economic Planning 299.94 44.39 38.34 8 37.98 - 99.1 0 12.7 -
Agriculture, Livestock & Fisheries De-velopment 159.6 165.77 26.51 19 25.11 9.93 94.7 52.3 15.7 6
Water ,Environment ,Energy & Natural Resources 69.32 140.56 10.12 32 9.55 44.01 94.4 137.5 13.8 31.3
Education, Youth, Culture & Social ser-vices 202.64 284.1 31.49 15 28.2 2.64 89.6 17.6 13.9 0.9
Health Services 1,330.47 172.83 215.88 72 214.06 67.62 99.2 93.9 16.1 39.1
Land, Housing & Physical Planning 43.78 74.24 4.46 10 6.2 6.87 139 68.7 14.2 9.3
Public Works, Roads & Transport 54.93 747.81 11.41 140 8.43 172.48 73.9 123.2 15.3 23.1
ICT & E-Government 24.21 67.81 4.09 5 3.06 3.56 74.8 71.2 12.6 5.2
Trade, Industrialization, Tourism, Wild-life & Cooperative Development 78.81 86.7 11.45 10 6.65 2.21 58.1 22.1 8.4 2.5
TOTAL 3,266.58 1,814.48 511.78 311 491.81 309.44 96.1 99.5 15.1 17.1
Source: Kericho County Treasury
The breakdown of budget performance by department shows that the Department of Health reported the highest absorption rate for development expenditure at 39.1 per cent while the Department of Education, Youth, Culture & Social services registered the lowest absorption rate at 0.9 per cent. On the other hand, the Office of the Governor and Deputy Governor attained the highest absorption rate for recurrent expenditure at 25.2 per cent while the department of Trade, Industrialization, Tourism, and Wildlife & Cooperative Development had the lowest absorption rate for recurrent expenditure at 8.4 per cent.
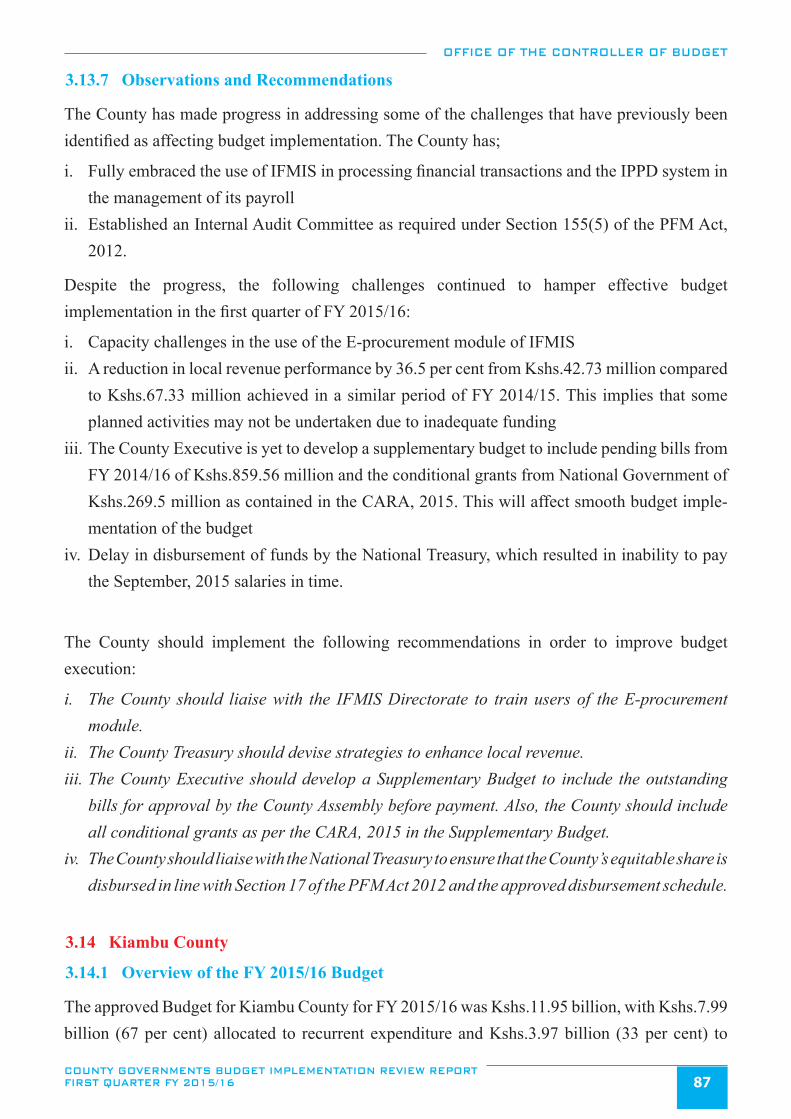
OFFICE OF THE CONTROLLER OF BUDGET
COUNTY GOVERNMENTS BUDGET IMPLEMENTATION REVIEW REPORT FIRST QUARTER FY 2015/16 87
3.13.7 Observations and Recommendations
The County has made progress in addressing some of the challenges that have previously been identified as affecting budget implementation. The County has;
i. Fully embraced the use of IFMIS in processing financial transactions and the IPPD system in the management of its payroll
ii. Established an Internal Audit Committee as required under Section 155(5) of the PFM Act, 2012.
Despite the progress, the following challenges continued to hamper effective budget implementation in the first quarter of FY 2015/16:
i. Capacity challenges in the use of the E-procurement module of IFMISii. A reduction in local revenue performance by 36.5 per cent from Kshs.42.73 million compared
to Kshs.67.33 million achieved in a similar period of FY 2014/15. This implies that some planned activities may not be undertaken due to inadequate funding
iii. The County Executive is yet to develop a supplementary budget to include pending bills from FY 2014/16 of Kshs.859.56 million and the conditional grants from National Government of Kshs.269.5 million as contained in the CARA, 2015. This will affect smooth budget imple-mentation of the budget
iv. Delay in disbursement of funds by the National Treasury, which resulted in inability to pay the September, 2015 salaries in time.
The County should implement the following recommendations in order to improve budget execution:
i. The County should liaise with the IFMIS Directorate to train users of the E-procurement module.
ii. The County Treasury should devise strategies to enhance local revenue. iii. The County Executive should develop a Supplementary Budget to include the outstanding
bills for approval by the County Assembly before payment. Also, the County should include all conditional grants as per the CARA, 2015 in the Supplementary Budget.
iv. The County should liaise with the National Treasury to ensure that the County’s equitable share is disbursed in line with Section 17 of the PFM Act 2012 and the approved disbursement schedule.
3.14 Kiambu County
3.14.1 Overview of the FY 2015/16 Budget
The approved Budget for Kiambu County for FY 2015/16 was Kshs.11.95 billion, with Kshs.7.99 billion (67 per cent) allocated to recurrent expenditure and Kshs.3.97 billion (33 per cent) to
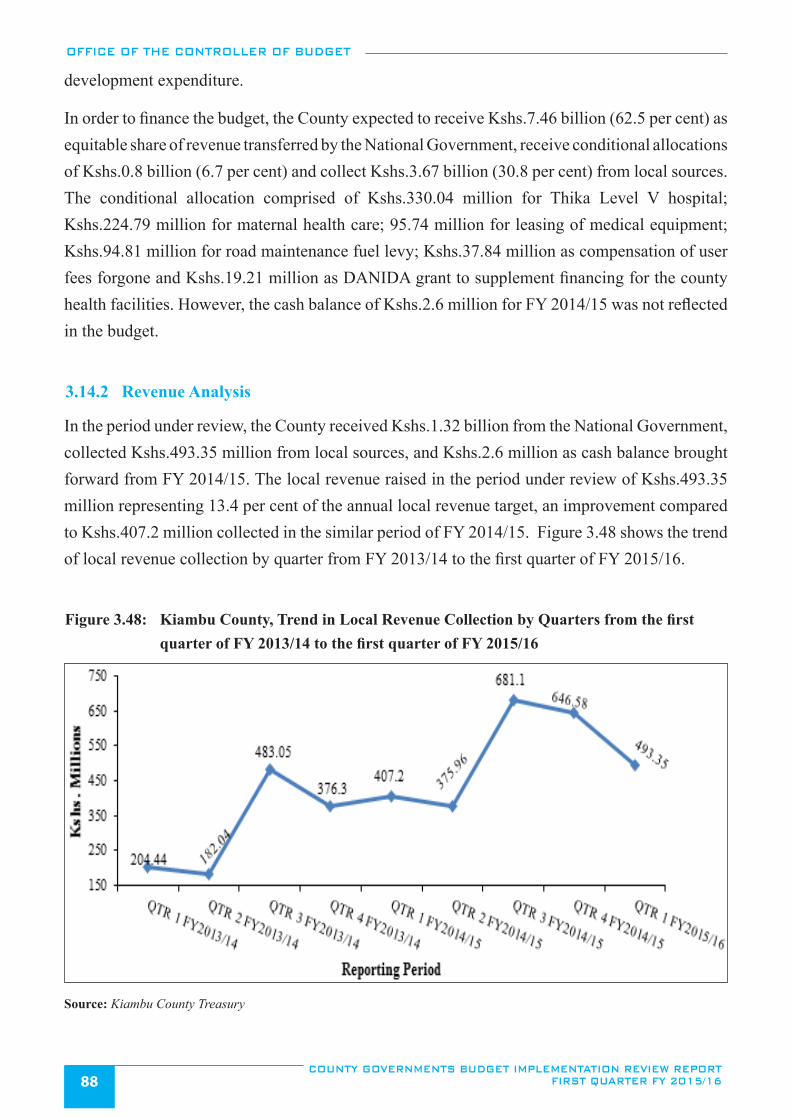
OFFICE OF THE CONTROLLER OF BUDGET
COUNTY GOVERNMENTS BUDGET IMPLEMENTATION REVIEW REPORT FIRST QUARTER FY 2015/1688
development expenditure.
In order to finance the budget, the County expected to receive Kshs.7.46 billion (62.5 per cent) as equitable share of revenue transferred by the National Government, receive conditional allocations of Kshs.0.8 billion (6.7 per cent) and collect Kshs.3.67 billion (30.8 per cent) from local sources. The conditional allocation comprised of Kshs.330.04 million for Thika Level V hospital; Kshs.224.79 million for maternal health care; 95.74 million for leasing of medical equipment; Kshs.94.81 million for road maintenance fuel levy; Kshs.37.84 million as compensation of user fees forgone and Kshs.19.21 million as DANIDA grant to supplement financing for the county health facilities. However, the cash balance of Kshs.2.6 million for FY 2014/15 was not reflected in the budget.
3.14.2 Revenue Analysis
In the period under review, the County received Kshs.1.32 billion from the National Government, collected Kshs.493.35 million from local sources, and Kshs.2.6 million as cash balance brought forward from FY 2014/15. The local revenue raised in the period under review of Kshs.493.35 million representing 13.4 per cent of the annual local revenue target, an improvement compared to Kshs.407.2 million collected in the similar period of FY 2014/15. Figure 3.48 shows the trend of local revenue collection by quarter from FY 2013/14 to the first quarter of FY 2015/16.
Figure 3.48: Kiambu County, Trend in Local Revenue Collection by Quarters from the first quarter of FY 2013/14 to the first quarter of FY 2015/16
Source: Kiambu County Treasury
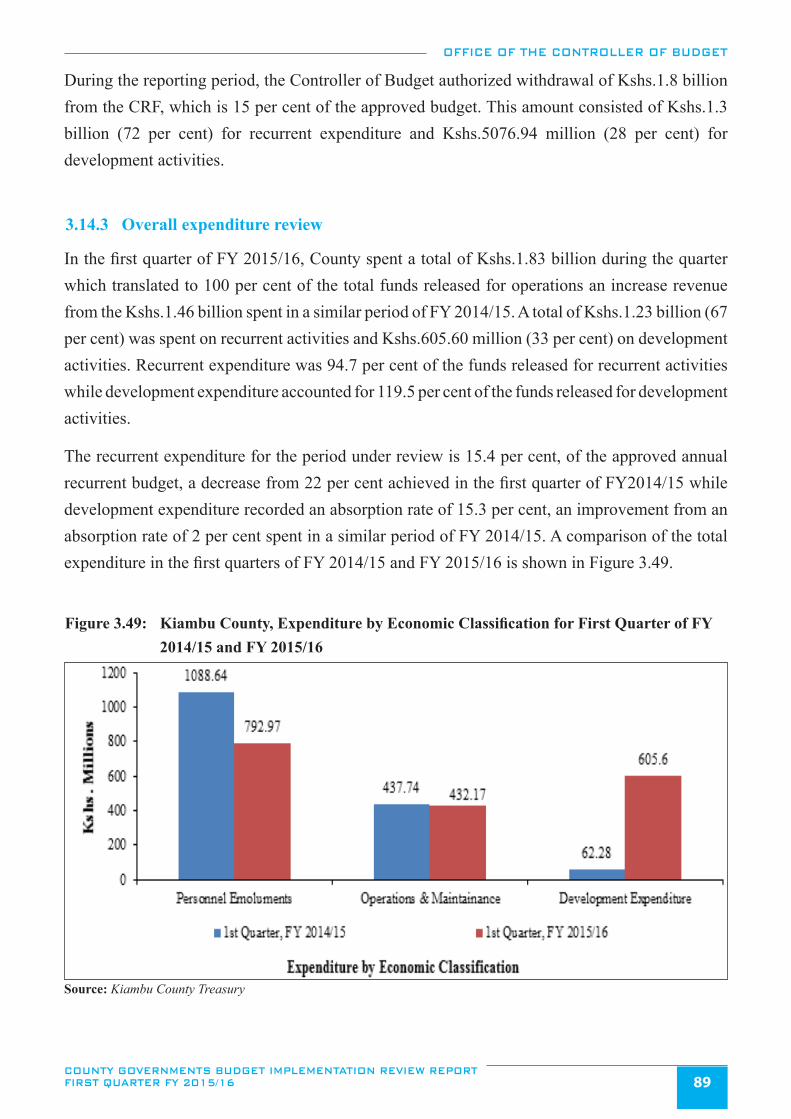
OFFICE OF THE CONTROLLER OF BUDGET
COUNTY GOVERNMENTS BUDGET IMPLEMENTATION REVIEW REPORT FIRST QUARTER FY 2015/16 89
During the reporting period, the Controller of Budget authorized withdrawal of Kshs.1.8 billion from the CRF, which is 15 per cent of the approved budget. This amount consisted of Kshs.1.3 billion (72 per cent) for recurrent expenditure and Kshs.5076.94 million (28 per cent) for development activities.
3.14.3 Overall expenditure review
In the first quarter of FY 2015/16, County spent a total of Kshs.1.83 billion during the quarter which translated to 100 per cent of the total funds released for operations an increase revenue from the Kshs.1.46 billion spent in a similar period of FY 2014/15. A total of Kshs.1.23 billion (67 per cent) was spent on recurrent activities and Kshs.605.60 million (33 per cent) on development activities. Recurrent expenditure was 94.7 per cent of the funds released for recurrent activities while development expenditure accounted for 119.5 per cent of the funds released for development activities.
The recurrent expenditure for the period under review is 15.4 per cent, of the approved annual recurrent budget, a decrease from 22 per cent achieved in the first quarter of FY2014/15 while development expenditure recorded an absorption rate of 15.3 per cent, an improvement from an absorption rate of 2 per cent spent in a similar period of FY 2014/15. A comparison of the total expenditure in the first quarters of FY 2014/15 and FY 2015/16 is shown in Figure 3.49.
Figure 3.49: Kiambu County, Expenditure by Economic Classification for First Quarter of FY 2014/15 and FY 2015/16
Source: Kiambu County Treasury
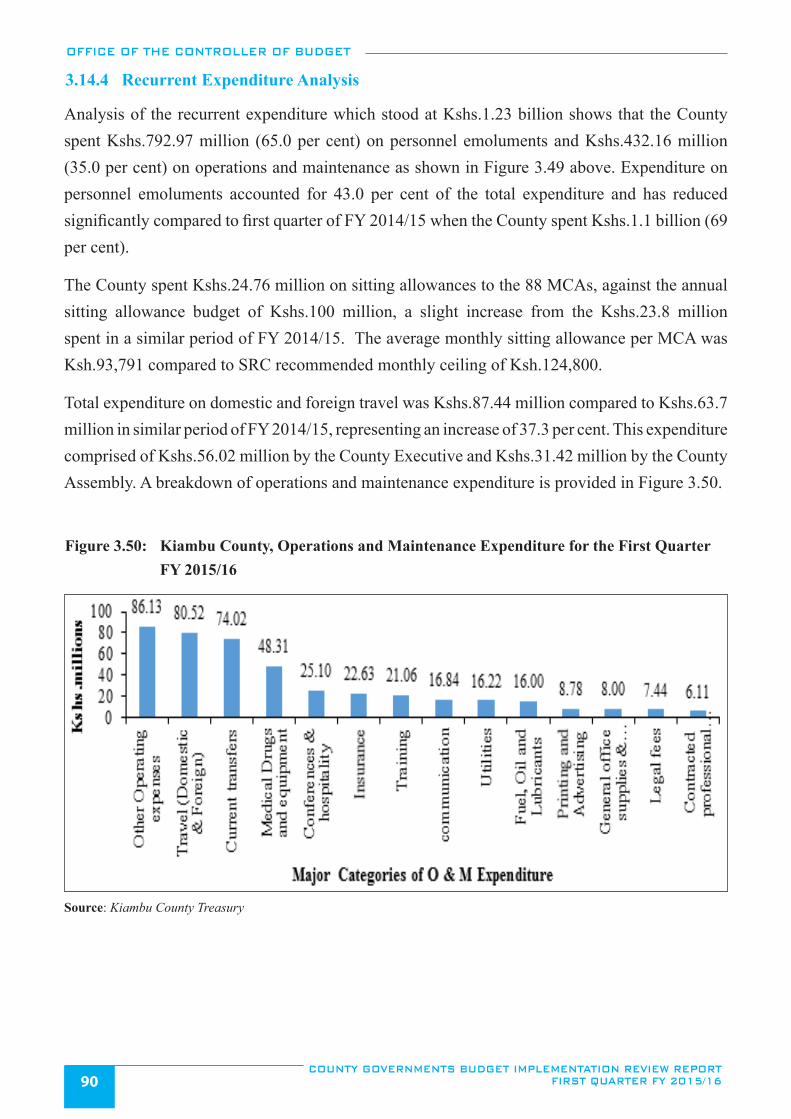
OFFICE OF THE CONTROLLER OF BUDGET
COUNTY GOVERNMENTS BUDGET IMPLEMENTATION REVIEW REPORT FIRST QUARTER FY 2015/1690
3.14.4 Recurrent Expenditure Analysis
Analysis of the recurrent expenditure which stood at Kshs.1.23 billion shows that the County spent Kshs.792.97 million (65.0 per cent) on personnel emoluments and Kshs.432.16 million (35.0 per cent) on operations and maintenance as shown in Figure 3.49 above. Expenditure on personnel emoluments accounted for 43.0 per cent of the total expenditure and has reduced significantly compared to first quarter of FY 2014/15 when the County spent Kshs.1.1 billion (69 per cent).
The County spent Kshs.24.76 million on sitting allowances to the 88 MCAs, against the annual sitting allowance budget of Kshs.100 million, a slight increase from the Kshs.23.8 million spent in a similar period of FY 2014/15. The average monthly sitting allowance per MCA was Ksh.93,791 compared to SRC recommended monthly ceiling of Ksh.124,800.
Total expenditure on domestic and foreign travel was Kshs.87.44 million compared to Kshs.63.7 million in similar period of FY 2014/15, representing an increase of 37.3 per cent. This expenditure comprised of Kshs.56.02 million by the County Executive and Kshs.31.42 million by the County Assembly. A breakdown of operations and maintenance expenditure is provided in Figure 3.50.
Figure 3.50: Kiambu County, Operations and Maintenance Expenditure for the First Quarter FY 2015/16
Source: Kiambu County Treasury
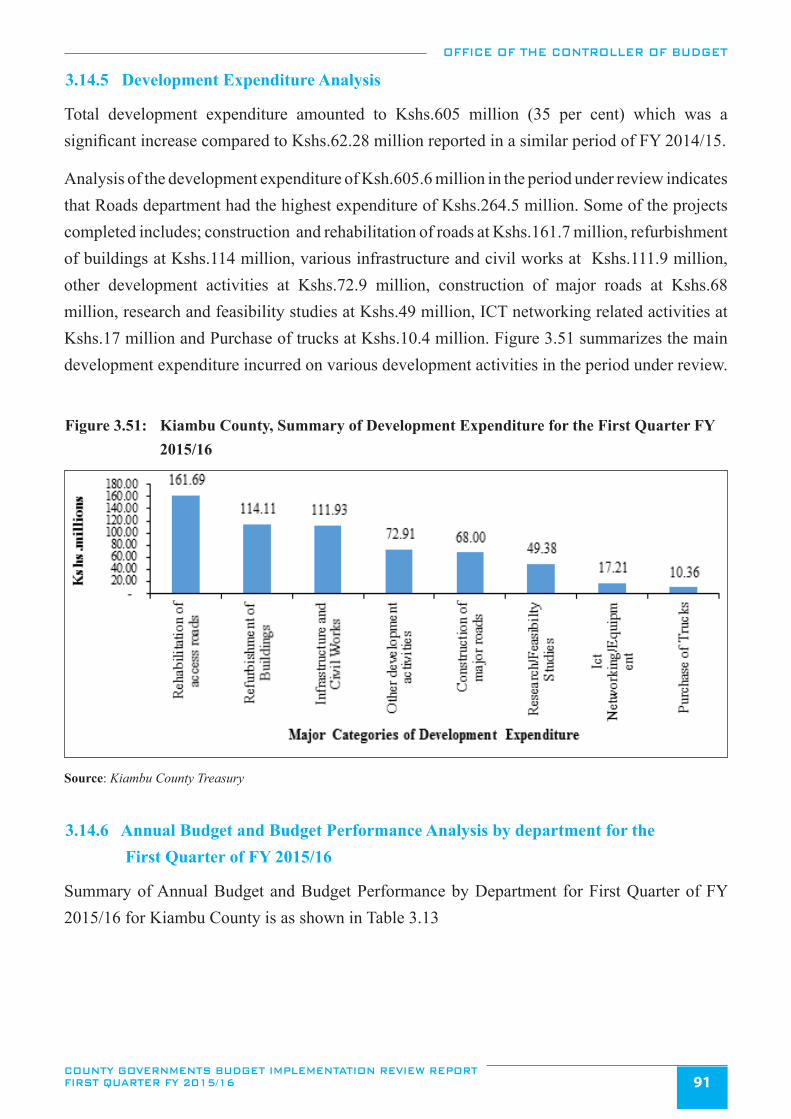
OFFICE OF THE CONTROLLER OF BUDGET
COUNTY GOVERNMENTS BUDGET IMPLEMENTATION REVIEW REPORT FIRST QUARTER FY 2015/16 91
3.14.5 Development Expenditure Analysis
Total development expenditure amounted to Kshs.605 million (35 per cent) which was a significant increase compared to Kshs.62.28 million reported in a similar period of FY 2014/15.
Analysis of the development expenditure of Ksh.605.6 million in the period under review indicates that Roads department had the highest expenditure of Kshs.264.5 million. Some of the projects completed includes; construction and rehabilitation of roads at Kshs.161.7 million, refurbishment of buildings at Kshs.114 million, various infrastructure and civil works at Kshs.111.9 million, other development activities at Kshs.72.9 million, construction of major roads at Kshs.68 million, research and feasibility studies at Kshs.49 million, ICT networking related activities at Kshs.17 million and Purchase of trucks at Kshs.10.4 million. Figure 3.51 summarizes the main development expenditure incurred on various development activities in the period under review.
Figure 3.51: Kiambu County, Summary of Development Expenditure for the First Quarter FY 2015/16
Source: Kiambu County Treasury
3.14.6 Annual Budget and Budget Performance Analysis by department for the First Quarter of FY 2015/16
Summary of Annual Budget and Budget Performance by Department for First Quarter of FY 2015/16 for Kiambu County is as shown in Table 3.13
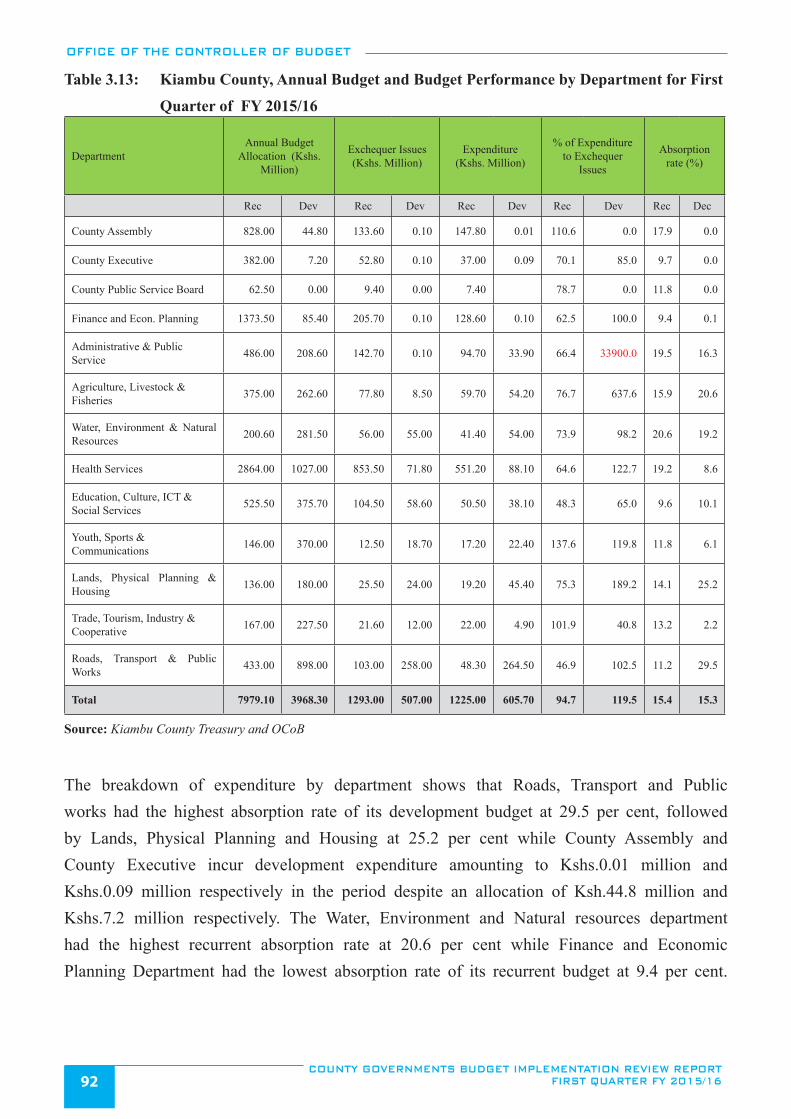
OFFICE OF THE CONTROLLER OF BUDGET
COUNTY GOVERNMENTS BUDGET IMPLEMENTATION REVIEW REPORT FIRST QUARTER FY 2015/1692
Table 3.13: Kiambu County, Annual Budget and Budget Performance by Department for First
Quarter of FY 2015/16
DepartmentAnnual Budget
Allocation (Kshs. Million)
Exchequer Issues (Kshs. Million)
Expenditure (Kshs. Million)
% of Expenditure to Exchequer
Issues
Absorption rate (%)
Rec Dev Rec Dev Rec Dev Rec Dev Rec Dec
County Assembly 828.00 44.80 133.60 0.10 147.80 0.01 110.6 0.0 17.9 0.0
County Executive 382.00 7.20 52.80 0.10 37.00 0.09 70.1 85.0 9.7 0.0
County Public Service Board 62.50 0.00 9.40 0.00 7.40 78.7 0.0 11.8 0.0
Finance and Econ. Planning 1373.50 85.40 205.70 0.10 128.60 0.10 62.5 100.0 9.4 0.1
Administrative & Public Service 486.00 208.60 142.70 0.10 94.70 33.90 66.4 33900.0 19.5 16.3
Agriculture, Livestock & Fisheries 375.00 262.60 77.80 8.50 59.70 54.20 76.7 637.6 15.9 20.6
Water, Environment & Natural Resources 200.60 281.50 56.00 55.00 41.40 54.00 73.9 98.2 20.6 19.2
Health Services 2864.00 1027.00 853.50 71.80 551.20 88.10 64.6 122.7 19.2 8.6
Education, Culture, ICT & Social Services 525.50 375.70 104.50 58.60 50.50 38.10 48.3 65.0 9.6 10.1
Youth, Sports & Communications 146.00 370.00 12.50 18.70 17.20 22.40 137.6 119.8 11.8 6.1
Lands, Physical Planning & Housing 136.00 180.00 25.50 24.00 19.20 45.40 75.3 189.2 14.1 25.2
Trade, Tourism, Industry & Cooperative 167.00 227.50 21.60 12.00 22.00 4.90 101.9 40.8 13.2 2.2
Roads, Transport & Public Works 433.00 898.00 103.00 258.00 48.30 264.50 46.9 102.5 11.2 29.5
Total 7979.10 3968.30 1293.00 507.00 1225.00 605.70 94.7 119.5 15.4 15.3
Source: Kiambu County Treasury and OCoB
The breakdown of expenditure by department shows that Roads, Transport and Public works had the highest absorption rate of its development budget at 29.5 per cent, followed by Lands, Physical Planning and Housing at 25.2 per cent while County Assembly and County Executive incur development expenditure amounting to Kshs.0.01 million and Kshs.0.09 million respectively in the period despite an allocation of Ksh.44.8 million and Kshs.7.2 million respectively. The Water, Environment and Natural resources department had the highest recurrent absorption rate at 20.6 per cent while Finance and Economic Planning Department had the lowest absorption rate of its recurrent budget at 9.4 per cent.
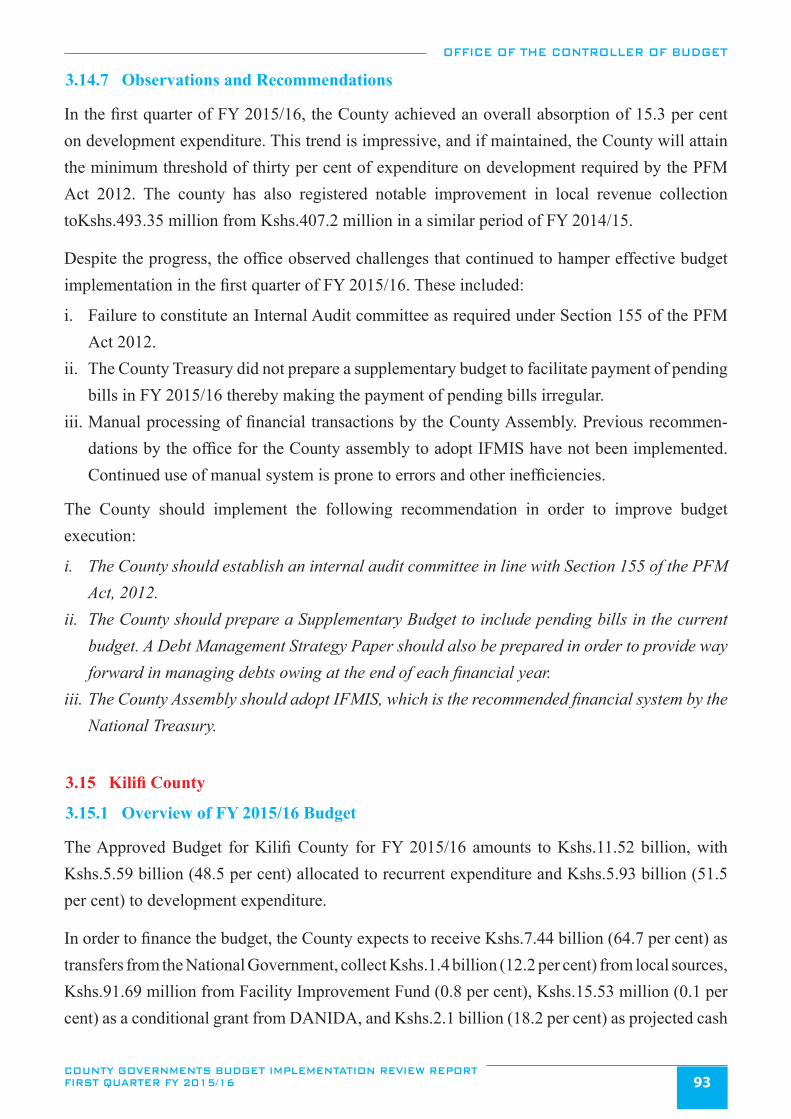
OFFICE OF THE CONTROLLER OF BUDGET
COUNTY GOVERNMENTS BUDGET IMPLEMENTATION REVIEW REPORT FIRST QUARTER FY 2015/16 93
3.14.7 Observations and Recommendations
In the first quarter of FY 2015/16, the County achieved an overall absorption of 15.3 per cent on development expenditure. This trend is impressive, and if maintained, the County will attain the minimum threshold of thirty per cent of expenditure on development required by the PFM Act 2012. The county has also registered notable improvement in local revenue collection toKshs.493.35 million from Kshs.407.2 million in a similar period of FY 2014/15.
Despite the progress, the office observed challenges that continued to hamper effective budget implementation in the first quarter of FY 2015/16. These included:
i. Failure to constitute an Internal Audit committee as required under Section 155 of the PFM Act 2012.
ii. The County Treasury did not prepare a supplementary budget to facilitate payment of pending bills in FY 2015/16 thereby making the payment of pending bills irregular.
iii. Manual processing of financial transactions by the County Assembly. Previous recommen-dations by the office for the County assembly to adopt IFMIS have not been implemented. Continued use of manual system is prone to errors and other inefficiencies.
The County should implement the following recommendation in order to improve budget execution:
i. The County should establish an internal audit committee in line with Section 155 of the PFM Act, 2012.
ii. The County should prepare a Supplementary Budget to include pending bills in the current budget. A Debt Management Strategy Paper should also be prepared in order to provide way forward in managing debts owing at the end of each financial year.
iii. The County Assembly should adopt IFMIS, which is the recommended financial system by the National Treasury.
3.15 Kilifi County
3.15.1 Overview of FY 2015/16 Budget
The Approved Budget for Kilifi County for FY 2015/16 amounts to Kshs.11.52 billion, with Kshs.5.59 billion (48.5 per cent) allocated to recurrent expenditure and Kshs.5.93 billion (51.5 per cent) to development expenditure.
In order to finance the budget, the County expects to receive Kshs.7.44 billion (64.7 per cent) as transfers from the National Government, collect Kshs.1.4 billion (12.2 per cent) from local sources, Kshs.91.69 million from Facility Improvement Fund (0.8 per cent), Kshs.15.53 million (0.1 per cent) as a conditional grant from DANIDA, and Kshs.2.1 billion (18.2 per cent) as projected cash
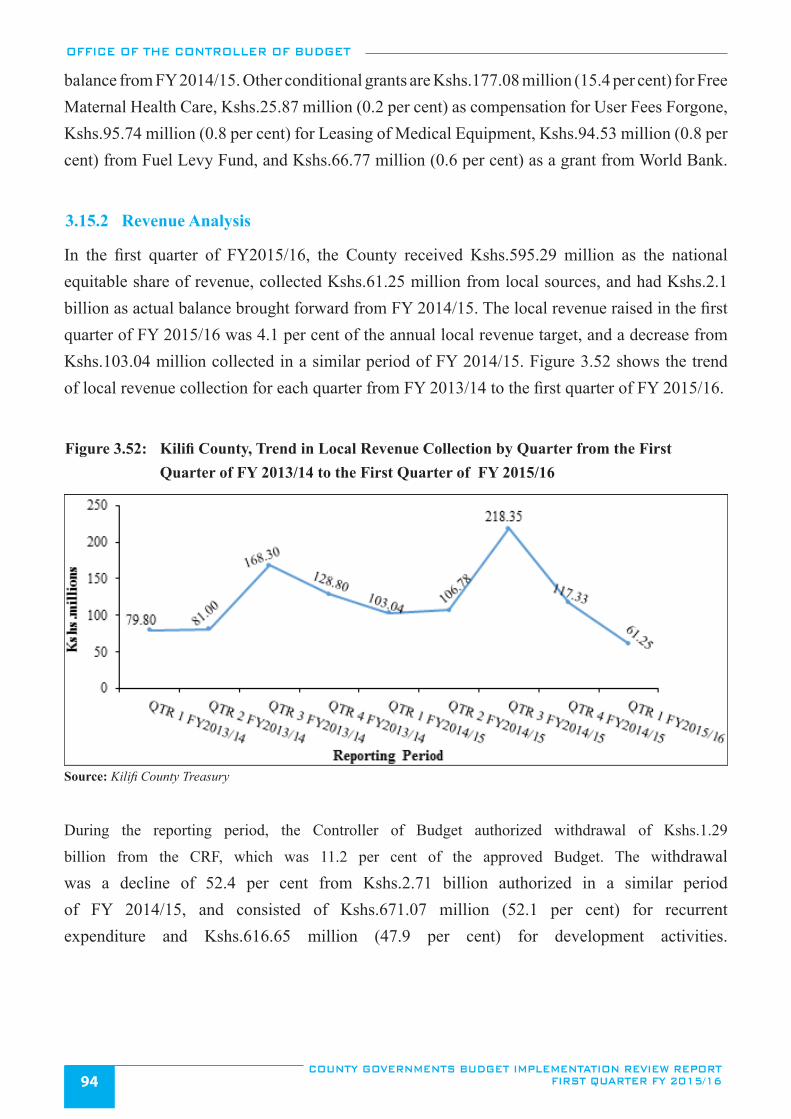
OFFICE OF THE CONTROLLER OF BUDGET
COUNTY GOVERNMENTS BUDGET IMPLEMENTATION REVIEW REPORT FIRST QUARTER FY 2015/1694
balance from FY 2014/15. Other conditional grants are Kshs.177.08 million (15.4 per cent) for Free Maternal Health Care, Kshs.25.87 million (0.2 per cent) as compensation for User Fees Forgone, Kshs.95.74 million (0.8 per cent) for Leasing of Medical Equipment, Kshs.94.53 million (0.8 per cent) from Fuel Levy Fund, and Kshs.66.77 million (0.6 per cent) as a grant from World Bank.
3.15.2 Revenue Analysis
In the first quarter of FY2015/16, the County received Kshs.595.29 million as the national equitable share of revenue, collected Kshs.61.25 million from local sources, and had Kshs.2.1 billion as actual balance brought forward from FY 2014/15. The local revenue raised in the first quarter of FY 2015/16 was 4.1 per cent of the annual local revenue target, and a decrease from Kshs.103.04 million collected in a similar period of FY 2014/15. Figure 3.52 shows the trend of local revenue collection for each quarter from FY 2013/14 to the first quarter of FY 2015/16.
Figure 3.52: Kilifi County, Trend in Local Revenue Collection by Quarter from the First Quarter of FY 2013/14 to the First Quarter of FY 2015/16
Source: Kilifi County Treasury
During the reporting period, the Controller of Budget authorized withdrawal of Kshs.1.29
billion from the CRF, which was 11.2 per cent of the approved Budget. The withdrawal was a decline of 52.4 per cent from Kshs.2.71 billion authorized in a similar period of FY 2014/15, and consisted of Kshs.671.07 million (52.1 per cent) for recurrent expenditure and Kshs.616.65 million (47.9 per cent) for development activities.
OFFICE OF THE CONTROLLER OF BUDGET
COUNTY GOVERNMENTS BUDGET IMPLEMENTATION REVIEW REPORT FIRST QUARTER FY 2015/16 95
3.15.3 Overall Expenditure Review
The County spent a total of Kshs.616.14 million on recurrent activities. We could not report on development expenditure as the IFMIS returns were incorrect and the County Treasury did not provide a reconciled position on time to enable reporting. Recurrent expenditure was 91.8 per cent of the funds released for recurrent expenditure. The County did not provide information on outstanding commitments as of 30th September, 2015.
The recurrent expenditure for the period under review represented 11 per cent of the approved annual recurrent budget, a decrease from 15.8 per cent spent in a similar period of FY 2014/15. Figure 3.53 shows a comparison of the total expenditure between the first quarters of FY 2014/15 and FY 2015/16.
Figure 3.53: Kilifi County, Expenditure by Economic Classification for First Quarter of FY 2014/15 and FY 2015/16
Source: Kilifi County Treasury
3.15.4 Recurrent Expenditure Analysis
Analysis of the recurrent expenditure of Kshs.616.14 million shows that the County spent Kshs.506.67 million (82.2 per cent) on personnel emoluments and Kshs.110.07 million (17.8 per cent) on operations and maintenance as shown in Figure 3.53. Expenditure on personnel emoluments accounted for 82.1 per cent of total recurrent expenditure, and has increased in the reporting period when compared to a similar period of FY 2014/15 when the County spent Kshs.241.9 million. The increase could be attributed to annual salary increments and employment of additional skilled staff.
The County spent Kshs.17.99 million on sitting allowances to the 54 MCAs, against the annual sitting allowance budget of Kshs.83.19 million, a decrease from Kshs.22.24 million spent in
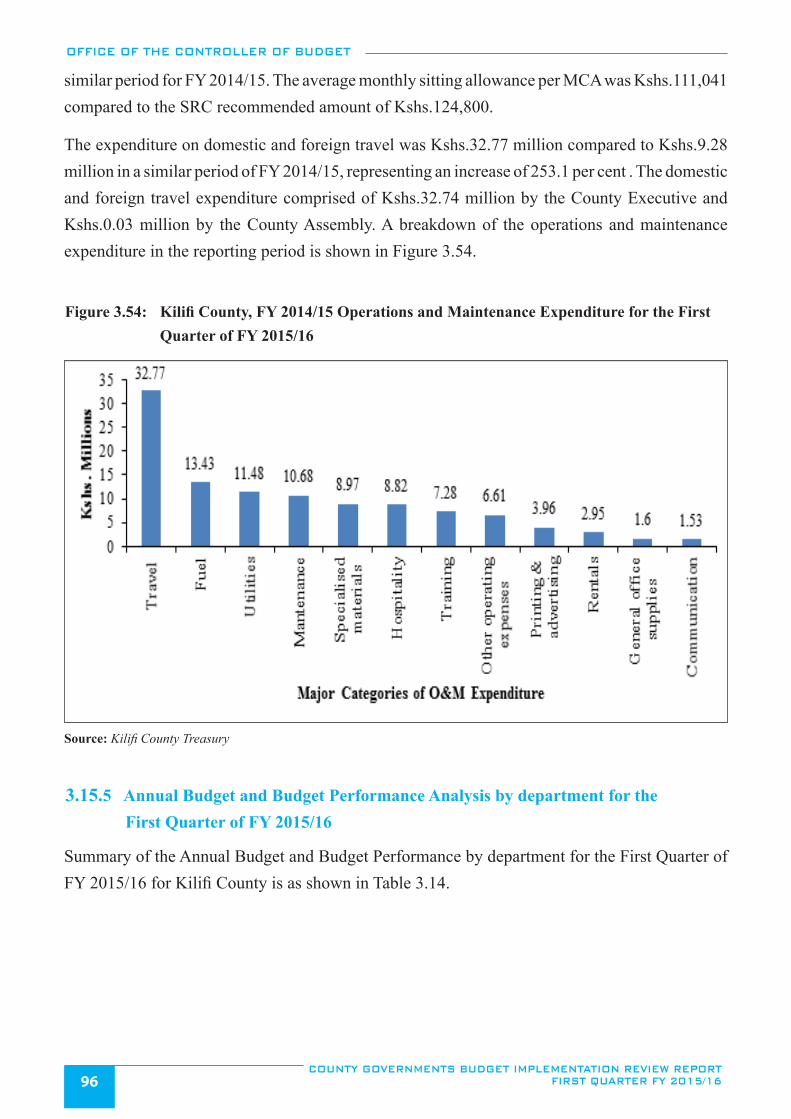
OFFICE OF THE CONTROLLER OF BUDGET
COUNTY GOVERNMENTS BUDGET IMPLEMENTATION REVIEW REPORT FIRST QUARTER FY 2015/1696
similar period for FY 2014/15. The average monthly sitting allowance per MCA was Kshs.111,041 compared to the SRC recommended amount of Kshs.124,800.
The expenditure on domestic and foreign travel was Kshs.32.77 million compared to Kshs.9.28 million in a similar period of FY 2014/15, representing an increase of 253.1 per cent . The domestic and foreign travel expenditure comprised of Kshs.32.74 million by the County Executive and Kshs.0.03 million by the County Assembly. A breakdown of the operations and maintenance expenditure in the reporting period is shown in Figure 3.54.
Figure 3.54: Kilifi County, FY 2014/15 Operations and Maintenance Expenditure for the First Quarter of FY 2015/16
Source: Kilifi County Treasury
3.15.5 Annual Budget and Budget Performance Analysis by department for the First Quarter of FY 2015/16
Summary of the Annual Budget and Budget Performance by department for the First Quarter of FY 2015/16 for Kilifi County is as shown in Table 3.14.
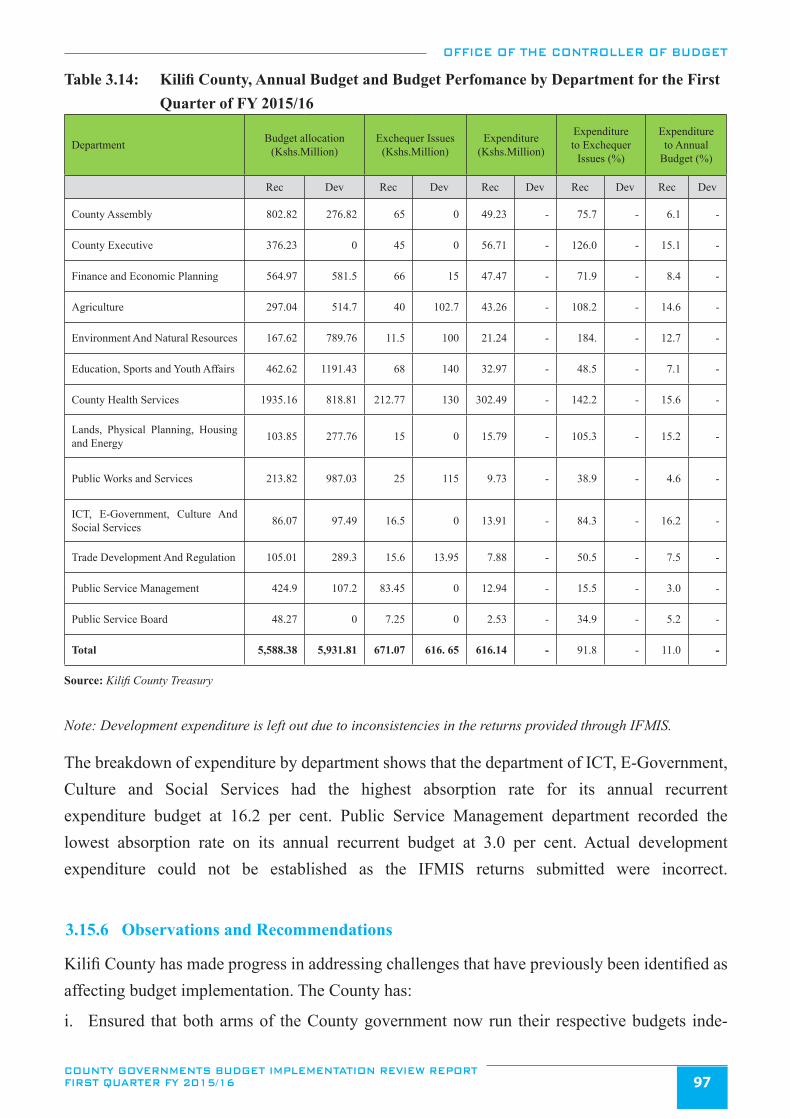
OFFICE OF THE CONTROLLER OF BUDGET
COUNTY GOVERNMENTS BUDGET IMPLEMENTATION REVIEW REPORT FIRST QUARTER FY 2015/16 97
Table 3.14: Kilifi County, Annual Budget and Budget Perfomance by Department for the First Quarter of FY 2015/16
Department Budget allocation (Kshs.Million)
Exchequer Issues (Kshs.Million)
Expenditure (Kshs.Million)
Expenditure to Exchequer
Issues (%)
Expenditure to Annual
Budget (%)
Rec Dev Rec Dev Rec Dev Rec Dev Rec Dev
County Assembly 802.82 276.82 65 0 49.23 - 75.7 - 6.1 -
County Executive 376.23 0 45 0 56.71 - 126.0 - 15.1 -
Finance and Economic Planning 564.97 581.5 66 15 47.47 - 71.9 - 8.4 -
Agriculture 297.04 514.7 40 102.7 43.26 - 108.2 - 14.6 -
Environment And Natural Resources 167.62 789.76 11.5 100 21.24 - 184. - 12.7 -
Education, Sports and Youth Affairs 462.62 1191.43 68 140 32.97 - 48.5 - 7.1 -
County Health Services 1935.16 818.81 212.77 130 302.49 - 142.2 - 15.6 -
Lands, Physical Planning, Housing and Energy 103.85 277.76 15 0 15.79 - 105.3 - 15.2 -
Public Works and Services 213.82 987.03 25 115 9.73 - 38.9 - 4.6 -
ICT, E-Government, Culture And Social Services 86.07 97.49 16.5 0 13.91 - 84.3 - 16.2 -
Trade Development And Regulation 105.01 289.3 15.6 13.95 7.88 - 50.5 - 7.5 -
Public Service Management 424.9 107.2 83.45 0 12.94 - 15.5 - 3.0 -
Public Service Board 48.27 0 7.25 0 2.53 - 34.9 - 5.2 -
Total 5,588.38 5,931.81 671.07 616. 65 616.14 - 91.8 - 11.0 -
Source: Kilifi County Treasury
Note: Development expenditure is left out due to inconsistencies in the returns provided through IFMIS.
The breakdown of expenditure by department shows that the department of ICT, E-Government, Culture and Social Services had the highest absorption rate for its annual recurrent expenditure budget at 16.2 per cent. Public Service Management department recorded the lowest absorption rate on its annual recurrent budget at 3.0 per cent. Actual development expenditure could not be established as the IFMIS returns submitted were incorrect.
3.15.6 Observations and Recommendations
Kilifi County has made progress in addressing challenges that have previously been identified as affecting budget implementation. The County has:
i. Ensured that both arms of the County government now run their respective budgets inde-
OFFICE OF THE CONTROLLER OF BUDGET
COUNTY GOVERNMENTS BUDGET IMPLEMENTATION REVIEW REPORT FIRST QUARTER FY 2015/1698
pendently, with clear separation of powers as required by law.ii. Automated the procurement process through adoption of E-Procurement module of IFMIS.iii. Designated Administrators for the County Scholarship Fund but it is yet to appoint desig-
nated administrators for the other established County Funds such as the County Assembly Mortgage and Car loan Funds and the County emergency Fund.
Despite the progress, the following challenges continued to hamper effective budget implementation in the first quarter of FY 2015/16;
i. Inadequate technical capacity among the officers handling IFMIS, which has occasioned er-roneous posting of transactions. This has resulted in inaccurate development expenditure re-porting.
ii. The County Treasury is yet to constitute an Internal Audit Committee. This is contrary to Section 155(5) of the PFM Act, 2012.
iii. Lack of Project Management and Implementation Committees, comprising of the local com-munities to oversee implementation of development projects at Sub-County and Ward levels.
iv. Delay in release of funds by the National Treasury which led to inability to pay suppliers in time.
The County should implement the following recommendations in order to improve budget execution:
i. County Treasury should build technical capacity of the officers handling IFMIS transactions. ii. The County Treasury should establish an Internal Audit Committee in order to strengthen
internal oversight mechanisms in line with the Section 155 (5) of the PFM Act, 2012.iii. The County should establish ward-level community Project Management Committees to over-
see implementation of development projects.iv. National Treasury should ensure timely exchequer releases to the County in accordance with
Section 17 of the PFM Act, 2012 and the approved disbursement schedule.
3.16 Kirinyaga County
3.16.1 Overview of the FY 2015/16 County Budget
During the FY 2015/16, the approved budget for Kirinyaga County was Kshs.5.32 billion, with Kshs.3.06 billion (57.6 per cent) allocated to recurrent expenditure and Kshs.2.26 billion (42.4 per cent) to development expenditure.
In order to finance the budget, the County expects to receive Kshs.3.54 billion (66.5 per cent) as transfers from the National Government, collect Kshs.500.00 million (9.4 per cent) from local sources, receive a
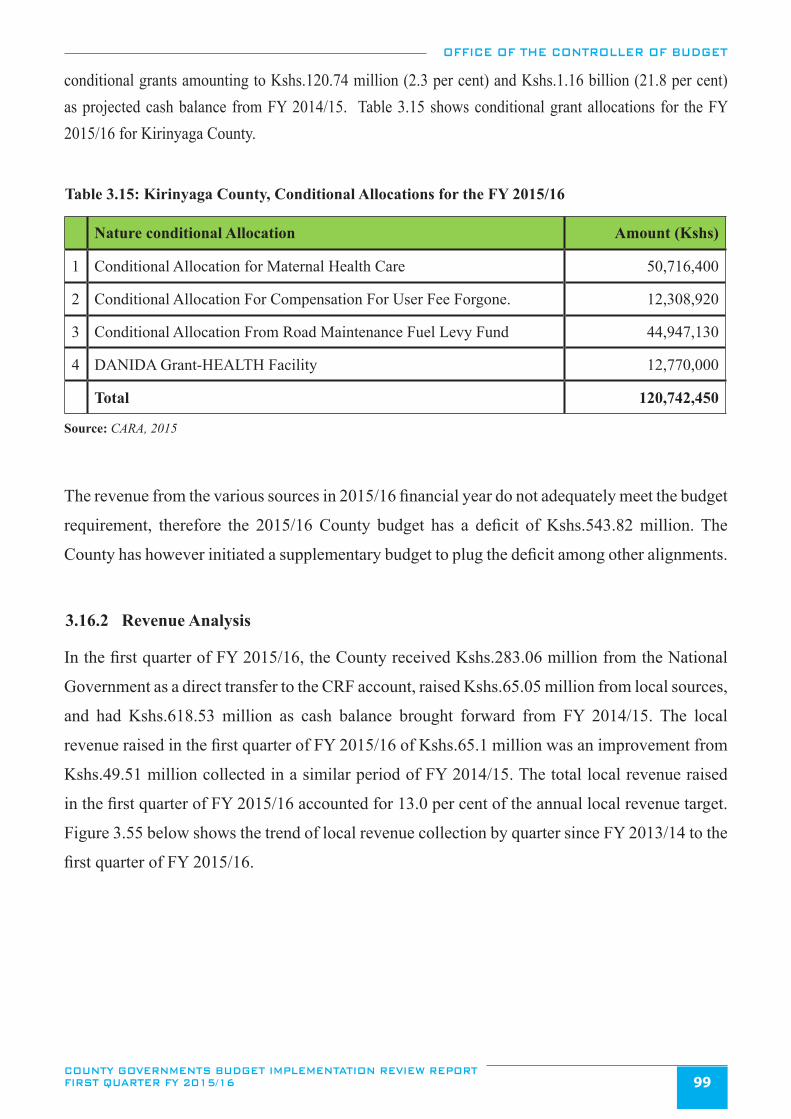
OFFICE OF THE CONTROLLER OF BUDGET
COUNTY GOVERNMENTS BUDGET IMPLEMENTATION REVIEW REPORT FIRST QUARTER FY 2015/16 99
conditional grants amounting to Kshs.120.74 million (2.3 per cent) and Kshs.1.16 billion (21.8 per cent) as projected cash balance from FY 2014/15. Table 3.15 shows conditional grant allocations for the FY 2015/16 for Kirinyaga County.
Table 3.15: Kirinyaga County, Conditional Allocations for the FY 2015/16
Nature conditional Allocation Amount (Kshs)
1 Conditional Allocation for Maternal Health Care 50,716,400
2 Conditional Allocation For Compensation For User Fee Forgone. 12,308,920
3 Conditional Allocation From Road Maintenance Fuel Levy Fund 44,947,130
4 DANIDA Grant-HEALTH Facility 12,770,000
Total 120,742,450
Source: CARA, 2015
The revenue from the various sources in 2015/16 financial year do not adequately meet the budget
requirement, therefore the 2015/16 County budget has a deficit of Kshs.543.82 million. The
County has however initiated a supplementary budget to plug the deficit among other alignments.
3.16.2 Revenue Analysis
In the first quarter of FY 2015/16, the County received Kshs.283.06 million from the National
Government as a direct transfer to the CRF account, raised Kshs.65.05 million from local sources,
and had Kshs.618.53 million as cash balance brought forward from FY 2014/15. The local
revenue raised in the first quarter of FY 2015/16 of Kshs.65.1 million was an improvement from
Kshs.49.51 million collected in a similar period of FY 2014/15. The total local revenue raised
in the first quarter of FY 2015/16 accounted for 13.0 per cent of the annual local revenue target.
Figure 3.55 below shows the trend of local revenue collection by quarter since FY 2013/14 to the
first quarter of FY 2015/16.
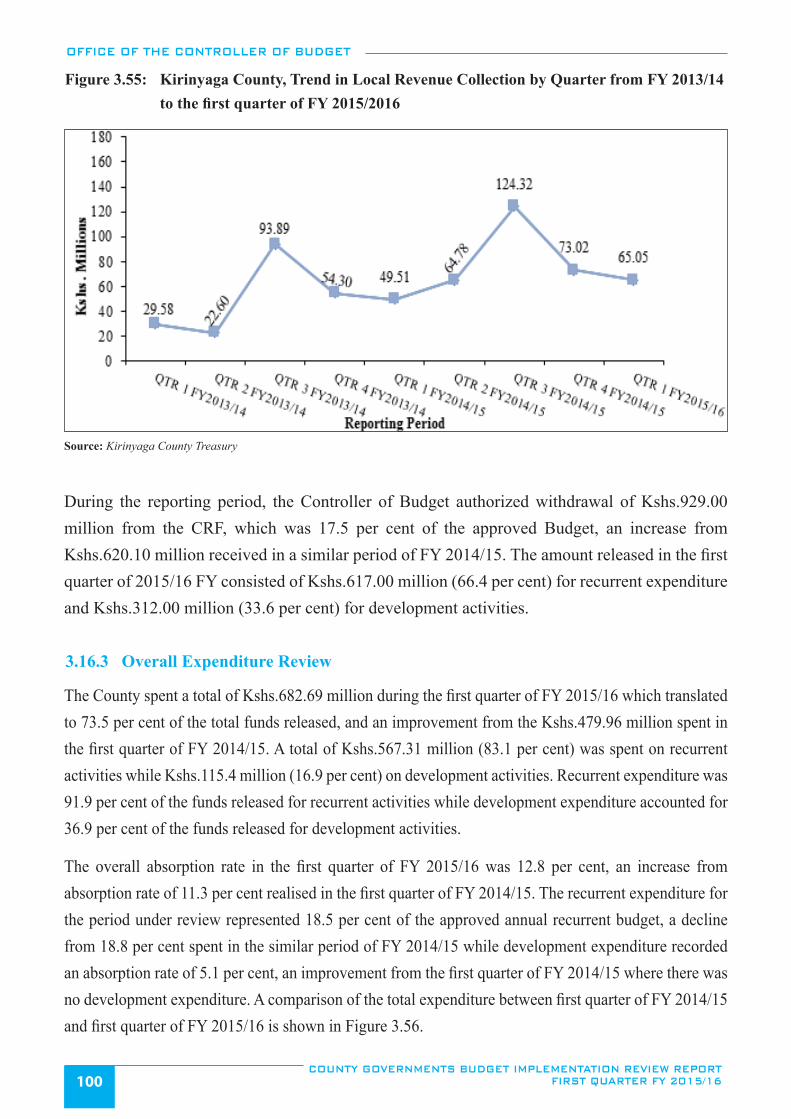
OFFICE OF THE CONTROLLER OF BUDGET
COUNTY GOVERNMENTS BUDGET IMPLEMENTATION REVIEW REPORT FIRST QUARTER FY 2015/16100
Figure 3.55: Kirinyaga County, Trend in Local Revenue Collection by Quarter from FY 2013/14 to the first quarter of FY 2015/2016
Source: Kirinyaga County Treasury
During the reporting period, the Controller of Budget authorized withdrawal of Kshs.929.00 million from the CRF, which was 17.5 per cent of the approved Budget, an increase from Kshs.620.10 million received in a similar period of FY 2014/15. The amount released in the first quarter of 2015/16 FY consisted of Kshs.617.00 million (66.4 per cent) for recurrent expenditure and Kshs.312.00 million (33.6 per cent) for development activities.
3.16.3 Overall Expenditure Review
The County spent a total of Kshs.682.69 million during the first quarter of FY 2015/16 which translated to 73.5 per cent of the total funds released, and an improvement from the Kshs.479.96 million spent in the first quarter of FY 2014/15. A total of Kshs.567.31 million (83.1 per cent) was spent on recurrent activities while Kshs.115.4 million (16.9 per cent) on development activities. Recurrent expenditure was 91.9 per cent of the funds released for recurrent activities while development expenditure accounted for 36.9 per cent of the funds released for development activities.
The overall absorption rate in the first quarter of FY 2015/16 was 12.8 per cent, an increase from absorption rate of 11.3 per cent realised in the first quarter of FY 2014/15. The recurrent expenditure for the period under review represented 18.5 per cent of the approved annual recurrent budget, a decline from 18.8 per cent spent in the similar period of FY 2014/15 while development expenditure recorded an absorption rate of 5.1 per cent, an improvement from the first quarter of FY 2014/15 where there was no development expenditure. A comparison of the total expenditure between first quarter of FY 2014/15 and first quarter of FY 2015/16 is shown in Figure 3.56.
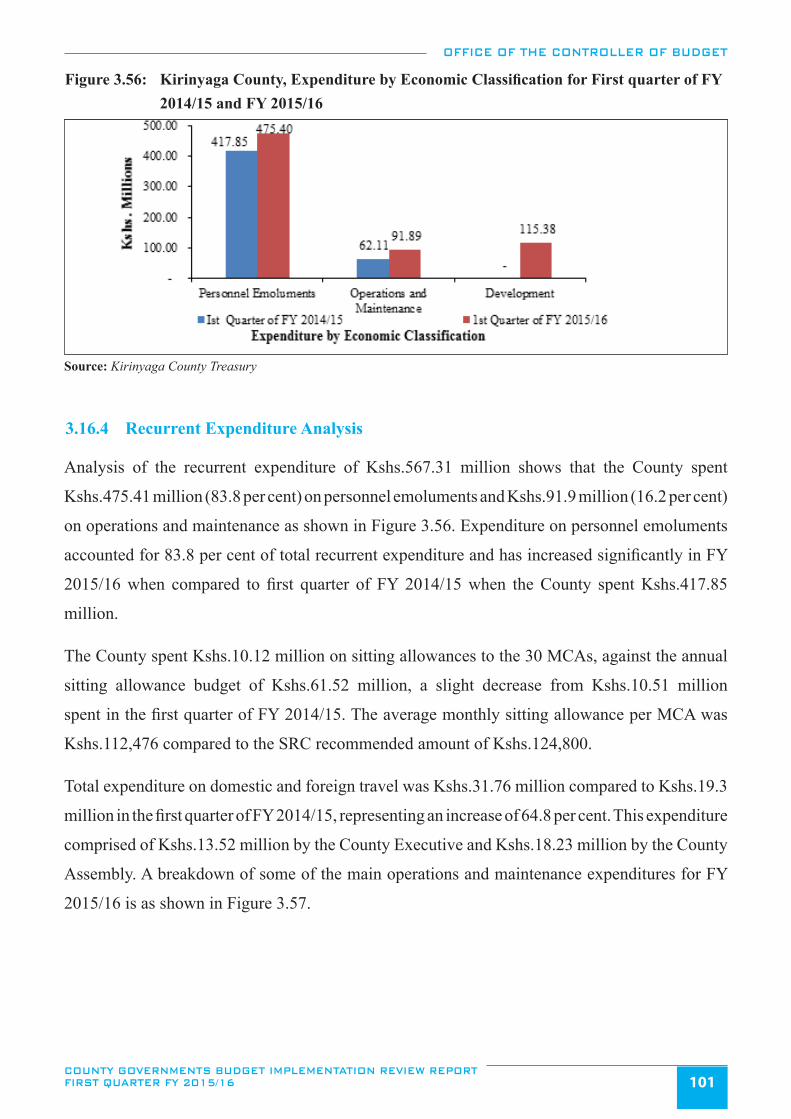
OFFICE OF THE CONTROLLER OF BUDGET
COUNTY GOVERNMENTS BUDGET IMPLEMENTATION REVIEW REPORT FIRST QUARTER FY 2015/16 101
Figure 3.56: Kirinyaga County, Expenditure by Economic Classification for First quarter of FY 2014/15 and FY 2015/16
Source: Kirinyaga County Treasury
3.16.4 Recurrent Expenditure Analysis
Analysis of the recurrent expenditure of Kshs.567.31 million shows that the County spent
Kshs.475.41 million (83.8 per cent) on personnel emoluments and Kshs.91.9 million (16.2 per cent)
on operations and maintenance as shown in Figure 3.56. Expenditure on personnel emoluments
accounted for 83.8 per cent of total recurrent expenditure and has increased significantly in FY
2015/16 when compared to first quarter of FY 2014/15 when the County spent Kshs.417.85
million.
The County spent Kshs.10.12 million on sitting allowances to the 30 MCAs, against the annual
sitting allowance budget of Kshs.61.52 million, a slight decrease from Kshs.10.51 million
spent in the first quarter of FY 2014/15. The average monthly sitting allowance per MCA was
Kshs.112,476 compared to the SRC recommended amount of Kshs.124,800.
Total expenditure on domestic and foreign travel was Kshs.31.76 million compared to Kshs.19.3
million in the first quarter of FY 2014/15, representing an increase of 64.8 per cent. This expenditure
comprised of Kshs.13.52 million by the County Executive and Kshs.18.23 million by the County
Assembly. A breakdown of some of the main operations and maintenance expenditures for FY
2015/16 is as shown in Figure 3.57.
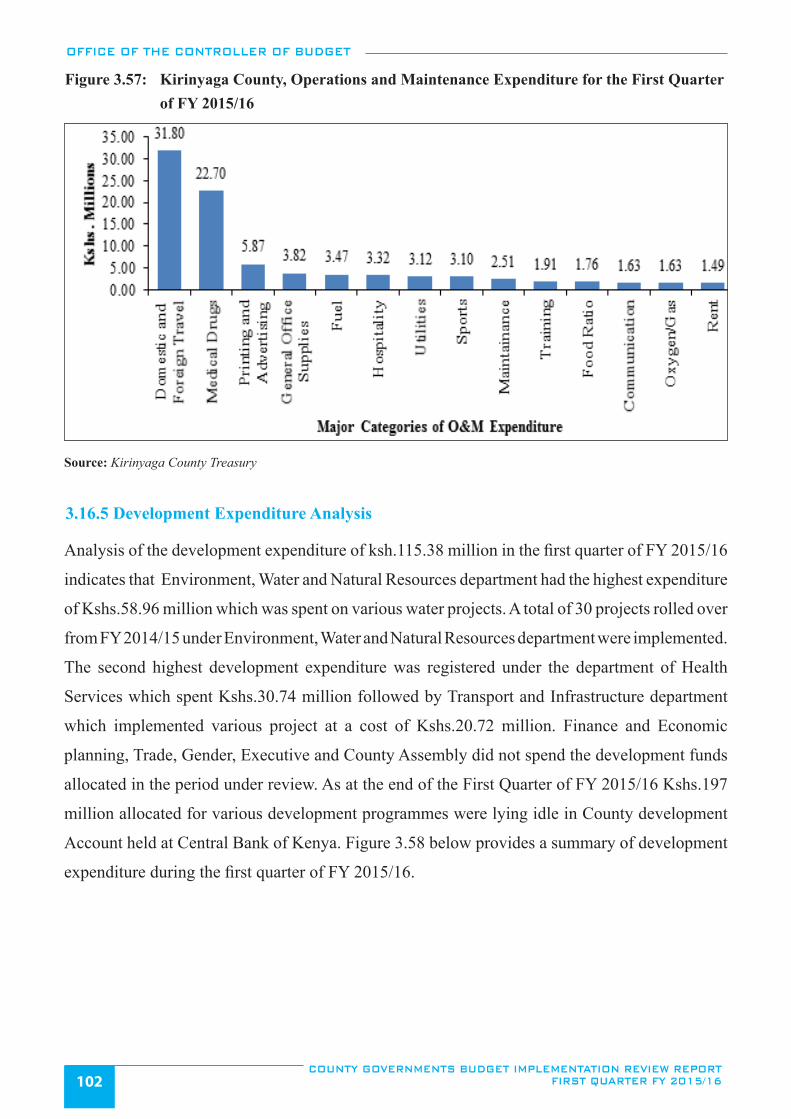
OFFICE OF THE CONTROLLER OF BUDGET
COUNTY GOVERNMENTS BUDGET IMPLEMENTATION REVIEW REPORT FIRST QUARTER FY 2015/16102
Figure 3.57: Kirinyaga County, Operations and Maintenance Expenditure for the First Quarter of FY 2015/16
Source: Kirinyaga County Treasury
3.16.5 Development Expenditure Analysis
Analysis of the development expenditure of ksh.115.38 million in the first quarter of FY 2015/16
indicates that Environment, Water and Natural Resources department had the highest expenditure
of Kshs.58.96 million which was spent on various water projects. A total of 30 projects rolled over
from FY 2014/15 under Environment, Water and Natural Resources department were implemented.
The second highest development expenditure was registered under the department of Health
Services which spent Kshs.30.74 million followed by Transport and Infrastructure department
which implemented various project at a cost of Kshs.20.72 million. Finance and Economic
planning, Trade, Gender, Executive and County Assembly did not spend the development funds
allocated in the period under review. As at the end of the First Quarter of FY 2015/16 Kshs.197
million allocated for various development programmes were lying idle in County development
Account held at Central Bank of Kenya. Figure 3.58 below provides a summary of development
expenditure during the first quarter of FY 2015/16.
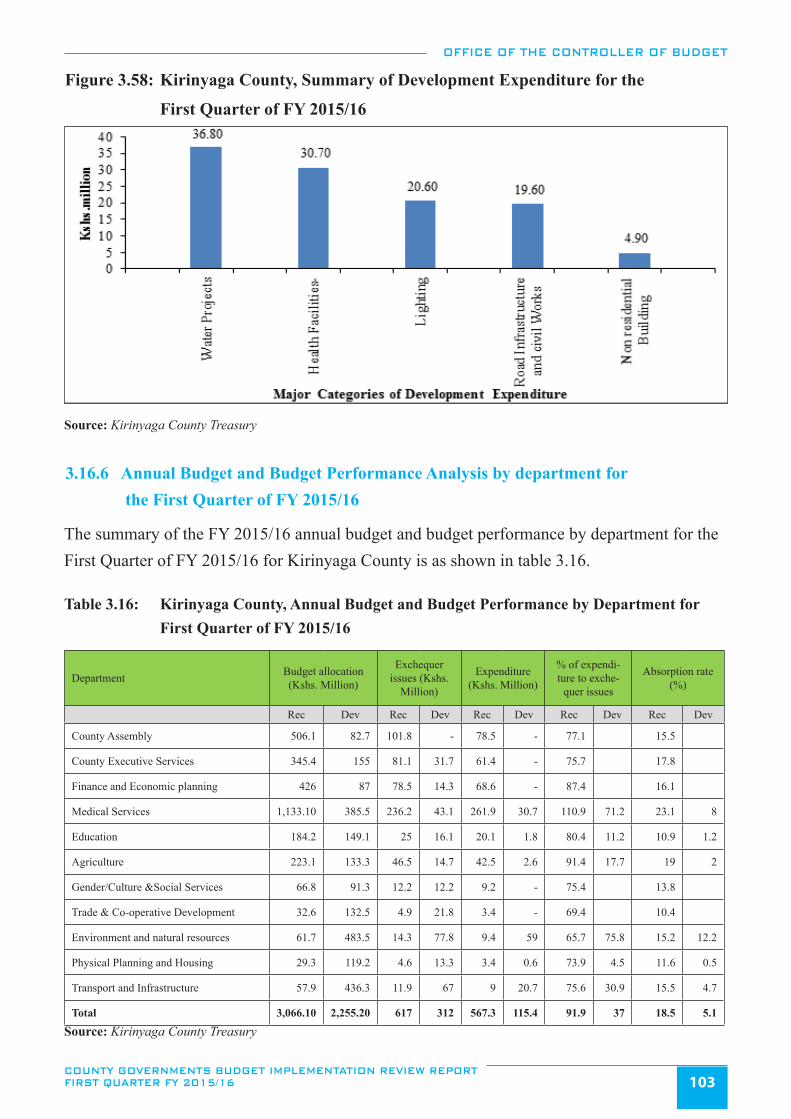
OFFICE OF THE CONTROLLER OF BUDGET
COUNTY GOVERNMENTS BUDGET IMPLEMENTATION REVIEW REPORT FIRST QUARTER FY 2015/16 103
Figure 3.58: Kirinyaga County, Summary of Development Expenditure for the
First Quarter of FY 2015/16
Source: Kirinyaga County Treasury
3.16.6 Annual Budget and Budget Performance Analysis by department for the First Quarter of FY 2015/16
The summary of the FY 2015/16 annual budget and budget performance by department for the First Quarter of FY 2015/16 for Kirinyaga County is as shown in table 3.16. Table 3.16: Kirinyaga County, Annual Budget and Budget Performance by Department for First Quarter of FY 2015/16
Department Budget allocation (Kshs. Million)
Exchequer issues (Kshs.
Million)
Expenditure (Kshs. Million)
% of expendi-ture to exche-
quer issues
Absorption rate (%)
Rec Dev Rec Dev Rec Dev Rec Dev Rec Dev
County Assembly 506.1 82.7 101.8 - 78.5 - 77.1 15.5
County Executive Services 345.4 155 81.1 31.7 61.4 - 75.7 17.8
Finance and Economic planning 426 87 78.5 14.3 68.6 - 87.4 16.1
Medical Services 1,133.10 385.5 236.2 43.1 261.9 30.7 110.9 71.2 23.1 8
Education 184.2 149.1 25 16.1 20.1 1.8 80.4 11.2 10.9 1.2
Agriculture 223.1 133.3 46.5 14.7 42.5 2.6 91.4 17.7 19 2
Gender/Culture &Social Services 66.8 91.3 12.2 12.2 9.2 - 75.4 13.8
Trade & Co-operative Development 32.6 132.5 4.9 21.8 3.4 - 69.4 10.4
Environment and natural resources 61.7 483.5 14.3 77.8 9.4 59 65.7 75.8 15.2 12.2
Physical Planning and Housing 29.3 119.2 4.6 13.3 3.4 0.6 73.9 4.5 11.6 0.5
Transport and Infrastructure 57.9 436.3 11.9 67 9 20.7 75.6 30.9 15.5 4.7
Total 3,066.10 2,255.20 617 312 567.3 115.4 91.9 37 18.5 5.1
Source: Kirinyaga County Treasury
OFFICE OF THE CONTROLLER OF BUDGET
COUNTY GOVERNMENTS BUDGET IMPLEMENTATION REVIEW REPORT FIRST QUARTER FY 2015/16104
The breakdown of expenditure by department shows that County Medical Services department attained the highest absorption rate of the recurrent budget at 23.1 per cent. On the other hand Trade and Cooperative Development department had the lowest absorption rate of the recurrent budget at 10.4 per cent.
3.16.7 Observations and Recommendations
In the first quarter of FY 2015/16, the County disaggregated processing of the County Assembly and County Executive payrolls. Other achievements include; improvement in local revenue collection, and an improvement in development expenditure.
However, the county is yet to implement the following recommendations;
i. Development of regulations for the administration of the County Emergency Fund. ii. Effective administration of local revenue collection systems. iii. Strengthening of internal audit mechanisms.
In the reporting period, the office noted the following additional challenges that hampered effected budget implementation:
i. Delay in the disbursement of funds by the National Treasury. As at the end of the first quar-ter the National Treasury had disbursed Kshs.283 million against the expected amount of Kshs.890 million based on the gazetted disbursement schedule.
ii. High wage bill which threatens to deprive development funding. In the period under review, personnel expenditure was 84 per cent of the total recurrent expenditure, which may be unsustainable.
iii. Use of manual vote book by County Treasury which resulted in inaccurate expenditure re-ports that are inconsistent with IFMIS returns.
iv. The County Assembly is yet to adopt IFMIS in processing financial transactions.
The County should implement the following recommendations in order to improve budget execution:
i. The County Treasury should liaise with the National Treasury to ensure that funds are dis-bursed on time and as per the approved disbursement schedule.
ii. Addressing the huge wage bill will require the concerted approach of both County and Na-tional Government. In the short term the County should freeze staff recruitment, undertake staff audit and staff rationalization in order to control the escalating wage bill.
iii. The County Treasury should automate the vote book to improve on budgetary control. iv. The County Assembly should adopt IFMIS in processing of all their financial transaction.
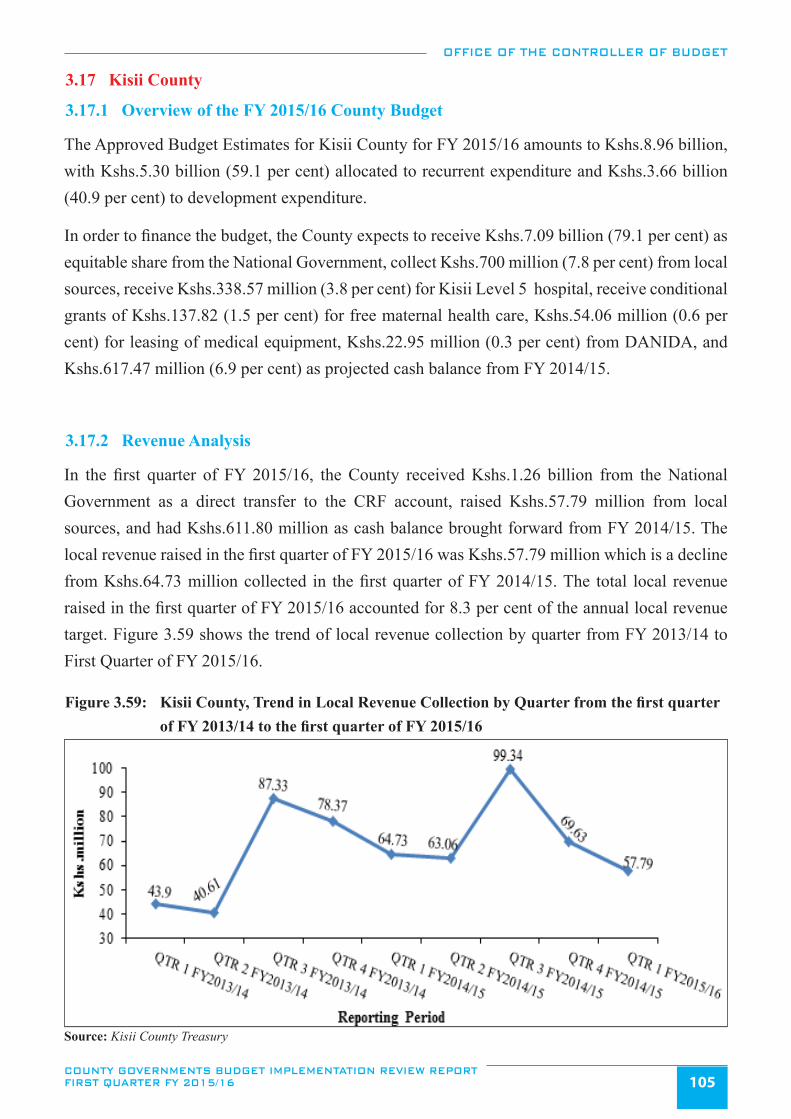
OFFICE OF THE CONTROLLER OF BUDGET
COUNTY GOVERNMENTS BUDGET IMPLEMENTATION REVIEW REPORT FIRST QUARTER FY 2015/16 105
3.17 Kisii County
3.17.1 Overview of the FY 2015/16 County Budget
The Approved Budget Estimates for Kisii County for FY 2015/16 amounts to Kshs.8.96 billion, with Kshs.5.30 billion (59.1 per cent) allocated to recurrent expenditure and Kshs.3.66 billion (40.9 per cent) to development expenditure.
In order to finance the budget, the County expects to receive Kshs.7.09 billion (79.1 per cent) as equitable share from the National Government, collect Kshs.700 million (7.8 per cent) from local sources, receive Kshs.338.57 million (3.8 per cent) for Kisii Level 5 hospital, receive conditional grants of Kshs.137.82 (1.5 per cent) for free maternal health care, Kshs.54.06 million (0.6 per cent) for leasing of medical equipment, Kshs.22.95 million (0.3 per cent) from DANIDA, and Kshs.617.47 million (6.9 per cent) as projected cash balance from FY 2014/15.
3.17.2 Revenue Analysis
In the first quarter of FY 2015/16, the County received Kshs.1.26 billion from the National Government as a direct transfer to the CRF account, raised Kshs.57.79 million from local sources, and had Kshs.611.80 million as cash balance brought forward from FY 2014/15. The local revenue raised in the first quarter of FY 2015/16 was Kshs.57.79 million which is a decline from Kshs.64.73 million collected in the first quarter of FY 2014/15. The total local revenue raised in the first quarter of FY 2015/16 accounted for 8.3 per cent of the annual local revenue target. Figure 3.59 shows the trend of local revenue collection by quarter from FY 2013/14 to First Quarter of FY 2015/16.
Figure 3.59: Kisii County, Trend in Local Revenue Collection by Quarter from the first quarter of FY 2013/14 to the first quarter of FY 2015/16
Source: Kisii County Treasury
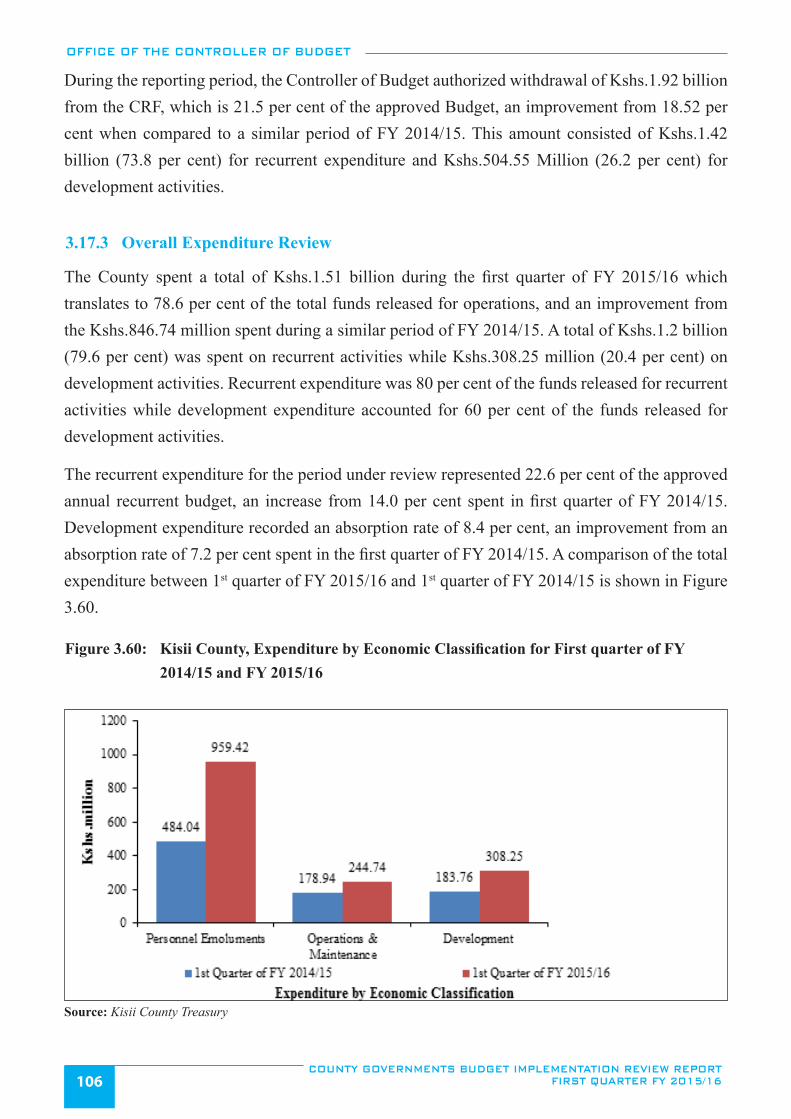
OFFICE OF THE CONTROLLER OF BUDGET
COUNTY GOVERNMENTS BUDGET IMPLEMENTATION REVIEW REPORT FIRST QUARTER FY 2015/16106
During the reporting period, the Controller of Budget authorized withdrawal of Kshs.1.92 billion from the CRF, which is 21.5 per cent of the approved Budget, an improvement from 18.52 per cent when compared to a similar period of FY 2014/15. This amount consisted of Kshs.1.42 billion (73.8 per cent) for recurrent expenditure and Kshs.504.55 Million (26.2 per cent) for development activities.
3.17.3 Overall Expenditure Review
The County spent a total of Kshs.1.51 billion during the first quarter of FY 2015/16 which translates to 78.6 per cent of the total funds released for operations, and an improvement from the Kshs.846.74 million spent during a similar period of FY 2014/15. A total of Kshs.1.2 billion (79.6 per cent) was spent on recurrent activities while Kshs.308.25 million (20.4 per cent) on development activities. Recurrent expenditure was 80 per cent of the funds released for recurrent activities while development expenditure accounted for 60 per cent of the funds released for development activities.
The recurrent expenditure for the period under review represented 22.6 per cent of the approved annual recurrent budget, an increase from 14.0 per cent spent in first quarter of FY 2014/15. Development expenditure recorded an absorption rate of 8.4 per cent, an improvement from an absorption rate of 7.2 per cent spent in the first quarter of FY 2014/15. A comparison of the total expenditure between 1st quarter of FY 2015/16 and 1st quarter of FY 2014/15 is shown in Figure 3.60.
Figure 3.60: Kisii County, Expenditure by Economic Classification for First quarter of FY 2014/15 and FY 2015/16
Source: Kisii County Treasury
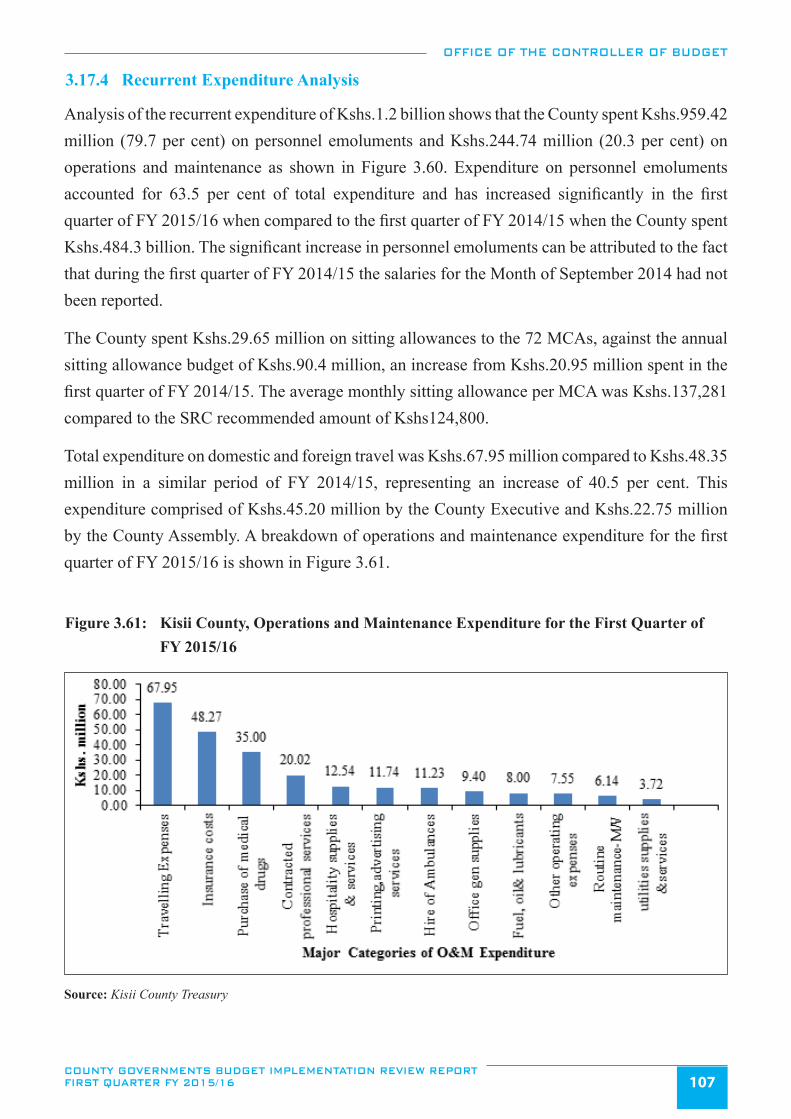
OFFICE OF THE CONTROLLER OF BUDGET
COUNTY GOVERNMENTS BUDGET IMPLEMENTATION REVIEW REPORT FIRST QUARTER FY 2015/16 107
3.17.4 Recurrent Expenditure Analysis
Analysis of the recurrent expenditure of Kshs.1.2 billion shows that the County spent Kshs.959.42 million (79.7 per cent) on personnel emoluments and Kshs.244.74 million (20.3 per cent) on operations and maintenance as shown in Figure 3.60. Expenditure on personnel emoluments accounted for 63.5 per cent of total expenditure and has increased significantly in the first quarter of FY 2015/16 when compared to the first quarter of FY 2014/15 when the County spent Kshs.484.3 billion. The significant increase in personnel emoluments can be attributed to the fact that during the first quarter of FY 2014/15 the salaries for the Month of September 2014 had not been reported.
The County spent Kshs.29.65 million on sitting allowances to the 72 MCAs, against the annual sitting allowance budget of Kshs.90.4 million, an increase from Kshs.20.95 million spent in the first quarter of FY 2014/15. The average monthly sitting allowance per MCA was Kshs.137,281 compared to the SRC recommended amount of Kshs124,800.
Total expenditure on domestic and foreign travel was Kshs.67.95 million compared to Kshs.48.35 million in a similar period of FY 2014/15, representing an increase of 40.5 per cent. This expenditure comprised of Kshs.45.20 million by the County Executive and Kshs.22.75 million by the County Assembly. A breakdown of operations and maintenance expenditure for the first quarter of FY 2015/16 is shown in Figure 3.61.
Figure 3.61: Kisii County, Operations and Maintenance Expenditure for the First Quarter of FY 2015/16
Source: Kisii County Treasury
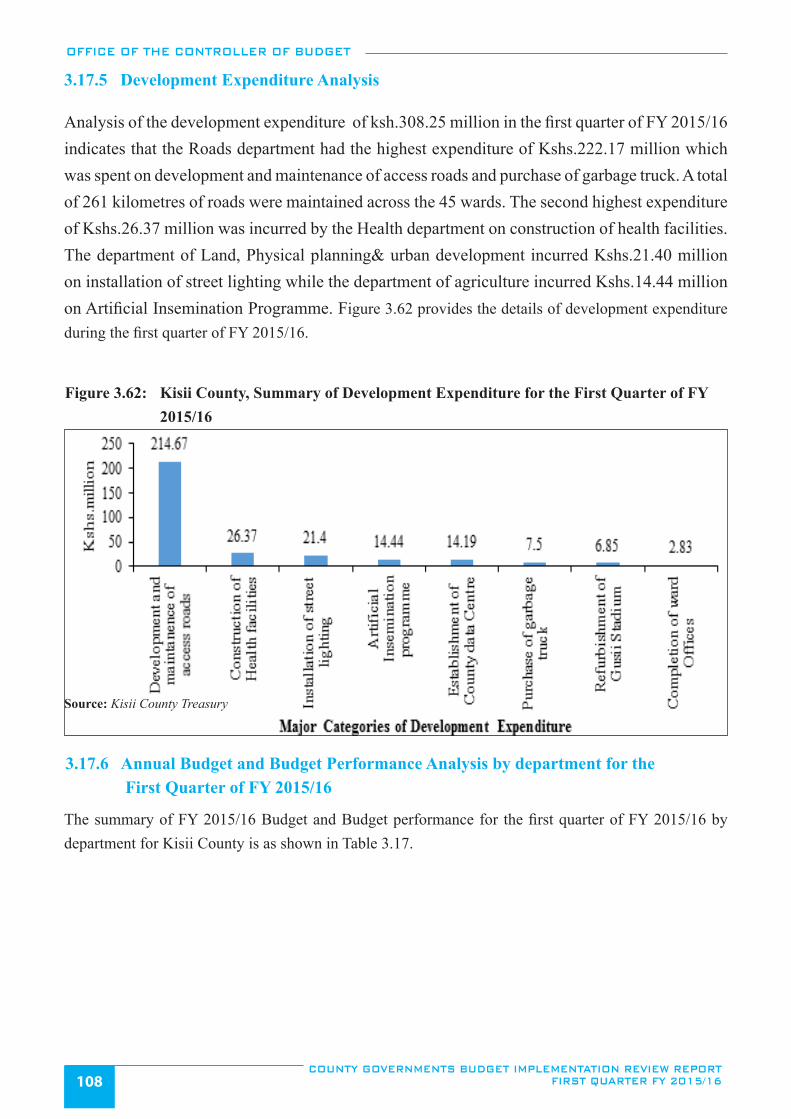
OFFICE OF THE CONTROLLER OF BUDGET
COUNTY GOVERNMENTS BUDGET IMPLEMENTATION REVIEW REPORT FIRST QUARTER FY 2015/16108
3.17.5 Development Expenditure Analysis
Analysis of the development expenditure of ksh.308.25 million in the first quarter of FY 2015/16 indicates that the Roads department had the highest expenditure of Kshs.222.17 million which was spent on development and maintenance of access roads and purchase of garbage truck. A total of 261 kilometres of roads were maintained across the 45 wards. The second highest expenditure of Kshs.26.37 million was incurred by the Health department on construction of health facilities. The department of Land, Physical planning& urban development incurred Kshs.21.40 million on installation of street lighting while the department of agriculture incurred Kshs.14.44 million on Artificial Insemination Programme. Figure 3.62 provides the details of development expenditure during the first quarter of FY 2015/16.
Figure 3.62: Kisii County, Summary of Development Expenditure for the First Quarter of FY 2015/16
Source: Kisii County Treasury
3.17.6 Annual Budget and Budget Performance Analysis by department for the First Quarter of FY 2015/16
The summary of FY 2015/16 Budget and Budget performance for the first quarter of FY 2015/16 by department for Kisii County is as shown in Table 3.17.
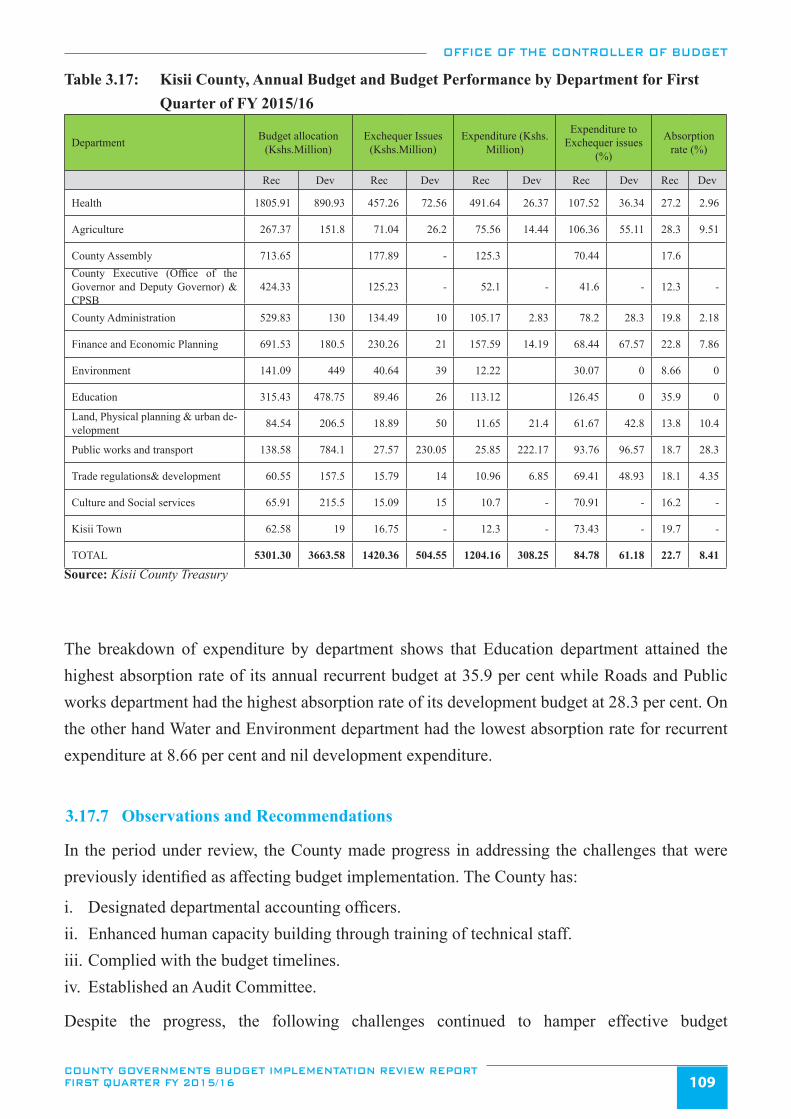
OFFICE OF THE CONTROLLER OF BUDGET
COUNTY GOVERNMENTS BUDGET IMPLEMENTATION REVIEW REPORT FIRST QUARTER FY 2015/16 109
Table 3.17: Kisii County, Annual Budget and Budget Performance by Department for First Quarter of FY 2015/16
Department Budget allocation (Kshs.Million)
Exchequer Issues (Kshs.Million)
Expenditure (Kshs.Million)
Expenditure to Exchequer issues
(%)
Absorption rate (%)
Rec Dev Rec Dev Rec Dev Rec Dev Rec Dev
Health 1805.91 890.93 457.26 72.56 491.64 26.37 107.52 36.34 27.2 2.96
Agriculture 267.37 151.8 71.04 26.2 75.56 14.44 106.36 55.11 28.3 9.51
County Assembly 713.65 177.89 - 125.3 70.44 17.6 County Executive (Office of the Governor and Deputy Governor) & CPSB
424.33 125.23 - 52.1 - 41.6 - 12.3 -
County Administration 529.83 130 134.49 10 105.17 2.83 78.2 28.3 19.8 2.18
Finance and Economic Planning 691.53 180.5 230.26 21 157.59 14.19 68.44 67.57 22.8 7.86
Environment 141.09 449 40.64 39 12.22 30.07 0 8.66 0
Education 315.43 478.75 89.46 26 113.12 126.45 0 35.9 0
Land, Physical planning & urban de-velopment 84.54 206.5 18.89 50 11.65 21.4 61.67 42.8 13.8 10.4
Public works and transport 138.58 784.1 27.57 230.05 25.85 222.17 93.76 96.57 18.7 28.3
Trade regulations& development 60.55 157.5 15.79 14 10.96 6.85 69.41 48.93 18.1 4.35
Culture and Social services 65.91 215.5 15.09 15 10.7 - 70.91 - 16.2 -
Kisii Town 62.58 19 16.75 - 12.3 - 73.43 - 19.7 -
TOTAL 5301.30 3663.58 1420.36 504.55 1204.16 308.25 84.78 61.18 22.7 8.41
Source: Kisii County Treasury
The breakdown of expenditure by department shows that Education department attained the highest absorption rate of its annual recurrent budget at 35.9 per cent while Roads and Public works department had the highest absorption rate of its development budget at 28.3 per cent. On the other hand Water and Environment department had the lowest absorption rate for recurrent expenditure at 8.66 per cent and nil development expenditure.
3.17.7 Observations and Recommendations
In the period under review, the County made progress in addressing the challenges that were previously identified as affecting budget implementation. The County has:
i. Designated departmental accounting officers.ii. Enhanced human capacity building through training of technical staff.iii. Complied with the budget timelines.iv. Established an Audit Committee.
Despite the progress, the following challenges continued to hamper effective budget
OFFICE OF THE CONTROLLER OF BUDGET
COUNTY GOVERNMENTS BUDGET IMPLEMENTATION REVIEW REPORT FIRST QUARTER FY 2015/16110
implementation in the first quarter of FY 2015/16:
i. Low local revenue collection which stood at 8.3 per cent of the projected revenue for FY 2015/16.
ii. Some devolved units, particularly health department do not report the revenue they collect and do not account for the same in contravention of Section109 (2) of the PFM Act, 2012.
iii. Failure to develop regulations for administration of the County Emergency Fund.iv. There are no designated Fund administrators for established funds such as the County Assem-
bly Mortgages and Car loan Fund.
The County should implement the following recommendations in order to improve budget execution:
i. The County should develop strategies to enhance local revenue collection and if necessary, revise the local revenue estimates to achievable levels.
ii. All revenue collected should be reported and properly accounted for in accordance with Sec-tion 109(2) of the PFM Act, 2012.
iii. The County Treasury should develop regulations to operationalize the established County Funds.
iv. All County public funds should have designated fund administrators so as to comply with the reporting requirements envisaged in Section 168 of the PFM Act, 2012.
3.18 Kisumu County
3.18.1 Overview of the FY 2015/16 Budget
Kisumu County had approved budget of Kshs.9.64 billion for FY 2015/16, comprising of Kshs.5.71 billion (59.2 per cent) allocated for recurrent expenditure and Kshs.3.93 billion (40.7 per cent) for development activities.
In order to finance the budget, the County expects to receive Kshs.5.68 billion (58.9 per cent) as transfers from the National Government, collect Kshs.1.87 billion (19.4 per cent), receive conditional grant of Kshs.16.58 million (0.2 per cent) from DANIDA and a conditional allocation of Kshs.123.78 million (1.3 per cent) from the National Government for Free Maternal Health Care, Compensation for User Fees Forgone amounting to Kshs.22.59 million (0.2 per cent), conditional allocation for Leasing of Medical Equipment amounting to Kshs.95.77 million (1.0 per cent)and conditional allocation for Road Maintenance Fuel Levy amounting to Kshs.72.17 million (0.7 per cent) and Kshs.1.37 billion (14.2 per cent) as projected cash balance from FY 2014/15.
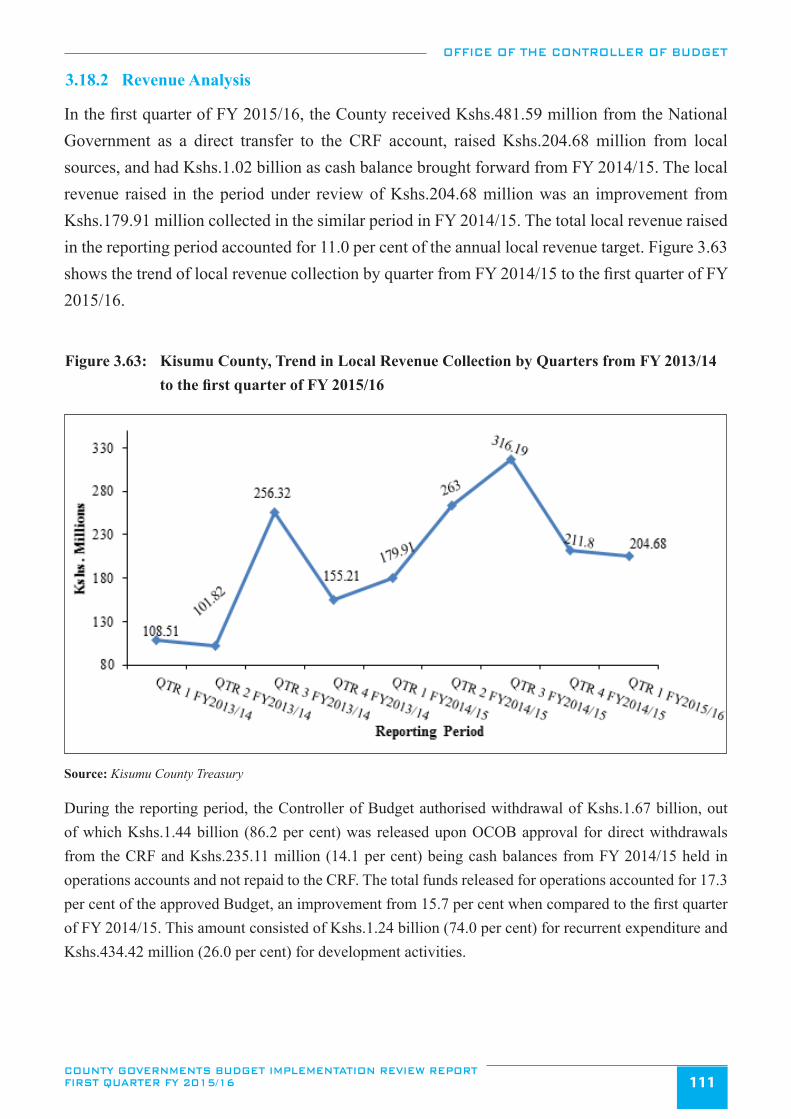
OFFICE OF THE CONTROLLER OF BUDGET
COUNTY GOVERNMENTS BUDGET IMPLEMENTATION REVIEW REPORT FIRST QUARTER FY 2015/16 111
3.18.2 Revenue Analysis
In the first quarter of FY 2015/16, the County received Kshs.481.59 million from the National Government as a direct transfer to the CRF account, raised Kshs.204.68 million from local sources, and had Kshs.1.02 billion as cash balance brought forward from FY 2014/15. The local revenue raised in the period under review of Kshs.204.68 million was an improvement from Kshs.179.91 million collected in the similar period in FY 2014/15. The total local revenue raised in the reporting period accounted for 11.0 per cent of the annual local revenue target. Figure 3.63 shows the trend of local revenue collection by quarter from FY 2014/15 to the first quarter of FY 2015/16.
Figure 3.63: Kisumu County, Trend in Local Revenue Collection by Quarters from FY 2013/14 to the first quarter of FY 2015/16
Source: Kisumu County Treasury
During the reporting period, the Controller of Budget authorised withdrawal of Kshs.1.67 billion, out of which Kshs.1.44 billion (86.2 per cent) was released upon OCOB approval for direct withdrawals from the CRF and Kshs.235.11 million (14.1 per cent) being cash balances from FY 2014/15 held in operations accounts and not repaid to the CRF. The total funds released for operations accounted for 17.3 per cent of the approved Budget, an improvement from 15.7 per cent when compared to the first quarter of FY 2014/15. This amount consisted of Kshs.1.24 billion (74.0 per cent) for recurrent expenditure and Kshs.434.42 million (26.0 per cent) for development activities.
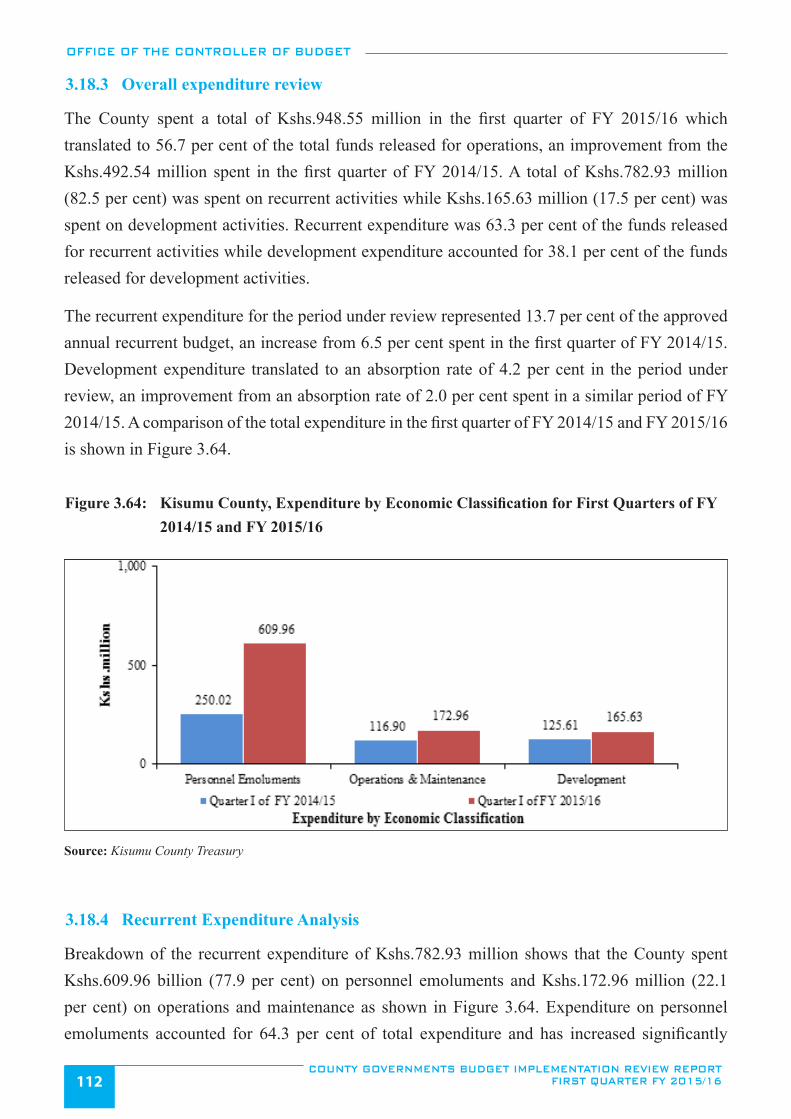
OFFICE OF THE CONTROLLER OF BUDGET
COUNTY GOVERNMENTS BUDGET IMPLEMENTATION REVIEW REPORT FIRST QUARTER FY 2015/16112
3.18.3 Overall expenditure review
The County spent a total of Kshs.948.55 million in the first quarter of FY 2015/16 which translated to 56.7 per cent of the total funds released for operations, an improvement from the Kshs.492.54 million spent in the first quarter of FY 2014/15. A total of Kshs.782.93 million (82.5 per cent) was spent on recurrent activities while Kshs.165.63 million (17.5 per cent) was spent on development activities. Recurrent expenditure was 63.3 per cent of the funds released for recurrent activities while development expenditure accounted for 38.1 per cent of the funds released for development activities.
The recurrent expenditure for the period under review represented 13.7 per cent of the approved annual recurrent budget, an increase from 6.5 per cent spent in the first quarter of FY 2014/15. Development expenditure translated to an absorption rate of 4.2 per cent in the period under review, an improvement from an absorption rate of 2.0 per cent spent in a similar period of FY 2014/15. A comparison of the total expenditure in the first quarter of FY 2014/15 and FY 2015/16 is shown in Figure 3.64.
Figure 3.64: Kisumu County, Expenditure by Economic Classification for First Quarters of FY 2014/15 and FY 2015/16
Source: Kisumu County Treasury
3.18.4 Recurrent Expenditure Analysis
Breakdown of the recurrent expenditure of Kshs.782.93 million shows that the County spent Kshs.609.96 billion (77.9 per cent) on personnel emoluments and Kshs.172.96 million (22.1 per cent) on operations and maintenance as shown in Figure 3.64. Expenditure on personnel emoluments accounted for 64.3 per cent of total expenditure and has increased significantly
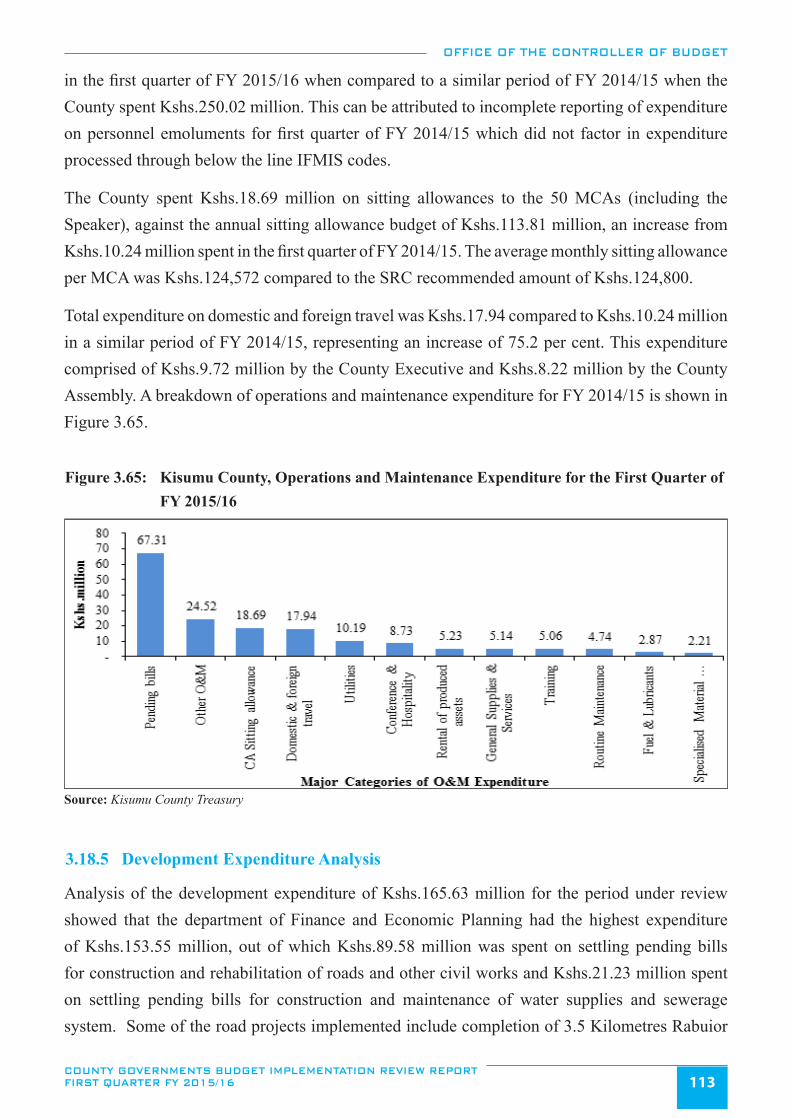
OFFICE OF THE CONTROLLER OF BUDGET
COUNTY GOVERNMENTS BUDGET IMPLEMENTATION REVIEW REPORT FIRST QUARTER FY 2015/16 113
in the first quarter of FY 2015/16 when compared to a similar period of FY 2014/15 when the County spent Kshs.250.02 million. This can be attributed to incomplete reporting of expenditure on personnel emoluments for first quarter of FY 2014/15 which did not factor in expenditure processed through below the line IFMIS codes.
The County spent Kshs.18.69 million on sitting allowances to the 50 MCAs (including the Speaker), against the annual sitting allowance budget of Kshs.113.81 million, an increase from Kshs.10.24 million spent in the first quarter of FY 2014/15. The average monthly sitting allowance per MCA was Kshs.124,572 compared to the SRC recommended amount of Kshs.124,800.
Total expenditure on domestic and foreign travel was Kshs.17.94 compared to Kshs.10.24 million in a similar period of FY 2014/15, representing an increase of 75.2 per cent. This expenditure comprised of Kshs.9.72 million by the County Executive and Kshs.8.22 million by the County Assembly. A breakdown of operations and maintenance expenditure for FY 2014/15 is shown in Figure 3.65.
Figure 3.65: Kisumu County, Operations and Maintenance Expenditure for the First Quarter of FY 2015/16
Source: Kisumu County Treasury
3.18.5 Development Expenditure Analysis
Analysis of the development expenditure of Kshs.165.63 million for the period under review showed that the department of Finance and Economic Planning had the highest expenditure of Kshs.153.55 million, out of which Kshs.89.58 million was spent on settling pending bills for construction and rehabilitation of roads and other civil works and Kshs.21.23 million spent on settling pending bills for construction and maintenance of water supplies and sewerage system. Some of the road projects implemented include completion of 3.5 Kilometres Rabuior
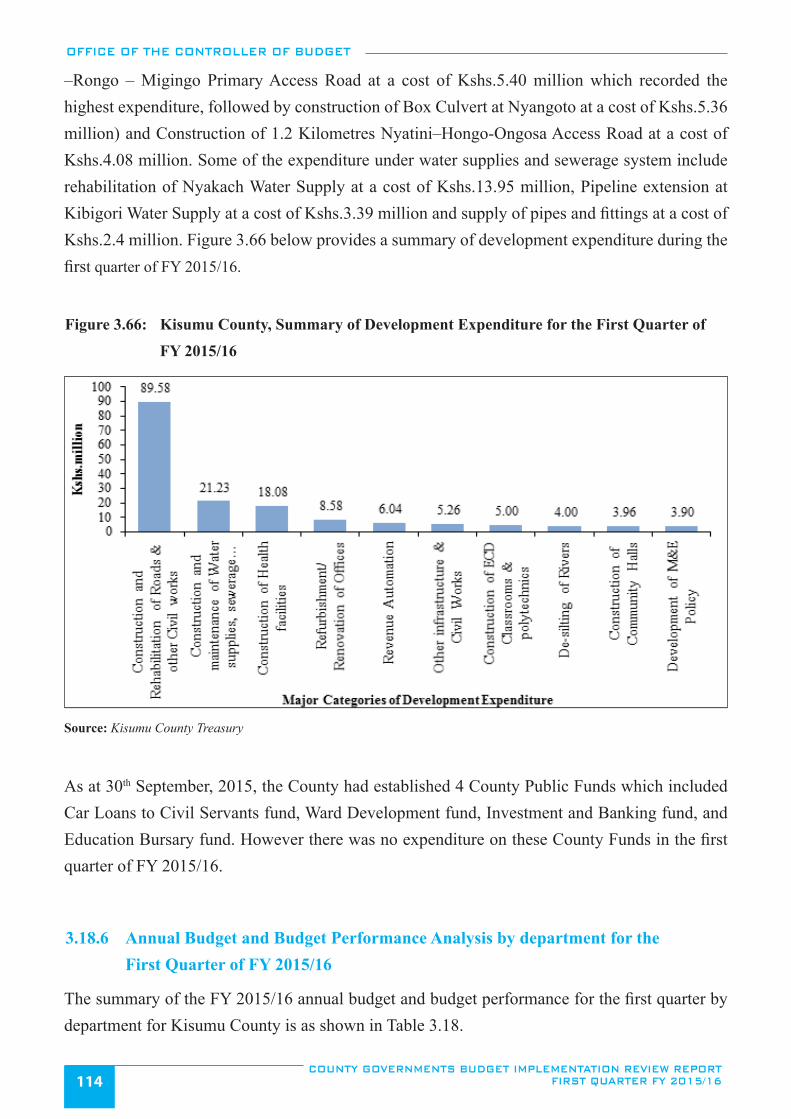
OFFICE OF THE CONTROLLER OF BUDGET
COUNTY GOVERNMENTS BUDGET IMPLEMENTATION REVIEW REPORT FIRST QUARTER FY 2015/16114
–Rongo – Migingo Primary Access Road at a cost of Kshs.5.40 million which recorded the highest expenditure, followed by construction of Box Culvert at Nyangoto at a cost of Kshs.5.36 million) and Construction of 1.2 Kilometres Nyatini–Hongo-Ongosa Access Road at a cost of Kshs.4.08 million. Some of the expenditure under water supplies and sewerage system include rehabilitation of Nyakach Water Supply at a cost of Kshs.13.95 million, Pipeline extension at Kibigori Water Supply at a cost of Kshs.3.39 million and supply of pipes and fittings at a cost of Kshs.2.4 million. Figure 3.66 below provides a summary of development expenditure during the first quarter of FY 2015/16.
Figure 3.66: Kisumu County, Summary of Development Expenditure for the First Quarter of
FY 2015/16
Source: Kisumu County Treasury
As at 30th September, 2015, the County had established 4 County Public Funds which included Car Loans to Civil Servants fund, Ward Development fund, Investment and Banking fund, and Education Bursary fund. However there was no expenditure on these County Funds in the first quarter of FY 2015/16.
3.18.6 Annual Budget and Budget Performance Analysis by department for the First Quarter of FY 2015/16
The summary of the FY 2015/16 annual budget and budget performance for the first quarter by department for Kisumu County is as shown in Table 3.18.
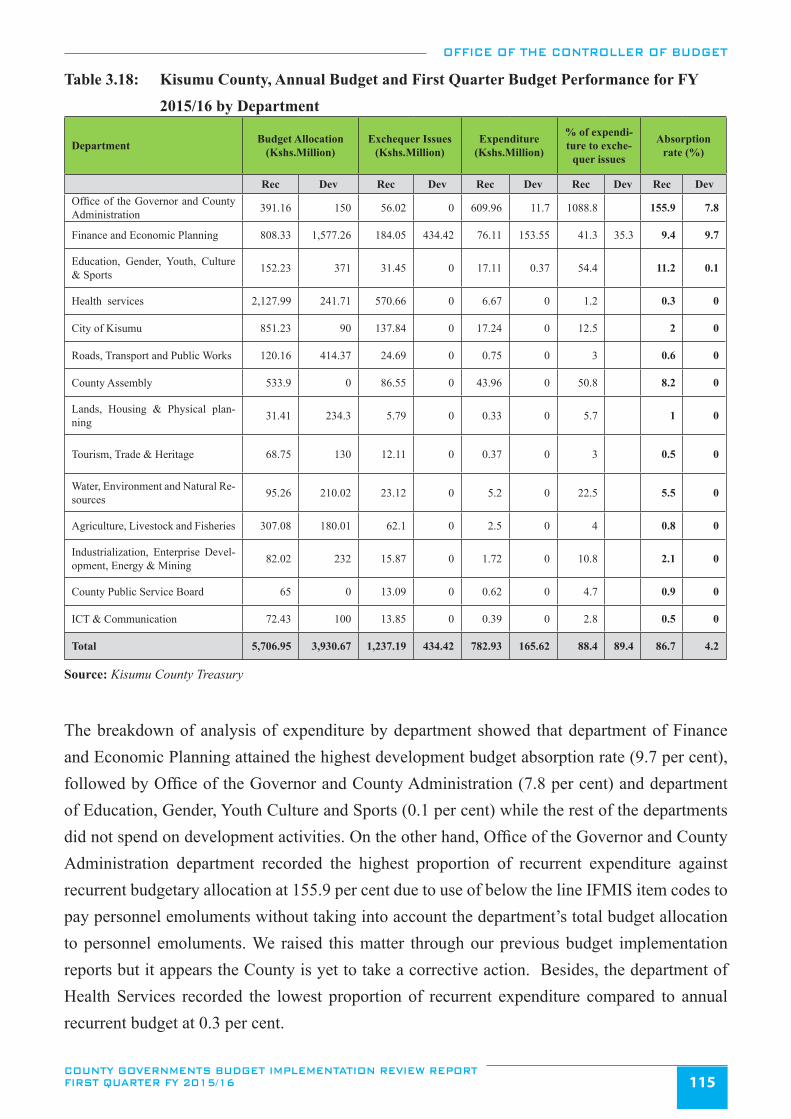
OFFICE OF THE CONTROLLER OF BUDGET
COUNTY GOVERNMENTS BUDGET IMPLEMENTATION REVIEW REPORT FIRST QUARTER FY 2015/16 115
Table 3.18: Kisumu County, Annual Budget and First Quarter Budget Performance for FY
2015/16 by Department
Department Budget Allocation (Kshs.Million)
Exchequer Issues (Kshs.Million)
Expenditure (Kshs.Million)
% of expendi-ture to exche-
quer issues
Absorption rate (%)
Rec Dev Rec Dev Rec Dev Rec Dev Rec DevOffice of the Governor and County Administration 391.16 150 56.02 0 609.96 11.7 1088.8 155.9 7.8
Finance and Economic Planning 808.33 1,577.26 184.05 434.42 76.11 153.55 41.3 35.3 9.4 9.7
Education, Gender, Youth, Culture & Sports 152.23 371 31.45 0 17.11 0.37 54.4 11.2 0.1
Health services 2,127.99 241.71 570.66 0 6.67 0 1.2 0.3 0
City of Kisumu 851.23 90 137.84 0 17.24 0 12.5 2 0
Roads, Transport and Public Works 120.16 414.37 24.69 0 0.75 0 3 0.6 0
County Assembly 533.9 0 86.55 0 43.96 0 50.8 8.2 0
Lands, Housing & Physical plan-ning 31.41 234.3 5.79 0 0.33 0 5.7 1 0
Tourism, Trade & Heritage 68.75 130 12.11 0 0.37 0 3 0.5 0
Water, Environment and Natural Re-sources 95.26 210.02 23.12 0 5.2 0 22.5 5.5 0
Agriculture, Livestock and Fisheries 307.08 180.01 62.1 0 2.5 0 4 0.8 0
Industrialization, Enterprise Devel-opment, Energy & Mining 82.02 232 15.87 0 1.72 0 10.8 2.1 0
County Public Service Board 65 0 13.09 0 0.62 0 4.7 0.9 0
ICT & Communication 72.43 100 13.85 0 0.39 0 2.8 0.5 0
Total 5,706.95 3,930.67 1,237.19 434.42 782.93 165.62 88.4 89.4 86.7 4.2
Source: Kisumu County Treasury
The breakdown of analysis of expenditure by department showed that department of Finance and Economic Planning attained the highest development budget absorption rate (9.7 per cent), followed by Office of the Governor and County Administration (7.8 per cent) and department of Education, Gender, Youth Culture and Sports (0.1 per cent) while the rest of the departments did not spend on development activities. On the other hand, Office of the Governor and County Administration department recorded the highest proportion of recurrent expenditure against recurrent budgetary allocation at 155.9 per cent due to use of below the line IFMIS item codes to pay personnel emoluments without taking into account the department’s total budget allocation to personnel emoluments. We raised this matter through our previous budget implementation reports but it appears the County is yet to take a corrective action. Besides, the department of Health Services recorded the lowest proportion of recurrent expenditure compared to annual recurrent budget at 0.3 per cent.
OFFICE OF THE CONTROLLER OF BUDGET
COUNTY GOVERNMENTS BUDGET IMPLEMENTATION REVIEW REPORT FIRST QUARTER FY 2015/16116
3.18.7 Observations and Recommendations
The County has made progress in addressing some of the challenges that have previously been identified as affecting budget implementation. The County has:
i. Enacted key revenue laws. ii. Improved local revenue collection. iii. Improved capacity of technical staff through training
iv. Improved the uptake of development funds.
However the following issues are still pending;
i. Over-reliance on temporary imprests as a method of procuring low valued goods and services leading to accumulation of huge outstanding imprest.
ii. Delayed remittance of the level 5 conditional grant to the intended health facility.
During the period under review, the office noted the following issues that need to be addressed.
i. Delay in disbursement of funds from Consolidated Fund to the County Revenue fund. ii. The County Treasury experienced the challenge of mapping expenditure on personnel costs
to departments for processing through IFMIS leading to expenditure in excess of budget allo-cation by some departments.
iii. Failure to adopt IFMIS in processing financial transactions at the City department.
The County should implement the following recommendations in order to improve budget execution:
i. The County should liaise with the National Treasury to ensure timely release of funds so that budget implementation is not adversely affected.
ii. The County Treasury should liaise with the IFMIS Directorate from time to time to address the challenges faced in the use of IFMIS.
iii. The County Treasury should fast track the roll out of IFMIS to the City department through liaison with IFMIS Directorate at the National Treasury.
3.19 Kitui County
3.19.1 Overview of the FY 2015/16 County Budget
The approved budget for Kitui County for FY 2015/16, amounts to Kshs.10.23 billion, with Kshs.4.79 billion (46.9 per cent) allocated to recurrent expenditure and Kshs.5.43 billion (53.1 per cent) to development expenditure.
In order to finance the budget, the County expected to receive Kshs.7.27 billion (71.1 per cent)
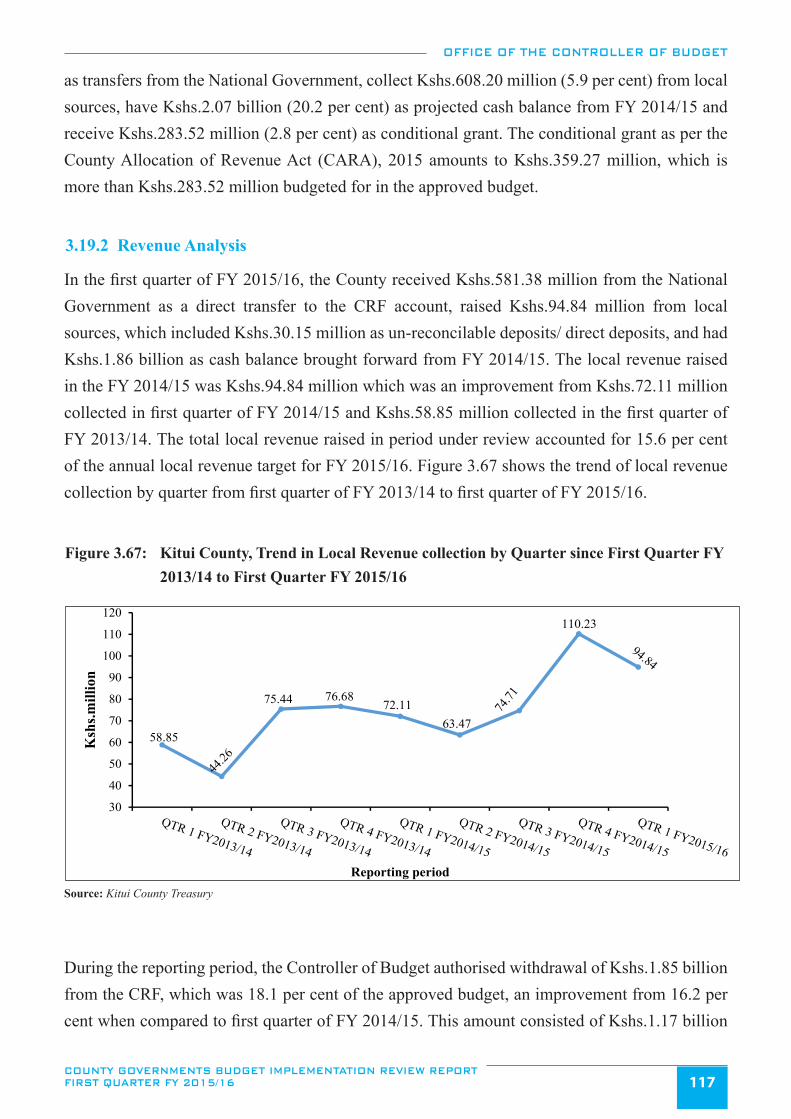
OFFICE OF THE CONTROLLER OF BUDGET
COUNTY GOVERNMENTS BUDGET IMPLEMENTATION REVIEW REPORT FIRST QUARTER FY 2015/16 117
as transfers from the National Government, collect Kshs.608.20 million (5.9 per cent) from local sources, have Kshs.2.07 billion (20.2 per cent) as projected cash balance from FY 2014/15 and receive Kshs.283.52 million (2.8 per cent) as conditional grant. The conditional grant as per the County Allocation of Revenue Act (CARA), 2015 amounts to Kshs.359.27 million, which is more than Kshs.283.52 million budgeted for in the approved budget.
3.19.2 Revenue Analysis
In the first quarter of FY 2015/16, the County received Kshs.581.38 million from the National Government as a direct transfer to the CRF account, raised Kshs.94.84 million from local sources, which included Kshs.30.15 million as un-reconcilable deposits/ direct deposits, and had Kshs.1.86 billion as cash balance brought forward from FY 2014/15. The local revenue raised in the FY 2014/15 was Kshs.94.84 million which was an improvement from Kshs.72.11 million collected in first quarter of FY 2014/15 and Kshs.58.85 million collected in the first quarter of FY 2013/14. The total local revenue raised in period under review accounted for 15.6 per cent of the annual local revenue target for FY 2015/16. Figure 3.67 shows the trend of local revenue collection by quarter from first quarter of FY 2013/14 to first quarter of FY 2015/16.
Figure 3.67: Kitui County, Trend in Local Revenue collection by Quarter since First Quarter FY 2013/14 to First Quarter FY 2015/16
58.85
75.44 76.6872.11
63.47
110.23
30
40
50
60
70
80
90
100
110
120
Ksh
s.mill
ion
Reporting periodSource: Kitui County Treasury
During the reporting period, the Controller of Budget authorised withdrawal of Kshs.1.85 billion from the CRF, which was 18.1 per cent of the approved budget, an improvement from 16.2 per cent when compared to first quarter of FY 2014/15. This amount consisted of Kshs.1.17 billion
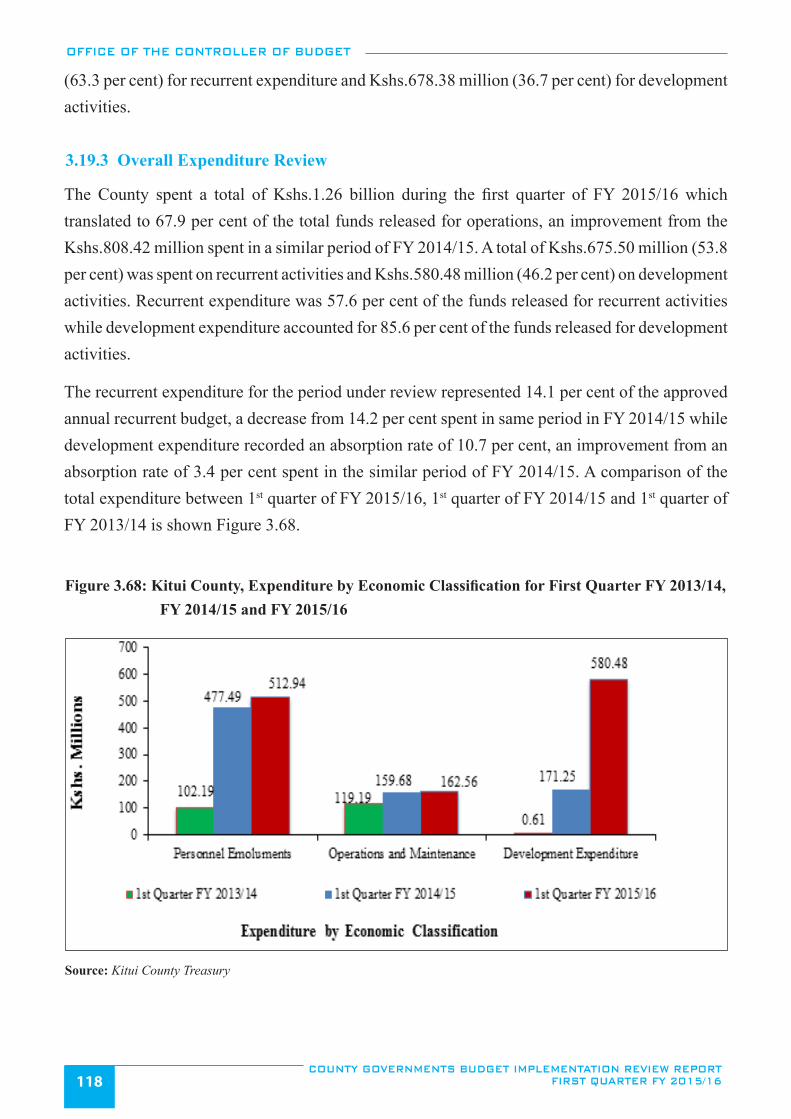
OFFICE OF THE CONTROLLER OF BUDGET
COUNTY GOVERNMENTS BUDGET IMPLEMENTATION REVIEW REPORT FIRST QUARTER FY 2015/16118
(63.3 per cent) for recurrent expenditure and Kshs.678.38 million (36.7 per cent) for development activities.
3.19.3 Overall Expenditure Review
The County spent a total of Kshs.1.26 billion during the first quarter of FY 2015/16 which translated to 67.9 per cent of the total funds released for operations, an improvement from the Kshs.808.42 million spent in a similar period of FY 2014/15. A total of Kshs.675.50 million (53.8 per cent) was spent on recurrent activities and Kshs.580.48 million (46.2 per cent) on development activities. Recurrent expenditure was 57.6 per cent of the funds released for recurrent activities while development expenditure accounted for 85.6 per cent of the funds released for development activities.
The recurrent expenditure for the period under review represented 14.1 per cent of the approved annual recurrent budget, a decrease from 14.2 per cent spent in same period in FY 2014/15 while development expenditure recorded an absorption rate of 10.7 per cent, an improvement from an absorption rate of 3.4 per cent spent in the similar period of FY 2014/15. A comparison of the total expenditure between 1st quarter of FY 2015/16, 1st quarter of FY 2014/15 and 1st quarter of FY 2013/14 is shown Figure 3.68.
Figure 3.68: Kitui County, Expenditure by Economic Classification for First Quarter FY 2013/14, FY 2014/15 and FY 2015/16
Source: Kitui County Treasury
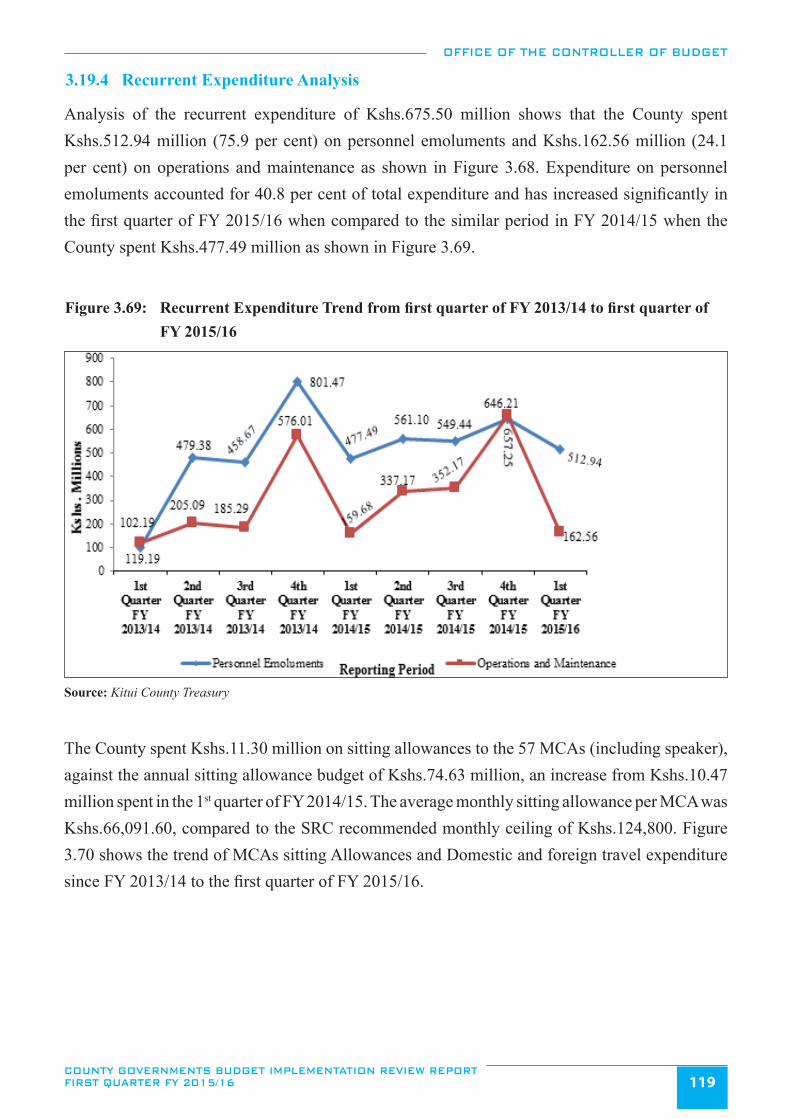
OFFICE OF THE CONTROLLER OF BUDGET
COUNTY GOVERNMENTS BUDGET IMPLEMENTATION REVIEW REPORT FIRST QUARTER FY 2015/16 119
3.19.4 Recurrent Expenditure Analysis
Analysis of the recurrent expenditure of Kshs.675.50 million shows that the County spent Kshs.512.94 million (75.9 per cent) on personnel emoluments and Kshs.162.56 million (24.1 per cent) on operations and maintenance as shown in Figure 3.68. Expenditure on personnel emoluments accounted for 40.8 per cent of total expenditure and has increased significantly in the first quarter of FY 2015/16 when compared to the similar period in FY 2014/15 when the County spent Kshs.477.49 million as shown in Figure 3.69.
Figure 3.69: Recurrent Expenditure Trend from first quarter of FY 2013/14 to first quarter of FY 2015/16
Source: Kitui County Treasury
The County spent Kshs.11.30 million on sitting allowances to the 57 MCAs (including speaker), against the annual sitting allowance budget of Kshs.74.63 million, an increase from Kshs.10.47 million spent in the 1st quarter of FY 2014/15. The average monthly sitting allowance per MCA was Kshs.66,091.60, compared to the SRC recommended monthly ceiling of Kshs.124,800. Figure 3.70 shows the trend of MCAs sitting Allowances and Domestic and foreign travel expenditure since FY 2013/14 to the first quarter of FY 2015/16.
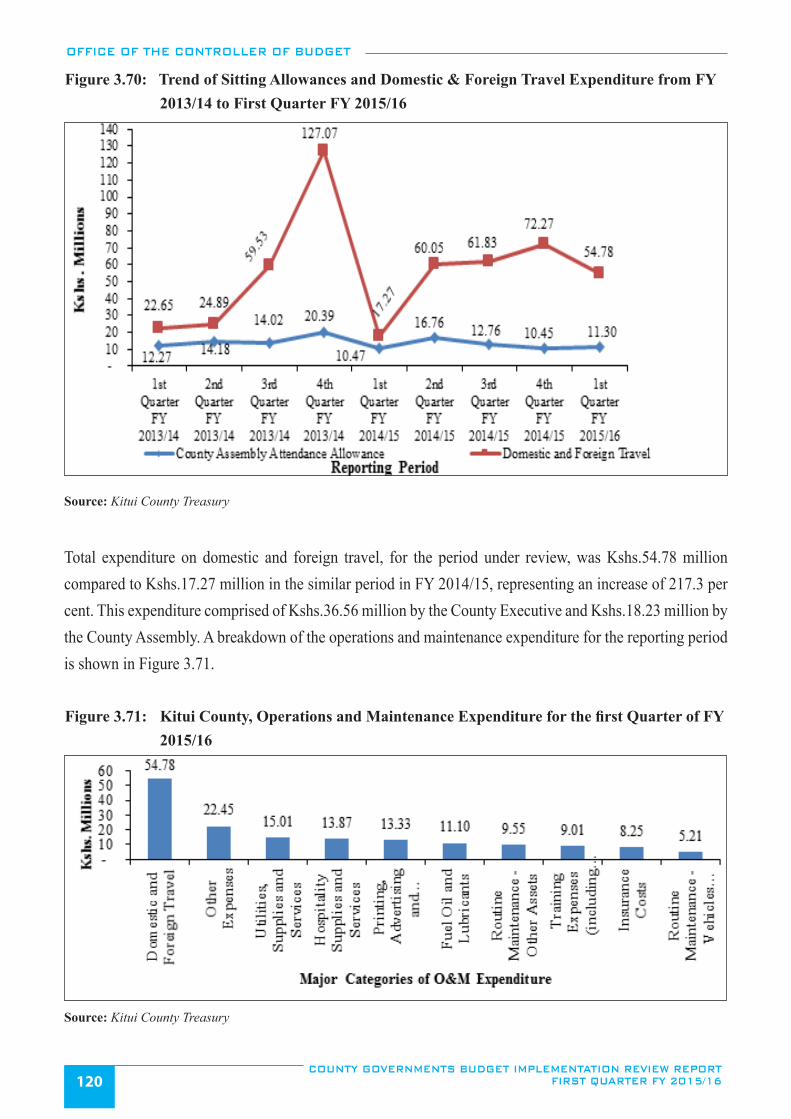
OFFICE OF THE CONTROLLER OF BUDGET
COUNTY GOVERNMENTS BUDGET IMPLEMENTATION REVIEW REPORT FIRST QUARTER FY 2015/16120
Figure 3.70: Trend of Sitting Allowances and Domestic & Foreign Travel Expenditure from FY 2013/14 to First Quarter FY 2015/16
Source: Kitui County Treasury
Total expenditure on domestic and foreign travel, for the period under review, was Kshs.54.78 million compared to Kshs.17.27 million in the similar period in FY 2014/15, representing an increase of 217.3 per cent. This expenditure comprised of Kshs.36.56 million by the County Executive and Kshs.18.23 million by the County Assembly. A breakdown of the operations and maintenance expenditure for the reporting period is shown in Figure 3.71.
Figure 3.71: Kitui County, Operations and Maintenance Expenditure for the first Quarter of FY 2015/16
Source: Kitui County Treasury
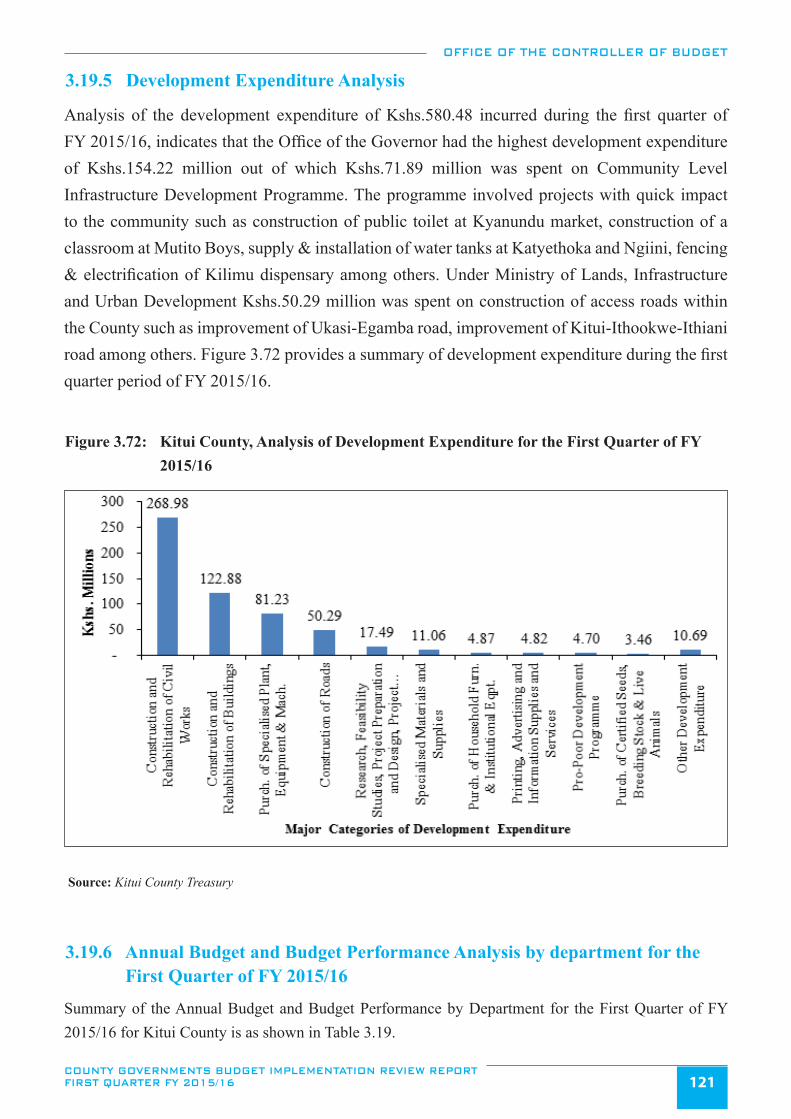
OFFICE OF THE CONTROLLER OF BUDGET
COUNTY GOVERNMENTS BUDGET IMPLEMENTATION REVIEW REPORT FIRST QUARTER FY 2015/16 121
3.19.5 Development Expenditure Analysis
Analysis of the development expenditure of Kshs.580.48 incurred during the first quarter of FY 2015/16, indicates that the Office of the Governor had the highest development expenditure of Kshs.154.22 million out of which Kshs.71.89 million was spent on Community Level Infrastructure Development Programme. The programme involved projects with quick impact to the community such as construction of public toilet at Kyanundu market, construction of a classroom at Mutito Boys, supply & installation of water tanks at Katyethoka and Ngiini, fencing & electrification of Kilimu dispensary among others. Under Ministry of Lands, Infrastructure and Urban Development Kshs.50.29 million was spent on construction of access roads within the County such as improvement of Ukasi-Egamba road, improvement of Kitui-Ithookwe-Ithiani road among others. Figure 3.72 provides a summary of development expenditure during the first quarter period of FY 2015/16.
Figure 3.72: Kitui County, Analysis of Development Expenditure for the First Quarter of FY 2015/16
Source: Kitui County Treasury
3.19.6 Annual Budget and Budget Performance Analysis by department for the First Quarter of FY 2015/16
Summary of the Annual Budget and Budget Performance by Department for the First Quarter of FY 2015/16 for Kitui County is as shown in Table 3.19.
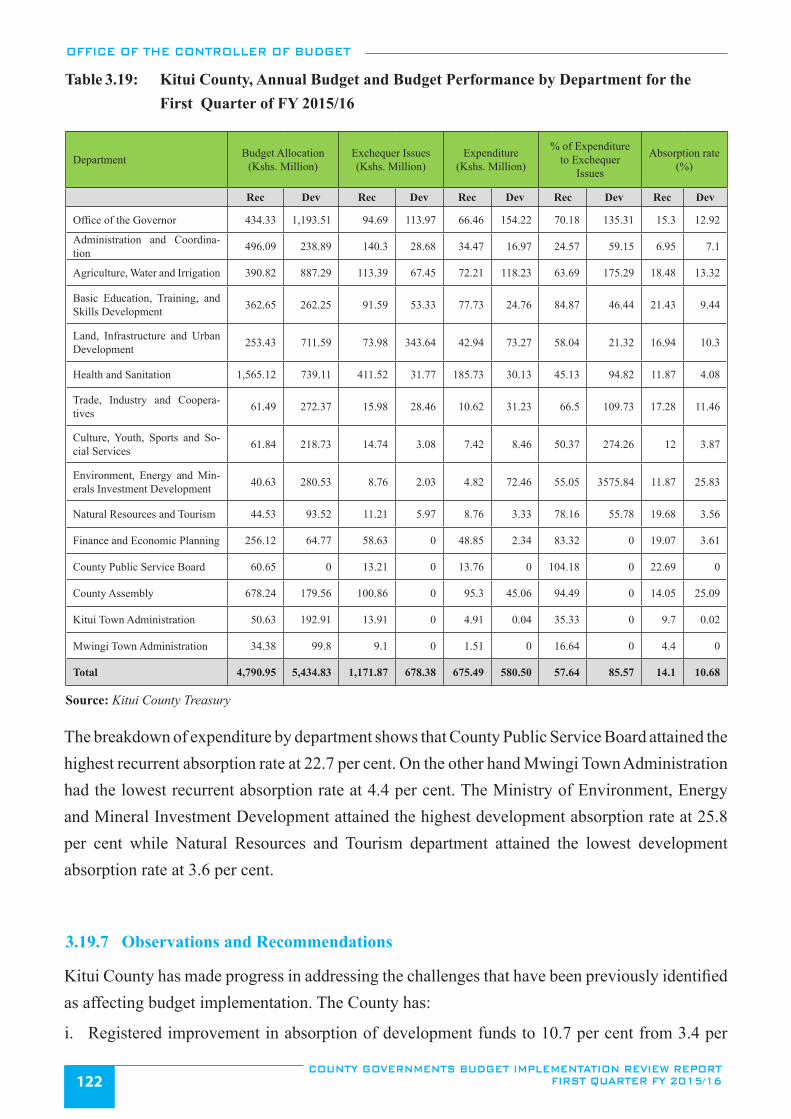
OFFICE OF THE CONTROLLER OF BUDGET
COUNTY GOVERNMENTS BUDGET IMPLEMENTATION REVIEW REPORT FIRST QUARTER FY 2015/16122
Table 3.19: Kitui County, Annual Budget and Budget Performance by Department for the First Quarter of FY 2015/16
Department Budget Allocation (Kshs. Million)
Exchequer Issues (Kshs. Million)
Expenditure (Kshs. Million)
% of Expenditure to Exchequer
Issues
Absorption rate (%)
Rec Dev Rec Dev Rec Dev Rec Dev Rec Dev
Office of the Governor 434.33 1,193.51 94.69 113.97 66.46 154.22 70.18 135.31 15.3 12.92
Administration and Coordina-tion 496.09 238.89 140.3 28.68 34.47 16.97 24.57 59.15 6.95 7.1
Agriculture, Water and Irrigation 390.82 887.29 113.39 67.45 72.21 118.23 63.69 175.29 18.48 13.32
Basic Education, Training, and Skills Development 362.65 262.25 91.59 53.33 77.73 24.76 84.87 46.44 21.43 9.44
Land, Infrastructure and Urban Development 253.43 711.59 73.98 343.64 42.94 73.27 58.04 21.32 16.94 10.3
Health and Sanitation 1,565.12 739.11 411.52 31.77 185.73 30.13 45.13 94.82 11.87 4.08
Trade, Industry and Coopera-tives 61.49 272.37 15.98 28.46 10.62 31.23 66.5 109.73 17.28 11.46
Culture, Youth, Sports and So-cial Services 61.84 218.73 14.74 3.08 7.42 8.46 50.37 274.26 12 3.87
Environment, Energy and Min-erals Investment Development 40.63 280.53 8.76 2.03 4.82 72.46 55.05 3575.84 11.87 25.83
Natural Resources and Tourism 44.53 93.52 11.21 5.97 8.76 3.33 78.16 55.78 19.68 3.56
Finance and Economic Planning 256.12 64.77 58.63 0 48.85 2.34 83.32 0 19.07 3.61
County Public Service Board 60.65 0 13.21 0 13.76 0 104.18 0 22.69 0
County Assembly 678.24 179.56 100.86 0 95.3 45.06 94.49 0 14.05 25.09
Kitui Town Administration 50.63 192.91 13.91 0 4.91 0.04 35.33 0 9.7 0.02
Mwingi Town Administration 34.38 99.8 9.1 0 1.51 0 16.64 0 4.4 0
Total 4,790.95 5,434.83 1,171.87 678.38 675.49 580.50 57.64 85.57 14.1 10.68
Source: Kitui County Treasury
The breakdown of expenditure by department shows that County Public Service Board attained the highest recurrent absorption rate at 22.7 per cent. On the other hand Mwingi Town Administration had the lowest recurrent absorption rate at 4.4 per cent. The Ministry of Environment, Energy and Mineral Investment Development attained the highest development absorption rate at 25.8 per cent while Natural Resources and Tourism department attained the lowest development absorption rate at 3.6 per cent.
3.19.7 Observations and Recommendations
Kitui County has made progress in addressing the challenges that have been previously identified as affecting budget implementation. The County has:
i. Registered improvement in absorption of development funds to 10.7 per cent from 3.4 per
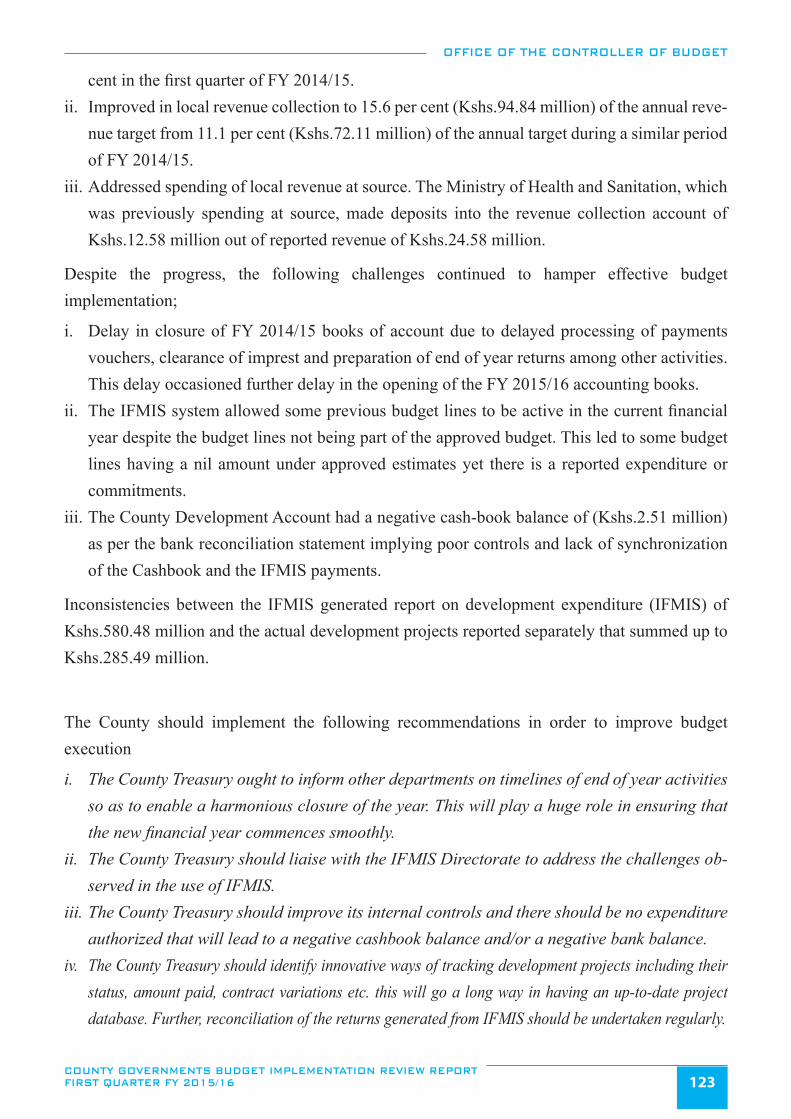
OFFICE OF THE CONTROLLER OF BUDGET
COUNTY GOVERNMENTS BUDGET IMPLEMENTATION REVIEW REPORT FIRST QUARTER FY 2015/16 123
cent in the first quarter of FY 2014/15.ii. Improved in local revenue collection to 15.6 per cent (Kshs.94.84 million) of the annual reve-
nue target from 11.1 per cent (Kshs.72.11 million) of the annual target during a similar period of FY 2014/15.
iii. Addressed spending of local revenue at source. The Ministry of Health and Sanitation, which was previously spending at source, made deposits into the revenue collection account of Kshs.12.58 million out of reported revenue of Kshs.24.58 million.
Despite the progress, the following challenges continued to hamper effective budget implementation;
i. Delay in closure of FY 2014/15 books of account due to delayed processing of payments vouchers, clearance of imprest and preparation of end of year returns among other activities. This delay occasioned further delay in the opening of the FY 2015/16 accounting books.
ii. The IFMIS system allowed some previous budget lines to be active in the current financial year despite the budget lines not being part of the approved budget. This led to some budget lines having a nil amount under approved estimates yet there is a reported expenditure or commitments.
iii. The County Development Account had a negative cash-book balance of (Kshs.2.51 million) as per the bank reconciliation statement implying poor controls and lack of synchronization of the Cashbook and the IFMIS payments.
Inconsistencies between the IFMIS generated report on development expenditure (IFMIS) of Kshs.580.48 million and the actual development projects reported separately that summed up to Kshs.285.49 million.
The County should implement the following recommendations in order to improve budget execution
i. The County Treasury ought to inform other departments on timelines of end of year activities so as to enable a harmonious closure of the year. This will play a huge role in ensuring that the new financial year commences smoothly.
ii. The County Treasury should liaise with the IFMIS Directorate to address the challenges ob-served in the use of IFMIS.
iii. The County Treasury should improve its internal controls and there should be no expenditure authorized that will lead to a negative cashbook balance and/or a negative bank balance.
iv. The County Treasury should identify innovative ways of tracking development projects including their status, amount paid, contract variations etc. this will go a long way in having an up-to-date project database. Further, reconciliation of the returns generated from IFMIS should be undertaken regularly.
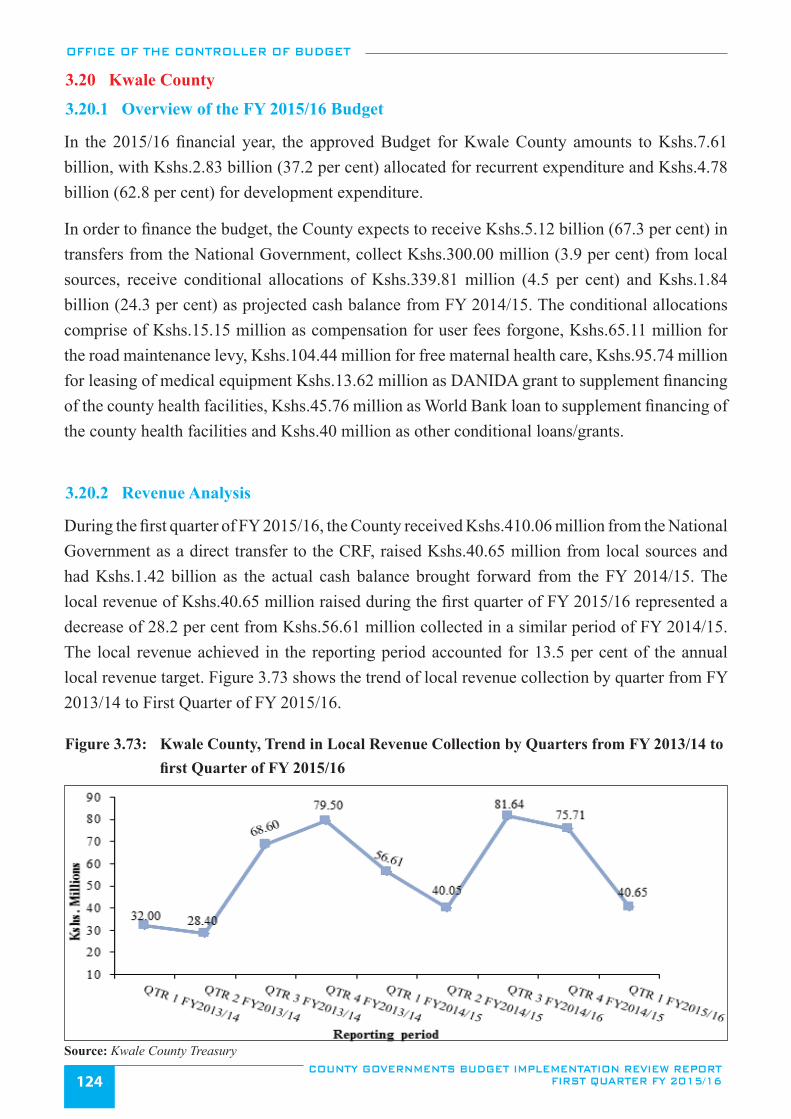
OFFICE OF THE CONTROLLER OF BUDGET
COUNTY GOVERNMENTS BUDGET IMPLEMENTATION REVIEW REPORT FIRST QUARTER FY 2015/16124
3.20 Kwale County
3.20.1 Overview of the FY 2015/16 Budget
In the 2015/16 financial year, the approved Budget for Kwale County amounts to Kshs.7.61 billion, with Kshs.2.83 billion (37.2 per cent) allocated for recurrent expenditure and Kshs.4.78 billion (62.8 per cent) for development expenditure.
In order to finance the budget, the County expects to receive Kshs.5.12 billion (67.3 per cent) in transfers from the National Government, collect Kshs.300.00 million (3.9 per cent) from local sources, receive conditional allocations of Kshs.339.81 million (4.5 per cent) and Kshs.1.84 billion (24.3 per cent) as projected cash balance from FY 2014/15. The conditional allocations comprise of Kshs.15.15 million as compensation for user fees forgone, Kshs.65.11 million for the road maintenance levy, Kshs.104.44 million for free maternal health care, Kshs.95.74 million for leasing of medical equipment Kshs.13.62 million as DANIDA grant to supplement financing of the county health facilities, Kshs.45.76 million as World Bank loan to supplement financing of the county health facilities and Kshs.40 million as other conditional loans/grants.
3.20.2 Revenue Analysis
During the first quarter of FY 2015/16, the County received Kshs.410.06 million from the National Government as a direct transfer to the CRF, raised Kshs.40.65 million from local sources and had Kshs.1.42 billion as the actual cash balance brought forward from the FY 2014/15. The local revenue of Kshs.40.65 million raised during the first quarter of FY 2015/16 represented a decrease of 28.2 per cent from Kshs.56.61 million collected in a similar period of FY 2014/15.The local revenue achieved in the reporting period accounted for 13.5 per cent of the annual local revenue target. Figure 3.73 shows the trend of local revenue collection by quarter from FY 2013/14 to First Quarter of FY 2015/16.
Figure 3.73: Kwale County, Trend in Local Revenue Collection by Quarters from FY 2013/14 to first Quarter of FY 2015/16
Source: Kwale County Treasury
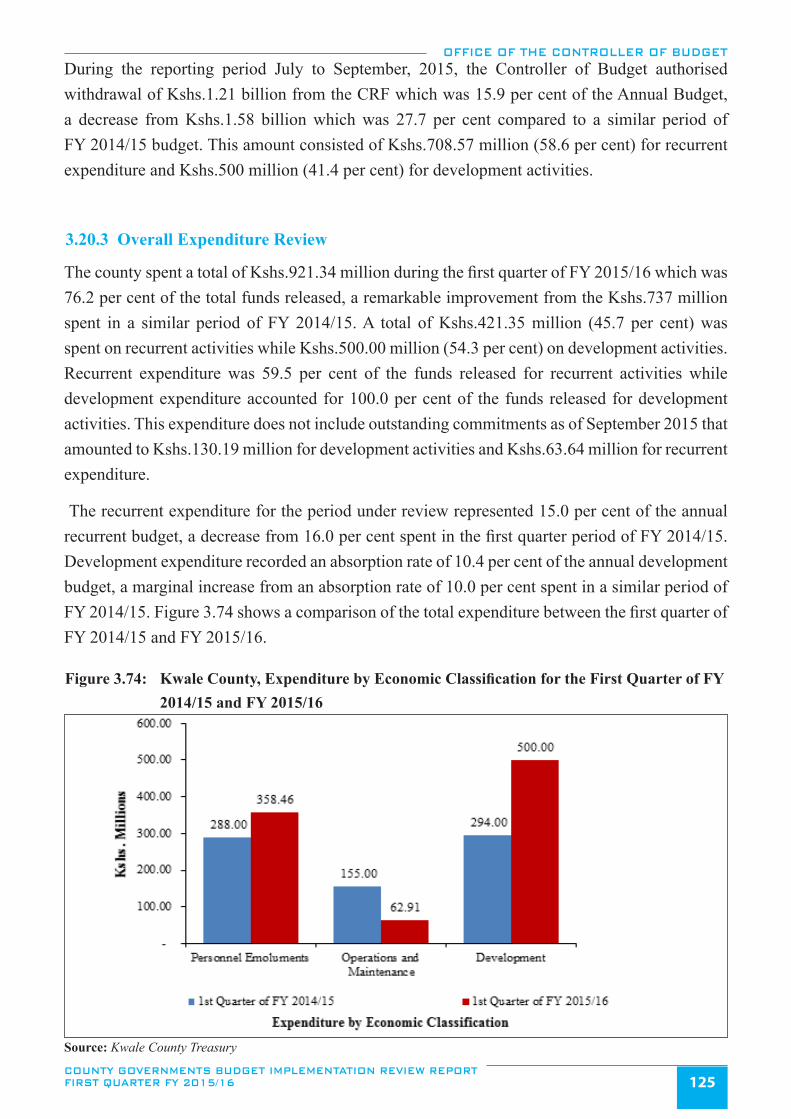
OFFICE OF THE CONTROLLER OF BUDGET
COUNTY GOVERNMENTS BUDGET IMPLEMENTATION REVIEW REPORT FIRST QUARTER FY 2015/16 125
During the reporting period July to September, 2015, the Controller of Budget authorised withdrawal of Kshs.1.21 billion from the CRF which was 15.9 per cent of the Annual Budget, a decrease from Kshs.1.58 billion which was 27.7 per cent compared to a similar period of FY 2014/15 budget. This amount consisted of Kshs.708.57 million (58.6 per cent) for recurrent expenditure and Kshs.500 million (41.4 per cent) for development activities.
3.20.3 Overall Expenditure Review
The county spent a total of Kshs.921.34 million during the first quarter of FY 2015/16 which was 76.2 per cent of the total funds released, a remarkable improvement from the Kshs.737 million spent in a similar period of FY 2014/15. A total of Kshs.421.35 million (45.7 per cent) was spent on recurrent activities while Kshs.500.00 million (54.3 per cent) on development activities. Recurrent expenditure was 59.5 per cent of the funds released for recurrent activities while development expenditure accounted for 100.0 per cent of the funds released for development activities. This expenditure does not include outstanding commitments as of September 2015 that amounted to Kshs.130.19 million for development activities and Kshs.63.64 million for recurrent expenditure.
The recurrent expenditure for the period under review represented 15.0 per cent of the annual recurrent budget, a decrease from 16.0 per cent spent in the first quarter period of FY 2014/15. Development expenditure recorded an absorption rate of 10.4 per cent of the annual development budget, a marginal increase from an absorption rate of 10.0 per cent spent in a similar period of FY 2014/15. Figure 3.74 shows a comparison of the total expenditure between the first quarter of FY 2014/15 and FY 2015/16.
Figure 3.74: Kwale County, Expenditure by Economic Classification for the First Quarter of FY 2014/15 and FY 2015/16
Source: Kwale County Treasury
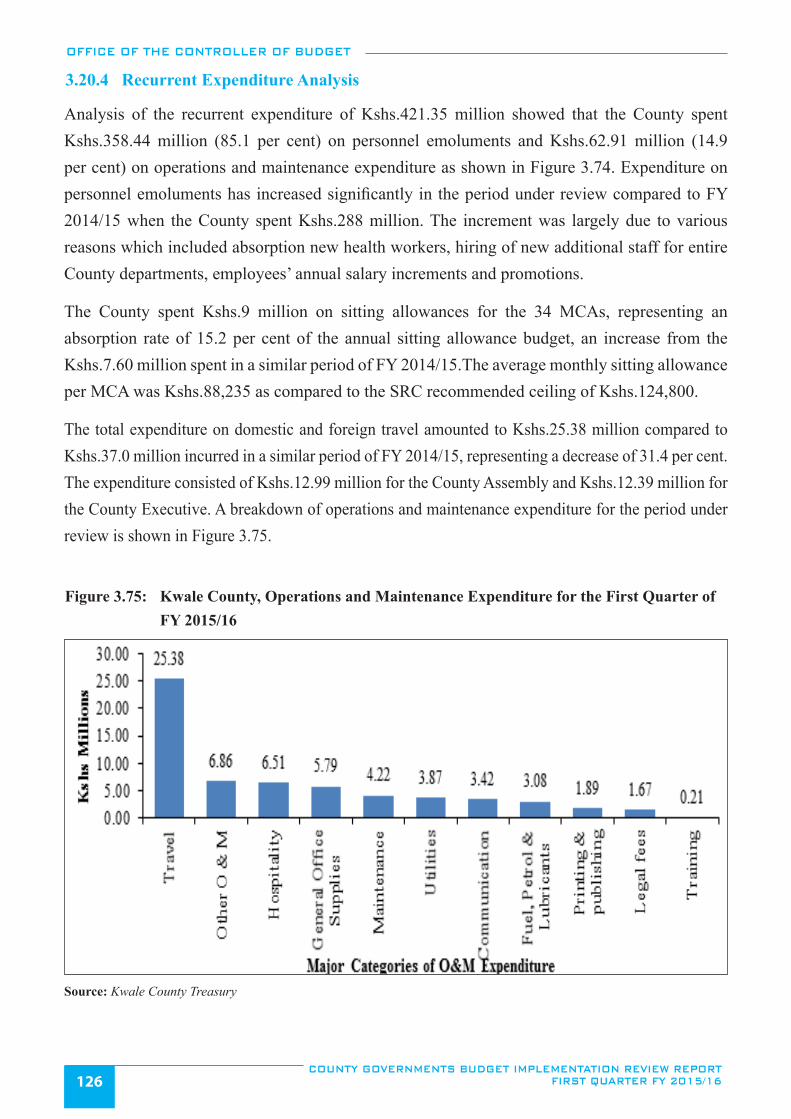
OFFICE OF THE CONTROLLER OF BUDGET
COUNTY GOVERNMENTS BUDGET IMPLEMENTATION REVIEW REPORT FIRST QUARTER FY 2015/16126
3.20.4 Recurrent Expenditure Analysis
Analysis of the recurrent expenditure of Kshs.421.35 million showed that the County spent Kshs.358.44 million (85.1 per cent) on personnel emoluments and Kshs.62.91 million (14.9 per cent) on operations and maintenance expenditure as shown in Figure 3.74. Expenditure on personnel emoluments has increased significantly in the period under review compared to FY 2014/15 when the County spent Kshs.288 million. The increment was largely due to various reasons which included absorption new health workers, hiring of new additional staff for entire County departments, employees’ annual salary increments and promotions.
The County spent Kshs.9 million on sitting allowances for the 34 MCAs, representing an absorption rate of 15.2 per cent of the annual sitting allowance budget, an increase from the Kshs.7.60 million spent in a similar period of FY 2014/15.The average monthly sitting allowance per MCA was Kshs.88,235 as compared to the SRC recommended ceiling of Kshs.124,800.
The total expenditure on domestic and foreign travel amounted to Kshs.25.38 million compared to Kshs.37.0 million incurred in a similar period of FY 2014/15, representing a decrease of 31.4 per cent. The expenditure consisted of Kshs.12.99 million for the County Assembly and Kshs.12.39 million for the County Executive. A breakdown of operations and maintenance expenditure for the period under review is shown in Figure 3.75.
Figure 3.75: Kwale County, Operations and Maintenance Expenditure for the First Quarter of FY 2015/16
Source: Kwale County Treasury
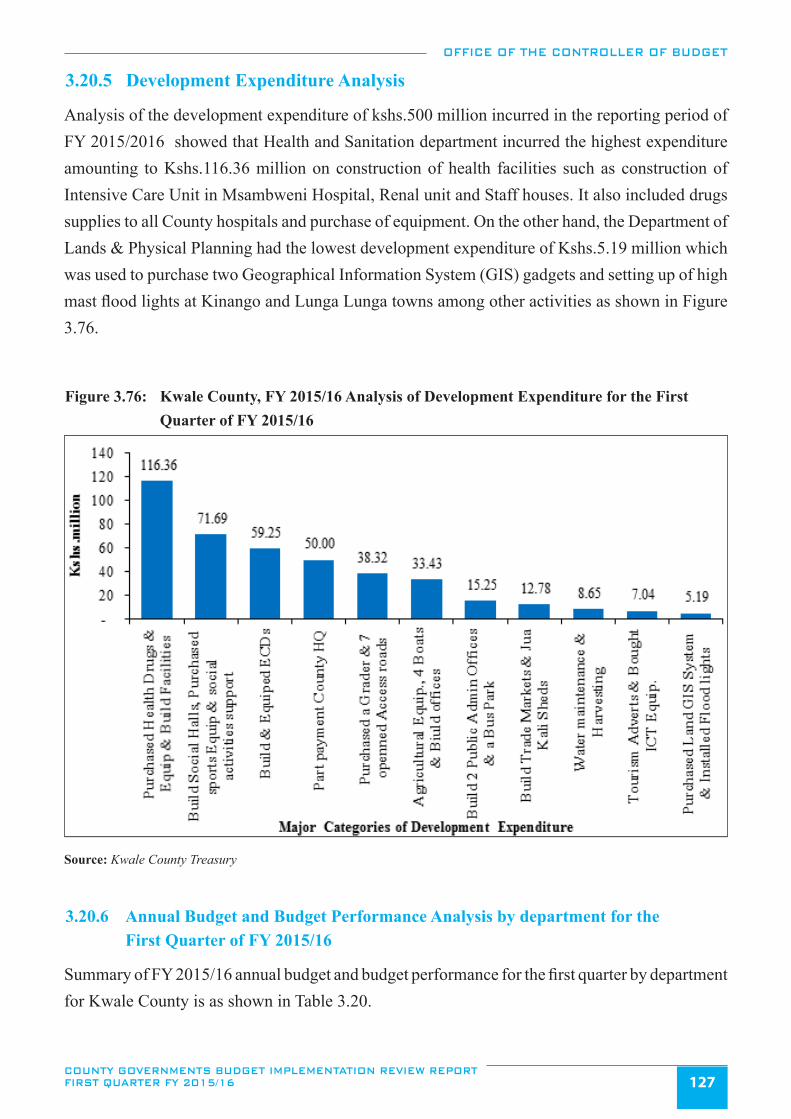
OFFICE OF THE CONTROLLER OF BUDGET
COUNTY GOVERNMENTS BUDGET IMPLEMENTATION REVIEW REPORT FIRST QUARTER FY 2015/16 127
3.20.5 Development Expenditure Analysis
Analysis of the development expenditure of kshs.500 million incurred in the reporting period of FY 2015/2016 showed that Health and Sanitation department incurred the highest expenditure amounting to Kshs.116.36 million on construction of health facilities such as construction of Intensive Care Unit in Msambweni Hospital, Renal unit and Staff houses. It also included drugs supplies to all County hospitals and purchase of equipment. On the other hand, the Department of Lands & Physical Planning had the lowest development expenditure of Kshs.5.19 million which was used to purchase two Geographical Information System (GIS) gadgets and setting up of high mast flood lights at Kinango and Lunga Lunga towns among other activities as shown in Figure 3.76.
Figure 3.76: Kwale County, FY 2015/16 Analysis of Development Expenditure for the First Quarter of FY 2015/16
Source: Kwale County Treasury
3.20.6 Annual Budget and Budget Performance Analysis by department for the First Quarter of FY 2015/16
Summary of FY 2015/16 annual budget and budget performance for the first quarter by department for Kwale County is as shown in Table 3.20.
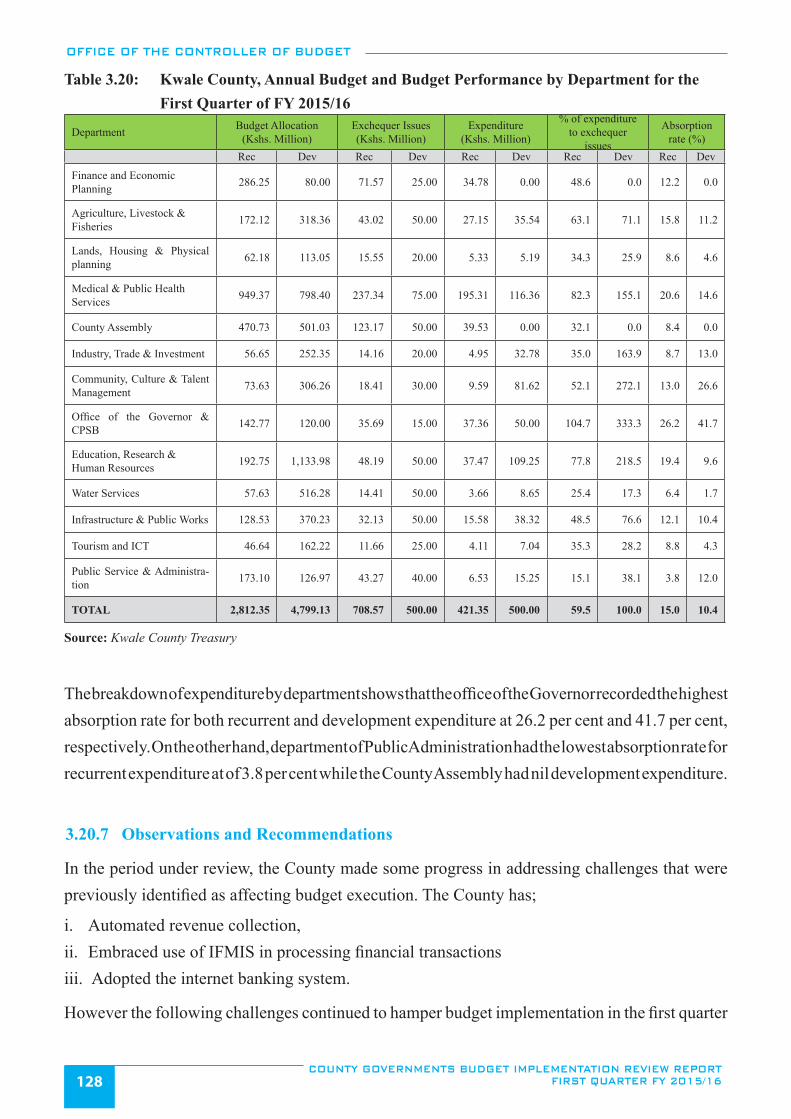
OFFICE OF THE CONTROLLER OF BUDGET
COUNTY GOVERNMENTS BUDGET IMPLEMENTATION REVIEW REPORT FIRST QUARTER FY 2015/16128
Table 3.20: Kwale County, Annual Budget and Budget Performance by Department for the First Quarter of FY 2015/16
Department Budget Allocation (Kshs. Million)
Exchequer Issues (Kshs. Million)
Expenditure (Kshs. Million)
% of expenditure to exchequer
issues
Absorption rate (%)
Rec Dev Rec Dev Rec Dev Rec Dev Rec Dev
Finance and Economic Planning 286.25 80.00 71.57 25.00 34.78 0.00 48.6 0.0 12.2 0.0
Agriculture, Livestock & Fisheries 172.12 318.36 43.02 50.00 27.15 35.54 63.1 71.1 15.8 11.2
Lands, Housing & Physical planning 62.18 113.05 15.55 20.00 5.33 5.19 34.3 25.9 8.6 4.6
Medical & Public Health Services 949.37 798.40 237.34 75.00 195.31 116.36 82.3 155.1 20.6 14.6
County Assembly 470.73 501.03 123.17 50.00 39.53 0.00 32.1 0.0 8.4 0.0
Industry, Trade & Investment 56.65 252.35 14.16 20.00 4.95 32.78 35.0 163.9 8.7 13.0
Community, Culture & Talent Management 73.63 306.26 18.41 30.00 9.59 81.62 52.1 272.1 13.0 26.6
Office of the Governor & CPSB 142.77 120.00 35.69 15.00 37.36 50.00 104.7 333.3 26.2 41.7
Education, Research & Human Resources 192.75 1,133.98 48.19 50.00 37.47 109.25 77.8 218.5 19.4 9.6
Water Services 57.63 516.28 14.41 50.00 3.66 8.65 25.4 17.3 6.4 1.7
Infrastructure & Public Works 128.53 370.23 32.13 50.00 15.58 38.32 48.5 76.6 12.1 10.4
Tourism and ICT 46.64 162.22 11.66 25.00 4.11 7.04 35.3 28.2 8.8 4.3
Public Service & Administra-tion 173.10 126.97 43.27 40.00 6.53 15.25 15.1 38.1 3.8 12.0
TOTAL 2,812.35 4,799.13 708.57 500.00 421.35 500.00 59.5 100.0 15.0 10.4
Source: Kwale County Treasury
The breakdown of expenditure by department shows that the office of the Governor recorded the highest absorption rate for both recurrent and development expenditure at 26.2 per cent and 41.7 per cent, respectively. On the other hand, department of Public Administration had the lowest absorption rate for recurrent expenditure at of 3.8 per cent while the County Assembly had nil development expenditure.
3.20.7 Observations and Recommendations
In the period under review, the County made some progress in addressing challenges that were previously identified as affecting budget execution. The County has;
i. Automated revenue collection, ii. Embraced use of IFMIS in processing financial transactionsiii. Adopted the internet banking system.
However the following challenges continued to hamper budget implementation in the first quarter
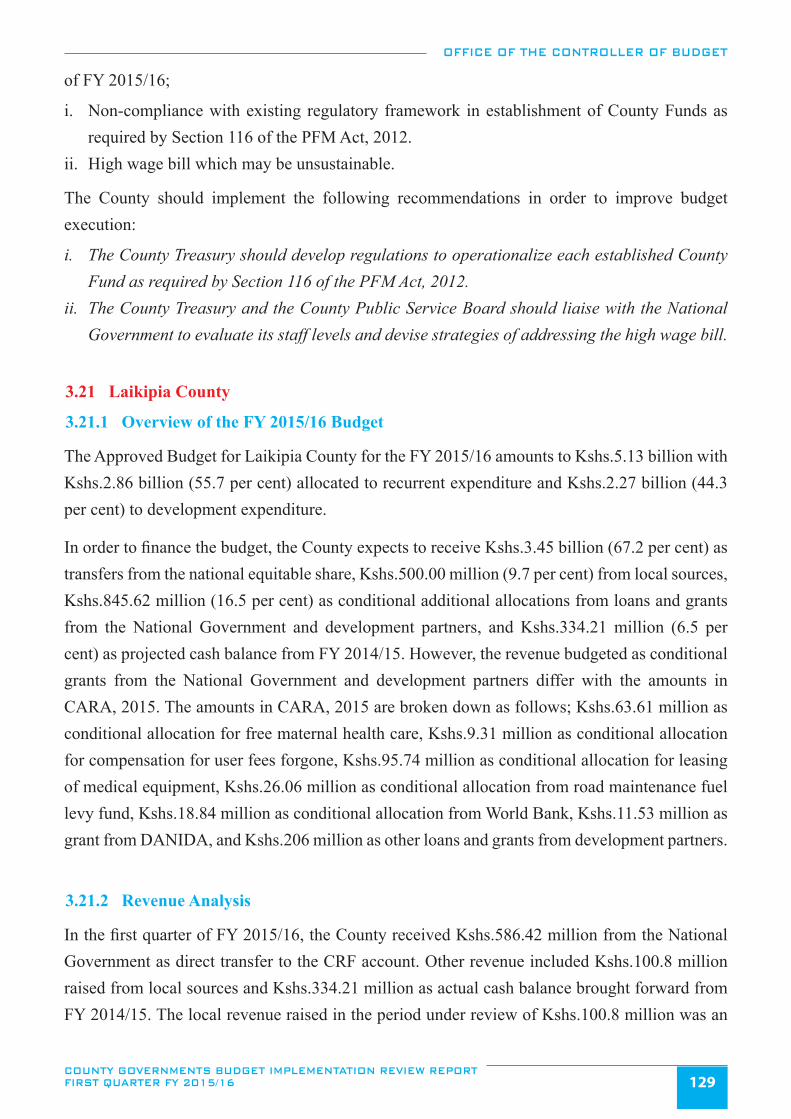
OFFICE OF THE CONTROLLER OF BUDGET
COUNTY GOVERNMENTS BUDGET IMPLEMENTATION REVIEW REPORT FIRST QUARTER FY 2015/16 129
of FY 2015/16;
i. Non-compliance with existing regulatory framework in establishment of County Funds as required by Section 116 of the PFM Act, 2012.
ii. High wage bill which may be unsustainable.
The County should implement the following recommendations in order to improve budget execution:
i. The County Treasury should develop regulations to operationalize each established County Fund as required by Section 116 of the PFM Act, 2012.
ii. The County Treasury and the County Public Service Board should liaise with the National Government to evaluate its staff levels and devise strategies of addressing the high wage bill.
3.21 Laikipia County
3.21.1 Overview of the FY 2015/16 Budget
The Approved Budget for Laikipia County for the FY 2015/16 amounts to Kshs.5.13 billion with Kshs.2.86 billion (55.7 per cent) allocated to recurrent expenditure and Kshs.2.27 billion (44.3 per cent) to development expenditure.
In order to finance the budget, the County expects to receive Kshs.3.45 billion (67.2 per cent) as transfers from the national equitable share, Kshs.500.00 million (9.7 per cent) from local sources, Kshs.845.62 million (16.5 per cent) as conditional additional allocations from loans and grants from the National Government and development partners, and Kshs.334.21 million (6.5 per cent) as projected cash balance from FY 2014/15. However, the revenue budgeted as conditional grants from the National Government and development partners differ with the amounts in CARA, 2015. The amounts in CARA, 2015 are broken down as follows; Kshs.63.61 million as conditional allocation for free maternal health care, Kshs.9.31 million as conditional allocation for compensation for user fees forgone, Kshs.95.74 million as conditional allocation for leasing of medical equipment, Kshs.26.06 million as conditional allocation from road maintenance fuel levy fund, Kshs.18.84 million as conditional allocation from World Bank, Kshs.11.53 million as grant from DANIDA, and Kshs.206 million as other loans and grants from development partners.
3.21.2 Revenue Analysis
In the first quarter of FY 2015/16, the County received Kshs.586.42 million from the National Government as direct transfer to the CRF account. Other revenue included Kshs.100.8 million raised from local sources and Kshs.334.21 million as actual cash balance brought forward from FY 2014/15. The local revenue raised in the period under review of Kshs.100.8 million was an
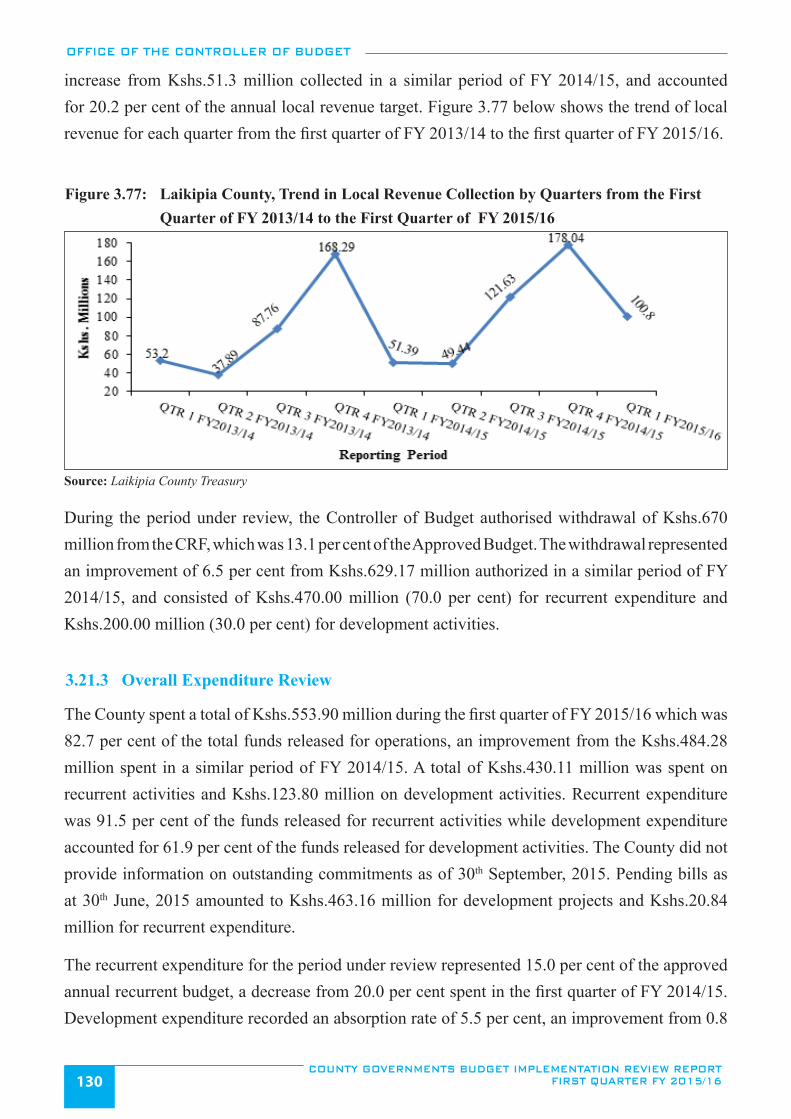
OFFICE OF THE CONTROLLER OF BUDGET
COUNTY GOVERNMENTS BUDGET IMPLEMENTATION REVIEW REPORT FIRST QUARTER FY 2015/16130
increase from Kshs.51.3 million collected in a similar period of FY 2014/15, and accounted for 20.2 per cent of the annual local revenue target. Figure 3.77 below shows the trend of local revenue for each quarter from the first quarter of FY 2013/14 to the first quarter of FY 2015/16.
Figure 3.77: Laikipia County, Trend in Local Revenue Collection by Quarters from the First Quarter of FY 2013/14 to the First Quarter of FY 2015/16
Source: Laikipia County Treasury
During the period under review, the Controller of Budget authorised withdrawal of Kshs.670 million from the CRF, which was 13.1 per cent of the Approved Budget. The withdrawal represented an improvement of 6.5 per cent from Kshs.629.17 million authorized in a similar period of FY 2014/15, and consisted of Kshs.470.00 million (70.0 per cent) for recurrent expenditure and Kshs.200.00 million (30.0 per cent) for development activities.
3.21.3 Overall Expenditure Review
The County spent a total of Kshs.553.90 million during the first quarter of FY 2015/16 which was 82.7 per cent of the total funds released for operations, an improvement from the Kshs.484.28 million spent in a similar period of FY 2014/15. A total of Kshs.430.11 million was spent on recurrent activities and Kshs.123.80 million on development activities. Recurrent expenditure was 91.5 per cent of the funds released for recurrent activities while development expenditure accounted for 61.9 per cent of the funds released for development activities. The County did not provide information on outstanding commitments as of 30th September, 2015. Pending bills as at 30th June, 2015 amounted to Kshs.463.16 million for development projects and Kshs.20.84 million for recurrent expenditure.
The recurrent expenditure for the period under review represented 15.0 per cent of the approved annual recurrent budget, a decrease from 20.0 per cent spent in the first quarter of FY 2014/15.Development expenditure recorded an absorption rate of 5.5 per cent, an improvement from 0.8
OFFICE OF THE CONTROLLER OF BUDGET
COUNTY GOVERNMENTS BUDGET IMPLEMENTATION REVIEW REPORT FIRST QUARTER FY 2015/16 131
per cent spent in the similar period of FY 2014/15. A comparison of the total expenditure between the first quarters of FY 2014/15 and FY 2015/16 is shown in Figure 3.78.
Figure 3.78: Laikipia County, Expenditure by Economic Classification for First Quarter of FY 2014/15 and FY 2015/16
Source: Laikipia County Treasury
3.21.4 Recurrent Expenditure Analysis
Analysis of the recurrent expenditure of Kshs.430.11 million shows that the County spent KShs.346.13 million (80.5 per cent) on personnel emoluments and Kshs.83.89 million (19.5 per cent) on operations and maintenance as shown in Figure 3.78. Expenditure on personnel emoluments accounted for 62.5 per cent of total expenditure and decreased significantly in the first quarter of FY 2015/16 compared to a similar period of FY 2014/15 when the County spent Kshs.416.65 million. The decrease is attributed to non-payment of statutory deductions in September, 2015 as a result of delayed disbursement of funds by the National Treasury.
The County spent Kshs.6.88 million on payment of sitting allowances to the 24 MCAs against the annual sitting allowance budget of Kshs.35.98 million, an increase from Kshs.2.73 million spent in the similar period of FY 2014/15. The average monthly sitting allowance per MCA for the quarter was Kshs.95,622 compared to SRC recommended amount of Kshs.124,800.
The expenditure on domestic and foreign travel in the first quarter of FY 2015/16 was Kshs.17.84 million compared to Kshs.28.11 million in a similar period of FY 2014/15, representing a decrease of 36.5 per cent. This expenditure comprised of Kshs.9.22 million by the County Executive and Kshs.8.62 million by the County Assembly. A breakdown of operations and maintenance expenditure for the period under review is shown in Figure 3.79.
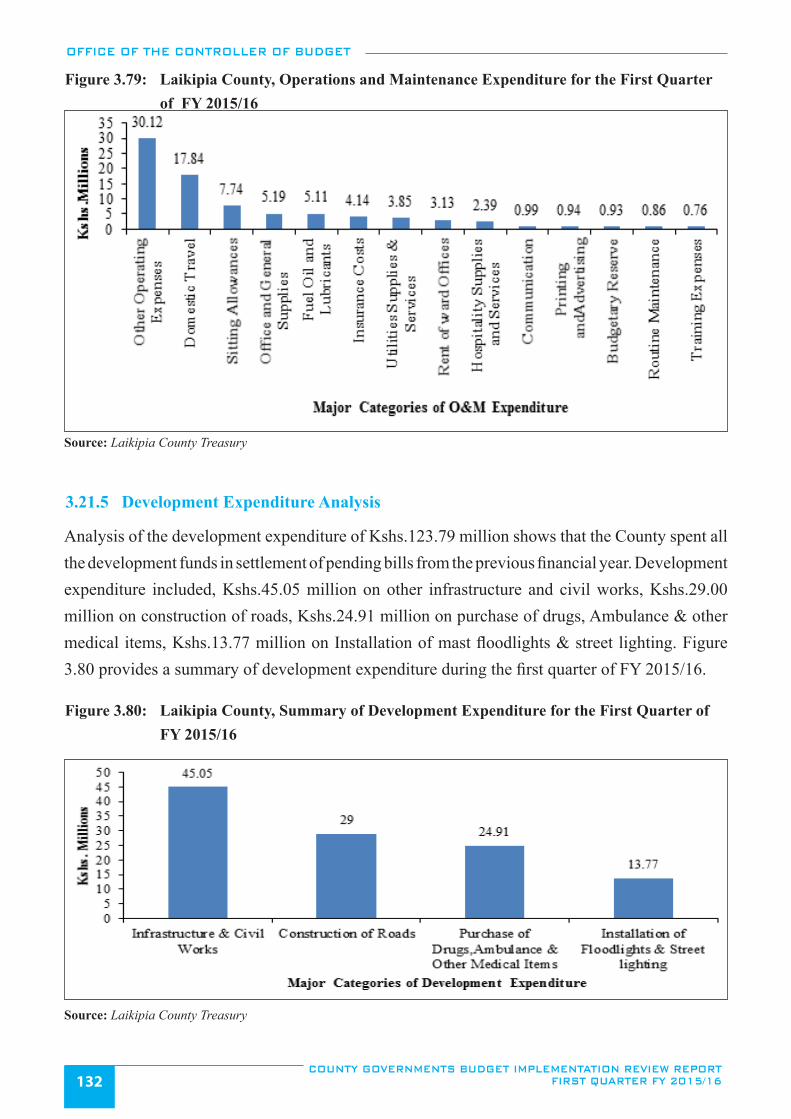
OFFICE OF THE CONTROLLER OF BUDGET
COUNTY GOVERNMENTS BUDGET IMPLEMENTATION REVIEW REPORT FIRST QUARTER FY 2015/16132
Figure 3.79: Laikipia County, Operations and Maintenance Expenditure for the First Quarter of FY 2015/16
Source: Laikipia County Treasury
3.21.5 Development Expenditure Analysis
Analysis of the development expenditure of Kshs.123.79 million shows that the County spent all the development funds in settlement of pending bills from the previous financial year. Development expenditure included, Kshs.45.05 million on other infrastructure and civil works, Kshs.29.00 million on construction of roads, Kshs.24.91 million on purchase of drugs, Ambulance & other medical items, Kshs.13.77 million on Installation of mast floodlights & street lighting. Figure 3.80 provides a summary of development expenditure during the first quarter of FY 2015/16.
Figure 3.80: Laikipia County, Summary of Development Expenditure for the First Quarter of FY 2015/16
Source: Laikipia County Treasury
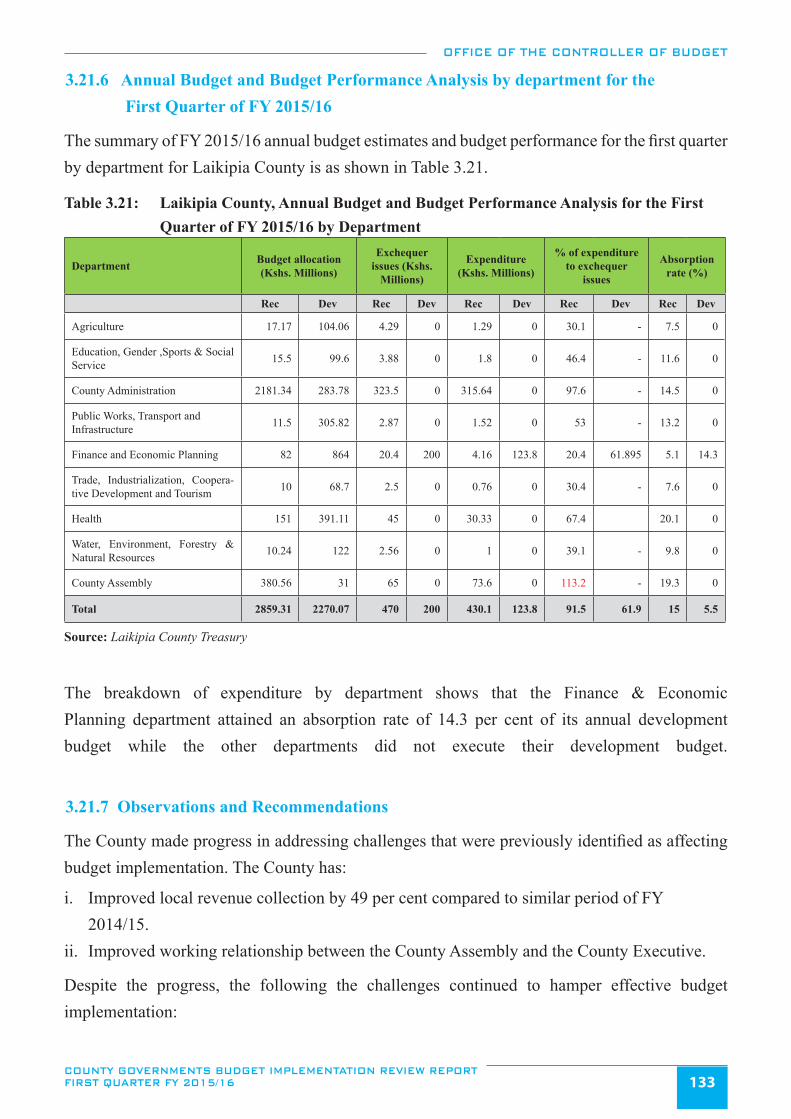
OFFICE OF THE CONTROLLER OF BUDGET
COUNTY GOVERNMENTS BUDGET IMPLEMENTATION REVIEW REPORT FIRST QUARTER FY 2015/16 133
3.21.6 Annual Budget and Budget Performance Analysis by department for the First Quarter of FY 2015/16
The summary of FY 2015/16 annual budget estimates and budget performance for the first quarter by department for Laikipia County is as shown in Table 3.21.
Table 3.21: Laikipia County, Annual Budget and Budget Performance Analysis for the First Quarter of FY 2015/16 by Department
Department Budget allocation (Kshs. Millions)
Exchequer issues (Kshs.
Millions)
Expenditure (Kshs. Millions)
% of expenditure to exchequer
issues
Absorption rate (%)
Rec Dev Rec Dev Rec Dev Rec Dev Rec Dev
Agriculture 17.17 104.06 4.29 0 1.29 0 30.1 - 7.5 0
Education, Gender ,Sports & Social Service 15.5 99.6 3.88 0 1.8 0 46.4 - 11.6 0
County Administration 2181.34 283.78 323.5 0 315.64 0 97.6 - 14.5 0
Public Works, Transport and Infrastructure 11.5 305.82 2.87 0 1.52 0 53 - 13.2 0
Finance and Economic Planning 82 864 20.4 200 4.16 123.8 20.4 61.895 5.1 14.3
Trade, Industrialization, Coopera-tive Development and Tourism 10 68.7 2.5 0 0.76 0 30.4 - 7.6 0
Health 151 391.11 45 0 30.33 0 67.4 20.1 0
Water, Environment, Forestry & Natural Resources 10.24 122 2.56 0 1 0 39.1 - 9.8 0
County Assembly 380.56 31 65 0 73.6 0 113.2 - 19.3 0
Total 2859.31 2270.07 470 200 430.1 123.8 91.5 61.9 15 5.5
Source: Laikipia County Treasury
The breakdown of expenditure by department shows that the Finance & Economic Planning department attained an absorption rate of 14.3 per cent of its annual development budget while the other departments did not execute their development budget.
3.21.7 Observations and Recommendations
The County made progress in addressing challenges that were previously identified as affecting budget implementation. The County has:
i. Improved local revenue collection by 49 per cent compared to similar period of FY 2014/15.
ii. Improved working relationship between the County Assembly and the County Executive.
Despite the progress, the following the challenges continued to hamper effective budget implementation:
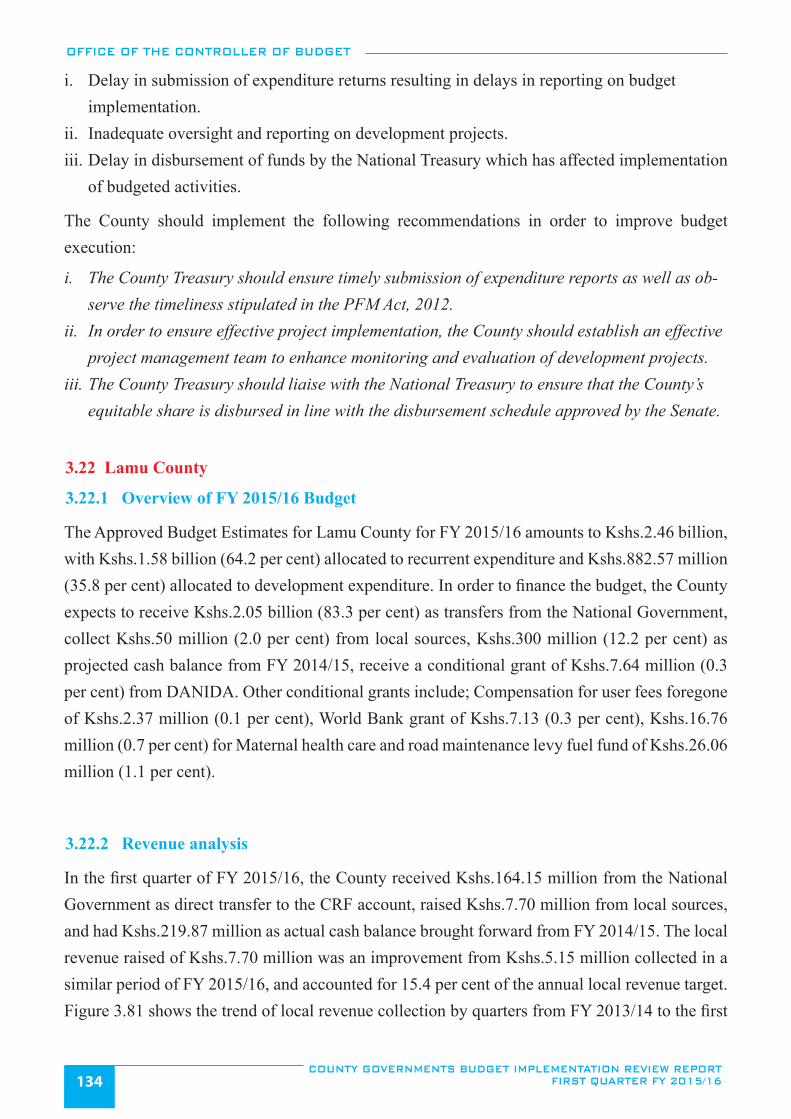
OFFICE OF THE CONTROLLER OF BUDGET
COUNTY GOVERNMENTS BUDGET IMPLEMENTATION REVIEW REPORT FIRST QUARTER FY 2015/16134
i. Delay in submission of expenditure returns resulting in delays in reporting on budget implementation.
ii. Inadequate oversight and reporting on development projects.iii. Delay in disbursement of funds by the National Treasury which has affected implementation
of budgeted activities.
The County should implement the following recommendations in order to improve budget execution:
i. The County Treasury should ensure timely submission of expenditure reports as well as ob-serve the timeliness stipulated in the PFM Act, 2012.
ii. In order to ensure effective project implementation, the County should establish an effective project management team to enhance monitoring and evaluation of development projects.
iii. The County Treasury should liaise with the National Treasury to ensure that the County’s equitable share is disbursed in line with the disbursement schedule approved by the Senate.
3.22 Lamu County
3.22.1 Overview of FY 2015/16 Budget
The Approved Budget Estimates for Lamu County for FY 2015/16 amounts to Kshs.2.46 billion, with Kshs.1.58 billion (64.2 per cent) allocated to recurrent expenditure and Kshs.882.57 million (35.8 per cent) allocated to development expenditure. In order to finance the budget, the County expects to receive Kshs.2.05 billion (83.3 per cent) as transfers from the National Government, collect Kshs.50 million (2.0 per cent) from local sources, Kshs.300 million (12.2 per cent) as projected cash balance from FY 2014/15, receive a conditional grant of Kshs.7.64 million (0.3 per cent) from DANIDA. Other conditional grants include; Compensation for user fees foregone of Kshs.2.37 million (0.1 per cent), World Bank grant of Kshs.7.13 (0.3 per cent), Kshs.16.76 million (0.7 per cent) for Maternal health care and road maintenance levy fuel fund of Kshs.26.06 million (1.1 per cent).
3.22.2 Revenue analysis
In the first quarter of FY 2015/16, the County received Kshs.164.15 million from the National Government as direct transfer to the CRF account, raised Kshs.7.70 million from local sources, and had Kshs.219.87 million as actual cash balance brought forward from FY 2014/15. The local revenue raised of Kshs.7.70 million was an improvement from Kshs.5.15 million collected in a similar period of FY 2015/16, and accounted for 15.4 per cent of the annual local revenue target. Figure 3.81 shows the trend of local revenue collection by quarters from FY 2013/14 to the first
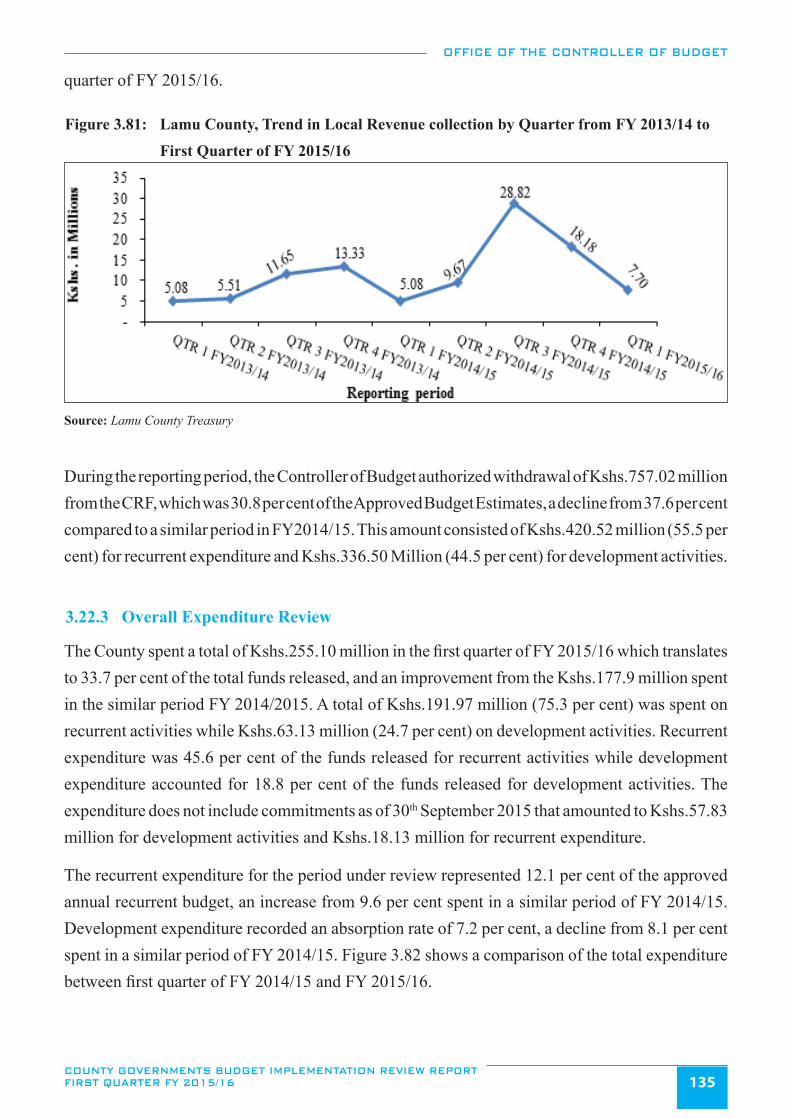
OFFICE OF THE CONTROLLER OF BUDGET
COUNTY GOVERNMENTS BUDGET IMPLEMENTATION REVIEW REPORT FIRST QUARTER FY 2015/16 135
quarter of FY 2015/16.
Figure 3.81: Lamu County, Trend in Local Revenue collection by Quarter from FY 2013/14 to
First Quarter of FY 2015/16
Source: Lamu County Treasury
During the reporting period, the Controller of Budget authorized withdrawal of Kshs.757.02 million from the CRF, which was 30.8 per cent of the Approved Budget Estimates, a decline from 37.6 per cent compared to a similar period in FY2014/15. This amount consisted of Kshs.420.52 million (55.5 per cent) for recurrent expenditure and Kshs.336.50 Million (44.5 per cent) for development activities.
3.22.3 Overall Expenditure Review
The County spent a total of Kshs.255.10 million in the first quarter of FY 2015/16 which translates to 33.7 per cent of the total funds released, and an improvement from the Kshs.177.9 million spent in the similar period FY 2014/2015. A total of Kshs.191.97 million (75.3 per cent) was spent on recurrent activities while Kshs.63.13 million (24.7 per cent) on development activities. Recurrent expenditure was 45.6 per cent of the funds released for recurrent activities while development expenditure accounted for 18.8 per cent of the funds released for development activities. The expenditure does not include commitments as of 30th September 2015 that amounted to Kshs.57.83 million for development activities and Kshs.18.13 million for recurrent expenditure.
The recurrent expenditure for the period under review represented 12.1 per cent of the approved annual recurrent budget, an increase from 9.6 per cent spent in a similar period of FY 2014/15. Development expenditure recorded an absorption rate of 7.2 per cent, a decline from 8.1 per cent spent in a similar period of FY 2014/15. Figure 3.82 shows a comparison of the total expenditure between first quarter of FY 2014/15 and FY 2015/16.
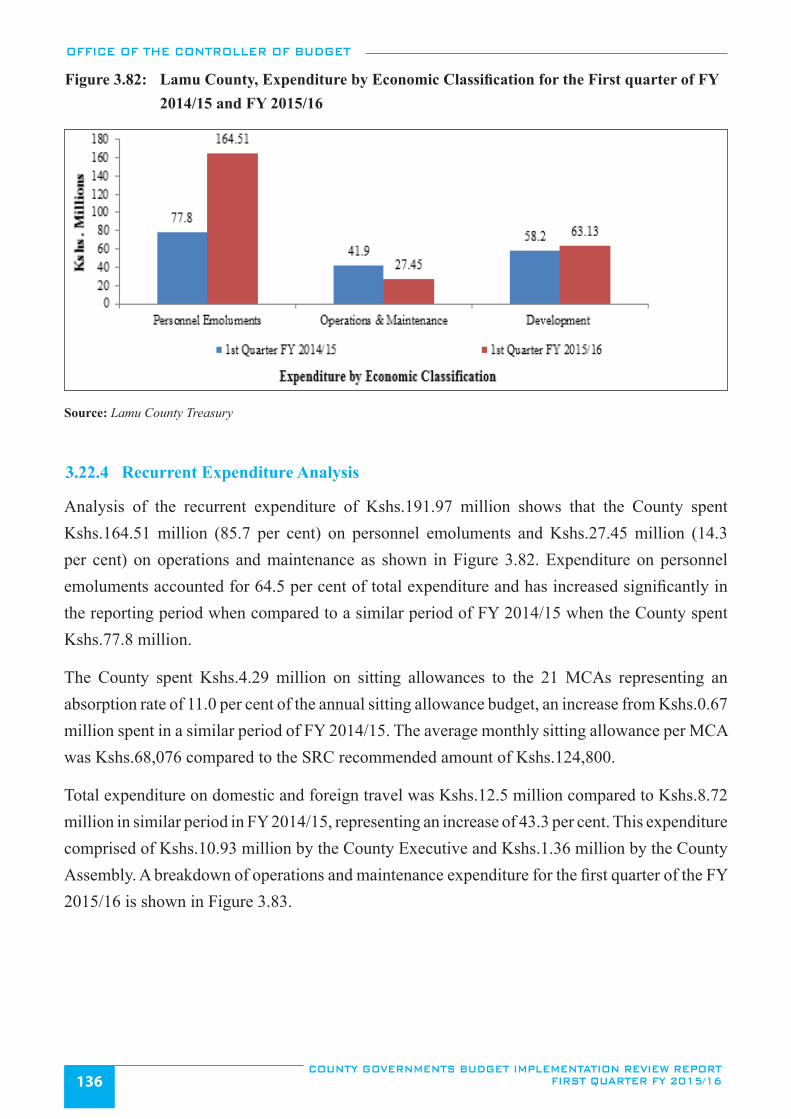
OFFICE OF THE CONTROLLER OF BUDGET
COUNTY GOVERNMENTS BUDGET IMPLEMENTATION REVIEW REPORT FIRST QUARTER FY 2015/16136
Figure 3.82: Lamu County, Expenditure by Economic Classification for the First quarter of FY 2014/15 and FY 2015/16
Source: Lamu County Treasury
3.22.4 Recurrent Expenditure Analysis
Analysis of the recurrent expenditure of Kshs.191.97 million shows that the County spent Kshs.164.51 million (85.7 per cent) on personnel emoluments and Kshs.27.45 million (14.3 per cent) on operations and maintenance as shown in Figure 3.82. Expenditure on personnel emoluments accounted for 64.5 per cent of total expenditure and has increased significantly in the reporting period when compared to a similar period of FY 2014/15 when the County spent Kshs.77.8 million.
The County spent Kshs.4.29 million on sitting allowances to the 21 MCAs representing an absorption rate of 11.0 per cent of the annual sitting allowance budget, an increase from Kshs.0.67 million spent in a similar period of FY 2014/15. The average monthly sitting allowance per MCA was Kshs.68,076 compared to the SRC recommended amount of Kshs.124,800.
Total expenditure on domestic and foreign travel was Kshs.12.5 million compared to Kshs.8.72 million in similar period in FY 2014/15, representing an increase of 43.3 per cent. This expenditure comprised of Kshs.10.93 million by the County Executive and Kshs.1.36 million by the County Assembly. A breakdown of operations and maintenance expenditure for the first quarter of the FY 2015/16 is shown in Figure 3.83.
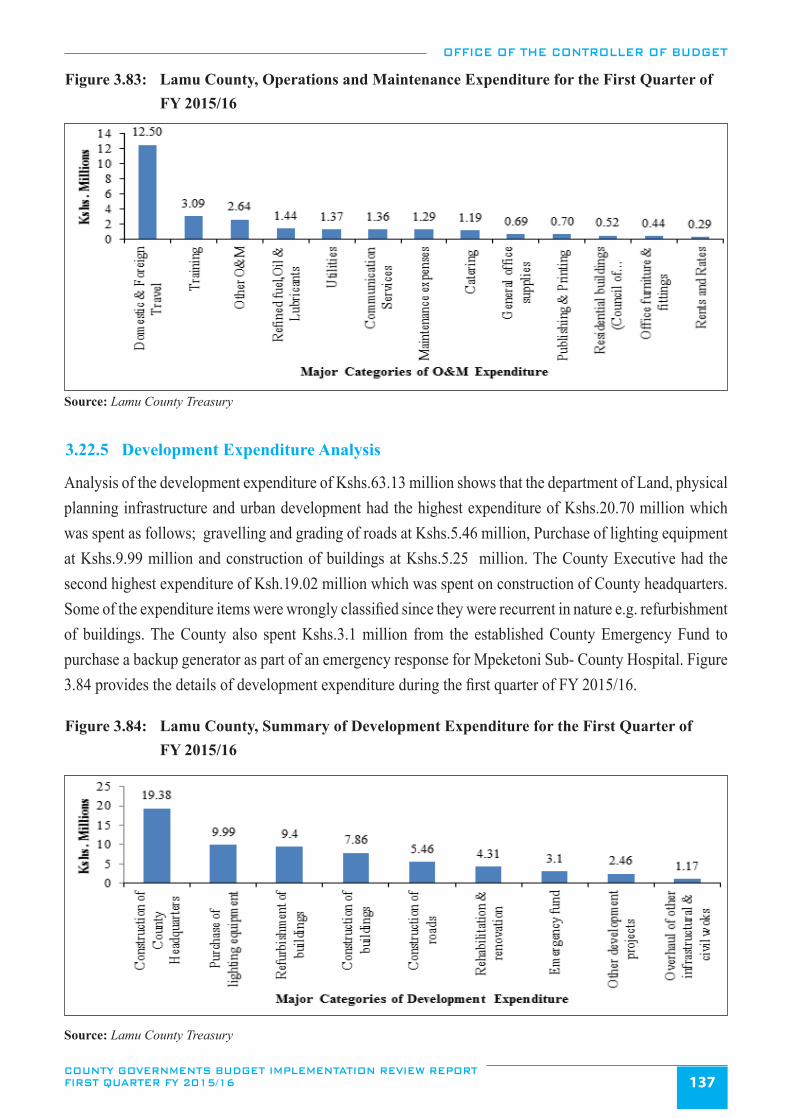
OFFICE OF THE CONTROLLER OF BUDGET
COUNTY GOVERNMENTS BUDGET IMPLEMENTATION REVIEW REPORT FIRST QUARTER FY 2015/16 137
Figure 3.83: Lamu County, Operations and Maintenance Expenditure for the First Quarter of FY 2015/16
Source: Lamu County Treasury
3.22.5 Development Expenditure Analysis
Analysis of the development expenditure of Kshs.63.13 million shows that the department of Land, physical planning infrastructure and urban development had the highest expenditure of Kshs.20.70 million which was spent as follows; gravelling and grading of roads at Kshs.5.46 million, Purchase of lighting equipment at Kshs.9.99 million and construction of buildings at Kshs.5.25 million. The County Executive had the second highest expenditure of Ksh.19.02 million which was spent on construction of County headquarters. Some of the expenditure items were wrongly classified since they were recurrent in nature e.g. refurbishment of buildings. The County also spent Kshs.3.1 million from the established County Emergency Fund to purchase a backup generator as part of an emergency response for Mpeketoni Sub- County Hospital. Figure 3.84 provides the details of development expenditure during the first quarter of FY 2015/16.
Figure 3.84: Lamu County, Summary of Development Expenditure for the First Quarter of FY 2015/16
Source: Lamu County Treasury
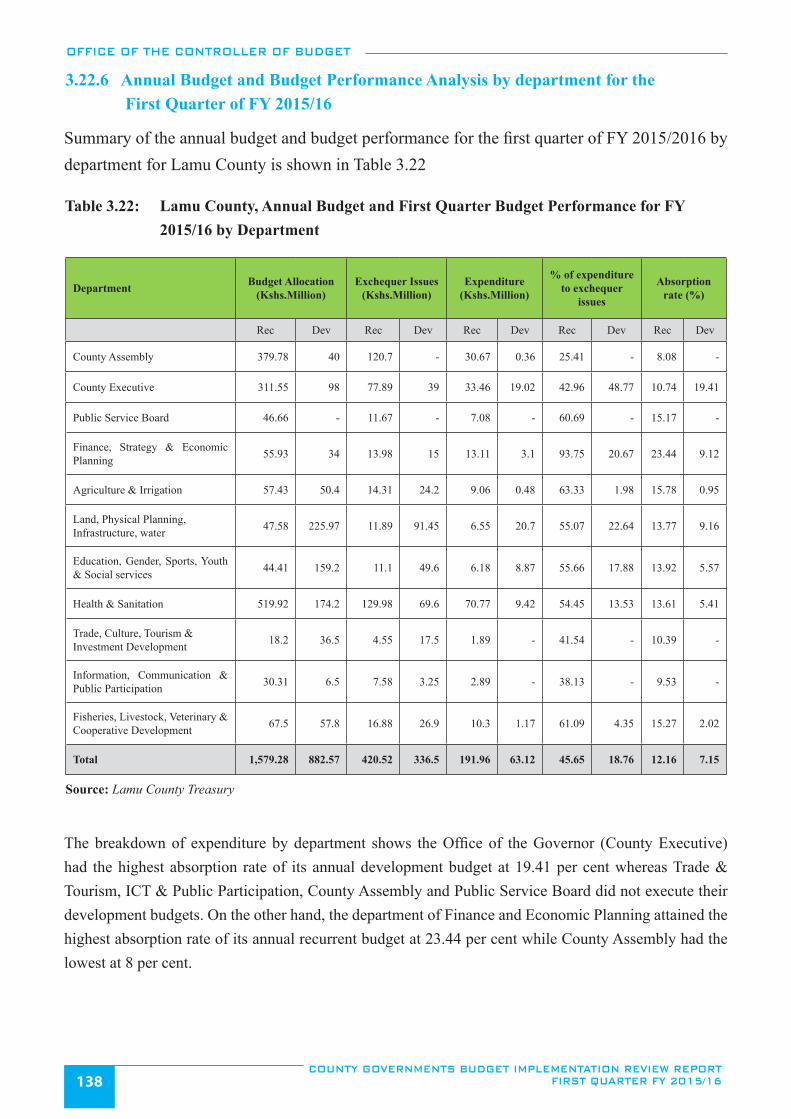
OFFICE OF THE CONTROLLER OF BUDGET
COUNTY GOVERNMENTS BUDGET IMPLEMENTATION REVIEW REPORT FIRST QUARTER FY 2015/16138
3.22.6 Annual Budget and Budget Performance Analysis by department for the First Quarter of FY 2015/16
Summary of the annual budget and budget performance for the first quarter of FY 2015/2016 by department for Lamu County is shown in Table 3.22
Table 3.22: Lamu County, Annual Budget and First Quarter Budget Performance for FY 2015/16 by Department
Department Budget Allocation (Kshs.Million)
Exchequer Issues (Kshs.Million)
Expenditure (Kshs.Million)
% of expenditure to exchequer
issues
Absorption rate (%)
Rec Dev Rec Dev Rec Dev Rec Dev Rec Dev
County Assembly 379.78 40 120.7 - 30.67 0.36 25.41 - 8.08 -
County Executive 311.55 98 77.89 39 33.46 19.02 42.96 48.77 10.74 19.41
Public Service Board 46.66 - 11.67 - 7.08 - 60.69 - 15.17 -
Finance, Strategy & Economic Planning 55.93 34 13.98 15 13.11 3.1 93.75 20.67 23.44 9.12
Agriculture & Irrigation 57.43 50.4 14.31 24.2 9.06 0.48 63.33 1.98 15.78 0.95
Land, Physical Planning, Infrastructure, water 47.58 225.97 11.89 91.45 6.55 20.7 55.07 22.64 13.77 9.16
Education, Gender, Sports, Youth & Social services 44.41 159.2 11.1 49.6 6.18 8.87 55.66 17.88 13.92 5.57
Health & Sanitation 519.92 174.2 129.98 69.6 70.77 9.42 54.45 13.53 13.61 5.41
Trade, Culture, Tourism & Investment Development 18.2 36.5 4.55 17.5 1.89 - 41.54 - 10.39 -
Information, Communication & Public Participation 30.31 6.5 7.58 3.25 2.89 - 38.13 - 9.53 -
Fisheries, Livestock, Veterinary & Cooperative Development 67.5 57.8 16.88 26.9 10.3 1.17 61.09 4.35 15.27 2.02
Total 1,579.28 882.57 420.52 336.5 191.96 63.12 45.65 18.76 12.16 7.15
Source: Lamu County Treasury
The breakdown of expenditure by department shows the Office of the Governor (County Executive) had the highest absorption rate of its annual development budget at 19.41 per cent whereas Trade & Tourism, ICT & Public Participation, County Assembly and Public Service Board did not execute their development budgets. On the other hand, the department of Finance and Economic Planning attained the highest absorption rate of its annual recurrent budget at 23.44 per cent while County Assembly had the lowest at 8 per cent.
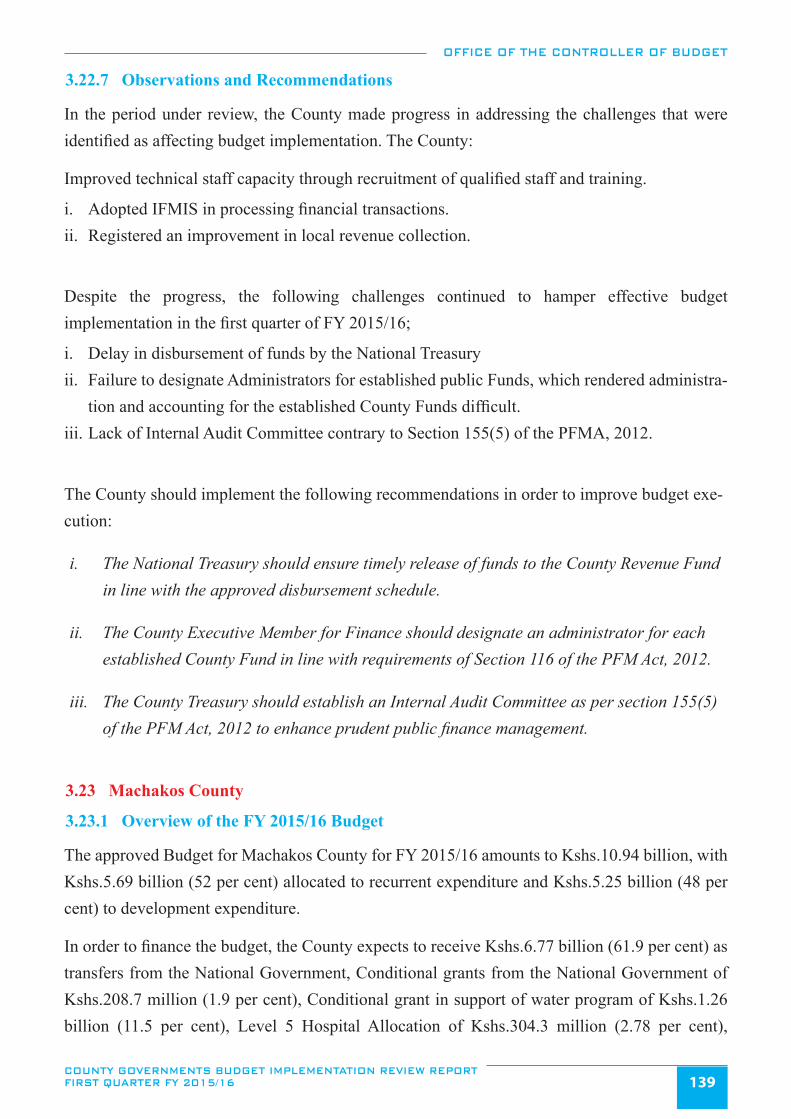
OFFICE OF THE CONTROLLER OF BUDGET
COUNTY GOVERNMENTS BUDGET IMPLEMENTATION REVIEW REPORT FIRST QUARTER FY 2015/16 139
3.22.7 Observations and Recommendations
In the period under review, the County made progress in addressing the challenges that were identified as affecting budget implementation. The County:
Improved technical staff capacity through recruitment of qualified staff and training.
i. Adopted IFMIS in processing financial transactions.ii. Registered an improvement in local revenue collection.
Despite the progress, the following challenges continued to hamper effective budget implementation in the first quarter of FY 2015/16;
i. Delay in disbursement of funds by the National Treasuryii. Failure to designate Administrators for established public Funds, which rendered administra-
tion and accounting for the established County Funds difficult.iii. Lack of Internal Audit Committee contrary to Section 155(5) of the PFMA, 2012.
The County should implement the following recommendations in order to improve budget exe-cution:
i. The National Treasury should ensure timely release of funds to the County Revenue Fund in line with the approved disbursement schedule.
ii. The County Executive Member for Finance should designate an administrator for each established County Fund in line with requirements of Section 116 of the PFM Act, 2012.
iii. The County Treasury should establish an Internal Audit Committee as per section 155(5) of the PFM Act, 2012 to enhance prudent public finance management.
3.23 Machakos County
3.23.1 Overview of the FY 2015/16 Budget
The approved Budget for Machakos County for FY 2015/16 amounts to Kshs.10.94 billion, with Kshs.5.69 billion (52 per cent) allocated to recurrent expenditure and Kshs.5.25 billion (48 per cent) to development expenditure.
In order to finance the budget, the County expects to receive Kshs.6.77 billion (61.9 per cent) as transfers from the National Government, Conditional grants from the National Government of Kshs.208.7 million (1.9 per cent), Conditional grant in support of water program of Kshs.1.26 billion (11.5 per cent), Level 5 Hospital Allocation of Kshs.304.3 million (2.78 per cent),
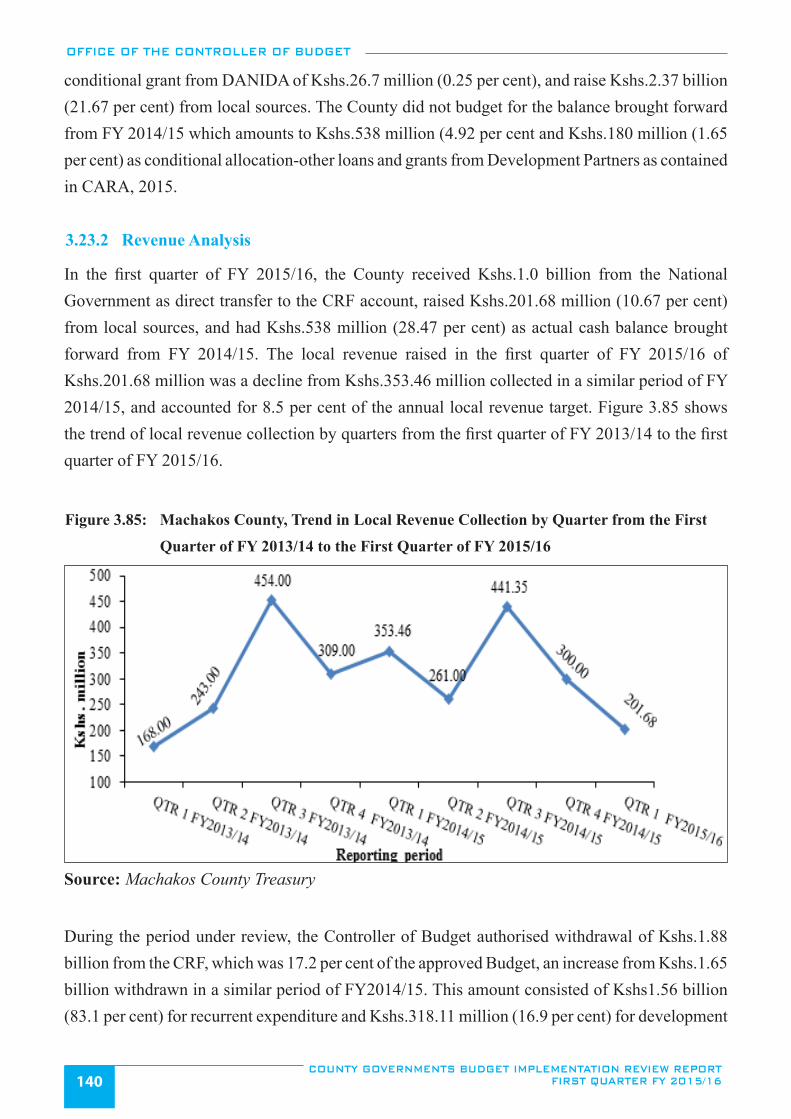
OFFICE OF THE CONTROLLER OF BUDGET
COUNTY GOVERNMENTS BUDGET IMPLEMENTATION REVIEW REPORT FIRST QUARTER FY 2015/16140
conditional grant from DANIDA of Kshs.26.7 million (0.25 per cent), and raise Kshs.2.37 billion (21.67 per cent) from local sources. The County did not budget for the balance brought forward from FY 2014/15 which amounts to Kshs.538 million (4.92 per cent and Kshs.180 million (1.65 per cent) as conditional allocation-other loans and grants from Development Partners as contained in CARA, 2015.
3.23.2 Revenue Analysis
In the first quarter of FY 2015/16, the County received Kshs.1.0 billion from the National Government as direct transfer to the CRF account, raised Kshs.201.68 million (10.67 per cent) from local sources, and had Kshs.538 million (28.47 per cent) as actual cash balance brought forward from FY 2014/15. The local revenue raised in the first quarter of FY 2015/16 of Kshs.201.68 million was a decline from Kshs.353.46 million collected in a similar period of FY 2014/15, and accounted for 8.5 per cent of the annual local revenue target. Figure 3.85 shows the trend of local revenue collection by quarters from the first quarter of FY 2013/14 to the first quarter of FY 2015/16.
Figure 3.85: Machakos County, Trend in Local Revenue Collection by Quarter from the First
Quarter of FY 2013/14 to the First Quarter of FY 2015/16
Source: Machakos County Treasury
During the period under review, the Controller of Budget authorised withdrawal of Kshs.1.88 billion from the CRF, which was 17.2 per cent of the approved Budget, an increase from Kshs.1.65 billion withdrawn in a similar period of FY2014/15. This amount consisted of Kshs1.56 billion (83.1 per cent) for recurrent expenditure and Kshs.318.11 million (16.9 per cent) for development
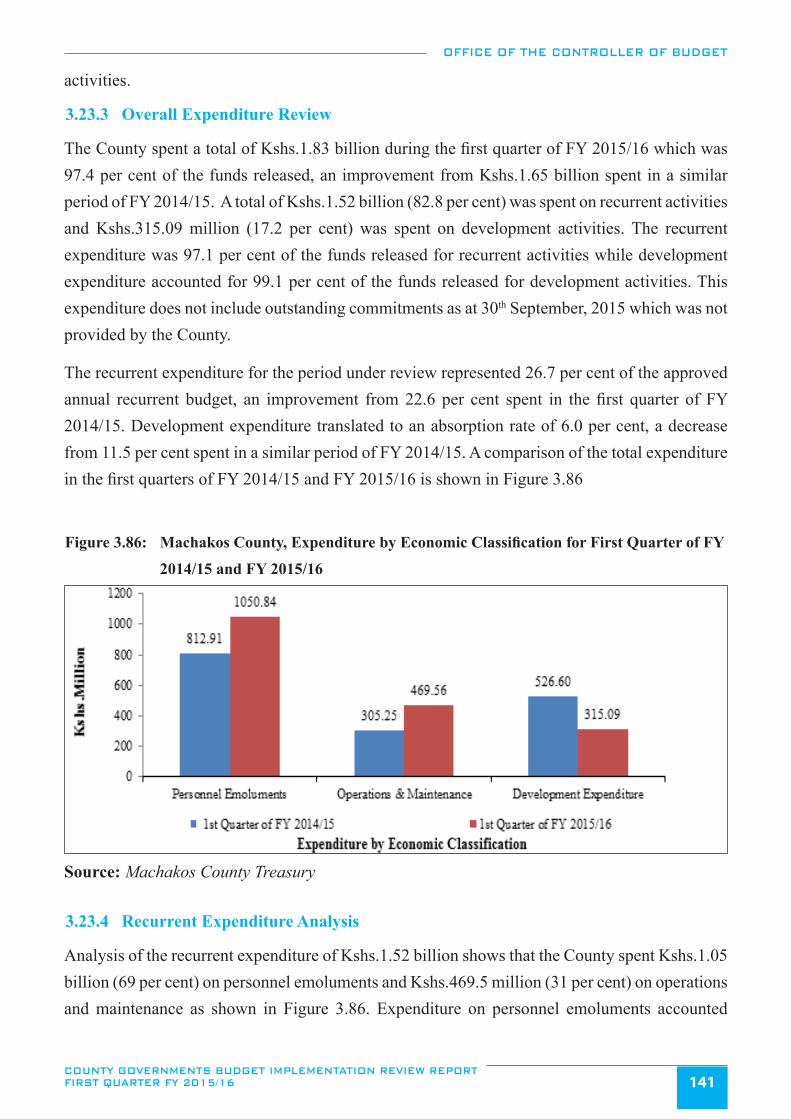
OFFICE OF THE CONTROLLER OF BUDGET
COUNTY GOVERNMENTS BUDGET IMPLEMENTATION REVIEW REPORT FIRST QUARTER FY 2015/16 141
activities.
3.23.3 Overall Expenditure Review
The County spent a total of Kshs.1.83 billion during the first quarter of FY 2015/16 which was 97.4 per cent of the funds released, an improvement from Kshs.1.65 billion spent in a similar period of FY 2014/15. A total of Kshs.1.52 billion (82.8 per cent) was spent on recurrent activities and Kshs.315.09 million (17.2 per cent) was spent on development activities. The recurrent expenditure was 97.1 per cent of the funds released for recurrent activities while development expenditure accounted for 99.1 per cent of the funds released for development activities. This expenditure does not include outstanding commitments as at 30th September, 2015 which was not provided by the County.
The recurrent expenditure for the period under review represented 26.7 per cent of the approved annual recurrent budget, an improvement from 22.6 per cent spent in the first quarter of FY 2014/15. Development expenditure translated to an absorption rate of 6.0 per cent, a decrease from 11.5 per cent spent in a similar period of FY 2014/15. A comparison of the total expenditure in the first quarters of FY 2014/15 and FY 2015/16 is shown in Figure 3.86
Figure 3.86: Machakos County, Expenditure by Economic Classification for First Quarter of FY
2014/15 and FY 2015/16
Source: Machakos County Treasury
3.23.4 Recurrent Expenditure Analysis
Analysis of the recurrent expenditure of Kshs.1.52 billion shows that the County spent Kshs.1.05 billion (69 per cent) on personnel emoluments and Kshs.469.5 million (31 per cent) on operations and maintenance as shown in Figure 3.86. Expenditure on personnel emoluments accounted
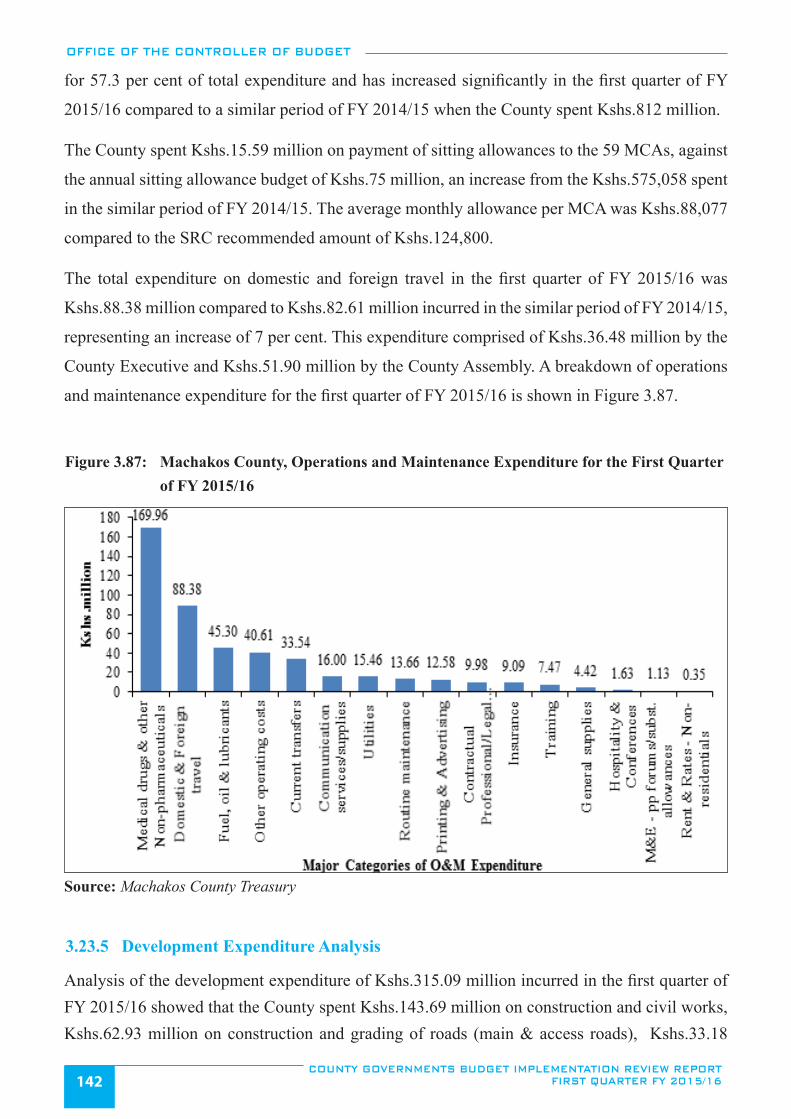
OFFICE OF THE CONTROLLER OF BUDGET
COUNTY GOVERNMENTS BUDGET IMPLEMENTATION REVIEW REPORT FIRST QUARTER FY 2015/16142
for 57.3 per cent of total expenditure and has increased significantly in the first quarter of FY
2015/16 compared to a similar period of FY 2014/15 when the County spent Kshs.812 million.
The County spent Kshs.15.59 million on payment of sitting allowances to the 59 MCAs, against
the annual sitting allowance budget of Kshs.75 million, an increase from the Kshs.575,058 spent
in the similar period of FY 2014/15. The average monthly allowance per MCA was Kshs.88,077
compared to the SRC recommended amount of Kshs.124,800.
The total expenditure on domestic and foreign travel in the first quarter of FY 2015/16 was
Kshs.88.38 million compared to Kshs.82.61 million incurred in the similar period of FY 2014/15,
representing an increase of 7 per cent. This expenditure comprised of Kshs.36.48 million by the
County Executive and Kshs.51.90 million by the County Assembly. A breakdown of operations
and maintenance expenditure for the first quarter of FY 2015/16 is shown in Figure 3.87.
Figure 3.87: Machakos County, Operations and Maintenance Expenditure for the First Quarter of FY 2015/16
Source: Machakos County Treasury
3.23.5 Development Expenditure Analysis
Analysis of the development expenditure of Kshs.315.09 million incurred in the first quarter of FY 2015/16 showed that the County spent Kshs.143.69 million on construction and civil works, Kshs.62.93 million on construction and grading of roads (main & access roads), Kshs.33.18
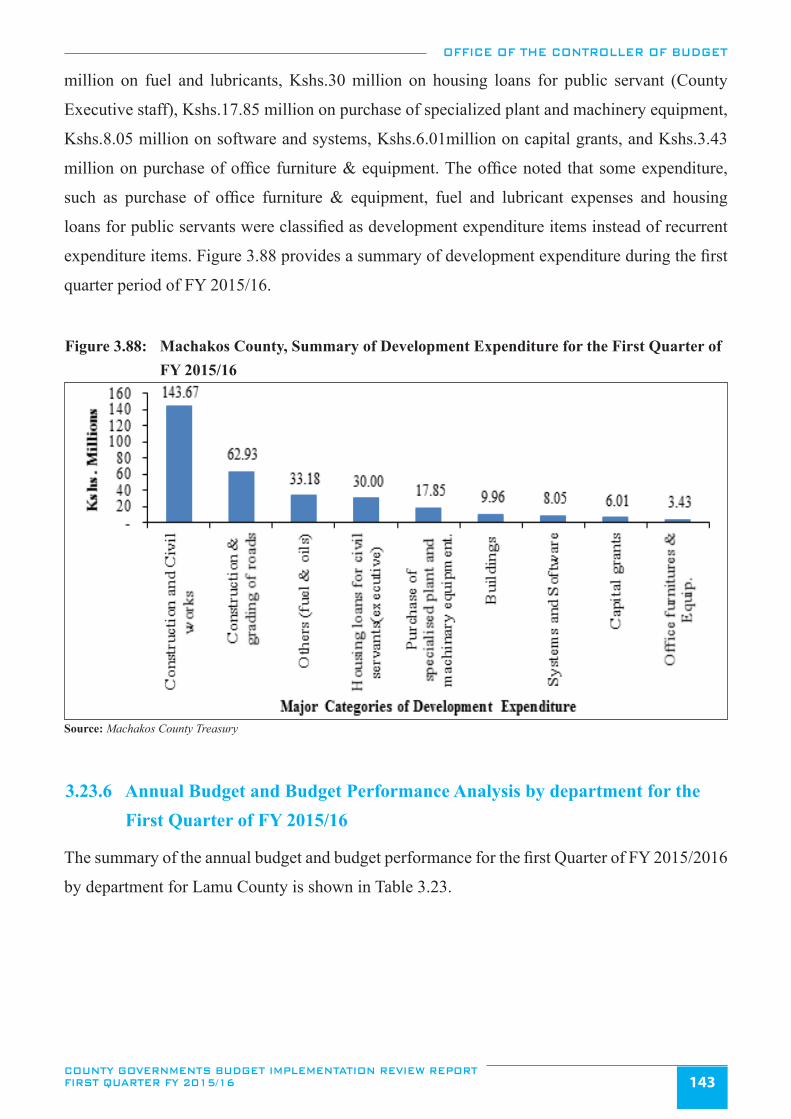
OFFICE OF THE CONTROLLER OF BUDGET
COUNTY GOVERNMENTS BUDGET IMPLEMENTATION REVIEW REPORT FIRST QUARTER FY 2015/16 143
million on fuel and lubricants, Kshs.30 million on housing loans for public servant (County
Executive staff), Kshs.17.85 million on purchase of specialized plant and machinery equipment,
Kshs.8.05 million on software and systems, Kshs.6.01million on capital grants, and Kshs.3.43
million on purchase of office furniture & equipment. The office noted that some expenditure,
such as purchase of office furniture & equipment, fuel and lubricant expenses and housing
loans for public servants were classified as development expenditure items instead of recurrent
expenditure items. Figure 3.88 provides a summary of development expenditure during the first
quarter period of FY 2015/16.
Figure 3.88: Machakos County, Summary of Development Expenditure for the First Quarter of FY 2015/16
Source: Machakos County Treasury
3.23.6 Annual Budget and Budget Performance Analysis by department for the First Quarter of FY 2015/16
The summary of the annual budget and budget performance for the first Quarter of FY 2015/2016
by department for Lamu County is shown in Table 3.23.
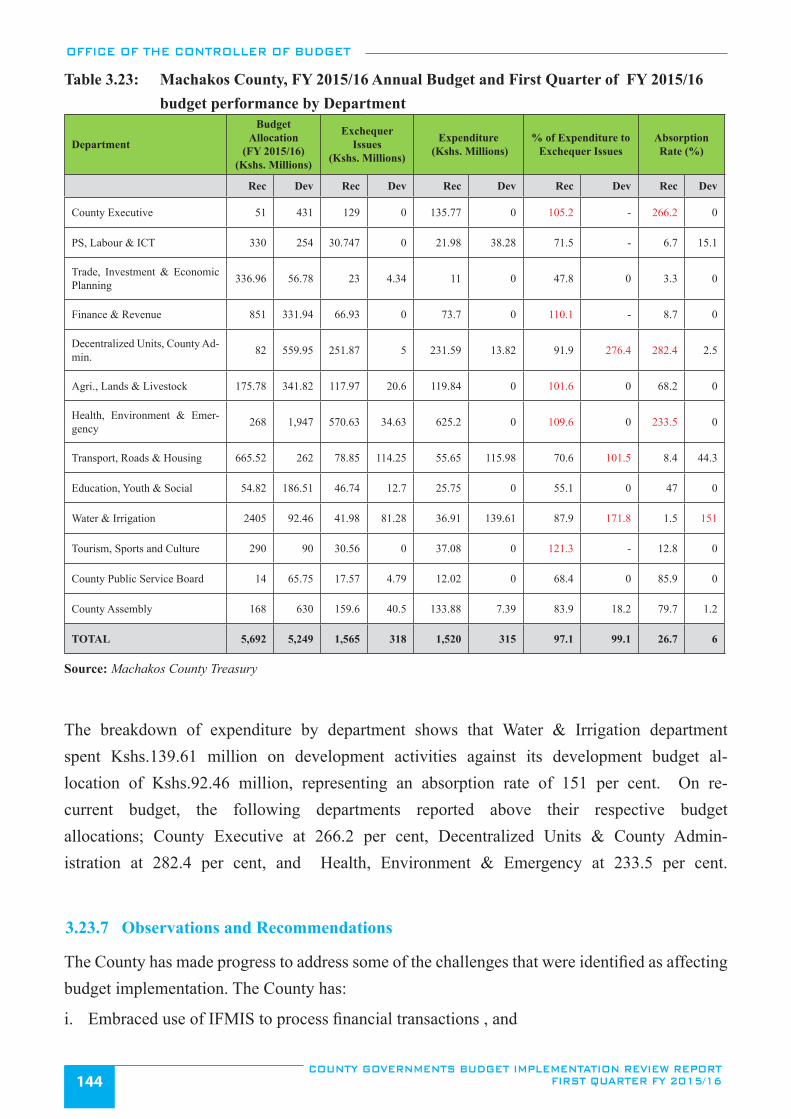
OFFICE OF THE CONTROLLER OF BUDGET
COUNTY GOVERNMENTS BUDGET IMPLEMENTATION REVIEW REPORT FIRST QUARTER FY 2015/16144
Table 3.23: Machakos County, FY 2015/16 Annual Budget and First Quarter of FY 2015/16 budget performance by Department
Department
Budget Allocation
(FY 2015/16) (Kshs. Millions)
Exchequer Issues
(Kshs. Millions)
Expenditure (Kshs. Millions)
% of Expenditure to Exchequer Issues
Absorption Rate (%)
Rec Dev Rec Dev Rec Dev Rec Dev Rec Dev
County Executive 51 431 129 0 135.77 0 105.2 - 266.2 0
PS, Labour & ICT 330 254 30.747 0 21.98 38.28 71.5 - 6.7 15.1
Trade, Investment & Economic Planning 336.96 56.78 23 4.34 11 0 47.8 0 3.3 0
Finance & Revenue 851 331.94 66.93 0 73.7 0 110.1 - 8.7 0
Decentralized Units, County Ad-min. 82 559.95 251.87 5 231.59 13.82 91.9 276.4 282.4 2.5
Agri., Lands & Livestock 175.78 341.82 117.97 20.6 119.84 0 101.6 0 68.2 0
Health, Environment & Emer-gency 268 1,947 570.63 34.63 625.2 0 109.6 0 233.5 0
Transport, Roads & Housing 665.52 262 78.85 114.25 55.65 115.98 70.6 101.5 8.4 44.3
Education, Youth & Social 54.82 186.51 46.74 12.7 25.75 0 55.1 0 47 0
Water & Irrigation 2405 92.46 41.98 81.28 36.91 139.61 87.9 171.8 1.5 151
Tourism, Sports and Culture 290 90 30.56 0 37.08 0 121.3 - 12.8 0
County Public Service Board 14 65.75 17.57 4.79 12.02 0 68.4 0 85.9 0
County Assembly 168 630 159.6 40.5 133.88 7.39 83.9 18.2 79.7 1.2
TOTAL 5,692 5,249 1,565 318 1,520 315 97.1 99.1 26.7 6
Source: Machakos County Treasury
The breakdown of expenditure by department shows that Water & Irrigation department spent Kshs.139.61 million on development activities against its development budget al-location of Kshs.92.46 million, representing an absorption rate of 151 per cent. On re-current budget, the following departments reported above their respective budget allocations; County Executive at 266.2 per cent, Decentralized Units & County Admin-istration at 282.4 per cent, and Health, Environment & Emergency at 233.5 per cent.
3.23.7 Observations and Recommendations
The County has made progress to address some of the challenges that were identified as affecting budget implementation. The County has:
i. Embraced use of IFMIS to process financial transactions , and
OFFICE OF THE CONTROLLER OF BUDGET
COUNTY GOVERNMENTS BUDGET IMPLEMENTATION REVIEW REPORT FIRST QUARTER FY 2015/16 145
ii. Improved in technical staff capacity through training.
The challenges that continued to hamper effective budget implementation in the first quarter of FY 2015/16 were: i. Underperformance in local revenue collection which stood at 7.5 per cent of the annual tar-
get. This implies that some budgeted activities may not be implemented due to inadequate funding.
ii. A huge wage bill, which may not be sustainable.iii. Lack of Internal Audit Committee contrary to Section 155(5) of the PFM Act, 2012.
The County should implement the following recommendations in order to improve budget execution:
i. The County Treasury should devise strategies to enhance revenue collection. ii. The County should liaise with the National Government to seek a solution to the huge wage
bill. iii. The County Treasury should establish an Internal Audit Committee as per Section 155(5) of
the PFM Act, 2012 in order to enhance public finance management.
3.24 Makueni County
3.24.1 Overview of the FY 2015/16 County Budget
The Approved Budget Estimates for Makueni FY 2015/16 amounts to Kshs.9.44 billion comprising of Kshs.4.47 billion (47.4 per cent) for recurrent expenditure and Kshs.4.97 billion (52.6 per cent) for development expenditure.
In order to finance this budget, the County expects to receive Kshs.5.96 billion (63 per cent) as transfers from the National Government, collect Kshs.400 million (4.2 per cent) from local sources, receive DANIDA conditional grant amounting to Kshs.24.13 million (0.3 per cent), Kshs.20.61 million (0.2 per cent) as compensation for user fees forgone, Kshs.75.83 million (0.8 per cent) as conditional allocation for the road maintenance levy, Kshs.80.8 million (0.9 per cent) as conditional allocation for free maternal health care, Kshs.95.74 million (1 per cent) for leasing of medical equipment, Kshs.220 million (2.3 per cent) as conditional allocation for other loans/grants, Kshs164.23 million (1.7 per cent) conditional allocation from loans and grants from development partners, and Kshs.2.42 billion (25.6 per cent) as balance brought forward from FY 2014/15.
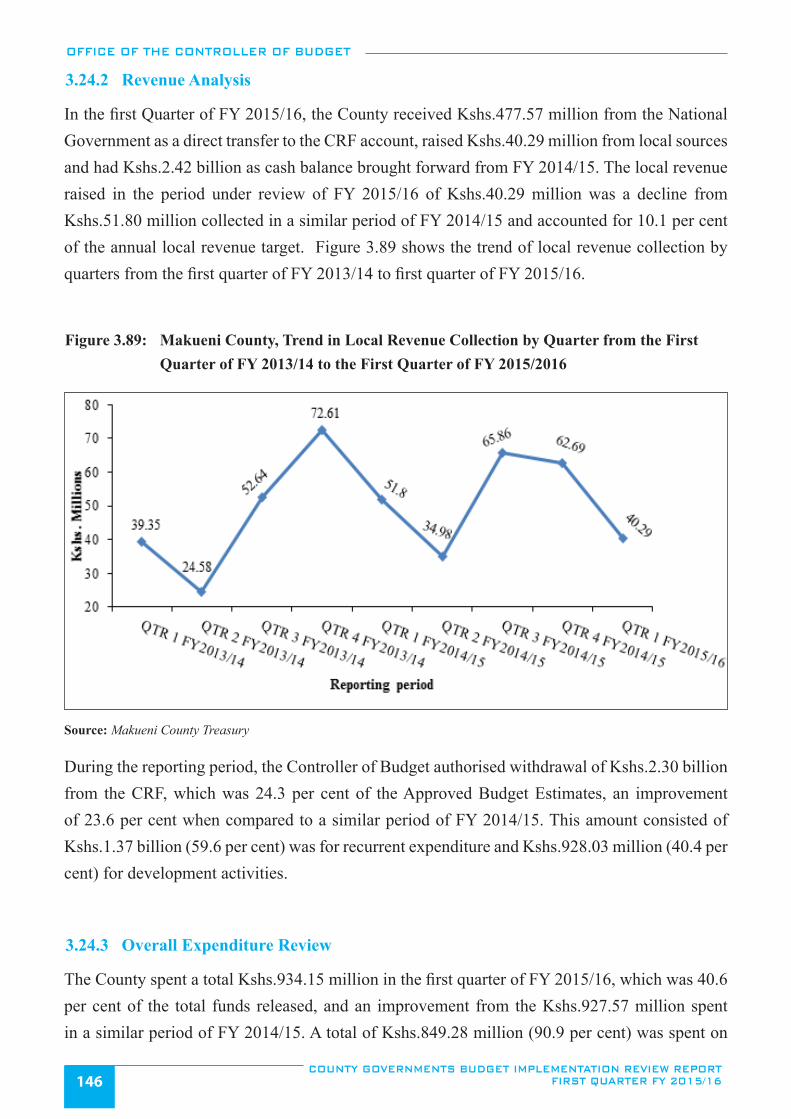
OFFICE OF THE CONTROLLER OF BUDGET
COUNTY GOVERNMENTS BUDGET IMPLEMENTATION REVIEW REPORT FIRST QUARTER FY 2015/16146
3.24.2 Revenue Analysis
In the first Quarter of FY 2015/16, the County received Kshs.477.57 million from the National Government as a direct transfer to the CRF account, raised Kshs.40.29 million from local sources and had Kshs.2.42 billion as cash balance brought forward from FY 2014/15. The local revenue raised in the period under review of FY 2015/16 of Kshs.40.29 million was a decline from Kshs.51.80 million collected in a similar period of FY 2014/15 and accounted for 10.1 per cent of the annual local revenue target. Figure 3.89 shows the trend of local revenue collection by quarters from the first quarter of FY 2013/14 to first quarter of FY 2015/16.
Figure 3.89: Makueni County, Trend in Local Revenue Collection by Quarter from the First Quarter of FY 2013/14 to the First Quarter of FY 2015/2016
Source: Makueni County Treasury
During the reporting period, the Controller of Budget authorised withdrawal of Kshs.2.30 billion from the CRF, which was 24.3 per cent of the Approved Budget Estimates, an improvement of 23.6 per cent when compared to a similar period of FY 2014/15. This amount consisted of Kshs.1.37 billion (59.6 per cent) was for recurrent expenditure and Kshs.928.03 million (40.4 per cent) for development activities.
3.24.3 Overall Expenditure Review
The County spent a total Kshs.934.15 million in the first quarter of FY 2015/16, which was 40.6 per cent of the total funds released, and an improvement from the Kshs.927.57 million spent in a similar period of FY 2014/15. A total of Kshs.849.28 million (90.9 per cent) was spent on
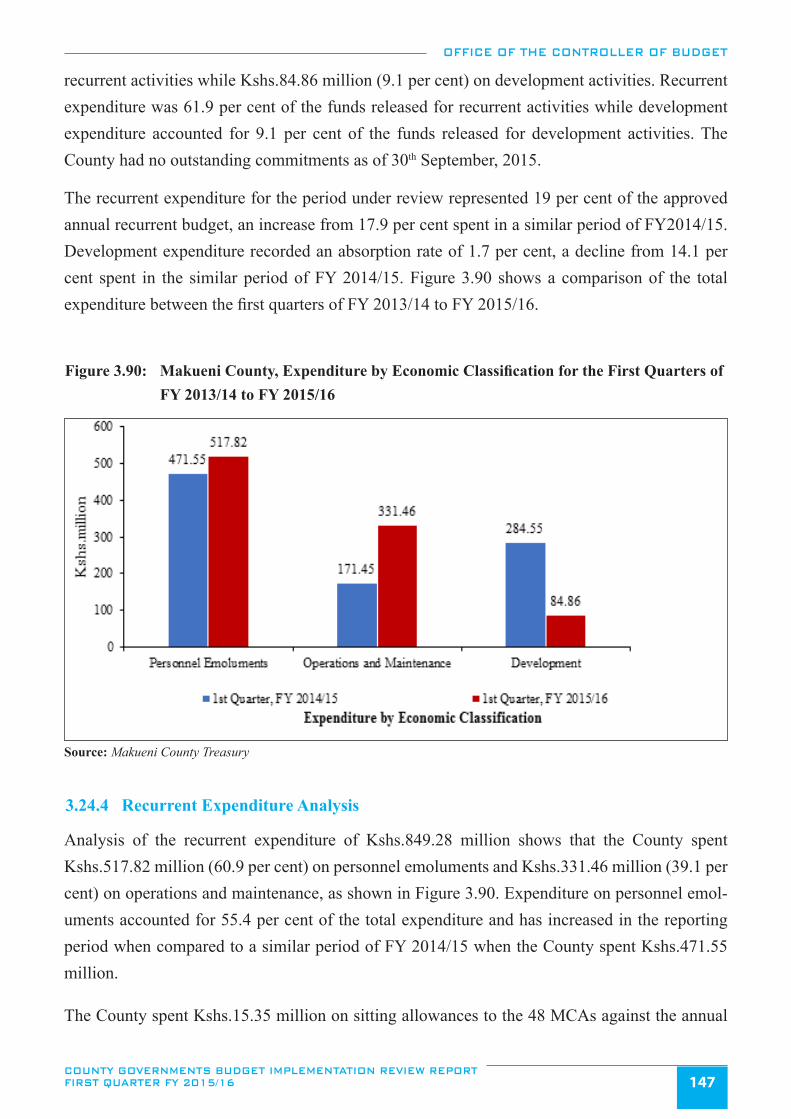
OFFICE OF THE CONTROLLER OF BUDGET
COUNTY GOVERNMENTS BUDGET IMPLEMENTATION REVIEW REPORT FIRST QUARTER FY 2015/16 147
recurrent activities while Kshs.84.86 million (9.1 per cent) on development activities. Recurrent expenditure was 61.9 per cent of the funds released for recurrent activities while development expenditure accounted for 9.1 per cent of the funds released for development activities. The County had no outstanding commitments as of 30th September, 2015.
The recurrent expenditure for the period under review represented 19 per cent of the approved annual recurrent budget, an increase from 17.9 per cent spent in a similar period of FY2014/15. Development expenditure recorded an absorption rate of 1.7 per cent, a decline from 14.1 per cent spent in the similar period of FY 2014/15. Figure 3.90 shows a comparison of the total expenditure between the first quarters of FY 2013/14 to FY 2015/16.
Figure 3.90: Makueni County, Expenditure by Economic Classification for the First Quarters of FY 2013/14 to FY 2015/16
Source: Makueni County Treasury
3.24.4 Recurrent Expenditure Analysis
Analysis of the recurrent expenditure of Kshs.849.28 million shows that the County spent Kshs.517.82 million (60.9 per cent) on personnel emoluments and Kshs.331.46 million (39.1 per cent) on operations and maintenance, as shown in Figure 3.90. Expenditure on personnel emol-uments accounted for 55.4 per cent of the total expenditure and has increased in the reporting period when compared to a similar period of FY 2014/15 when the County spent Kshs.471.55 million.
The County spent Kshs.15.35 million on sitting allowances to the 48 MCAs against the annual
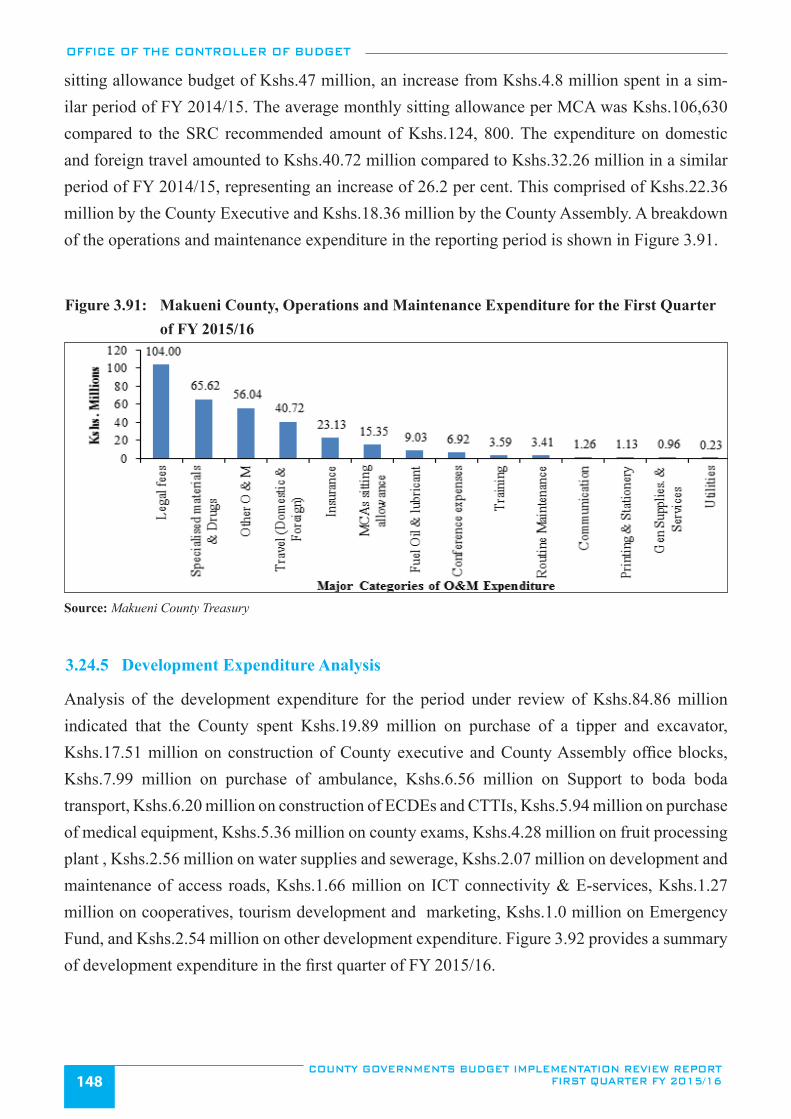
OFFICE OF THE CONTROLLER OF BUDGET
COUNTY GOVERNMENTS BUDGET IMPLEMENTATION REVIEW REPORT FIRST QUARTER FY 2015/16148
sitting allowance budget of Kshs.47 million, an increase from Kshs.4.8 million spent in a sim-ilar period of FY 2014/15. The average monthly sitting allowance per MCA was Kshs.106,630 compared to the SRC recommended amount of Kshs.124, 800. The expenditure on domestic and foreign travel amounted to Kshs.40.72 million compared to Kshs.32.26 million in a similar period of FY 2014/15, representing an increase of 26.2 per cent. This comprised of Kshs.22.36 million by the County Executive and Kshs.18.36 million by the County Assembly. A breakdown of the operations and maintenance expenditure in the reporting period is shown in Figure 3.91.
Figure 3.91: Makueni County, Operations and Maintenance Expenditure for the First Quarter of FY 2015/16
Source: Makueni County Treasury
3.24.5 Development Expenditure Analysis
Analysis of the development expenditure for the period under review of Kshs.84.86 million indicated that the County spent Kshs.19.89 million on purchase of a tipper and excavator, Kshs.17.51 million on construction of County executive and County Assembly office blocks, Kshs.7.99 million on purchase of ambulance, Kshs.6.56 million on Support to boda boda transport, Kshs.6.20 million on construction of ECDEs and CTTIs, Kshs.5.94 million on purchase of medical equipment, Kshs.5.36 million on county exams, Kshs.4.28 million on fruit processing plant , Kshs.2.56 million on water supplies and sewerage, Kshs.2.07 million on development and maintenance of access roads, Kshs.1.66 million on ICT connectivity & E-services, Kshs.1.27 million on cooperatives, tourism development and marketing, Kshs.1.0 million on Emergency Fund, and Kshs.2.54 million on other development expenditure. Figure 3.92 provides a summary of development expenditure in the first quarter of FY 2015/16.
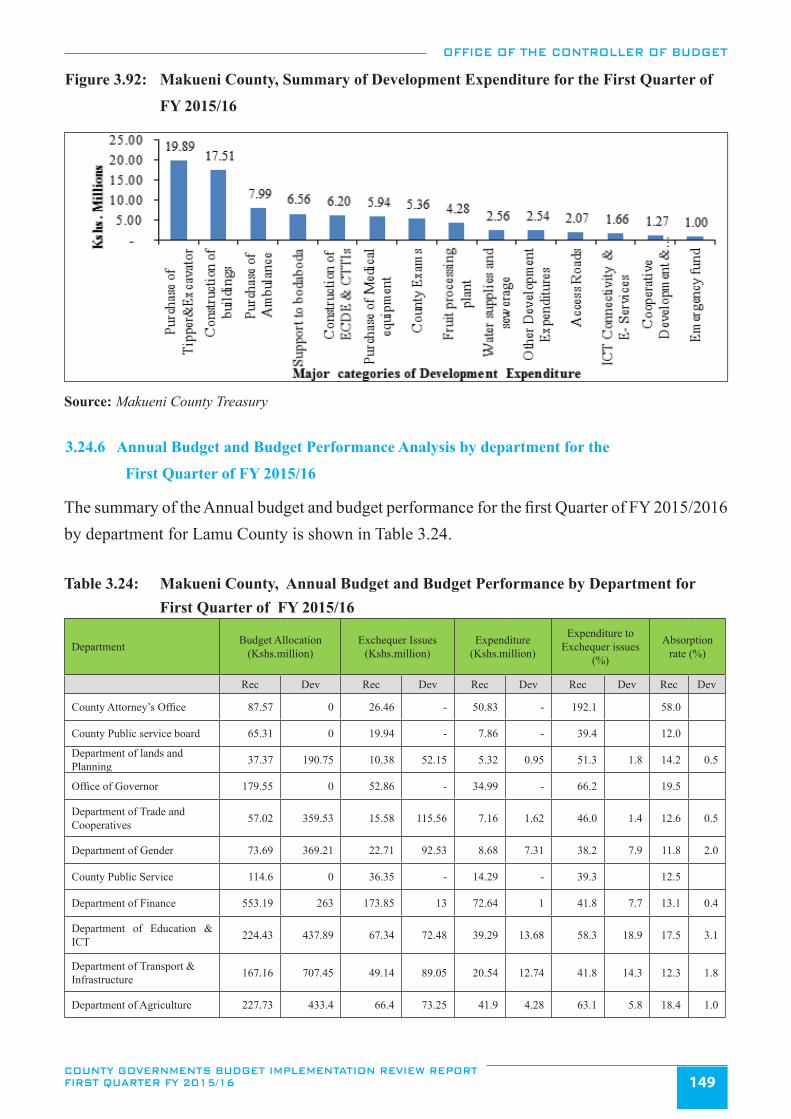
OFFICE OF THE CONTROLLER OF BUDGET
COUNTY GOVERNMENTS BUDGET IMPLEMENTATION REVIEW REPORT FIRST QUARTER FY 2015/16 149
Figure 3.92: Makueni County, Summary of Development Expenditure for the First Quarter of
FY 2015/16
Source: Makueni County Treasury
3.24.6 Annual Budget and Budget Performance Analysis by department for the
First Quarter of FY 2015/16
The summary of the Annual budget and budget performance for the first Quarter of FY 2015/2016 by department for Lamu County is shown in Table 3.24.
Table 3.24: Makueni County, Annual Budget and Budget Performance by Department for First Quarter of FY 2015/16
Department Budget Allocation (Kshs.million)
Exchequer Issues (Kshs.million)
Expenditure (Kshs.million)
Expenditure to Exchequer issues
(%)
Absorption rate (%)
Rec Dev Rec Dev Rec Dev Rec Dev Rec Dev
County Attorney’s Office 87.57 0 26.46 - 50.83 - 192.1 58.0
County Public service board 65.31 0 19.94 - 7.86 - 39.4 12.0
Department of lands and Planning 37.37 190.75 10.38 52.15 5.32 0.95 51.3 1.8 14.2 0.5
Office of Governor 179.55 0 52.86 - 34.99 - 66.2 19.5
Department of Trade and Cooperatives 57.02 359.53 15.58 115.56 7.16 1.62 46.0 1.4 12.6 0.5
Department of Gender 73.69 369.21 22.71 92.53 8.68 7.31 38.2 7.9 11.8 2.0
County Public Service 114.6 0 36.35 - 14.29 - 39.3 12.5
Department of Finance 553.19 263 173.85 13 72.64 1 41.8 7.7 13.1 0.4
Department of Education & ICT 224.43 437.89 67.34 72.48 39.29 13.68 58.3 18.9 17.5 3.1
Department of Transport & Infrastructure 167.16 707.45 49.14 89.05 20.54 12.74 41.8 14.3 12.3 1.8
Department of Agriculture 227.73 433.4 66.4 73.25 41.9 4.28 63.1 5.8 18.4 1.0
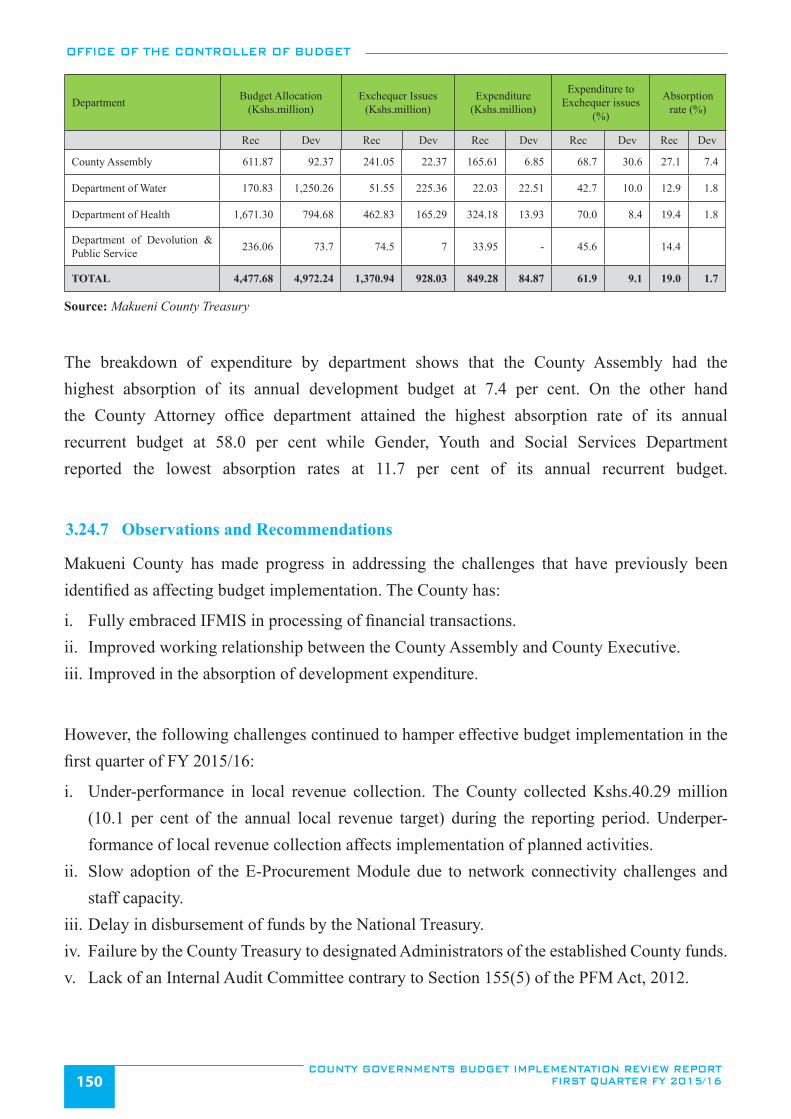
OFFICE OF THE CONTROLLER OF BUDGET
COUNTY GOVERNMENTS BUDGET IMPLEMENTATION REVIEW REPORT FIRST QUARTER FY 2015/16150
County Assembly 611.87 92.37 241.05 22.37 165.61 6.85 68.7 30.6 27.1 7.4
Department of Water 170.83 1,250.26 51.55 225.36 22.03 22.51 42.7 10.0 12.9 1.8
Department of Health 1,671.30 794.68 462.83 165.29 324.18 13.93 70.0 8.4 19.4 1.8
Department of Devolution & Public Service 236.06 73.7 74.5 7 33.95 - 45.6 14.4
TOTAL 4,477.68 4,972.24 1,370.94 928.03 849.28 84.87 61.9 9.1 19.0 1.7
Source: Makueni County Treasury
The breakdown of expenditure by department shows that the County Assembly had the highest absorption of its annual development budget at 7.4 per cent. On the other hand the County Attorney office department attained the highest absorption rate of its annual recurrent budget at 58.0 per cent while Gender, Youth and Social Services Department reported the lowest absorption rates at 11.7 per cent of its annual recurrent budget.
3.24.7 Observations and Recommendations
Makueni County has made progress in addressing the challenges that have previously been identified as affecting budget implementation. The County has:
i. Fully embraced IFMIS in processing of financial transactions.ii. Improved working relationship between the County Assembly and County Executive.iii. Improved in the absorption of development expenditure.
However, the following challenges continued to hamper effective budget implementation in the first quarter of FY 2015/16:
i. Under-performance in local revenue collection. The County collected Kshs.40.29 million (10.1 per cent of the annual local revenue target) during the reporting period. Underper-formance of local revenue collection affects implementation of planned activities.
ii. Slow adoption of the E-Procurement Module due to network connectivity challenges and staff capacity.
iii. Delay in disbursement of funds by the National Treasury.iv. Failure by the County Treasury to designated Administrators of the established County funds.v. Lack of an Internal Audit Committee contrary to Section 155(5) of the PFM Act, 2012.
Department Budget Allocation (Kshs.million)
Exchequer Issues (Kshs.million)
Expenditure (Kshs.million)
Expenditure to Exchequer issues
(%)
Absorption rate (%)
Rec Dev Rec Dev Rec Dev Rec Dev Rec Dev
OFFICE OF THE CONTROLLER OF BUDGET
COUNTY GOVERNMENTS BUDGET IMPLEMENTATION REVIEW REPORT FIRST QUARTER FY 2015/16 151
The County should implement the following recommendations in order to improve budget execution:
i. The County Treasury should devise strategies to enhance local revenue collectionii. The County should enhance technical capacity in E-procurement through training and also
liaise with National Treasury to address the network challenges. iii. The County Treasury should liaise with the National Treasury to ensure that funds are dis-
bursed in a timely manner as per the gazetted disbursement schedule. This will enhance smooth budget implementation.
iv. The Head of County Treasury should designate an Administrator for each established County Fund in line with Section 116 of the PFM act 2012.
v. The County Treasury should establish an Internal Audit Committee as per Section 155(5) of the PFM Act, 2012 to enhance prudent public financial management.
3.25 Mandera County
3.25.1 Overview of FY 2015/16 the Budget
The approved Budget for Mandera County for FY 2015/16, amounts to Kshs.11.44 billion with Kshs.4.55 billion (39.8 per cent) allocated for recurrent expenditure and Kshs.6.88 billion (60.2 per cent) for development expenditure. In order to finance the budget, the County expects to receive Kshs.8.96 billion (78.3 per cent) transfers from the National Government, collect Kshs.270 million (2.4 per cent) from local sources, Kshs.98.64 million (0.9 per cent) as a conditional allocations including from DANIDA, and Kshs.2.11 billion (18.5 per cent) as projected cash balance from FY 2014/15. However, the County did not budget for the additional conditional grants from the National Government amounting to Kshs.209.51 million as detailed in CARA, 2015.
3.25.2 Revenue Analysis
In the first quarter of FY 2015/16, the County received Kshs.716.47 million from the National Government as direct transfer to CRF account, raised Kshs.18.46 million from local sources, and had Kshs.2.11 billion as actual cash balance brought forward from FY 2014/15. The local revenue raised in the period under review was Kshs.18.46 million, a marginal decrease from Kshs.18.99 million registered in a similar period of FY 2014/15 and accounted for 6.8 per cent of the annual local revenue target. Figure 3.93 shows the trend of local revenue collection by quarters from the first quarter of FY 2013/14 to the first quarter of FY 2015/16.
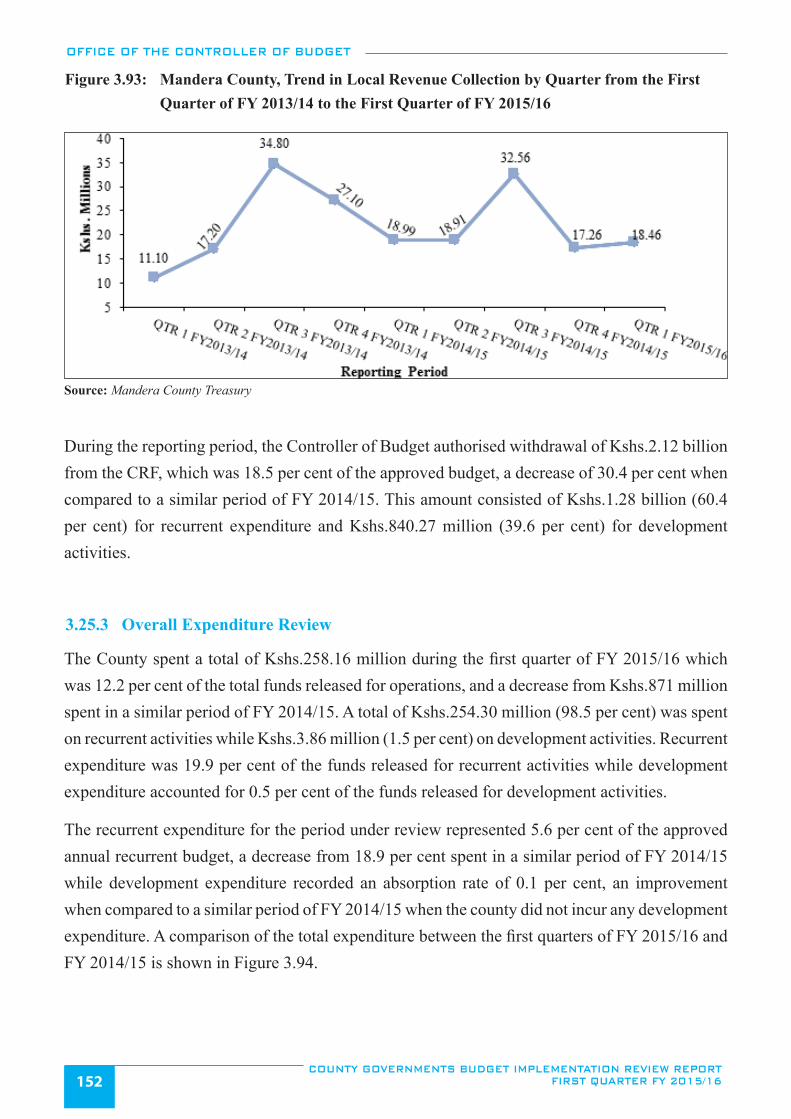
OFFICE OF THE CONTROLLER OF BUDGET
COUNTY GOVERNMENTS BUDGET IMPLEMENTATION REVIEW REPORT FIRST QUARTER FY 2015/16152
Figure 3.93: Mandera County, Trend in Local Revenue Collection by Quarter from the First Quarter of FY 2013/14 to the First Quarter of FY 2015/16
Source: Mandera County Treasury
During the reporting period, the Controller of Budget authorised withdrawal of Kshs.2.12 billion from the CRF, which was 18.5 per cent of the approved budget, a decrease of 30.4 per cent when compared to a similar period of FY 2014/15. This amount consisted of Kshs.1.28 billion (60.4 per cent) for recurrent expenditure and Kshs.840.27 million (39.6 per cent) for development activities.
3.25.3 Overall Expenditure Review
The County spent a total of Kshs.258.16 million during the first quarter of FY 2015/16 which was 12.2 per cent of the total funds released for operations, and a decrease from Kshs.871 million spent in a similar period of FY 2014/15. A total of Kshs.254.30 million (98.5 per cent) was spent on recurrent activities while Kshs.3.86 million (1.5 per cent) on development activities. Recurrent expenditure was 19.9 per cent of the funds released for recurrent activities while development expenditure accounted for 0.5 per cent of the funds released for development activities.
The recurrent expenditure for the period under review represented 5.6 per cent of the approved annual recurrent budget, a decrease from 18.9 per cent spent in a similar period of FY 2014/15 while development expenditure recorded an absorption rate of 0.1 per cent, an improvement when compared to a similar period of FY 2014/15 when the county did not incur any development expenditure. A comparison of the total expenditure between the first quarters of FY 2015/16 and FY 2014/15 is shown in Figure 3.94.
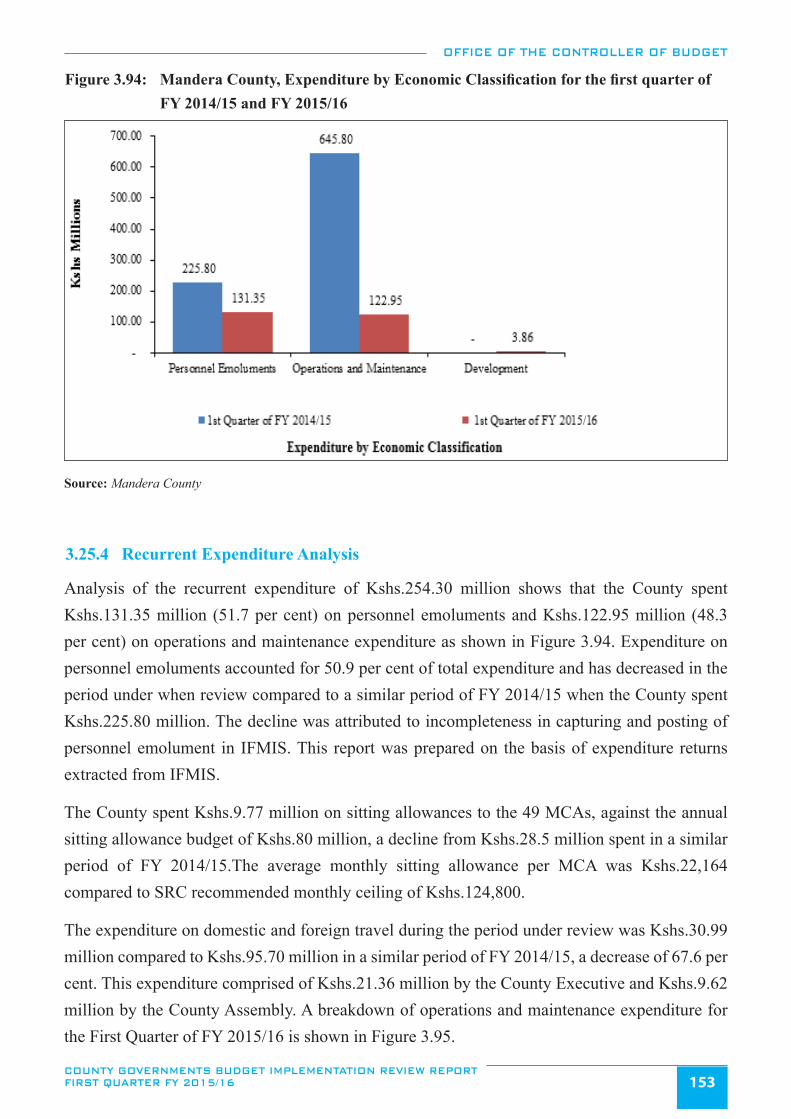
OFFICE OF THE CONTROLLER OF BUDGET
COUNTY GOVERNMENTS BUDGET IMPLEMENTATION REVIEW REPORT FIRST QUARTER FY 2015/16 153
Figure 3.94: Mandera County, Expenditure by Economic Classification for the first quarter of FY 2014/15 and FY 2015/16
Source: Mandera County
3.25.4 Recurrent Expenditure Analysis
Analysis of the recurrent expenditure of Kshs.254.30 million shows that the County spent Kshs.131.35 million (51.7 per cent) on personnel emoluments and Kshs.122.95 million (48.3 per cent) on operations and maintenance expenditure as shown in Figure 3.94. Expenditure on personnel emoluments accounted for 50.9 per cent of total expenditure and has decreased in the period under when review compared to a similar period of FY 2014/15 when the County spent Kshs.225.80 million. The decline was attributed to incompleteness in capturing and posting of personnel emolument in IFMIS. This report was prepared on the basis of expenditure returns extracted from IFMIS.
The County spent Kshs.9.77 million on sitting allowances to the 49 MCAs, against the annual sitting allowance budget of Kshs.80 million, a decline from Kshs.28.5 million spent in a similar period of FY 2014/15.The average monthly sitting allowance per MCA was Kshs.22,164 compared to SRC recommended monthly ceiling of Kshs.124,800.
The expenditure on domestic and foreign travel during the period under review was Kshs.30.99 million compared to Kshs.95.70 million in a similar period of FY 2014/15, a decrease of 67.6 per cent. This expenditure comprised of Kshs.21.36 million by the County Executive and Kshs.9.62 million by the County Assembly. A breakdown of operations and maintenance expenditure for the First Quarter of FY 2015/16 is shown in Figure 3.95.
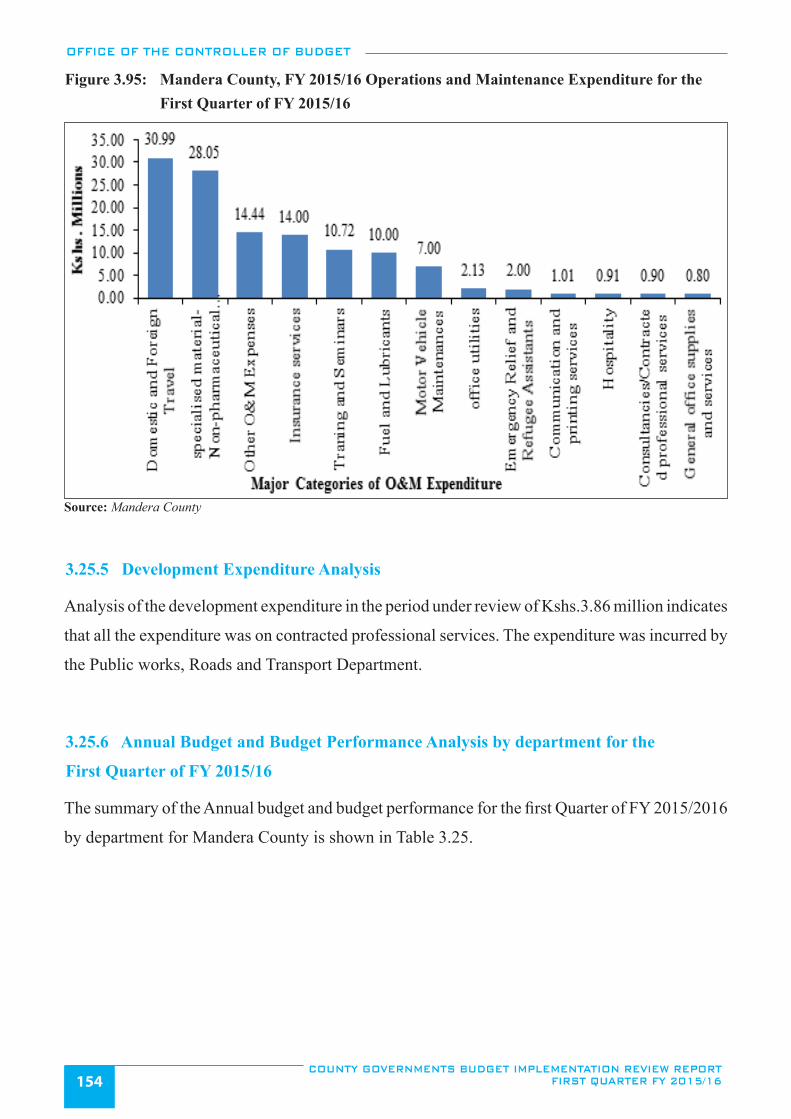
OFFICE OF THE CONTROLLER OF BUDGET
COUNTY GOVERNMENTS BUDGET IMPLEMENTATION REVIEW REPORT FIRST QUARTER FY 2015/16154
Figure 3.95: Mandera County, FY 2015/16 Operations and Maintenance Expenditure for the First Quarter of FY 2015/16
Source: Mandera County
3.25.5 Development Expenditure Analysis
Analysis of the development expenditure in the period under review of Kshs.3.86 million indicates
that all the expenditure was on contracted professional services. The expenditure was incurred by
the Public works, Roads and Transport Department.
3.25.6 Annual Budget and Budget Performance Analysis by department for the
First Quarter of FY 2015/16
The summary of the Annual budget and budget performance for the first Quarter of FY 2015/2016
by department for Mandera County is shown in Table 3.25.
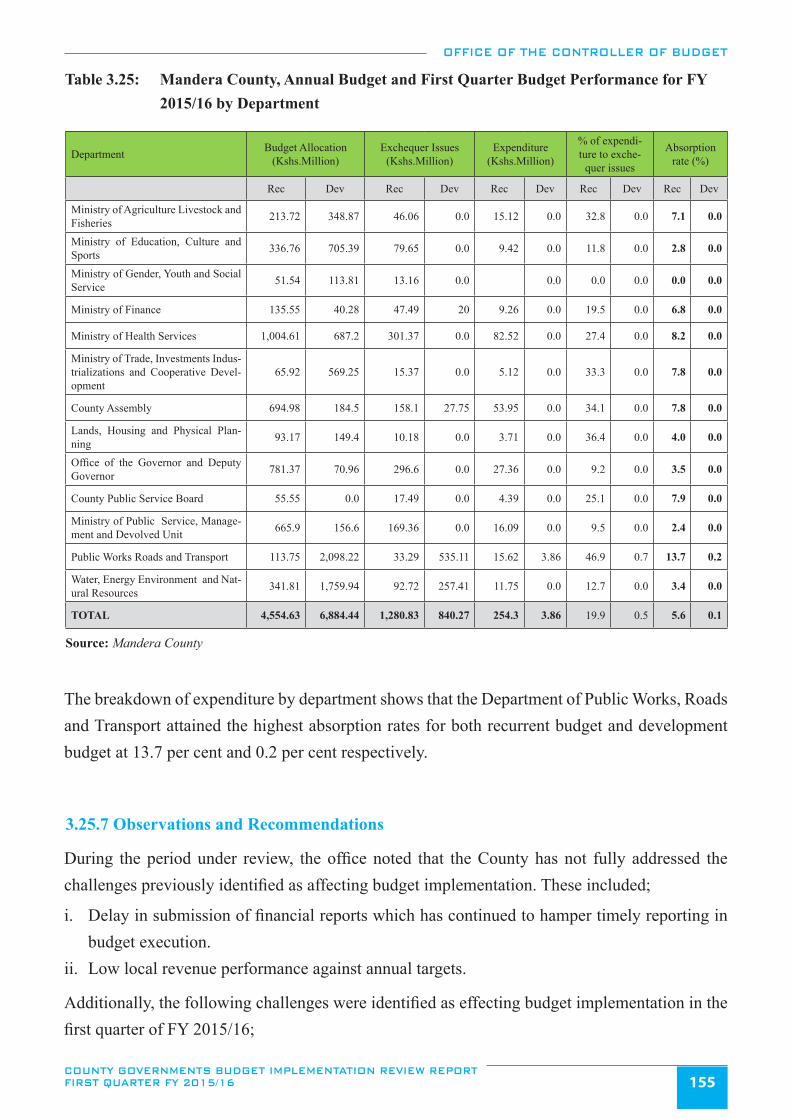
OFFICE OF THE CONTROLLER OF BUDGET
COUNTY GOVERNMENTS BUDGET IMPLEMENTATION REVIEW REPORT FIRST QUARTER FY 2015/16 155
Table 3.25: Mandera County, Annual Budget and First Quarter Budget Performance for FY 2015/16 by Department
Department Budget Allocation (Kshs.Million)
Exchequer Issues (Kshs.Million)
Expenditure (Kshs.Million)
% of expendi-ture to exche-
quer issues
Absorption rate (%)
Rec Dev Rec Dev Rec Dev Rec Dev Rec Dev
Ministry of Agriculture Livestock and Fisheries 213.72 348.87 46.06 0.0 15.12 0.0 32.8 0.0 7.1 0.0
Ministry of Education, Culture and Sports 336.76 705.39 79.65 0.0 9.42 0.0 11.8 0.0 2.8 0.0
Ministry of Gender, Youth and Social Service 51.54 113.81 13.16 0.0 0.0 0.0 0.0 0.0 0.0
Ministry of Finance 135.55 40.28 47.49 20 9.26 0.0 19.5 0.0 6.8 0.0
Ministry of Health Services 1,004.61 687.2 301.37 0.0 82.52 0.0 27.4 0.0 8.2 0.0
Ministry of Trade, Investments Indus-trializations and Cooperative Devel-opment
65.92 569.25 15.37 0.0 5.12 0.0 33.3 0.0 7.8 0.0
County Assembly 694.98 184.5 158.1 27.75 53.95 0.0 34.1 0.0 7.8 0.0
Lands, Housing and Physical Plan-ning 93.17 149.4 10.18 0.0 3.71 0.0 36.4 0.0 4.0 0.0
Office of the Governor and Deputy Governor 781.37 70.96 296.6 0.0 27.36 0.0 9.2 0.0 3.5 0.0
County Public Service Board 55.55 0.0 17.49 0.0 4.39 0.0 25.1 0.0 7.9 0.0
Ministry of Public Service, Manage-ment and Devolved Unit 665.9 156.6 169.36 0.0 16.09 0.0 9.5 0.0 2.4 0.0
Public Works Roads and Transport 113.75 2,098.22 33.29 535.11 15.62 3.86 46.9 0.7 13.7 0.2
Water, Energy Environment and Nat-ural Resources 341.81 1,759.94 92.72 257.41 11.75 0.0 12.7 0.0 3.4 0.0
TOTAL 4,554.63 6,884.44 1,280.83 840.27 254.3 3.86 19.9 0.5 5.6 0.1
Source: Mandera County
The breakdown of expenditure by department shows that the Department of Public Works, Roads and Transport attained the highest absorption rates for both recurrent budget and development budget at 13.7 per cent and 0.2 per cent respectively.
3.25.7 Observations and Recommendations
During the period under review, the office noted that the County has not fully addressed the challenges previously identified as affecting budget implementation. These included;
i. Delay in submission of financial reports which has continued to hamper timely reporting in budget execution.
ii. Low local revenue performance against annual targets.
Additionally, the following challenges were identified as effecting budget implementation in the first quarter of FY 2015/16;
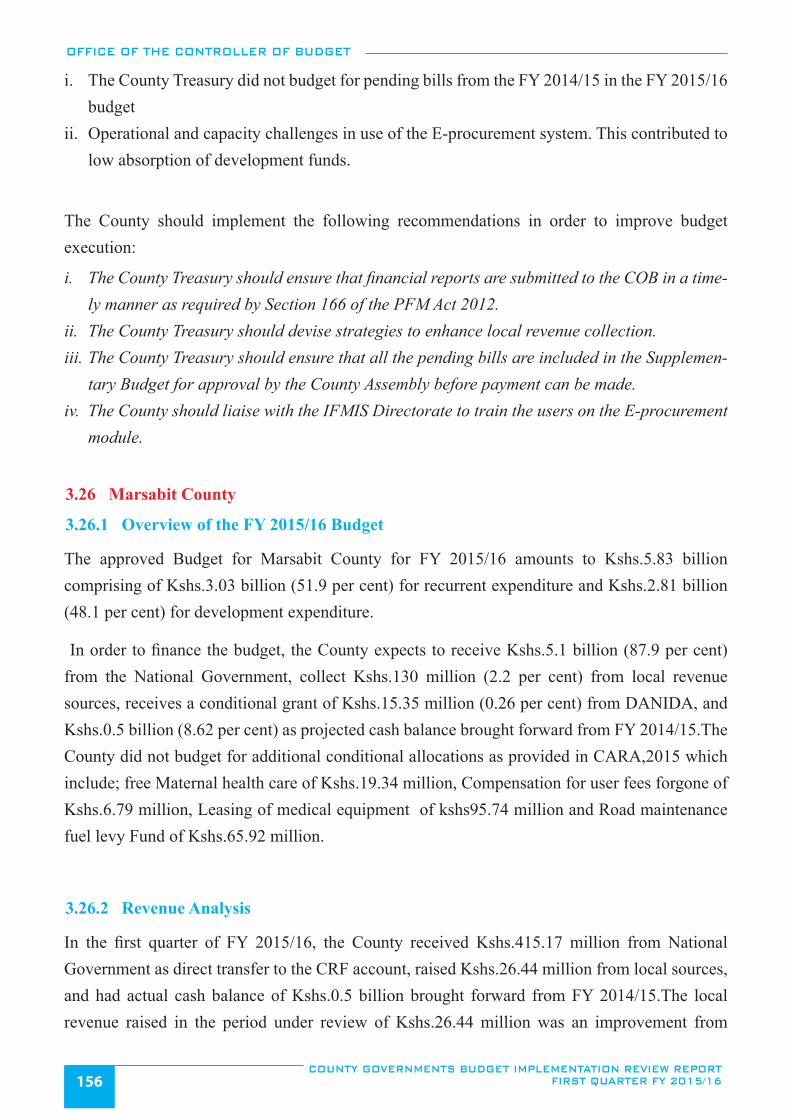
OFFICE OF THE CONTROLLER OF BUDGET
COUNTY GOVERNMENTS BUDGET IMPLEMENTATION REVIEW REPORT FIRST QUARTER FY 2015/16156
i. The County Treasury did not budget for pending bills from the FY 2014/15 in the FY 2015/16 budget
ii. Operational and capacity challenges in use of the E-procurement system. This contributed to low absorption of development funds.
The County should implement the following recommendations in order to improve budget execution:
i. The County Treasury should ensure that financial reports are submitted to the COB in a time-ly manner as required by Section 166 of the PFM Act 2012.
ii. The County Treasury should devise strategies to enhance local revenue collection.iii. The County Treasury should ensure that all the pending bills are included in the Supplemen-
tary Budget for approval by the County Assembly before payment can be made.iv. The County should liaise with the IFMIS Directorate to train the users on the E-procurement
module.
3.26 Marsabit County
3.26.1 Overview of the FY 2015/16 Budget
The approved Budget for Marsabit County for FY 2015/16 amounts to Kshs.5.83 billion comprising of Kshs.3.03 billion (51.9 per cent) for recurrent expenditure and Kshs.2.81 billion (48.1 per cent) for development expenditure.
In order to finance the budget, the County expects to receive Kshs.5.1 billion (87.9 per cent) from the National Government, collect Kshs.130 million (2.2 per cent) from local revenue sources, receives a conditional grant of Kshs.15.35 million (0.26 per cent) from DANIDA, and Kshs.0.5 billion (8.62 per cent) as projected cash balance brought forward from FY 2014/15.The County did not budget for additional conditional allocations as provided in CARA,2015 which include; free Maternal health care of Kshs.19.34 million, Compensation for user fees forgone of Kshs.6.79 million, Leasing of medical equipment of kshs95.74 million and Road maintenance fuel levy Fund of Kshs.65.92 million.
3.26.2 Revenue Analysis
In the first quarter of FY 2015/16, the County received Kshs.415.17 million from National Government as direct transfer to the CRF account, raised Kshs.26.44 million from local sources, and had actual cash balance of Kshs.0.5 billion brought forward from FY 2014/15.The local revenue raised in the period under review of Kshs.26.44 million was an improvement from
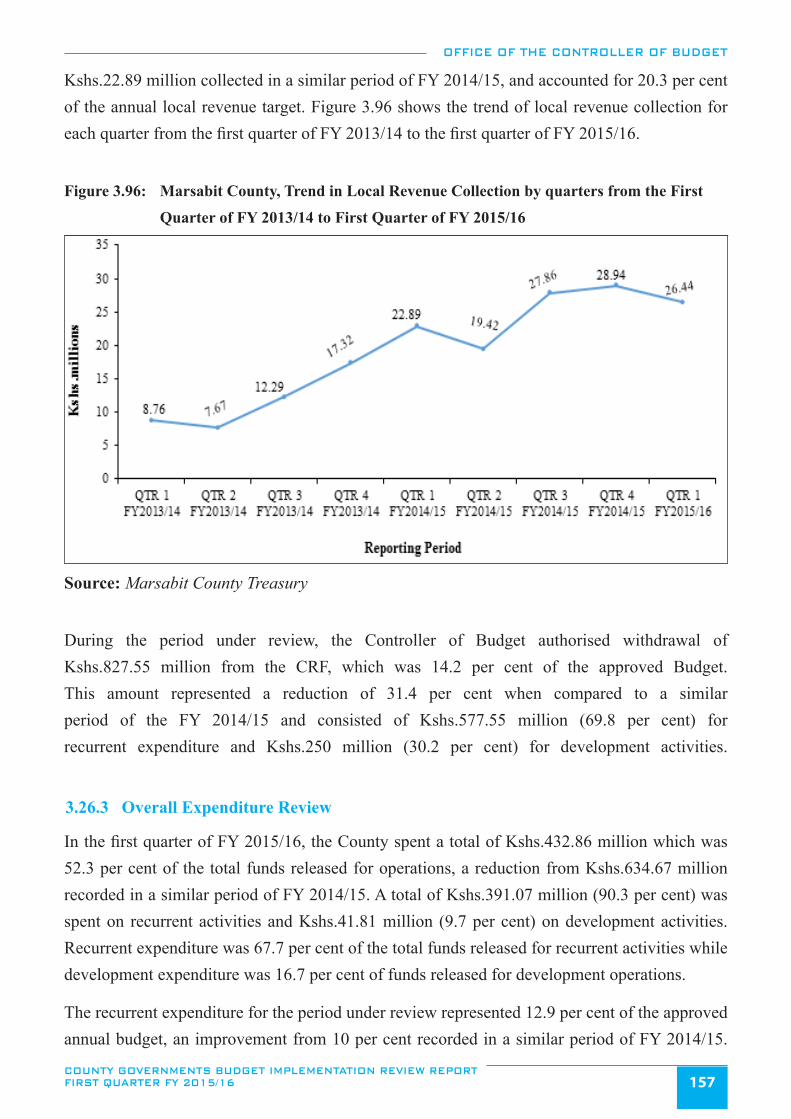
OFFICE OF THE CONTROLLER OF BUDGET
COUNTY GOVERNMENTS BUDGET IMPLEMENTATION REVIEW REPORT FIRST QUARTER FY 2015/16 157
Kshs.22.89 million collected in a similar period of FY 2014/15, and accounted for 20.3 per cent of the annual local revenue target. Figure 3.96 shows the trend of local revenue collection for each quarter from the first quarter of FY 2013/14 to the first quarter of FY 2015/16.
Figure 3.96: Marsabit County, Trend in Local Revenue Collection by quarters from the First
Quarter of FY 2013/14 to First Quarter of FY 2015/16
Source: Marsabit County Treasury
During the period under review, the Controller of Budget authorised withdrawal of Kshs.827.55 million from the CRF, which was 14.2 per cent of the approved Budget. This amount represented a reduction of 31.4 per cent when compared to a similar period of the FY 2014/15 and consisted of Kshs.577.55 million (69.8 per cent) for recurrent expenditure and Kshs.250 million (30.2 per cent) for development activities.
3.26.3 Overall Expenditure Review
In the first quarter of FY 2015/16, the County spent a total of Kshs.432.86 million which was 52.3 per cent of the total funds released for operations, a reduction from Kshs.634.67 million recorded in a similar period of FY 2014/15. A total of Kshs.391.07 million (90.3 per cent) was spent on recurrent activities and Kshs.41.81 million (9.7 per cent) on development activities. Recurrent expenditure was 67.7 per cent of the total funds released for recurrent activities while development expenditure was 16.7 per cent of funds released for development operations.
The recurrent expenditure for the period under review represented 12.9 per cent of the approved annual budget, an improvement from 10 per cent recorded in a similar period of FY 2014/15.
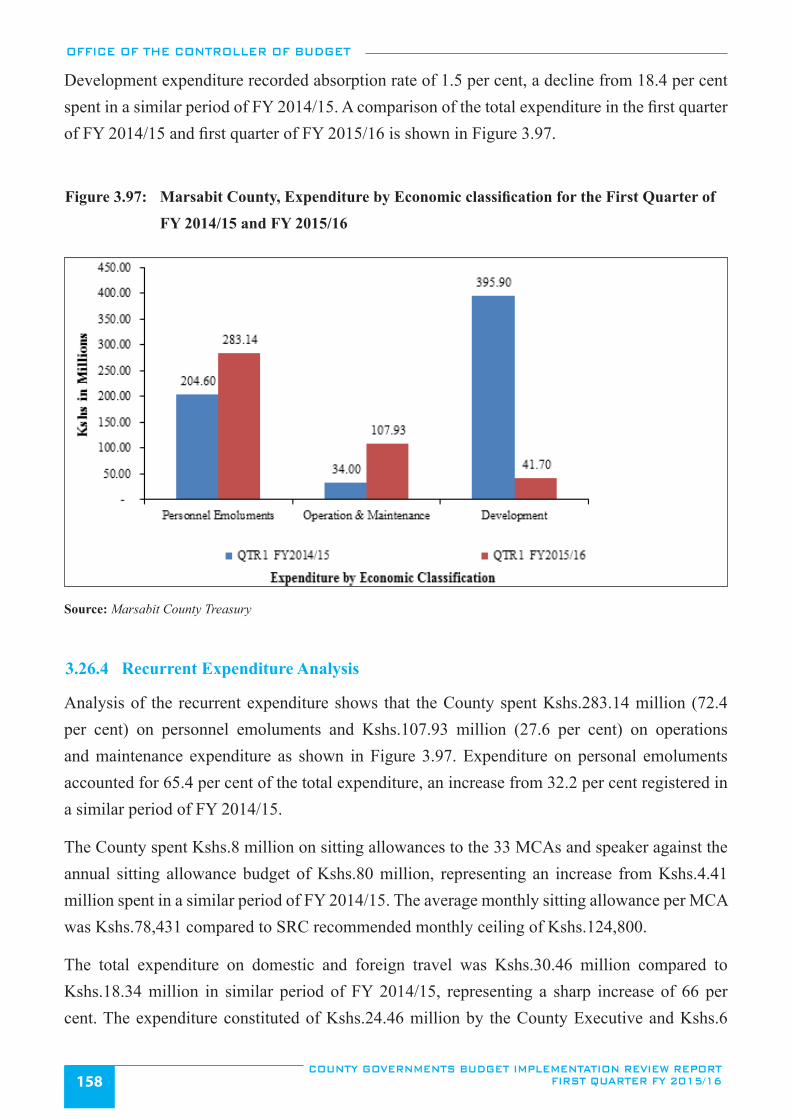
OFFICE OF THE CONTROLLER OF BUDGET
COUNTY GOVERNMENTS BUDGET IMPLEMENTATION REVIEW REPORT FIRST QUARTER FY 2015/16158
Development expenditure recorded absorption rate of 1.5 per cent, a decline from 18.4 per cent spent in a similar period of FY 2014/15. A comparison of the total expenditure in the first quarter of FY 2014/15 and first quarter of FY 2015/16 is shown in Figure 3.97.
Figure 3.97: Marsabit County, Expenditure by Economic classification for the First Quarter of
FY 2014/15 and FY 2015/16
Source: Marsabit County Treasury
3.26.4 Recurrent Expenditure Analysis
Analysis of the recurrent expenditure shows that the County spent Kshs.283.14 million (72.4 per cent) on personnel emoluments and Kshs.107.93 million (27.6 per cent) on operations and maintenance expenditure as shown in Figure 3.97. Expenditure on personal emoluments accounted for 65.4 per cent of the total expenditure, an increase from 32.2 per cent registered in a similar period of FY 2014/15.
The County spent Kshs.8 million on sitting allowances to the 33 MCAs and speaker against the annual sitting allowance budget of Kshs.80 million, representing an increase from Kshs.4.41 million spent in a similar period of FY 2014/15. The average monthly sitting allowance per MCA was Kshs.78,431 compared to SRC recommended monthly ceiling of Kshs.124,800.
The total expenditure on domestic and foreign travel was Kshs.30.46 million compared to Kshs.18.34 million in similar period of FY 2014/15, representing a sharp increase of 66 per cent. The expenditure constituted of Kshs.24.46 million by the County Executive and Kshs.6
OFFICE OF THE CONTROLLER OF BUDGET
COUNTY GOVERNMENTS BUDGET IMPLEMENTATION REVIEW REPORT FIRST QUARTER FY 2015/16 159
million by the County Assembly. A breakdown of operations and maintenance expenditure for the reporting period of FY 2015/16 is shown in Figure 3.98.
Figure 3.98: Marsabit County, Operations and Maintenance Expenditure for the First Quarter of FY 2015/16
Source: Marsabit County Treasury
3.26.5 Development Expenditure Analysis
Analysis of the development expenditure of Kshs.41.70 million incurred in the period under
review indicates that the highest expenditure of Kshs.20.19 million was spent on construction
and completion of an executive office while the second highest expenditure of Kshs.14.37
million was incurred on construction of water storage tanks and commissioning of hydro pump
equipment. The lowest amount of Kshs.0.77 million was on construction of water supply & store
renovation at Moyale Hospital as shown in Figure 3.99.
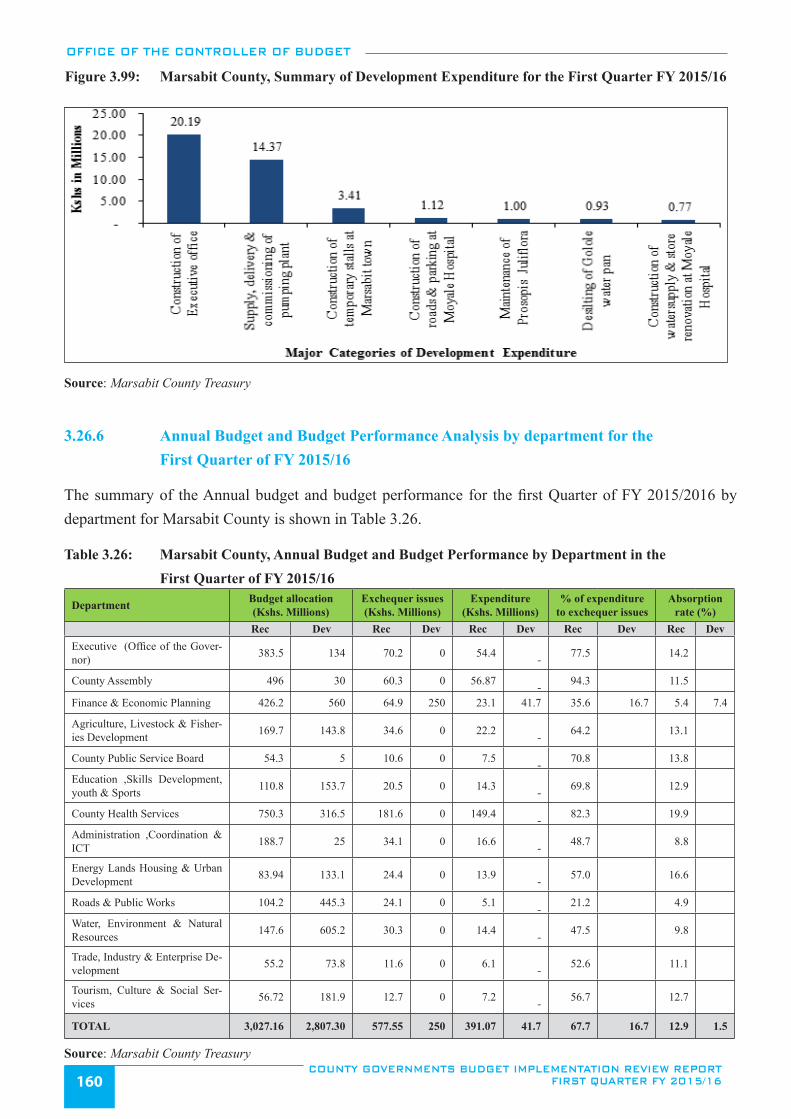
OFFICE OF THE CONTROLLER OF BUDGET
COUNTY GOVERNMENTS BUDGET IMPLEMENTATION REVIEW REPORT FIRST QUARTER FY 2015/16160
Figure 3.99: Marsabit County, Summary of Development Expenditure for the First Quarter FY 2015/16
Source: Marsabit County Treasury
3.26.6 Annual Budget and Budget Performance Analysis by department for the First Quarter of FY 2015/16
The summary of the Annual budget and budget performance for the first Quarter of FY 2015/2016 by department for Marsabit County is shown in Table 3.26.
Table 3.26: Marsabit County, Annual Budget and Budget Performance by Department in the First Quarter of FY 2015/16
Department Budget allocation (Kshs. Millions)
Exchequer issues (Kshs. Millions)
Expenditure (Kshs. Millions)
% of expenditure to exchequer issues
Absorption rate (%)
Rec Dev Rec Dev Rec Dev Rec Dev Rec DevExecutive (Office of the Gover-nor) 383.5 134 70.2 0 54.4
- 77.5 14.2
County Assembly 496 30 60.3 0 56.87 - 94.3 11.5
Finance & Economic Planning 426.2 560 64.9 250 23.1 41.7 35.6 16.7 5.4 7.4
Agriculture, Livestock & Fisher-ies Development 169.7 143.8 34.6 0 22.2
- 64.2 13.1
County Public Service Board 54.3 5 10.6 0 7.5 - 70.8 13.8
Education ,Skills Development, youth & Sports 110.8 153.7 20.5 0 14.3
- 69.8 12.9
County Health Services 750.3 316.5 181.6 0 149.4 - 82.3 19.9
Administration ,Coordination & ICT 188.7 25 34.1 0 16.6
- 48.7 8.8
Energy Lands Housing & Urban Development 83.94 133.1 24.4 0 13.9
- 57.0 16.6
Roads & Public Works 104.2 445.3 24.1 0 5.1 - 21.2 4.9
Water, Environment & Natural Resources 147.6 605.2 30.3 0 14.4
- 47.5 9.8
Trade, Industry & Enterprise De-velopment 55.2 73.8 11.6 0 6.1
- 52.6 11.1
Tourism, Culture & Social Ser-vices 56.72 181.9 12.7 0 7.2
- 56.7 12.7
TOTAL 3,027.16 2,807.30 577.55 250 391.07 41.7 67.7 16.7 12.9 1.5
Source: Marsabit County Treasury
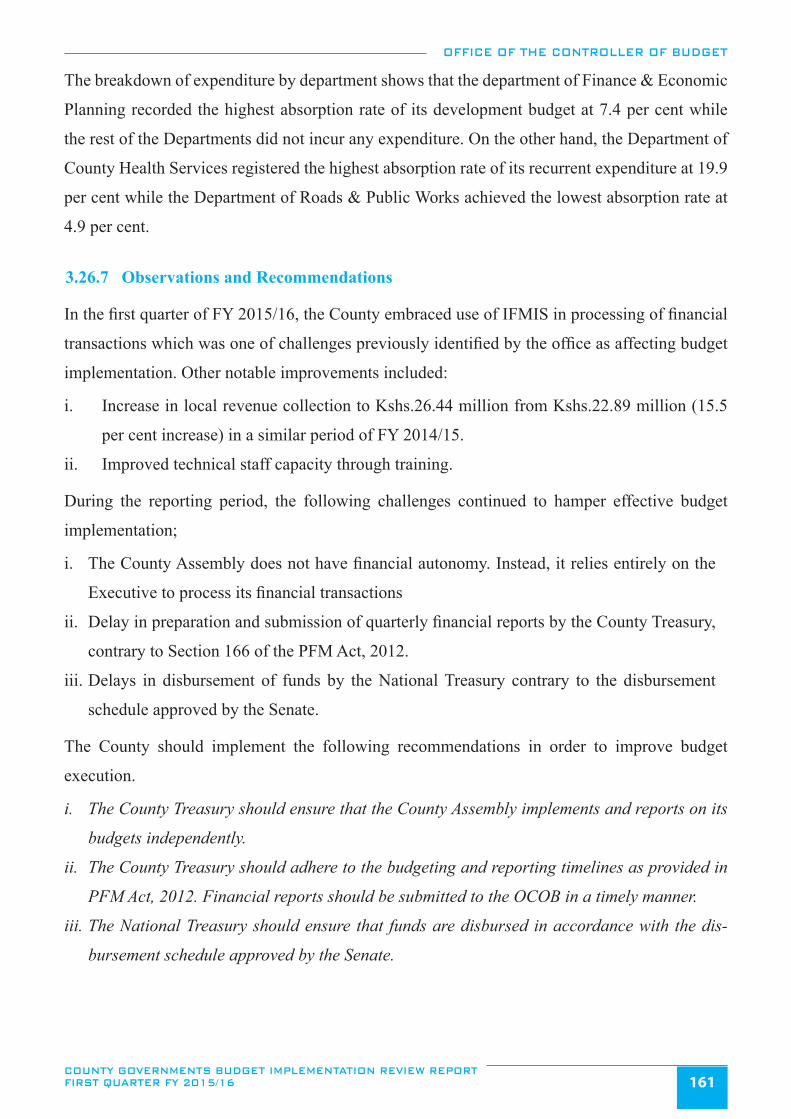
OFFICE OF THE CONTROLLER OF BUDGET
COUNTY GOVERNMENTS BUDGET IMPLEMENTATION REVIEW REPORT FIRST QUARTER FY 2015/16 161
The breakdown of expenditure by department shows that the department of Finance & Economic
Planning recorded the highest absorption rate of its development budget at 7.4 per cent while
the rest of the Departments did not incur any expenditure. On the other hand, the Department of
County Health Services registered the highest absorption rate of its recurrent expenditure at 19.9
per cent while the Department of Roads & Public Works achieved the lowest absorption rate at
4.9 per cent.
3.26.7 Observations and Recommendations
In the first quarter of FY 2015/16, the County embraced use of IFMIS in processing of financial
transactions which was one of challenges previously identified by the office as affecting budget
implementation. Other notable improvements included:
i. Increase in local revenue collection to Kshs.26.44 million from Kshs.22.89 million (15.5
per cent increase) in a similar period of FY 2014/15.
ii. Improved technical staff capacity through training.
During the reporting period, the following challenges continued to hamper effective budget
implementation;
i. The County Assembly does not have financial autonomy. Instead, it relies entirely on the
Executive to process its financial transactions
ii. Delay in preparation and submission of quarterly financial reports by the County Treasury,
contrary to Section 166 of the PFM Act, 2012.
iii. Delays in disbursement of funds by the National Treasury contrary to the disbursement
schedule approved by the Senate.
The County should implement the following recommendations in order to improve budget
execution.
i. The County Treasury should ensure that the County Assembly implements and reports on its
budgets independently.
ii. The County Treasury should adhere to the budgeting and reporting timelines as provided in
PFM Act, 2012. Financial reports should be submitted to the OCOB in a timely manner.
iii. The National Treasury should ensure that funds are disbursed in accordance with the dis-
bursement schedule approved by the Senate.
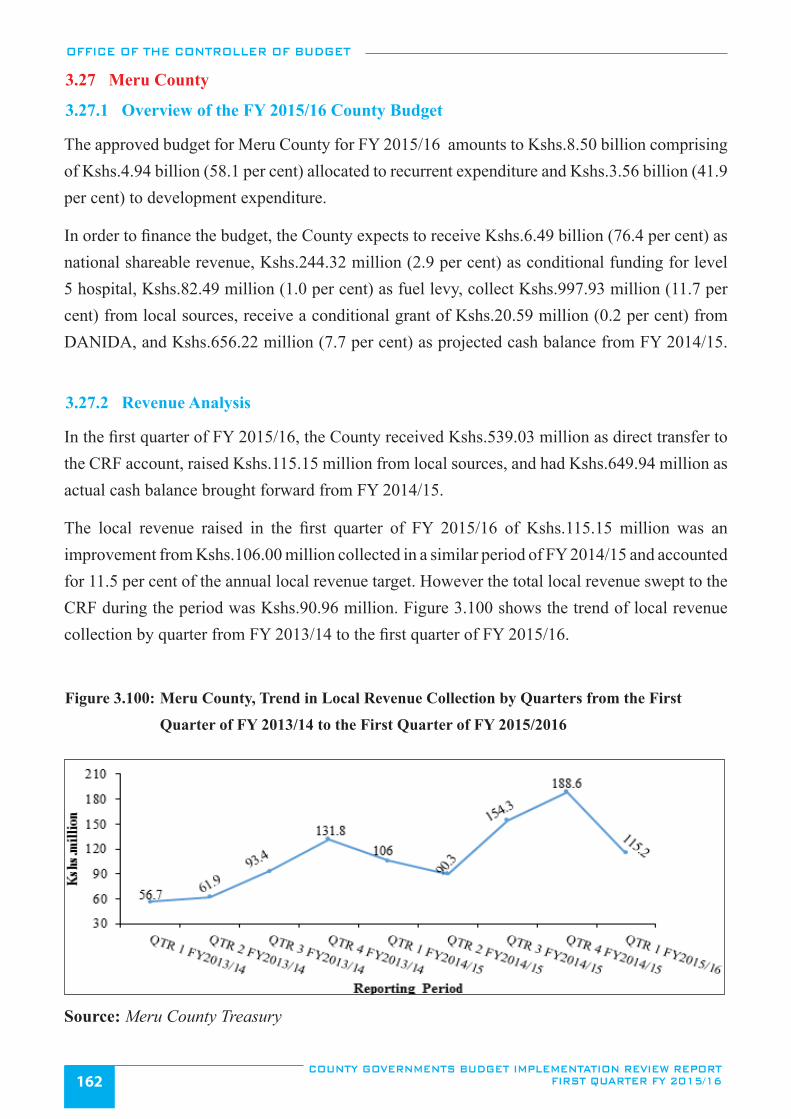
OFFICE OF THE CONTROLLER OF BUDGET
COUNTY GOVERNMENTS BUDGET IMPLEMENTATION REVIEW REPORT FIRST QUARTER FY 2015/16162
3.27 Meru County
3.27.1 Overview of the FY 2015/16 County Budget
The approved budget for Meru County for FY 2015/16 amounts to Kshs.8.50 billion comprising of Kshs.4.94 billion (58.1 per cent) allocated to recurrent expenditure and Kshs.3.56 billion (41.9 per cent) to development expenditure.
In order to finance the budget, the County expects to receive Kshs.6.49 billion (76.4 per cent) as national shareable revenue, Kshs.244.32 million (2.9 per cent) as conditional funding for level 5 hospital, Kshs.82.49 million (1.0 per cent) as fuel levy, collect Kshs.997.93 million (11.7 per cent) from local sources, receive a conditional grant of Kshs.20.59 million (0.2 per cent) from DANIDA, and Kshs.656.22 million (7.7 per cent) as projected cash balance from FY 2014/15.
3.27.2 Revenue Analysis
In the first quarter of FY 2015/16, the County received Kshs.539.03 million as direct transfer to the CRF account, raised Kshs.115.15 million from local sources, and had Kshs.649.94 million as actual cash balance brought forward from FY 2014/15.
The local revenue raised in the first quarter of FY 2015/16 of Kshs.115.15 million was an improvement from Kshs.106.00 million collected in a similar period of FY 2014/15 and accounted for 11.5 per cent of the annual local revenue target. However the total local revenue swept to the CRF during the period was Kshs.90.96 million. Figure 3.100 shows the trend of local revenue collection by quarter from FY 2013/14 to the first quarter of FY 2015/16.
Figure 3.100: Meru County, Trend in Local Revenue Collection by Quarters from the First
Quarter of FY 2013/14 to the First Quarter of FY 2015/2016
Source: Meru County Treasury
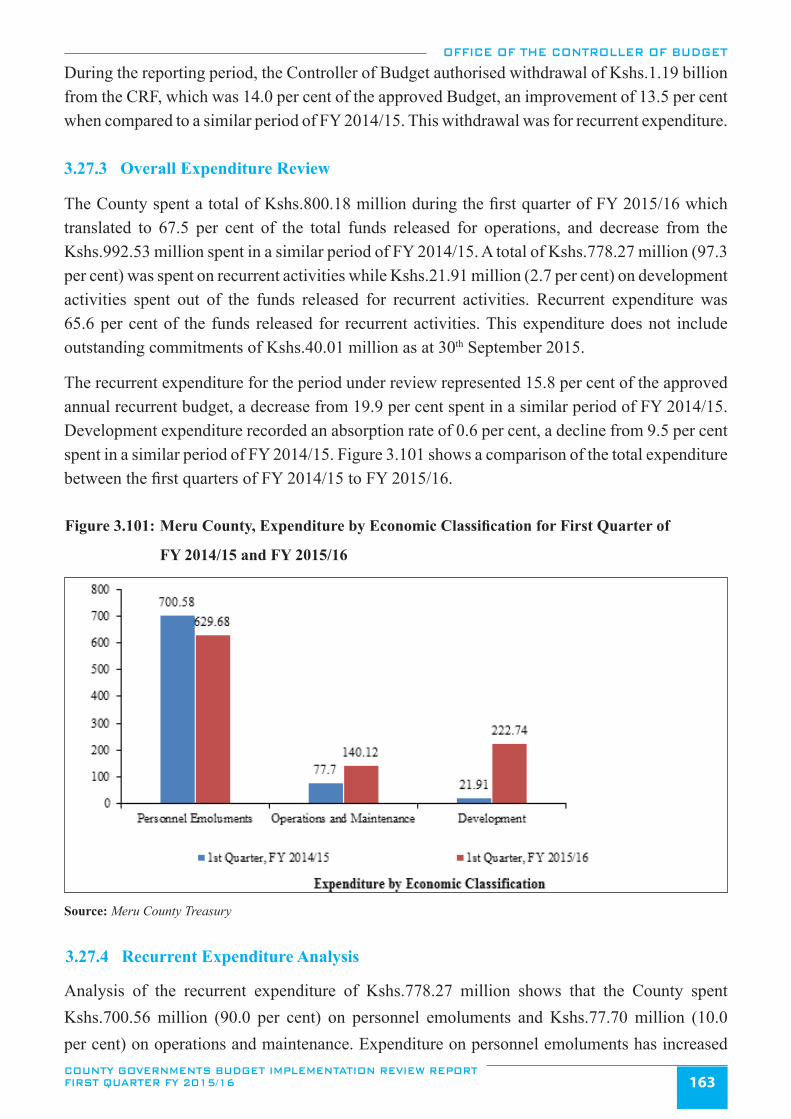
OFFICE OF THE CONTROLLER OF BUDGET
COUNTY GOVERNMENTS BUDGET IMPLEMENTATION REVIEW REPORT FIRST QUARTER FY 2015/16 163
During the reporting period, the Controller of Budget authorised withdrawal of Kshs.1.19 billion from the CRF, which was 14.0 per cent of the approved Budget, an improvement of 13.5 per cent when compared to a similar period of FY 2014/15. This withdrawal was for recurrent expenditure. 3.27.3 Overall Expenditure Review
The County spent a total of Kshs.800.18 million during the first quarter of FY 2015/16 which translated to 67.5 per cent of the total funds released for operations, and decrease from the Kshs.992.53 million spent in a similar period of FY 2014/15. A total of Kshs.778.27 million (97.3 per cent) was spent on recurrent activities while Kshs.21.91 million (2.7 per cent) on development activities spent out of the funds released for recurrent activities. Recurrent expenditure was 65.6 per cent of the funds released for recurrent activities. This expenditure does not include outstanding commitments of Kshs.40.01 million as at 30th September 2015.
The recurrent expenditure for the period under review represented 15.8 per cent of the approved annual recurrent budget, a decrease from 19.9 per cent spent in a similar period of FY 2014/15. Development expenditure recorded an absorption rate of 0.6 per cent, a decline from 9.5 per cent spent in a similar period of FY 2014/15. Figure 3.101 shows a comparison of the total expenditure between the first quarters of FY 2014/15 to FY 2015/16.
Figure 3.101: Meru County, Expenditure by Economic Classification for First Quarter of
FY 2014/15 and FY 2015/16
Source: Meru County Treasury
3.27.4 Recurrent Expenditure Analysis
Analysis of the recurrent expenditure of Kshs.778.27 million shows that the County spent Kshs.700.56 million (90.0 per cent) on personnel emoluments and Kshs.77.70 million (10.0 per cent) on operations and maintenance. Expenditure on personnel emoluments has increased
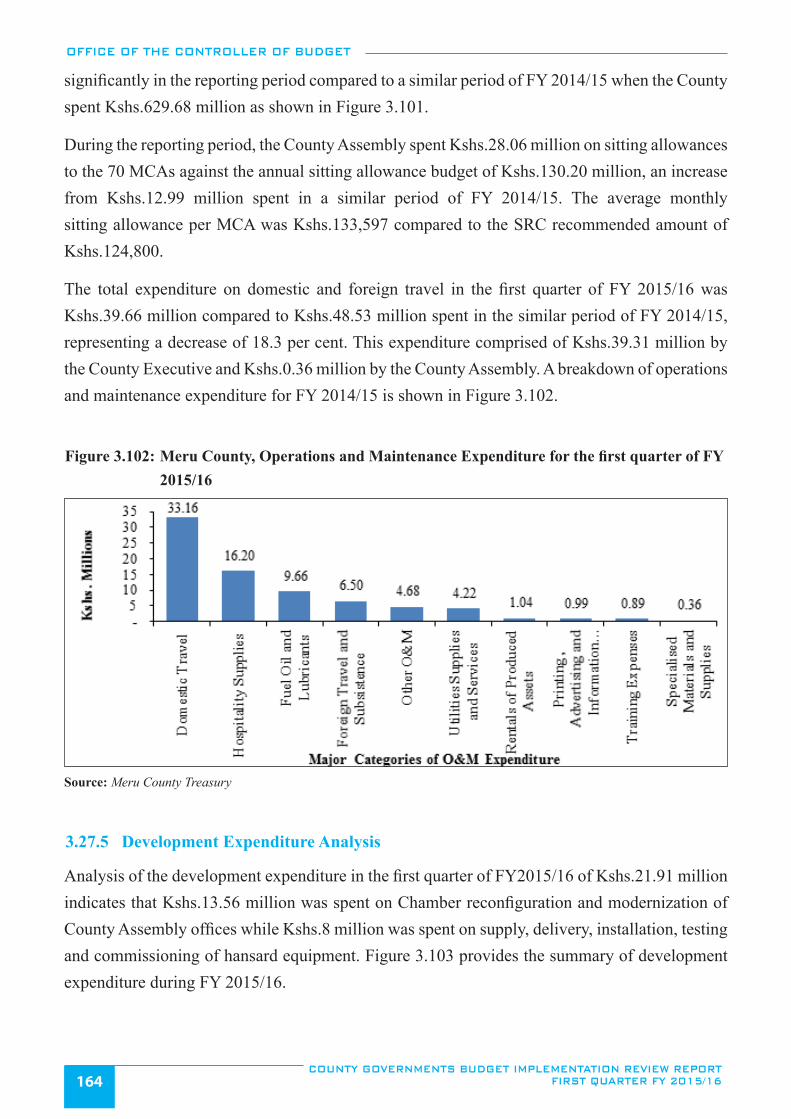
OFFICE OF THE CONTROLLER OF BUDGET
COUNTY GOVERNMENTS BUDGET IMPLEMENTATION REVIEW REPORT FIRST QUARTER FY 2015/16164
significantly in the reporting period compared to a similar period of FY 2014/15 when the County spent Kshs.629.68 million as shown in Figure 3.101.
During the reporting period, the County Assembly spent Kshs.28.06 million on sitting allowances to the 70 MCAs against the annual sitting allowance budget of Kshs.130.20 million, an increase from Kshs.12.99 million spent in a similar period of FY 2014/15. The average monthly sitting allowance per MCA was Kshs.133,597 compared to the SRC recommended amount of Kshs.124,800.
The total expenditure on domestic and foreign travel in the first quarter of FY 2015/16 was Kshs.39.66 million compared to Kshs.48.53 million spent in the similar period of FY 2014/15, representing a decrease of 18.3 per cent. This expenditure comprised of Kshs.39.31 million by the County Executive and Kshs.0.36 million by the County Assembly. A breakdown of operations and maintenance expenditure for FY 2014/15 is shown in Figure 3.102.
Figure 3.102: Meru County, Operations and Maintenance Expenditure for the first quarter of FY 2015/16
Source: Meru County Treasury
3.27.5 Development Expenditure Analysis
Analysis of the development expenditure in the first quarter of FY2015/16 of Kshs.21.91 million indicates that Kshs.13.56 million was spent on Chamber reconfiguration and modernization of County Assembly offices while Kshs.8 million was spent on supply, delivery, installation, testing and commissioning of hansard equipment. Figure 3.103 provides the summary of development expenditure during FY 2015/16.
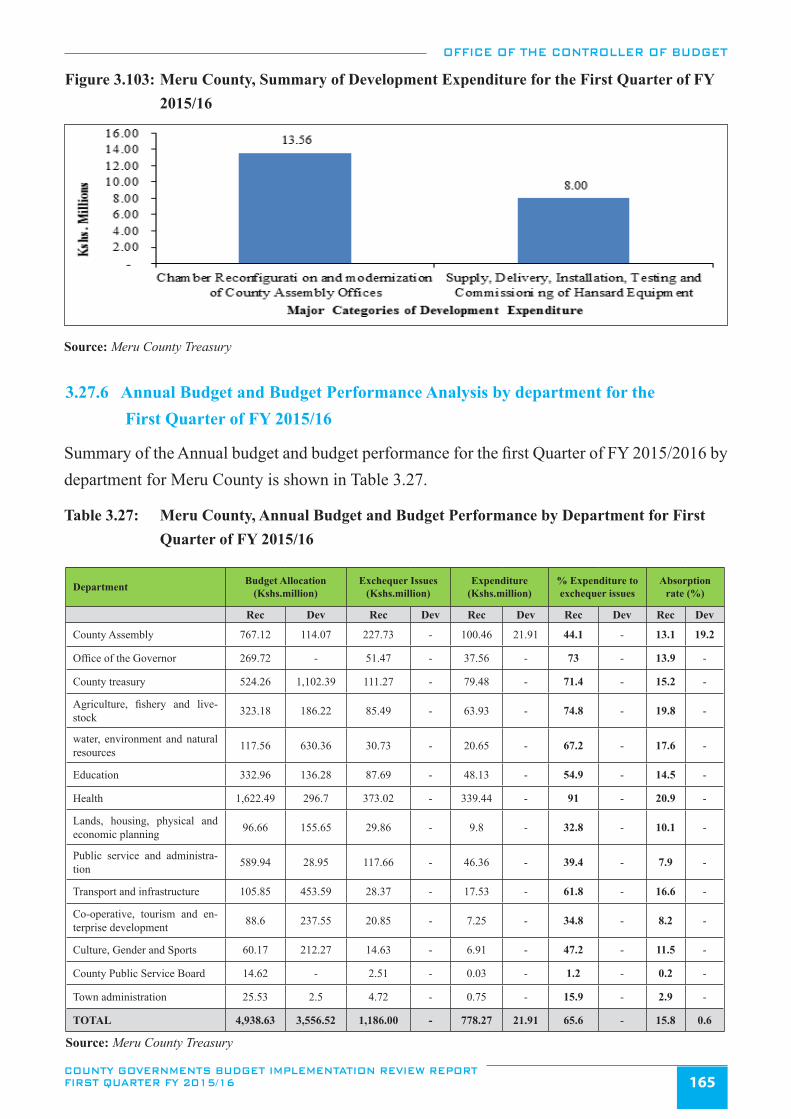
OFFICE OF THE CONTROLLER OF BUDGET
COUNTY GOVERNMENTS BUDGET IMPLEMENTATION REVIEW REPORT FIRST QUARTER FY 2015/16 165
Figure 3.103: Meru County, Summary of Development Expenditure for the First Quarter of FY 2015/16
Source: Meru County Treasury
3.27.6 Annual Budget and Budget Performance Analysis by department for the First Quarter of FY 2015/16
Summary of the Annual budget and budget performance for the first Quarter of FY 2015/2016 by department for Meru County is shown in Table 3.27.
Table 3.27: Meru County, Annual Budget and Budget Performance by Department for First Quarter of FY 2015/16
Department Budget Allocation (Kshs.million)
Exchequer Issues (Kshs.million)
Expenditure (Kshs.million)
% Expenditure to exchequer issues
Absorption rate (%)
Rec Dev Rec Dev Rec Dev Rec Dev Rec Dev
County Assembly 767.12 114.07 227.73 - 100.46 21.91 44.1 - 13.1 19.2
Office of the Governor 269.72 - 51.47 - 37.56 - 73 - 13.9 -
County treasury 524.26 1,102.39 111.27 - 79.48 - 71.4 - 15.2 -
Agriculture, fishery and live-stock 323.18 186.22 85.49 - 63.93 - 74.8 - 19.8 -
water, environment and natural resources 117.56 630.36 30.73 - 20.65 - 67.2 - 17.6 -
Education 332.96 136.28 87.69 - 48.13 - 54.9 - 14.5 -
Health 1,622.49 296.7 373.02 - 339.44 - 91 - 20.9 -
Lands, housing, physical and economic planning 96.66 155.65 29.86 - 9.8 - 32.8 - 10.1 -
Public service and administra-tion 589.94 28.95 117.66 - 46.36 - 39.4 - 7.9 -
Transport and infrastructure 105.85 453.59 28.37 - 17.53 - 61.8 - 16.6 -
Co-operative, tourism and en-terprise development 88.6 237.55 20.85 - 7.25 - 34.8 - 8.2 -
Culture, Gender and Sports 60.17 212.27 14.63 - 6.91 - 47.2 - 11.5 -
County Public Service Board 14.62 - 2.51 - 0.03 - 1.2 - 0.2 -
Town administration 25.53 2.5 4.72 - 0.75 - 15.9 - 2.9 -
TOTAL 4,938.63 3,556.52 1,186.00 - 778.27 21.91 65.6 - 15.8 0.6
Source: Meru County Treasury
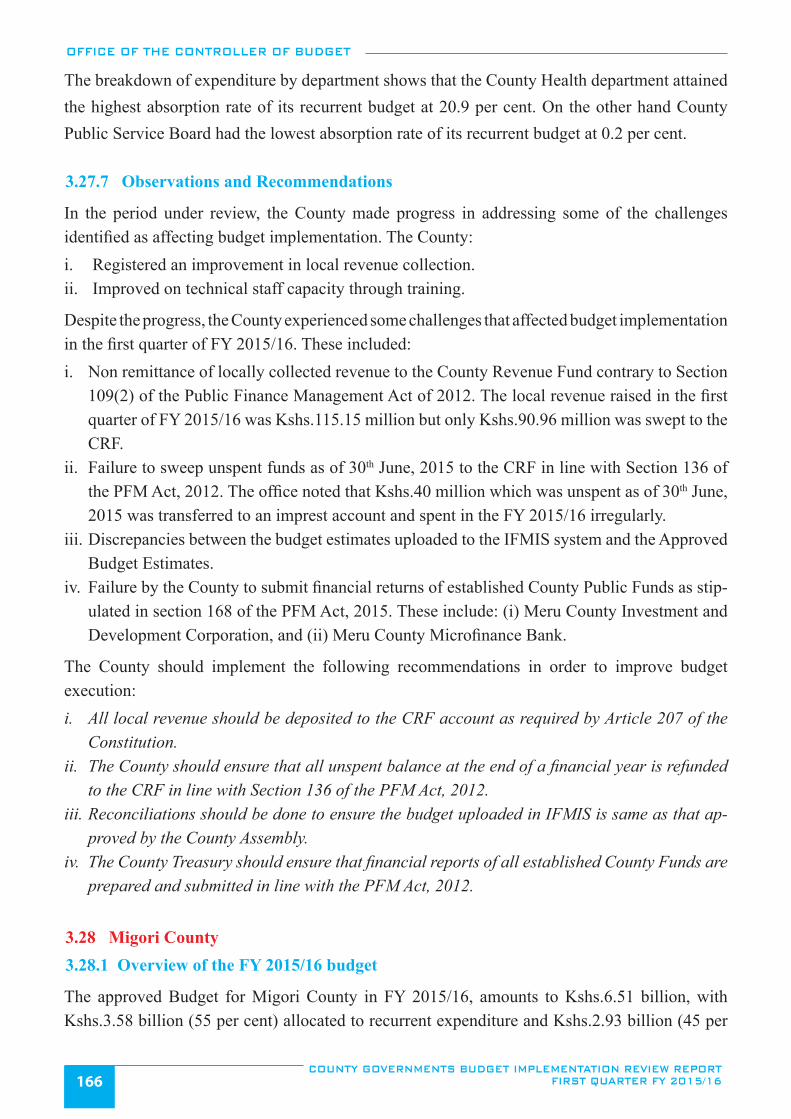
OFFICE OF THE CONTROLLER OF BUDGET
COUNTY GOVERNMENTS BUDGET IMPLEMENTATION REVIEW REPORT FIRST QUARTER FY 2015/16166
The breakdown of expenditure by department shows that the County Health department attained the highest absorption rate of its recurrent budget at 20.9 per cent. On the other hand County Public Service Board had the lowest absorption rate of its recurrent budget at 0.2 per cent.
3.27.7 Observations and Recommendations
In the period under review, the County made progress in addressing some of the challenges identified as affecting budget implementation. The County:i. Registered an improvement in local revenue collection.ii. Improved on technical staff capacity through training.
Despite the progress, the County experienced some challenges that affected budget implementation in the first quarter of FY 2015/16. These included:i. Non remittance of locally collected revenue to the County Revenue Fund contrary to Section
109(2) of the Public Finance Management Act of 2012. The local revenue raised in the first quarter of FY 2015/16 was Kshs.115.15 million but only Kshs.90.96 million was swept to the CRF.
ii. Failure to sweep unspent funds as of 30th June, 2015 to the CRF in line with Section 136 of the PFM Act, 2012. The office noted that Kshs.40 million which was unspent as of 30th June, 2015 was transferred to an imprest account and spent in the FY 2015/16 irregularly.
iii. Discrepancies between the budget estimates uploaded to the IFMIS system and the Approved Budget Estimates.
iv. Failure by the County to submit financial returns of established County Public Funds as stip-ulated in section 168 of the PFM Act, 2015. These include: (i) Meru County Investment and Development Corporation, and (ii) Meru County Microfinance Bank.
The County should implement the following recommendations in order to improve budget execution:i. All local revenue should be deposited to the CRF account as required by Article 207 of the
Constitution.ii. The County should ensure that all unspent balance at the end of a financial year is refunded
to the CRF in line with Section 136 of the PFM Act, 2012.iii. Reconciliations should be done to ensure the budget uploaded in IFMIS is same as that ap-
proved by the County Assembly.iv. The County Treasury should ensure that financial reports of all established County Funds are
prepared and submitted in line with the PFM Act, 2012.
3.28 Migori County3.28.1 Overview of the FY 2015/16 budget
The approved Budget for Migori County in FY 2015/16, amounts to Kshs.6.51 billion, with Kshs.3.58 billion (55 per cent) allocated to recurrent expenditure and Kshs.2.93 billion (45 per
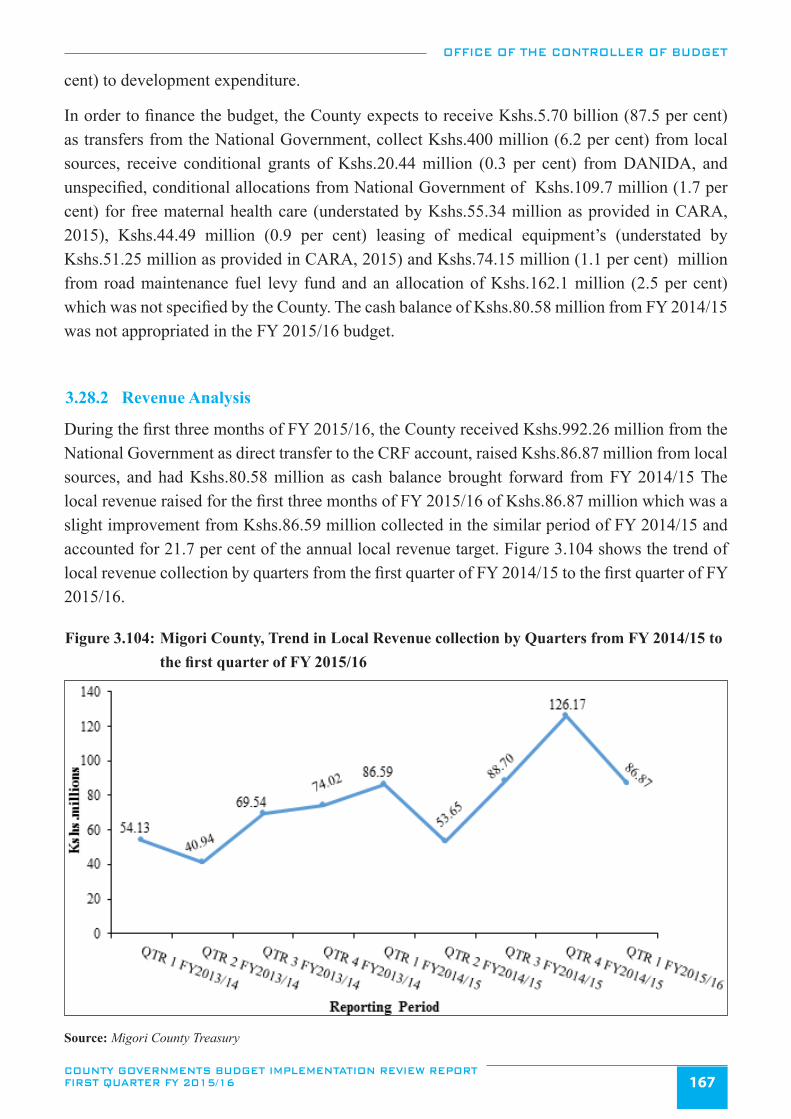
OFFICE OF THE CONTROLLER OF BUDGET
COUNTY GOVERNMENTS BUDGET IMPLEMENTATION REVIEW REPORT FIRST QUARTER FY 2015/16 167
cent) to development expenditure.
In order to finance the budget, the County expects to receive Kshs.5.70 billion (87.5 per cent) as transfers from the National Government, collect Kshs.400 million (6.2 per cent) from local sources, receive conditional grants of Kshs.20.44 million (0.3 per cent) from DANIDA, and unspecified, conditional allocations from National Government of Kshs.109.7 million (1.7 per cent) for free maternal health care (understated by Kshs.55.34 million as provided in CARA, 2015), Kshs.44.49 million (0.9 per cent) leasing of medical equipment’s (understated by Kshs.51.25 million as provided in CARA, 2015) and Kshs.74.15 million (1.1 per cent) million from road maintenance fuel levy fund and an allocation of Kshs.162.1 million (2.5 per cent) which was not specified by the County. The cash balance of Kshs.80.58 million from FY 2014/15 was not appropriated in the FY 2015/16 budget.
3.28.2 Revenue Analysis
During the first three months of FY 2015/16, the County received Kshs.992.26 million from the National Government as direct transfer to the CRF account, raised Kshs.86.87 million from local sources, and had Kshs.80.58 million as cash balance brought forward from FY 2014/15 The local revenue raised for the first three months of FY 2015/16 of Kshs.86.87 million which was a slight improvement from Kshs.86.59 million collected in the similar period of FY 2014/15 and accounted for 21.7 per cent of the annual local revenue target. Figure 3.104 shows the trend of local revenue collection by quarters from the first quarter of FY 2014/15 to the first quarter of FY 2015/16.
Figure 3.104: Migori County, Trend in Local Revenue collection by Quarters from FY 2014/15 to the first quarter of FY 2015/16
Source: Migori County Treasury
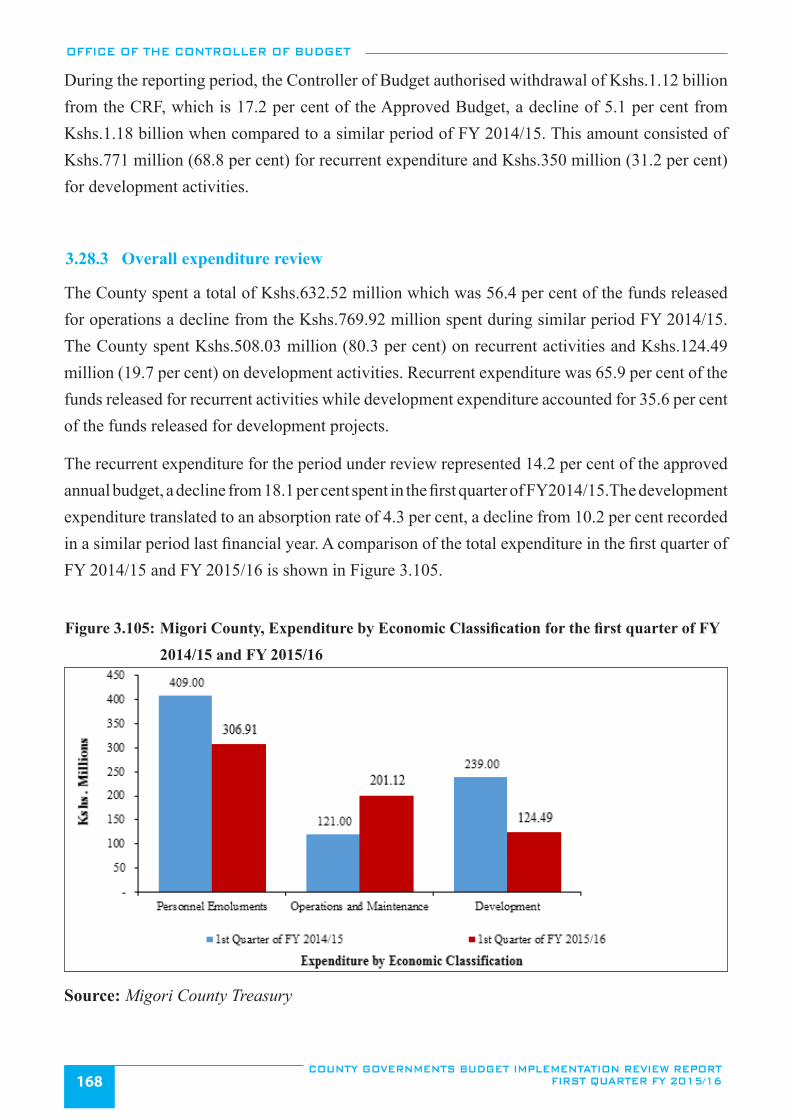
OFFICE OF THE CONTROLLER OF BUDGET
COUNTY GOVERNMENTS BUDGET IMPLEMENTATION REVIEW REPORT FIRST QUARTER FY 2015/16168
During the reporting period, the Controller of Budget authorised withdrawal of Kshs.1.12 billion from the CRF, which is 17.2 per cent of the Approved Budget, a decline of 5.1 per cent from Kshs.1.18 billion when compared to a similar period of FY 2014/15. This amount consisted of Kshs.771 million (68.8 per cent) for recurrent expenditure and Kshs.350 million (31.2 per cent) for development activities.
3.28.3 Overall expenditure review
The County spent a total of Kshs.632.52 million which was 56.4 per cent of the funds released for operations a decline from the Kshs.769.92 million spent during similar period FY 2014/15. The County spent Kshs.508.03 million (80.3 per cent) on recurrent activities and Kshs.124.49 million (19.7 per cent) on development activities. Recurrent expenditure was 65.9 per cent of the funds released for recurrent activities while development expenditure accounted for 35.6 per cent of the funds released for development projects.
The recurrent expenditure for the period under review represented 14.2 per cent of the approved annual budget, a decline from 18.1 per cent spent in the first quarter of FY2014/15.The development expenditure translated to an absorption rate of 4.3 per cent, a decline from 10.2 per cent recorded in a similar period last financial year. A comparison of the total expenditure in the first quarter of FY 2014/15 and FY 2015/16 is shown in Figure 3.105.
Figure 3.105: Migori County, Expenditure by Economic Classification for the first quarter of FY
2014/15 and FY 2015/16
Source: Migori County Treasury
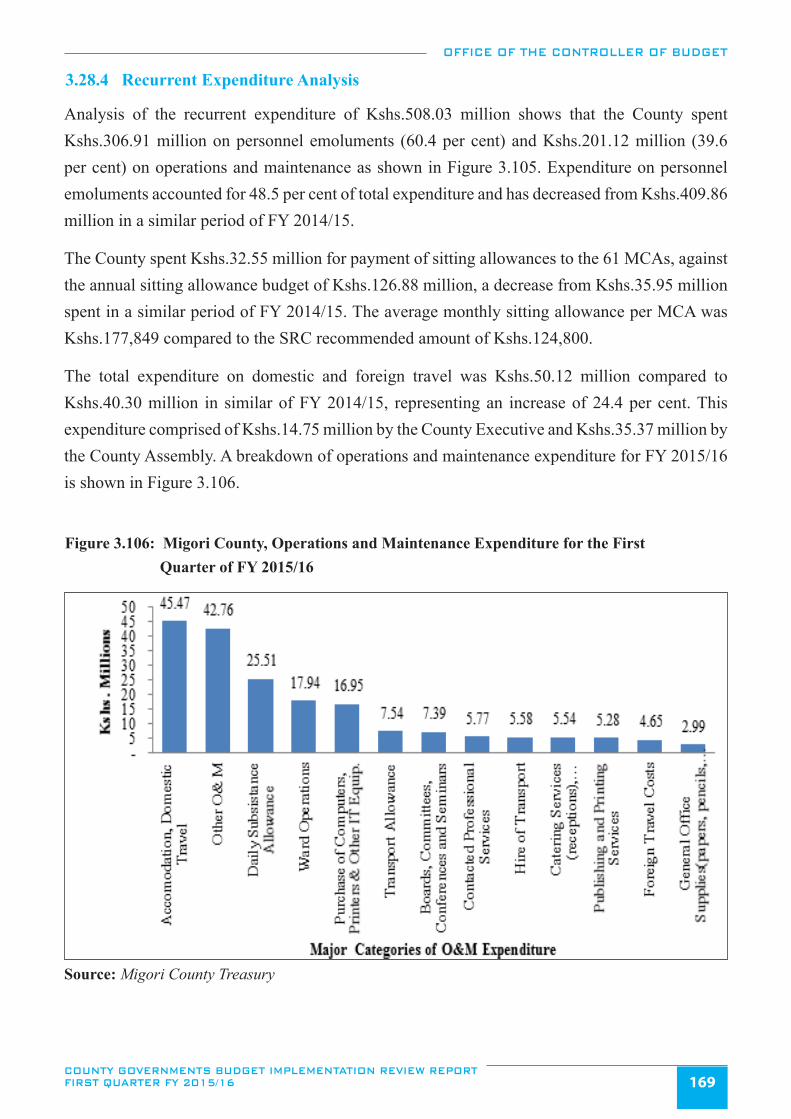
OFFICE OF THE CONTROLLER OF BUDGET
COUNTY GOVERNMENTS BUDGET IMPLEMENTATION REVIEW REPORT FIRST QUARTER FY 2015/16 169
3.28.4 Recurrent Expenditure Analysis
Analysis of the recurrent expenditure of Kshs.508.03 million shows that the County spent Kshs.306.91 million on personnel emoluments (60.4 per cent) and Kshs.201.12 million (39.6 per cent) on operations and maintenance as shown in Figure 3.105. Expenditure on personnel emoluments accounted for 48.5 per cent of total expenditure and has decreased from Kshs.409.86 million in a similar period of FY 2014/15.
The County spent Kshs.32.55 million for payment of sitting allowances to the 61 MCAs, against the annual sitting allowance budget of Kshs.126.88 million, a decrease from Kshs.35.95 million spent in a similar period of FY 2014/15. The average monthly sitting allowance per MCA was Kshs.177,849 compared to the SRC recommended amount of Kshs.124,800.
The total expenditure on domestic and foreign travel was Kshs.50.12 million compared to Kshs.40.30 million in similar of FY 2014/15, representing an increase of 24.4 per cent. This expenditure comprised of Kshs.14.75 million by the County Executive and Kshs.35.37 million by the County Assembly. A breakdown of operations and maintenance expenditure for FY 2015/16 is shown in Figure 3.106.
Figure 3.106: Migori County, Operations and Maintenance Expenditure for the First Quarter of FY 2015/16
Source: Migori County Treasury
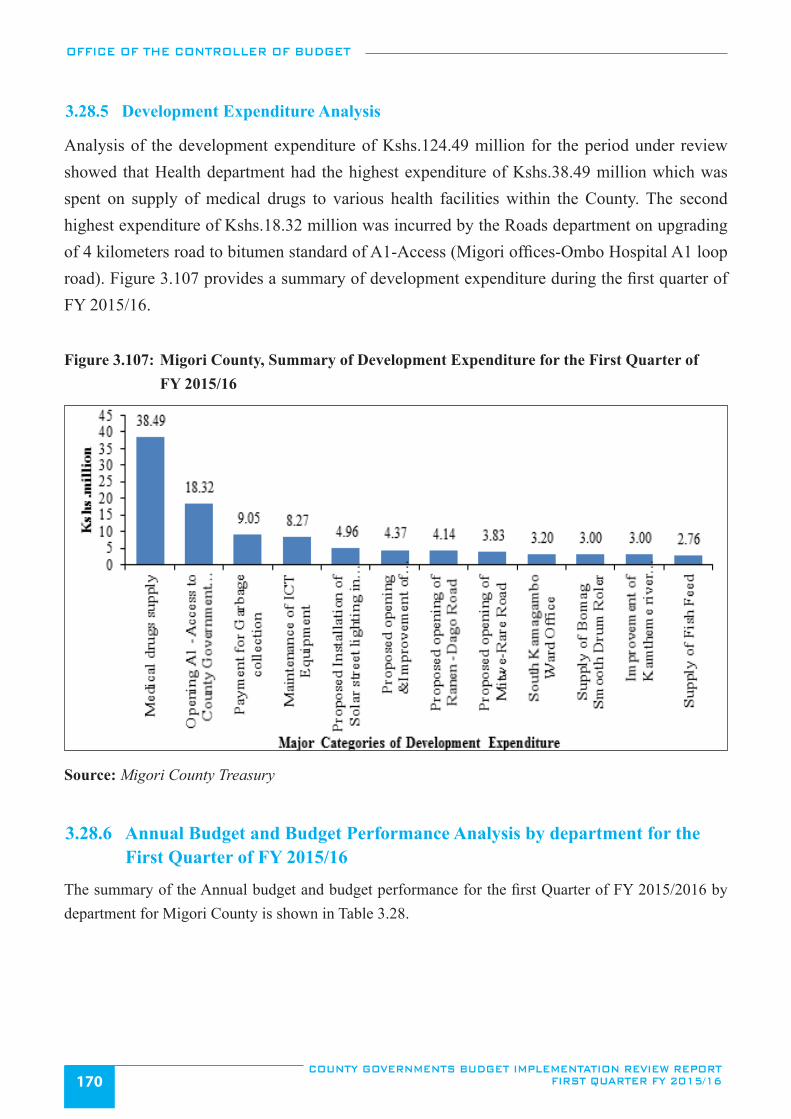
OFFICE OF THE CONTROLLER OF BUDGET
COUNTY GOVERNMENTS BUDGET IMPLEMENTATION REVIEW REPORT FIRST QUARTER FY 2015/16170
3.28.5 Development Expenditure Analysis
Analysis of the development expenditure of Kshs.124.49 million for the period under review showed that Health department had the highest expenditure of Kshs.38.49 million which was spent on supply of medical drugs to various health facilities within the County. The second highest expenditure of Kshs.18.32 million was incurred by the Roads department on upgrading of 4 kilometers road to bitumen standard of A1-Access (Migori offices-Ombo Hospital A1 loop road). Figure 3.107 provides a summary of development expenditure during the first quarter of FY 2015/16.
Figure 3.107: Migori County, Summary of Development Expenditure for the First Quarter of FY 2015/16
Source: Migori County Treasury
3.28.6 Annual Budget and Budget Performance Analysis by department for the First Quarter of FY 2015/16
The summary of the Annual budget and budget performance for the first Quarter of FY 2015/2016 by department for Migori County is shown in Table 3.28.
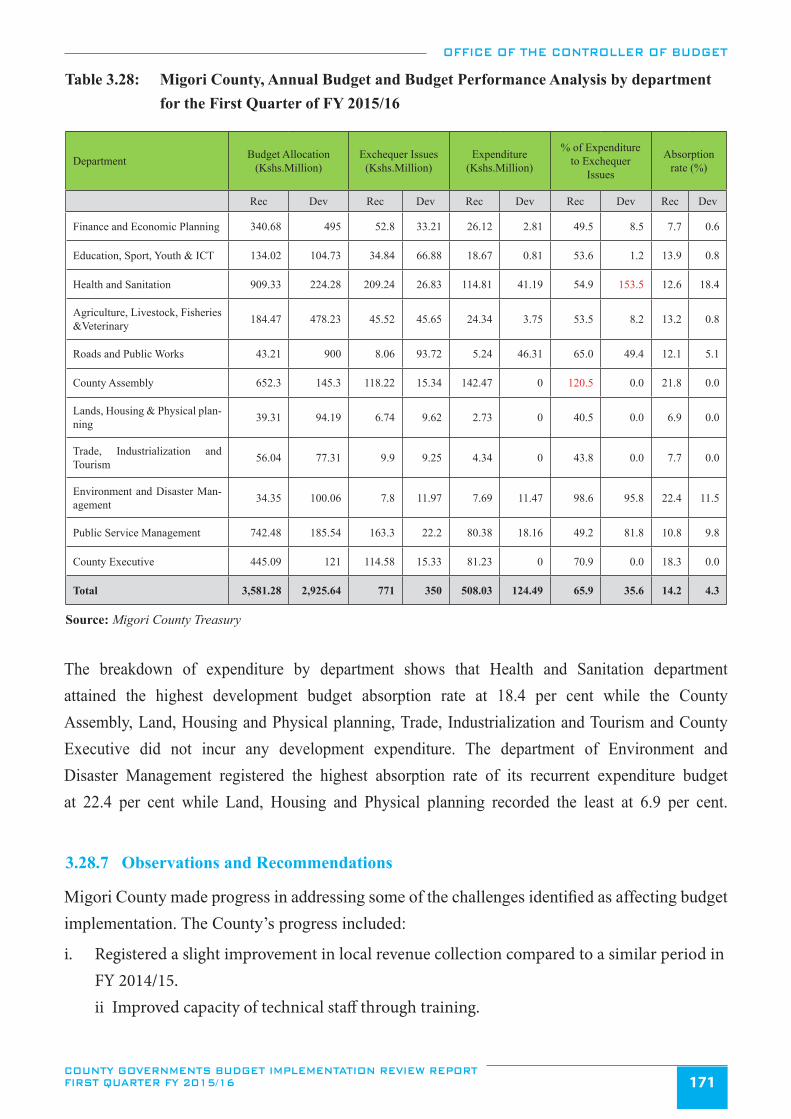
OFFICE OF THE CONTROLLER OF BUDGET
COUNTY GOVERNMENTS BUDGET IMPLEMENTATION REVIEW REPORT FIRST QUARTER FY 2015/16 171
Table 3.28: Migori County, Annual Budget and Budget Performance Analysis by department for the First Quarter of FY 2015/16
Department Budget Allocation (Kshs.Million)
Exchequer Issues (Kshs.Million)
Expenditure (Kshs.Million)
% of Expenditure to Exchequer
Issues
Absorption rate (%)
Rec Dev Rec Dev Rec Dev Rec Dev Rec Dev
Finance and Economic Planning 340.68 495 52.8 33.21 26.12 2.81 49.5 8.5 7.7 0.6
Education, Sport, Youth & ICT 134.02 104.73 34.84 66.88 18.67 0.81 53.6 1.2 13.9 0.8
Health and Sanitation 909.33 224.28 209.24 26.83 114.81 41.19 54.9 153.5 12.6 18.4
Agriculture, Livestock, Fisheries &Veterinary 184.47 478.23 45.52 45.65 24.34 3.75 53.5 8.2 13.2 0.8
Roads and Public Works 43.21 900 8.06 93.72 5.24 46.31 65.0 49.4 12.1 5.1
County Assembly 652.3 145.3 118.22 15.34 142.47 0 120.5 0.0 21.8 0.0
Lands, Housing & Physical plan-ning 39.31 94.19 6.74 9.62 2.73 0 40.5 0.0 6.9 0.0
Trade, Industrialization and Tourism 56.04 77.31 9.9 9.25 4.34 0 43.8 0.0 7.7 0.0
Environment and Disaster Man-agement 34.35 100.06 7.8 11.97 7.69 11.47 98.6 95.8 22.4 11.5
Public Service Management 742.48 185.54 163.3 22.2 80.38 18.16 49.2 81.8 10.8 9.8
County Executive 445.09 121 114.58 15.33 81.23 0 70.9 0.0 18.3 0.0
Total 3,581.28 2,925.64 771 350 508.03 124.49 65.9 35.6 14.2 4.3
Source: Migori County Treasury
The breakdown of expenditure by department shows that Health and Sanitation department attained the highest development budget absorption rate at 18.4 per cent while the County Assembly, Land, Housing and Physical planning, Trade, Industrialization and Tourism and County Executive did not incur any development expenditure. The department of Environment and Disaster Management registered the highest absorption rate of its recurrent expenditure budget at 22.4 per cent while Land, Housing and Physical planning recorded the least at 6.9 per cent.
3.28.7 Observations and Recommendations
Migori County made progress in addressing some of the challenges identified as affecting budget implementation. The County’s progress included:
i. Registered a slight improvement in local revenue collection compared to a similar period in FY 2014/15. ii Improved capacity of technical staff through training.
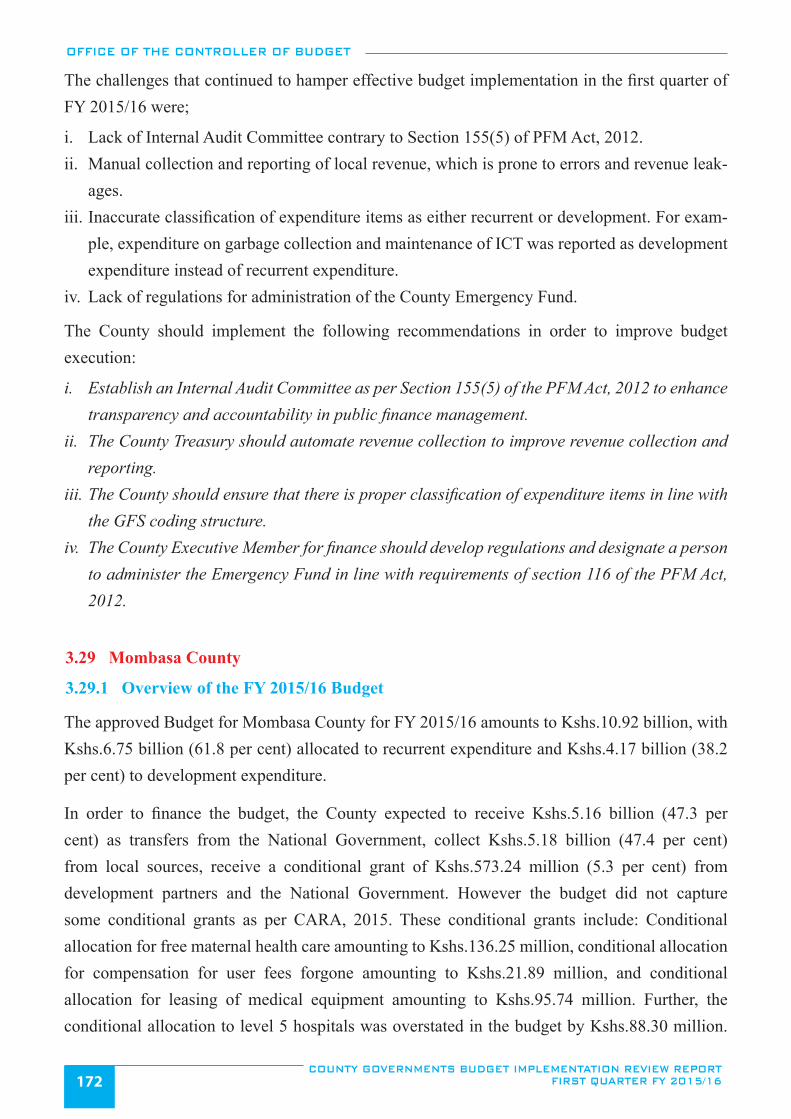
OFFICE OF THE CONTROLLER OF BUDGET
COUNTY GOVERNMENTS BUDGET IMPLEMENTATION REVIEW REPORT FIRST QUARTER FY 2015/16172
The challenges that continued to hamper effective budget implementation in the first quarter of FY 2015/16 were;
i. Lack of Internal Audit Committee contrary to Section 155(5) of PFM Act, 2012.ii. Manual collection and reporting of local revenue, which is prone to errors and revenue leak-
ages.iii. Inaccurate classification of expenditure items as either recurrent or development. For exam-
ple, expenditure on garbage collection and maintenance of ICT was reported as development expenditure instead of recurrent expenditure.
iv. Lack of regulations for administration of the County Emergency Fund.
The County should implement the following recommendations in order to improve budget execution:
i. Establish an Internal Audit Committee as per Section 155(5) of the PFM Act, 2012 to enhance transparency and accountability in public finance management.
ii. The County Treasury should automate revenue collection to improve revenue collection and reporting.
iii. The County should ensure that there is proper classification of expenditure items in line with the GFS coding structure.
iv. The County Executive Member for finance should develop regulations and designate a person to administer the Emergency Fund in line with requirements of section 116 of the PFM Act, 2012.
3.29 Mombasa County
3.29.1 Overview of the FY 2015/16 Budget
The approved Budget for Mombasa County for FY 2015/16 amounts to Kshs.10.92 billion, with Kshs.6.75 billion (61.8 per cent) allocated to recurrent expenditure and Kshs.4.17 billion (38.2 per cent) to development expenditure.
In order to finance the budget, the County expected to receive Kshs.5.16 billion (47.3 per cent) as transfers from the National Government, collect Kshs.5.18 billion (47.4 per cent) from local sources, receive a conditional grant of Kshs.573.24 million (5.3 per cent) from development partners and the National Government. However the budget did not capture some conditional grants as per CARA, 2015. These conditional grants include: Conditional allocation for free maternal health care amounting to Kshs.136.25 million, conditional allocation for compensation for user fees forgone amounting to Kshs.21.89 million, and conditional allocation for leasing of medical equipment amounting to Kshs.95.74 million. Further, the conditional allocation to level 5 hospitals was overstated in the budget by Kshs.88.30 million.
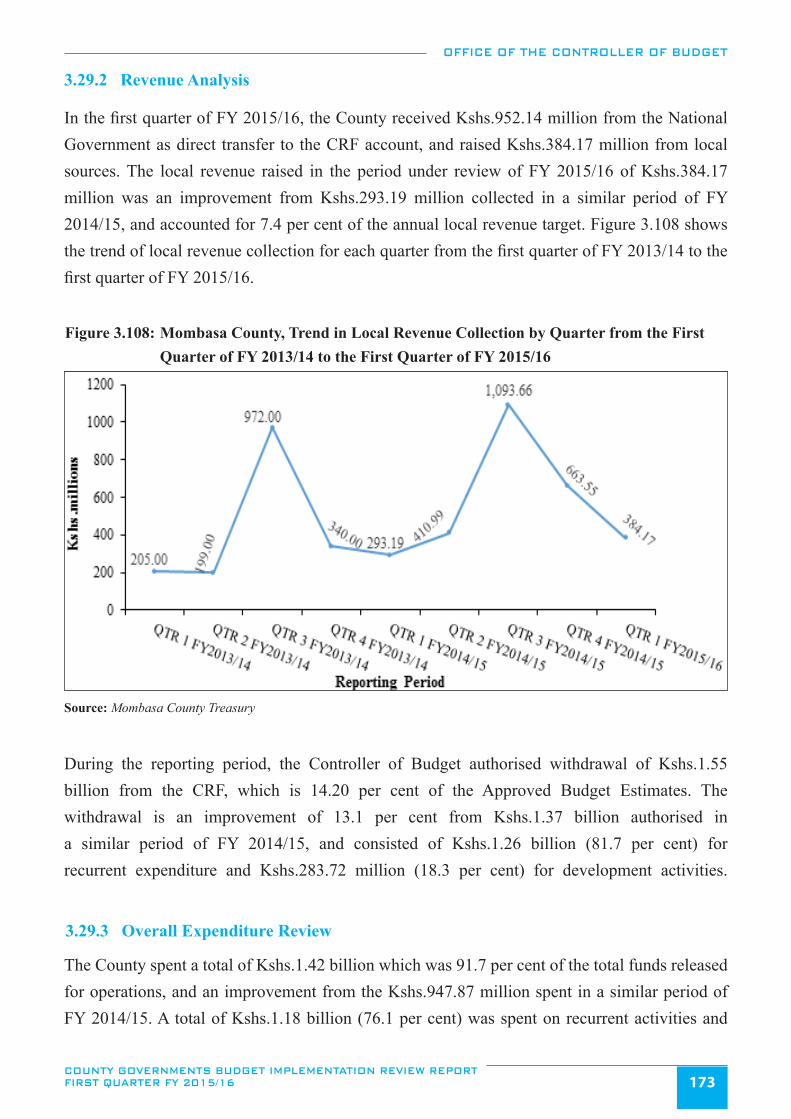
OFFICE OF THE CONTROLLER OF BUDGET
COUNTY GOVERNMENTS BUDGET IMPLEMENTATION REVIEW REPORT FIRST QUARTER FY 2015/16 173
3.29.2 Revenue Analysis
In the first quarter of FY 2015/16, the County received Kshs.952.14 million from the National Government as direct transfer to the CRF account, and raised Kshs.384.17 million from local sources. The local revenue raised in the period under review of FY 2015/16 of Kshs.384.17 million was an improvement from Kshs.293.19 million collected in a similar period of FY 2014/15, and accounted for 7.4 per cent of the annual local revenue target. Figure 3.108 shows the trend of local revenue collection for each quarter from the first quarter of FY 2013/14 to the first quarter of FY 2015/16.
Figure 3.108: Mombasa County, Trend in Local Revenue Collection by Quarter from the First Quarter of FY 2013/14 to the First Quarter of FY 2015/16
Source: Mombasa County Treasury
During the reporting period, the Controller of Budget authorised withdrawal of Kshs.1.55 billion from the CRF, which is 14.20 per cent of the Approved Budget Estimates. The withdrawal is an improvement of 13.1 per cent from Kshs.1.37 billion authorised in a similar period of FY 2014/15, and consisted of Kshs.1.26 billion (81.7 per cent) for recurrent expenditure and Kshs.283.72 million (18.3 per cent) for development activities.
3.29.3 Overall Expenditure Review
The County spent a total of Kshs.1.42 billion which was 91.7 per cent of the total funds released for operations, and an improvement from the Kshs.947.87 million spent in a similar period of FY 2014/15. A total of Kshs.1.18 billion (76.1 per cent) was spent on recurrent activities and
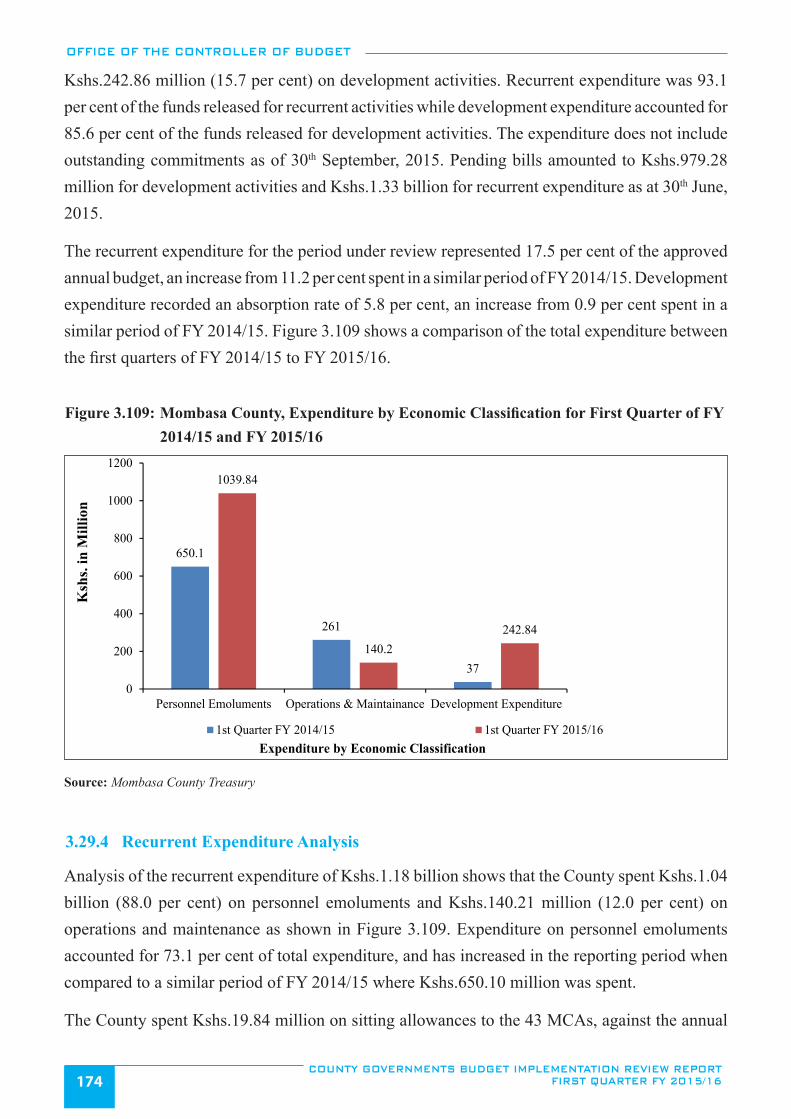
OFFICE OF THE CONTROLLER OF BUDGET
COUNTY GOVERNMENTS BUDGET IMPLEMENTATION REVIEW REPORT FIRST QUARTER FY 2015/16174
Kshs.242.86 million (15.7 per cent) on development activities. Recurrent expenditure was 93.1 per cent of the funds released for recurrent activities while development expenditure accounted for 85.6 per cent of the funds released for development activities. The expenditure does not include outstanding commitments as of 30th September, 2015. Pending bills amounted to Kshs.979.28 million for development activities and Kshs.1.33 billion for recurrent expenditure as at 30th June, 2015.
The recurrent expenditure for the period under review represented 17.5 per cent of the approved annual budget, an increase from 11.2 per cent spent in a similar period of FY 2014/15. Development expenditure recorded an absorption rate of 5.8 per cent, an increase from 0.9 per cent spent in a similar period of FY 2014/15. Figure 3.109 shows a comparison of the total expenditure between the first quarters of FY 2014/15 to FY 2015/16.
Figure 3.109: Mombasa County, Expenditure by Economic Classification for First Quarter of FY 2014/15 and FY 2015/16
650.1
261
37
1039.84
140.2242.84
0
200
400
600
800
1000
1200
Personnel Emoluments Operations & Maintainance Development Expenditure
Ksh
s. in
Mill
ion
Expenditure by Economic Classification1st Quarter FY 2014/15 1st Quarter FY 2015/16
Source: Mombasa County Treasury
3.29.4 Recurrent Expenditure Analysis
Analysis of the recurrent expenditure of Kshs.1.18 billion shows that the County spent Kshs.1.04 billion (88.0 per cent) on personnel emoluments and Kshs.140.21 million (12.0 per cent) on operations and maintenance as shown in Figure 3.109. Expenditure on personnel emoluments accounted for 73.1 per cent of total expenditure, and has increased in the reporting period when compared to a similar period of FY 2014/15 where Kshs.650.10 million was spent.
The County spent Kshs.19.84 million on sitting allowances to the 43 MCAs, against the annual
OFFICE OF THE CONTROLLER OF BUDGET
COUNTY GOVERNMENTS BUDGET IMPLEMENTATION REVIEW REPORT FIRST QUARTER FY 2015/16 175
sitting allowance budget of Kshs.97.84 million, an increase from Kshs.12.1 million spent in a similar period of FY 2014/15. The average monthly sitting allowance per MCA was Kshs.153,827 compared to SRC recommended monthly ceiling of Kshs.124,800.
The expenditure on domestic and foreign travel was Kshs.38.34 million compared to Kshs.0.86 million in first quarter of FY 2014/15, representing an increase of 4,358.1 per cent. This expenditure comprised of Kshs.35.8 million by the County Executive and Kshs.2.43 million by the County Assembly. A breakdown of the operations and maintenance expenditure for the reporting period is shown in Figure 3.110.
Figure 3.110: Mombasa County, Operations and Maintenance Expenditure for the First Quarter of FY 2015/16
Source: Mombasa County Treasury
3.29.5 Development Expenditure Analysis
Analysis of the development expenditure in the first quarter of FY 2015/16 indicates that the Finance and Economic department had the highest expenditure of Kshs.226.36 million which was spent on payment of pending bills from the previous financial year. Some of these pending bills include: garbage collection charges amounting to Kshs.36.72 million and maintenance of Kiembeni Estate at Kshs.23.97 million. The second highest expenditure was spent under the Youth, Sports and Gender department where a total of Kshs.9.08 million was spent on purchase of constructions materials. The Office of the Governor spent Kshs.7.40 million on purchase of office furniture. The office has noted that most of these expenditure items were wrongly classified as development items. Figure 3.111 provides a summary of development expenditure during the first quarter of the FY 2015/16.
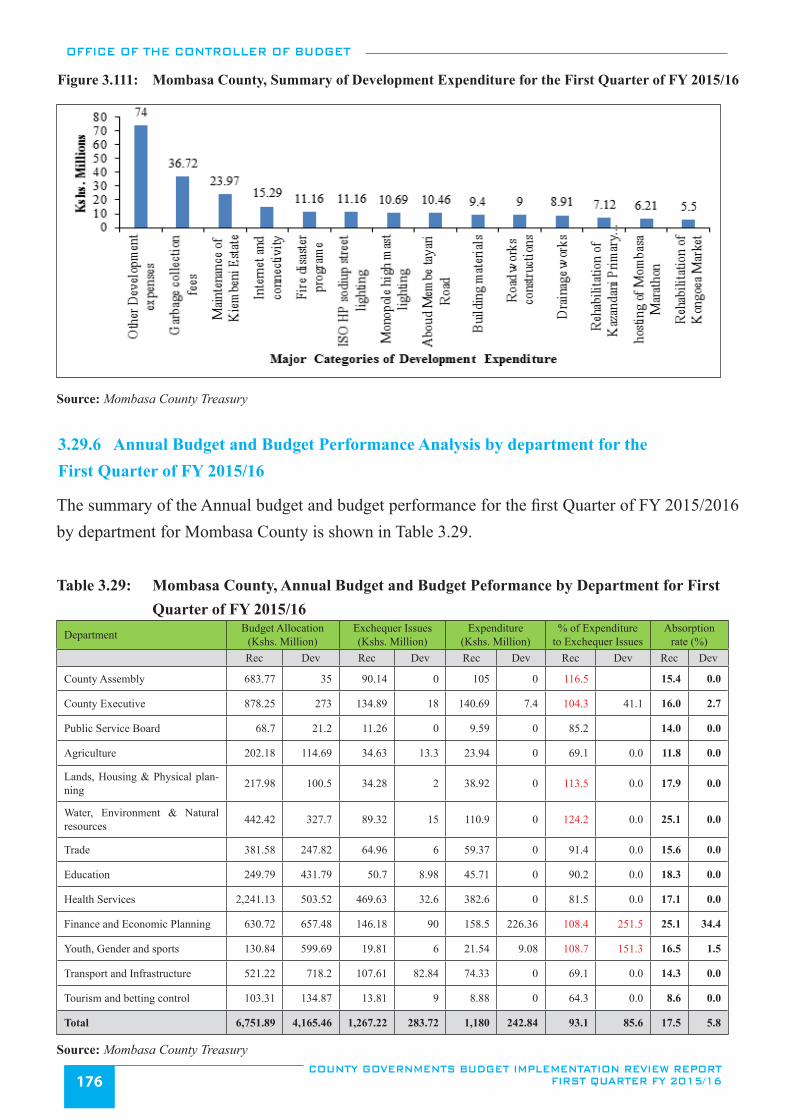
OFFICE OF THE CONTROLLER OF BUDGET
COUNTY GOVERNMENTS BUDGET IMPLEMENTATION REVIEW REPORT FIRST QUARTER FY 2015/16176
Figure 3.111: Mombasa County, Summary of Development Expenditure for the First Quarter of FY 2015/16
Source: Mombasa County Treasury
3.29.6 Annual Budget and Budget Performance Analysis by department for the First Quarter of FY 2015/16
The summary of the Annual budget and budget performance for the first Quarter of FY 2015/2016 by department for Mombasa County is shown in Table 3.29.
Table 3.29: Mombasa County, Annual Budget and Budget Peformance by Department for First Quarter of FY 2015/16
Department Budget Allocation (Kshs. Million)
Exchequer Issues (Kshs. Million)
Expenditure (Kshs. Million)
% of Expenditure to Exchequer Issues
Absorption rate (%)
Rec Dev Rec Dev Rec Dev Rec Dev Rec Dev
County Assembly 683.77 35 90.14 0 105 0 116.5 15.4 0.0
County Executive 878.25 273 134.89 18 140.69 7.4 104.3 41.1 16.0 2.7
Public Service Board 68.7 21.2 11.26 0 9.59 0 85.2 14.0 0.0
Agriculture 202.18 114.69 34.63 13.3 23.94 0 69.1 0.0 11.8 0.0
Lands, Housing & Physical plan-ning 217.98 100.5 34.28 2 38.92 0 113.5 0.0 17.9 0.0
Water, Environment & Natural resources 442.42 327.7 89.32 15 110.9 0 124.2 0.0 25.1 0.0
Trade 381.58 247.82 64.96 6 59.37 0 91.4 0.0 15.6 0.0
Education 249.79 431.79 50.7 8.98 45.71 0 90.2 0.0 18.3 0.0
Health Services 2,241.13 503.52 469.63 32.6 382.6 0 81.5 0.0 17.1 0.0
Finance and Economic Planning 630.72 657.48 146.18 90 158.5 226.36 108.4 251.5 25.1 34.4
Youth, Gender and sports 130.84 599.69 19.81 6 21.54 9.08 108.7 151.3 16.5 1.5
Transport and Infrastructure 521.22 718.2 107.61 82.84 74.33 0 69.1 0.0 14.3 0.0
Tourism and betting control 103.31 134.87 13.81 9 8.88 0 64.3 0.0 8.6 0.0
Total 6,751.89 4,165.46 1,267.22 283.72 1,180 242.84 93.1 85.6 17.5 5.8
Source: Mombasa County Treasury
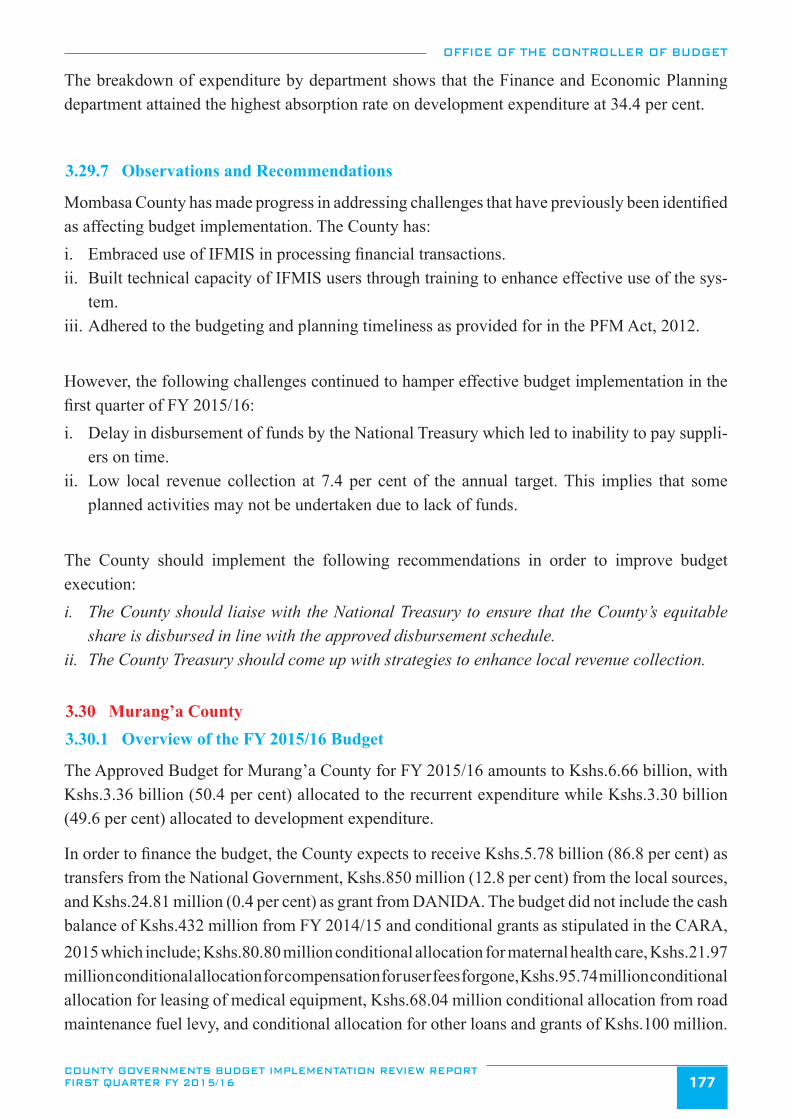
OFFICE OF THE CONTROLLER OF BUDGET
COUNTY GOVERNMENTS BUDGET IMPLEMENTATION REVIEW REPORT FIRST QUARTER FY 2015/16 177
The breakdown of expenditure by department shows that the Finance and Economic Planning department attained the highest absorption rate on development expenditure at 34.4 per cent.
3.29.7 Observations and Recommendations
Mombasa County has made progress in addressing challenges that have previously been identified as affecting budget implementation. The County has: i. Embraced use of IFMIS in processing financial transactions. ii. Built technical capacity of IFMIS users through training to enhance effective use of the sys-
tem.iii. Adhered to the budgeting and planning timeliness as provided for in the PFM Act, 2012.
However, the following challenges continued to hamper effective budget implementation in the first quarter of FY 2015/16:i. Delay in disbursement of funds by the National Treasury which led to inability to pay suppli-
ers on time.ii. Low local revenue collection at 7.4 per cent of the annual target. This implies that some
planned activities may not be undertaken due to lack of funds.
The County should implement the following recommendations in order to improve budget execution:i. The County should liaise with the National Treasury to ensure that the County’s equitable
share is disbursed in line with the approved disbursement schedule.ii. The County Treasury should come up with strategies to enhance local revenue collection.
3.30 Murang’a County3.30.1 Overview of the FY 2015/16 Budget
The Approved Budget for Murang’a County for FY 2015/16 amounts to Kshs.6.66 billion, with Kshs.3.36 billion (50.4 per cent) allocated to the recurrent expenditure while Kshs.3.30 billion (49.6 per cent) allocated to development expenditure.
In order to finance the budget, the County expects to receive Kshs.5.78 billion (86.8 per cent) as transfers from the National Government, Kshs.850 million (12.8 per cent) from the local sources, and Kshs.24.81 million (0.4 per cent) as grant from DANIDA. The budget did not include the cash balance of Kshs.432 million from FY 2014/15 and conditional grants as stipulated in the CARA, 2015 which include; Kshs.80.80 million conditional allocation for maternal health care, Kshs.21.97 million conditional allocation for compensation for user fees forgone, Kshs.95.74 million conditional allocation for leasing of medical equipment, Kshs.68.04 million conditional allocation from road maintenance fuel levy, and conditional allocation for other loans and grants of Kshs.100 million.
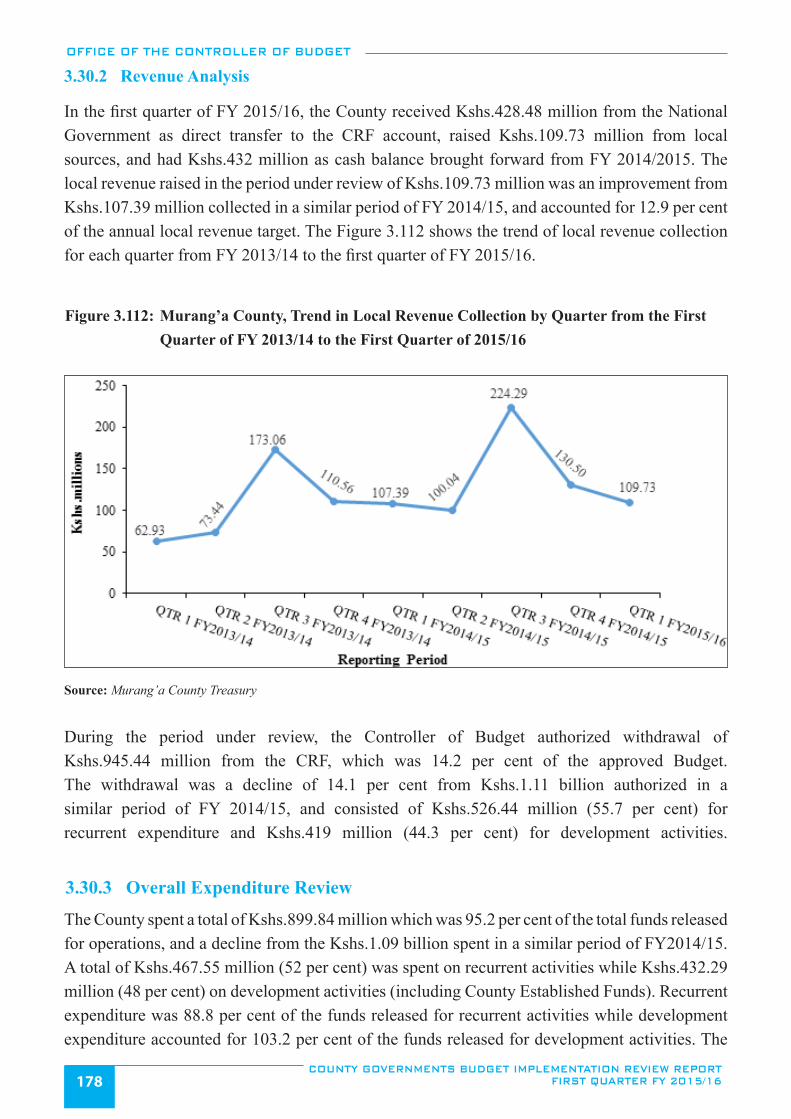
OFFICE OF THE CONTROLLER OF BUDGET
COUNTY GOVERNMENTS BUDGET IMPLEMENTATION REVIEW REPORT FIRST QUARTER FY 2015/16178
3.30.2 Revenue Analysis
In the first quarter of FY 2015/16, the County received Kshs.428.48 million from the National Government as direct transfer to the CRF account, raised Kshs.109.73 million from local sources, and had Kshs.432 million as cash balance brought forward from FY 2014/2015. The local revenue raised in the period under review of Kshs.109.73 million was an improvement from Kshs.107.39 million collected in a similar period of FY 2014/15, and accounted for 12.9 per cent of the annual local revenue target. The Figure 3.112 shows the trend of local revenue collection for each quarter from FY 2013/14 to the first quarter of FY 2015/16.
Figure 3.112: Murang’a County, Trend in Local Revenue Collection by Quarter from the First Quarter of FY 2013/14 to the First Quarter of 2015/16
Source: Murang’a County Treasury
During the period under review, the Controller of Budget authorized withdrawal of Kshs.945.44 million from the CRF, which was 14.2 per cent of the approved Budget. The withdrawal was a decline of 14.1 per cent from Kshs.1.11 billion authorized in a similar period of FY 2014/15, and consisted of Kshs.526.44 million (55.7 per cent) for recurrent expenditure and Kshs.419 million (44.3 per cent) for development activities.
3.30.3 Overall Expenditure Review
The County spent a total of Kshs.899.84 million which was 95.2 per cent of the total funds released for operations, and a decline from the Kshs.1.09 billion spent in a similar period of FY2014/15. A total of Kshs.467.55 million (52 per cent) was spent on recurrent activities while Kshs.432.29 million (48 per cent) on development activities (including County Established Funds). Recurrent expenditure was 88.8 per cent of the funds released for recurrent activities while development expenditure accounted for 103.2 per cent of the funds released for development activities. The
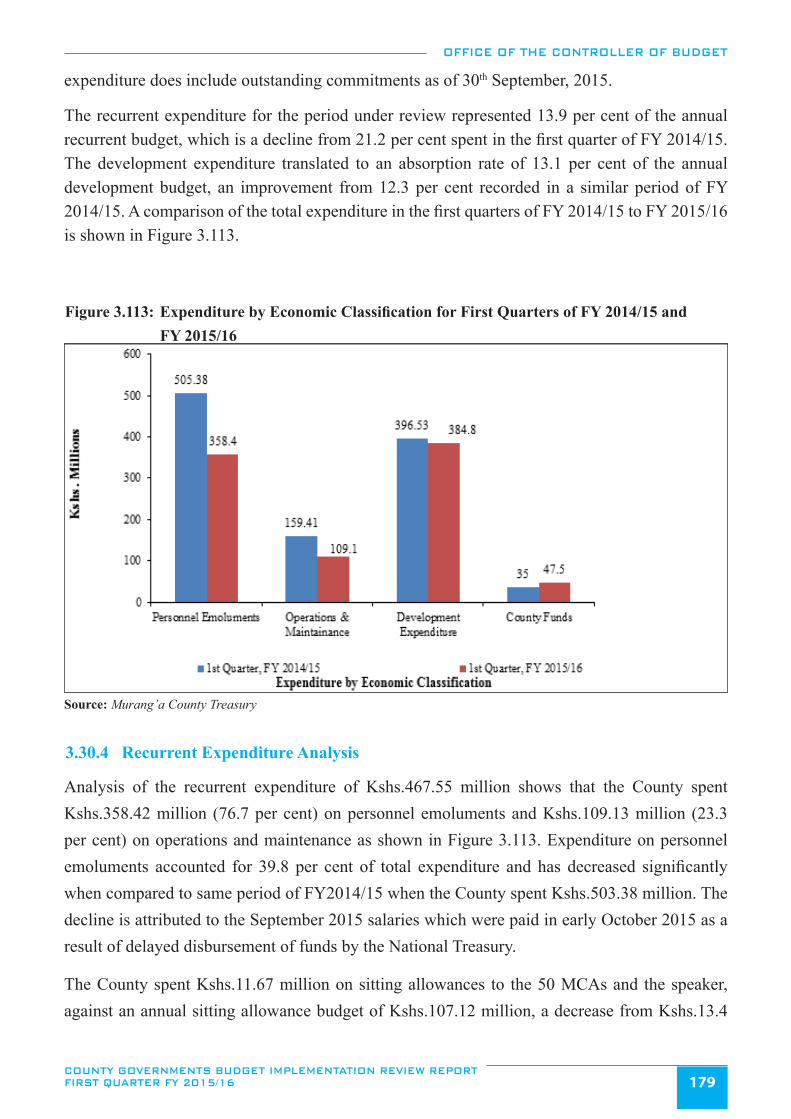
OFFICE OF THE CONTROLLER OF BUDGET
COUNTY GOVERNMENTS BUDGET IMPLEMENTATION REVIEW REPORT FIRST QUARTER FY 2015/16 179
expenditure does include outstanding commitments as of 30th September, 2015.
The recurrent expenditure for the period under review represented 13.9 per cent of the annual recurrent budget, which is a decline from 21.2 per cent spent in the first quarter of FY 2014/15. The development expenditure translated to an absorption rate of 13.1 per cent of the annual development budget, an improvement from 12.3 per cent recorded in a similar period of FY 2014/15. A comparison of the total expenditure in the first quarters of FY 2014/15 to FY 2015/16 is shown in Figure 3.113.
Figure 3.113: Expenditure by Economic Classification for First Quarters of FY 2014/15 and FY 2015/16
Source: Murang’a County Treasury
3.30.4 Recurrent Expenditure Analysis
Analysis of the recurrent expenditure of Kshs.467.55 million shows that the County spent Kshs.358.42 million (76.7 per cent) on personnel emoluments and Kshs.109.13 million (23.3 per cent) on operations and maintenance as shown in Figure 3.113. Expenditure on personnel emoluments accounted for 39.8 per cent of total expenditure and has decreased significantly when compared to same period of FY2014/15 when the County spent Kshs.503.38 million. The decline is attributed to the September 2015 salaries which were paid in early October 2015 as a result of delayed disbursement of funds by the National Treasury.
The County spent Kshs.11.67 million on sitting allowances to the 50 MCAs and the speaker, against an annual sitting allowance budget of Kshs.107.12 million, a decrease from Kshs.13.4
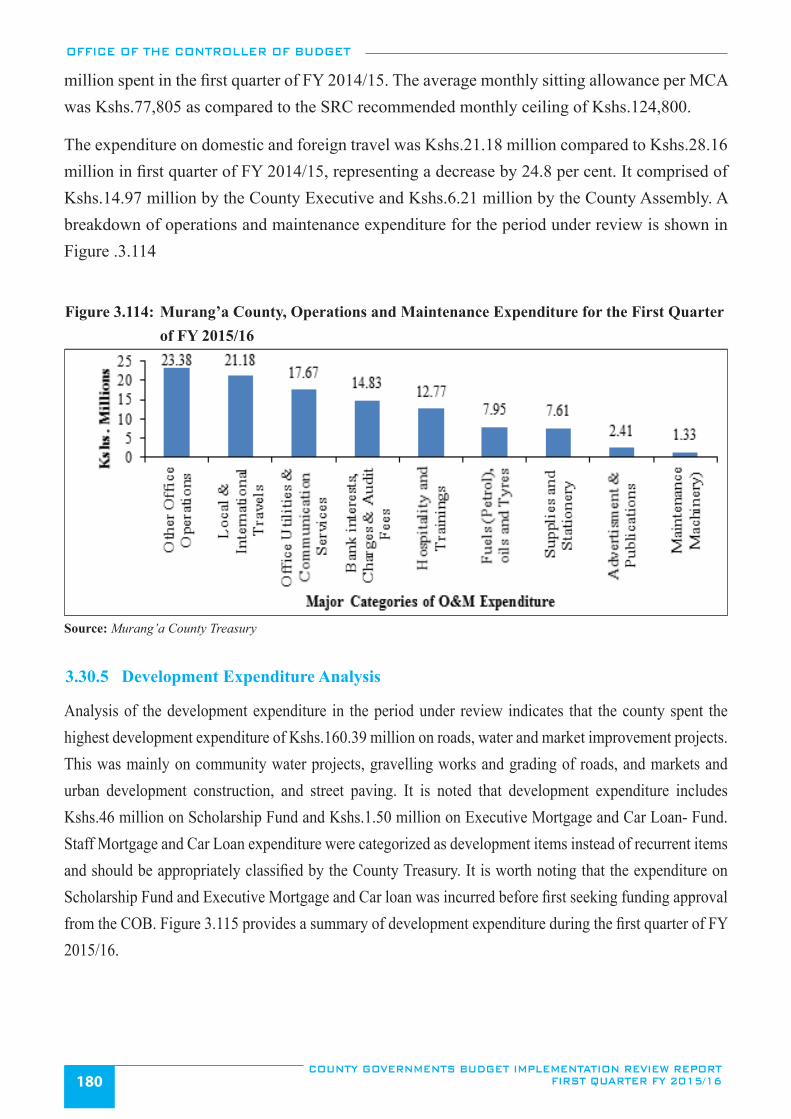
OFFICE OF THE CONTROLLER OF BUDGET
COUNTY GOVERNMENTS BUDGET IMPLEMENTATION REVIEW REPORT FIRST QUARTER FY 2015/16180
million spent in the first quarter of FY 2014/15. The average monthly sitting allowance per MCA was Kshs.77,805 as compared to the SRC recommended monthly ceiling of Kshs.124,800.
The expenditure on domestic and foreign travel was Kshs.21.18 million compared to Kshs.28.16 million in first quarter of FY 2014/15, representing a decrease by 24.8 per cent. It comprised of Kshs.14.97 million by the County Executive and Kshs.6.21 million by the County Assembly. A breakdown of operations and maintenance expenditure for the period under review is shown in Figure .3.114
Figure 3.114: Murang’a County, Operations and Maintenance Expenditure for the First Quarter of FY 2015/16
Source: Murang’a County Treasury
3.30.5 Development Expenditure Analysis
Analysis of the development expenditure in the period under review indicates that the county spent the highest development expenditure of Kshs.160.39 million on roads, water and market improvement projects. This was mainly on community water projects, gravelling works and grading of roads, and markets and urban development construction, and street paving. It is noted that development expenditure includes Kshs.46 million on Scholarship Fund and Kshs.1.50 million on Executive Mortgage and Car Loan- Fund. Staff Mortgage and Car Loan expenditure were categorized as development items instead of recurrent items and should be appropriately classified by the County Treasury. It is worth noting that the expenditure on Scholarship Fund and Executive Mortgage and Car loan was incurred before first seeking funding approval from the COB. Figure 3.115 provides a summary of development expenditure during the first quarter of FY 2015/16.
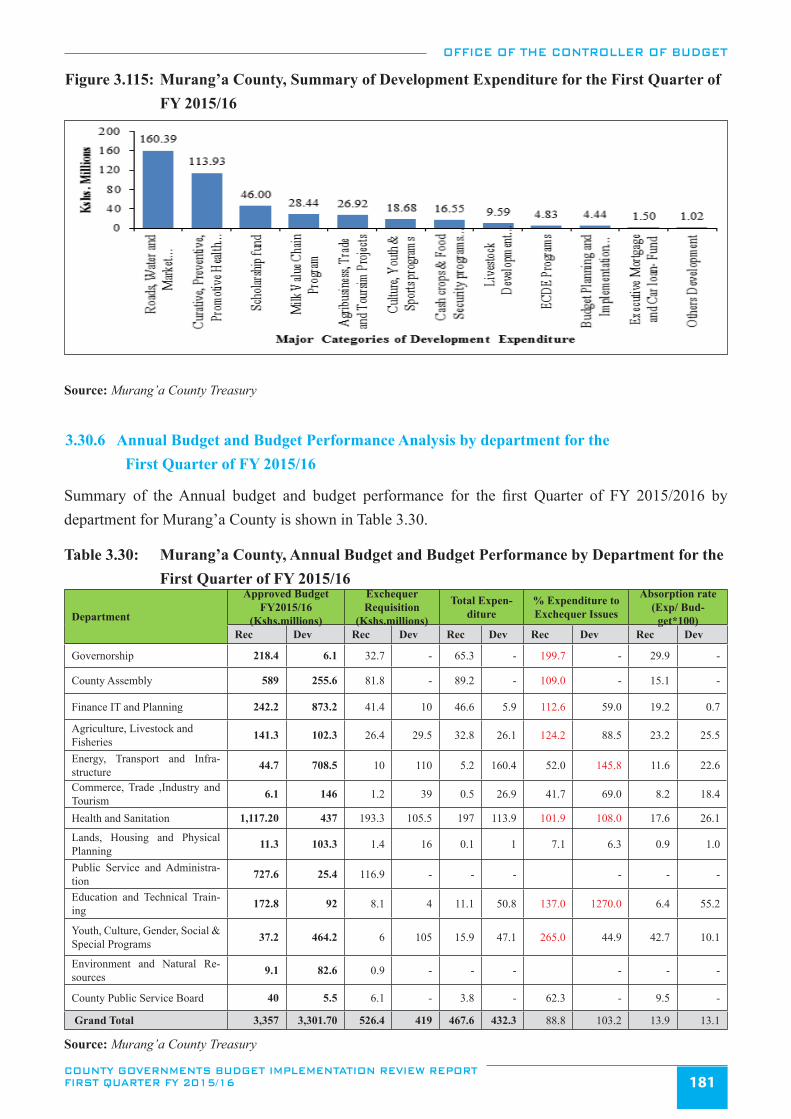
OFFICE OF THE CONTROLLER OF BUDGET
COUNTY GOVERNMENTS BUDGET IMPLEMENTATION REVIEW REPORT FIRST QUARTER FY 2015/16 181
Figure 3.115: Murang’a County, Summary of Development Expenditure for the First Quarter of FY 2015/16
Source: Murang’a County Treasury
3.30.6 Annual Budget and Budget Performance Analysis by department for the First Quarter of FY 2015/16
Summary of the Annual budget and budget performance for the first Quarter of FY 2015/2016 by department for Murang’a County is shown in Table 3.30.
Table 3.30: Murang’a County, Annual Budget and Budget Performance by Department for the First Quarter of FY 2015/16
Department
Approved Budget FY2015/16
(Kshs.millions)
Exchequer Requisition
(Kshs.millions)
Total Expen-diture
% Expenditure to Exchequer Issues
Absorption rate (Exp/ Bud-
get*100)Rec Dev Rec Dev Rec Dev Rec Dev Rec Dev
Governorship 218.4 6.1 32.7 - 65.3 - 199.7 - 29.9 -
County Assembly 589 255.6 81.8 - 89.2 - 109.0 - 15.1 -
Finance IT and Planning 242.2 873.2 41.4 10 46.6 5.9 112.6 59.0 19.2 0.7
Agriculture, Livestock and Fisheries 141.3 102.3 26.4 29.5 32.8 26.1 124.2 88.5 23.2 25.5
Energy, Transport and Infra-structure 44.7 708.5 10 110 5.2 160.4 52.0 145.8 11.6 22.6
Commerce, Trade ,Industry and Tourism 6.1 146 1.2 39 0.5 26.9 41.7 69.0 8.2 18.4
Health and Sanitation 1,117.20 437 193.3 105.5 197 113.9 101.9 108.0 17.6 26.1
Lands, Housing and Physical Planning 11.3 103.3 1.4 16 0.1 1 7.1 6.3 0.9 1.0
Public Service and Administra-tion 727.6 25.4 116.9 - - - - - -
Education and Technical Train-ing 172.8 92 8.1 4 11.1 50.8 137.0 1270.0 6.4 55.2
Youth, Culture, Gender, Social & Special Programs 37.2 464.2 6 105 15.9 47.1 265.0 44.9 42.7 10.1
Environment and Natural Re-sources 9.1 82.6 0.9 - - - - - -
County Public Service Board 40 5.5 6.1 - 3.8 - 62.3 - 9.5 -
Grand Total 3,357 3,301.70 526.4 419 467.6 432.3 88.8 103.2 13.9 13.1
Source: Murang’a County Treasury
OFFICE OF THE CONTROLLER OF BUDGET
COUNTY GOVERNMENTS BUDGET IMPLEMENTATION REVIEW REPORT FIRST QUARTER FY 2015/16182
The breakdown of expenditure by department shows that the Education department had the highest absorption rate of its annual development budget at 55.2 per cent, followed by Health and Sanitation at 26.1 per cent. The department of Youth, Culture, Gender, Social and Special programs recorded the highest absorption rate of its annual recurrent budget at 42.7per cent followed by Office of the Governor at 29.9 per cent.
3.30.7 Observations and Recommendations
Murang’a County has made progress in addressing some of the challenges that were identified as affecting budget implementation. The County has;
i. Ensured and encouraged financial independence of the spending entities unlike in the previ-ous financial years when spending was centrally controlled by the County Treasury.
ii. Set realistic revenue target for the FY 2015/16. This implies there will be smooth implemen-tation of activities without disruptions due to lack of funds.
Despite the progress, the following challenges continued to hamper effective budget implementation in the first quarter of FY 2015/16;
i. The County Assembly did not refund the unspent balance of Kshs.12.41 million at the end of the FY 2014/15 to the CRF account. This is contrary to Section 136 of PFM Act 2012 and implies that the expenditure arising from the unspent amount is irregular and should be regu-larized through a Supplementary Budget.
ii. Delayed submission of expenditure reports by the County Treasury contrary to Section 166 of the PFM Act, 2012.
iii. The revenue estimates provided in the approved budget differed with the amounts in CARA, 2015. The inconsistencies in the budget and CARA, 2015 should be addressed through a Supplementary Budget.
iv. Delay in release of funds by the National Treasury that led to delay in the payment of staff salaries for the month of September, 2015.
The County should implement the following recommendations in order to improve budget execution:
i. The County Treasury should prepare a Supplementary Budget for approval by the County Assembly, to appropriate the un-refunded funds to CRF which were used to defray recurrent expenditure in FY 2015/16.
ii. The County Treasury should adhere to the reporting timeliness as provided in the PFM Act, 2012 and Circulars.
iii. The inconsistencies in the revenue estimates in the approved budget and CARA, 2015 should be reconciled and corrected through a Supplementary Budget.
iv. The County Treasury should liaise with the National Treasury to ensure timely exchequer
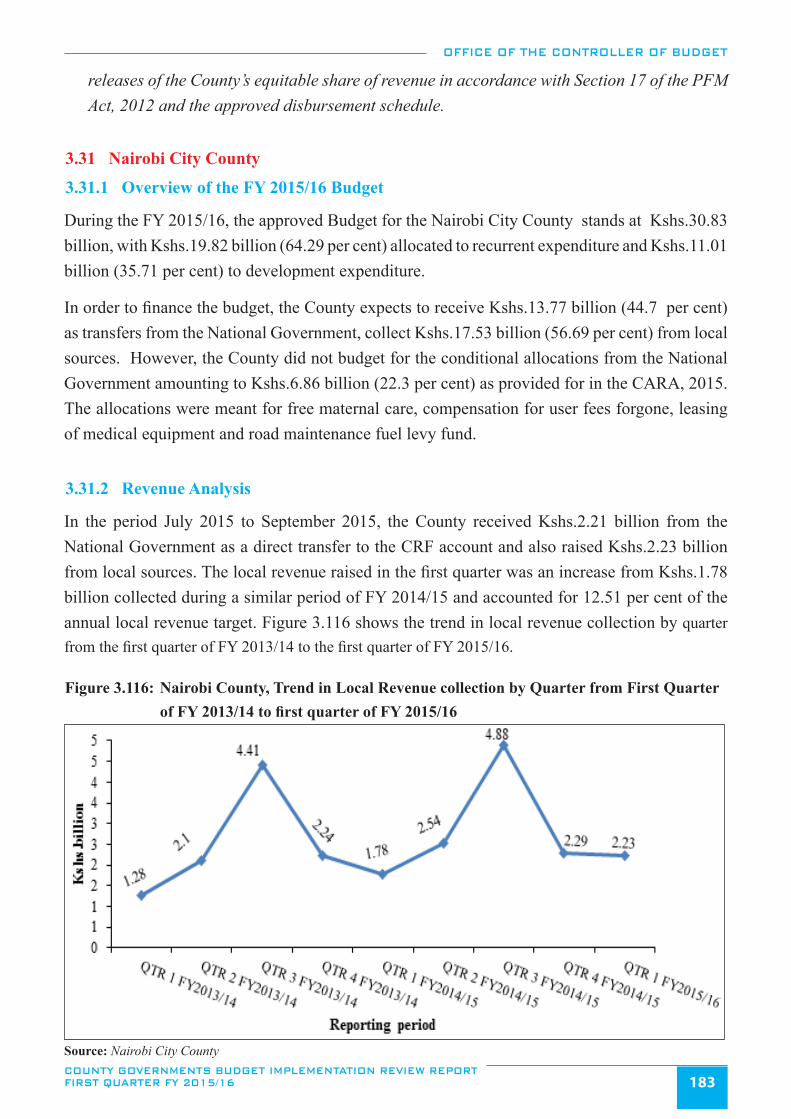
OFFICE OF THE CONTROLLER OF BUDGET
COUNTY GOVERNMENTS BUDGET IMPLEMENTATION REVIEW REPORT FIRST QUARTER FY 2015/16 183
releases of the County’s equitable share of revenue in accordance with Section 17 of the PFM Act, 2012 and the approved disbursement schedule.
3.31 Nairobi City County
3.31.1 Overview of the FY 2015/16 Budget
During the FY 2015/16, the approved Budget for the Nairobi City County stands at Kshs.30.83 billion, with Kshs.19.82 billion (64.29 per cent) allocated to recurrent expenditure and Kshs.11.01 billion (35.71 per cent) to development expenditure.
In order to finance the budget, the County expects to receive Kshs.13.77 billion (44.7 per cent) as transfers from the National Government, collect Kshs.17.53 billion (56.69 per cent) from local sources. However, the County did not budget for the conditional allocations from the National Government amounting to Kshs.6.86 billion (22.3 per cent) as provided for in the CARA, 2015. The allocations were meant for free maternal care, compensation for user fees forgone, leasing of medical equipment and road maintenance fuel levy fund.
3.31.2 Revenue Analysis
In the period July 2015 to September 2015, the County received Kshs.2.21 billion from the National Government as a direct transfer to the CRF account and also raised Kshs.2.23 billion from local sources. The local revenue raised in the first quarter was an increase from Kshs.1.78 billion collected during a similar period of FY 2014/15 and accounted for 12.51 per cent of the annual local revenue target. Figure 3.116 shows the trend in local revenue collection by quarter from the first quarter of FY 2013/14 to the first quarter of FY 2015/16.
Figure 3.116: Nairobi County, Trend in Local Revenue collection by Quarter from First Quarter of FY 2013/14 to first quarter of FY 2015/16
Source: Nairobi City County
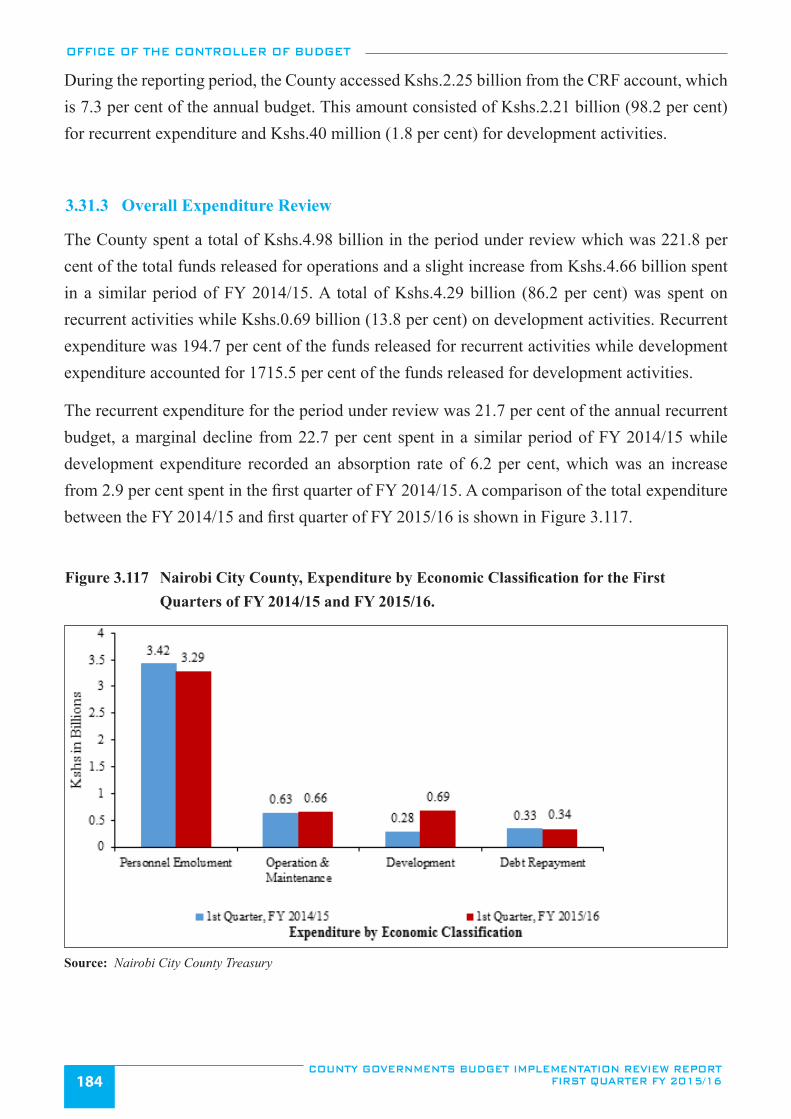
OFFICE OF THE CONTROLLER OF BUDGET
COUNTY GOVERNMENTS BUDGET IMPLEMENTATION REVIEW REPORT FIRST QUARTER FY 2015/16184
During the reporting period, the County accessed Kshs.2.25 billion from the CRF account, which is 7.3 per cent of the annual budget. This amount consisted of Kshs.2.21 billion (98.2 per cent) for recurrent expenditure and Kshs.40 million (1.8 per cent) for development activities.
3.31.3 Overall Expenditure Review
The County spent a total of Kshs.4.98 billion in the period under review which was 221.8 per cent of the total funds released for operations and a slight increase from Kshs.4.66 billion spent in a similar period of FY 2014/15. A total of Kshs.4.29 billion (86.2 per cent) was spent on recurrent activities while Kshs.0.69 billion (13.8 per cent) on development activities. Recurrent expenditure was 194.7 per cent of the funds released for recurrent activities while development expenditure accounted for 1715.5 per cent of the funds released for development activities.
The recurrent expenditure for the period under review was 21.7 per cent of the annual recurrent budget, a marginal decline from 22.7 per cent spent in a similar period of FY 2014/15 while development expenditure recorded an absorption rate of 6.2 per cent, which was an increase from 2.9 per cent spent in the first quarter of FY 2014/15. A comparison of the total expenditure between the FY 2014/15 and first quarter of FY 2015/16 is shown in Figure 3.117.
Figure 3.117 Nairobi City County, Expenditure by Economic Classification for the First Quarters of FY 2014/15 and FY 2015/16.
Source: Nairobi City County Treasury
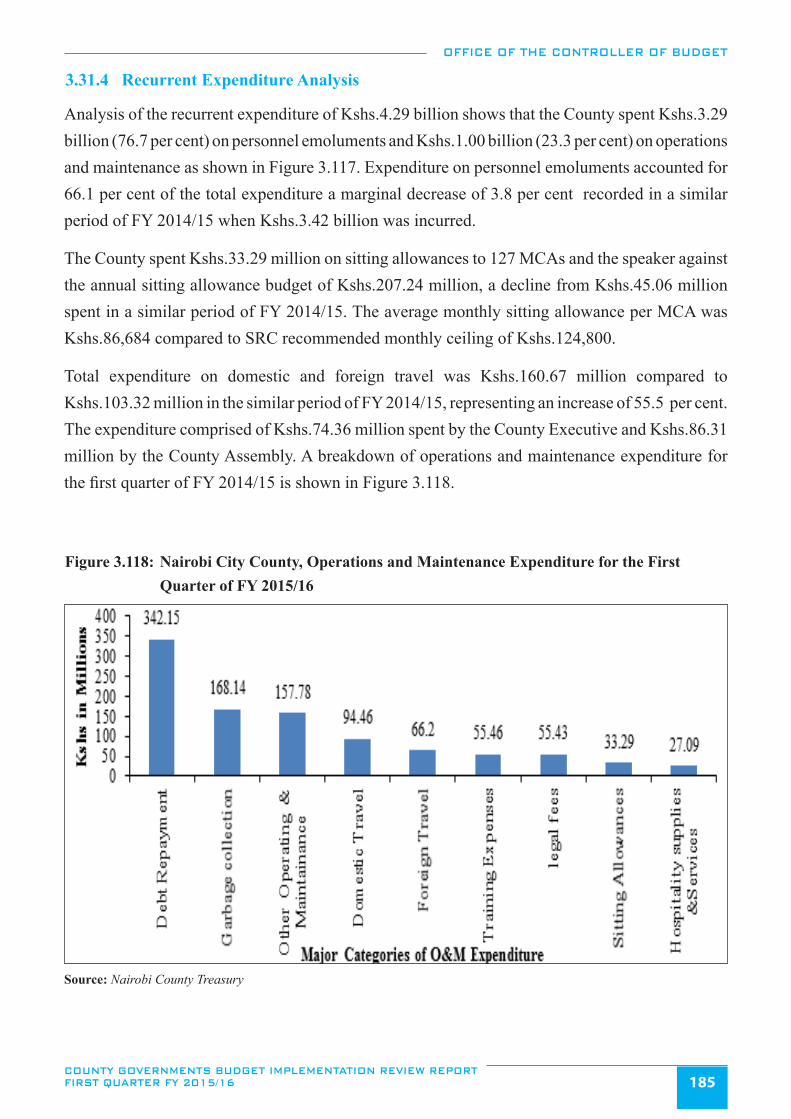
OFFICE OF THE CONTROLLER OF BUDGET
COUNTY GOVERNMENTS BUDGET IMPLEMENTATION REVIEW REPORT FIRST QUARTER FY 2015/16 185
3.31.4 Recurrent Expenditure Analysis
Analysis of the recurrent expenditure of Kshs.4.29 billion shows that the County spent Kshs.3.29 billion (76.7 per cent) on personnel emoluments and Kshs.1.00 billion (23.3 per cent) on operations and maintenance as shown in Figure 3.117. Expenditure on personnel emoluments accounted for 66.1 per cent of the total expenditure a marginal decrease of 3.8 per cent recorded in a similar period of FY 2014/15 when Kshs.3.42 billion was incurred.
The County spent Kshs.33.29 million on sitting allowances to 127 MCAs and the speaker against the annual sitting allowance budget of Kshs.207.24 million, a decline from Kshs.45.06 million spent in a similar period of FY 2014/15. The average monthly sitting allowance per MCA was Kshs.86,684 compared to SRC recommended monthly ceiling of Kshs.124,800.
Total expenditure on domestic and foreign travel was Kshs.160.67 million compared to Kshs.103.32 million in the similar period of FY 2014/15, representing an increase of 55.5 per cent. The expenditure comprised of Kshs.74.36 million spent by the County Executive and Kshs.86.31 million by the County Assembly. A breakdown of operations and maintenance expenditure for the first quarter of FY 2014/15 is shown in Figure 3.118.
Figure 3.118: Nairobi City County, Operations and Maintenance Expenditure for the First Quarter of FY 2015/16
Source: Nairobi County Treasury
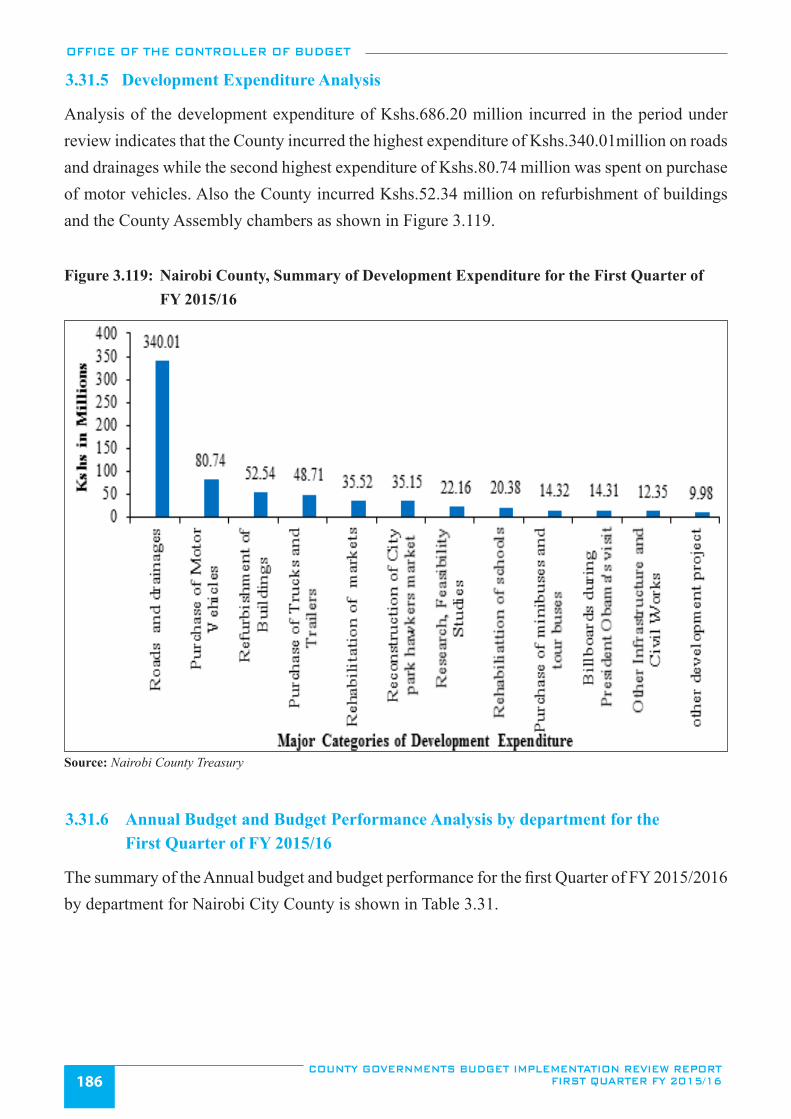
OFFICE OF THE CONTROLLER OF BUDGET
COUNTY GOVERNMENTS BUDGET IMPLEMENTATION REVIEW REPORT FIRST QUARTER FY 2015/16186
3.31.5 Development Expenditure Analysis
Analysis of the development expenditure of Kshs.686.20 million incurred in the period under review indicates that the County incurred the highest expenditure of Kshs.340.01million on roads and drainages while the second highest expenditure of Kshs.80.74 million was spent on purchase of motor vehicles. Also the County incurred Kshs.52.34 million on refurbishment of buildings and the County Assembly chambers as shown in Figure 3.119.
Figure 3.119: Nairobi County, Summary of Development Expenditure for the First Quarter of FY 2015/16
Source: Nairobi County Treasury
3.31.6 Annual Budget and Budget Performance Analysis by department for the First Quarter of FY 2015/16
The summary of the Annual budget and budget performance for the first Quarter of FY 2015/2016 by department for Nairobi City County is shown in Table 3.31.
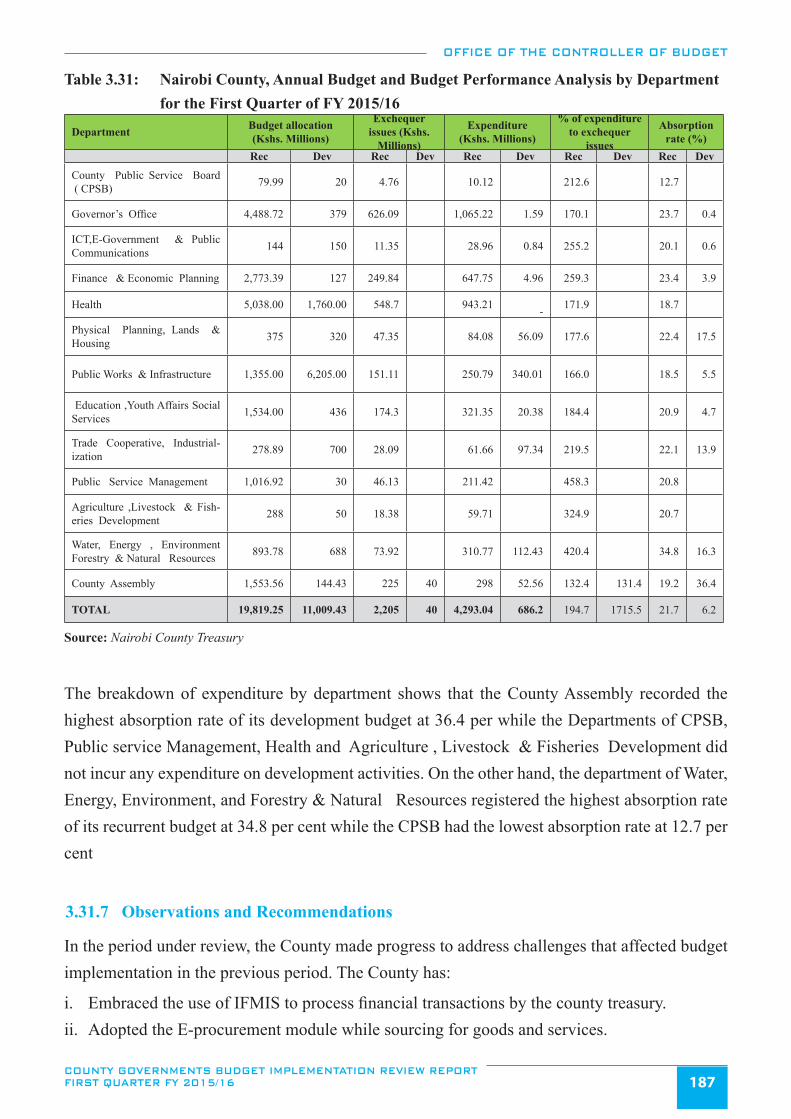
OFFICE OF THE CONTROLLER OF BUDGET
COUNTY GOVERNMENTS BUDGET IMPLEMENTATION REVIEW REPORT FIRST QUARTER FY 2015/16 187
Table 3.31: Nairobi County, Annual Budget and Budget Performance Analysis by Department for the First Quarter of FY 2015/16
Department Budget allocation (Kshs. Millions)
Exchequer issues (Kshs.
Millions)
Expenditure (Kshs. Millions)
% of expenditure to exchequer
issues
Absorption rate (%)
Rec Dev Rec Dev Rec Dev Rec Dev Rec Dev
County Public Service Board ( CPSB) 79.99 20 4.76 10.12 212.6 12.7
Governor’s Office 4,488.72 379 626.09 1,065.22 1.59 170.1 23.7 0.4
ICT,E-Government & Public Communications 144 150 11.35 28.96 0.84 255.2 20.1 0.6
Finance & Economic Planning 2,773.39 127 249.84 647.75 4.96 259.3 23.4 3.9
Health 5,038.00 1,760.00 548.7 943.21 - 171.9 18.7
Physical Planning, Lands & Housing 375 320 47.35 84.08 56.09 177.6 22.4 17.5
Public Works & Infrastructure 1,355.00 6,205.00 151.11 250.79 340.01 166.0 18.5 5.5
Education ,Youth Affairs Social Services 1,534.00 436 174.3 321.35 20.38 184.4 20.9 4.7
Trade Cooperative, Industrial-ization 278.89 700 28.09 61.66 97.34 219.5 22.1 13.9
Public Service Management 1,016.92 30 46.13 211.42 458.3 20.8
Agriculture ,Livestock & Fish-eries Development 288 50 18.38 59.71 324.9 20.7
Water, Energy , Environment Forestry & Natural Resources 893.78 688 73.92 310.77 112.43 420.4 34.8 16.3
County Assembly 1,553.56 144.43 225 40 298 52.56 132.4 131.4 19.2 36.4
TOTAL 19,819.25 11,009.43 2,205 40 4,293.04 686.2 194.7 1715.5 21.7 6.2
Source: Nairobi County Treasury
The breakdown of expenditure by department shows that the County Assembly recorded the highest absorption rate of its development budget at 36.4 per while the Departments of CPSB, Public service Management, Health and Agriculture , Livestock & Fisheries Development did not incur any expenditure on development activities. On the other hand, the department of Water, Energy, Environment, and Forestry & Natural Resources registered the highest absorption rate of its recurrent budget at 34.8 per cent while the CPSB had the lowest absorption rate at 12.7 per cent
3.31.7 Observations and Recommendations
In the period under review, the County made progress to address challenges that affected budget implementation in the previous period. The County has:
i. Embraced the use of IFMIS to process financial transactions by the county treasury.ii. Adopted the E-procurement module while sourcing for goods and services.
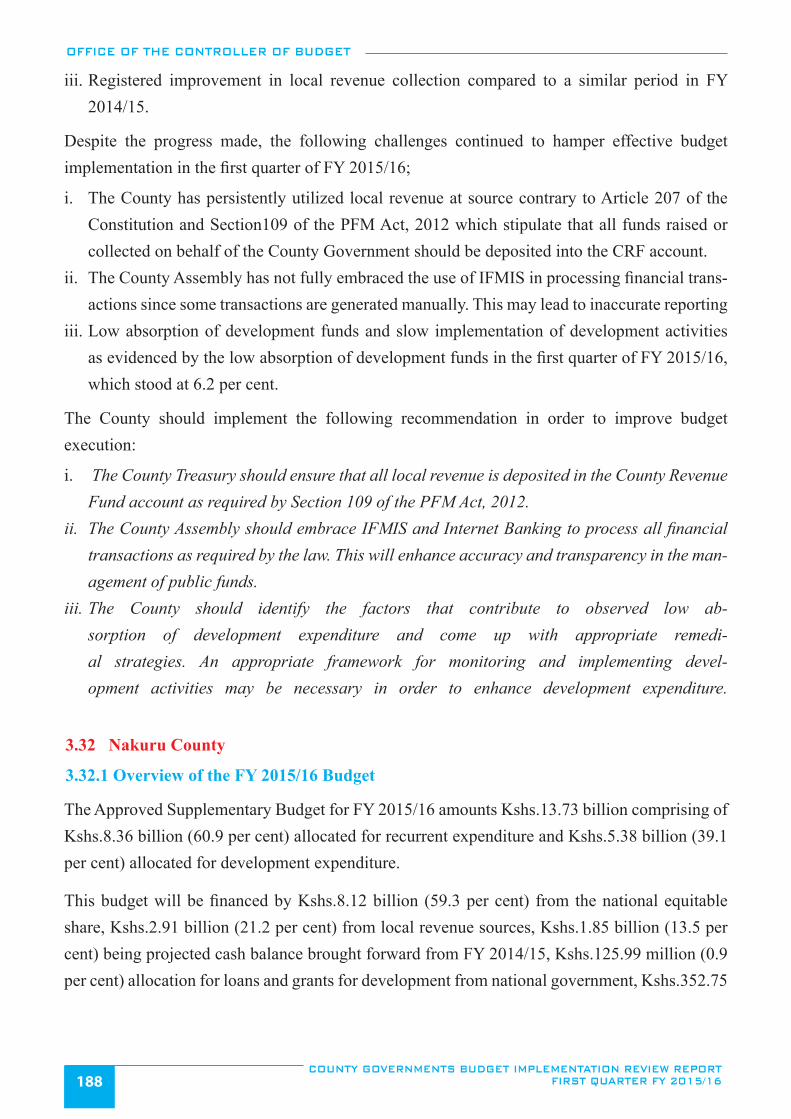
OFFICE OF THE CONTROLLER OF BUDGET
COUNTY GOVERNMENTS BUDGET IMPLEMENTATION REVIEW REPORT FIRST QUARTER FY 2015/16188
iii. Registered improvement in local revenue collection compared to a similar period in FY 2014/15.
Despite the progress made, the following challenges continued to hamper effective budget implementation in the first quarter of FY 2015/16;
i. The County has persistently utilized local revenue at source contrary to Article 207 of the Constitution and Section109 of the PFM Act, 2012 which stipulate that all funds raised or collected on behalf of the County Government should be deposited into the CRF account.
ii. The County Assembly has not fully embraced the use of IFMIS in processing financial trans-actions since some transactions are generated manually. This may lead to inaccurate reporting
iii. Low absorption of development funds and slow implementation of development activities as evidenced by the low absorption of development funds in the first quarter of FY 2015/16, which stood at 6.2 per cent.
The County should implement the following recommendation in order to improve budget execution:
i. The County Treasury should ensure that all local revenue is deposited in the County Revenue Fund account as required by Section 109 of the PFM Act, 2012.
ii. The County Assembly should embrace IFMIS and Internet Banking to process all financial transactions as required by the law. This will enhance accuracy and transparency in the man-agement of public funds.
iii. The County should identify the factors that contribute to observed low ab-sorption of development expenditure and come up with appropriate remedi-al strategies. An appropriate framework for monitoring and implementing devel-opment activities may be necessary in order to enhance development expenditure.
3.32 Nakuru County
3.32.1 Overview of the FY 2015/16 Budget
The Approved Supplementary Budget for FY 2015/16 amounts Kshs.13.73 billion comprising of Kshs.8.36 billion (60.9 per cent) allocated for recurrent expenditure and Kshs.5.38 billion (39.1 per cent) allocated for development expenditure.
This budget will be financed by Kshs.8.12 billion (59.3 per cent) from the national equitable share, Kshs.2.91 billion (21.2 per cent) from local revenue sources, Kshs.1.85 billion (13.5 per cent) being projected cash balance brought forward from FY 2014/15, Kshs.125.99 million (0.9 per cent) allocation for loans and grants for development from national government, Kshs.352.75
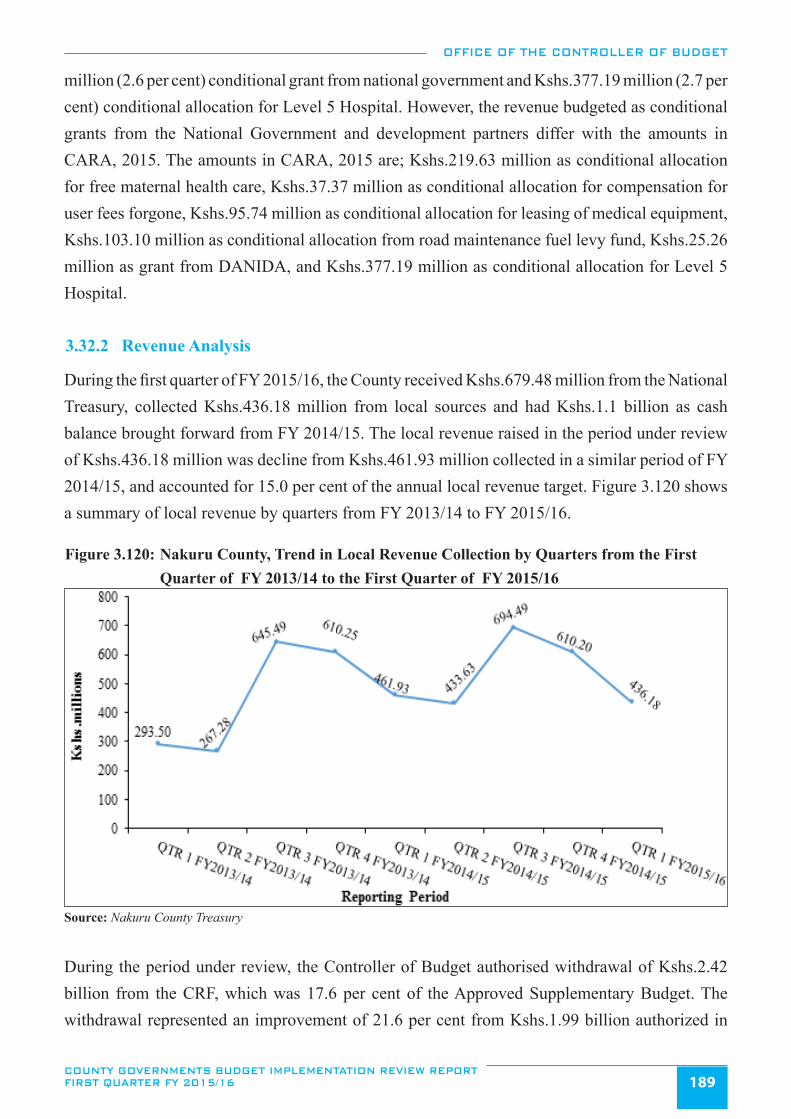
OFFICE OF THE CONTROLLER OF BUDGET
COUNTY GOVERNMENTS BUDGET IMPLEMENTATION REVIEW REPORT FIRST QUARTER FY 2015/16 189
million (2.6 per cent) conditional grant from national government and Kshs.377.19 million (2.7 per cent) conditional allocation for Level 5 Hospital. However, the revenue budgeted as conditional grants from the National Government and development partners differ with the amounts in CARA, 2015. The amounts in CARA, 2015 are; Kshs.219.63 million as conditional allocation for free maternal health care, Kshs.37.37 million as conditional allocation for compensation for user fees forgone, Kshs.95.74 million as conditional allocation for leasing of medical equipment, Kshs.103.10 million as conditional allocation from road maintenance fuel levy fund, Kshs.25.26 million as grant from DANIDA, and Kshs.377.19 million as conditional allocation for Level 5 Hospital. 3.32.2 Revenue Analysis
During the first quarter of FY 2015/16, the County received Kshs.679.48 million from the National Treasury, collected Kshs.436.18 million from local sources and had Kshs.1.1 billion as cash balance brought forward from FY 2014/15. The local revenue raised in the period under review of Kshs.436.18 million was decline from Kshs.461.93 million collected in a similar period of FY 2014/15, and accounted for 15.0 per cent of the annual local revenue target. Figure 3.120 shows a summary of local revenue by quarters from FY 2013/14 to FY 2015/16.
Figure 3.120: Nakuru County, Trend in Local Revenue Collection by Quarters from the First Quarter of FY 2013/14 to the First Quarter of FY 2015/16
Source: Nakuru County Treasury
During the period under review, the Controller of Budget authorised withdrawal of Kshs.2.42 billion from the CRF, which was 17.6 per cent of the Approved Supplementary Budget. The withdrawal represented an improvement of 21.6 per cent from Kshs.1.99 billion authorized in
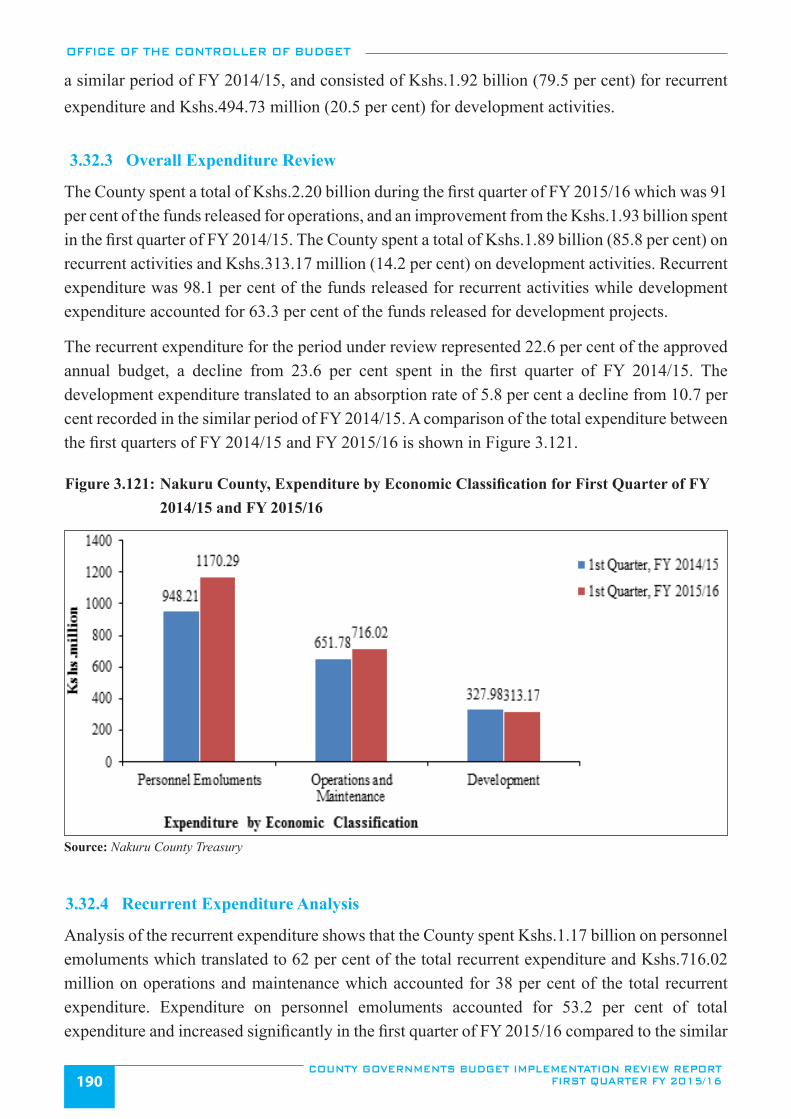
OFFICE OF THE CONTROLLER OF BUDGET
COUNTY GOVERNMENTS BUDGET IMPLEMENTATION REVIEW REPORT FIRST QUARTER FY 2015/16190
a similar period of FY 2014/15, and consisted of Kshs.1.92 billion (79.5 per cent) for recurrent expenditure and Kshs.494.73 million (20.5 per cent) for development activities.
3.32.3 Overall Expenditure Review
The County spent a total of Kshs.2.20 billion during the first quarter of FY 2015/16 which was 91 per cent of the funds released for operations, and an improvement from the Kshs.1.93 billion spent in the first quarter of FY 2014/15. The County spent a total of Kshs.1.89 billion (85.8 per cent) on recurrent activities and Kshs.313.17 million (14.2 per cent) on development activities. Recurrent expenditure was 98.1 per cent of the funds released for recurrent activities while development expenditure accounted for 63.3 per cent of the funds released for development projects.
The recurrent expenditure for the period under review represented 22.6 per cent of the approved annual budget, a decline from 23.6 per cent spent in the first quarter of FY 2014/15. The development expenditure translated to an absorption rate of 5.8 per cent a decline from 10.7 per cent recorded in the similar period of FY 2014/15. A comparison of the total expenditure between the first quarters of FY 2014/15 and FY 2015/16 is shown in Figure 3.121.
Figure 3.121: Nakuru County, Expenditure by Economic Classification for First Quarter of FY 2014/15 and FY 2015/16
Source: Nakuru County Treasury
3.32.4 Recurrent Expenditure Analysis
Analysis of the recurrent expenditure shows that the County spent Kshs.1.17 billion on personnel emoluments which translated to 62 per cent of the total recurrent expenditure and Kshs.716.02 million on operations and maintenance which accounted for 38 per cent of the total recurrent expenditure. Expenditure on personnel emoluments accounted for 53.2 per cent of total expenditure and increased significantly in the first quarter of FY 2015/16 compared to the similar
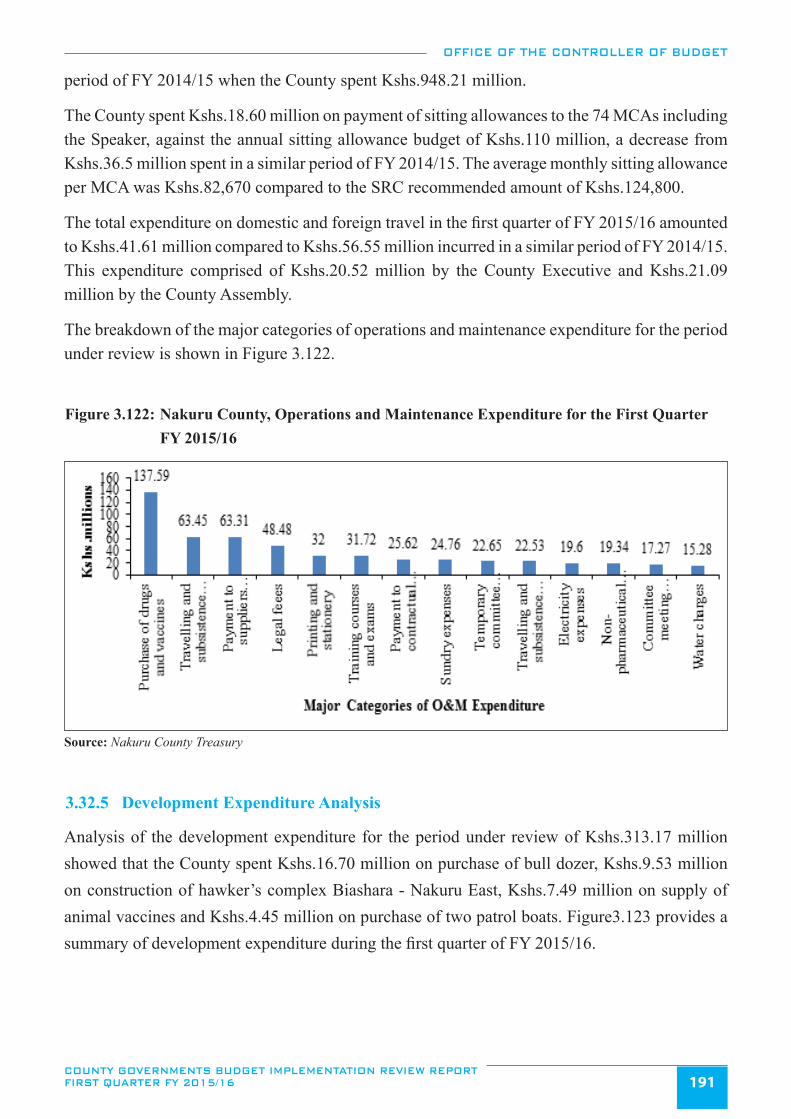
OFFICE OF THE CONTROLLER OF BUDGET
COUNTY GOVERNMENTS BUDGET IMPLEMENTATION REVIEW REPORT FIRST QUARTER FY 2015/16 191
period of FY 2014/15 when the County spent Kshs.948.21 million.
The County spent Kshs.18.60 million on payment of sitting allowances to the 74 MCAs including the Speaker, against the annual sitting allowance budget of Kshs.110 million, a decrease from Kshs.36.5 million spent in a similar period of FY 2014/15. The average monthly sitting allowance per MCA was Kshs.82,670 compared to the SRC recommended amount of Kshs.124,800.
The total expenditure on domestic and foreign travel in the first quarter of FY 2015/16 amounted to Kshs.41.61 million compared to Kshs.56.55 million incurred in a similar period of FY 2014/15. This expenditure comprised of Kshs.20.52 million by the County Executive and Kshs.21.09 million by the County Assembly.
The breakdown of the major categories of operations and maintenance expenditure for the period under review is shown in Figure 3.122.
Figure 3.122: Nakuru County, Operations and Maintenance Expenditure for the First Quarter FY 2015/16
Source: Nakuru County Treasury
3.32.5 Development Expenditure Analysis
Analysis of the development expenditure for the period under review of Kshs.313.17 million showed that the County spent Kshs.16.70 million on purchase of bull dozer, Kshs.9.53 million on construction of hawker’s complex Biashara - Nakuru East, Kshs.7.49 million on supply of animal vaccines and Kshs.4.45 million on purchase of two patrol boats. Figure3.123 provides a summary of development expenditure during the first quarter of FY 2015/16.
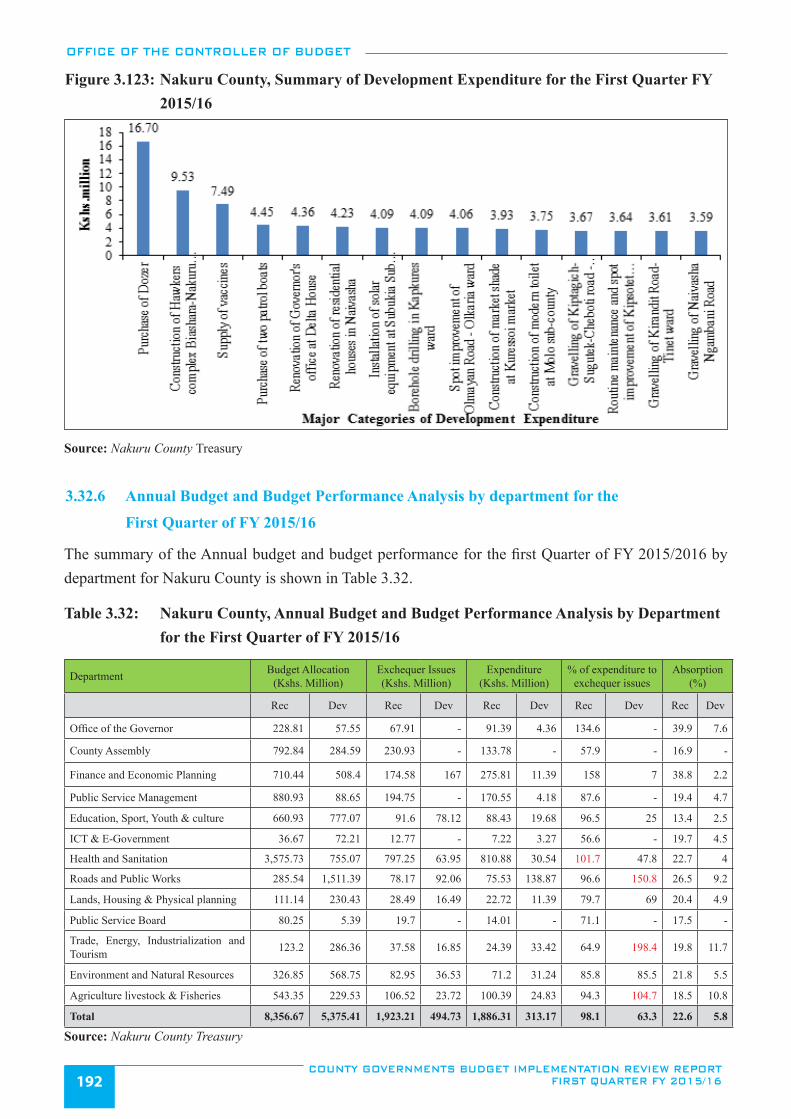
OFFICE OF THE CONTROLLER OF BUDGET
COUNTY GOVERNMENTS BUDGET IMPLEMENTATION REVIEW REPORT FIRST QUARTER FY 2015/16192
Figure 3.123: Nakuru County, Summary of Development Expenditure for the First Quarter FY 2015/16
Source: Nakuru County Treasury
3.32.6 Annual Budget and Budget Performance Analysis by department for the
First Quarter of FY 2015/16
The summary of the Annual budget and budget performance for the first Quarter of FY 2015/2016 by department for Nakuru County is shown in Table 3.32.
Table 3.32: Nakuru County, Annual Budget and Budget Performance Analysis by Department for the First Quarter of FY 2015/16
Department Budget Allocation (Kshs. Million)
Exchequer Issues (Kshs. Million)
Expenditure (Kshs. Million)
% of expenditure to exchequer issues
Absorption (%)
Rec Dev Rec Dev Rec Dev Rec Dev Rec Dev
Office of the Governor 228.81 57.55 67.91 - 91.39 4.36 134.6 - 39.9 7.6
County Assembly 792.84 284.59 230.93 - 133.78 - 57.9 - 16.9 -
Finance and Economic Planning 710.44 508.4 174.58 167 275.81 11.39 158 7 38.8 2.2
Public Service Management 880.93 88.65 194.75 - 170.55 4.18 87.6 - 19.4 4.7
Education, Sport, Youth & culture 660.93 777.07 91.6 78.12 88.43 19.68 96.5 25 13.4 2.5
ICT & E-Government 36.67 72.21 12.77 - 7.22 3.27 56.6 - 19.7 4.5
Health and Sanitation 3,575.73 755.07 797.25 63.95 810.88 30.54 101.7 47.8 22.7 4
Roads and Public Works 285.54 1,511.39 78.17 92.06 75.53 138.87 96.6 150.8 26.5 9.2
Lands, Housing & Physical planning 111.14 230.43 28.49 16.49 22.72 11.39 79.7 69 20.4 4.9
Public Service Board 80.25 5.39 19.7 - 14.01 - 71.1 - 17.5 -
Trade, Energy, Industrialization and Tourism 123.2 286.36 37.58 16.85 24.39 33.42 64.9 198.4 19.8 11.7
Environment and Natural Resources 326.85 568.75 82.95 36.53 71.2 31.24 85.8 85.5 21.8 5.5
Agriculture livestock & Fisheries 543.35 229.53 106.52 23.72 100.39 24.83 94.3 104.7 18.5 10.8
Total 8,356.67 5,375.41 1,923.21 494.73 1,886.31 313.17 98.1 63.3 22.6 5.8
Source: Nakuru County Treasury
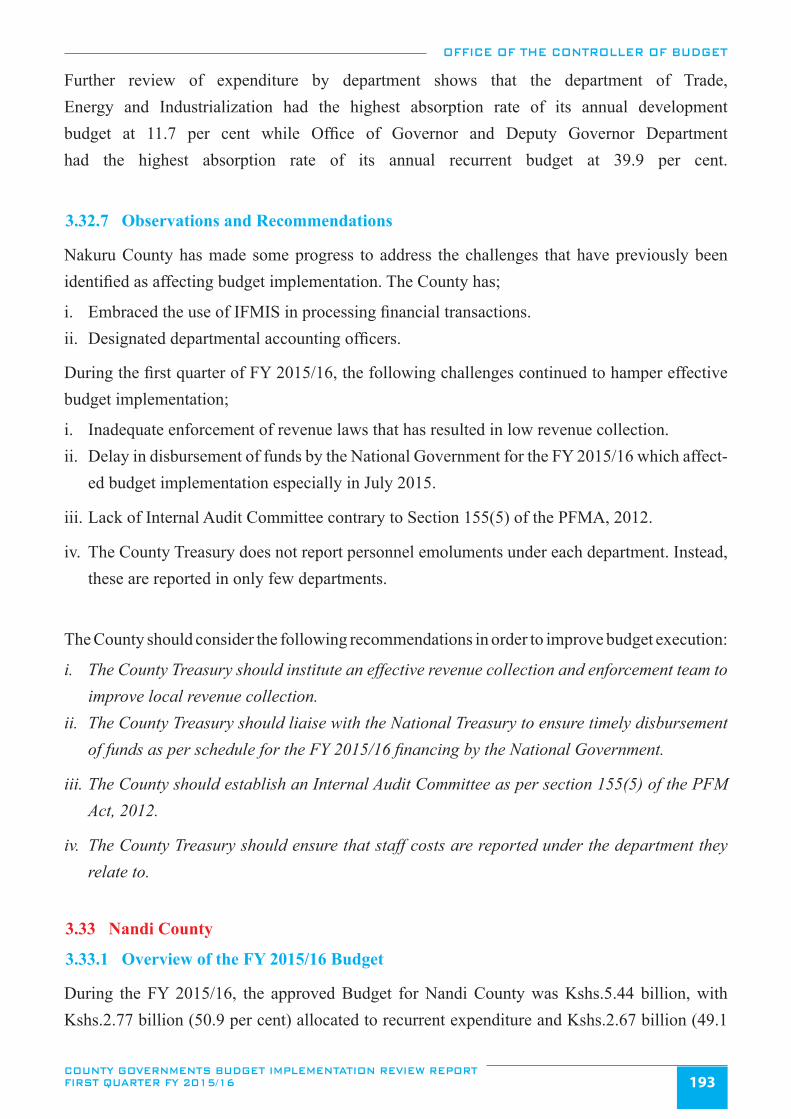
OFFICE OF THE CONTROLLER OF BUDGET
COUNTY GOVERNMENTS BUDGET IMPLEMENTATION REVIEW REPORT FIRST QUARTER FY 2015/16 193
Further review of expenditure by department shows that the department of Trade, Energy and Industrialization had the highest absorption rate of its annual development budget at 11.7 per cent while Office of Governor and Deputy Governor Department had the highest absorption rate of its annual recurrent budget at 39.9 per cent.
3.32.7 Observations and Recommendations
Nakuru County has made some progress to address the challenges that have previously been identified as affecting budget implementation. The County has;
i. Embraced the use of IFMIS in processing financial transactions.ii. Designated departmental accounting officers.
During the first quarter of FY 2015/16, the following challenges continued to hamper effective budget implementation;
i. Inadequate enforcement of revenue laws that has resulted in low revenue collection.ii. Delay in disbursement of funds by the National Government for the FY 2015/16 which affect-
ed budget implementation especially in July 2015.
iii. Lack of Internal Audit Committee contrary to Section 155(5) of the PFMA, 2012.
iv. The County Treasury does not report personnel emoluments under each department. Instead, these are reported in only few departments.
The County should consider the following recommendations in order to improve budget execution:
i. The County Treasury should institute an effective revenue collection and enforcement team to improve local revenue collection.
ii. The County Treasury should liaise with the National Treasury to ensure timely disbursement of funds as per schedule for the FY 2015/16 financing by the National Government.
iii. The County should establish an Internal Audit Committee as per section 155(5) of the PFM Act, 2012.
iv. The County Treasury should ensure that staff costs are reported under the department they relate to.
3.33 Nandi County
3.33.1 Overview of the FY 2015/16 Budget
During the FY 2015/16, the approved Budget for Nandi County was Kshs.5.44 billion, with Kshs.2.77 billion (50.9 per cent) allocated to recurrent expenditure and Kshs.2.67 billion (49.1
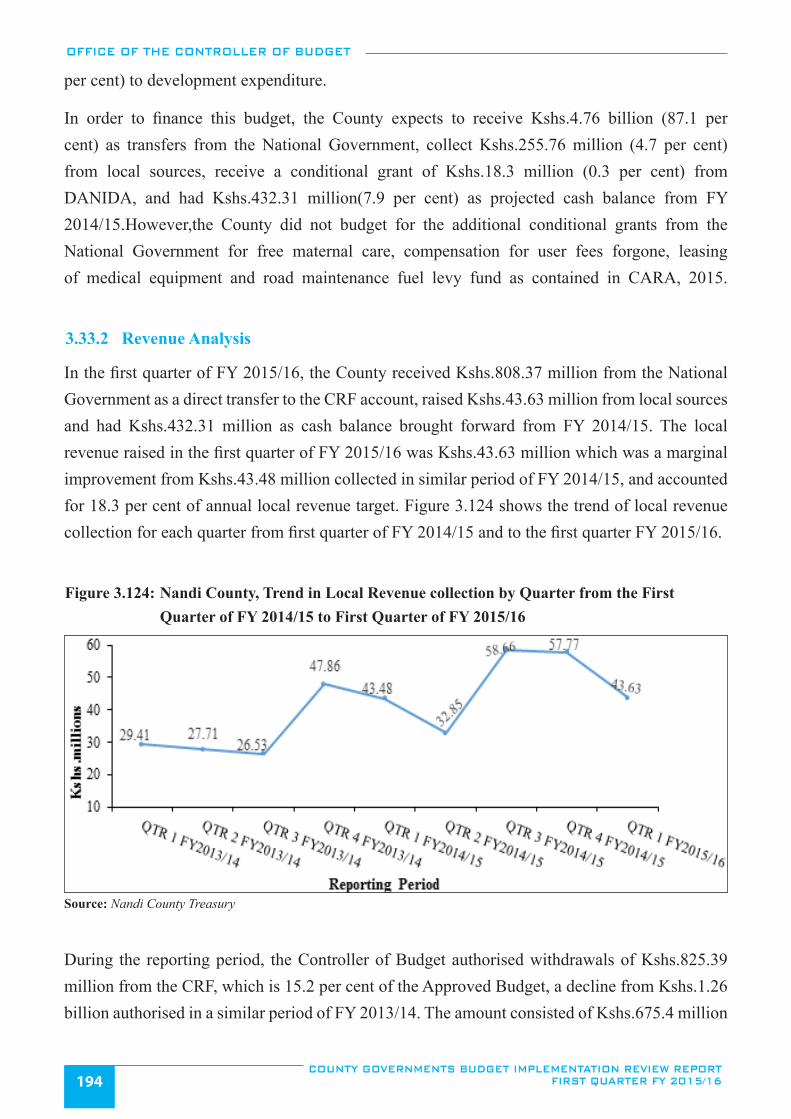
OFFICE OF THE CONTROLLER OF BUDGET
COUNTY GOVERNMENTS BUDGET IMPLEMENTATION REVIEW REPORT FIRST QUARTER FY 2015/16194
per cent) to development expenditure.
In order to finance this budget, the County expects to receive Kshs.4.76 billion (87.1 per cent) as transfers from the National Government, collect Kshs.255.76 million (4.7 per cent) from local sources, receive a conditional grant of Kshs.18.3 million (0.3 per cent) from DANIDA, and had Kshs.432.31 million(7.9 per cent) as projected cash balance from FY 2014/15.However,the County did not budget for the additional conditional grants from the National Government for free maternal care, compensation for user fees forgone, leasing of medical equipment and road maintenance fuel levy fund as contained in CARA, 2015.
3.33.2 Revenue Analysis
In the first quarter of FY 2015/16, the County received Kshs.808.37 million from the National Government as a direct transfer to the CRF account, raised Kshs.43.63 million from local sources and had Kshs.432.31 million as cash balance brought forward from FY 2014/15. The local revenue raised in the first quarter of FY 2015/16 was Kshs.43.63 million which was a marginal improvement from Kshs.43.48 million collected in similar period of FY 2014/15, and accounted for 18.3 per cent of annual local revenue target. Figure 3.124 shows the trend of local revenue collection for each quarter from first quarter of FY 2014/15 and to the first quarter FY 2015/16.
Figure 3.124: Nandi County, Trend in Local Revenue collection by Quarter from the First Quarter of FY 2014/15 to First Quarter of FY 2015/16
Source: Nandi County Treasury
During the reporting period, the Controller of Budget authorised withdrawals of Kshs.825.39 million from the CRF, which is 15.2 per cent of the Approved Budget, a decline from Kshs.1.26 billion authorised in a similar period of FY 2013/14. The amount consisted of Kshs.675.4 million
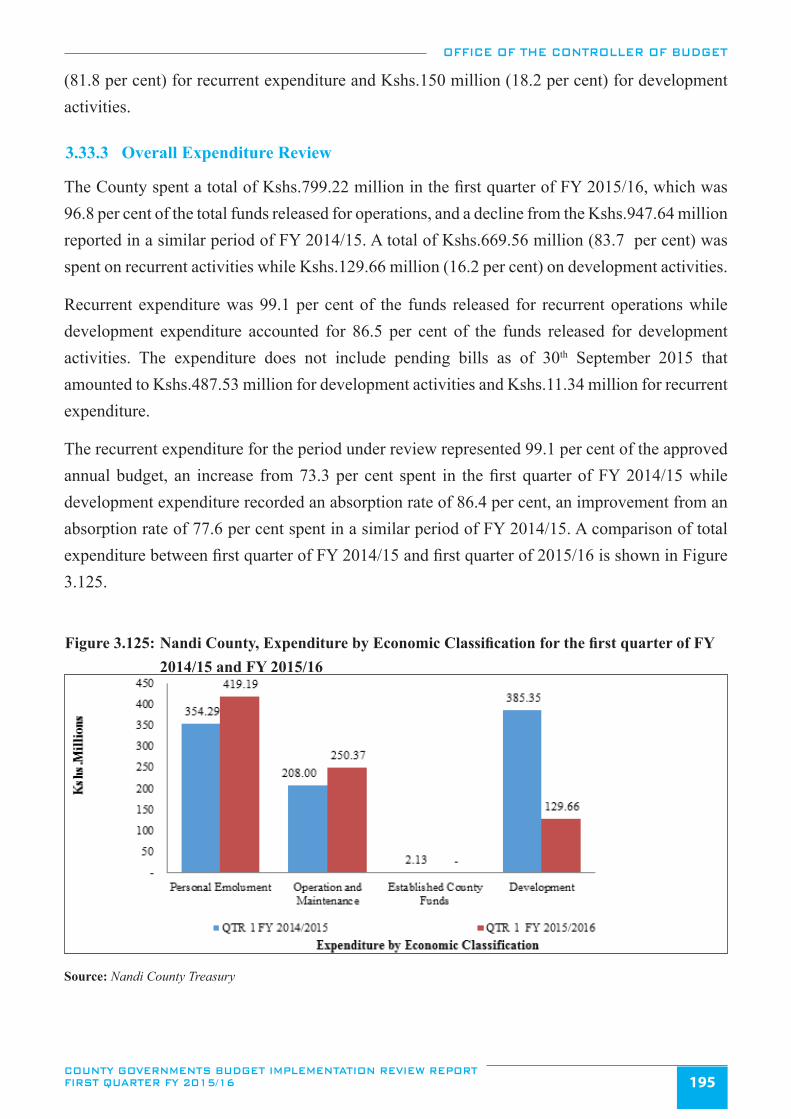
OFFICE OF THE CONTROLLER OF BUDGET
COUNTY GOVERNMENTS BUDGET IMPLEMENTATION REVIEW REPORT FIRST QUARTER FY 2015/16 195
(81.8 per cent) for recurrent expenditure and Kshs.150 million (18.2 per cent) for development activities.
3.33.3 Overall Expenditure Review
The County spent a total of Kshs.799.22 million in the first quarter of FY 2015/16, which was 96.8 per cent of the total funds released for operations, and a decline from the Kshs.947.64 million reported in a similar period of FY 2014/15. A total of Kshs.669.56 million (83.7 per cent) was spent on recurrent activities while Kshs.129.66 million (16.2 per cent) on development activities.
Recurrent expenditure was 99.1 per cent of the funds released for recurrent operations while development expenditure accounted for 86.5 per cent of the funds released for development activities. The expenditure does not include pending bills as of 30th September 2015 that amounted to Kshs.487.53 million for development activities and Kshs.11.34 million for recurrent expenditure.
The recurrent expenditure for the period under review represented 99.1 per cent of the approved annual budget, an increase from 73.3 per cent spent in the first quarter of FY 2014/15 while development expenditure recorded an absorption rate of 86.4 per cent, an improvement from an absorption rate of 77.6 per cent spent in a similar period of FY 2014/15. A comparison of total expenditure between first quarter of FY 2014/15 and first quarter of 2015/16 is shown in Figure 3.125.
Figure 3.125: Nandi County, Expenditure by Economic Classification for the first quarter of FY 2014/15 and FY 2015/16
Source: Nandi County Treasury
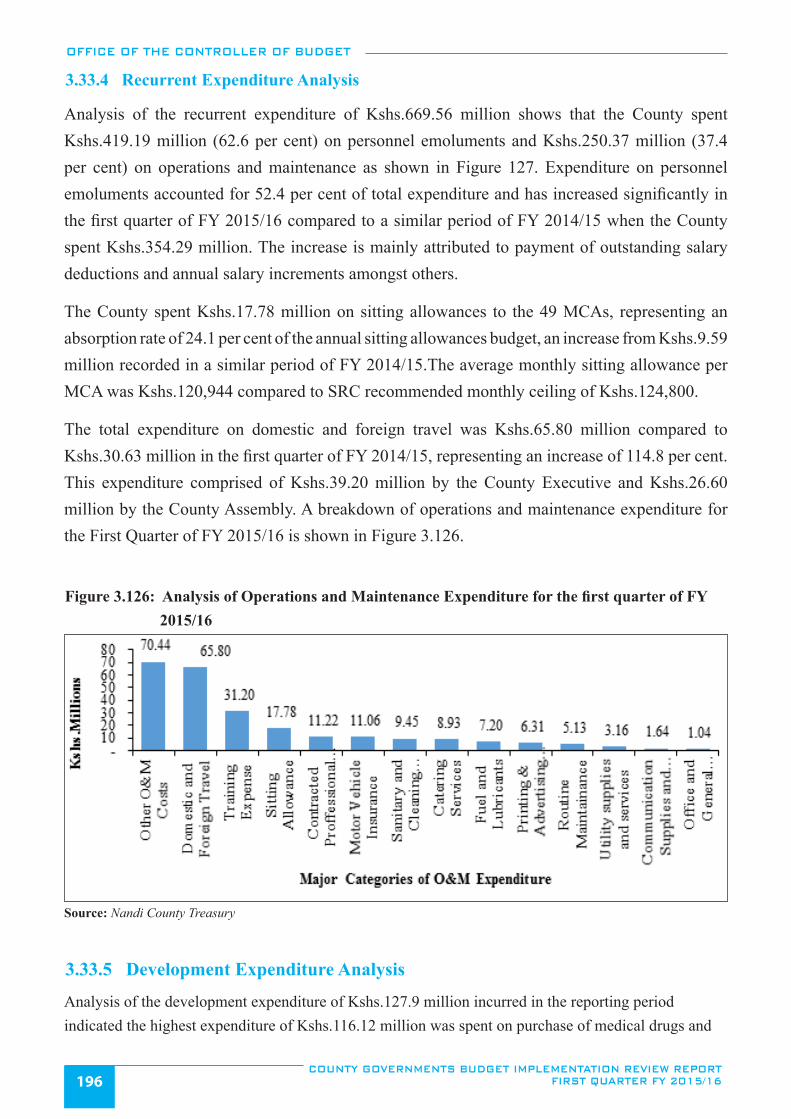
OFFICE OF THE CONTROLLER OF BUDGET
COUNTY GOVERNMENTS BUDGET IMPLEMENTATION REVIEW REPORT FIRST QUARTER FY 2015/16196
3.33.4 Recurrent Expenditure Analysis
Analysis of the recurrent expenditure of Kshs.669.56 million shows that the County spent Kshs.419.19 million (62.6 per cent) on personnel emoluments and Kshs.250.37 million (37.4 per cent) on operations and maintenance as shown in Figure 127. Expenditure on personnel emoluments accounted for 52.4 per cent of total expenditure and has increased significantly in the first quarter of FY 2015/16 compared to a similar period of FY 2014/15 when the County spent Kshs.354.29 million. The increase is mainly attributed to payment of outstanding salary deductions and annual salary increments amongst others.
The County spent Kshs.17.78 million on sitting allowances to the 49 MCAs, representing an absorption rate of 24.1 per cent of the annual sitting allowances budget, an increase from Kshs.9.59 million recorded in a similar period of FY 2014/15.The average monthly sitting allowance per MCA was Kshs.120,944 compared to SRC recommended monthly ceiling of Kshs.124,800.
The total expenditure on domestic and foreign travel was Kshs.65.80 million compared to Kshs.30.63 million in the first quarter of FY 2014/15, representing an increase of 114.8 per cent. This expenditure comprised of Kshs.39.20 million by the County Executive and Kshs.26.60 million by the County Assembly. A breakdown of operations and maintenance expenditure for the First Quarter of FY 2015/16 is shown in Figure 3.126.
Figure 3.126: Analysis of Operations and Maintenance Expenditure for the first quarter of FY 2015/16
Source: Nandi County Treasury
3.33.5 Development Expenditure Analysis
Analysis of the development expenditure of Kshs.127.9 million incurred in the reporting period indicated the highest expenditure of Kshs.116.12 million was spent on purchase of medical drugs and
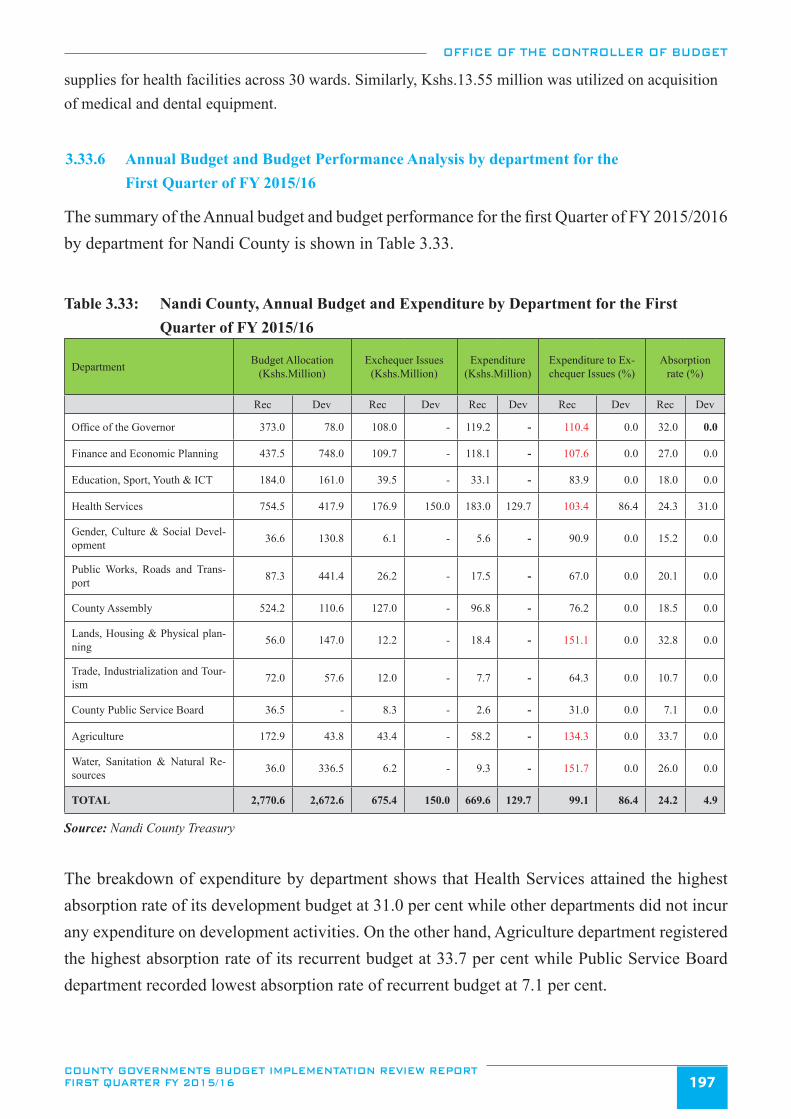
OFFICE OF THE CONTROLLER OF BUDGET
COUNTY GOVERNMENTS BUDGET IMPLEMENTATION REVIEW REPORT FIRST QUARTER FY 2015/16 197
supplies for health facilities across 30 wards. Similarly, Kshs.13.55 million was utilized on acquisition of medical and dental equipment.
3.33.6 Annual Budget and Budget Performance Analysis by department for the First Quarter of FY 2015/16
The summary of the Annual budget and budget performance for the first Quarter of FY 2015/2016 by department for Nandi County is shown in Table 3.33.
Table 3.33: Nandi County, Annual Budget and Expenditure by Department for the First Quarter of FY 2015/16
Department Budget Allocation (Kshs.Million)
Exchequer Issues (Kshs.Million)
Expenditure (Kshs.Million)
Expenditure to Ex-chequer Issues (%)
Absorption rate (%)
Rec Dev Rec Dev Rec Dev Rec Dev Rec Dev
Office of the Governor 373.0 78.0 108.0 - 119.2 - 110.4 0.0 32.0 0.0
Finance and Economic Planning 437.5 748.0 109.7 - 118.1 - 107.6 0.0 27.0 0.0
Education, Sport, Youth & ICT 184.0 161.0 39.5 - 33.1 - 83.9 0.0 18.0 0.0
Health Services 754.5 417.9 176.9 150.0 183.0 129.7 103.4 86.4 24.3 31.0
Gender, Culture & Social Devel-opment 36.6 130.8 6.1 - 5.6 - 90.9 0.0 15.2 0.0
Public Works, Roads and Trans-port 87.3 441.4 26.2 - 17.5 - 67.0 0.0 20.1 0.0
County Assembly 524.2 110.6 127.0 - 96.8 - 76.2 0.0 18.5 0.0
Lands, Housing & Physical plan-ning 56.0 147.0 12.2 - 18.4 - 151.1 0.0 32.8 0.0
Trade, Industrialization and Tour-ism 72.0 57.6 12.0 - 7.7 - 64.3 0.0 10.7 0.0
County Public Service Board 36.5 - 8.3 - 2.6 - 31.0 0.0 7.1 0.0
Agriculture 172.9 43.8 43.4 - 58.2 - 134.3 0.0 33.7 0.0
Water, Sanitation & Natural Re-sources 36.0 336.5 6.2 - 9.3 - 151.7 0.0 26.0 0.0
TOTAL 2,770.6 2,672.6 675.4 150.0 669.6 129.7 99.1 86.4 24.2 4.9
Source: Nandi County Treasury
The breakdown of expenditure by department shows that Health Services attained the highest absorption rate of its development budget at 31.0 per cent while other departments did not incur any expenditure on development activities. On the other hand, Agriculture department registered the highest absorption rate of its recurrent budget at 33.7 per cent while Public Service Board department recorded lowest absorption rate of recurrent budget at 7.1 per cent.
OFFICE OF THE CONTROLLER OF BUDGET
COUNTY GOVERNMENTS BUDGET IMPLEMENTATION REVIEW REPORT FIRST QUARTER FY 2015/16198
3.33.7 Observations and Recommendations
In the period under review, the County has made some progress to address the challenges that have previously been identified as affecting budget implementation. The County;
i. Developed realistic revenue targets.ii. Embraced the use of IFMIS in processing financial transactions.iii. Designated departmental accounting officers.
Despite the progress, the following challenges continued to hinder effective budget implementation in the first quarter of FY 2015/16:
i. Delay in preparation and approval of key budget implementation documents such as the ADP and the Revenue Bills as provided in the PFM Act, 2012.
ii. Delay in disbursement of funds by the National Treasury affected timely implementation of planned activities as outlined in the budget.
iii. Failure by the County to designate Administrators for the established County Funds such as the Bursary Funds, thereby rendering the process of accountability and reporting difficult.
The County should implement the following recommendations in order to improve budget execution:
i. The County Executive should work closely with the County Assembly to ensure that all budg-etary policy documents are prepared and approved within the stipulated timelines as envis-aged in the PFM Act, 2012.
ii. The County should liaise with the National Treasury to ensure that the County’s equitable share is disbursed in line with the CARA, 2015 approved disbursement schedule.
iii. The County Executive Member for Finance should appoint an administrator for each estab-lished County Fund in accordance with section 116 of the PFM Act, 2012.
3.34 Narok County 3.34.1 Overview of the FY 2015/16 County Budget
The Approved Budget Estimates for Narok County in the FY 2015/16 amounts to Kshs.8.99 billion, with Kshs.5.06 billion (56.2 per cent) allocated to recurrent expenditure and Kshs.3.94 billion (43.8 per cent) to development expenditure.
In order to finance the budget, the County expected to receive Kshs.5.29 billion (58.8 per cent) as transfers from the National Government, collect Kshs.3.51 billion (39 per cent) from local sources, receive a conditional grant of Kshs.17.89 million (0.2 per cent) from DANIDA, Kshs.56.03 million (0.62 per cent) as projected cash balance from FY 2014/15, and additional grants as provided for in CARA, 2015 this includes Kshs.19.83 million as compensation for user fees forgone; Kshs.67.17 million for the road maintenance levy; Kshs.56.3 million for free
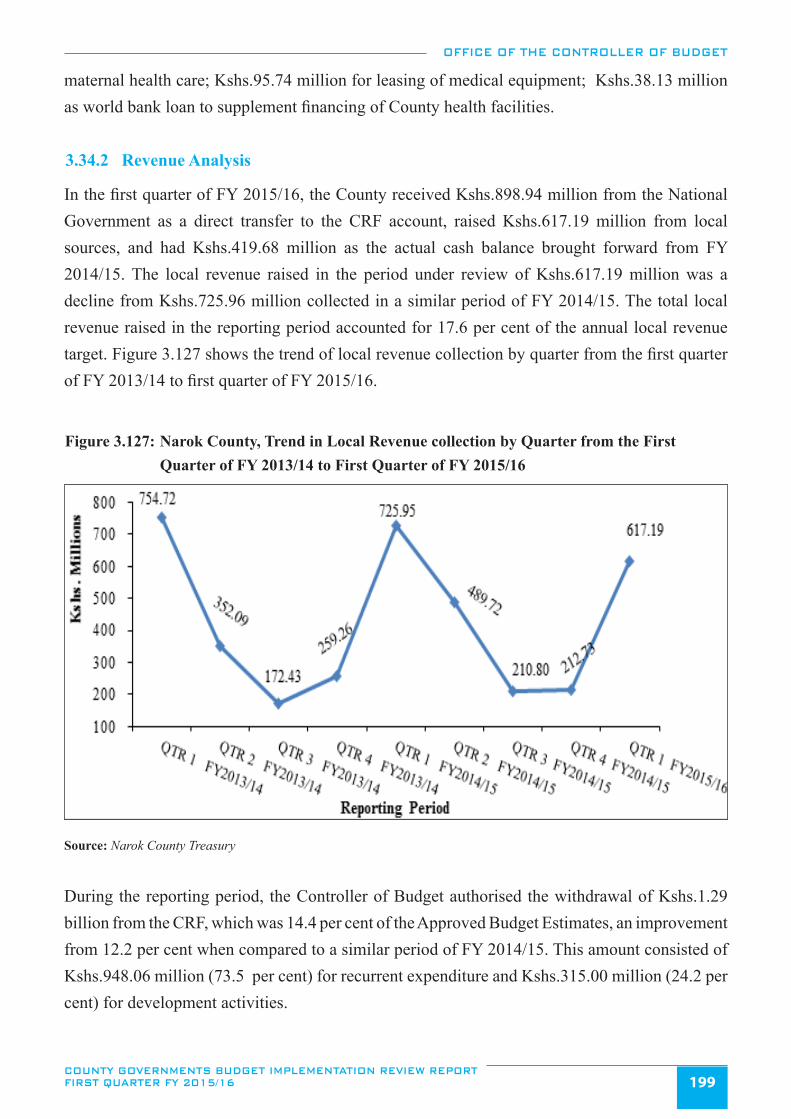
OFFICE OF THE CONTROLLER OF BUDGET
COUNTY GOVERNMENTS BUDGET IMPLEMENTATION REVIEW REPORT FIRST QUARTER FY 2015/16 199
maternal health care; Kshs.95.74 million for leasing of medical equipment; Kshs.38.13 million as world bank loan to supplement financing of County health facilities.
3.34.2 Revenue Analysis
In the first quarter of FY 2015/16, the County received Kshs.898.94 million from the National Government as a direct transfer to the CRF account, raised Kshs.617.19 million from local sources, and had Kshs.419.68 million as the actual cash balance brought forward from FY 2014/15. The local revenue raised in the period under review of Kshs.617.19 million was a decline from Kshs.725.96 million collected in a similar period of FY 2014/15. The total local revenue raised in the reporting period accounted for 17.6 per cent of the annual local revenue target. Figure 3.127 shows the trend of local revenue collection by quarter from the first quarter of FY 2013/14 to first quarter of FY 2015/16.
Figure 3.127: Narok County, Trend in Local Revenue collection by Quarter from the First Quarter of FY 2013/14 to First Quarter of FY 2015/16
Source: Narok County Treasury
During the reporting period, the Controller of Budget authorised the withdrawal of Kshs.1.29 billion from the CRF, which was 14.4 per cent of the Approved Budget Estimates, an improvement from 12.2 per cent when compared to a similar period of FY 2014/15. This amount consisted of Kshs.948.06 million (73.5 per cent) for recurrent expenditure and Kshs.315.00 million (24.2 per cent) for development activities.
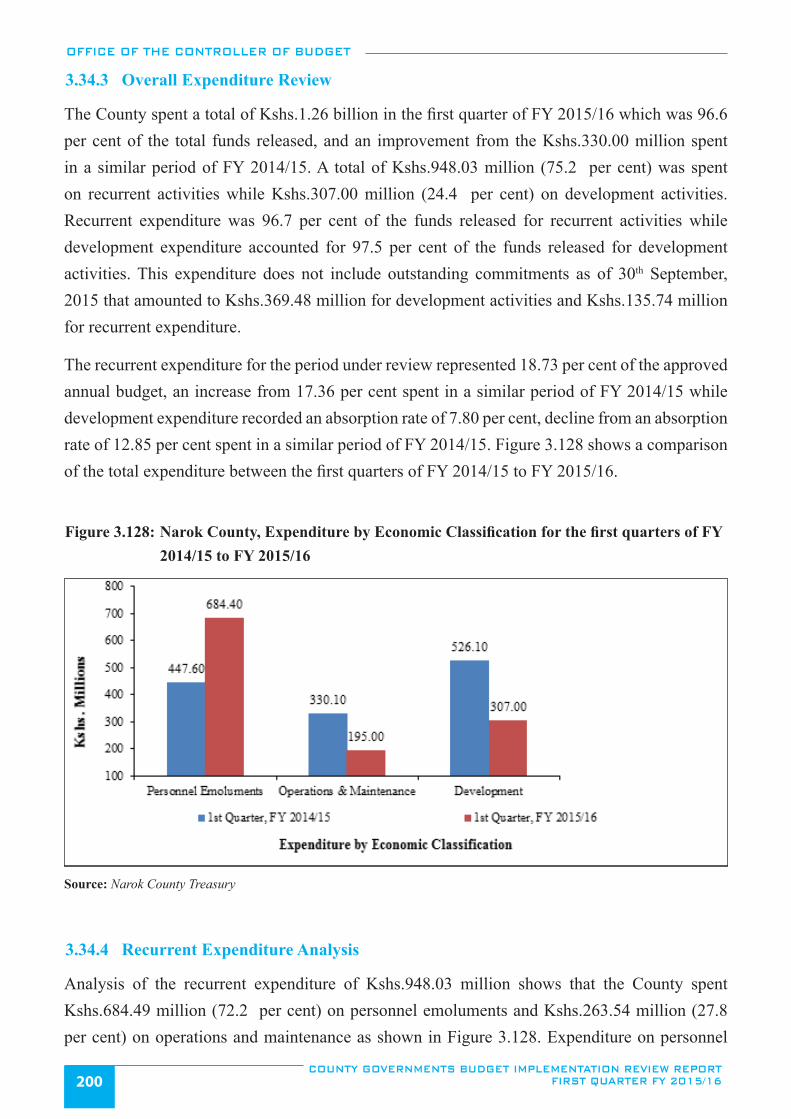
OFFICE OF THE CONTROLLER OF BUDGET
COUNTY GOVERNMENTS BUDGET IMPLEMENTATION REVIEW REPORT FIRST QUARTER FY 2015/16200
3.34.3 Overall Expenditure Review
The County spent a total of Kshs.1.26 billion in the first quarter of FY 2015/16 which was 96.6 per cent of the total funds released, and an improvement from the Kshs.330.00 million spent in a similar period of FY 2014/15. A total of Kshs.948.03 million (75.2 per cent) was spent on recurrent activities while Kshs.307.00 million (24.4 per cent) on development activities. Recurrent expenditure was 96.7 per cent of the funds released for recurrent activities while development expenditure accounted for 97.5 per cent of the funds released for development activities. This expenditure does not include outstanding commitments as of 30th September, 2015 that amounted to Kshs.369.48 million for development activities and Kshs.135.74 million for recurrent expenditure.
The recurrent expenditure for the period under review represented 18.73 per cent of the approved annual budget, an increase from 17.36 per cent spent in a similar period of FY 2014/15 while development expenditure recorded an absorption rate of 7.80 per cent, decline from an absorption rate of 12.85 per cent spent in a similar period of FY 2014/15. Figure 3.128 shows a comparison of the total expenditure between the first quarters of FY 2014/15 to FY 2015/16.
Figure 3.128: Narok County, Expenditure by Economic Classification for the first quarters of FY 2014/15 to FY 2015/16
Source: Narok County Treasury
3.34.4 Recurrent Expenditure Analysis
Analysis of the recurrent expenditure of Kshs.948.03 million shows that the County spent Kshs.684.49 million (72.2 per cent) on personnel emoluments and Kshs.263.54 million (27.8 per cent) on operations and maintenance as shown in Figure 3.128. Expenditure on personnel
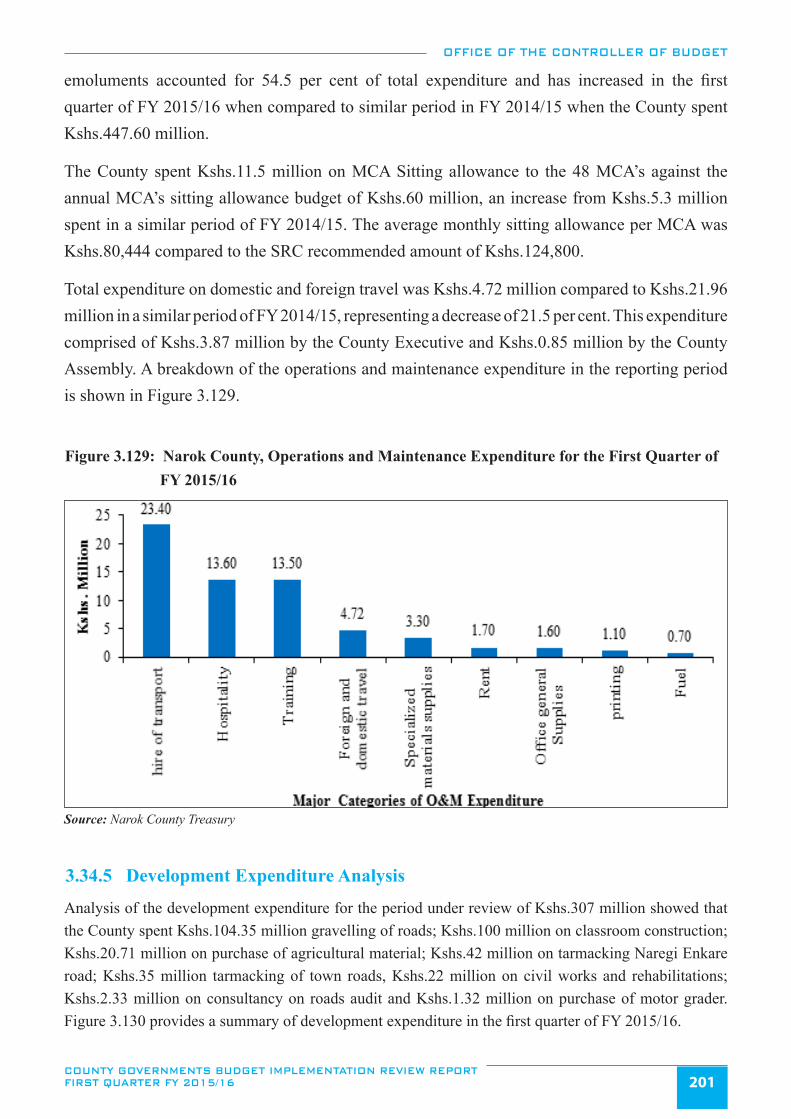
OFFICE OF THE CONTROLLER OF BUDGET
COUNTY GOVERNMENTS BUDGET IMPLEMENTATION REVIEW REPORT FIRST QUARTER FY 2015/16 201
emoluments accounted for 54.5 per cent of total expenditure and has increased in the first quarter of FY 2015/16 when compared to similar period in FY 2014/15 when the County spent Kshs.447.60 million.
The County spent Kshs.11.5 million on MCA Sitting allowance to the 48 MCA’s against the annual MCA’s sitting allowance budget of Kshs.60 million, an increase from Kshs.5.3 million spent in a similar period of FY 2014/15. The average monthly sitting allowance per MCA was Kshs.80,444 compared to the SRC recommended amount of Kshs.124,800.
Total expenditure on domestic and foreign travel was Kshs.4.72 million compared to Kshs.21.96 million in a similar period of FY 2014/15, representing a decrease of 21.5 per cent. This expenditure comprised of Kshs.3.87 million by the County Executive and Kshs.0.85 million by the County Assembly. A breakdown of the operations and maintenance expenditure in the reporting period is shown in Figure 3.129.
Figure 3.129: Narok County, Operations and Maintenance Expenditure for the First Quarter of FY 2015/16
Source: Narok County Treasury
3.34.5 Development Expenditure Analysis
Analysis of the development expenditure for the period under review of Kshs.307 million showed that the County spent Kshs.104.35 million gravelling of roads; Kshs.100 million on classroom construction; Kshs.20.71 million on purchase of agricultural material; Kshs.42 million on tarmacking Naregi Enkare road; Kshs.35 million tarmacking of town roads, Kshs.22 million on civil works and rehabilitations; Kshs.2.33 million on consultancy on roads audit and Kshs.1.32 million on purchase of motor grader. Figure 3.130 provides a summary of development expenditure in the first quarter of FY 2015/16.
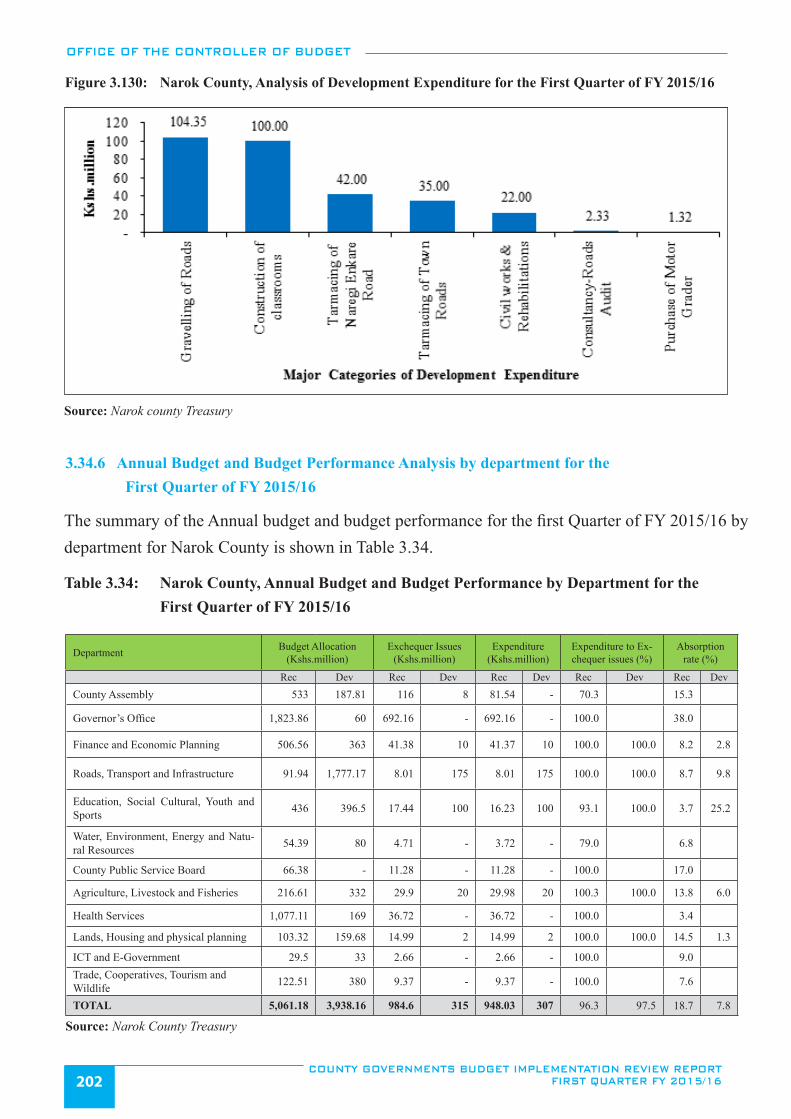
OFFICE OF THE CONTROLLER OF BUDGET
COUNTY GOVERNMENTS BUDGET IMPLEMENTATION REVIEW REPORT FIRST QUARTER FY 2015/16202
Figure 3.130: Narok County, Analysis of Development Expenditure for the First Quarter of FY 2015/16
Source: Narok county Treasury
3.34.6 Annual Budget and Budget Performance Analysis by department for the First Quarter of FY 2015/16
The summary of the Annual budget and budget performance for the first Quarter of FY 2015/16 by department for Narok County is shown in Table 3.34.
Table 3.34: Narok County, Annual Budget and Budget Performance by Department for the First Quarter of FY 2015/16
Department Budget Allocation (Kshs.million)
Exchequer Issues (Kshs.million)
Expenditure (Kshs.million)
Expenditure to Ex-chequer issues (%)
Absorption rate (%)
Rec Dev Rec Dev Rec Dev Rec Dev Rec Dev
County Assembly 533 187.81 116 8 81.54 - 70.3 15.3
Governor’s Office 1,823.86 60 692.16 - 692.16 - 100.0 38.0
Finance and Economic Planning 506.56 363 41.38 10 41.37 10 100.0 100.0 8.2 2.8
Roads, Transport and Infrastructure 91.94 1,777.17 8.01 175 8.01 175 100.0 100.0 8.7 9.8
Education, Social Cultural, Youth and Sports 436 396.5 17.44 100 16.23 100 93.1 100.0 3.7 25.2
Water, Environment, Energy and Natu-ral Resources 54.39 80 4.71 - 3.72 - 79.0 6.8
County Public Service Board 66.38 - 11.28 - 11.28 - 100.0 17.0
Agriculture, Livestock and Fisheries 216.61 332 29.9 20 29.98 20 100.3 100.0 13.8 6.0
Health Services 1,077.11 169 36.72 - 36.72 - 100.0 3.4
Lands, Housing and physical planning 103.32 159.68 14.99 2 14.99 2 100.0 100.0 14.5 1.3
ICT and E-Government 29.5 33 2.66 - 2.66 - 100.0 9.0 Trade, Cooperatives, Tourism and Wildlife 122.51 380 9.37 - 9.37 - 100.0 7.6
TOTAL 5,061.18 3,938.16 984.6 315 948.03 307 96.3 97.5 18.7 7.8
Source: Narok County Treasury
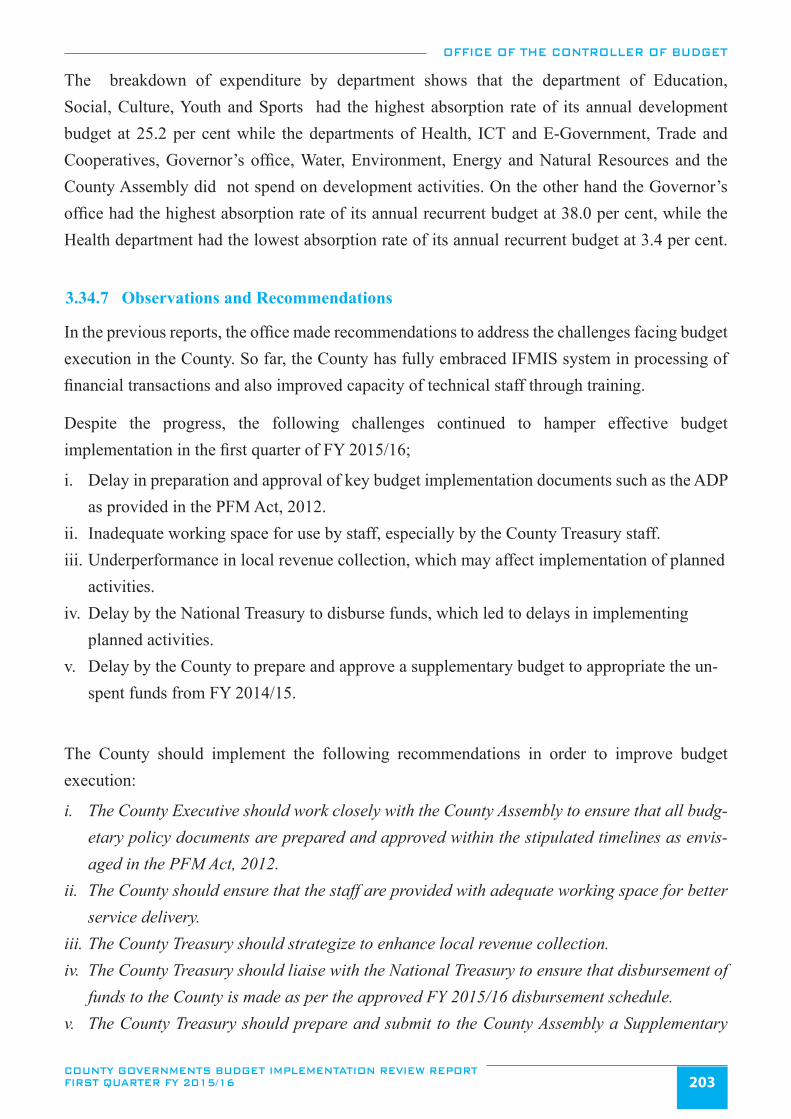
OFFICE OF THE CONTROLLER OF BUDGET
COUNTY GOVERNMENTS BUDGET IMPLEMENTATION REVIEW REPORT FIRST QUARTER FY 2015/16 203
The breakdown of expenditure by department shows that the department of Education, Social, Culture, Youth and Sports had the highest absorption rate of its annual development budget at 25.2 per cent while the departments of Health, ICT and E-Government, Trade and Cooperatives, Governor’s office, Water, Environment, Energy and Natural Resources and the County Assembly did not spend on development activities. On the other hand the Governor’s office had the highest absorption rate of its annual recurrent budget at 38.0 per cent, while the Health department had the lowest absorption rate of its annual recurrent budget at 3.4 per cent.
3.34.7 Observations and Recommendations
In the previous reports, the office made recommendations to address the challenges facing budget execution in the County. So far, the County has fully embraced IFMIS system in processing of financial transactions and also improved capacity of technical staff through training.
Despite the progress, the following challenges continued to hamper effective budget implementation in the first quarter of FY 2015/16;
i. Delay in preparation and approval of key budget implementation documents such as the ADP as provided in the PFM Act, 2012.
ii. Inadequate working space for use by staff, especially by the County Treasury staff.iii. Underperformance in local revenue collection, which may affect implementation of planned
activities. iv. Delay by the National Treasury to disburse funds, which led to delays in implementing
planned activities.v. Delay by the County to prepare and approve a supplementary budget to appropriate the un-
spent funds from FY 2014/15.
The County should implement the following recommendations in order to improve budget execution:
i. The County Executive should work closely with the County Assembly to ensure that all budg-etary policy documents are prepared and approved within the stipulated timelines as envis-aged in the PFM Act, 2012.
ii. The County should ensure that the staff are provided with adequate working space for better service delivery.
iii. The County Treasury should strategize to enhance local revenue collection. iv. The County Treasury should liaise with the National Treasury to ensure that disbursement of
funds to the County is made as per the approved FY 2015/16 disbursement schedule.v. The County Treasury should prepare and submit to the County Assembly a Supplementary
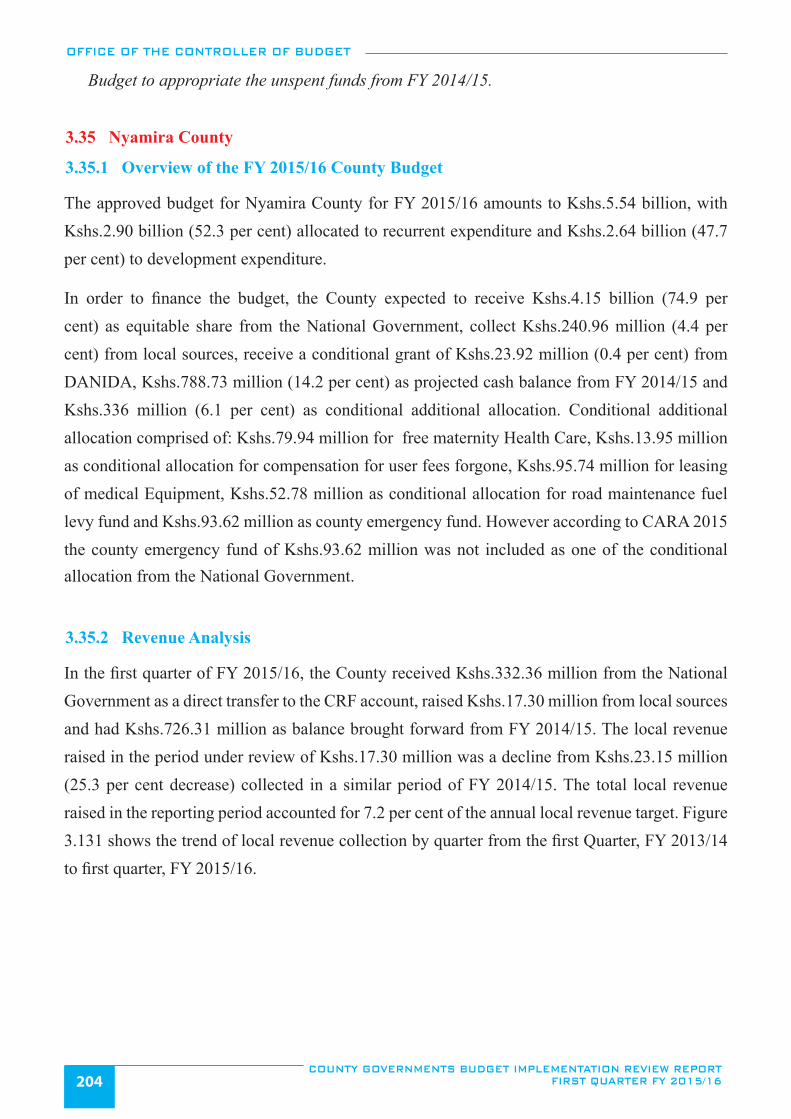
OFFICE OF THE CONTROLLER OF BUDGET
COUNTY GOVERNMENTS BUDGET IMPLEMENTATION REVIEW REPORT FIRST QUARTER FY 2015/16204
Budget to appropriate the unspent funds from FY 2014/15.
3.35 Nyamira County
3.35.1 Overview of the FY 2015/16 County Budget
The approved budget for Nyamira County for FY 2015/16 amounts to Kshs.5.54 billion, with Kshs.2.90 billion (52.3 per cent) allocated to recurrent expenditure and Kshs.2.64 billion (47.7 per cent) to development expenditure.
In order to finance the budget, the County expected to receive Kshs.4.15 billion (74.9 per cent) as equitable share from the National Government, collect Kshs.240.96 million (4.4 per cent) from local sources, receive a conditional grant of Kshs.23.92 million (0.4 per cent) from DANIDA, Kshs.788.73 million (14.2 per cent) as projected cash balance from FY 2014/15 and Kshs.336 million (6.1 per cent) as conditional additional allocation. Conditional additional allocation comprised of: Kshs.79.94 million for free maternity Health Care, Kshs.13.95 million as conditional allocation for compensation for user fees forgone, Kshs.95.74 million for leasing of medical Equipment, Kshs.52.78 million as conditional allocation for road maintenance fuel levy fund and Kshs.93.62 million as county emergency fund. However according to CARA 2015 the county emergency fund of Kshs.93.62 million was not included as one of the conditional allocation from the National Government.
3.35.2 Revenue Analysis
In the first quarter of FY 2015/16, the County received Kshs.332.36 million from the National Government as a direct transfer to the CRF account, raised Kshs.17.30 million from local sources and had Kshs.726.31 million as balance brought forward from FY 2014/15. The local revenue raised in the period under review of Kshs.17.30 million was a decline from Kshs.23.15 million (25.3 per cent decrease) collected in a similar period of FY 2014/15. The total local revenue raised in the reporting period accounted for 7.2 per cent of the annual local revenue target. Figure 3.131 shows the trend of local revenue collection by quarter from the first Quarter, FY 2013/14 to first quarter, FY 2015/16.
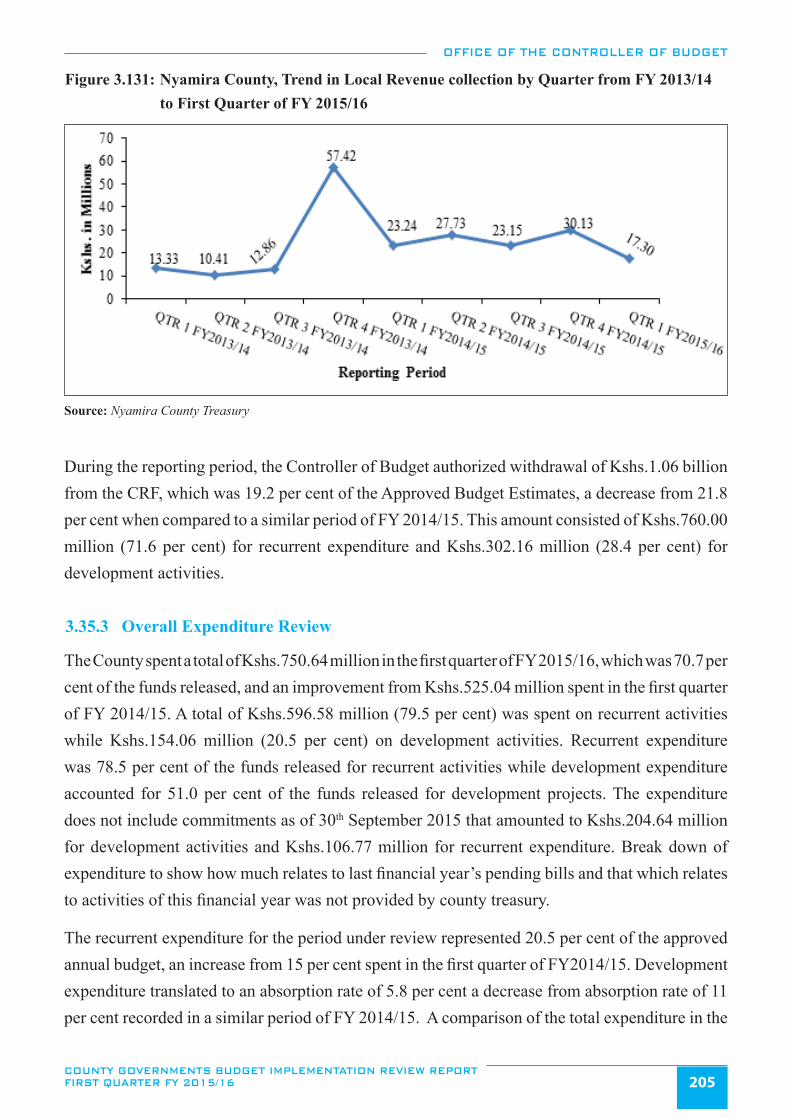
OFFICE OF THE CONTROLLER OF BUDGET
COUNTY GOVERNMENTS BUDGET IMPLEMENTATION REVIEW REPORT FIRST QUARTER FY 2015/16 205
Figure 3.131: Nyamira County, Trend in Local Revenue collection by Quarter from FY 2013/14 to First Quarter of FY 2015/16
Source: Nyamira County Treasury
During the reporting period, the Controller of Budget authorized withdrawal of Kshs.1.06 billion from the CRF, which was 19.2 per cent of the Approved Budget Estimates, a decrease from 21.8 per cent when compared to a similar period of FY 2014/15. This amount consisted of Kshs.760.00 million (71.6 per cent) for recurrent expenditure and Kshs.302.16 million (28.4 per cent) for development activities.
3.35.3 Overall Expenditure Review
The County spent a total of Kshs.750.64 million in the first quarter of FY 2015/16, which was 70.7 per cent of the funds released, and an improvement from Kshs.525.04 million spent in the first quarter of FY 2014/15. A total of Kshs.596.58 million (79.5 per cent) was spent on recurrent activities while Kshs.154.06 million (20.5 per cent) on development activities. Recurrent expenditure was 78.5 per cent of the funds released for recurrent activities while development expenditure accounted for 51.0 per cent of the funds released for development projects. The expenditure does not include commitments as of 30th September 2015 that amounted to Kshs.204.64 million for development activities and Kshs.106.77 million for recurrent expenditure. Break down of expenditure to show how much relates to last financial year’s pending bills and that which relates to activities of this financial year was not provided by county treasury.
The recurrent expenditure for the period under review represented 20.5 per cent of the approved annual budget, an increase from 15 per cent spent in the first quarter of FY2014/15. Development expenditure translated to an absorption rate of 5.8 per cent a decrease from absorption rate of 11 per cent recorded in a similar period of FY 2014/15. A comparison of the total expenditure in the
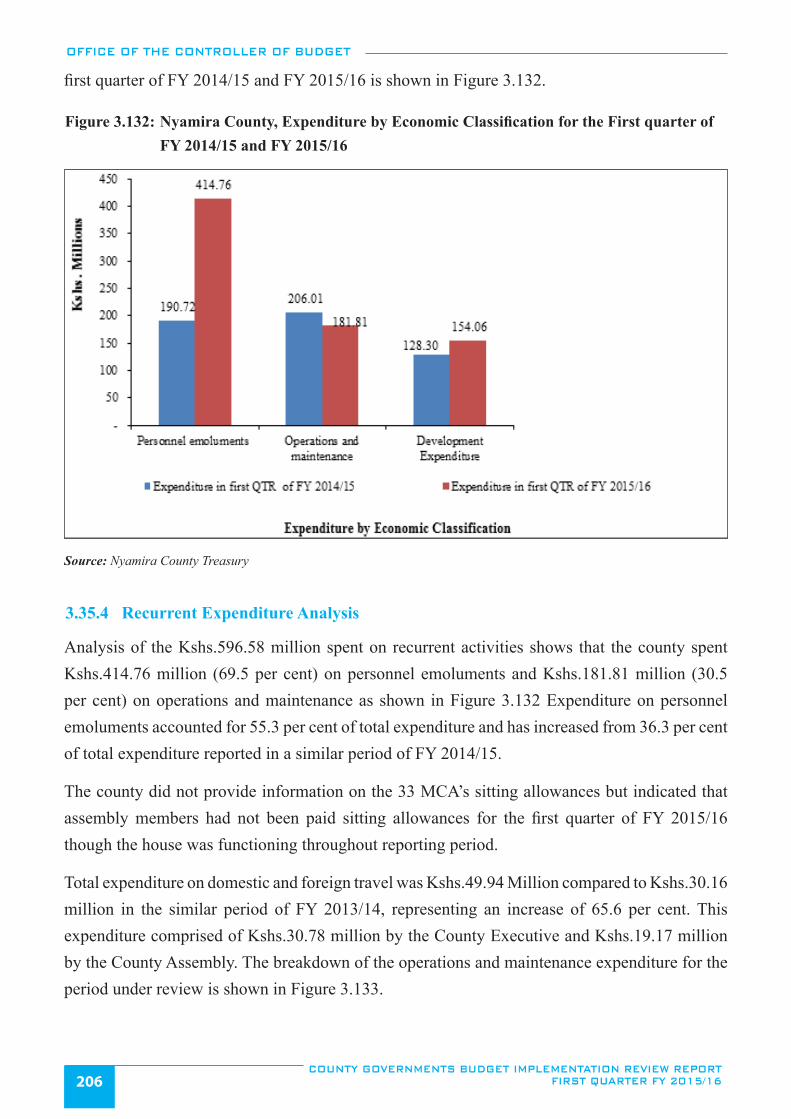
OFFICE OF THE CONTROLLER OF BUDGET
COUNTY GOVERNMENTS BUDGET IMPLEMENTATION REVIEW REPORT FIRST QUARTER FY 2015/16206
first quarter of FY 2014/15 and FY 2015/16 is shown in Figure 3.132.
Figure 3.132: Nyamira County, Expenditure by Economic Classification for the First quarter of FY 2014/15 and FY 2015/16
Source: Nyamira County Treasury
3.35.4 Recurrent Expenditure Analysis
Analysis of the Kshs.596.58 million spent on recurrent activities shows that the county spent Kshs.414.76 million (69.5 per cent) on personnel emoluments and Kshs.181.81 million (30.5 per cent) on operations and maintenance as shown in Figure 3.132 Expenditure on personnel emoluments accounted for 55.3 per cent of total expenditure and has increased from 36.3 per cent of total expenditure reported in a similar period of FY 2014/15.
The county did not provide information on the 33 MCA’s sitting allowances but indicated that assembly members had not been paid sitting allowances for the first quarter of FY 2015/16 though the house was functioning throughout reporting period.
Total expenditure on domestic and foreign travel was Kshs.49.94 Million compared to Kshs.30.16 million in the similar period of FY 2013/14, representing an increase of 65.6 per cent. This expenditure comprised of Kshs.30.78 million by the County Executive and Kshs.19.17 million by the County Assembly. The breakdown of the operations and maintenance expenditure for the period under review is shown in Figure 3.133.
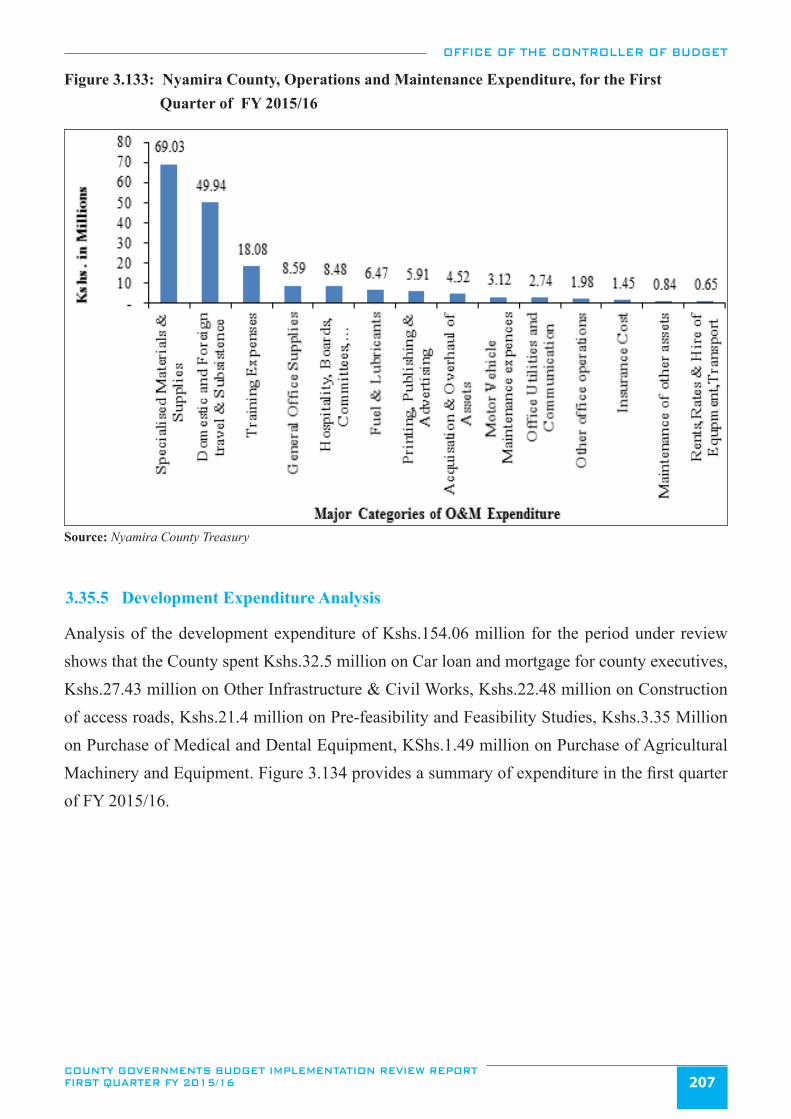
OFFICE OF THE CONTROLLER OF BUDGET
COUNTY GOVERNMENTS BUDGET IMPLEMENTATION REVIEW REPORT FIRST QUARTER FY 2015/16 207
Figure 3.133: Nyamira County, Operations and Maintenance Expenditure, for the First Quarter of FY 2015/16
Source: Nyamira County Treasury
3.35.5 Development Expenditure Analysis
Analysis of the development expenditure of Kshs.154.06 million for the period under review shows that the County spent Kshs.32.5 million on Car loan and mortgage for county executives, Kshs.27.43 million on Other Infrastructure & Civil Works, Kshs.22.48 million on Construction of access roads, Kshs.21.4 million on Pre-feasibility and Feasibility Studies, Kshs.3.35 Million on Purchase of Medical and Dental Equipment, KShs.1.49 million on Purchase of Agricultural Machinery and Equipment. Figure 3.134 provides a summary of expenditure in the first quarter of FY 2015/16.
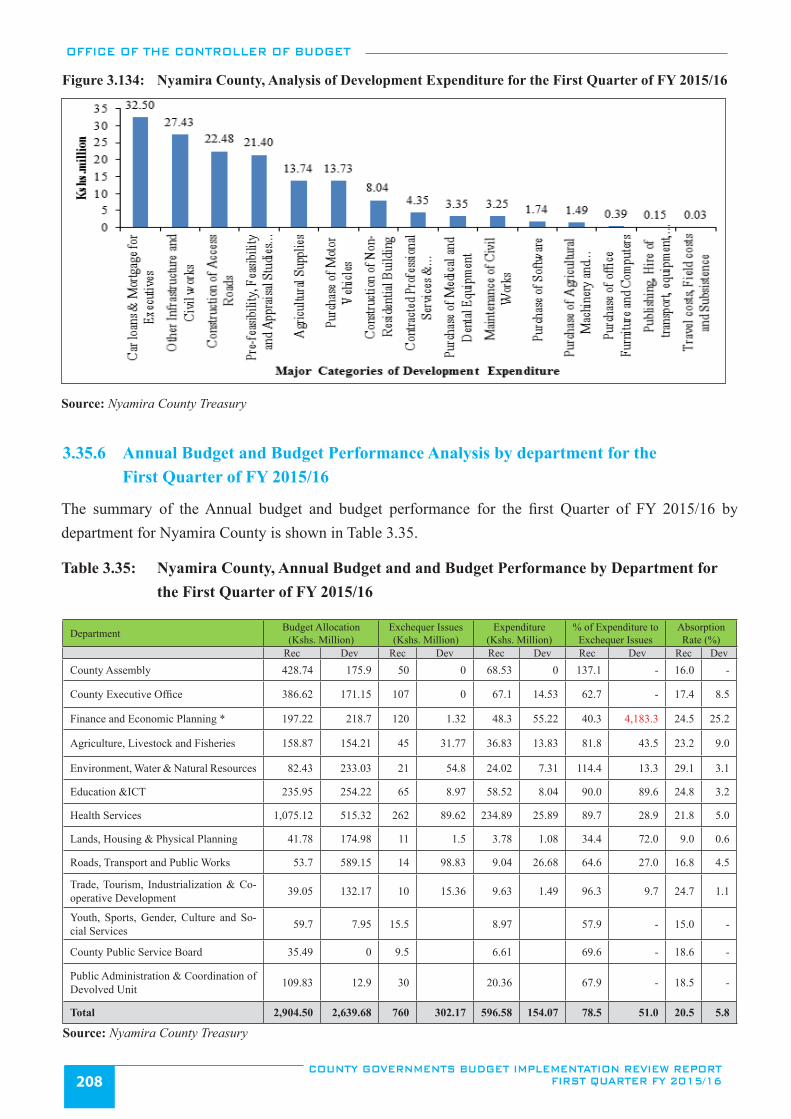
OFFICE OF THE CONTROLLER OF BUDGET
COUNTY GOVERNMENTS BUDGET IMPLEMENTATION REVIEW REPORT FIRST QUARTER FY 2015/16208
Figure 3.134: Nyamira County, Analysis of Development Expenditure for the First Quarter of FY 2015/16
Source: Nyamira County Treasury
3.35.6 Annual Budget and Budget Performance Analysis by department for the First Quarter of FY 2015/16
The summary of the Annual budget and budget performance for the first Quarter of FY 2015/16 by department for Nyamira County is shown in Table 3.35.
Table 3.35: Nyamira County, Annual Budget and and Budget Performance by Department for the First Quarter of FY 2015/16
Department Budget Allocation (Kshs. Million)
Exchequer Issues (Kshs. Million)
Expenditure (Kshs. Million)
% of Expenditure to Exchequer Issues
Absorption Rate (%)
Rec Dev Rec Dev Rec Dev Rec Dev Rec DevCounty Assembly 428.74 175.9 50 0 68.53 0 137.1 - 16.0 -
County Executive Office 386.62 171.15 107 0 67.1 14.53 62.7 - 17.4 8.5
Finance and Economic Planning * 197.22 218.7 120 1.32 48.3 55.22 40.3 4,183.3 24.5 25.2
Agriculture, Livestock and Fisheries 158.87 154.21 45 31.77 36.83 13.83 81.8 43.5 23.2 9.0
Environment, Water & Natural Resources 82.43 233.03 21 54.8 24.02 7.31 114.4 13.3 29.1 3.1
Education &ICT 235.95 254.22 65 8.97 58.52 8.04 90.0 89.6 24.8 3.2
Health Services 1,075.12 515.32 262 89.62 234.89 25.89 89.7 28.9 21.8 5.0
Lands, Housing & Physical Planning 41.78 174.98 11 1.5 3.78 1.08 34.4 72.0 9.0 0.6
Roads, Transport and Public Works 53.7 589.15 14 98.83 9.04 26.68 64.6 27.0 16.8 4.5
Trade, Tourism, Industrialization & Co-operative Development 39.05 132.17 10 15.36 9.63 1.49 96.3 9.7 24.7 1.1
Youth, Sports, Gender, Culture and So-cial Services 59.7 7.95 15.5 8.97 57.9 - 15.0 -
County Public Service Board 35.49 0 9.5 6.61 69.6 - 18.6 -
Public Administration & Coordination of Devolved Unit 109.83 12.9 30 20.36 67.9 - 18.5 -
Total 2,904.50 2,639.68 760 302.17 596.58 154.07 78.5 51.0 20.5 5.8
Source: Nyamira County Treasury
OFFICE OF THE CONTROLLER OF BUDGET
COUNTY GOVERNMENTS BUDGET IMPLEMENTATION REVIEW REPORT FIRST QUARTER FY 2015/16 209
* Recurrent exchequer release for Department of Finance and Economic Planning includes Kshs.65 million budgeted for in Development Estimates as mortgage and car loan for executive.
The breakdown of expenditure by department shows that the Finance and Economic Planning department attained the highest absorption rate of development budget at 24.5 per cent. On the other hand Lands, Housing & Physical Planning department had the lowest absorption rate of development budget at 0.6 per cent.
3.35.7 Observations and Recommendations
During the period under review, it was noted that the County has implemented most of the recommendations made in previous CBIRRs. The County has;
i. Embraced the use of IFMIS to process financial transactions by the County Treasury.ii. Appointed administrators for each established County Fund in line with Section 116 of the
PFM Act, 2012.
Despite the progress, the following challenges continued to hamper effective budget implementation in the first quarter of FY 2015/16:
i. Some expenditure items were classified as development items even though they were recur-rent in nature. These included: purchase of vehicles, official furniture, hire of transport, travel and subsistence allowances, among others.
ii. Inadequate personnel to ensure proper functioning of the finance departments of both the County Executive and the County Assembly.
iii. Delay in submission of expenditure reports on established County Funds.iv. The County Assembly is yet to adopt IFMIS in processing financial transactions.v. Lack of an internal audit committee, which is contrary to Section 155 of the PFM Act 2012.
The County should implement the following recommendations in order to improve budget execution:
i. The County Treasury should ensure proper classification of expenditure items in line with the Government Finance Statistics (GFS) coding structure.
ii. County should engage adequate personnel in the finance department and also develop staff capacity through training to ensure improved service delivery.
iii. The County Treasury should ensure that financial statements on the established County Funds are prepared in time and submitted to the Controller of Budget in a timely manner as envis-aged in Section 166 of the PFM Act, 2012.
iv. The County Assembly should adopt IFMIS in processing all financial transactions.v. The County Treasury should establish an internal audit committee in order to strengthen in-
OFFICE OF THE CONTROLLER OF BUDGET
COUNTY GOVERNMENTS BUDGET IMPLEMENTATION REVIEW REPORT FIRST QUARTER FY 2015/16210
ternal oversight mechanisms in line with Section 155 the PFM Act, 2012.
3.36 Nyandarua County
3.36.1 Overview of the FY 2015/16 County Budget
The Approved Budget Estimates for Nyandarua County FY 2015/16 amounts to Kshs.4.28 billion, with Kshs.2.80 billion (65.5 per cent) allocated to recurrent expenditure and Kshs.1.47 billion (34.5 per cent) to development expenditure.
In order to finance this budget, the County expects to receive Kshs.3.983 billion (93.1 per cent) as transfers from the National Government, collect Kshs.235.5 million (5.5 per cent) from local sources, receive DANIDA conditional grant of Kshs.18.86 million (0.4 per cent) and Kshs.42 million (1 per cent) as F.I.F. However, the County did not budget for balance brought forward from FY 2014/15 amounting to Kshs.591.03 million and additional grants as provided for in CARA, 2015 which include; Kshs.13.94 million as compensation for user fees forgone, Kshs.54.71 million for the road maintenance levy, Kshs.50.71 million for free maternal health care, Kshs.95.74 million for leasing of medical equipment and Kshs.73 million as other conditional loans/grants. In addition, the equitable share was under budgeted by Kshs.323.27 million indicating that the county had a surplus budget.
3.36.2 Revenue Analysis
In the first quarter of the FY 2015/16, the County received Kshs.344.57 million from the National Government as direct transfer to the CRF account, raised Kshs.49.90 million from local sources, and had Kshs.591.03 million as actual cash balance brought forward from FY 2014/15. The local revenue raised in the period under review of Kshs.49.90 million was an improvement from Kshs.26.86 million collected in a similar period of FY 2014/15 and accounted for 21.2 per cent of the annual local revenue target. Figure 3.135 shows the trend of local revenue collection by quarter from the first quarter of FY 2013/14 to the first quarter of FY 2015/16.
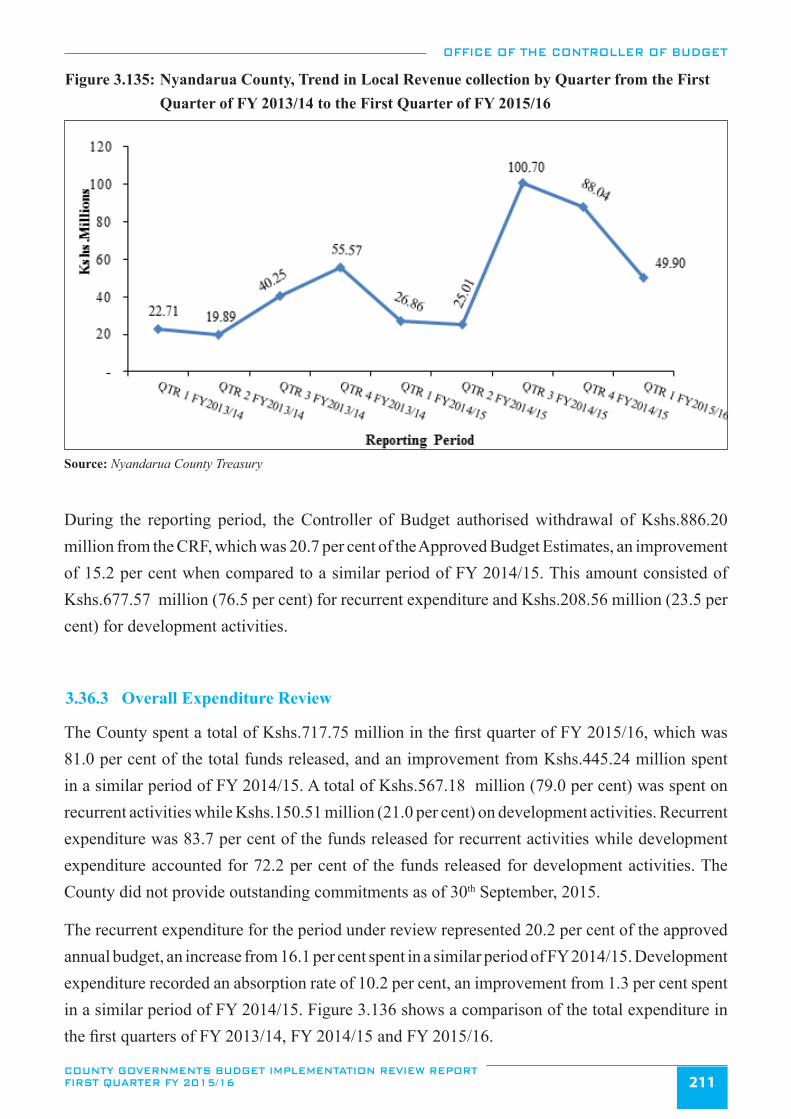
OFFICE OF THE CONTROLLER OF BUDGET
COUNTY GOVERNMENTS BUDGET IMPLEMENTATION REVIEW REPORT FIRST QUARTER FY 2015/16 211
Figure 3.135: Nyandarua County, Trend in Local Revenue collection by Quarter from the First Quarter of FY 2013/14 to the First Quarter of FY 2015/16
Source: Nyandarua County Treasury
During the reporting period, the Controller of Budget authorised withdrawal of Kshs.886.20 million from the CRF, which was 20.7 per cent of the Approved Budget Estimates, an improvement of 15.2 per cent when compared to a similar period of FY 2014/15. This amount consisted of Kshs.677.57 million (76.5 per cent) for recurrent expenditure and Kshs.208.56 million (23.5 per cent) for development activities.
3.36.3 Overall Expenditure Review
The County spent a total of Kshs.717.75 million in the first quarter of FY 2015/16, which was 81.0 per cent of the total funds released, and an improvement from Kshs.445.24 million spent in a similar period of FY 2014/15. A total of Kshs.567.18 million (79.0 per cent) was spent on recurrent activities while Kshs.150.51 million (21.0 per cent) on development activities. Recurrent expenditure was 83.7 per cent of the funds released for recurrent activities while development expenditure accounted for 72.2 per cent of the funds released for development activities. The County did not provide outstanding commitments as of 30th September, 2015.
The recurrent expenditure for the period under review represented 20.2 per cent of the approved annual budget, an increase from 16.1 per cent spent in a similar period of FY 2014/15. Development expenditure recorded an absorption rate of 10.2 per cent, an improvement from 1.3 per cent spent in a similar period of FY 2014/15. Figure 3.136 shows a comparison of the total expenditure in the first quarters of FY 2013/14, FY 2014/15 and FY 2015/16.
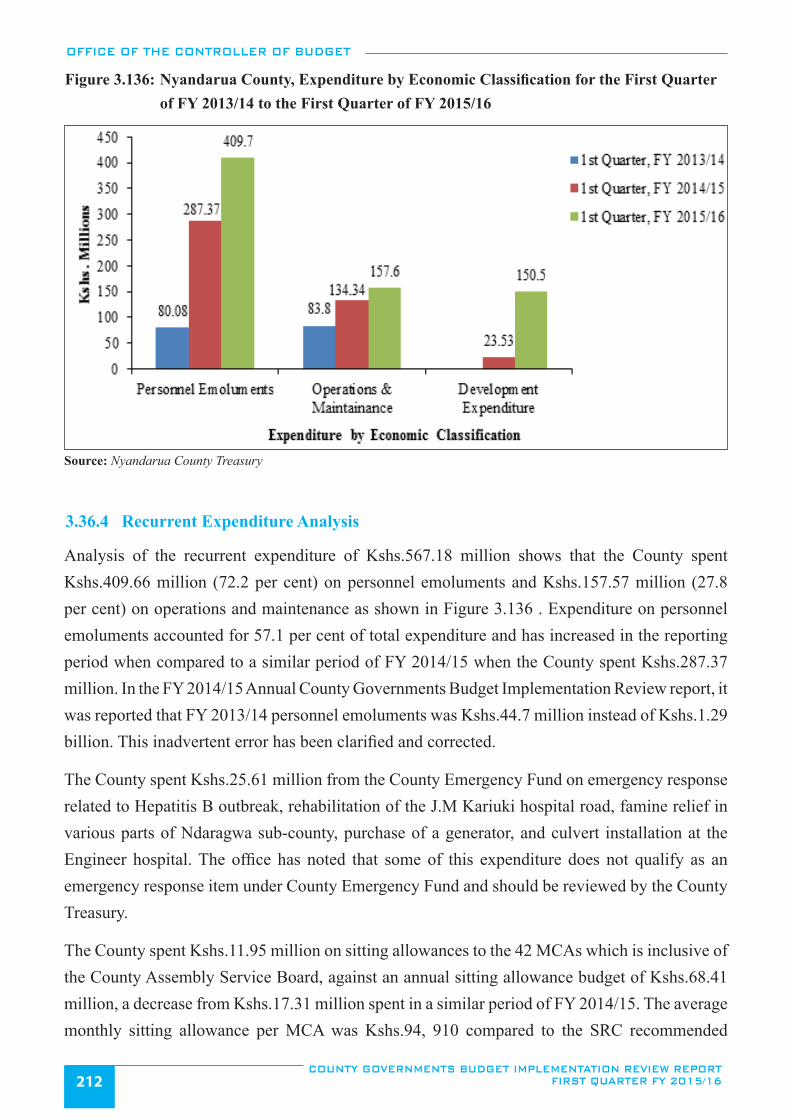
OFFICE OF THE CONTROLLER OF BUDGET
COUNTY GOVERNMENTS BUDGET IMPLEMENTATION REVIEW REPORT FIRST QUARTER FY 2015/16212
Figure 3.136: Nyandarua County, Expenditure by Economic Classification for the First Quarter of FY 2013/14 to the First Quarter of FY 2015/16
Source: Nyandarua County Treasury
3.36.4 Recurrent Expenditure Analysis
Analysis of the recurrent expenditure of Kshs.567.18 million shows that the County spent Kshs.409.66 million (72.2 per cent) on personnel emoluments and Kshs.157.57 million (27.8 per cent) on operations and maintenance as shown in Figure 3.136 . Expenditure on personnel emoluments accounted for 57.1 per cent of total expenditure and has increased in the reporting period when compared to a similar period of FY 2014/15 when the County spent Kshs.287.37 million. In the FY 2014/15 Annual County Governments Budget Implementation Review report, it was reported that FY 2013/14 personnel emoluments was Kshs.44.7 million instead of Kshs.1.29 billion. This inadvertent error has been clarified and corrected.
The County spent Kshs.25.61 million from the County Emergency Fund on emergency response related to Hepatitis B outbreak, rehabilitation of the J.M Kariuki hospital road, famine relief in various parts of Ndaragwa sub-county, purchase of a generator, and culvert installation at the Engineer hospital. The office has noted that some of this expenditure does not qualify as an emergency response item under County Emergency Fund and should be reviewed by the County Treasury.
The County spent Kshs.11.95 million on sitting allowances to the 42 MCAs which is inclusive of the County Assembly Service Board, against an annual sitting allowance budget of Kshs.68.41 million, a decrease from Kshs.17.31 million spent in a similar period of FY 2014/15. The average monthly sitting allowance per MCA was Kshs.94, 910 compared to the SRC recommended
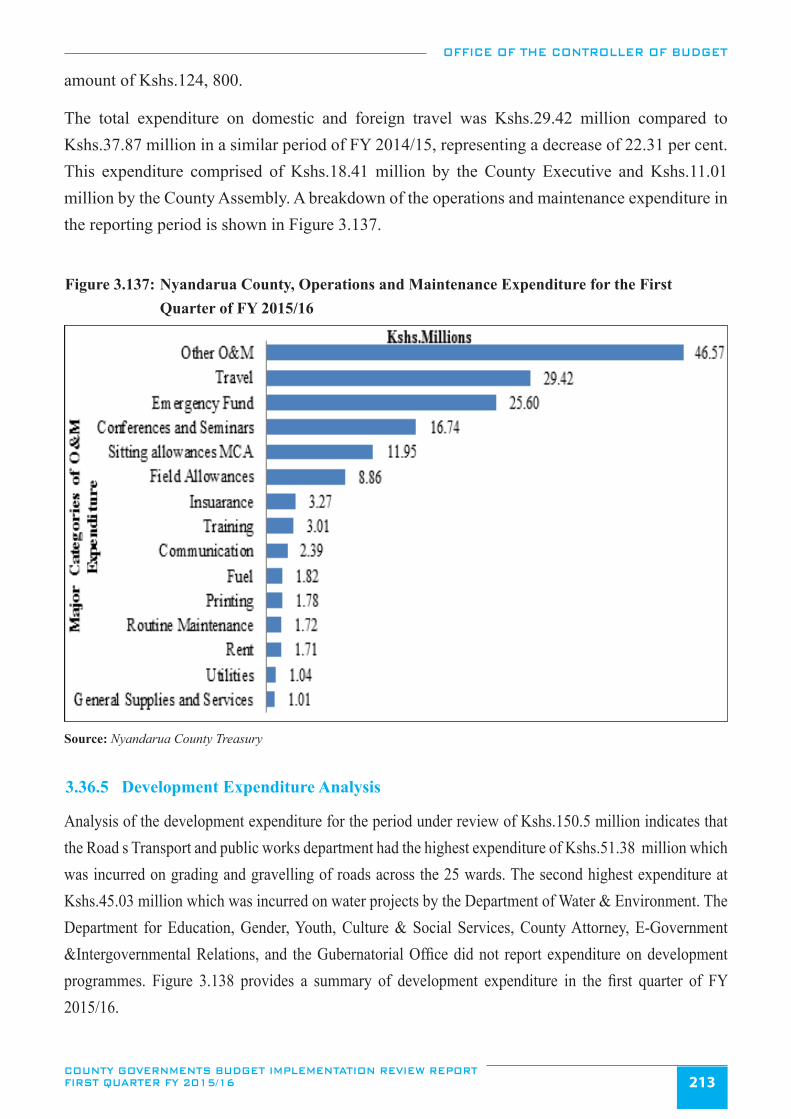
OFFICE OF THE CONTROLLER OF BUDGET
COUNTY GOVERNMENTS BUDGET IMPLEMENTATION REVIEW REPORT FIRST QUARTER FY 2015/16 213
amount of Kshs.124, 800.
The total expenditure on domestic and foreign travel was Kshs.29.42 million compared to Kshs.37.87 million in a similar period of FY 2014/15, representing a decrease of 22.31 per cent. This expenditure comprised of Kshs.18.41 million by the County Executive and Kshs.11.01 million by the County Assembly. A breakdown of the operations and maintenance expenditure in the reporting period is shown in Figure 3.137.
Figure 3.137: Nyandarua County, Operations and Maintenance Expenditure for the First Quarter of FY 2015/16
Source: Nyandarua County Treasury
3.36.5 Development Expenditure Analysis
Analysis of the development expenditure for the period under review of Kshs.150.5 million indicates that the Road s Transport and public works department had the highest expenditure of Kshs.51.38 million which was incurred on grading and gravelling of roads across the 25 wards. The second highest expenditure at Kshs.45.03 million which was incurred on water projects by the Department of Water & Environment. The Department for Education, Gender, Youth, Culture & Social Services, County Attorney, E-Government &Intergovernmental Relations, and the Gubernatorial Office did not report expenditure on development programmes. Figure 3.138 provides a summary of development expenditure in the first quarter of FY 2015/16.
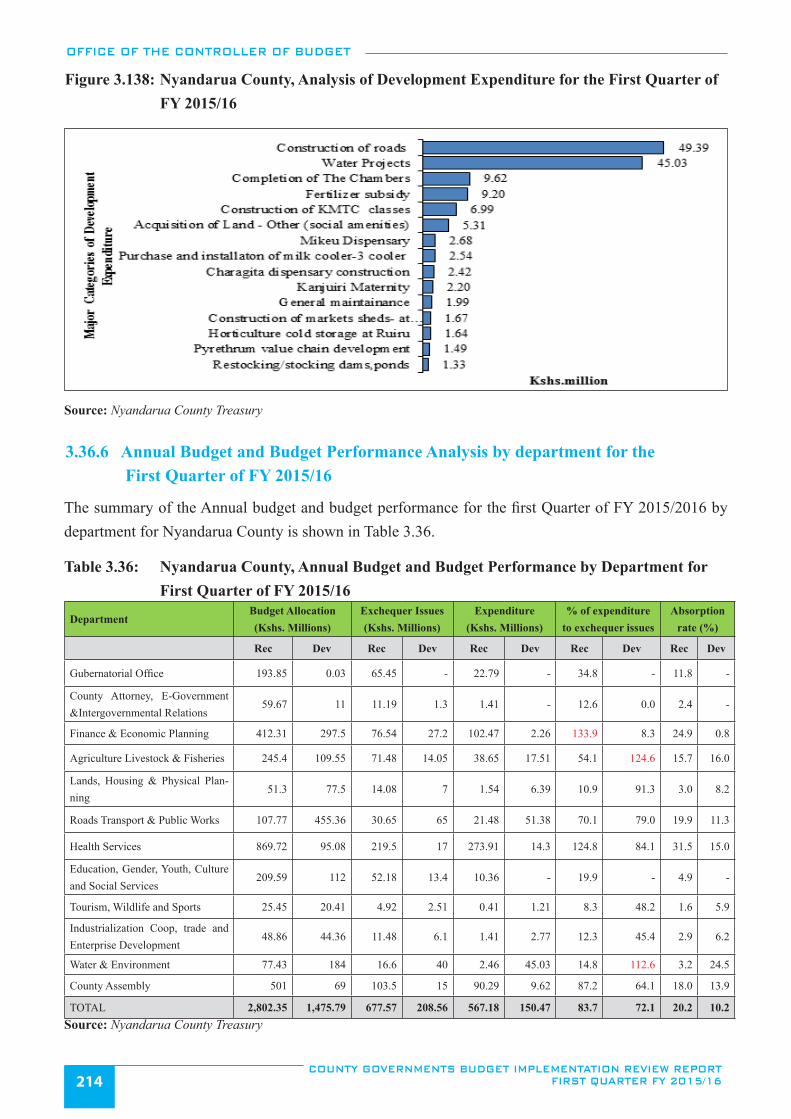
OFFICE OF THE CONTROLLER OF BUDGET
COUNTY GOVERNMENTS BUDGET IMPLEMENTATION REVIEW REPORT FIRST QUARTER FY 2015/16214
Figure 3.138: Nyandarua County, Analysis of Development Expenditure for the First Quarter of FY 2015/16
Source: Nyandarua County Treasury
3.36.6 Annual Budget and Budget Performance Analysis by department for the First Quarter of FY 2015/16
The summary of the Annual budget and budget performance for the first Quarter of FY 2015/2016 by department for Nyandarua County is shown in Table 3.36.
Table 3.36: Nyandarua County, Annual Budget and Budget Performance by Department for First Quarter of FY 2015/16
DepartmentBudget Allocation (Kshs. Millions)
Exchequer Issues (Kshs. Millions)
Expenditure (Kshs. Millions)
% of expenditure to exchequer issues
Absorption rate (%)
Rec Dev Rec Dev Rec Dev Rec Dev Rec Dev
Gubernatorial Office 193.85 0.03 65.45 - 22.79 - 34.8 - 11.8 -
County Attorney, E-Government &Intergovernmental Relations
59.67 11 11.19 1.3 1.41 - 12.6 0.0 2.4 -
Finance & Economic Planning 412.31 297.5 76.54 27.2 102.47 2.26 133.9 8.3 24.9 0.8
Agriculture Livestock & Fisheries 245.4 109.55 71.48 14.05 38.65 17.51 54.1 124.6 15.7 16.0
Lands, Housing & Physical Plan-ning
51.3 77.5 14.08 7 1.54 6.39 10.9 91.3 3.0 8.2
Roads Transport & Public Works 107.77 455.36 30.65 65 21.48 51.38 70.1 79.0 19.9 11.3
Health Services 869.72 95.08 219.5 17 273.91 14.3 124.8 84.1 31.5 15.0
Education, Gender, Youth, Culture and Social Services
209.59 112 52.18 13.4 10.36 - 19.9 - 4.9 -
Tourism, Wildlife and Sports 25.45 20.41 4.92 2.51 0.41 1.21 8.3 48.2 1.6 5.9
Industrialization Coop, trade and Enterprise Development
48.86 44.36 11.48 6.1 1.41 2.77 12.3 45.4 2.9 6.2
Water & Environment 77.43 184 16.6 40 2.46 45.03 14.8 112.6 3.2 24.5
County Assembly 501 69 103.5 15 90.29 9.62 87.2 64.1 18.0 13.9
TOTAL 2,802.35 1,475.79 677.57 208.56 567.18 150.47 83.7 72.1 20.2 10.2Source: Nyandarua County Treasury
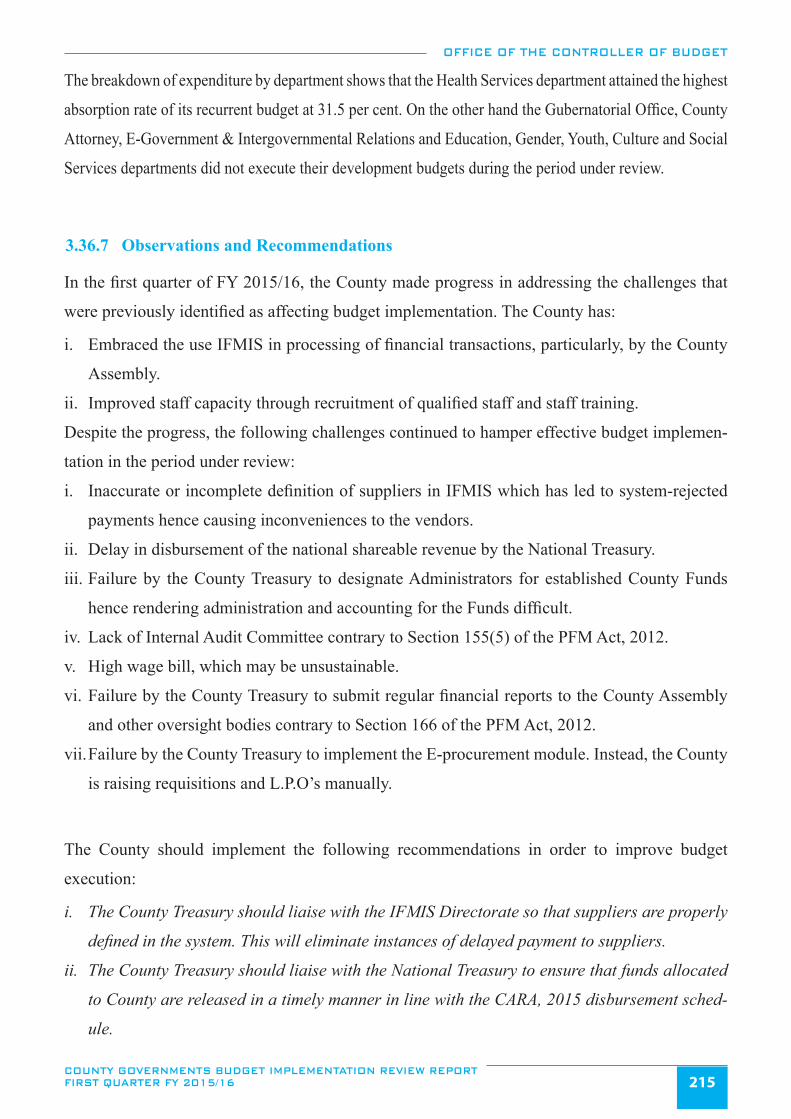
OFFICE OF THE CONTROLLER OF BUDGET
COUNTY GOVERNMENTS BUDGET IMPLEMENTATION REVIEW REPORT FIRST QUARTER FY 2015/16 215
The breakdown of expenditure by department shows that the Health Services department attained the highest
absorption rate of its recurrent budget at 31.5 per cent. On the other hand the Gubernatorial Office, County
Attorney, E-Government & Intergovernmental Relations and Education, Gender, Youth, Culture and Social
Services departments did not execute their development budgets during the period under review.
3.36.7 Observations and Recommendations
In the first quarter of FY 2015/16, the County made progress in addressing the challenges that
were previously identified as affecting budget implementation. The County has:
i. Embraced the use IFMIS in processing of financial transactions, particularly, by the County
Assembly.
ii. Improved staff capacity through recruitment of qualified staff and staff training.
Despite the progress, the following challenges continued to hamper effective budget implemen-
tation in the period under review:
i. Inaccurate or incomplete definition of suppliers in IFMIS which has led to system-rejected
payments hence causing inconveniences to the vendors.
ii. Delay in disbursement of the national shareable revenue by the National Treasury.
iii. Failure by the County Treasury to designate Administrators for established County Funds
hence rendering administration and accounting for the Funds difficult.
iv. Lack of Internal Audit Committee contrary to Section 155(5) of the PFM Act, 2012.
v. High wage bill, which may be unsustainable.
vi. Failure by the County Treasury to submit regular financial reports to the County Assembly
and other oversight bodies contrary to Section 166 of the PFM Act, 2012.
vii. Failure by the County Treasury to implement the E-procurement module. Instead, the County
is raising requisitions and L.P.O’s manually.
The County should implement the following recommendations in order to improve budget
execution:
i. The County Treasury should liaise with the IFMIS Directorate so that suppliers are properly
defined in the system. This will eliminate instances of delayed payment to suppliers.
ii. The County Treasury should liaise with the National Treasury to ensure that funds allocated
to County are released in a timely manner in line with the CARA, 2015 disbursement sched-
ule.
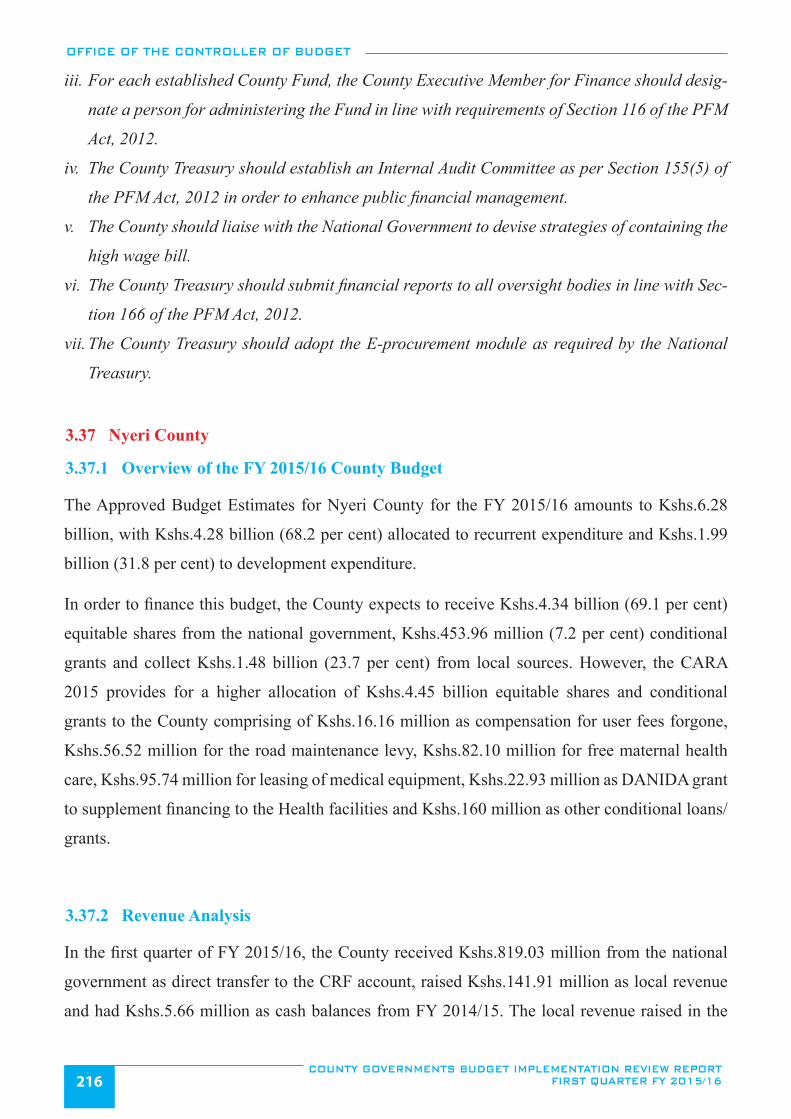
OFFICE OF THE CONTROLLER OF BUDGET
COUNTY GOVERNMENTS BUDGET IMPLEMENTATION REVIEW REPORT FIRST QUARTER FY 2015/16216
iii. For each established County Fund, the County Executive Member for Finance should desig-
nate a person for administering the Fund in line with requirements of Section 116 of the PFM
Act, 2012.
iv. The County Treasury should establish an Internal Audit Committee as per Section 155(5) of
the PFM Act, 2012 in order to enhance public financial management.
v. The County should liaise with the National Government to devise strategies of containing the
high wage bill.
vi. The County Treasury should submit financial reports to all oversight bodies in line with Sec-
tion 166 of the PFM Act, 2012.
vii. The County Treasury should adopt the E-procurement module as required by the National
Treasury.
3.37 Nyeri County
3.37.1 Overview of the FY 2015/16 County Budget
The Approved Budget Estimates for Nyeri County for the FY 2015/16 amounts to Kshs.6.28
billion, with Kshs.4.28 billion (68.2 per cent) allocated to recurrent expenditure and Kshs.1.99
billion (31.8 per cent) to development expenditure.
In order to finance this budget, the County expects to receive Kshs.4.34 billion (69.1 per cent)
equitable shares from the national government, Kshs.453.96 million (7.2 per cent) conditional
grants and collect Kshs.1.48 billion (23.7 per cent) from local sources. However, the CARA
2015 provides for a higher allocation of Kshs.4.45 billion equitable shares and conditional
grants to the County comprising of Kshs.16.16 million as compensation for user fees forgone,
Kshs.56.52 million for the road maintenance levy, Kshs.82.10 million for free maternal health
care, Kshs.95.74 million for leasing of medical equipment, Kshs.22.93 million as DANIDA grant
to supplement financing to the Health facilities and Kshs.160 million as other conditional loans/
grants.
3.37.2 Revenue Analysis
In the first quarter of FY 2015/16, the County received Kshs.819.03 million from the national
government as direct transfer to the CRF account, raised Kshs.141.91 million as local revenue
and had Kshs.5.66 million as cash balances from FY 2014/15. The local revenue raised in the
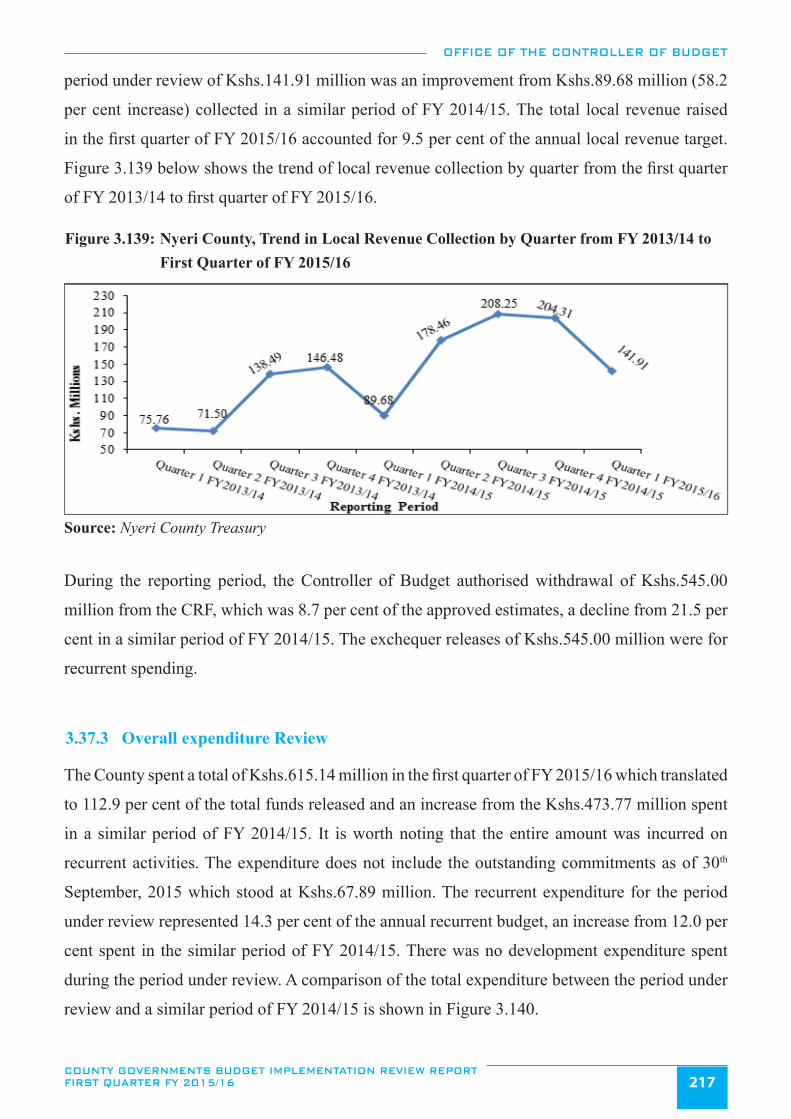
OFFICE OF THE CONTROLLER OF BUDGET
COUNTY GOVERNMENTS BUDGET IMPLEMENTATION REVIEW REPORT FIRST QUARTER FY 2015/16 217
period under review of Kshs.141.91 million was an improvement from Kshs.89.68 million (58.2
per cent increase) collected in a similar period of FY 2014/15. The total local revenue raised
in the first quarter of FY 2015/16 accounted for 9.5 per cent of the annual local revenue target.
Figure 3.139 below shows the trend of local revenue collection by quarter from the first quarter
of FY 2013/14 to first quarter of FY 2015/16.
Figure 3.139: Nyeri County, Trend in Local Revenue Collection by Quarter from FY 2013/14 to First Quarter of FY 2015/16
Source: Nyeri County Treasury
During the reporting period, the Controller of Budget authorised withdrawal of Kshs.545.00
million from the CRF, which was 8.7 per cent of the approved estimates, a decline from 21.5 per
cent in a similar period of FY 2014/15. The exchequer releases of Kshs.545.00 million were for
recurrent spending.
3.37.3 Overall expenditure Review
The County spent a total of Kshs.615.14 million in the first quarter of FY 2015/16 which translated
to 112.9 per cent of the total funds released and an increase from the Kshs.473.77 million spent
in a similar period of FY 2014/15. It is worth noting that the entire amount was incurred on
recurrent activities. The expenditure does not include the outstanding commitments as of 30th
September, 2015 which stood at Kshs.67.89 million. The recurrent expenditure for the period
under review represented 14.3 per cent of the annual recurrent budget, an increase from 12.0 per
cent spent in the similar period of FY 2014/15. There was no development expenditure spent
during the period under review. A comparison of the total expenditure between the period under
review and a similar period of FY 2014/15 is shown in Figure 3.140.
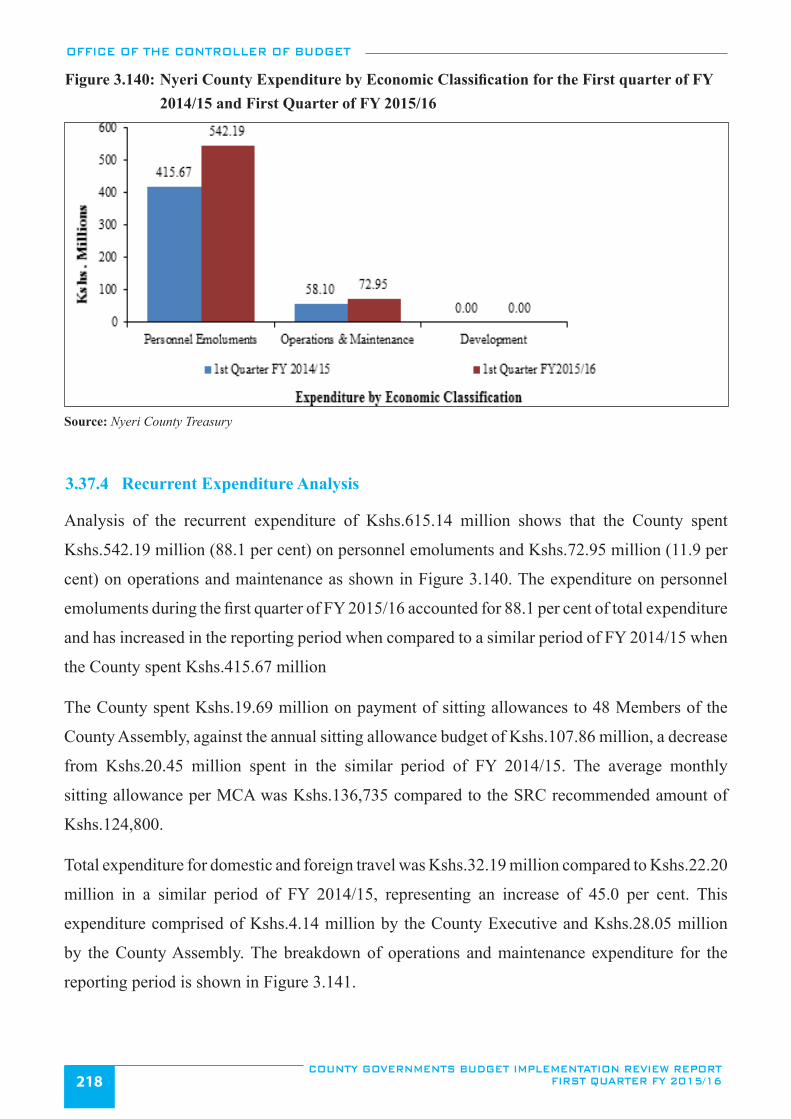
OFFICE OF THE CONTROLLER OF BUDGET
COUNTY GOVERNMENTS BUDGET IMPLEMENTATION REVIEW REPORT FIRST QUARTER FY 2015/16218
Figure 3.140: Nyeri County Expenditure by Economic Classification for the First quarter of FY 2014/15 and First Quarter of FY 2015/16
Source: Nyeri County Treasury
3.37.4 Recurrent Expenditure Analysis
Analysis of the recurrent expenditure of Kshs.615.14 million shows that the County spent
Kshs.542.19 million (88.1 per cent) on personnel emoluments and Kshs.72.95 million (11.9 per
cent) on operations and maintenance as shown in Figure 3.140. The expenditure on personnel
emoluments during the first quarter of FY 2015/16 accounted for 88.1 per cent of total expenditure
and has increased in the reporting period when compared to a similar period of FY 2014/15 when
the County spent Kshs.415.67 million
The County spent Kshs.19.69 million on payment of sitting allowances to 48 Members of the
County Assembly, against the annual sitting allowance budget of Kshs.107.86 million, a decrease
from Kshs.20.45 million spent in the similar period of FY 2014/15. The average monthly
sitting allowance per MCA was Kshs.136,735 compared to the SRC recommended amount of
Kshs.124,800.
Total expenditure for domestic and foreign travel was Kshs.32.19 million compared to Kshs.22.20
million in a similar period of FY 2014/15, representing an increase of 45.0 per cent. This
expenditure comprised of Kshs.4.14 million by the County Executive and Kshs.28.05 million
by the County Assembly. The breakdown of operations and maintenance expenditure for the
reporting period is shown in Figure 3.141.
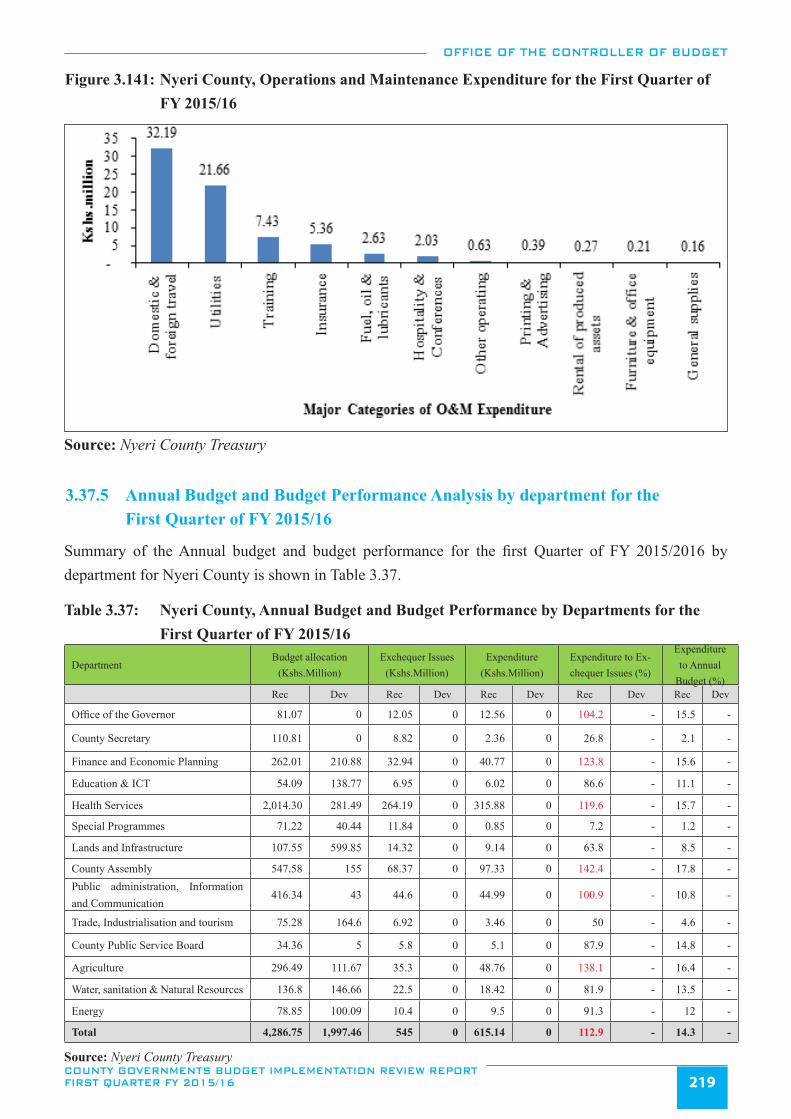
OFFICE OF THE CONTROLLER OF BUDGET
COUNTY GOVERNMENTS BUDGET IMPLEMENTATION REVIEW REPORT FIRST QUARTER FY 2015/16 219
Figure 3.141: Nyeri County, Operations and Maintenance Expenditure for the First Quarter of FY 2015/16
Source: Nyeri County Treasury
3.37.5 Annual Budget and Budget Performance Analysis by department for the First Quarter of FY 2015/16
Summary of the Annual budget and budget performance for the first Quarter of FY 2015/2016 by department for Nyeri County is shown in Table 3.37.
Table 3.37: Nyeri County, Annual Budget and Budget Performance by Departments for the First Quarter of FY 2015/16
DepartmentBudget allocation
(Kshs.Million)Exchequer Issues
(Kshs.Million)Expenditure
(Kshs.Million)Expenditure to Ex-chequer Issues (%)
Expenditure to Annual
Budget (%)Rec Dev Rec Dev Rec Dev Rec Dev Rec Dev
Office of the Governor 81.07 0 12.05 0 12.56 0 104.2 - 15.5 -
County Secretary 110.81 0 8.82 0 2.36 0 26.8 - 2.1 -
Finance and Economic Planning 262.01 210.88 32.94 0 40.77 0 123.8 - 15.6 -
Education & ICT 54.09 138.77 6.95 0 6.02 0 86.6 - 11.1 -
Health Services 2,014.30 281.49 264.19 0 315.88 0 119.6 - 15.7 -
Special Programmes 71.22 40.44 11.84 0 0.85 0 7.2 - 1.2 -
Lands and Infrastructure 107.55 599.85 14.32 0 9.14 0 63.8 - 8.5 -
County Assembly 547.58 155 68.37 0 97.33 0 142.4 - 17.8 - Public administration, Information and Communication
416.34 43 44.6 0 44.99 0 100.9 - 10.8 -
Trade, Industrialisation and tourism 75.28 164.6 6.92 0 3.46 0 50 - 4.6 -
County Public Service Board 34.36 5 5.8 0 5.1 0 87.9 - 14.8 -
Agriculture 296.49 111.67 35.3 0 48.76 0 138.1 - 16.4 -
Water, sanitation & Natural Resources 136.8 146.66 22.5 0 18.42 0 81.9 - 13.5 -
Energy 78.85 100.09 10.4 0 9.5 0 91.3 - 12 -
Total 4,286.75 1,997.46 545 0 615.14 0 112.9 - 14.3 -
Source: Nyeri County Treasury
OFFICE OF THE CONTROLLER OF BUDGET
COUNTY GOVERNMENTS BUDGET IMPLEMENTATION REVIEW REPORT FIRST QUARTER FY 2015/16220
Further analysis of expenditure by department shows that County Assembly attained the highest absorption rate of its recurrent budget at 17.8 per cent. Agriculture and Health Services departments recorded the second and third highest absorption rates of 16.4 per cent and 15.7 per cent respectively of their recurrent budgets. On the other hand, the Office of the County Secretary had the lowest absorption rate of its recurrent budget at 2.1 per cent.
3.37.6 Observations and Recommendations
During the period under review, the county made progress in addressing the challenges that were previously identified as affecting budget implementation. The County has:
i. Strengthened the Internal Audit Department through recruitment of key staff.ii. Developed and approved regulations for County Emergency Fund and the County Assembly
Mortgage and Car loan Fund but it is yet to develop and approve regulations as well as ap-point designated administrators for the County Executive Mortgage and Car loan Fund and the Widows empowerment fund
Despite some progress, the following challenges continued to hamper effective budget implementation in the period under review:
i. Under performance of local revenue.ii. Emerging spending pressures on non-priority areas like travelling expenses, which grew by
45.0 per cent during the reporting period when compared to a similar period of FY 2014/15. This will crowd out development spending.
iii. Delays in the disbursement of funds by the National Treasury, which affected timely imple-mentation of programmes.
iv. Lack of Internal Audit Committee contrary to Section 155(5) of the PFM Act, 2012.
v. The County is yet to operationalize the E-procurement module.
The County should implement the following recommendations in order to improve budget execution:
i. The County should devise strategies to improve local revenue collection. ii. The County should rationalise spending on non-critical activities in order to free funds for
development activities.iii. The County Treasury should liaise with the National Treasury in order to address the delay in
release of funds to the County.
OFFICE OF THE CONTROLLER OF BUDGET
COUNTY GOVERNMENTS BUDGET IMPLEMENTATION REVIEW REPORT FIRST QUARTER FY 2015/16 221
iv. The County Treasury should establish an Internal Audit Committee as per Section 155(5) of the PFM Act, 2012 in order to enhance public financial management.
v. The County should liaise with the National Treasury’s IFMIS Directorate to building capac-ity of the county staff on the E-procurement module.
3.38 Samburu County
3.38.1 Overview of the FY 2015/16 County Budget
The approved Budget for Samburu County for FY 2015/16 was Kshs.4.06 billion, with Kshs.2.57 billion (63.3 per cent) allocated to recurrent expenditure and Kshs.1.49 billion (36.7 per cent) to development expenditure.
In order to finance the budget, the county expects to receive Kshs.3.53 billion (86.8 per cent) as transfers from the national government, collect Kshs.356.58 million (8.8 per cent) from local sources, receive Kshs.45.12 million (1.1 per cent) as Road Maintenance Levy and Kshs.10.99 million (0.27 per cent) as a conditional grant of from DANIDA. Other conditional grants included User Fees Foregone of Kshs.5.22 million (0.13 per cent), Free Maternity of Kshs.14.18 million (0.34 per cent), Conditional Health allocation of Kshs.91.8 million (2.26 per cent) and a World Bank grant of Kshs.8.67 million (0.2 per cent). The balance brought forward from FY 2014/15 amounting to Kshs.355.38 million was not included in the budget.
3.38.2 Revenue Analysis
In the first quarter of the FY 2015/16, the County received Kshs.284.18 million from the National Government as a direct transfer to the CRF account, raised Kshs.51.07 million from local sources and had Kshs.355.38 million as cash balance brought forward from FY 2014/15. The local revenue raised in the first quarter of FY 2014/15 of Kshs.51.07 million was a decline from Kshs.65.14 million collected in a similar period of FY 2014/15 and accounted for 14.3 per cent of the annual local revenue target. Figure 3.142 shows the trend of local revenue collection by quarters from the first quarter of FY 2013/14 to the first quarter of FY 2015/16.
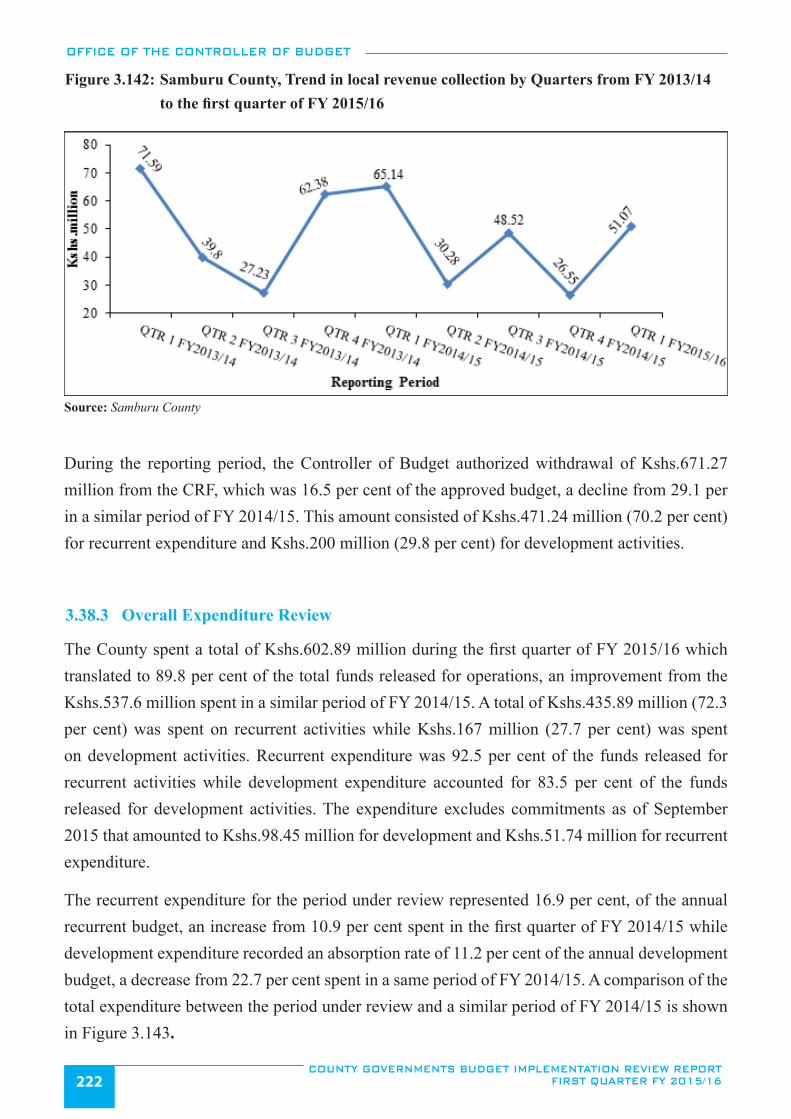
OFFICE OF THE CONTROLLER OF BUDGET
COUNTY GOVERNMENTS BUDGET IMPLEMENTATION REVIEW REPORT FIRST QUARTER FY 2015/16222
Figure 3.142: Samburu County, Trend in local revenue collection by Quarters from FY 2013/14 to the first quarter of FY 2015/16
Source: Samburu County
During the reporting period, the Controller of Budget authorized withdrawal of Kshs.671.27 million from the CRF, which was 16.5 per cent of the approved budget, a decline from 29.1 per in a similar period of FY 2014/15. This amount consisted of Kshs.471.24 million (70.2 per cent) for recurrent expenditure and Kshs.200 million (29.8 per cent) for development activities.
3.38.3 Overall Expenditure Review
The County spent a total of Kshs.602.89 million during the first quarter of FY 2015/16 which translated to 89.8 per cent of the total funds released for operations, an improvement from the Kshs.537.6 million spent in a similar period of FY 2014/15. A total of Kshs.435.89 million (72.3 per cent) was spent on recurrent activities while Kshs.167 million (27.7 per cent) was spent on development activities. Recurrent expenditure was 92.5 per cent of the funds released for recurrent activities while development expenditure accounted for 83.5 per cent of the funds released for development activities. The expenditure excludes commitments as of September 2015 that amounted to Kshs.98.45 million for development and Kshs.51.74 million for recurrent expenditure.
The recurrent expenditure for the period under review represented 16.9 per cent, of the annual recurrent budget, an increase from 10.9 per cent spent in the first quarter of FY 2014/15 while development expenditure recorded an absorption rate of 11.2 per cent of the annual development budget, a decrease from 22.7 per cent spent in a same period of FY 2014/15. A comparison of the total expenditure between the period under review and a similar period of FY 2014/15 is shown in Figure 3.143.
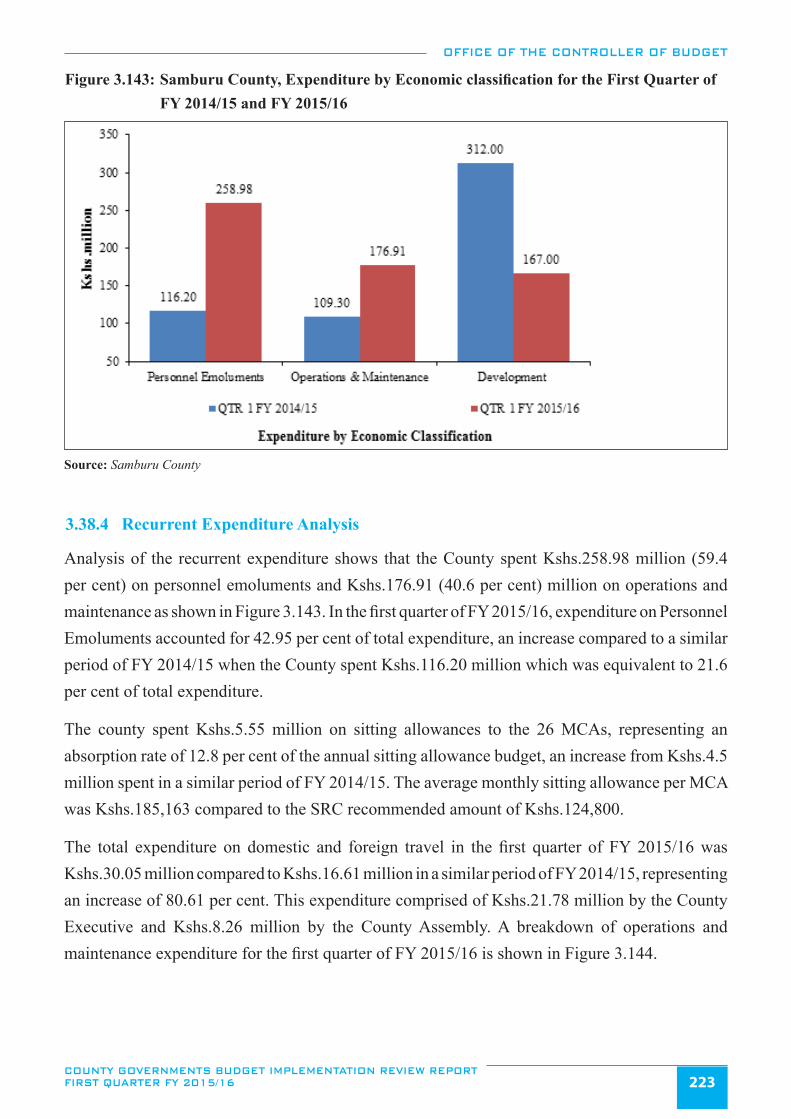
OFFICE OF THE CONTROLLER OF BUDGET
COUNTY GOVERNMENTS BUDGET IMPLEMENTATION REVIEW REPORT FIRST QUARTER FY 2015/16 223
Figure 3.143: Samburu County, Expenditure by Economic classification for the First Quarter of FY 2014/15 and FY 2015/16
Source: Samburu County
3.38.4 Recurrent Expenditure Analysis
Analysis of the recurrent expenditure shows that the County spent Kshs.258.98 million (59.4 per cent) on personnel emoluments and Kshs.176.91 (40.6 per cent) million on operations and maintenance as shown in Figure 3.143. In the first quarter of FY 2015/16, expenditure on Personnel Emoluments accounted for 42.95 per cent of total expenditure, an increase compared to a similar period of FY 2014/15 when the County spent Kshs.116.20 million which was equivalent to 21.6 per cent of total expenditure.
The county spent Kshs.5.55 million on sitting allowances to the 26 MCAs, representing an absorption rate of 12.8 per cent of the annual sitting allowance budget, an increase from Kshs.4.5 million spent in a similar period of FY 2014/15. The average monthly sitting allowance per MCA was Kshs.185,163 compared to the SRC recommended amount of Kshs.124,800.
The total expenditure on domestic and foreign travel in the first quarter of FY 2015/16 was Kshs.30.05 million compared to Kshs.16.61 million in a similar period of FY 2014/15, representing an increase of 80.61 per cent. This expenditure comprised of Kshs.21.78 million by the County Executive and Kshs.8.26 million by the County Assembly. A breakdown of operations and maintenance expenditure for the first quarter of FY 2015/16 is shown in Figure 3.144.
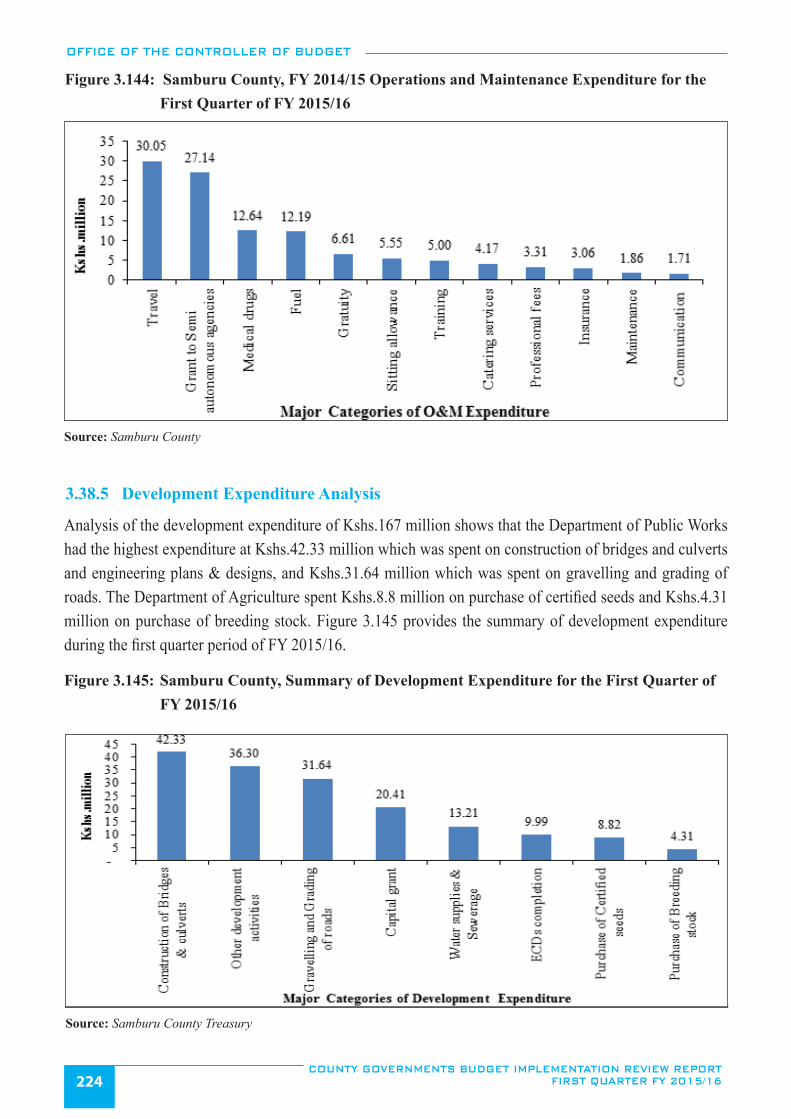
OFFICE OF THE CONTROLLER OF BUDGET
COUNTY GOVERNMENTS BUDGET IMPLEMENTATION REVIEW REPORT FIRST QUARTER FY 2015/16224
Figure 3.144: Samburu County, FY 2014/15 Operations and Maintenance Expenditure for the First Quarter of FY 2015/16
Source: Samburu County
3.38.5 Development Expenditure Analysis
Analysis of the development expenditure of Kshs.167 million shows that the Department of Public Works had the highest expenditure at Kshs.42.33 million which was spent on construction of bridges and culverts and engineering plans & designs, and Kshs.31.64 million which was spent on gravelling and grading of roads. The Department of Agriculture spent Kshs.8.8 million on purchase of certified seeds and Kshs.4.31 million on purchase of breeding stock. Figure 3.145 provides the summary of development expenditure during the first quarter period of FY 2015/16.
Figure 3.145: Samburu County, Summary of Development Expenditure for the First Quarter of FY 2015/16
Source: Samburu County Treasury
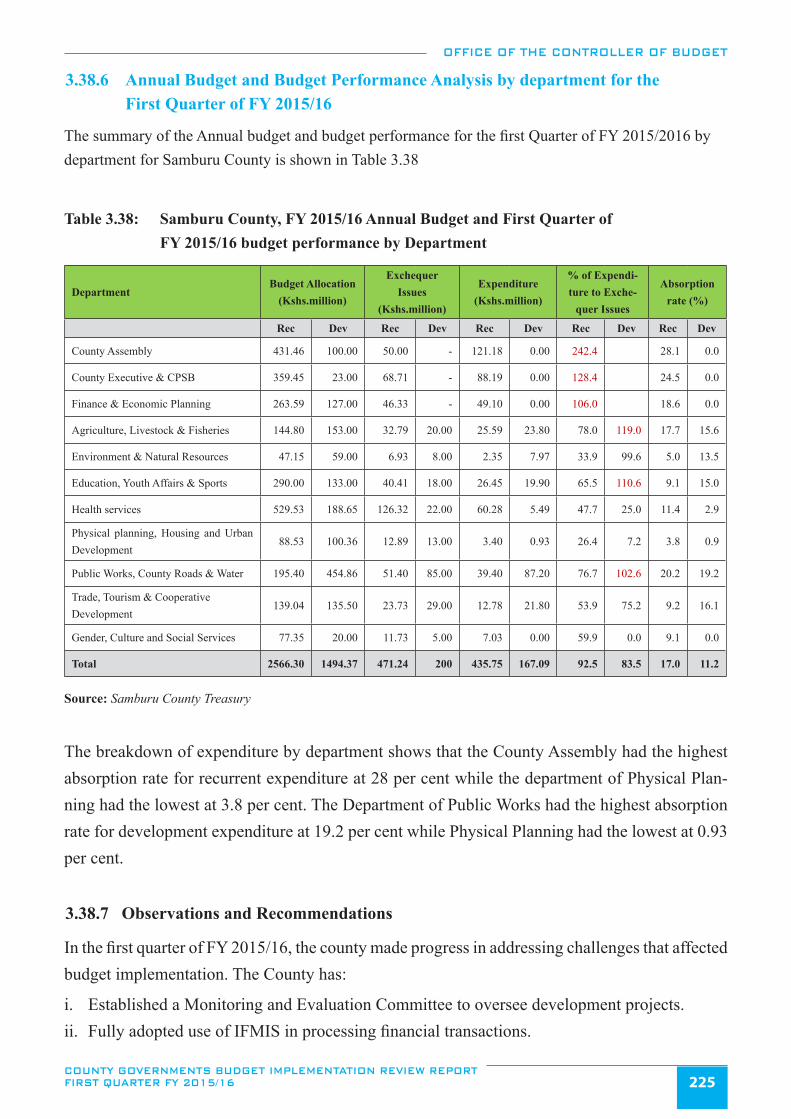
OFFICE OF THE CONTROLLER OF BUDGET
COUNTY GOVERNMENTS BUDGET IMPLEMENTATION REVIEW REPORT FIRST QUARTER FY 2015/16 225
3.38.6 Annual Budget and Budget Performance Analysis by department for the First Quarter of FY 2015/16
The summary of the Annual budget and budget performance for the first Quarter of FY 2015/2016 by department for Samburu County is shown in Table 3.38
Table 3.38: Samburu County, FY 2015/16 Annual Budget and First Quarter of FY 2015/16 budget performance by Department
DepartmentBudget Allocation
(Kshs.million)
Exchequer Issues
(Kshs.million)
Expenditure (Kshs.million)
% of Expendi-ture to Exche-
quer Issues
Absorption rate (%)
Rec Dev Rec Dev Rec Dev Rec Dev Rec Dev
County Assembly 431.46 100.00 50.00 - 121.18 0.00 242.4 28.1 0.0
County Executive & CPSB 359.45 23.00 68.71 - 88.19 0.00 128.4 24.5 0.0
Finance & Economic Planning 263.59 127.00 46.33 - 49.10 0.00 106.0 18.6 0.0
Agriculture, Livestock & Fisheries 144.80 153.00 32.79 20.00 25.59 23.80 78.0 119.0 17.7 15.6
Environment & Natural Resources 47.15 59.00 6.93 8.00 2.35 7.97 33.9 99.6 5.0 13.5
Education, Youth Affairs & Sports 290.00 133.00 40.41 18.00 26.45 19.90 65.5 110.6 9.1 15.0
Health services 529.53 188.65 126.32 22.00 60.28 5.49 47.7 25.0 11.4 2.9
Physical planning, Housing and Urban Development
88.53 100.36 12.89 13.00 3.40 0.93 26.4 7.2 3.8 0.9
Public Works, County Roads & Water 195.40 454.86 51.40 85.00 39.40 87.20 76.7 102.6 20.2 19.2
Trade, Tourism & Cooperative Development
139.04 135.50 23.73 29.00 12.78 21.80 53.9 75.2 9.2 16.1
Gender, Culture and Social Services 77.35 20.00 11.73 5.00 7.03 0.00 59.9 0.0 9.1 0.0
Total 2566.30 1494.37 471.24 200 435.75 167.09 92.5 83.5 17.0 11.2
Source: Samburu County Treasury
The breakdown of expenditure by department shows that the County Assembly had the highest absorption rate for recurrent expenditure at 28 per cent while the department of Physical Plan-ning had the lowest at 3.8 per cent. The Department of Public Works had the highest absorption rate for development expenditure at 19.2 per cent while Physical Planning had the lowest at 0.93 per cent.
3.38.7 Observations and Recommendations
In the first quarter of FY 2015/16, the county made progress in addressing challenges that affected budget implementation. The County has:
i. Established a Monitoring and Evaluation Committee to oversee development projects.ii. Fully adopted use of IFMIS in processing financial transactions.
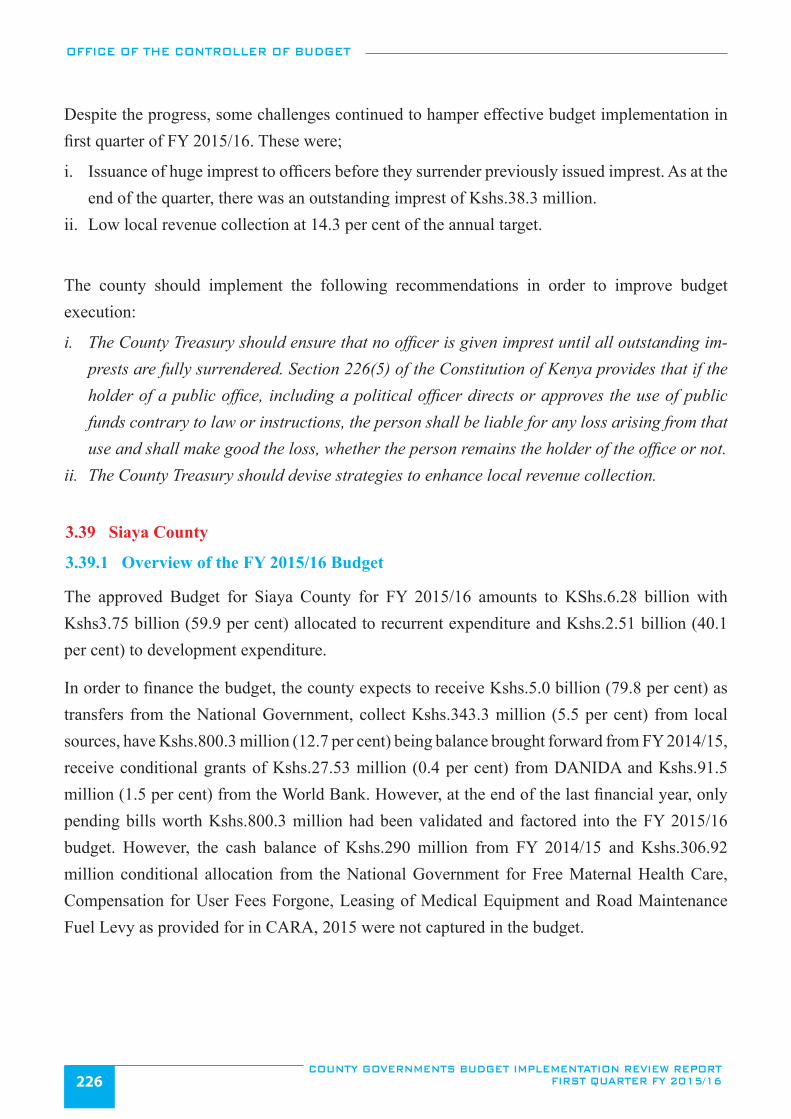
OFFICE OF THE CONTROLLER OF BUDGET
COUNTY GOVERNMENTS BUDGET IMPLEMENTATION REVIEW REPORT FIRST QUARTER FY 2015/16226
Despite the progress, some challenges continued to hamper effective budget implementation in first quarter of FY 2015/16. These were;
i. Issuance of huge imprest to officers before they surrender previously issued imprest. As at the end of the quarter, there was an outstanding imprest of Kshs.38.3 million.
ii. Low local revenue collection at 14.3 per cent of the annual target.
The county should implement the following recommendations in order to improve budget execution:
i. The County Treasury should ensure that no officer is given imprest until all outstanding im-prests are fully surrendered. Section 226(5) of the Constitution of Kenya provides that if the holder of a public office, including a political officer directs or approves the use of public funds contrary to law or instructions, the person shall be liable for any loss arising from that use and shall make good the loss, whether the person remains the holder of the office or not.
ii. The County Treasury should devise strategies to enhance local revenue collection.
3.39 Siaya County
3.39.1 Overview of the FY 2015/16 Budget
The approved Budget for Siaya County for FY 2015/16 amounts to KShs.6.28 billion with Kshs3.75 billion (59.9 per cent) allocated to recurrent expenditure and Kshs.2.51 billion (40.1 per cent) to development expenditure.
In order to finance the budget, the county expects to receive Kshs.5.0 billion (79.8 per cent) as transfers from the National Government, collect Kshs.343.3 million (5.5 per cent) from local sources, have Kshs.800.3 million (12.7 per cent) being balance brought forward from FY 2014/15, receive conditional grants of Kshs.27.53 million (0.4 per cent) from DANIDA and Kshs.91.5 million (1.5 per cent) from the World Bank. However, at the end of the last financial year, only pending bills worth Kshs.800.3 million had been validated and factored into the FY 2015/16 budget. However, the cash balance of Kshs.290 million from FY 2014/15 and Kshs.306.92 million conditional allocation from the National Government for Free Maternal Health Care, Compensation for User Fees Forgone, Leasing of Medical Equipment and Road Maintenance Fuel Levy as provided for in CARA, 2015 were not captured in the budget.
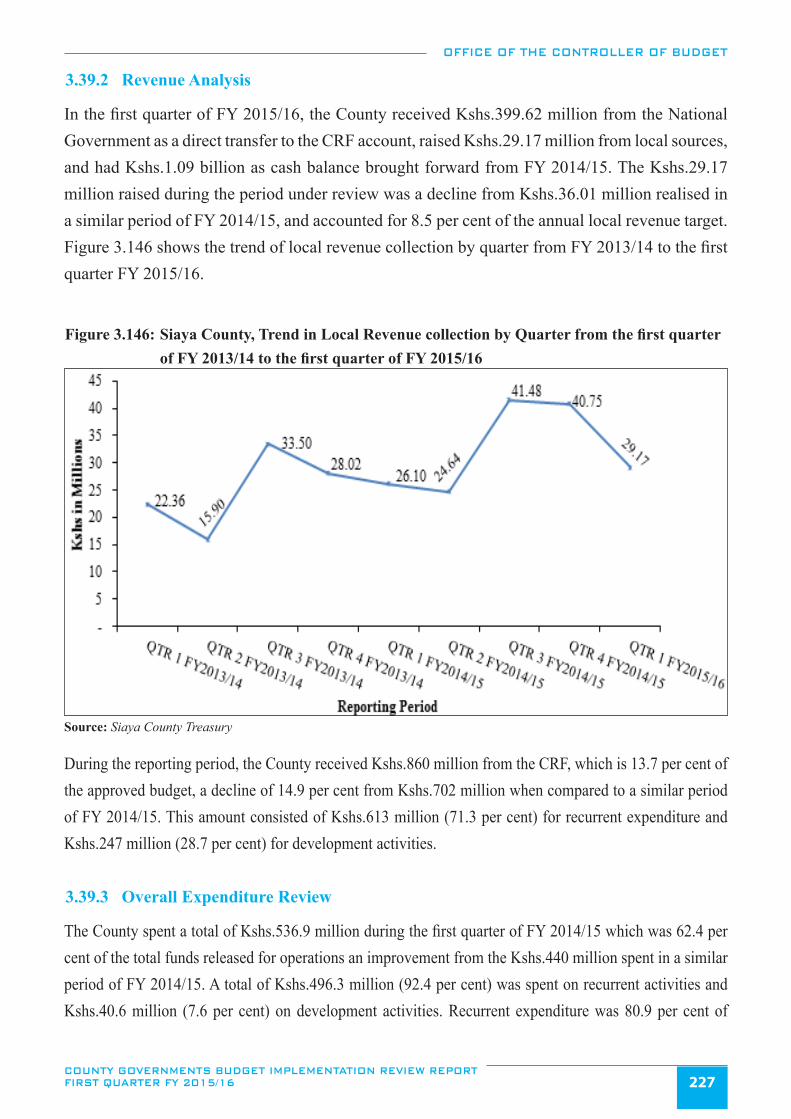
OFFICE OF THE CONTROLLER OF BUDGET
COUNTY GOVERNMENTS BUDGET IMPLEMENTATION REVIEW REPORT FIRST QUARTER FY 2015/16 227
3.39.2 Revenue Analysis
In the first quarter of FY 2015/16, the County received Kshs.399.62 million from the National Government as a direct transfer to the CRF account, raised Kshs.29.17 million from local sources, and had Kshs.1.09 billion as cash balance brought forward from FY 2014/15. The Kshs.29.17 million raised during the period under review was a decline from Kshs.36.01 million realised in a similar period of FY 2014/15, and accounted for 8.5 per cent of the annual local revenue target. Figure 3.146 shows the trend of local revenue collection by quarter from FY 2013/14 to the first quarter FY 2015/16.
Figure 3.146: Siaya County, Trend in Local Revenue collection by Quarter from the first quarter of FY 2013/14 to the first quarter of FY 2015/16
Source: Siaya County Treasury
During the reporting period, the County received Kshs.860 million from the CRF, which is 13.7 per cent of the approved budget, a decline of 14.9 per cent from Kshs.702 million when compared to a similar period of FY 2014/15. This amount consisted of Kshs.613 million (71.3 per cent) for recurrent expenditure and Kshs.247 million (28.7 per cent) for development activities.
3.39.3 Overall Expenditure Review
The County spent a total of Kshs.536.9 million during the first quarter of FY 2014/15 which was 62.4 per cent of the total funds released for operations an improvement from the Kshs.440 million spent in a similar period of FY 2014/15. A total of Kshs.496.3 million (92.4 per cent) was spent on recurrent activities and Kshs.40.6 million (7.6 per cent) on development activities. Recurrent expenditure was 80.9 per cent of
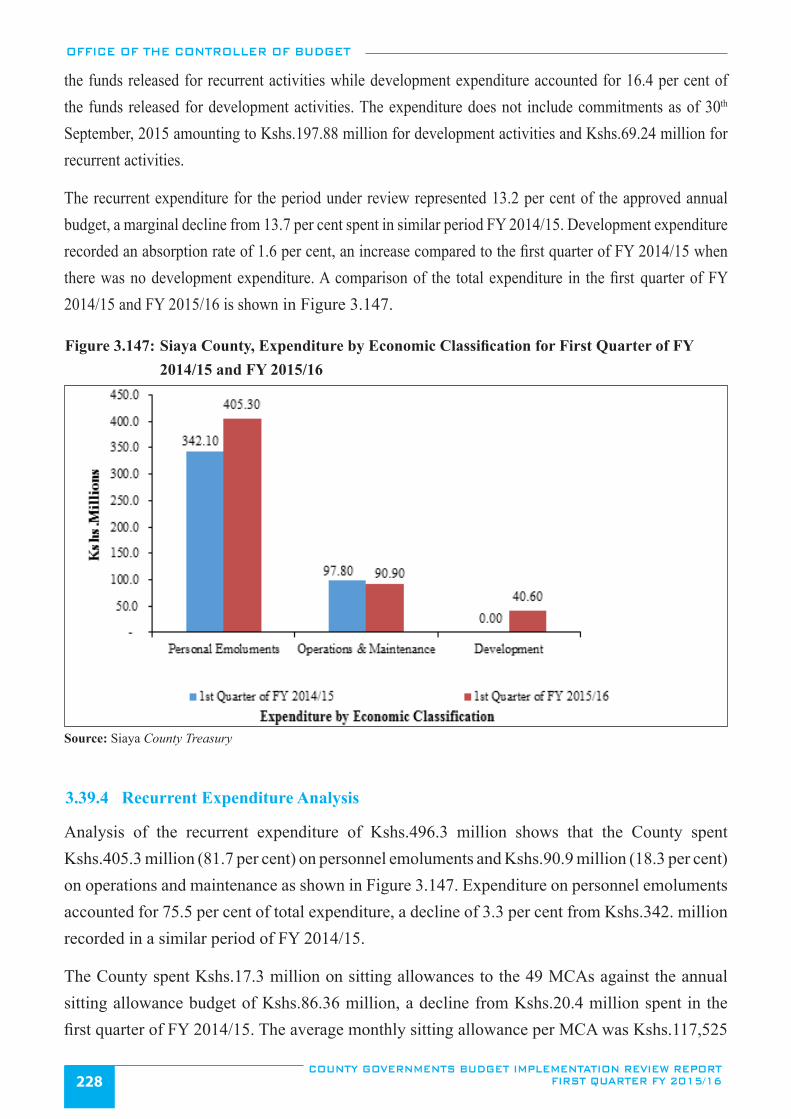
OFFICE OF THE CONTROLLER OF BUDGET
COUNTY GOVERNMENTS BUDGET IMPLEMENTATION REVIEW REPORT FIRST QUARTER FY 2015/16228
the funds released for recurrent activities while development expenditure accounted for 16.4 per cent of the funds released for development activities. The expenditure does not include commitments as of 30th September, 2015 amounting to Kshs.197.88 million for development activities and Kshs.69.24 million for recurrent activities.
The recurrent expenditure for the period under review represented 13.2 per cent of the approved annual budget, a marginal decline from 13.7 per cent spent in similar period FY 2014/15. Development expenditure recorded an absorption rate of 1.6 per cent, an increase compared to the first quarter of FY 2014/15 when there was no development expenditure. A comparison of the total expenditure in the first quarter of FY 2014/15 and FY 2015/16 is shown in Figure 3.147.
Figure 3.147: Siaya County, Expenditure by Economic Classification for First Quarter of FY 2014/15 and FY 2015/16
Source: Siaya County Treasury
3.39.4 Recurrent Expenditure Analysis
Analysis of the recurrent expenditure of Kshs.496.3 million shows that the County spent Kshs.405.3 million (81.7 per cent) on personnel emoluments and Kshs.90.9 million (18.3 per cent) on operations and maintenance as shown in Figure 3.147. Expenditure on personnel emoluments accounted for 75.5 per cent of total expenditure, a decline of 3.3 per cent from Kshs.342. million recorded in a similar period of FY 2014/15.
The County spent Kshs.17.3 million on sitting allowances to the 49 MCAs against the annual sitting allowance budget of Kshs.86.36 million, a decline from Kshs.20.4 million spent in the first quarter of FY 2014/15. The average monthly sitting allowance per MCA was Kshs.117,525
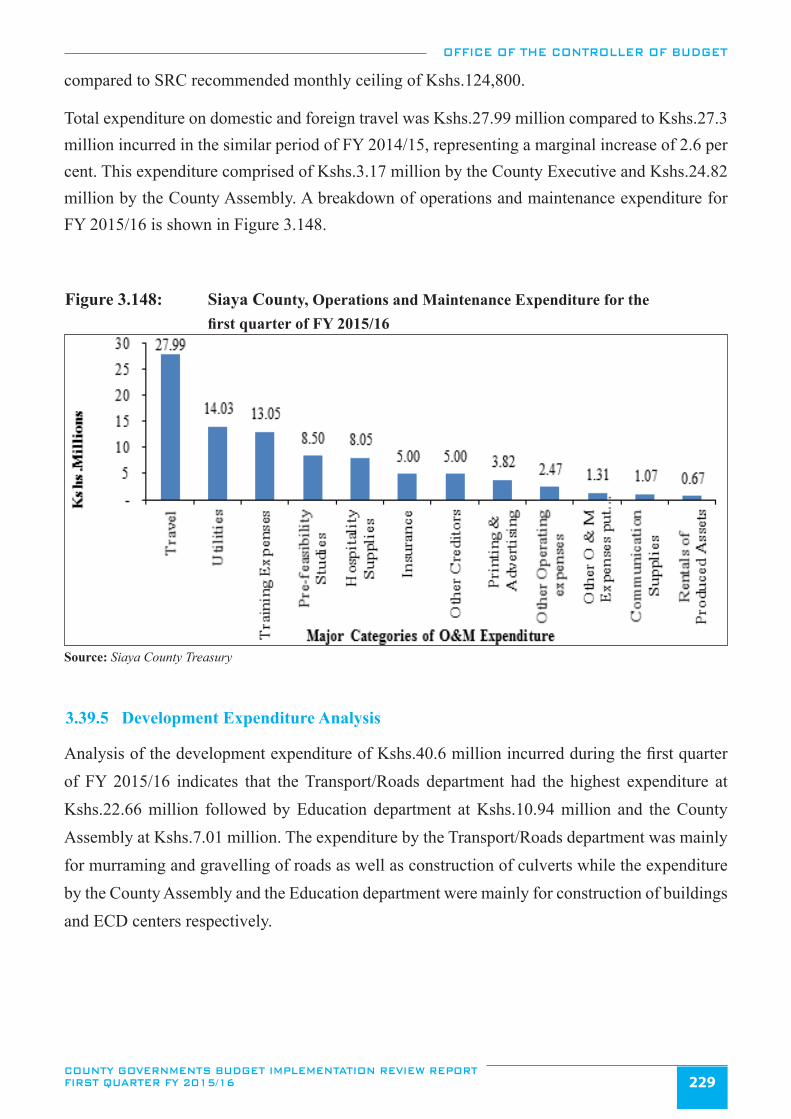
OFFICE OF THE CONTROLLER OF BUDGET
COUNTY GOVERNMENTS BUDGET IMPLEMENTATION REVIEW REPORT FIRST QUARTER FY 2015/16 229
compared to SRC recommended monthly ceiling of Kshs.124,800.
Total expenditure on domestic and foreign travel was Kshs.27.99 million compared to Kshs.27.3 million incurred in the similar period of FY 2014/15, representing a marginal increase of 2.6 per cent. This expenditure comprised of Kshs.3.17 million by the County Executive and Kshs.24.82 million by the County Assembly. A breakdown of operations and maintenance expenditure for FY 2015/16 is shown in Figure 3.148.
Figure 3.148: Siaya County, Operations and Maintenance Expenditure for the first quarter of FY 2015/16
Source: Siaya County Treasury
3.39.5 Development Expenditure Analysis
Analysis of the development expenditure of Kshs.40.6 million incurred during the first quarter of FY 2015/16 indicates that the Transport/Roads department had the highest expenditure at Kshs.22.66 million followed by Education department at Kshs.10.94 million and the County Assembly at Kshs.7.01 million. The expenditure by the Transport/Roads department was mainly for murraming and gravelling of roads as well as construction of culverts while the expenditure by the County Assembly and the Education department were mainly for construction of buildings and ECD centers respectively.
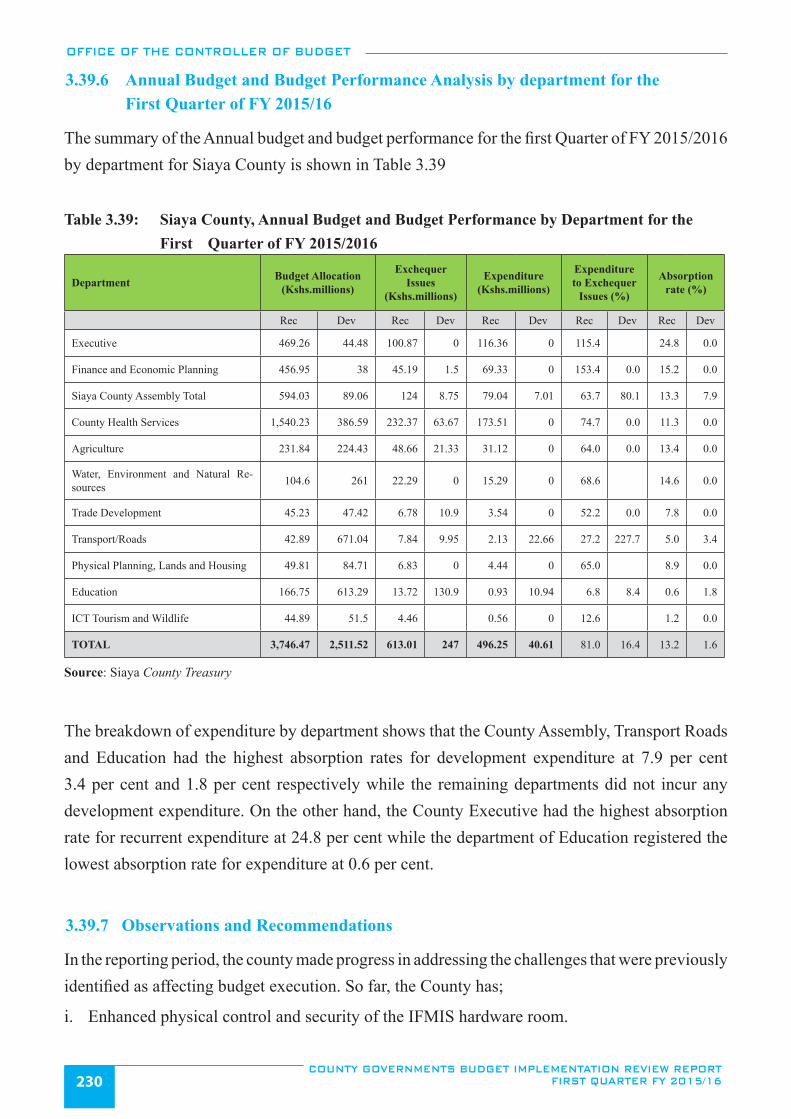
OFFICE OF THE CONTROLLER OF BUDGET
COUNTY GOVERNMENTS BUDGET IMPLEMENTATION REVIEW REPORT FIRST QUARTER FY 2015/16230
3.39.6 Annual Budget and Budget Performance Analysis by department for the First Quarter of FY 2015/16
The summary of the Annual budget and budget performance for the first Quarter of FY 2015/2016 by department for Siaya County is shown in Table 3.39
Table 3.39: Siaya County, Annual Budget and Budget Performance by Department for the First Quarter of FY 2015/2016
Department Budget Allocation (Kshs.millions)
Exchequer Issues
(Kshs.millions)
Expenditure (Kshs.millions)
Expenditure to Exchequer
Issues (%)
Absorption rate (%)
Rec Dev Rec Dev Rec Dev Rec Dev Rec Dev
Executive 469.26 44.48 100.87 0 116.36 0 115.4 24.8 0.0
Finance and Economic Planning 456.95 38 45.19 1.5 69.33 0 153.4 0.0 15.2 0.0
Siaya County Assembly Total 594.03 89.06 124 8.75 79.04 7.01 63.7 80.1 13.3 7.9
County Health Services 1,540.23 386.59 232.37 63.67 173.51 0 74.7 0.0 11.3 0.0
Agriculture 231.84 224.43 48.66 21.33 31.12 0 64.0 0.0 13.4 0.0
Water, Environment and Natural Re-sources 104.6 261 22.29 0 15.29 0 68.6 14.6 0.0
Trade Development 45.23 47.42 6.78 10.9 3.54 0 52.2 0.0 7.8 0.0
Transport/Roads 42.89 671.04 7.84 9.95 2.13 22.66 27.2 227.7 5.0 3.4
Physical Planning, Lands and Housing 49.81 84.71 6.83 0 4.44 0 65.0 8.9 0.0
Education 166.75 613.29 13.72 130.9 0.93 10.94 6.8 8.4 0.6 1.8
ICT Tourism and Wildlife 44.89 51.5 4.46 0.56 0 12.6 1.2 0.0
TOTAL 3,746.47 2,511.52 613.01 247 496.25 40.61 81.0 16.4 13.2 1.6
Source: Siaya County Treasury
The breakdown of expenditure by department shows that the County Assembly, Transport Roads and Education had the highest absorption rates for development expenditure at 7.9 per cent 3.4 per cent and 1.8 per cent respectively while the remaining departments did not incur any development expenditure. On the other hand, the County Executive had the highest absorption rate for recurrent expenditure at 24.8 per cent while the department of Education registered the lowest absorption rate for expenditure at 0.6 per cent.
3.39.7 Observations and Recommendations
In the reporting period, the county made progress in addressing the challenges that were previously identified as affecting budget execution. So far, the County has;
i. Enhanced physical control and security of the IFMIS hardware room.
OFFICE OF THE CONTROLLER OF BUDGET
COUNTY GOVERNMENTS BUDGET IMPLEMENTATION REVIEW REPORT FIRST QUARTER FY 2015/16 231
ii. Registered increase in local revenue collection compared to similar period in FY 2014/15.iii. Registered increase in development expenditure compared to similar period of FY 2014/15.
Despite the progress, there were challenges that continued to hamper effective budget implementation in first quarter of FY 2015/16. They included;
i. While the County had previously operationalized IFMIS, the office observed return to manual operations whereby money is transferred to local banks from where the County Assembly spends.
ii. The County is yet to come up with a Supplementary Budget to correct inconsistencies in the current budget as well as capture emerging issues during the budget implementation process.
iii. The County is yet to enact regulations to operationalize the Bursary fund.
The County should implement the following recommendations in order to improve budget execution:
i. The County Treasury should ensure that all financial transactions are processed through IFMIS.
ii. The County Treasury should prepare and submit a Supplementary Budget for approval by the County Assembly to address the emerging issues identified during budget implementation.
iii. The County Treasury should ensure that regulations for managing the Bursary Fund and any other fund established by the County are developed and approved by the County Assembly.
3.40 Taita Taveta County
3.40.1 Overview of the FY 2015/16 Budget
The approved budget for Taita Taveta County for the FY 2015/16 is Kshs.3.89 billion with Kshs.2.70 billion (69.4 per cent) allocated for recurrent expenditure and Kshs.1.19 billion (30.6 per cent) for development expenditure.
The budget will be financed by Kshs.3.31 billion (85.2 per cent) from the National equitable share, a balance of Kshs.42.96 million (1.1 per cent) brought forward from FY 2014/15, Kshs.310.41 million (8 per cent) from local revenue sources and conditional grants of Kshs223.04 million (5.7 per cent). The conditional allocations comprised of Kshs.17.24 million for World Bank Health Sector Services Fund; Kshs.42.12 million for maternal health care; 95.74 million for leasing of medical equipment; Kshs.42.04 million for road maintenance fuel levy; Kshs.6.64 million as compensation for user fees forgone; Kshs.14.81 million as DANIDA grant and Kshs.4.44 million as a grant from the Government of Australia.
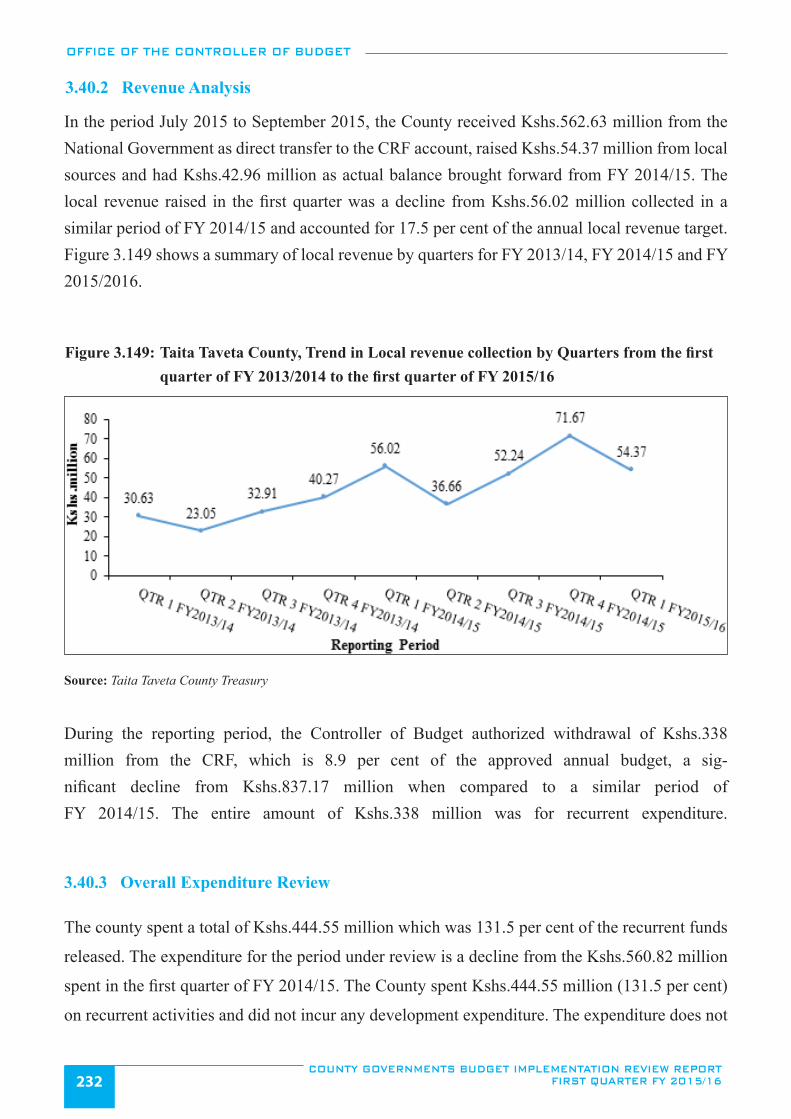
OFFICE OF THE CONTROLLER OF BUDGET
COUNTY GOVERNMENTS BUDGET IMPLEMENTATION REVIEW REPORT FIRST QUARTER FY 2015/16232
3.40.2 Revenue Analysis
In the period July 2015 to September 2015, the County received Kshs.562.63 million from the National Government as direct transfer to the CRF account, raised Kshs.54.37 million from local sources and had Kshs.42.96 million as actual balance brought forward from FY 2014/15. The local revenue raised in the first quarter was a decline from Kshs.56.02 million collected in a similar period of FY 2014/15 and accounted for 17.5 per cent of the annual local revenue target. Figure 3.149 shows a summary of local revenue by quarters for FY 2013/14, FY 2014/15 and FY 2015/2016.
Figure 3.149: Taita Taveta County, Trend in Local revenue collection by Quarters from the first quarter of FY 2013/2014 to the first quarter of FY 2015/16
Source: Taita Taveta County Treasury
During the reporting period, the Controller of Budget authorized withdrawal of Kshs.338 million from the CRF, which is 8.9 per cent of the approved annual budget, a sig-nificant decline from Kshs.837.17 million when compared to a similar period of FY 2014/15. The entire amount of Kshs.338 million was for recurrent expenditure.
3.40.3 Overall Expenditure Review
The county spent a total of Kshs.444.55 million which was 131.5 per cent of the recurrent funds
released. The expenditure for the period under review is a decline from the Kshs.560.82 million
spent in the first quarter of FY 2014/15. The County spent Kshs.444.55 million (131.5 per cent)
on recurrent activities and did not incur any development expenditure. The expenditure does not
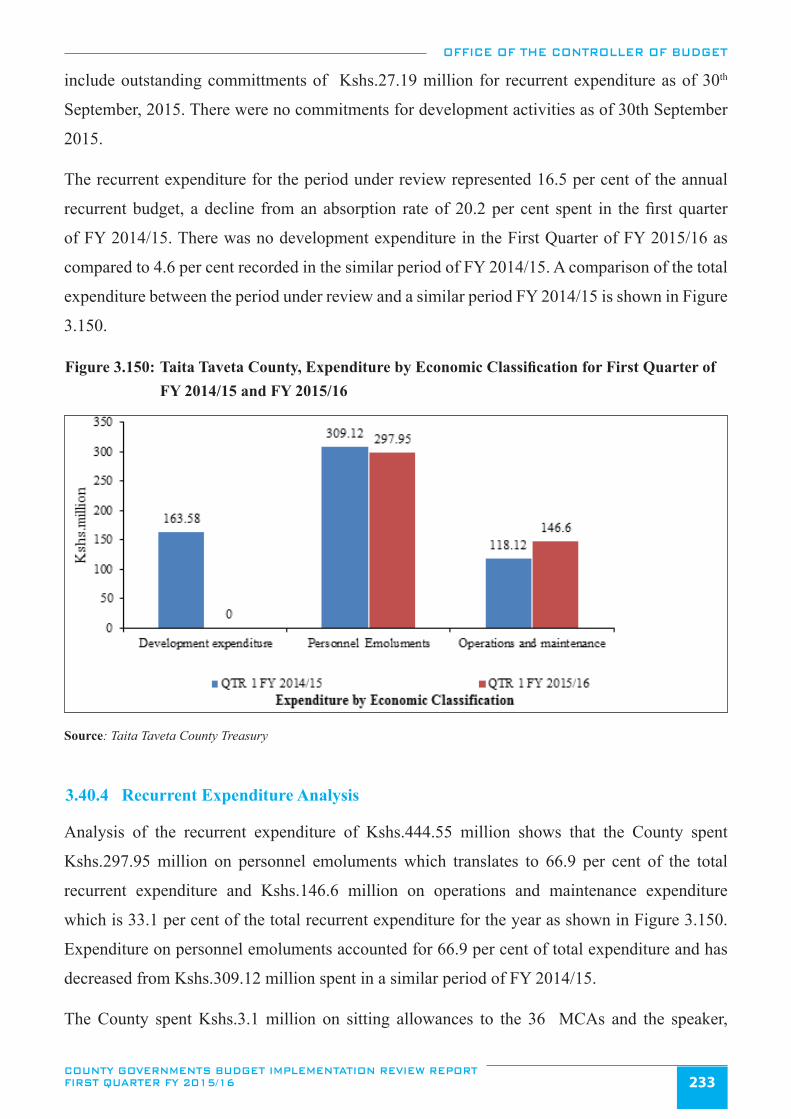
OFFICE OF THE CONTROLLER OF BUDGET
COUNTY GOVERNMENTS BUDGET IMPLEMENTATION REVIEW REPORT FIRST QUARTER FY 2015/16 233
include outstanding committments of Kshs.27.19 million for recurrent expenditure as of 30th
September, 2015. There were no commitments for development activities as of 30th September
2015.
The recurrent expenditure for the period under review represented 16.5 per cent of the annual
recurrent budget, a decline from an absorption rate of 20.2 per cent spent in the first quarter
of FY 2014/15. There was no development expenditure in the First Quarter of FY 2015/16 as
compared to 4.6 per cent recorded in the similar period of FY 2014/15. A comparison of the total
expenditure between the period under review and a similar period FY 2014/15 is shown in Figure
3.150.
Figure 3.150: Taita Taveta County, Expenditure by Economic Classification for First Quarter of FY 2014/15 and FY 2015/16
Source: Taita Taveta County Treasury
3.40.4 Recurrent Expenditure Analysis
Analysis of the recurrent expenditure of Kshs.444.55 million shows that the County spent
Kshs.297.95 million on personnel emoluments which translates to 66.9 per cent of the total
recurrent expenditure and Kshs.146.6 million on operations and maintenance expenditure
which is 33.1 per cent of the total recurrent expenditure for the year as shown in Figure 3.150.
Expenditure on personnel emoluments accounted for 66.9 per cent of total expenditure and has
decreased from Kshs.309.12 million spent in a similar period of FY 2014/15.
The County spent Kshs.3.1 million on sitting allowances to the 36 MCAs and the speaker,
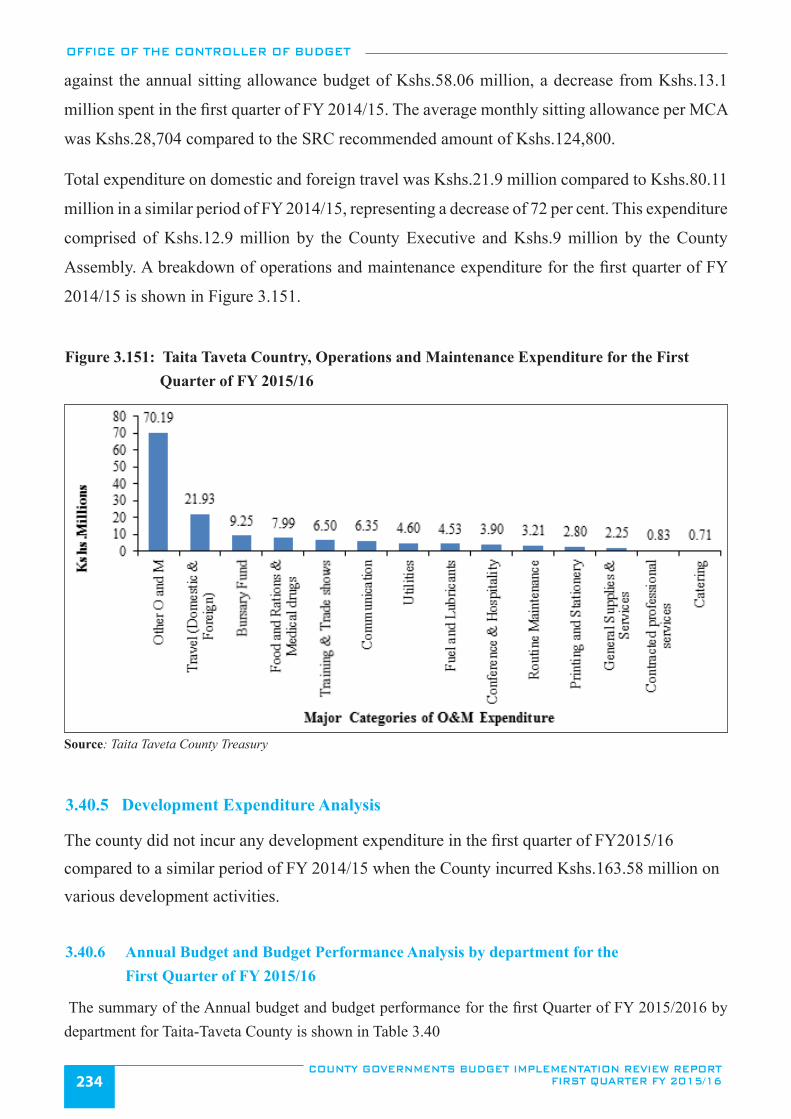
OFFICE OF THE CONTROLLER OF BUDGET
COUNTY GOVERNMENTS BUDGET IMPLEMENTATION REVIEW REPORT FIRST QUARTER FY 2015/16234
against the annual sitting allowance budget of Kshs.58.06 million, a decrease from Kshs.13.1
million spent in the first quarter of FY 2014/15. The average monthly sitting allowance per MCA
was Kshs.28,704 compared to the SRC recommended amount of Kshs.124,800.
Total expenditure on domestic and foreign travel was Kshs.21.9 million compared to Kshs.80.11
million in a similar period of FY 2014/15, representing a decrease of 72 per cent. This expenditure
comprised of Kshs.12.9 million by the County Executive and Kshs.9 million by the County
Assembly. A breakdown of operations and maintenance expenditure for the first quarter of FY
2014/15 is shown in Figure 3.151.
Figure 3.151: Taita Taveta Country, Operations and Maintenance Expenditure for the First Quarter of FY 2015/16
Source: Taita Taveta County Treasury
3.40.5 Development Expenditure Analysis
The county did not incur any development expenditure in the first quarter of FY2015/16 compared to a similar period of FY 2014/15 when the County incurred Kshs.163.58 million on various development activities.
3.40.6 Annual Budget and Budget Performance Analysis by department for the First Quarter of FY 2015/16
The summary of the Annual budget and budget performance for the first Quarter of FY 2015/2016 by department for Taita-Taveta County is shown in Table 3.40
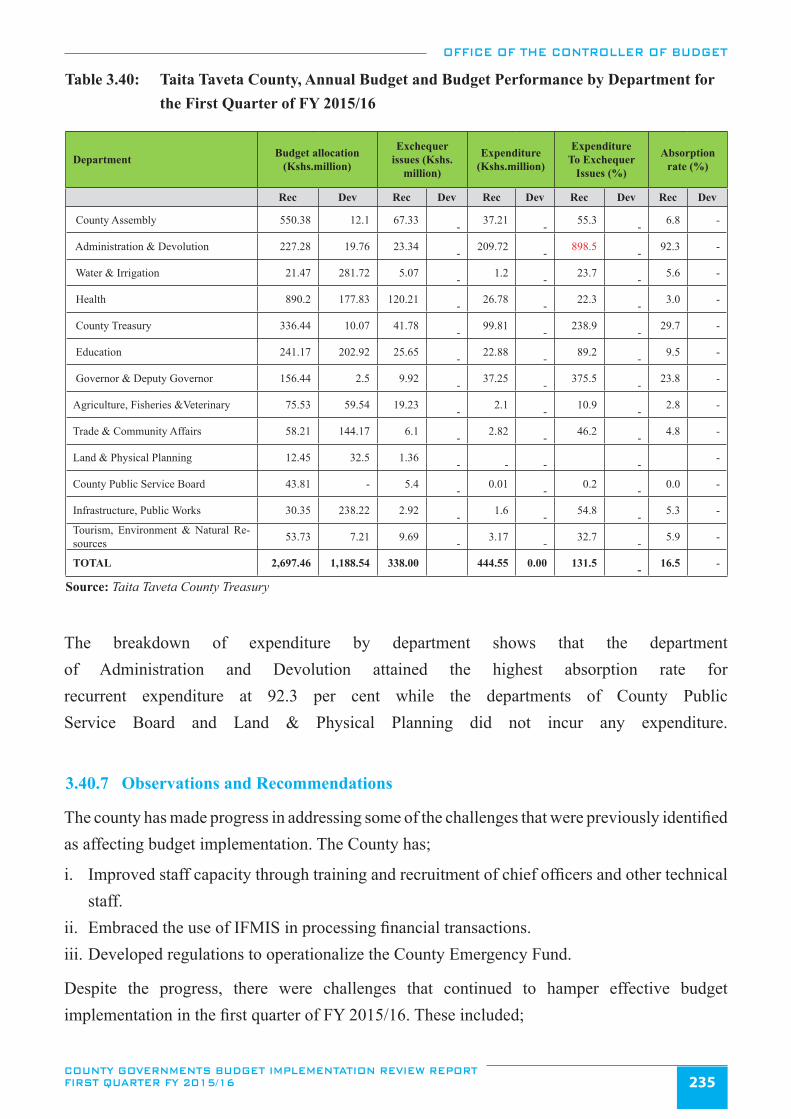
OFFICE OF THE CONTROLLER OF BUDGET
COUNTY GOVERNMENTS BUDGET IMPLEMENTATION REVIEW REPORT FIRST QUARTER FY 2015/16 235
Table 3.40: Taita Taveta County, Annual Budget and Budget Performance by Department for the First Quarter of FY 2015/16
Department Budget allocation (Kshs.million)
Exchequer issues (Kshs.
million)
Expenditure (Kshs.million)
Expenditure To Exchequer
Issues (%)
Absorption rate (%)
Rec Dev Rec Dev Rec Dev Rec Dev Rec Dev
County Assembly 550.38 12.1 67.33 - 37.21
- 55.3 - 6.8 -
Administration & Devolution 227.28 19.76 23.34 - 209.72
- 898.5 - 92.3 -
Water & Irrigation 21.47 281.72 5.07 - 1.2
- 23.7 - 5.6 -
Health 890.2 177.83 120.21 - 26.78
- 22.3 - 3.0 -
County Treasury 336.44 10.07 41.78 - 99.81
- 238.9 - 29.7 -
Education 241.17 202.92 25.65 - 22.88
- 89.2 - 9.5 -
Governor & Deputy Governor 156.44 2.5 9.92 - 37.25
- 375.5 - 23.8 -
Agriculture, Fisheries &Veterinary 75.53 59.54 19.23 - 2.1
- 10.9 - 2.8 -
Trade & Community Affairs 58.21 144.17 6.1 - 2.82
- 46.2 - 4.8 -
Land & Physical Planning 12.45 32.5 1.36 -
-
-
- -
County Public Service Board 43.81 - 5.4 - 0.01
- 0.2 - 0.0 -
Infrastructure, Public Works 30.35 238.22 2.92 - 1.6
- 54.8 - 5.3 -
Tourism, Environment & Natural Re-sources 53.73 7.21 9.69
- 3.17 - 32.7
- 5.9 -
TOTAL 2,697.46 1,188.54 338.00 444.55 0.00 131.5 - 16.5 -
Source: Taita Taveta County Treasury
The breakdown of expenditure by department shows that the department of Administration and Devolution attained the highest absorption rate for recurrent expenditure at 92.3 per cent while the departments of County Public Service Board and Land & Physical Planning did not incur any expenditure.
3.40.7 Observations and Recommendations
The county has made progress in addressing some of the challenges that were previously identified as affecting budget implementation. The County has;
i. Improved staff capacity through training and recruitment of chief officers and other technical staff.
ii. Embraced the use of IFMIS in processing financial transactions.iii. Developed regulations to operationalize the County Emergency Fund.
Despite the progress, there were challenges that continued to hamper effective budget implementation in the first quarter of FY 2015/16. These included;
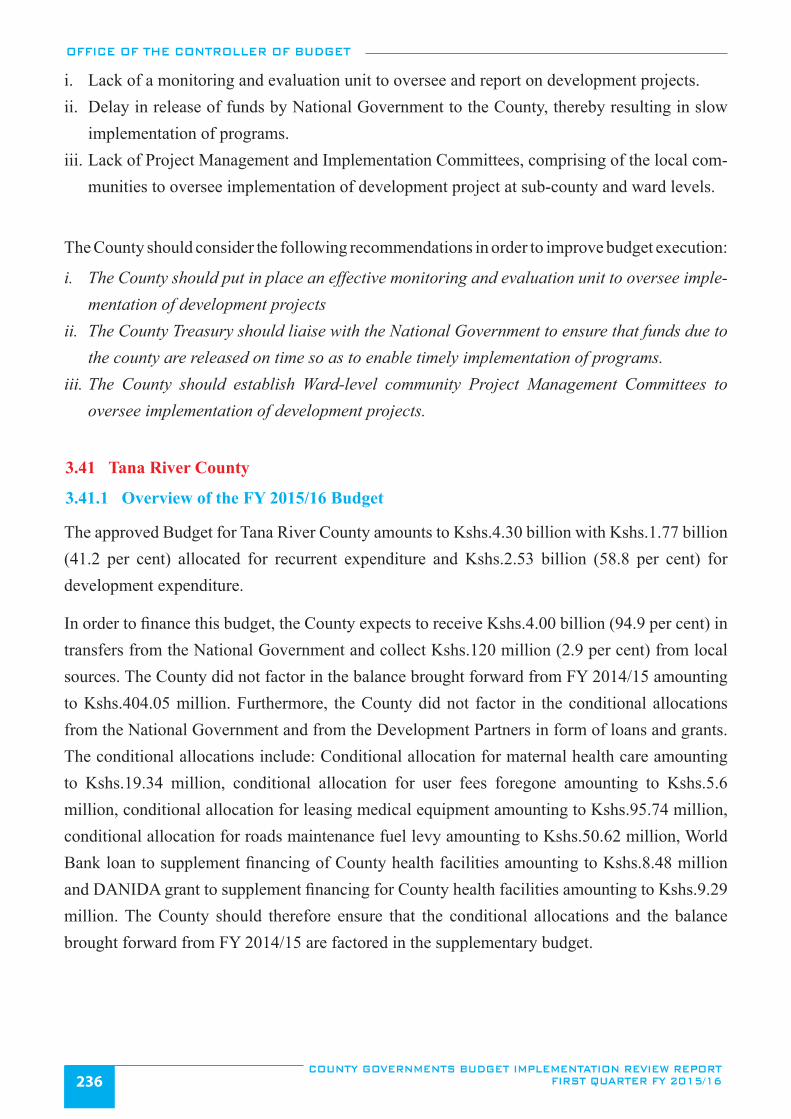
OFFICE OF THE CONTROLLER OF BUDGET
COUNTY GOVERNMENTS BUDGET IMPLEMENTATION REVIEW REPORT FIRST QUARTER FY 2015/16236
i. Lack of a monitoring and evaluation unit to oversee and report on development projects. ii. Delay in release of funds by National Government to the County, thereby resulting in slow
implementation of programs.iii. Lack of Project Management and Implementation Committees, comprising of the local com-
munities to oversee implementation of development project at sub-county and ward levels.
The County should consider the following recommendations in order to improve budget execution:
i. The County should put in place an effective monitoring and evaluation unit to oversee imple-mentation of development projects
ii. The County Treasury should liaise with the National Government to ensure that funds due to the county are released on time so as to enable timely implementation of programs.
iii. The County should establish Ward-level community Project Management Committees to oversee implementation of development projects.
3.41 Tana River County
3.41.1 Overview of the FY 2015/16 Budget
The approved Budget for Tana River County amounts to Kshs.4.30 billion with Kshs.1.77 billion (41.2 per cent) allocated for recurrent expenditure and Kshs.2.53 billion (58.8 per cent) for development expenditure.
In order to finance this budget, the County expects to receive Kshs.4.00 billion (94.9 per cent) in transfers from the National Government and collect Kshs.120 million (2.9 per cent) from local sources. The County did not factor in the balance brought forward from FY 2014/15 amounting to Kshs.404.05 million. Furthermore, the County did not factor in the conditional allocations from the National Government and from the Development Partners in form of loans and grants. The conditional allocations include: Conditional allocation for maternal health care amounting to Kshs.19.34 million, conditional allocation for user fees foregone amounting to Kshs.5.6 million, conditional allocation for leasing medical equipment amounting to Kshs.95.74 million, conditional allocation for roads maintenance fuel levy amounting to Kshs.50.62 million, World Bank loan to supplement financing of County health facilities amounting to Kshs.8.48 million and DANIDA grant to supplement financing for County health facilities amounting to Kshs.9.29 million. The County should therefore ensure that the conditional allocations and the balance brought forward from FY 2014/15 are factored in the supplementary budget.
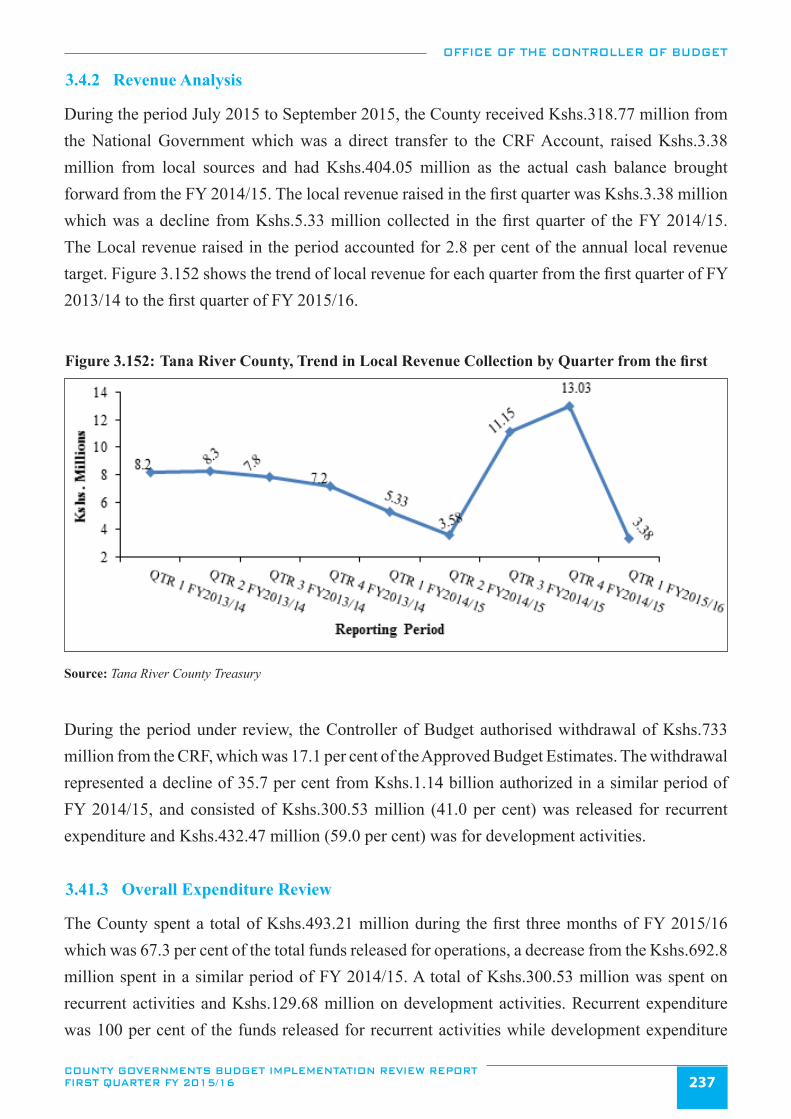
OFFICE OF THE CONTROLLER OF BUDGET
COUNTY GOVERNMENTS BUDGET IMPLEMENTATION REVIEW REPORT FIRST QUARTER FY 2015/16 237
3.4.2 Revenue Analysis
During the period July 2015 to September 2015, the County received Kshs.318.77 million from the National Government which was a direct transfer to the CRF Account, raised Kshs.3.38 million from local sources and had Kshs.404.05 million as the actual cash balance brought forward from the FY 2014/15. The local revenue raised in the first quarter was Kshs.3.38 million which was a decline from Kshs.5.33 million collected in the first quarter of the FY 2014/15. The Local revenue raised in the period accounted for 2.8 per cent of the annual local revenue target. Figure 3.152 shows the trend of local revenue for each quarter from the first quarter of FY 2013/14 to the first quarter of FY 2015/16.
Figure 3.152: Tana River County, Trend in Local Revenue Collection by Quarter from the first quarter of FY 2013/14 to the first quarter of FY 2015/16
Source: Tana River County Treasury
During the period under review, the Controller of Budget authorised withdrawal of Kshs.733 million from the CRF, which was 17.1 per cent of the Approved Budget Estimates. The withdrawal represented a decline of 35.7 per cent from Kshs.1.14 billion authorized in a similar period of FY 2014/15, and consisted of Kshs.300.53 million (41.0 per cent) was released for recurrent expenditure and Kshs.432.47 million (59.0 per cent) was for development activities.
3.41.3 Overall Expenditure Review
The County spent a total of Kshs.493.21 million during the first three months of FY 2015/16 which was 67.3 per cent of the total funds released for operations, a decrease from the Kshs.692.8 million spent in a similar period of FY 2014/15. A total of Kshs.300.53 million was spent on recurrent activities and Kshs.129.68 million on development activities. Recurrent expenditure was 100 per cent of the funds released for recurrent activities while development expenditure
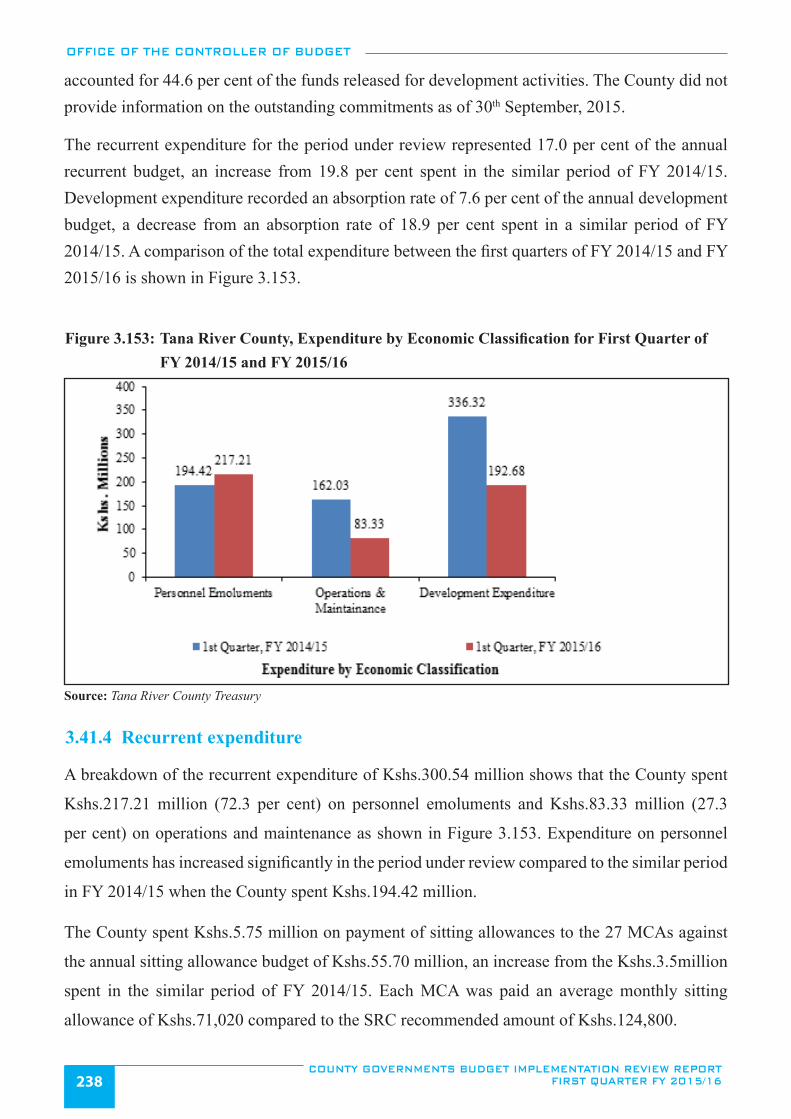
OFFICE OF THE CONTROLLER OF BUDGET
COUNTY GOVERNMENTS BUDGET IMPLEMENTATION REVIEW REPORT FIRST QUARTER FY 2015/16238
accounted for 44.6 per cent of the funds released for development activities. The County did not provide information on the outstanding commitments as of 30th September, 2015.
The recurrent expenditure for the period under review represented 17.0 per cent of the annual recurrent budget, an increase from 19.8 per cent spent in the similar period of FY 2014/15. Development expenditure recorded an absorption rate of 7.6 per cent of the annual development budget, a decrease from an absorption rate of 18.9 per cent spent in a similar period of FY 2014/15. A comparison of the total expenditure between the first quarters of FY 2014/15 and FY 2015/16 is shown in Figure 3.153.
Figure 3.153: Tana River County, Expenditure by Economic Classification for First Quarter of FY 2014/15 and FY 2015/16
Source: Tana River County Treasury
3.41.4 Recurrent expenditure
A breakdown of the recurrent expenditure of Kshs.300.54 million shows that the County spent
Kshs.217.21 million (72.3 per cent) on personnel emoluments and Kshs.83.33 million (27.3
per cent) on operations and maintenance as shown in Figure 3.153. Expenditure on personnel
emoluments has increased significantly in the period under review compared to the similar period
in FY 2014/15 when the County spent Kshs.194.42 million.
The County spent Kshs.5.75 million on payment of sitting allowances to the 27 MCAs against
the annual sitting allowance budget of Kshs.55.70 million, an increase from the Kshs.3.5million
spent in the similar period of FY 2014/15. Each MCA was paid an average monthly sitting
allowance of Kshs.71,020 compared to the SRC recommended amount of Kshs.124,800.
OFFICE OF THE CONTROLLER OF BUDGET
COUNTY GOVERNMENTS BUDGET IMPLEMENTATION REVIEW REPORT FIRST QUARTER FY 2015/16 239
The total expenditure on domestic and foreign travel amounted to Kshs.52.43 million compared
to Kshs.58.29 million in a similar period of FY 2014/15, representing a decrease of 10.05 per
cent. The total travel expenditure for the County Assembly and the County Executive amounted
to Kshs.14.72 million and Kshs.37.71 million respectively. A breakdown of operations and
maintenance expenditure for the period under review is shown in Figure 3.154.
Figure 3.154: Tana River County, Operations and Maintenance Expenditure for the First Quarter FY 2015/16
Source: Tana River County Treasury
3.41.5 Development Expenditure Analysis
Analysis of the development expenditure for the period under review showed that the County spent
Kshs.3.37 million on improvement of the Makere-Bura road; Kshs.5.20 million on construction of
Mandingo dispensary; Kshs.4.63 million for the construction of Odhole dispensary; Kshs.3.02 million
on the renovation of Lenda dispensary; Kshs.2.60 million on improvement of junction B8-Kurawa
road; Kshs.2.80 million for sinking of the Katumbo borehole; Kshs.2.06 million on the construction
of the Tarasaa water pipeline; Kshs.11.45 million on the building of the Bil-bil market footbridge;
Kshs.3.64 million for the construction of the Pumwani road; Kshs.4.60 million for the construction
of the Titila-Muka road; Kshs.5.40 million for the construction of the Gururi-Chifiri road; Kshs.2.70
million for the construction of the Duwayo-Junction B8 road.
Further analysis indicated that Kshs.12.15 million for the construction of the Chardende water
pipeline; Kshs.9.48 million for the construction of the Laza-wenje road; Kshs.3.50 million for the
purchase of press equipment; Kshs.3.53 million for improvement of the Chakamba-Riketa road;
Kshs.6.17 million on water tracking; Kshs.4.19 million for the spot improvement of the Kilelengwani-
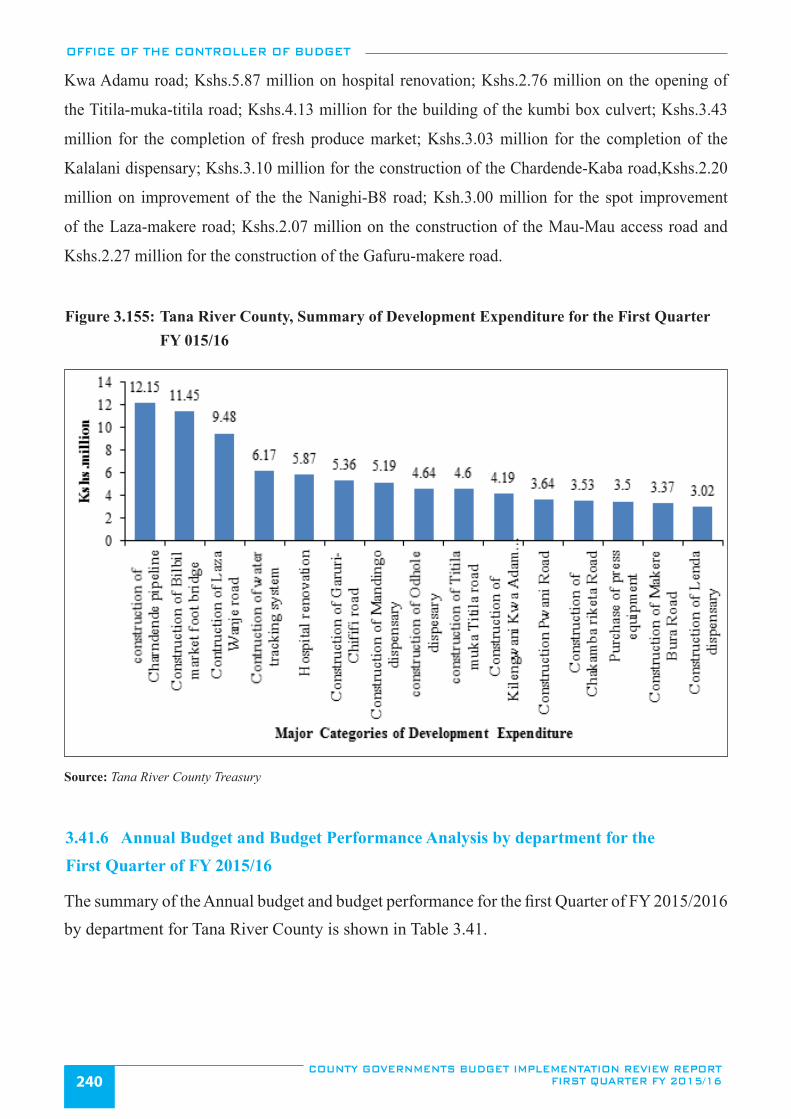
OFFICE OF THE CONTROLLER OF BUDGET
COUNTY GOVERNMENTS BUDGET IMPLEMENTATION REVIEW REPORT FIRST QUARTER FY 2015/16240
Kwa Adamu road; Kshs.5.87 million on hospital renovation; Kshs.2.76 million on the opening of
the Titila-muka-titila road; Kshs.4.13 million for the building of the kumbi box culvert; Kshs.3.43
million for the completion of fresh produce market; Kshs.3.03 million for the completion of the
Kalalani dispensary; Kshs.3.10 million for the construction of the Chardende-Kaba road,Kshs.2.20
million on improvement of the the Nanighi-B8 road; Ksh.3.00 million for the spot improvement
of the Laza-makere road; Kshs.2.07 million on the construction of the Mau-Mau access road and
Kshs.2.27 million for the construction of the Gafuru-makere road.
Figure 3.155: Tana River County, Summary of Development Expenditure for the First Quarter FY 015/16
Source: Tana River County Treasury
3.41.6 Annual Budget and Budget Performance Analysis by department for the First Quarter of FY 2015/16
The summary of the Annual budget and budget performance for the first Quarter of FY 2015/2016 by department for Tana River County is shown in Table 3.41.
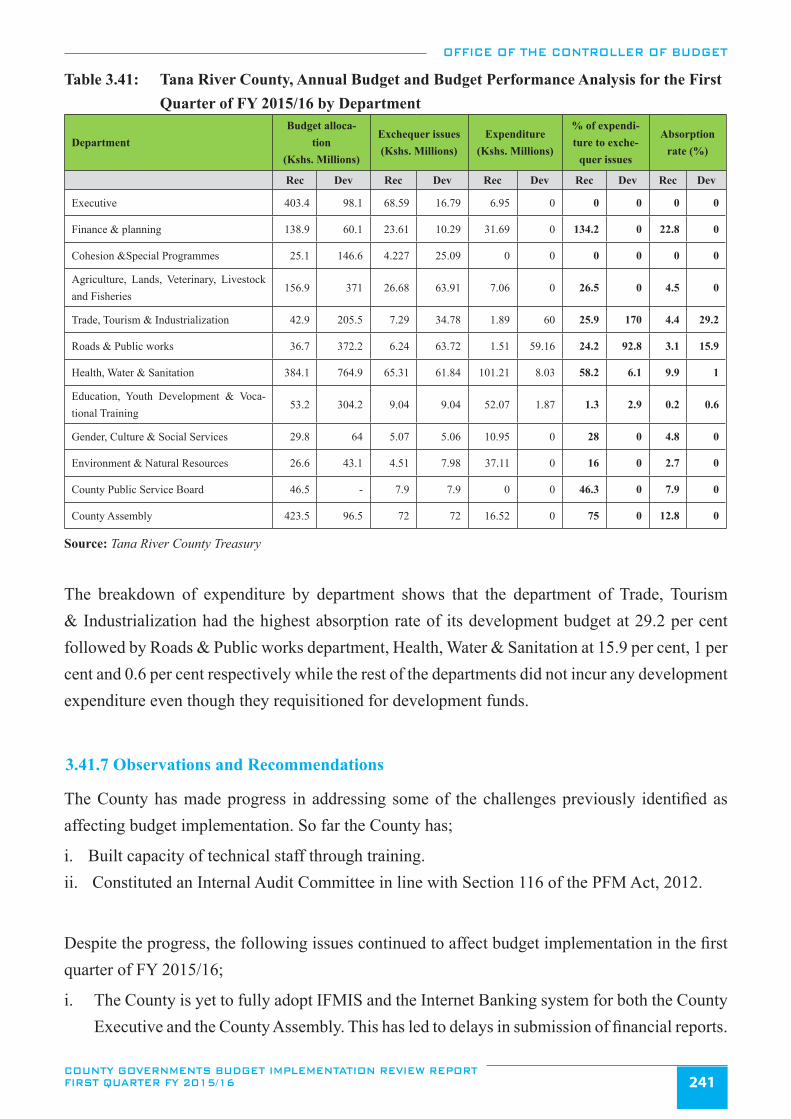
OFFICE OF THE CONTROLLER OF BUDGET
COUNTY GOVERNMENTS BUDGET IMPLEMENTATION REVIEW REPORT FIRST QUARTER FY 2015/16 241
Table 3.41: Tana River County, Annual Budget and Budget Performance Analysis for the First Quarter of FY 2015/16 by Department
DepartmentBudget alloca-
tion (Kshs. Millions)
Exchequer issues (Kshs. Millions)
Expenditure (Kshs. Millions)
% of expendi-ture to exche-
quer issues
Absorption rate (%)
Rec Dev Rec Dev Rec Dev Rec Dev Rec Dev
Executive 403.4 98.1 68.59 16.79 6.95 0 0 0 0 0
Finance & planning 138.9 60.1 23.61 10.29 31.69 0 134.2 0 22.8 0
Cohesion &Special Programmes 25.1 146.6 4.227 25.09 0 0 0 0 0 0
Agriculture, Lands, Veterinary, Livestock and Fisheries
156.9 371 26.68 63.91 7.06 0 26.5 0 4.5 0
Trade, Tourism & Industrialization 42.9 205.5 7.29 34.78 1.89 60 25.9 170 4.4 29.2
Roads & Public works 36.7 372.2 6.24 63.72 1.51 59.16 24.2 92.8 3.1 15.9
Health, Water & Sanitation 384.1 764.9 65.31 61.84 101.21 8.03 58.2 6.1 9.9 1
Education, Youth Development & Voca-tional Training
53.2 304.2 9.04 9.04 52.07 1.87 1.3 2.9 0.2 0.6
Gender, Culture & Social Services 29.8 64 5.07 5.06 10.95 0 28 0 4.8 0
Environment & Natural Resources 26.6 43.1 4.51 7.98 37.11 0 16 0 2.7 0
County Public Service Board 46.5 - 7.9 7.9 0 0 46.3 0 7.9 0
County Assembly 423.5 96.5 72 72 16.52 0 75 0 12.8 0
Source: Tana River County Treasury
The breakdown of expenditure by department shows that the department of Trade, Tourism & Industrialization had the highest absorption rate of its development budget at 29.2 per cent followed by Roads & Public works department, Health, Water & Sanitation at 15.9 per cent, 1 per cent and 0.6 per cent respectively while the rest of the departments did not incur any development expenditure even though they requisitioned for development funds.
3.41.7 Observations and Recommendations
The County has made progress in addressing some of the challenges previously identified as affecting budget implementation. So far the County has;
i. Built capacity of technical staff through training. ii. Constituted an Internal Audit Committee in line with Section 116 of the PFM Act, 2012.
Despite the progress, the following issues continued to affect budget implementation in the first quarter of FY 2015/16;
i. The County is yet to fully adopt IFMIS and the Internet Banking system for both the County Executive and the County Assembly. This has led to delays in submission of financial reports.
OFFICE OF THE CONTROLLER OF BUDGET
COUNTY GOVERNMENTS BUDGET IMPLEMENTATION REVIEW REPORT FIRST QUARTER FY 2015/16242
ii. Lack of adequate office space to accommodate the increased number of staff.iii. Decline in local revenue collection from Kshs.5.33 million in the first quarter of FY 2014/15
to Kshs.3.38 million in the first quarter of FY 2015/16 as shown in Figure 3.152.iv. Huge wage bill.
The County should implement the following recommendations in order to improve budget execution:
i. The County Treasury should ensure full adoption of the IFMIS and Internet Banking system. ii. The County should provide adequate office space for its officers to enhance service delivery
to the public.iii. The County Treasury should devise strategies to enhance local revenues mobilization. This
will enable the County to fully implement planned activities. iv. The County Public Service Board should develop an optimal staffing structure to address the
escalating wage bill.
3.42 Tharaka Nithi County
3.42.1 Overview of the FY 2015/16 County Budget
The Approved Budget Estimates for Tharaka Nithi County for FY 2015/16 amounts to Kshs.3.55 billion, with Kshs.2.08 billion (58.6 per cent) allocated to recurrent expenditure and Kshs.1.47 billion (41.4 per cent) to development expenditure.
In order to finance this budget, the County expects to receive Kshs.3.12 billion (87.8 per cent) as transfers from the National Government, collect Kshs.248.05 million (7 per cent) from local sources, DANIDA and National Government grants of Kshs.189.36 million (5.2 per cent). However, the County did not budget for the balance brought forward from FY 2014/2015 amounting to Kshs.278.71 million and additional grants as provided for in CARA, 2015 which include Kshs.13.90 million from World Bank to supplement County health facilities, and Kshs.300 million conditional allocations for other loans and grants. The DANIDA grant and equitable share were also under budgeted by Kshs.2.33 million and Kshs.41 million respectively.
3.42.2 Revenue Analysis
In the first quarter of FY 2015/16, the County received Kshs.251.01 million from the National Government as a direct transfer to the CRF account, raised Kshs.36.68 million from local sources, and had Kshs.270.25 million as cash balance brought forward from the FY 2014/15. The local revenue raised in the period under review of Kshs.36.68 million was an improvement from Kshs.30.79 million collected in the first quarter of the FY 2014/15, and accounted for 14.8 per
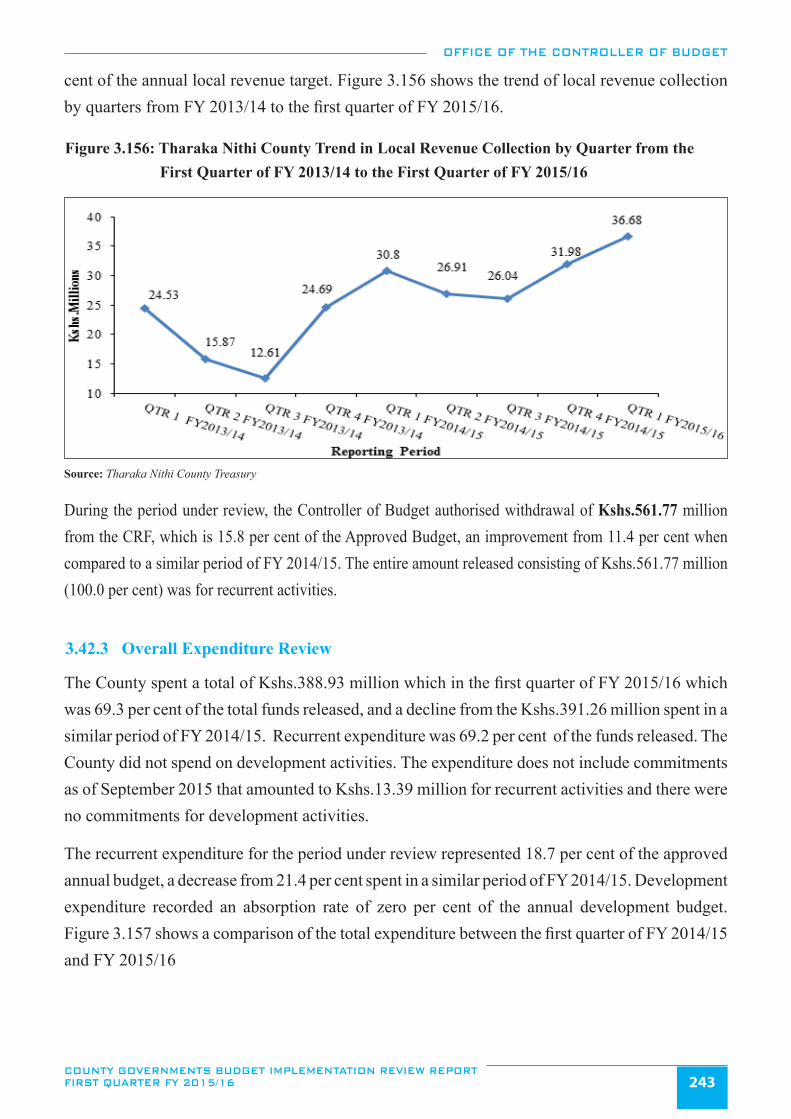
OFFICE OF THE CONTROLLER OF BUDGET
COUNTY GOVERNMENTS BUDGET IMPLEMENTATION REVIEW REPORT FIRST QUARTER FY 2015/16 243
cent of the annual local revenue target. Figure 3.156 shows the trend of local revenue collection by quarters from FY 2013/14 to the first quarter of FY 2015/16.
Figure 3.156: Tharaka Nithi County Trend in Local Revenue Collection by Quarter from the First Quarter of FY 2013/14 to the First Quarter of FY 2015/16
Source: Tharaka Nithi County Treasury
During the period under review, the Controller of Budget authorised withdrawal of Kshs.561.77 million from the CRF, which is 15.8 per cent of the Approved Budget, an improvement from 11.4 per cent when compared to a similar period of FY 2014/15. The entire amount released consisting of Kshs.561.77 million (100.0 per cent) was for recurrent activities.
3.42.3 Overall Expenditure Review
The County spent a total of Kshs.388.93 million which in the first quarter of FY 2015/16 which was 69.3 per cent of the total funds released, and a decline from the Kshs.391.26 million spent in a similar period of FY 2014/15. Recurrent expenditure was 69.2 per cent of the funds released. The County did not spend on development activities. The expenditure does not include commitments as of September 2015 that amounted to Kshs.13.39 million for recurrent activities and there were no commitments for development activities.
The recurrent expenditure for the period under review represented 18.7 per cent of the approved annual budget, a decrease from 21.4 per cent spent in a similar period of FY 2014/15. Development expenditure recorded an absorption rate of zero per cent of the annual development budget. Figure 3.157 shows a comparison of the total expenditure between the first quarter of FY 2014/15 and FY 2015/16
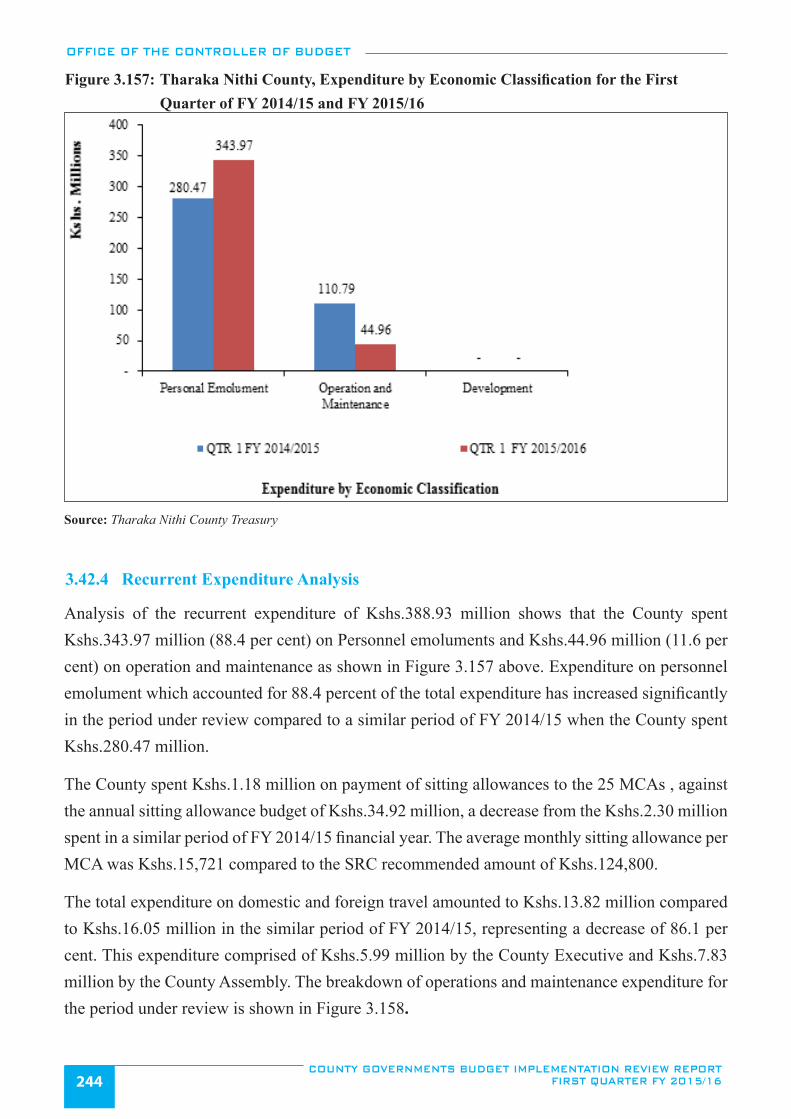
OFFICE OF THE CONTROLLER OF BUDGET
COUNTY GOVERNMENTS BUDGET IMPLEMENTATION REVIEW REPORT FIRST QUARTER FY 2015/16244
Figure 3.157: Tharaka Nithi County, Expenditure by Economic Classification for the First Quarter of FY 2014/15 and FY 2015/16
Source: Tharaka Nithi County Treasury
3.42.4 Recurrent Expenditure Analysis
Analysis of the recurrent expenditure of Kshs.388.93 million shows that the County spent Kshs.343.97 million (88.4 per cent) on Personnel emoluments and Kshs.44.96 million (11.6 per cent) on operation and maintenance as shown in Figure 3.157 above. Expenditure on personnel emolument which accounted for 88.4 percent of the total expenditure has increased significantly in the period under review compared to a similar period of FY 2014/15 when the County spent Kshs.280.47 million.
The County spent Kshs.1.18 million on payment of sitting allowances to the 25 MCAs , against the annual sitting allowance budget of Kshs.34.92 million, a decrease from the Kshs.2.30 million spent in a similar period of FY 2014/15 financial year. The average monthly sitting allowance per MCA was Kshs.15,721 compared to the SRC recommended amount of Kshs.124,800.
The total expenditure on domestic and foreign travel amounted to Kshs.13.82 million compared to Kshs.16.05 million in the similar period of FY 2014/15, representing a decrease of 86.1 per cent. This expenditure comprised of Kshs.5.99 million by the County Executive and Kshs.7.83 million by the County Assembly. The breakdown of operations and maintenance expenditure for the period under review is shown in Figure 3.158.
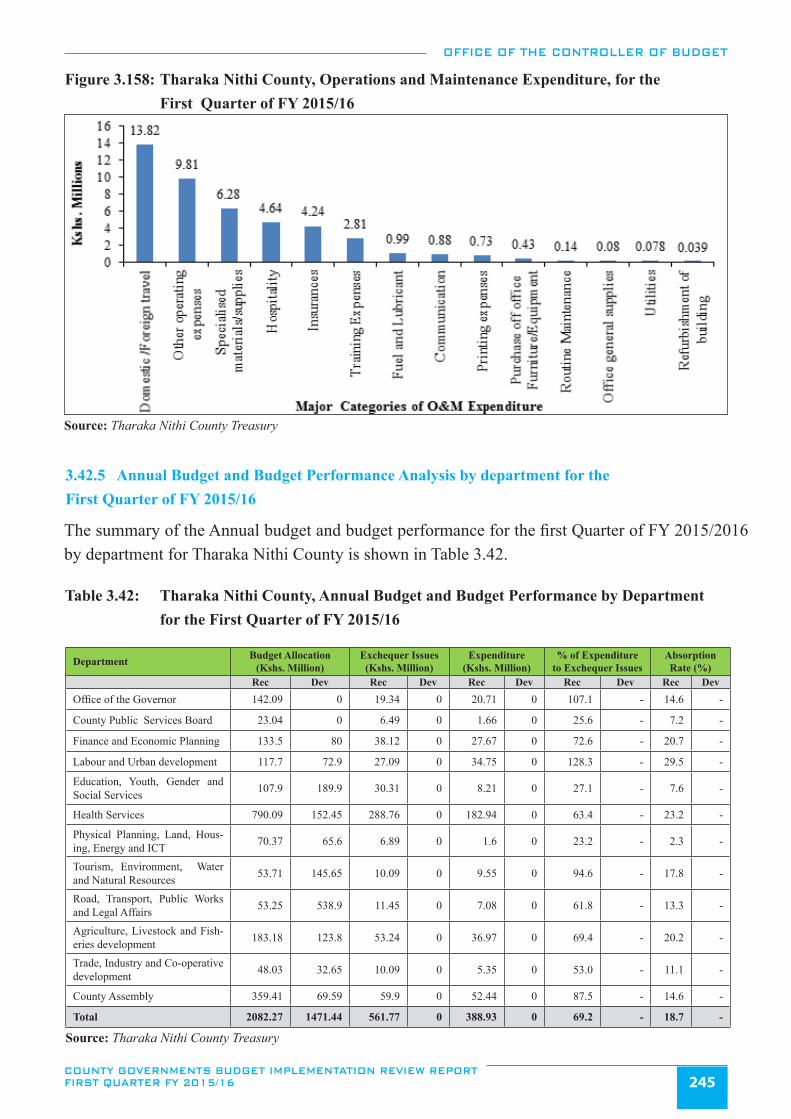
OFFICE OF THE CONTROLLER OF BUDGET
COUNTY GOVERNMENTS BUDGET IMPLEMENTATION REVIEW REPORT FIRST QUARTER FY 2015/16 245
Figure 3.158: Tharaka Nithi County, Operations and Maintenance Expenditure, for the First Quarter of FY 2015/16
Source: Tharaka Nithi County Treasury
3.42.5 Annual Budget and Budget Performance Analysis by department for the First Quarter of FY 2015/16
The summary of the Annual budget and budget performance for the first Quarter of FY 2015/2016 by department for Tharaka Nithi County is shown in Table 3.42.
Table 3.42: Tharaka Nithi County, Annual Budget and Budget Performance by Department for the First Quarter of FY 2015/16
Department Budget Allocation (Kshs. Million)
Exchequer Issues (Kshs. Million)
Expenditure (Kshs. Million)
% of Expenditure to Exchequer Issues
Absorption Rate (%)
Rec Dev Rec Dev Rec Dev Rec Dev Rec DevOffice of the Governor 142.09 0 19.34 0 20.71 0 107.1 - 14.6 -
County Public Services Board 23.04 0 6.49 0 1.66 0 25.6 - 7.2 -
Finance and Economic Planning 133.5 80 38.12 0 27.67 0 72.6 - 20.7 -
Labour and Urban development 117.7 72.9 27.09 0 34.75 0 128.3 - 29.5 -
Education, Youth, Gender and Social Services 107.9 189.9 30.31 0 8.21 0 27.1 - 7.6 -
Health Services 790.09 152.45 288.76 0 182.94 0 63.4 - 23.2 -
Physical Planning, Land, Hous-ing, Energy and ICT 70.37 65.6 6.89 0 1.6 0 23.2 - 2.3 -
Tourism, Environment, Water and Natural Resources 53.71 145.65 10.09 0 9.55 0 94.6 - 17.8 -
Road, Transport, Public Works and Legal Affairs 53.25 538.9 11.45 0 7.08 0 61.8 - 13.3 -
Agriculture, Livestock and Fish-eries development 183.18 123.8 53.24 0 36.97 0 69.4 - 20.2 -
Trade, Industry and Co-operative development 48.03 32.65 10.09 0 5.35 0 53.0 - 11.1 -
County Assembly 359.41 69.59 59.9 0 52.44 0 87.5 - 14.6 -
Total 2082.27 1471.44 561.77 0 388.93 0 69.2 - 18.7 -
Source: Tharaka Nithi County Treasury
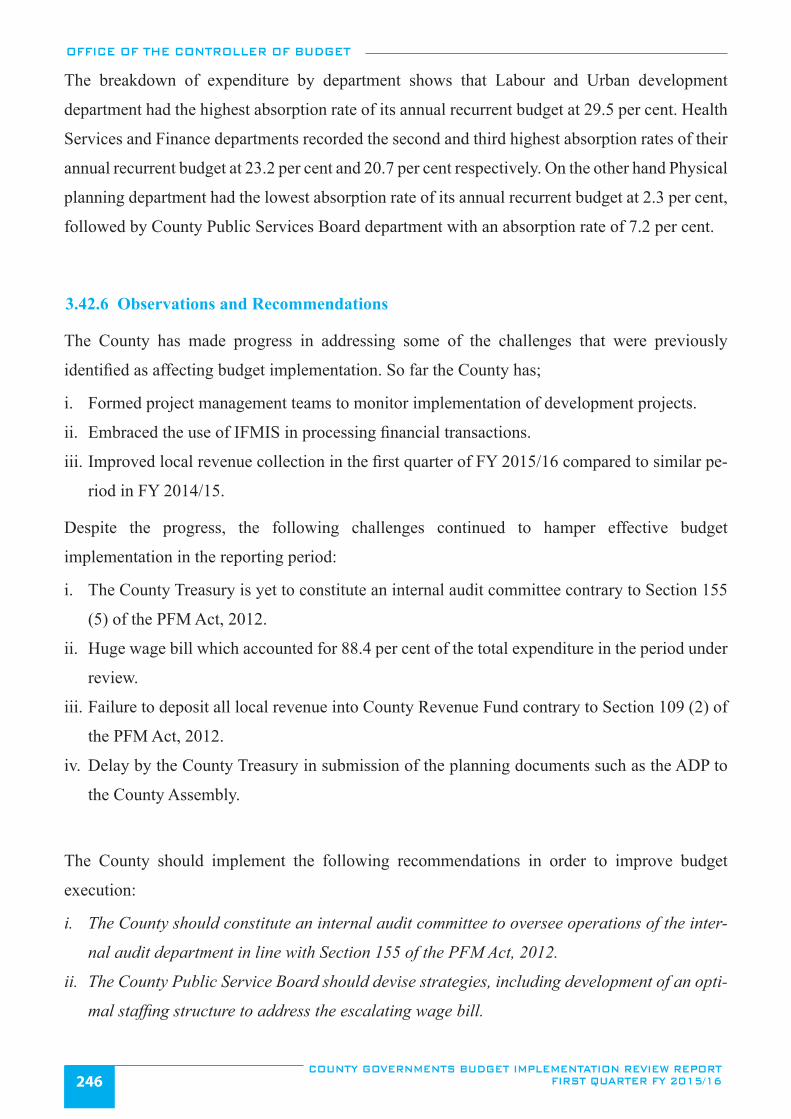
OFFICE OF THE CONTROLLER OF BUDGET
COUNTY GOVERNMENTS BUDGET IMPLEMENTATION REVIEW REPORT FIRST QUARTER FY 2015/16246
The breakdown of expenditure by department shows that Labour and Urban development
department had the highest absorption rate of its annual recurrent budget at 29.5 per cent. Health
Services and Finance departments recorded the second and third highest absorption rates of their
annual recurrent budget at 23.2 per cent and 20.7 per cent respectively. On the other hand Physical
planning department had the lowest absorption rate of its annual recurrent budget at 2.3 per cent,
followed by County Public Services Board department with an absorption rate of 7.2 per cent.
3.42.6 Observations and Recommendations
The County has made progress in addressing some of the challenges that were previously
identified as affecting budget implementation. So far the County has;
i. Formed project management teams to monitor implementation of development projects.
ii. Embraced the use of IFMIS in processing financial transactions.
iii. Improved local revenue collection in the first quarter of FY 2015/16 compared to similar pe-
riod in FY 2014/15.
Despite the progress, the following challenges continued to hamper effective budget
implementation in the reporting period:
i. The County Treasury is yet to constitute an internal audit committee contrary to Section 155
(5) of the PFM Act, 2012.
ii. Huge wage bill which accounted for 88.4 per cent of the total expenditure in the period under
review.
iii. Failure to deposit all local revenue into County Revenue Fund contrary to Section 109 (2) of
the PFM Act, 2012.
iv. Delay by the County Treasury in submission of the planning documents such as the ADP to
the County Assembly.
The County should implement the following recommendations in order to improve budget
execution:
i. The County should constitute an internal audit committee to oversee operations of the inter-
nal audit department in line with Section 155 of the PFM Act, 2012.
ii. The County Public Service Board should devise strategies, including development of an opti-
mal staffing structure to address the escalating wage bill.
OFFICE OF THE CONTROLLER OF BUDGET
COUNTY GOVERNMENTS BUDGET IMPLEMENTATION REVIEW REPORT FIRST QUARTER FY 2015/16 247
iii. The County Treasury should ensure that all local revenue is deposited into County Revenue
Fund as per Section 109(2) of Public Finance Management Act, 2012.
iv. County Treasury should adhere to the budget cycle as outlined in the PFM Act, 2012. This
will enhance effective execution of the budget.
3.43 Trans Nzoia County
3.43.1 Overview of the FY 2015/16 Budget
In the FY 2015/16 the approved budget for Trans Nzoia county amounts to Kshs.6.29 billion
comprising of Kshs.3.36 billion (53.5 per cent) allocated for recurrent expenditure and Kshs.2.93
billion (46.5 per cent) for development expenditure.
In order to finance this budget, the County expects to receive Kshs.5.10 billion (81.2 per cent)
as transfers from the National Government, collect Kshs.389.03 million (6.2 per cent) from
local sources, receive a conditional grant of Kshs.30.42 million (0.8 per cent) from DANIDA,
Kshs.163.65 million (2.8 per cent) for other conditional allocations, Kshs.64.78 million (1.4 per
cent) for Road Maintenance Fuel Levy, and Kshs.451.26 million (7.2 per cent) as projected cash
balance from FY 2014/15. However, the County did not budget for conditional allocations as
provided for in CARA, 2015 which include: Kshs.19.09 million as compensation for forgone
user fees, Kshs.67.91 million for free maternal health care, and Kshs.95.74 million for leasing of
medical equipment.
3.43.2 Revenue Analysis
In period July to September, 2015, the County received Kshs.407.97 million from the National
Government as direct transfer to the CRF account, raised Kshs.50.99 million from local sources
and had Kshs.450 million as cash balance brought forward from FY 2014/15. The local revenue
of Kshs.50.99 million, is a significant improvement from Kshs.34.7 million collected in a similar
period of FY 2014/15, and accounted for 13.1 per cent of the annual local revenue target. Figure
3.159 shows the trend of local revenue collection for each quarter from the first quarter of FY
2013/14 to the first quarter of FY 2015/16
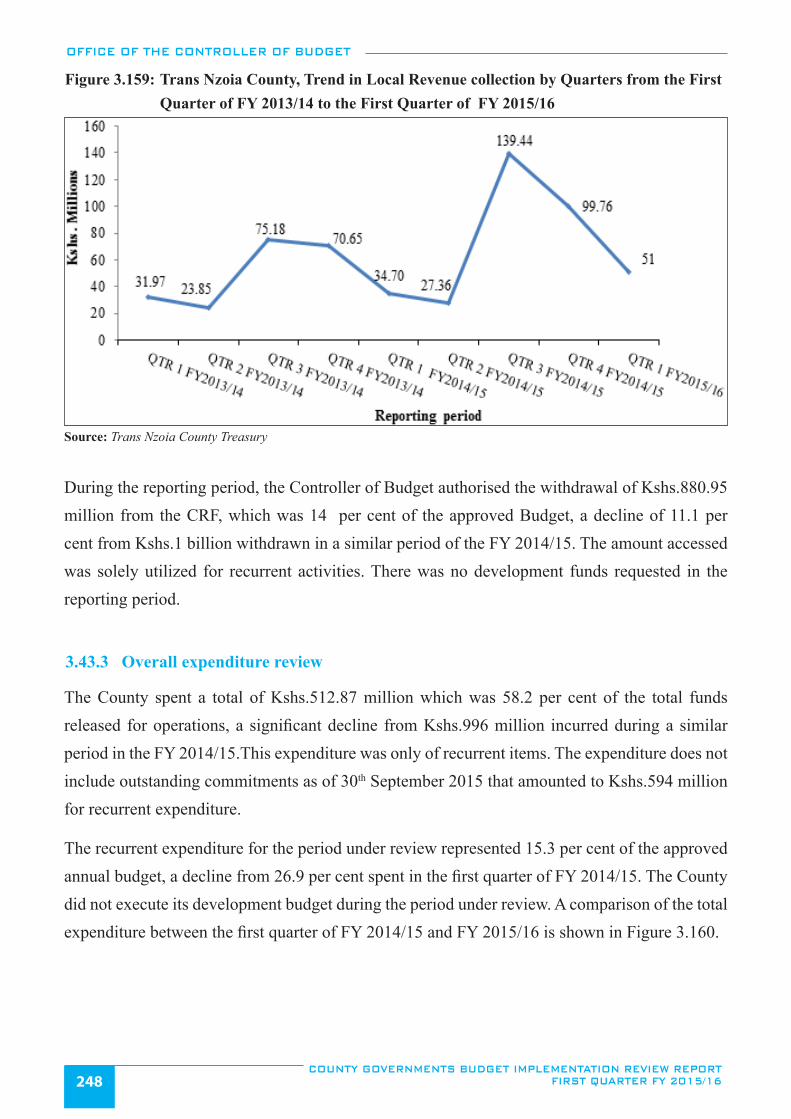
OFFICE OF THE CONTROLLER OF BUDGET
COUNTY GOVERNMENTS BUDGET IMPLEMENTATION REVIEW REPORT FIRST QUARTER FY 2015/16248
Figure 3.159: Trans Nzoia County, Trend in Local Revenue collection by Quarters from the First Quarter of FY 2013/14 to the First Quarter of FY 2015/16
Source: Trans Nzoia County Treasury
During the reporting period, the Controller of Budget authorised the withdrawal of Kshs.880.95 million from the CRF, which was 14 per cent of the approved Budget, a decline of 11.1 per cent from Kshs.1 billion withdrawn in a similar period of the FY 2014/15. The amount accessed was solely utilized for recurrent activities. There was no development funds requested in the reporting period.
3.43.3 Overall expenditure review
The County spent a total of Kshs.512.87 million which was 58.2 per cent of the total funds released for operations, a significant decline from Kshs.996 million incurred during a similar period in the FY 2014/15.This expenditure was only of recurrent items. The expenditure does not include outstanding commitments as of 30th September 2015 that amounted to Kshs.594 million for recurrent expenditure.
The recurrent expenditure for the period under review represented 15.3 per cent of the approved annual budget, a decline from 26.9 per cent spent in the first quarter of FY 2014/15. The County did not execute its development budget during the period under review. A comparison of the total expenditure between the first quarter of FY 2014/15 and FY 2015/16 is shown in Figure 3.160.
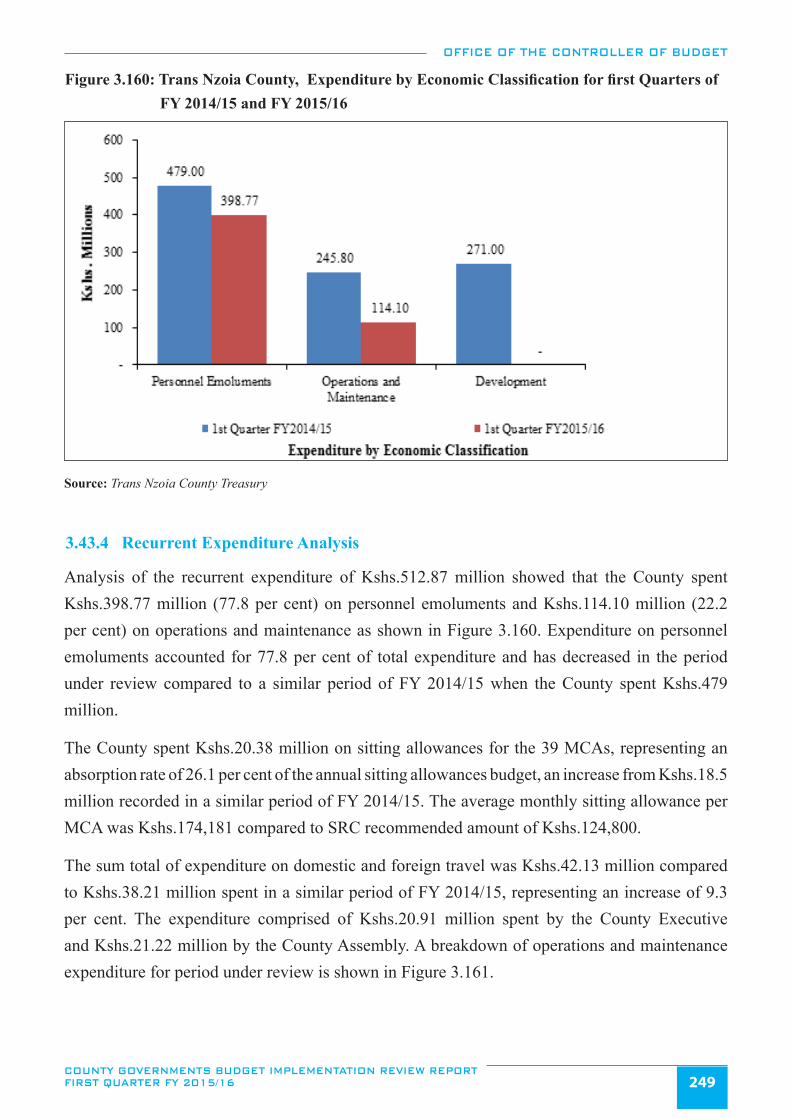
OFFICE OF THE CONTROLLER OF BUDGET
COUNTY GOVERNMENTS BUDGET IMPLEMENTATION REVIEW REPORT FIRST QUARTER FY 2015/16 249
Figure 3.160: Trans Nzoia County, Expenditure by Economic Classification for first Quarters of FY 2014/15 and FY 2015/16
Source: Trans Nzoia County Treasury
3.43.4 Recurrent Expenditure Analysis
Analysis of the recurrent expenditure of Kshs.512.87 million showed that the County spent Kshs.398.77 million (77.8 per cent) on personnel emoluments and Kshs.114.10 million (22.2 per cent) on operations and maintenance as shown in Figure 3.160. Expenditure on personnel emoluments accounted for 77.8 per cent of total expenditure and has decreased in the period under review compared to a similar period of FY 2014/15 when the County spent Kshs.479 million.
The County spent Kshs.20.38 million on sitting allowances for the 39 MCAs, representing an absorption rate of 26.1 per cent of the annual sitting allowances budget, an increase from Kshs.18.5 million recorded in a similar period of FY 2014/15. The average monthly sitting allowance per MCA was Kshs.174,181 compared to SRC recommended amount of Kshs.124,800.
The sum total of expenditure on domestic and foreign travel was Kshs.42.13 million compared to Kshs.38.21 million spent in a similar period of FY 2014/15, representing an increase of 9.3 per cent. The expenditure comprised of Kshs.20.91 million spent by the County Executive and Kshs.21.22 million by the County Assembly. A breakdown of operations and maintenance expenditure for period under review is shown in Figure 3.161.
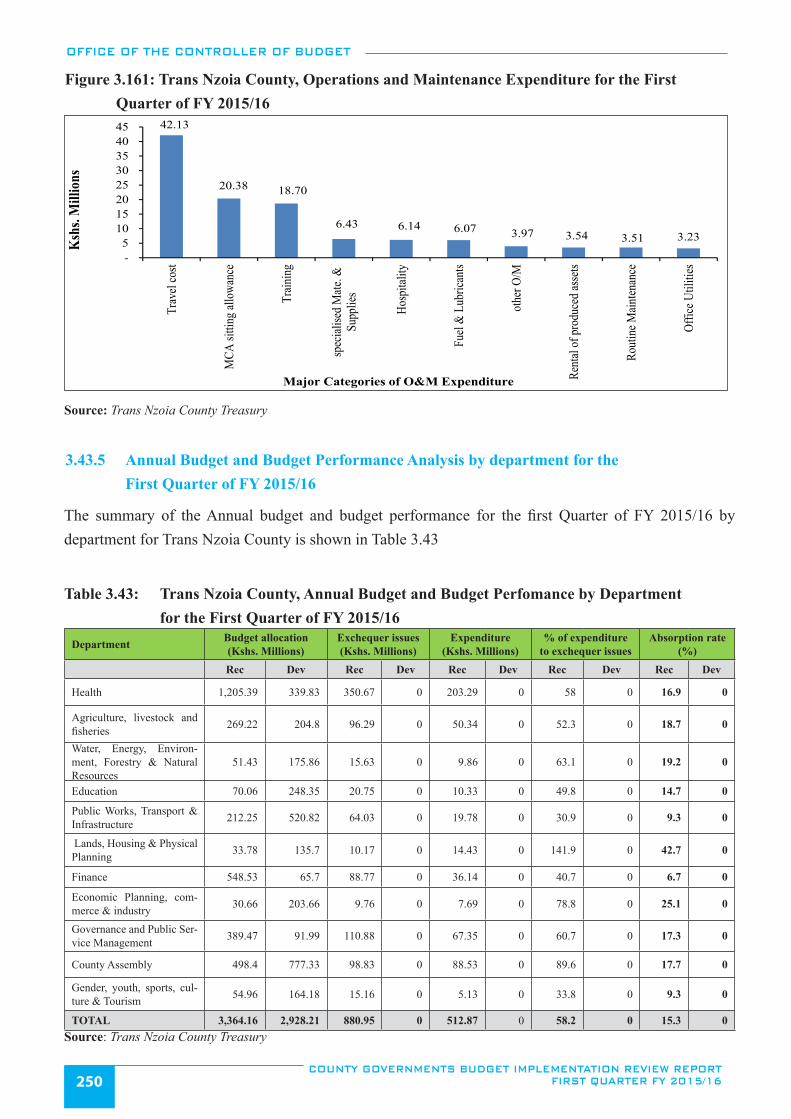
OFFICE OF THE CONTROLLER OF BUDGET
COUNTY GOVERNMENTS BUDGET IMPLEMENTATION REVIEW REPORT FIRST QUARTER FY 2015/16250
Figure 3.161: Trans Nzoia County, Operations and Maintenance Expenditure for the First Quarter of FY 2015/16
42.13
20.38 18.70
6.43 6.14 6.07 3.97 3.54 3.51 3.23
- 5
10 15 20 25 30 35 40 45
Trav
el co
st
MCA
sitti
ng al
lowa
nce
Train
ing
spec
ialise
d Mate
. &Su
pplie
s
Hosp
italit
y
Fuel
& L
ubric
ants
othe
r O/M
Rent
al of
pro
duce
d ass
ets
Rout
ine M
ainten
ance
Offic
e Util
ities
Ksh
s. M
illio
ns
Major Categories of O&M Expenditure
Source: Trans Nzoia County Treasury
3.43.5 Annual Budget and Budget Performance Analysis by department for the First Quarter of FY 2015/16
The summary of the Annual budget and budget performance for the first Quarter of FY 2015/16 by department for Trans Nzoia County is shown in Table 3.43
Table 3.43: Trans Nzoia County, Annual Budget and Budget Perfomance by Department for the First Quarter of FY 2015/16
Department Budget allocation (Kshs. Millions)
Exchequer issues (Kshs. Millions)
Expenditure (Kshs. Millions)
% of expenditure to exchequer issues
Absorption rate (%)
Rec Dev Rec Dev Rec Dev Rec Dev Rec Dev
Health 1,205.39 339.83 350.67 0 203.29 0 58 0 16.9 0
Agriculture, livestock and fisheries 269.22 204.8 96.29 0 50.34 0 52.3 0 18.7 0
Water, Energy, Environ-ment, Forestry & Natural Resources
51.43 175.86 15.63 0 9.86 0 63.1 0 19.2 0
Education 70.06 248.35 20.75 0 10.33 0 49.8 0 14.7 0
Public Works, Transport & Infrastructure 212.25 520.82 64.03 0 19.78 0 30.9 0 9.3 0
Lands, Housing & Physical Planning 33.78 135.7 10.17 0 14.43 0 141.9 0 42.7 0
Finance 548.53 65.7 88.77 0 36.14 0 40.7 0 6.7 0
Economic Planning, com-merce & industry 30.66 203.66 9.76 0 7.69 0 78.8 0 25.1 0
Governance and Public Ser-vice Management 389.47 91.99 110.88 0 67.35 0 60.7 0 17.3 0
County Assembly 498.4 777.33 98.83 0 88.53 0 89.6 0 17.7 0
Gender, youth, sports, cul-ture & Tourism 54.96 164.18 15.16 0 5.13 0 33.8 0 9.3 0
TOTAL 3,364.16 2,928.21 880.95 0 512.87 0 58.2 0 15.3 0Source: Trans Nzoia County Treasury
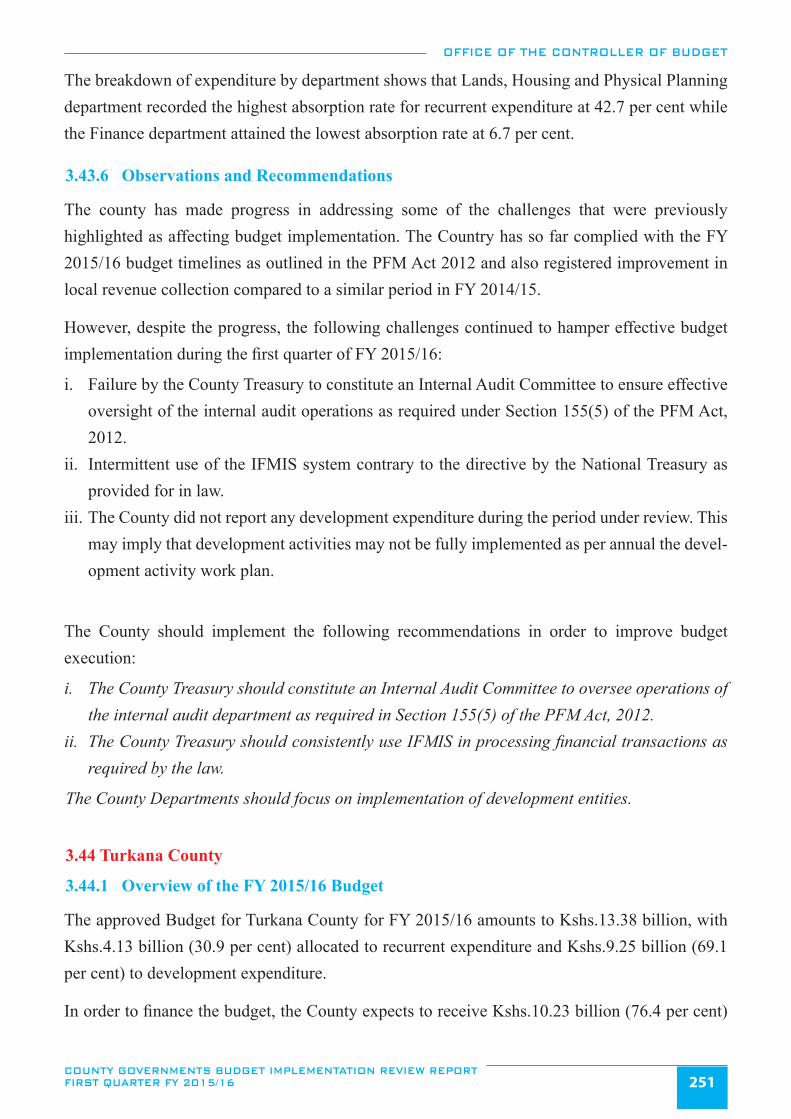
OFFICE OF THE CONTROLLER OF BUDGET
COUNTY GOVERNMENTS BUDGET IMPLEMENTATION REVIEW REPORT FIRST QUARTER FY 2015/16 251
The breakdown of expenditure by department shows that Lands, Housing and Physical Planning department recorded the highest absorption rate for recurrent expenditure at 42.7 per cent while the Finance department attained the lowest absorption rate at 6.7 per cent. 3.43.6 Observations and Recommendations
The county has made progress in addressing some of the challenges that were previously highlighted as affecting budget implementation. The Country has so far complied with the FY 2015/16 budget timelines as outlined in the PFM Act 2012 and also registered improvement in local revenue collection compared to a similar period in FY 2014/15.
However, despite the progress, the following challenges continued to hamper effective budget implementation during the first quarter of FY 2015/16:
i. Failure by the County Treasury to constitute an Internal Audit Committee to ensure effective oversight of the internal audit operations as required under Section 155(5) of the PFM Act, 2012.
ii. Intermittent use of the IFMIS system contrary to the directive by the National Treasury as provided for in law.
iii. The County did not report any development expenditure during the period under review. This may imply that development activities may not be fully implemented as per annual the devel-opment activity work plan.
The County should implement the following recommendations in order to improve budget execution:
i. The County Treasury should constitute an Internal Audit Committee to oversee operations of the internal audit department as required in Section 155(5) of the PFM Act, 2012.
ii. The County Treasury should consistently use IFMIS in processing financial transactions as required by the law.
The County Departments should focus on implementation of development entities.
3.44 Turkana County
3.44.1 Overview of the FY 2015/16 Budget
The approved Budget for Turkana County for FY 2015/16 amounts to Kshs.13.38 billion, with Kshs.4.13 billion (30.9 per cent) allocated to recurrent expenditure and Kshs.9.25 billion (69.1 per cent) to development expenditure.
In order to finance the budget, the County expects to receive Kshs.10.23 billion (76.4 per cent)
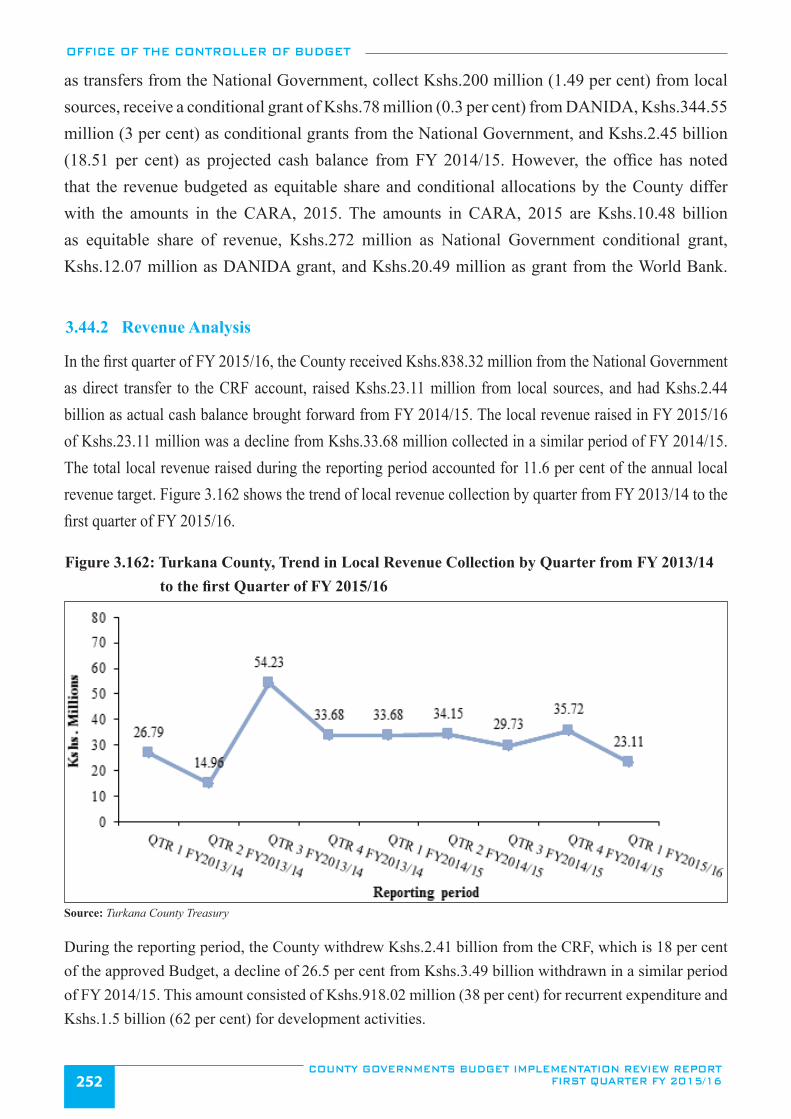
OFFICE OF THE CONTROLLER OF BUDGET
COUNTY GOVERNMENTS BUDGET IMPLEMENTATION REVIEW REPORT FIRST QUARTER FY 2015/16252
as transfers from the National Government, collect Kshs.200 million (1.49 per cent) from local sources, receive a conditional grant of Kshs.78 million (0.3 per cent) from DANIDA, Kshs.344.55 million (3 per cent) as conditional grants from the National Government, and Kshs.2.45 billion (18.51 per cent) as projected cash balance from FY 2014/15. However, the office has noted that the revenue budgeted as equitable share and conditional allocations by the County differ with the amounts in the CARA, 2015. The amounts in CARA, 2015 are Kshs.10.48 billion as equitable share of revenue, Kshs.272 million as National Government conditional grant, Kshs.12.07 million as DANIDA grant, and Kshs.20.49 million as grant from the World Bank.
3.44.2 Revenue Analysis
In the first quarter of FY 2015/16, the County received Kshs.838.32 million from the National Government as direct transfer to the CRF account, raised Kshs.23.11 million from local sources, and had Kshs.2.44 billion as actual cash balance brought forward from FY 2014/15. The local revenue raised in FY 2015/16 of Kshs.23.11 million was a decline from Kshs.33.68 million collected in a similar period of FY 2014/15. The total local revenue raised during the reporting period accounted for 11.6 per cent of the annual local revenue target. Figure 3.162 shows the trend of local revenue collection by quarter from FY 2013/14 to the first quarter of FY 2015/16.
Figure 3.162: Turkana County, Trend in Local Revenue Collection by Quarter from FY 2013/14 to the first Quarter of FY 2015/16
Source: Turkana County Treasury
During the reporting period, the County withdrew Kshs.2.41 billion from the CRF, which is 18 per cent of the approved Budget, a decline of 26.5 per cent from Kshs.3.49 billion withdrawn in a similar period of FY 2014/15. This amount consisted of Kshs.918.02 million (38 per cent) for recurrent expenditure and Kshs.1.5 billion (62 per cent) for development activities.
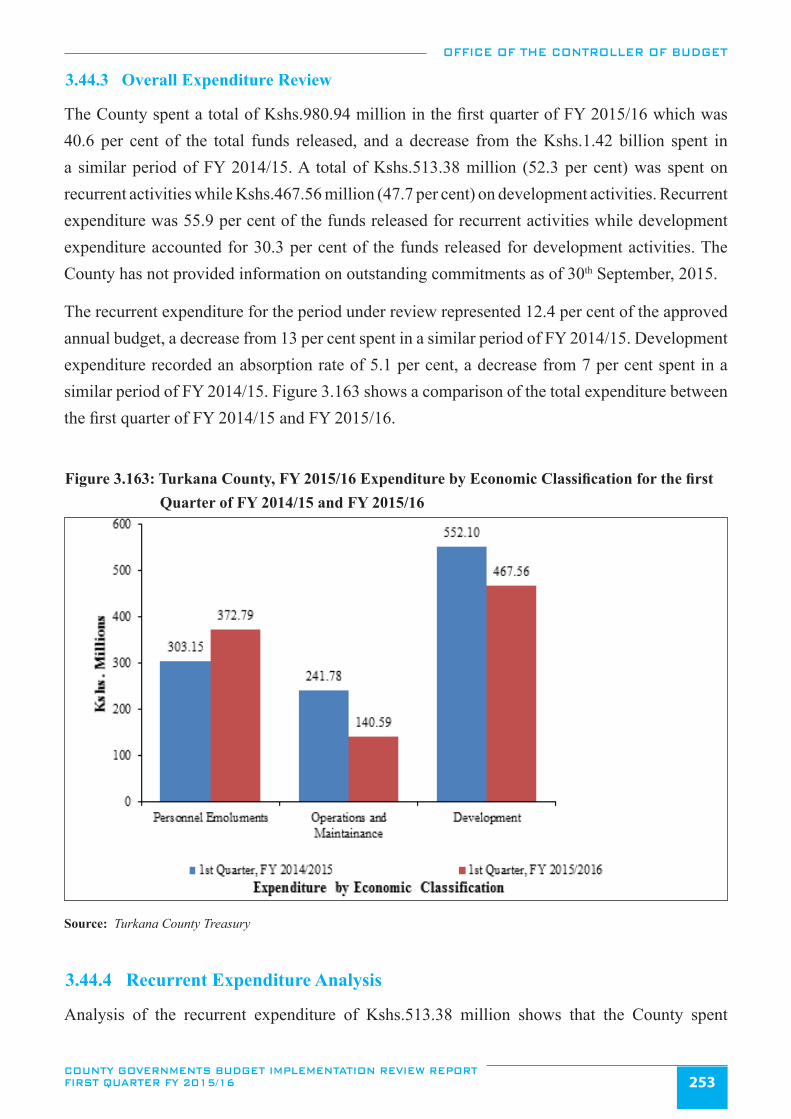
OFFICE OF THE CONTROLLER OF BUDGET
COUNTY GOVERNMENTS BUDGET IMPLEMENTATION REVIEW REPORT FIRST QUARTER FY 2015/16 253
3.44.3 Overall Expenditure Review
The County spent a total of Kshs.980.94 million in the first quarter of FY 2015/16 which was 40.6 per cent of the total funds released, and a decrease from the Kshs.1.42 billion spent in a similar period of FY 2014/15. A total of Kshs.513.38 million (52.3 per cent) was spent on recurrent activities while Kshs.467.56 million (47.7 per cent) on development activities. Recurrent expenditure was 55.9 per cent of the funds released for recurrent activities while development expenditure accounted for 30.3 per cent of the funds released for development activities. The County has not provided information on outstanding commitments as of 30th September, 2015.
The recurrent expenditure for the period under review represented 12.4 per cent of the approved annual budget, a decrease from 13 per cent spent in a similar period of FY 2014/15. Development expenditure recorded an absorption rate of 5.1 per cent, a decrease from 7 per cent spent in a similar period of FY 2014/15. Figure 3.163 shows a comparison of the total expenditure between the first quarter of FY 2014/15 and FY 2015/16.
Figure 3.163: Turkana County, FY 2015/16 Expenditure by Economic Classification for the first Quarter of FY 2014/15 and FY 2015/16
Source: Turkana County Treasury
3.44.4 Recurrent Expenditure Analysis
Analysis of the recurrent expenditure of Kshs.513.38 million shows that the County spent
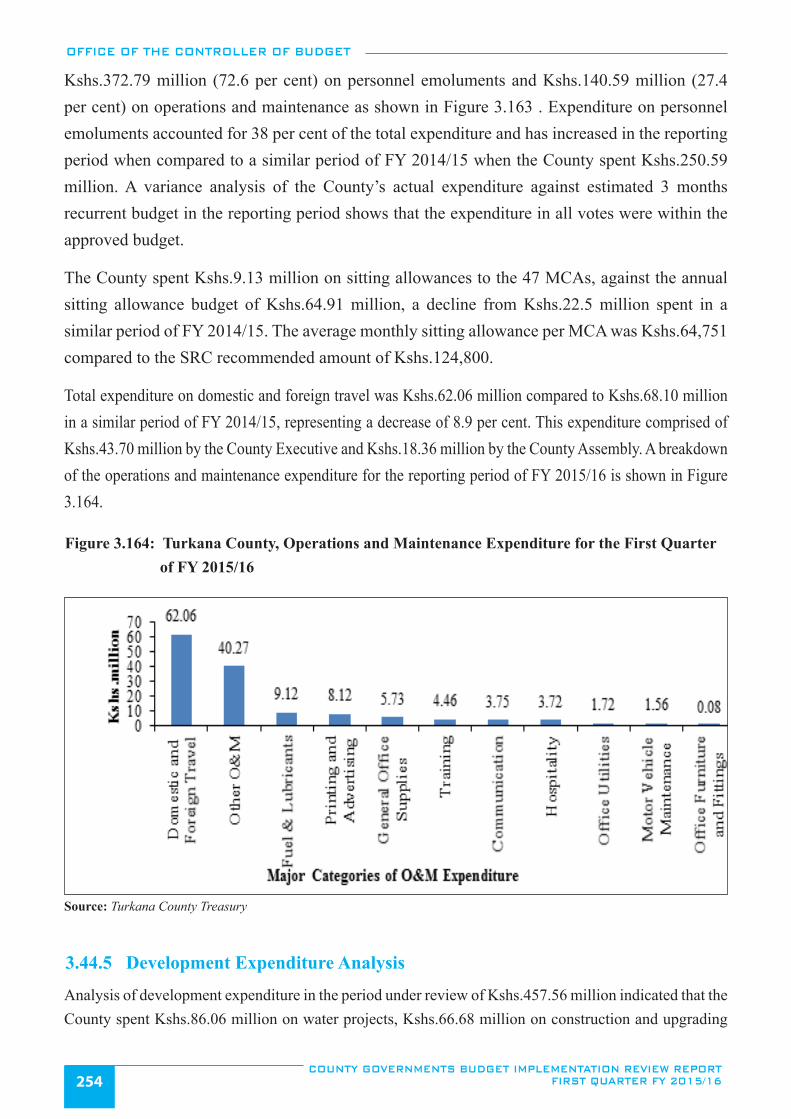
OFFICE OF THE CONTROLLER OF BUDGET
COUNTY GOVERNMENTS BUDGET IMPLEMENTATION REVIEW REPORT FIRST QUARTER FY 2015/16254
Kshs.372.79 million (72.6 per cent) on personnel emoluments and Kshs.140.59 million (27.4 per cent) on operations and maintenance as shown in Figure 3.163 . Expenditure on personnel emoluments accounted for 38 per cent of the total expenditure and has increased in the reporting period when compared to a similar period of FY 2014/15 when the County spent Kshs.250.59 million. A variance analysis of the County’s actual expenditure against estimated 3 months recurrent budget in the reporting period shows that the expenditure in all votes were within the approved budget.
The County spent Kshs.9.13 million on sitting allowances to the 47 MCAs, against the annual sitting allowance budget of Kshs.64.91 million, a decline from Kshs.22.5 million spent in a similar period of FY 2014/15. The average monthly sitting allowance per MCA was Kshs.64,751 compared to the SRC recommended amount of Kshs.124,800.
Total expenditure on domestic and foreign travel was Kshs.62.06 million compared to Kshs.68.10 million in a similar period of FY 2014/15, representing a decrease of 8.9 per cent. This expenditure comprised of Kshs.43.70 million by the County Executive and Kshs.18.36 million by the County Assembly. A breakdown of the operations and maintenance expenditure for the reporting period of FY 2015/16 is shown in Figure 3.164.
Figure 3.164: Turkana County, Operations and Maintenance Expenditure for the First Quarter of FY 2015/16
Source: Turkana County Treasury
3.44.5 Development Expenditure Analysis
Analysis of development expenditure in the period under review of Kshs.457.56 million indicated that the County spent Kshs.86.06 million on water projects, Kshs.66.68 million on construction and upgrading
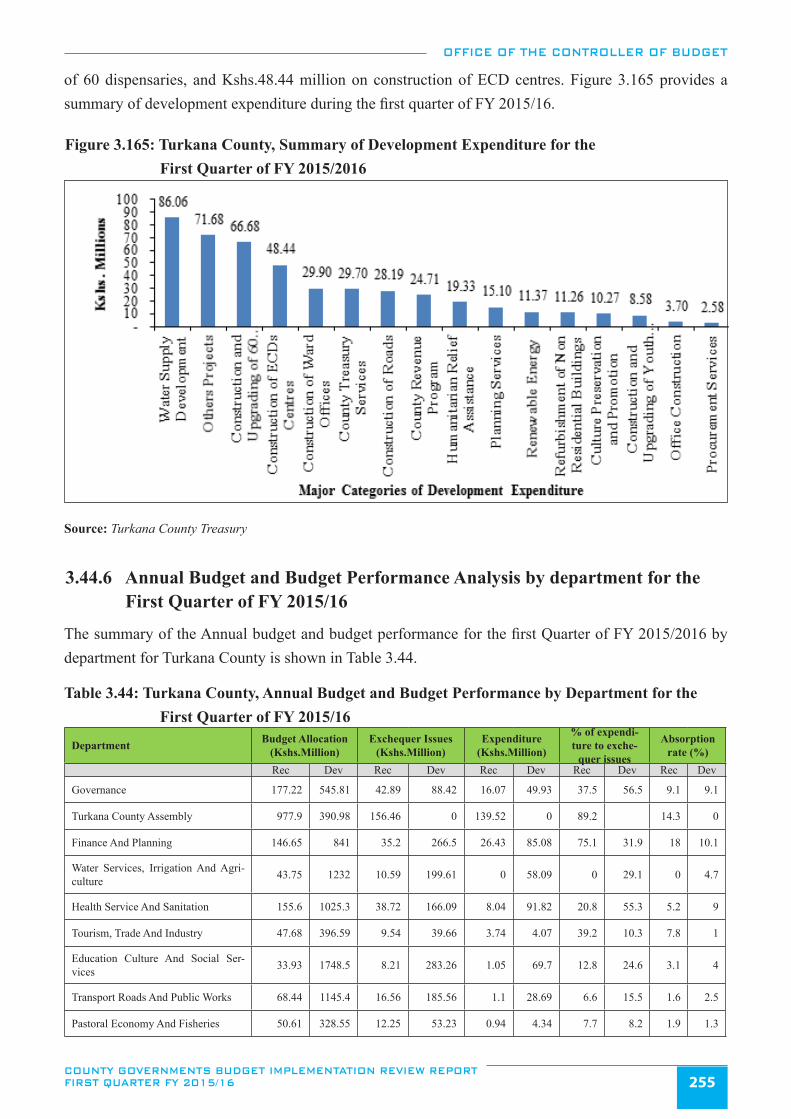
OFFICE OF THE CONTROLLER OF BUDGET
COUNTY GOVERNMENTS BUDGET IMPLEMENTATION REVIEW REPORT FIRST QUARTER FY 2015/16 255
of 60 dispensaries, and Kshs.48.44 million on construction of ECD centres. Figure 3.165 provides a summary of development expenditure during the first quarter of FY 2015/16.
Figure 3.165: Turkana County, Summary of Development Expenditure for the First Quarter of FY 2015/2016
Source: Turkana County Treasury
3.44.6 Annual Budget and Budget Performance Analysis by department for the First Quarter of FY 2015/16
The summary of the Annual budget and budget performance for the first Quarter of FY 2015/2016 by department for Turkana County is shown in Table 3.44.
Table 3.44: Turkana County, Annual Budget and Budget Performance by Department for the First Quarter of FY 2015/16
Department Budget Allocation (Kshs.Million)
Exchequer Issues (Kshs.Million)
Expenditure (Kshs.Million)
% of expendi-ture to exche-
quer issues
Absorption rate (%)
Rec Dev Rec Dev Rec Dev Rec Dev Rec Dev
Governance 177.22 545.81 42.89 88.42 16.07 49.93 37.5 56.5 9.1 9.1
Turkana County Assembly 977.9 390.98 156.46 0 139.52 0 89.2 14.3 0
Finance And Planning 146.65 841 35.2 266.5 26.43 85.08 75.1 31.9 18 10.1
Water Services, Irrigation And Agri-culture 43.75 1232 10.59 199.61 0 58.09 0 29.1 0 4.7
Health Service And Sanitation 155.6 1025.3 38.72 166.09 8.04 91.82 20.8 55.3 5.2 9
Tourism, Trade And Industry 47.68 396.59 9.54 39.66 3.74 4.07 39.2 10.3 7.8 1
Education Culture And Social Ser-vices 33.93 1748.5 8.21 283.26 1.05 69.7 12.8 24.6 3.1 4
Transport Roads And Public Works 68.44 1145.4 16.56 185.56 1.1 28.69 6.6 15.5 1.6 2.5
Pastoral Economy And Fisheries 50.61 328.55 12.25 53.23 0.94 4.34 7.7 8.2 1.9 1.3
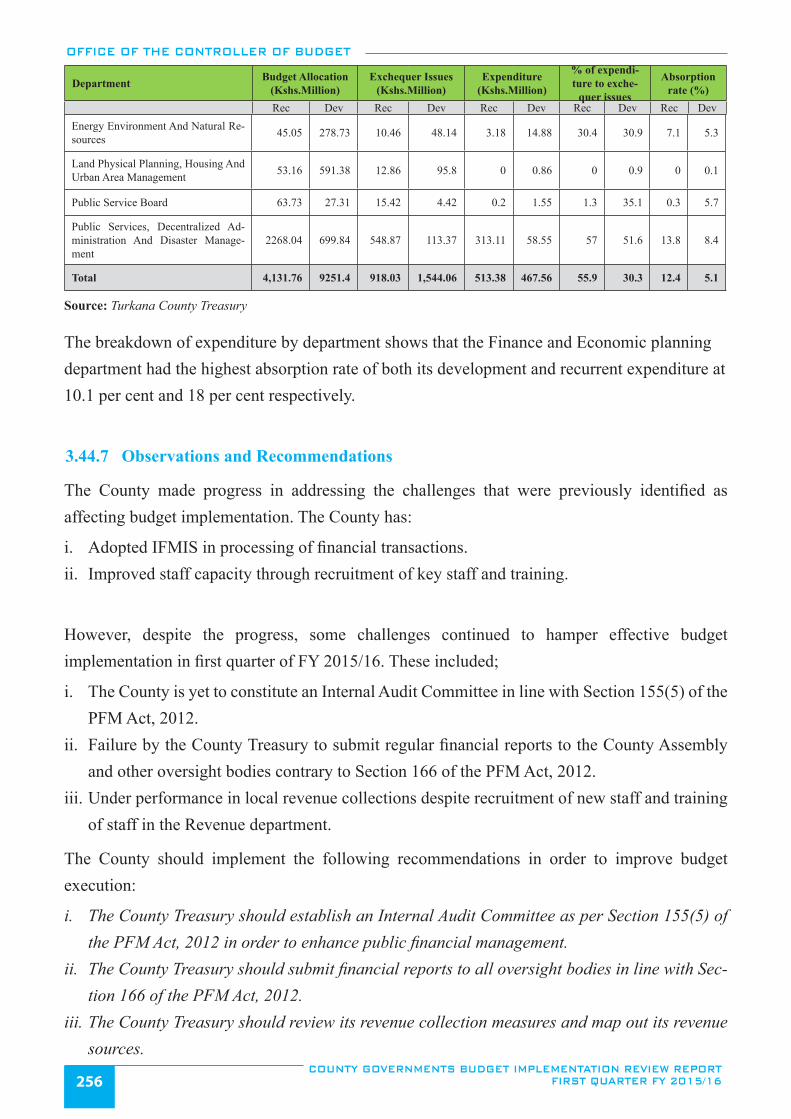
OFFICE OF THE CONTROLLER OF BUDGET
COUNTY GOVERNMENTS BUDGET IMPLEMENTATION REVIEW REPORT FIRST QUARTER FY 2015/16256
Energy Environment And Natural Re-sources 45.05 278.73 10.46 48.14 3.18 14.88 30.4 30.9 7.1 5.3
Land Physical Planning, Housing And Urban Area Management 53.16 591.38 12.86 95.8 0 0.86 0 0.9 0 0.1
Public Service Board 63.73 27.31 15.42 4.42 0.2 1.55 1.3 35.1 0.3 5.7
Public Services, Decentralized Ad-ministration And Disaster Manage-ment
2268.04 699.84 548.87 113.37 313.11 58.55 57 51.6 13.8 8.4
Total 4,131.76 9251.4 918.03 1,544.06 513.38 467.56 55.9 30.3 12.4 5.1
Source: Turkana County Treasury
The breakdown of expenditure by department shows that the Finance and Economic planning department had the highest absorption rate of both its development and recurrent expenditure at 10.1 per cent and 18 per cent respectively.
3.44.7 Observations and Recommendations
The County made progress in addressing the challenges that were previously identified as affecting budget implementation. The County has:
i. Adopted IFMIS in processing of financial transactions.ii. Improved staff capacity through recruitment of key staff and training.
However, despite the progress, some challenges continued to hamper effective budget implementation in first quarter of FY 2015/16. These included;
i. The County is yet to constitute an Internal Audit Committee in line with Section 155(5) of the PFM Act, 2012.
ii. Failure by the County Treasury to submit regular financial reports to the County Assembly and other oversight bodies contrary to Section 166 of the PFM Act, 2012.
iii. Under performance in local revenue collections despite recruitment of new staff and training of staff in the Revenue department.
The County should implement the following recommendations in order to improve budget execution:
i. The County Treasury should establish an Internal Audit Committee as per Section 155(5) of the PFM Act, 2012 in order to enhance public financial management.
ii. The County Treasury should submit financial reports to all oversight bodies in line with Sec-tion 166 of the PFM Act, 2012.
iii. The County Treasury should review its revenue collection measures and map out its revenue sources.
Department Budget Allocation (Kshs.Million)
Exchequer Issues (Kshs.Million)
Expenditure (Kshs.Million)
% of expendi-ture to exche-
quer issues
Absorption rate (%)
Rec Dev Rec Dev Rec Dev Rec Dev Rec Dev
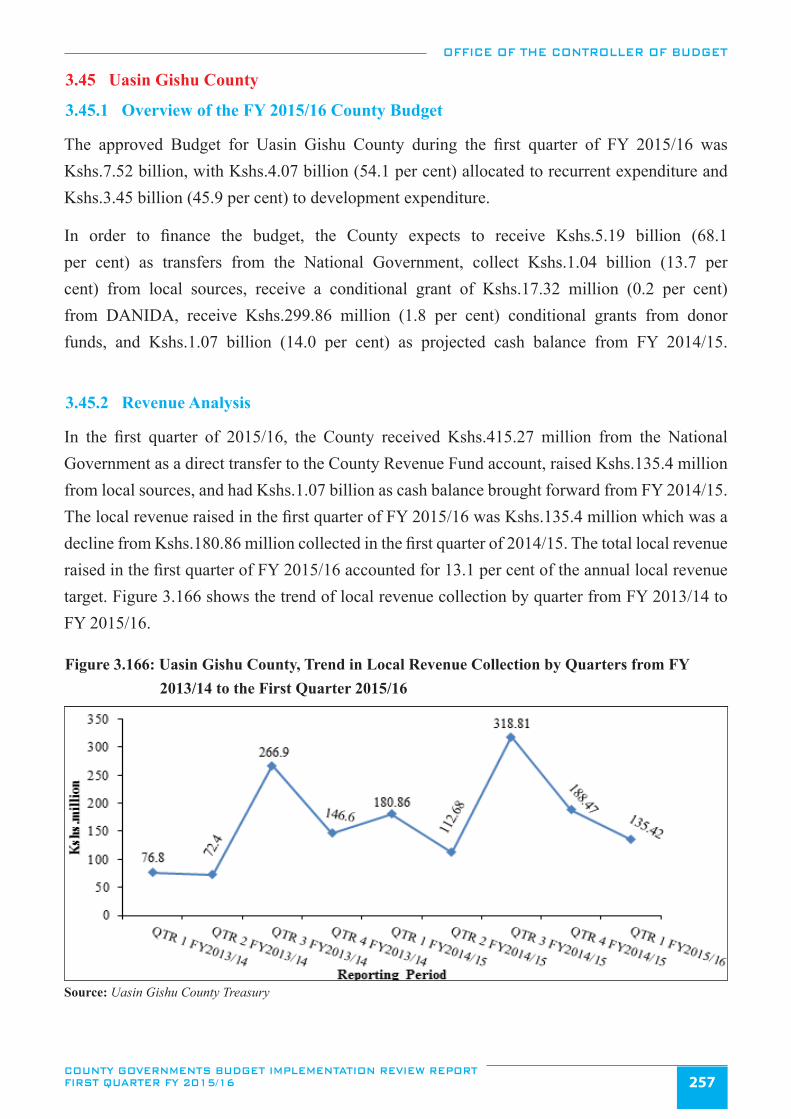
OFFICE OF THE CONTROLLER OF BUDGET
COUNTY GOVERNMENTS BUDGET IMPLEMENTATION REVIEW REPORT FIRST QUARTER FY 2015/16 257
3.45 Uasin Gishu County
3.45.1 Overview of the FY 2015/16 County Budget
The approved Budget for Uasin Gishu County during the first quarter of FY 2015/16 was Kshs.7.52 billion, with Kshs.4.07 billion (54.1 per cent) allocated to recurrent expenditure and Kshs.3.45 billion (45.9 per cent) to development expenditure.
In order to finance the budget, the County expects to receive Kshs.5.19 billion (68.1 per cent) as transfers from the National Government, collect Kshs.1.04 billion (13.7 per cent) from local sources, receive a conditional grant of Kshs.17.32 million (0.2 per cent) from DANIDA, receive Kshs.299.86 million (1.8 per cent) conditional grants from donor funds, and Kshs.1.07 billion (14.0 per cent) as projected cash balance from FY 2014/15.
3.45.2 Revenue Analysis
In the first quarter of 2015/16, the County received Kshs.415.27 million from the National Government as a direct transfer to the County Revenue Fund account, raised Kshs.135.4 million from local sources, and had Kshs.1.07 billion as cash balance brought forward from FY 2014/15. The local revenue raised in the first quarter of FY 2015/16 was Kshs.135.4 million which was a decline from Kshs.180.86 million collected in the first quarter of 2014/15. The total local revenue raised in the first quarter of FY 2015/16 accounted for 13.1 per cent of the annual local revenue target. Figure 3.166 shows the trend of local revenue collection by quarter from FY 2013/14 to FY 2015/16.
Figure 3.166: Uasin Gishu County, Trend in Local Revenue Collection by Quarters from FY 2013/14 to the First Quarter 2015/16
Source: Uasin Gishu County Treasury
OFFICE OF THE CONTROLLER OF BUDGET
COUNTY GOVERNMENTS BUDGET IMPLEMENTATION REVIEW REPORT FIRST QUARTER FY 2015/16258
During the first quarter of 2015/16, the Controller of Budget authorised withdrawal of Kshs.1.18 billion from the CRF, which was 15.8 per cent of the approved annual Budget, a reduction from 22.94 per cent recorded in the first quarter of FY 2014/15. This amount consisted of Kshs.879.10 million (74.2 per cent) for recurrent expenditure and Kshs.305.71 million (25.8 per cent) for development activities.
3.45.3 Overall expenditure Review
The County spent a total of Kshs.573.80 million during first quarter of 2015/16 which accounted for 48.4 per cent of the total funds released to the county operational accounts and a reduction from the Kshs.847.84 million spent in the first quarter of 2014/15. A total of Kshs.566.74 million (98.8 per cent) was spent on recurrent activities while Kshs.7.06 million (1.22 per cent) was spent on development activities. With a total expenditure of kshs.573.80 million, the county had an overall absorption of 7.6 per cent with recurrent accounting for 13.9 per cent while development expenditure accounted for 0.2 per cent absorption rate. Recurrent expenditure was 64.5 per cent of the funds released for recurrent activities while development expenditure accounted for 2.3 per cent of the funds released for development activities.
The total expenditure on development of Kshs.7.06 million was on pending bills which were outstanding as at June 30th 2015. However, the balance of Kshs.829.34 million on development expenditure and Kshs.219.19 million for recurrent expenditure were still pending as at 30th September 2015. The county has not been able to pay these bills due to the low human capacity on the e-procurement system and connectivity of the system while making the payments.
The Office of the Controller of Budget noted that as at September 30th, 2015, the County had established three County Public Funds namely County Bursary Fund, Car loan and Mortgages Fund, Co-operative Enterprise Fund with approved budgets of Kshs.229.6 million, 225.00 million, and Kshs.90.00 million respectively. However, during the first quarter of FY 2015/16 the county reported no expenditure for the bursary fund and cooperative enterprise fund while the MCAs car loan and mortgages fund had already been disbursed to MCAs in the FY 2013/14 with recovery of the loan being reported by the fund administrator.
The recurrent expenditure for the period under review represented an absorption rate of 13.9 per cent, a reduction from 20.7 per cent spent in the first quarter of FY 2014/15 while development expenditure recorded an absorption rate of 0.2 per cent, a reduction from an absorption rate of 2.4 per cent spent in the first quarter of FY 2014/15. Figure 3.167 shows the breakdown of expenditure by economic classification.
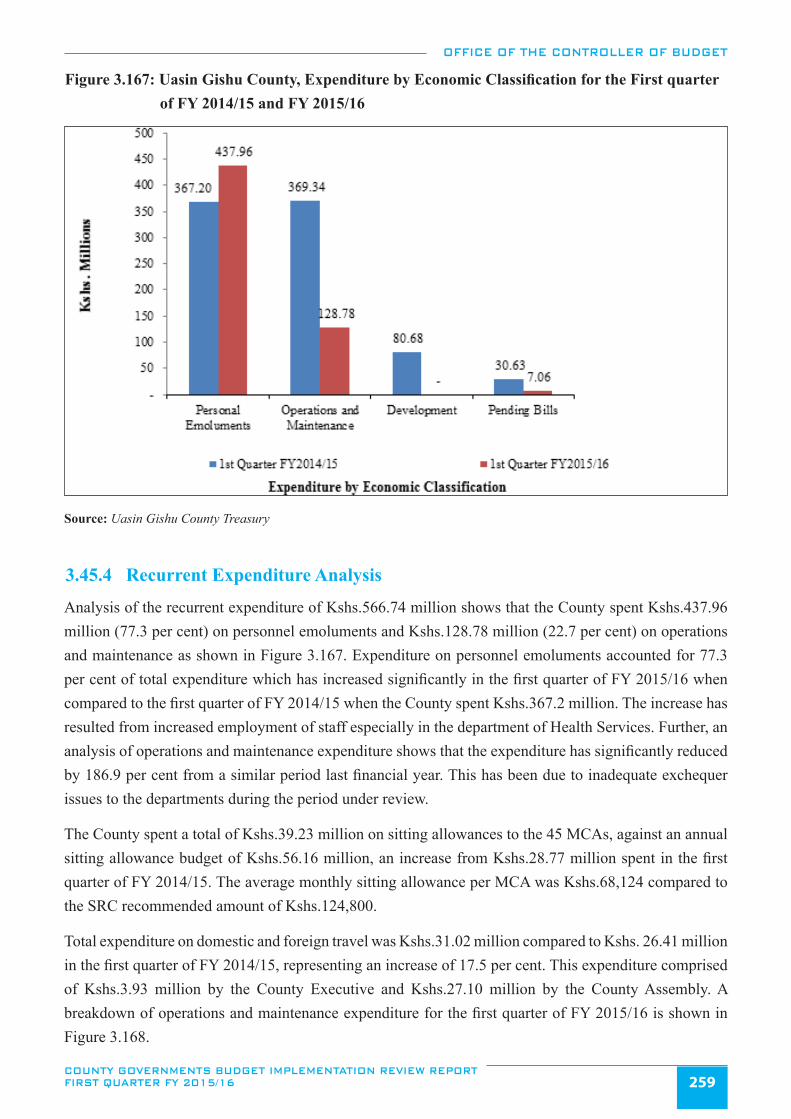
OFFICE OF THE CONTROLLER OF BUDGET
COUNTY GOVERNMENTS BUDGET IMPLEMENTATION REVIEW REPORT FIRST QUARTER FY 2015/16 259
Figure 3.167: Uasin Gishu County, Expenditure by Economic Classification for the First quarter of FY 2014/15 and FY 2015/16
Source: Uasin Gishu County Treasury
3.45.4 Recurrent Expenditure Analysis
Analysis of the recurrent expenditure of Kshs.566.74 million shows that the County spent Kshs.437.96 million (77.3 per cent) on personnel emoluments and Kshs.128.78 million (22.7 per cent) on operations and maintenance as shown in Figure 3.167. Expenditure on personnel emoluments accounted for 77.3 per cent of total expenditure which has increased significantly in the first quarter of FY 2015/16 when compared to the first quarter of FY 2014/15 when the County spent Kshs.367.2 million. The increase has resulted from increased employment of staff especially in the department of Health Services. Further, an analysis of operations and maintenance expenditure shows that the expenditure has significantly reduced by 186.9 per cent from a similar period last financial year. This has been due to inadequate exchequer issues to the departments during the period under review.
The County spent a total of Kshs.39.23 million on sitting allowances to the 45 MCAs, against an annual sitting allowance budget of Kshs.56.16 million, an increase from Kshs.28.77 million spent in the first quarter of FY 2014/15. The average monthly sitting allowance per MCA was Kshs.68,124 compared to the SRC recommended amount of Kshs.124,800.
Total expenditure on domestic and foreign travel was Kshs.31.02 million compared to Kshs. 26.41 million in the first quarter of FY 2014/15, representing an increase of 17.5 per cent. This expenditure comprised of Kshs.3.93 million by the County Executive and Kshs.27.10 million by the County Assembly. A breakdown of operations and maintenance expenditure for the first quarter of FY 2015/16 is shown in Figure 3.168.
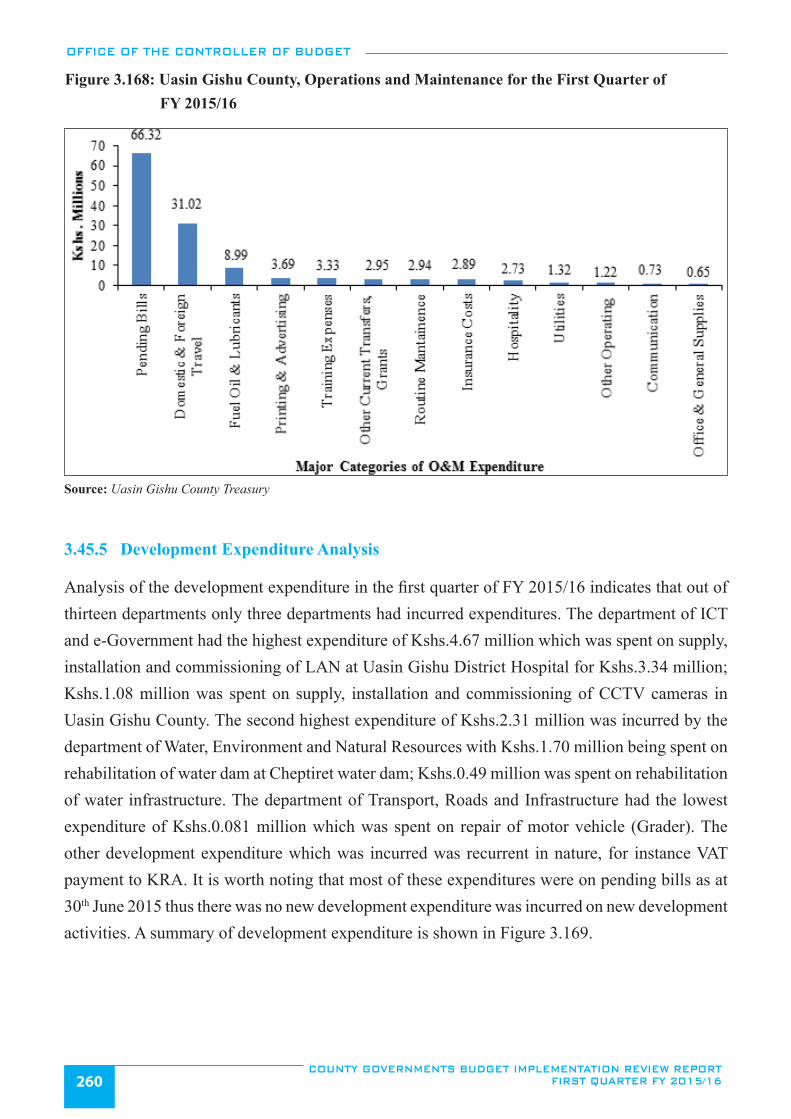
OFFICE OF THE CONTROLLER OF BUDGET
COUNTY GOVERNMENTS BUDGET IMPLEMENTATION REVIEW REPORT FIRST QUARTER FY 2015/16260
Figure 3.168: Uasin Gishu County, Operations and Maintenance for the First Quarter of FY 2015/16
Source: Uasin Gishu County Treasury
3.45.5 Development Expenditure Analysis
Analysis of the development expenditure in the first quarter of FY 2015/16 indicates that out of thirteen departments only three departments had incurred expenditures. The department of ICT and e-Government had the highest expenditure of Kshs.4.67 million which was spent on supply, installation and commissioning of LAN at Uasin Gishu District Hospital for Kshs.3.34 million; Kshs.1.08 million was spent on supply, installation and commissioning of CCTV cameras in Uasin Gishu County. The second highest expenditure of Kshs.2.31 million was incurred by the department of Water, Environment and Natural Resources with Kshs.1.70 million being spent on rehabilitation of water dam at Cheptiret water dam; Kshs.0.49 million was spent on rehabilitation of water infrastructure. The department of Transport, Roads and Infrastructure had the lowest expenditure of Kshs.0.081 million which was spent on repair of motor vehicle (Grader). The other development expenditure which was incurred was recurrent in nature, for instance VAT payment to KRA. It is worth noting that most of these expenditures were on pending bills as at 30th June 2015 thus there was no new development expenditure was incurred on new development activities. A summary of development expenditure is shown in Figure 3.169.
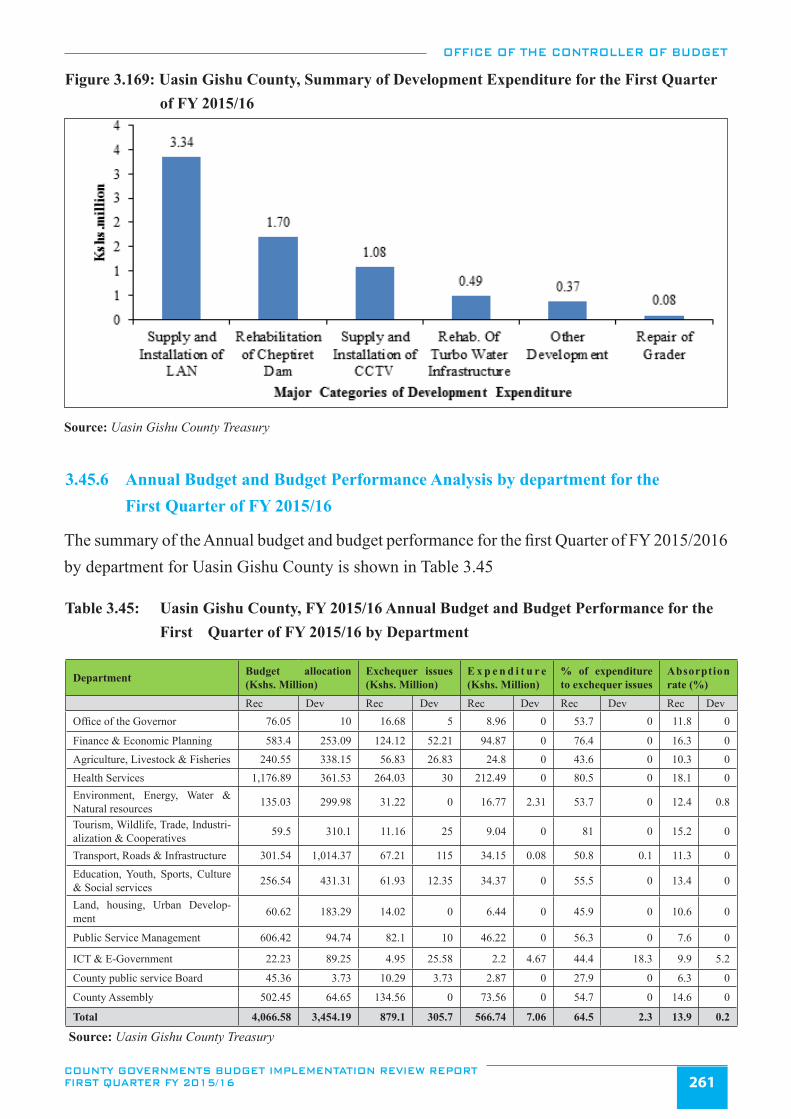
OFFICE OF THE CONTROLLER OF BUDGET
COUNTY GOVERNMENTS BUDGET IMPLEMENTATION REVIEW REPORT FIRST QUARTER FY 2015/16 261
Figure 3.169: Uasin Gishu County, Summary of Development Expenditure for the First Quarter of FY 2015/16
Source: Uasin Gishu County Treasury
3.45.6 Annual Budget and Budget Performance Analysis by department for the First Quarter of FY 2015/16
The summary of the Annual budget and budget performance for the first Quarter of FY 2015/2016 by department for Uasin Gishu County is shown in Table 3.45
Table 3.45: Uasin Gishu County, FY 2015/16 Annual Budget and Budget Performance for the First Quarter of FY 2015/16 by Department
Department Budget allocation (Kshs. Million)
Exchequer issues (Kshs. Million)
E x p e n d i t u r e (Kshs. Million)
% of expenditure to exchequer issues
Absorption rate (%)
Rec Dev Rec Dev Rec Dev Rec Dev Rec DevOffice of the Governor 76.05 10 16.68 5 8.96 0 53.7 0 11.8 0
Finance & Economic Planning 583.4 253.09 124.12 52.21 94.87 0 76.4 0 16.3 0
Agriculture, Livestock & Fisheries 240.55 338.15 56.83 26.83 24.8 0 43.6 0 10.3 0Health Services 1,176.89 361.53 264.03 30 212.49 0 80.5 0 18.1 0Environment, Energy, Water & Natural resources 135.03 299.98 31.22 0 16.77 2.31 53.7 0 12.4 0.8
Tourism, Wildlife, Trade, Industri-alization & Cooperatives 59.5 310.1 11.16 25 9.04 0 81 0 15.2 0
Transport, Roads & Infrastructure 301.54 1,014.37 67.21 115 34.15 0.08 50.8 0.1 11.3 0Education, Youth, Sports, Culture & Social services 256.54 431.31 61.93 12.35 34.37 0 55.5 0 13.4 0
Land, housing, Urban Develop-ment 60.62 183.29 14.02 0 6.44 0 45.9 0 10.6 0
Public Service Management 606.42 94.74 82.1 10 46.22 0 56.3 0 7.6 0
ICT & E-Government 22.23 89.25 4.95 25.58 2.2 4.67 44.4 18.3 9.9 5.2
County public service Board 45.36 3.73 10.29 3.73 2.87 0 27.9 0 6.3 0
County Assembly 502.45 64.65 134.56 0 73.56 0 54.7 0 14.6 0
Total 4,066.58 3,454.19 879.1 305.7 566.74 7.06 64.5 2.3 13.9 0.2
Source: Uasin Gishu County Treasury
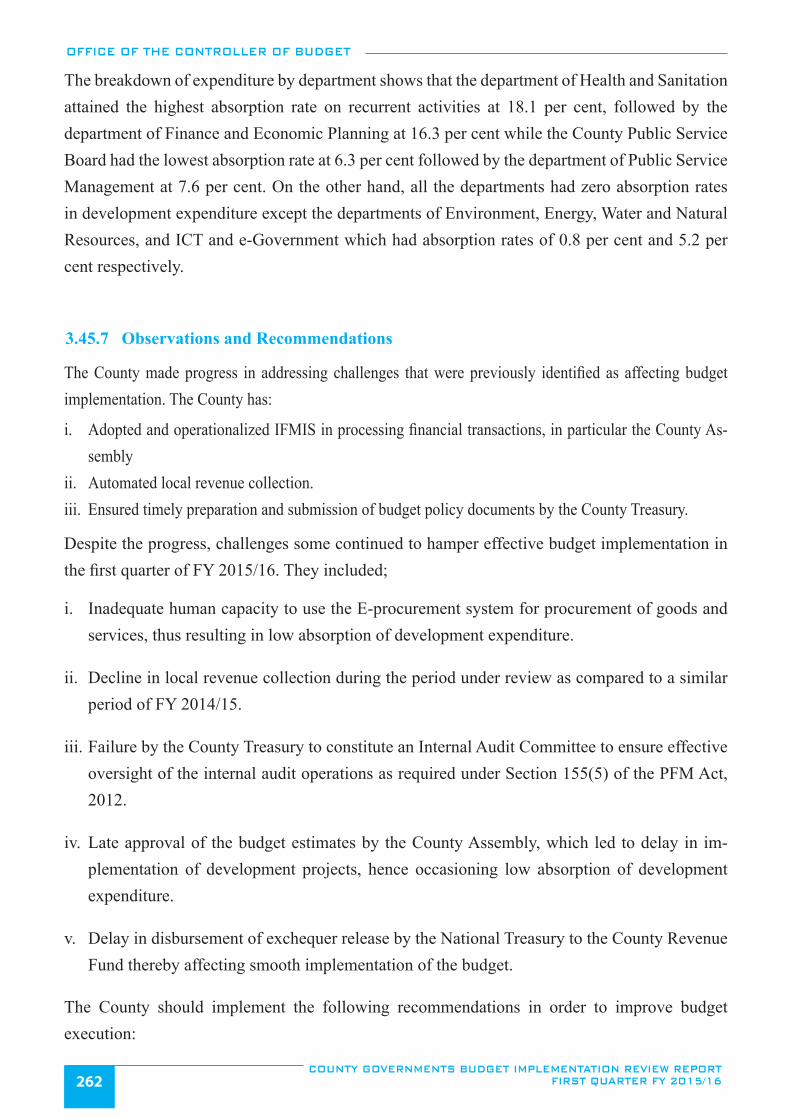
OFFICE OF THE CONTROLLER OF BUDGET
COUNTY GOVERNMENTS BUDGET IMPLEMENTATION REVIEW REPORT FIRST QUARTER FY 2015/16262
The breakdown of expenditure by department shows that the department of Health and Sanitation attained the highest absorption rate on recurrent activities at 18.1 per cent, followed by the department of Finance and Economic Planning at 16.3 per cent while the County Public Service Board had the lowest absorption rate at 6.3 per cent followed by the department of Public Service Management at 7.6 per cent. On the other hand, all the departments had zero absorption rates in development expenditure except the departments of Environment, Energy, Water and Natural Resources, and ICT and e-Government which had absorption rates of 0.8 per cent and 5.2 per cent respectively.
3.45.7 Observations and Recommendations
The County made progress in addressing challenges that were previously identified as affecting budget implementation. The County has:
i. Adopted and operationalized IFMIS in processing financial transactions, in particular the County As-sembly
ii. Automated local revenue collection.iii. Ensured timely preparation and submission of budget policy documents by the County Treasury.
Despite the progress, challenges some continued to hamper effective budget implementation in the first quarter of FY 2015/16. They included;
i. Inadequate human capacity to use the E-procurement system for procurement of goods and services, thus resulting in low absorption of development expenditure.
ii. Decline in local revenue collection during the period under review as compared to a similar period of FY 2014/15.
iii. Failure by the County Treasury to constitute an Internal Audit Committee to ensure effective oversight of the internal audit operations as required under Section 155(5) of the PFM Act, 2012.
iv. Late approval of the budget estimates by the County Assembly, which led to delay in im-plementation of development projects, hence occasioning low absorption of development expenditure.
v. Delay in disbursement of exchequer release by the National Treasury to the County Revenue Fund thereby affecting smooth implementation of the budget.
The County should implement the following recommendations in order to improve budget execution:
OFFICE OF THE CONTROLLER OF BUDGET
COUNTY GOVERNMENTS BUDGET IMPLEMENTATION REVIEW REPORT FIRST QUARTER FY 2015/16 263
i. The County should liaise with the National Treasury’s IFMIS department in building capacity of the county staff on e-procurement module of the IFMIS.
ii. The County should enforce strong internal controls and evaluate the various revenue streams for purposes of enhancing the local revenue collections.
iii. The County should promptly constitute an Internal Audit Committee to oversee operations of the internal audit department as required in Section 155(5) of the PFM Act, 2012.
iv. The County Assembly should ensure timely approval of the budget in line with Section 131(1) of the PFM Act 2012. This will in turn ensure timely budget implementation.
v. The County Treasury should liaise with the National Treasury to ensure disbursement of the equitable share to the County Revenue Fund in line with the approved disbursement schedule.
3.46 Vihiga County
3.46.1 Overview of the FY 2015/16 Budget
The Approved Budget for Vihiga County for FY 2015/16 amounts Kshs.4.49 billion, with Kshs.2.54 billion (56.6 per cent) allocated to recurrent expenditure and Kshs.1.95 billion (43.4 per cent) to development expenditure.
In order to finance the budget, the County expected to receive Kshs.3.77 billion (84.0 per cent) as equitable share from the National Government, collect Kshs.277.00 million (6.2 per cent) from local sources, receive a conditional grant of Kshs.417.83 million (9.3 per cent) from national government and Kshs.23.00 million (0.5) from DANIDA. However, the County did not budget for the additional conditional grants from the National Government of Kshs.130.75 million as contained in CARA, 2015.
3.46.2 Revenue Analysis
In the first quarter FY 2015/16, the County received Kshs.658.14 million from the National Government as a direct transfer to the CRF account, raised Kshs.34.89 million from local sources, and had Kshs.4.33 million brought forward from FY 2014/15. The local revenue raised in the first quarter of FY 2015/16 was Kshs.34.89 million which was an increase from Kshs.25.60 million collected in the similar period of FY 2014/15 and accounted for 12.6 per cent of the annual local revenue target. Figure 3.170 shows the trend of local revenue collection from FY 2013/14 to first quarter of FY 2014/15.
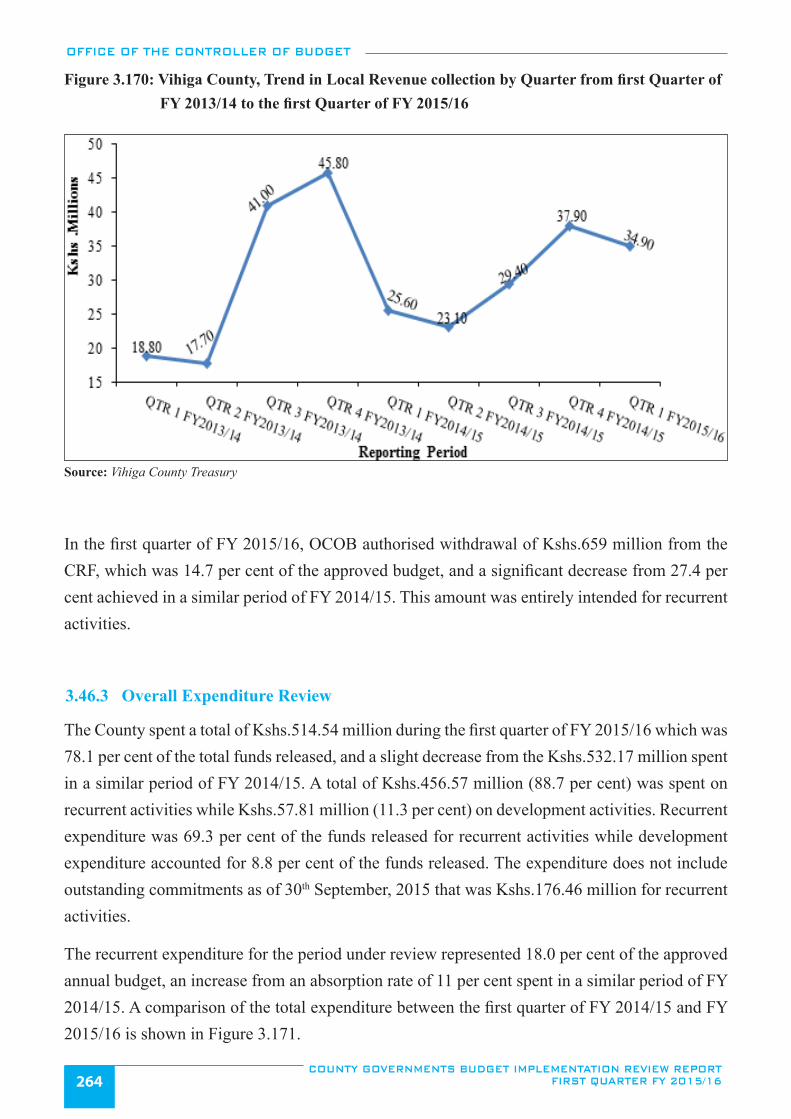
OFFICE OF THE CONTROLLER OF BUDGET
COUNTY GOVERNMENTS BUDGET IMPLEMENTATION REVIEW REPORT FIRST QUARTER FY 2015/16264
Figure 3.170: Vihiga County, Trend in Local Revenue collection by Quarter from first Quarter of FY 2013/14 to the first Quarter of FY 2015/16
Source: Vihiga County Treasury
In the first quarter of FY 2015/16, OCOB authorised withdrawal of Kshs.659 million from the CRF, which was 14.7 per cent of the approved budget, and a significant decrease from 27.4 per cent achieved in a similar period of FY 2014/15. This amount was entirely intended for recurrent activities.
3.46.3 Overall Expenditure Review
The County spent a total of Kshs.514.54 million during the first quarter of FY 2015/16 which was 78.1 per cent of the total funds released, and a slight decrease from the Kshs.532.17 million spent in a similar period of FY 2014/15. A total of Kshs.456.57 million (88.7 per cent) was spent on recurrent activities while Kshs.57.81 million (11.3 per cent) on development activities. Recurrent expenditure was 69.3 per cent of the funds released for recurrent activities while development expenditure accounted for 8.8 per cent of the funds released. The expenditure does not include outstanding commitments as of 30th September, 2015 that was Kshs.176.46 million for recurrent activities.
The recurrent expenditure for the period under review represented 18.0 per cent of the approved annual budget, an increase from an absorption rate of 11 per cent spent in a similar period of FY 2014/15. A comparison of the total expenditure between the first quarter of FY 2014/15 and FY 2015/16 is shown in Figure 3.171.
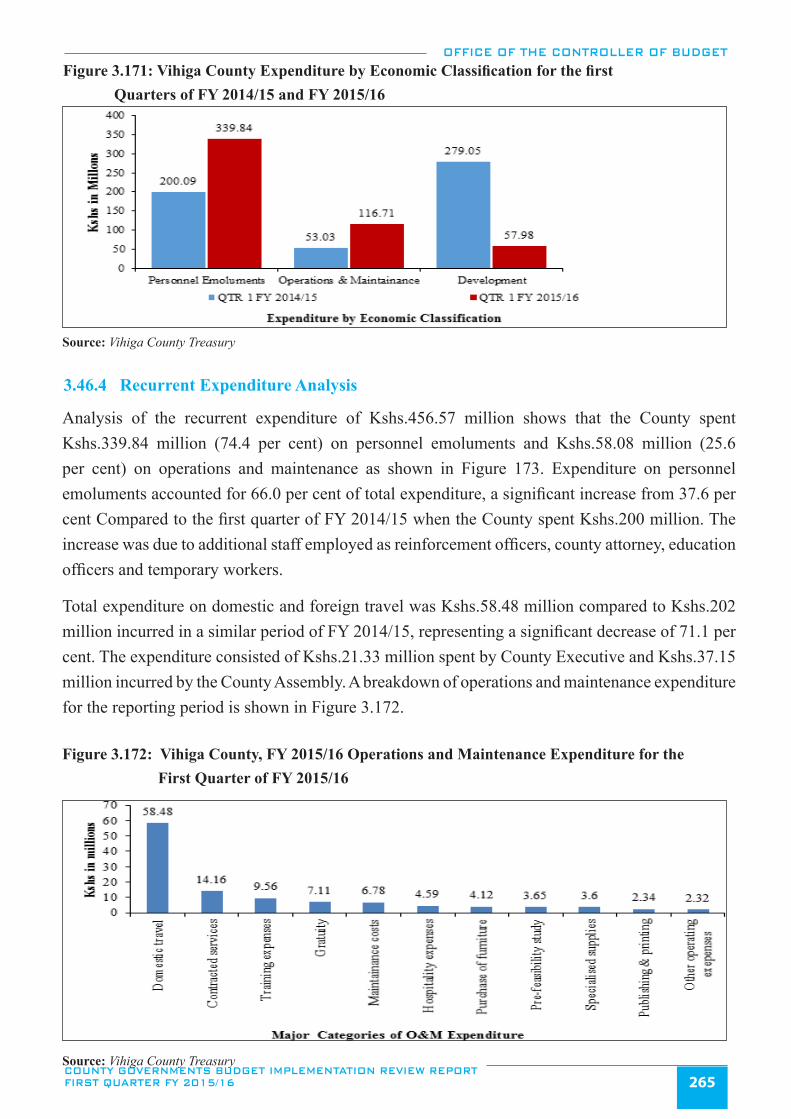
OFFICE OF THE CONTROLLER OF BUDGET
COUNTY GOVERNMENTS BUDGET IMPLEMENTATION REVIEW REPORT FIRST QUARTER FY 2015/16 265
Figure 3.171: Vihiga County Expenditure by Economic Classification for the first Quarters of FY 2014/15 and FY 2015/16
Source: Vihiga County Treasury
3.46.4 Recurrent Expenditure Analysis
Analysis of the recurrent expenditure of Kshs.456.57 million shows that the County spent Kshs.339.84 million (74.4 per cent) on personnel emoluments and Kshs.58.08 million (25.6 per cent) on operations and maintenance as shown in Figure 173. Expenditure on personnel emoluments accounted for 66.0 per cent of total expenditure, a significant increase from 37.6 per cent Compared to the first quarter of FY 2014/15 when the County spent Kshs.200 million. The increase was due to additional staff employed as reinforcement officers, county attorney, education officers and temporary workers.
Total expenditure on domestic and foreign travel was Kshs.58.48 million compared to Kshs.202 million incurred in a similar period of FY 2014/15, representing a significant decrease of 71.1 per cent. The expenditure consisted of Kshs.21.33 million spent by County Executive and Kshs.37.15 million incurred by the County Assembly. A breakdown of operations and maintenance expenditure for the reporting period is shown in Figure 3.172.
Figure 3.172: Vihiga County, FY 2015/16 Operations and Maintenance Expenditure for the First Quarter of FY 2015/16
Source: Vihiga County Treasury
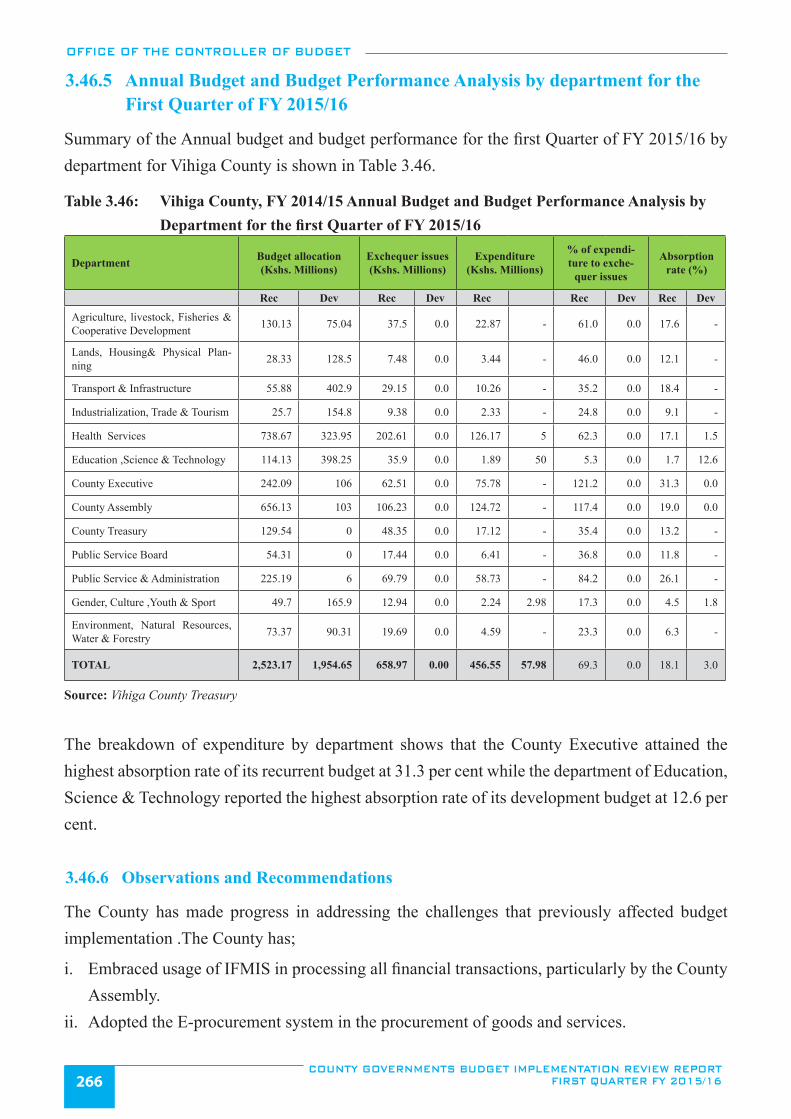
OFFICE OF THE CONTROLLER OF BUDGET
COUNTY GOVERNMENTS BUDGET IMPLEMENTATION REVIEW REPORT FIRST QUARTER FY 2015/16266
3.46.5 Annual Budget and Budget Performance Analysis by department for the First Quarter of FY 2015/16
Summary of the Annual budget and budget performance for the first Quarter of FY 2015/16 by department for Vihiga County is shown in Table 3.46.
Table 3.46: Vihiga County, FY 2014/15 Annual Budget and Budget Performance Analysis by Department for the first Quarter of FY 2015/16
Department Budget allocation (Kshs. Millions)
Exchequer issues (Kshs. Millions)
Expenditure (Kshs. Millions)
% of expendi-ture to exche-
quer issues
Absorption rate (%)
Rec Dev Rec Dev Rec Rec Dev Rec Dev
Agriculture, livestock, Fisheries & Cooperative Development 130.13 75.04 37.5 0.0 22.87 - 61.0 0.0 17.6 -
Lands, Housing& Physical Plan-ning 28.33 128.5 7.48 0.0 3.44 - 46.0 0.0 12.1 -
Transport & Infrastructure 55.88 402.9 29.15 0.0 10.26 - 35.2 0.0 18.4 -
Industrialization, Trade & Tourism 25.7 154.8 9.38 0.0 2.33 - 24.8 0.0 9.1 -
Health Services 738.67 323.95 202.61 0.0 126.17 5 62.3 0.0 17.1 1.5
Education ,Science & Technology 114.13 398.25 35.9 0.0 1.89 50 5.3 0.0 1.7 12.6
County Executive 242.09 106 62.51 0.0 75.78 - 121.2 0.0 31.3 0.0
County Assembly 656.13 103 106.23 0.0 124.72 - 117.4 0.0 19.0 0.0
County Treasury 129.54 0 48.35 0.0 17.12 - 35.4 0.0 13.2 -
Public Service Board 54.31 0 17.44 0.0 6.41 - 36.8 0.0 11.8 -
Public Service & Administration 225.19 6 69.79 0.0 58.73 - 84.2 0.0 26.1 -
Gender, Culture ,Youth & Sport 49.7 165.9 12.94 0.0 2.24 2.98 17.3 0.0 4.5 1.8
Environment, Natural Resources, Water & Forestry 73.37 90.31 19.69 0.0 4.59 - 23.3 0.0 6.3 -
TOTAL 2,523.17 1,954.65 658.97 0.00 456.55 57.98 69.3 0.0 18.1 3.0
Source: Vihiga County Treasury
The breakdown of expenditure by department shows that the County Executive attained the highest absorption rate of its recurrent budget at 31.3 per cent while the department of Education, Science & Technology reported the highest absorption rate of its development budget at 12.6 per cent.
3.46.6 Observations and Recommendations
The County has made progress in addressing the challenges that previously affected budget implementation .The County has;
i. Embraced usage of IFMIS in processing all financial transactions, particularly by the County Assembly.
ii. Adopted the E-procurement system in the procurement of goods and services.
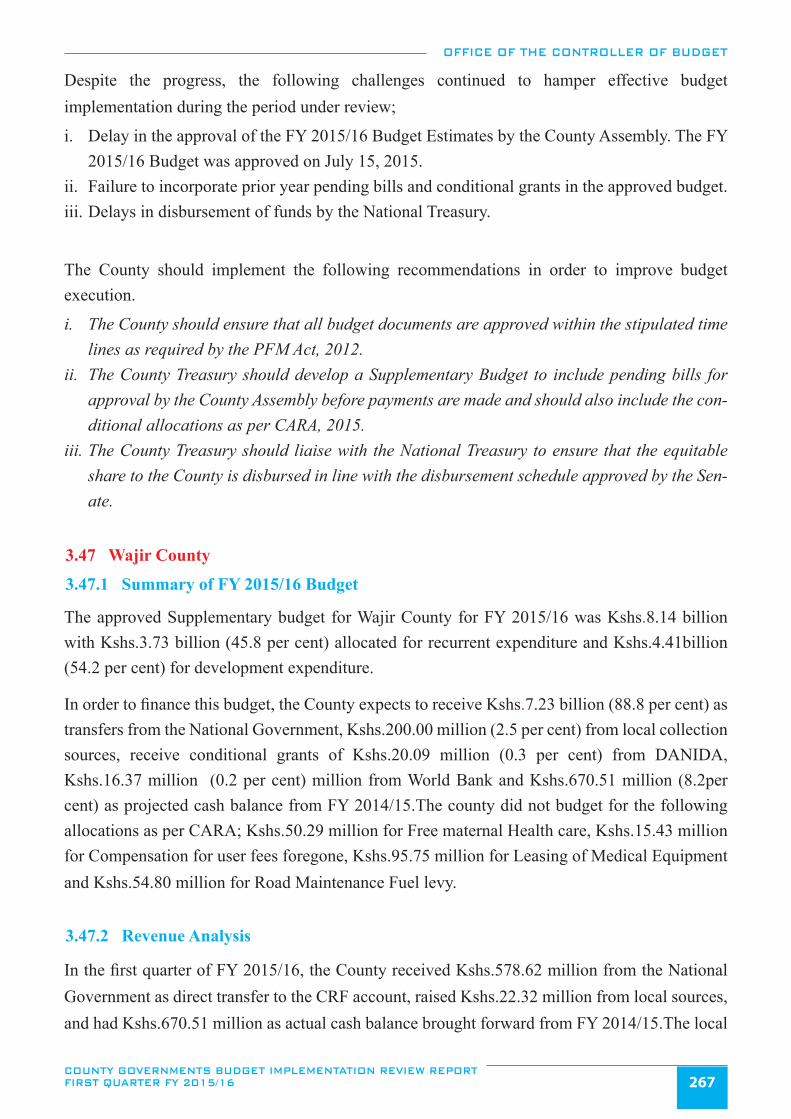
OFFICE OF THE CONTROLLER OF BUDGET
COUNTY GOVERNMENTS BUDGET IMPLEMENTATION REVIEW REPORT FIRST QUARTER FY 2015/16 267
Despite the progress, the following challenges continued to hamper effective budget implementation during the period under review;
i. Delay in the approval of the FY 2015/16 Budget Estimates by the County Assembly. The FY 2015/16 Budget was approved on July 15, 2015.
ii. Failure to incorporate prior year pending bills and conditional grants in the approved budget.iii. Delays in disbursement of funds by the National Treasury.
The County should implement the following recommendations in order to improve budget execution.
i. The County should ensure that all budget documents are approved within the stipulated time lines as required by the PFM Act, 2012.
ii. The County Treasury should develop a Supplementary Budget to include pending bills for approval by the County Assembly before payments are made and should also include the con-ditional allocations as per CARA, 2015.
iii. The County Treasury should liaise with the National Treasury to ensure that the equitable share to the County is disbursed in line with the disbursement schedule approved by the Sen-ate.
3.47 Wajir County
3.47.1 Summary of FY 2015/16 Budget
The approved Supplementary budget for Wajir County for FY 2015/16 was Kshs.8.14 billion with Kshs.3.73 billion (45.8 per cent) allocated for recurrent expenditure and Kshs.4.41billion (54.2 per cent) for development expenditure.
In order to finance this budget, the County expects to receive Kshs.7.23 billion (88.8 per cent) as transfers from the National Government, Kshs.200.00 million (2.5 per cent) from local collection sources, receive conditional grants of Kshs.20.09 million (0.3 per cent) from DANIDA, Kshs.16.37 million (0.2 per cent) million from World Bank and Kshs.670.51 million (8.2per cent) as projected cash balance from FY 2014/15.The county did not budget for the following allocations as per CARA; Kshs.50.29 million for Free maternal Health care, Kshs.15.43 million for Compensation for user fees foregone, Kshs.95.75 million for Leasing of Medical Equipment and Kshs.54.80 million for Road Maintenance Fuel levy.
3.47.2 Revenue Analysis
In the first quarter of FY 2015/16, the County received Kshs.578.62 million from the National Government as direct transfer to the CRF account, raised Kshs.22.32 million from local sources, and had Kshs.670.51 million as actual cash balance brought forward from FY 2014/15.The local
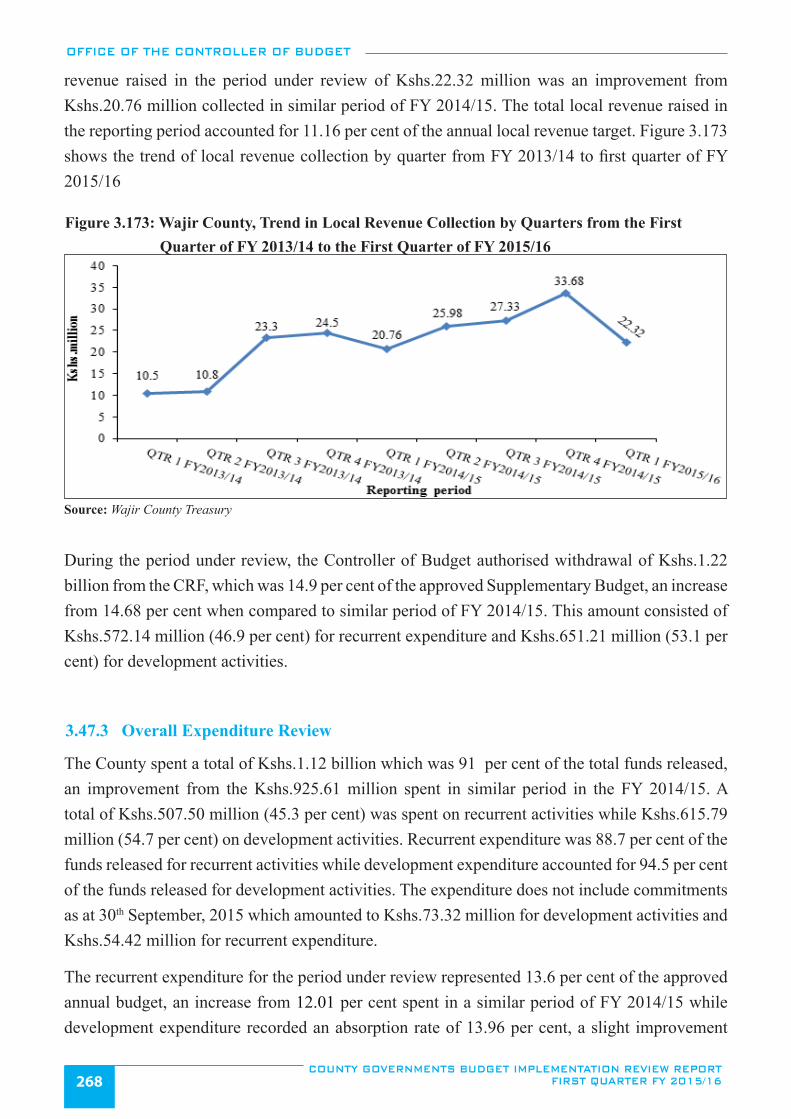
OFFICE OF THE CONTROLLER OF BUDGET
COUNTY GOVERNMENTS BUDGET IMPLEMENTATION REVIEW REPORT FIRST QUARTER FY 2015/16268
revenue raised in the period under review of Kshs.22.32 million was an improvement from Kshs.20.76 million collected in similar period of FY 2014/15. The total local revenue raised in the reporting period accounted for 11.16 per cent of the annual local revenue target. Figure 3.173 shows the trend of local revenue collection by quarter from FY 2013/14 to first quarter of FY 2015/16
Figure 3.173: Wajir County, Trend in Local Revenue Collection by Quarters from the First Quarter of FY 2013/14 to the First Quarter of FY 2015/16
Source: Wajir County Treasury
During the period under review, the Controller of Budget authorised withdrawal of Kshs.1.22 billion from the CRF, which was 14.9 per cent of the approved Supplementary Budget, an increase from 14.68 per cent when compared to similar period of FY 2014/15. This amount consisted of Kshs.572.14 million (46.9 per cent) for recurrent expenditure and Kshs.651.21 million (53.1 per cent) for development activities.
3.47.3 Overall Expenditure Review
The County spent a total of Kshs.1.12 billion which was 91 per cent of the total funds released, an improvement from the Kshs.925.61 million spent in similar period in the FY 2014/15. A total of Kshs.507.50 million (45.3 per cent) was spent on recurrent activities while Kshs.615.79 million (54.7 per cent) on development activities. Recurrent expenditure was 88.7 per cent of the funds released for recurrent activities while development expenditure accounted for 94.5 per cent of the funds released for development activities. The expenditure does not include commitments as at 30th September, 2015 which amounted to Kshs.73.32 million for development activities and Kshs.54.42 million for recurrent expenditure.
The recurrent expenditure for the period under review represented 13.6 per cent of the approved annual budget, an increase from 12.01 per cent spent in a similar period of FY 2014/15 while development expenditure recorded an absorption rate of 13.96 per cent, a slight improvement
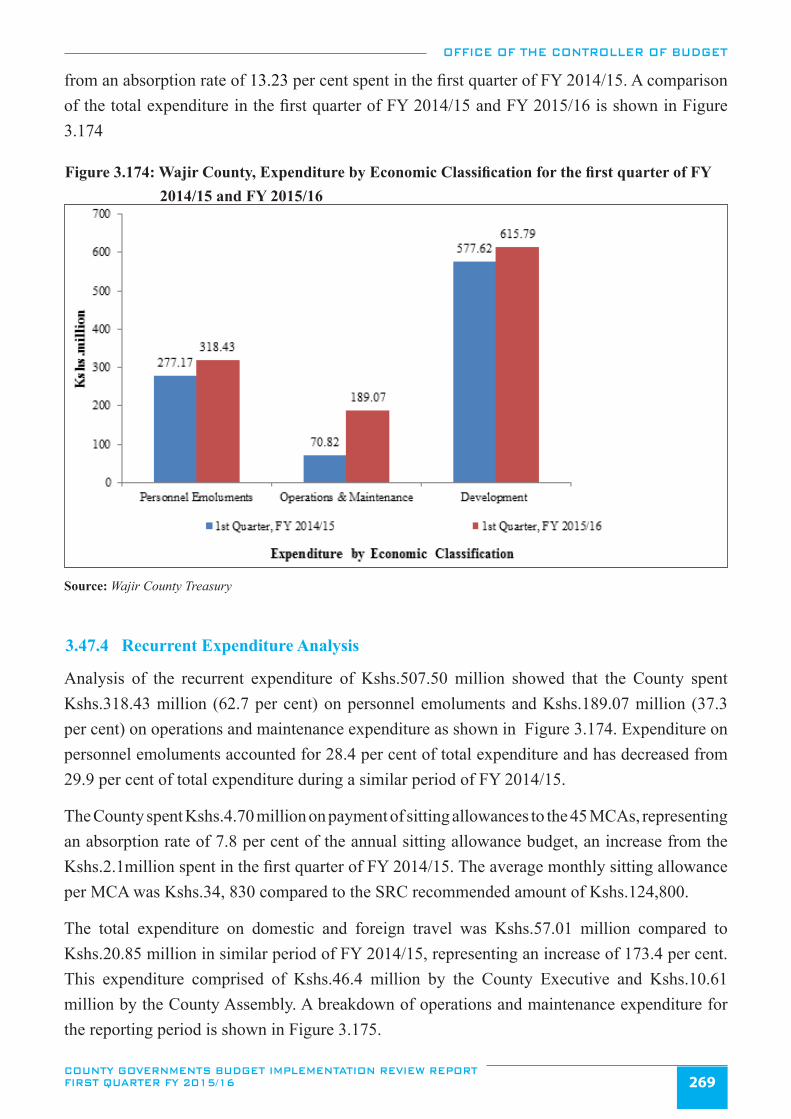
OFFICE OF THE CONTROLLER OF BUDGET
COUNTY GOVERNMENTS BUDGET IMPLEMENTATION REVIEW REPORT FIRST QUARTER FY 2015/16 269
from an absorption rate of 13.23 per cent spent in the first quarter of FY 2014/15. A comparison of the total expenditure in the first quarter of FY 2014/15 and FY 2015/16 is shown in Figure 3.174
Figure 3.174: Wajir County, Expenditure by Economic Classification for the first quarter of FY 2014/15 and FY 2015/16
Source: Wajir County Treasury
3.47.4 Recurrent Expenditure Analysis
Analysis of the recurrent expenditure of Kshs.507.50 million showed that the County spent Kshs.318.43 million (62.7 per cent) on personnel emoluments and Kshs.189.07 million (37.3 per cent) on operations and maintenance expenditure as shown in Figure 3.174. Expenditure on personnel emoluments accounted for 28.4 per cent of total expenditure and has decreased from 29.9 per cent of total expenditure during a similar period of FY 2014/15.
The County spent Kshs.4.70 million on payment of sitting allowances to the 45 MCAs, representing an absorption rate of 7.8 per cent of the annual sitting allowance budget, an increase from the Kshs.2.1million spent in the first quarter of FY 2014/15. The average monthly sitting allowance per MCA was Kshs.34, 830 compared to the SRC recommended amount of Kshs.124,800.
The total expenditure on domestic and foreign travel was Kshs.57.01 million compared to Kshs.20.85 million in similar period of FY 2014/15, representing an increase of 173.4 per cent. This expenditure comprised of Kshs.46.4 million by the County Executive and Kshs.10.61 million by the County Assembly. A breakdown of operations and maintenance expenditure for the reporting period is shown in Figure 3.175.
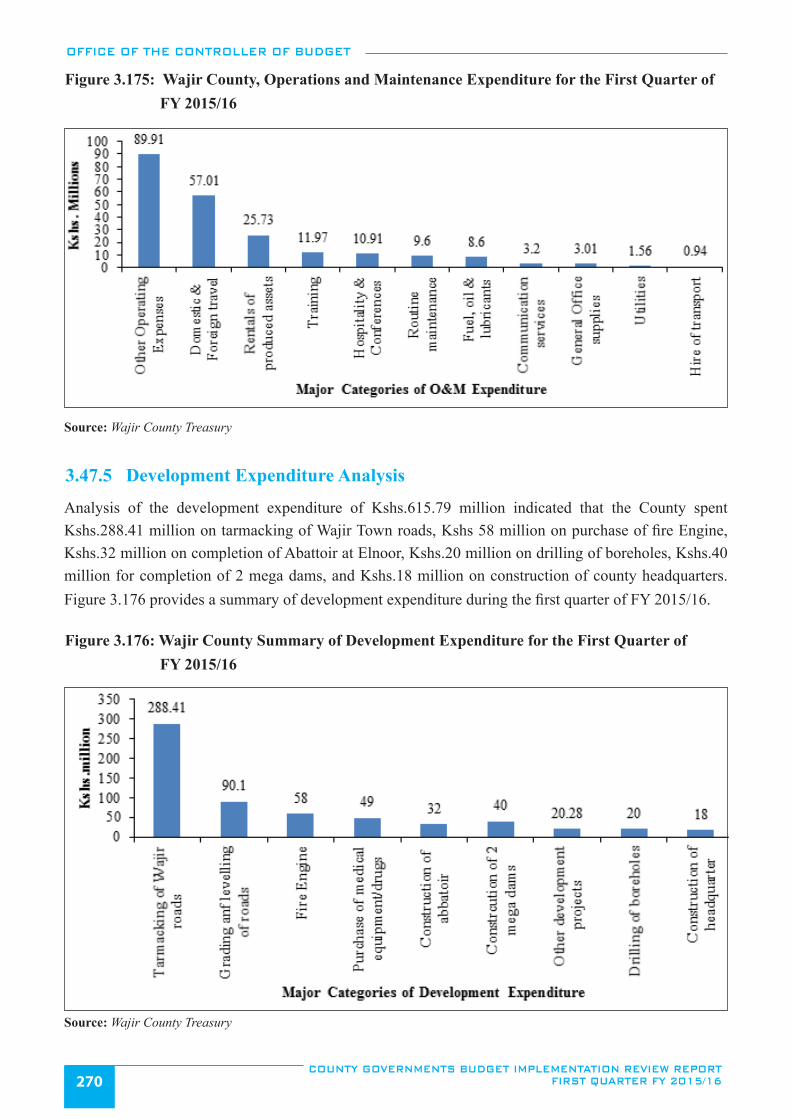
OFFICE OF THE CONTROLLER OF BUDGET
COUNTY GOVERNMENTS BUDGET IMPLEMENTATION REVIEW REPORT FIRST QUARTER FY 2015/16270
Figure 3.175: Wajir County, Operations and Maintenance Expenditure for the First Quarter of FY 2015/16
Source: Wajir County Treasury
3.47.5 Development Expenditure Analysis
Analysis of the development expenditure of Kshs.615.79 million indicated that the County spent Kshs.288.41 million on tarmacking of Wajir Town roads, Kshs 58 million on purchase of fire Engine, Kshs.32 million on completion of Abattoir at Elnoor, Kshs.20 million on drilling of boreholes, Kshs.40 million for completion of 2 mega dams, and Kshs.18 million on construction of county headquarters. Figure 3.176 provides a summary of development expenditure during the first quarter of FY 2015/16.
Figure 3.176: Wajir County Summary of Development Expenditure for the First Quarter of FY 2015/16
Source: Wajir County Treasury
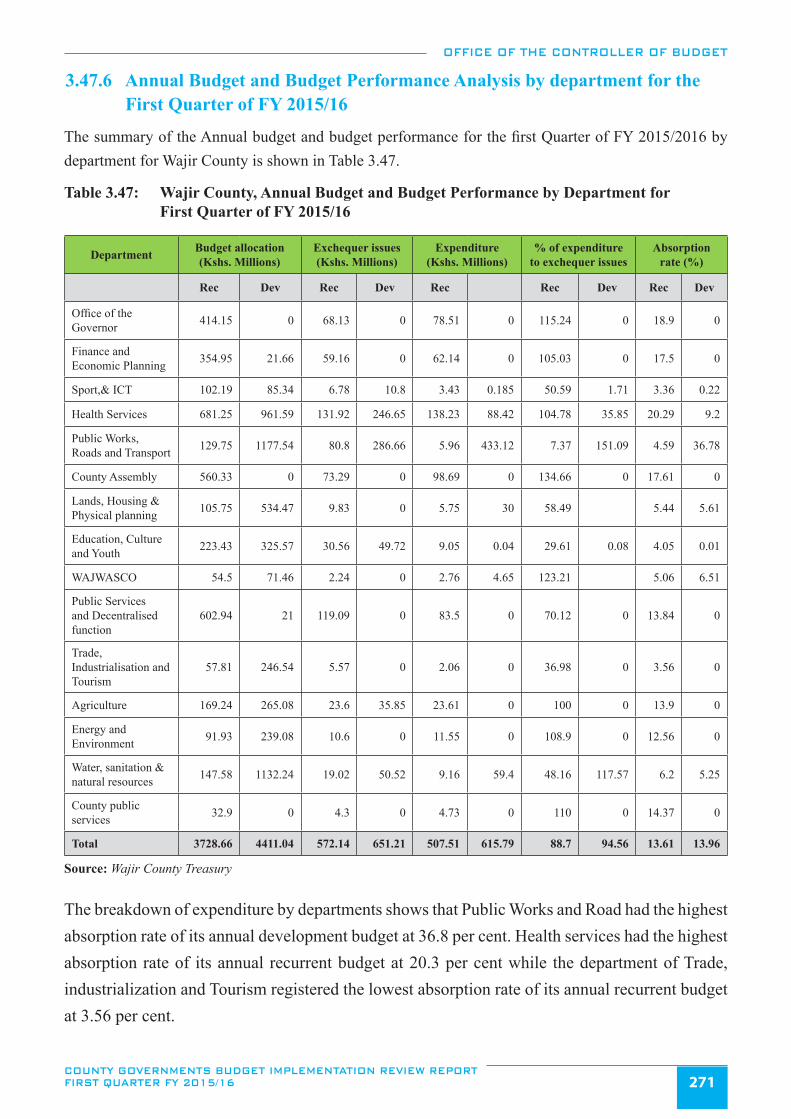
OFFICE OF THE CONTROLLER OF BUDGET
COUNTY GOVERNMENTS BUDGET IMPLEMENTATION REVIEW REPORT FIRST QUARTER FY 2015/16 271
3.47.6 Annual Budget and Budget Performance Analysis by department for the First Quarter of FY 2015/16
The summary of the Annual budget and budget performance for the first Quarter of FY 2015/2016 by department for Wajir County is shown in Table 3.47.
Source: Wajir County Treasury
The breakdown of expenditure by departments shows that Public Works and Road had the highest absorption rate of its annual development budget at 36.8 per cent. Health services had the highest absorption rate of its annual recurrent budget at 20.3 per cent while the department of Trade, industrialization and Tourism registered the lowest absorption rate of its annual recurrent budget at 3.56 per cent.
Table 3.47: Wajir County, Annual Budget and Budget Performance by Department for First Quarter of FY 2015/16
Department Budget allocation (Kshs. Millions)
Exchequer issues (Kshs. Millions)
Expenditure (Kshs. Millions)
% of expenditure to exchequer issues
Absorption rate (%)
Rec Dev Rec Dev Rec Rec Dev Rec Dev
Office of the Governor 414.15 0 68.13 0 78.51 0 115.24 0 18.9 0
Finance and Economic Planning 354.95 21.66 59.16 0 62.14 0 105.03 0 17.5 0
Sport,& ICT 102.19 85.34 6.78 10.8 3.43 0.185 50.59 1.71 3.36 0.22
Health Services 681.25 961.59 131.92 246.65 138.23 88.42 104.78 35.85 20.29 9.2
Public Works, Roads and Transport 129.75 1177.54 80.8 286.66 5.96 433.12 7.37 151.09 4.59 36.78
County Assembly 560.33 0 73.29 0 98.69 0 134.66 0 17.61 0
Lands, Housing & Physical planning 105.75 534.47 9.83 0 5.75 30 58.49 5.44 5.61
Education, Culture and Youth 223.43 325.57 30.56 49.72 9.05 0.04 29.61 0.08 4.05 0.01
WAJWASCO 54.5 71.46 2.24 0 2.76 4.65 123.21 5.06 6.51
Public Services and Decentralised function
602.94 21 119.09 0 83.5 0 70.12 0 13.84 0
Trade, Industrialisation and Tourism
57.81 246.54 5.57 0 2.06 0 36.98 0 3.56 0
Agriculture 169.24 265.08 23.6 35.85 23.61 0 100 0 13.9 0
Energy and Environment 91.93 239.08 10.6 0 11.55 0 108.9 0 12.56 0
Water, sanitation & natural resources 147.58 1132.24 19.02 50.52 9.16 59.4 48.16 117.57 6.2 5.25
County public services 32.9 0 4.3 0 4.73 0 110 0 14.37 0
Total 3728.66 4411.04 572.14 651.21 507.51 615.79 88.7 94.56 13.61 13.96
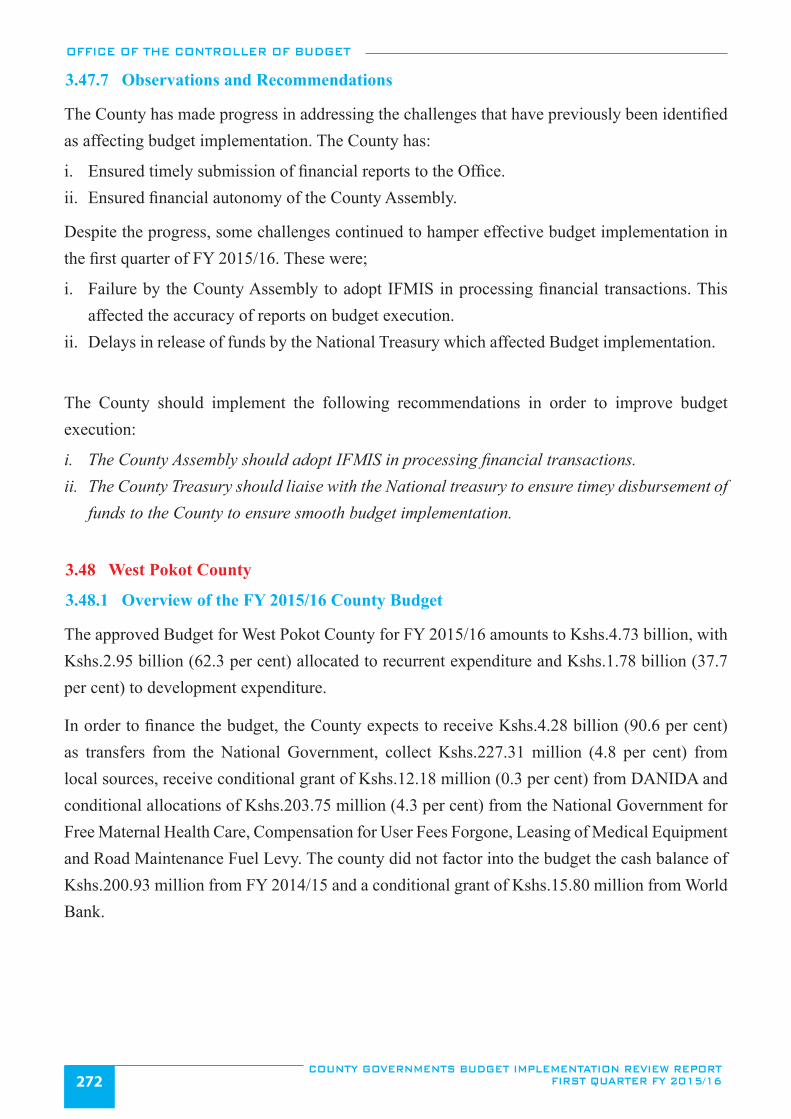
OFFICE OF THE CONTROLLER OF BUDGET
COUNTY GOVERNMENTS BUDGET IMPLEMENTATION REVIEW REPORT FIRST QUARTER FY 2015/16272
3.47.7 Observations and Recommendations
The County has made progress in addressing the challenges that have previously been identified as affecting budget implementation. The County has:
i. Ensured timely submission of financial reports to the Office.ii. Ensured financial autonomy of the County Assembly.
Despite the progress, some challenges continued to hamper effective budget implementation in the first quarter of FY 2015/16. These were;
i. Failure by the County Assembly to adopt IFMIS in processing financial transactions. This affected the accuracy of reports on budget execution.
ii. Delays in release of funds by the National Treasury which affected Budget implementation.
The County should implement the following recommendations in order to improve budget execution:
i. The County Assembly should adopt IFMIS in processing financial transactions. ii. The County Treasury should liaise with the National treasury to ensure timey disbursement of
funds to the County to ensure smooth budget implementation.
3.48 West Pokot County
3.48.1 Overview of the FY 2015/16 County Budget
The approved Budget for West Pokot County for FY 2015/16 amounts to Kshs.4.73 billion, with Kshs.2.95 billion (62.3 per cent) allocated to recurrent expenditure and Kshs.1.78 billion (37.7 per cent) to development expenditure.
In order to finance the budget, the County expects to receive Kshs.4.28 billion (90.6 per cent) as transfers from the National Government, collect Kshs.227.31 million (4.8 per cent) from local sources, receive conditional grant of Kshs.12.18 million (0.3 per cent) from DANIDA and conditional allocations of Kshs.203.75 million (4.3 per cent) from the National Government for Free Maternal Health Care, Compensation for User Fees Forgone, Leasing of Medical Equipment and Road Maintenance Fuel Levy. The county did not factor into the budget the cash balance of Kshs.200.93 million from FY 2014/15 and a conditional grant of Kshs.15.80 million from World Bank.
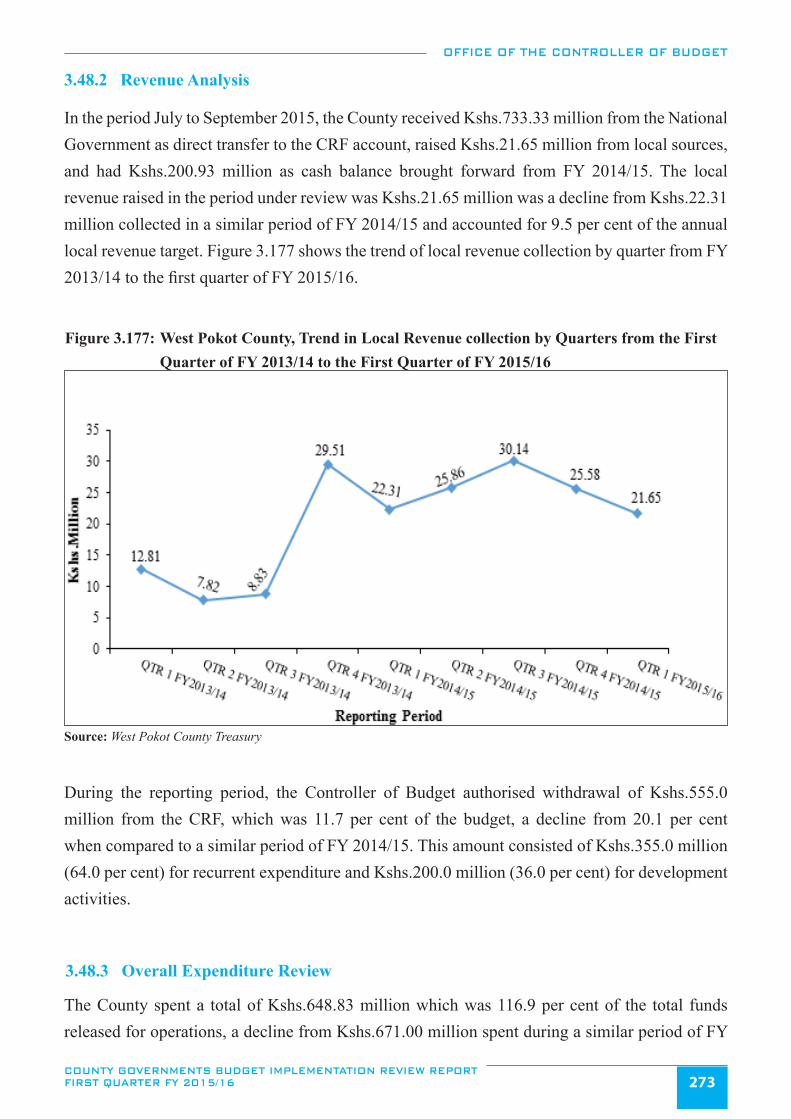
OFFICE OF THE CONTROLLER OF BUDGET
COUNTY GOVERNMENTS BUDGET IMPLEMENTATION REVIEW REPORT FIRST QUARTER FY 2015/16 273
3.48.2 Revenue Analysis
In the period July to September 2015, the County received Kshs.733.33 million from the National Government as direct transfer to the CRF account, raised Kshs.21.65 million from local sources, and had Kshs.200.93 million as cash balance brought forward from FY 2014/15. The local revenue raised in the period under review was Kshs.21.65 million was a decline from Kshs.22.31 million collected in a similar period of FY 2014/15 and accounted for 9.5 per cent of the annual local revenue target. Figure 3.177 shows the trend of local revenue collection by quarter from FY 2013/14 to the first quarter of FY 2015/16.
Figure 3.177: West Pokot County, Trend in Local Revenue collection by Quarters from the First Quarter of FY 2013/14 to the First Quarter of FY 2015/16
Source: West Pokot County Treasury
During the reporting period, the Controller of Budget authorised withdrawal of Kshs.555.0 million from the CRF, which was 11.7 per cent of the budget, a decline from 20.1 per cent when compared to a similar period of FY 2014/15. This amount consisted of Kshs.355.0 million (64.0 per cent) for recurrent expenditure and Kshs.200.0 million (36.0 per cent) for development activities.
3.48.3 Overall Expenditure Review
The County spent a total of Kshs.648.83 million which was 116.9 per cent of the total funds released for operations, a decline from Kshs.671.00 million spent during a similar period of FY
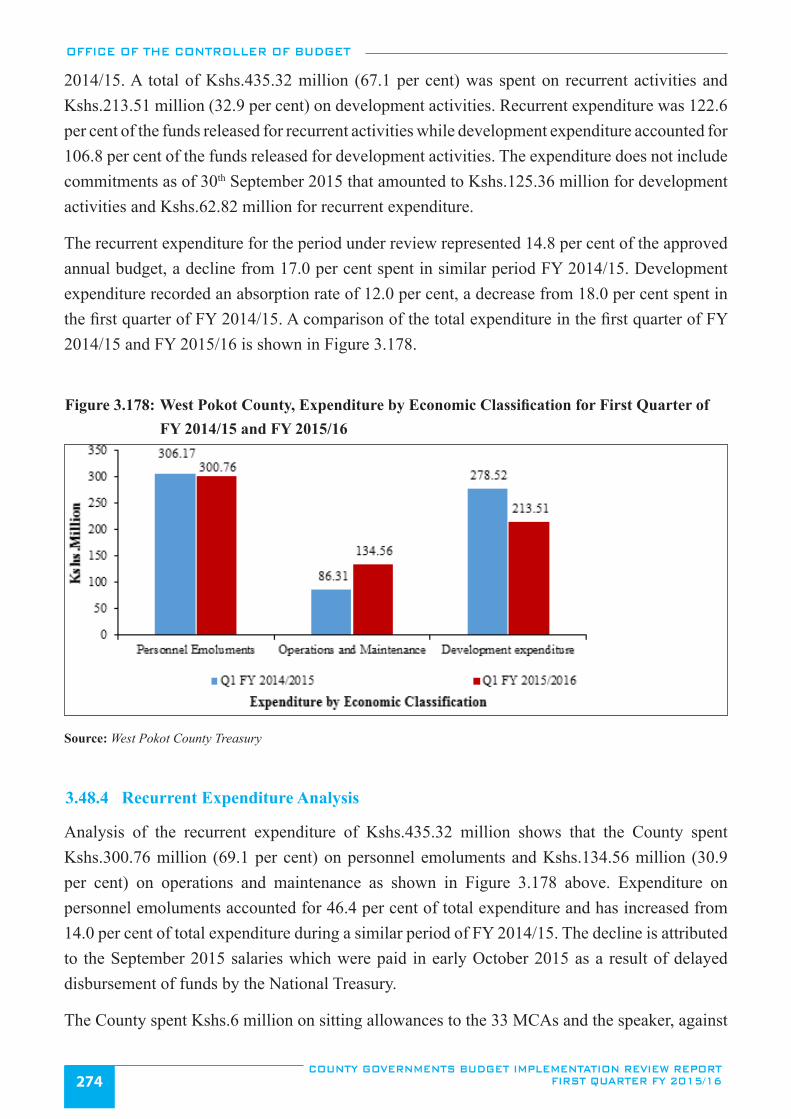
OFFICE OF THE CONTROLLER OF BUDGET
COUNTY GOVERNMENTS BUDGET IMPLEMENTATION REVIEW REPORT FIRST QUARTER FY 2015/16274
2014/15. A total of Kshs.435.32 million (67.1 per cent) was spent on recurrent activities and Kshs.213.51 million (32.9 per cent) on development activities. Recurrent expenditure was 122.6 per cent of the funds released for recurrent activities while development expenditure accounted for 106.8 per cent of the funds released for development activities. The expenditure does not include commitments as of 30th September 2015 that amounted to Kshs.125.36 million for development activities and Kshs.62.82 million for recurrent expenditure.
The recurrent expenditure for the period under review represented 14.8 per cent of the approved annual budget, a decline from 17.0 per cent spent in similar period FY 2014/15. Development expenditure recorded an absorption rate of 12.0 per cent, a decrease from 18.0 per cent spent in the first quarter of FY 2014/15. A comparison of the total expenditure in the first quarter of FY 2014/15 and FY 2015/16 is shown in Figure 3.178.
Figure 3.178: West Pokot County, Expenditure by Economic Classification for First Quarter of FY 2014/15 and FY 2015/16
Source: West Pokot County Treasury
3.48.4 Recurrent Expenditure Analysis
Analysis of the recurrent expenditure of Kshs.435.32 million shows that the County spent Kshs.300.76 million (69.1 per cent) on personnel emoluments and Kshs.134.56 million (30.9 per cent) on operations and maintenance as shown in Figure 3.178 above. Expenditure on personnel emoluments accounted for 46.4 per cent of total expenditure and has increased from 14.0 per cent of total expenditure during a similar period of FY 2014/15. The decline is attributed to the September 2015 salaries which were paid in early October 2015 as a result of delayed disbursement of funds by the National Treasury.
The County spent Kshs.6 million on sitting allowances to the 33 MCAs and the speaker, against
OFFICE OF THE CONTROLLER OF BUDGET
COUNTY GOVERNMENTS BUDGET IMPLEMENTATION REVIEW REPORT FIRST QUARTER FY 2015/16 275
an annual sitting allowance budget of 54.29 million, an increase from Kshs.5.52 million spent in the first quarter of FY 2014/15. The average monthly sitting allowance per MCA was Kshs.60,606 compared to the SRC recommended amount of Kshs.124,800.
The total expenditure on domestic and foreign travel was Kshs.42.60 million compared to Kshs.28.12 million in a similar period of FY 2014/15, representing an increase of 51.5 per cent. This expenditure comprised of Kshs.40.01 million spent by the County Executive and Kshs.2.59 million by the County Assembly. A breakdown of operations and maintenance expenditure for the reporting period is shown in Figure 3.179.
Figure 3.179: West Pokot County, Operations and Maintenance Expenditure for the First Quarter of FY 2015/16
Source: West Pokot County Treasury
3.47.5 Development Expenditure Analysis
Analysis of the development expenditure of Kshs.213.51 million in the period under review indicates that construction of residential buildings had the highest expenditure at Kshs.99.56 million. Residential buildings include completion of construction of Doctors flats – 12 units at Kapenguria Referral Hospital, completion of construction of staff houses at various dispensaries, construction of several cattle dips, completion of construction of ICU and Casualty Wing at Kapenguria County Referral Hospital. The second highest expenditure was on construction of other infrastructure at Kshs.57.07 million which includes the completion of construction of County Treasury offices, completion of construction of County Lands offices, construction of market stalls at Bendera, construction of market shades and stalls at Makutano and Mnagei, construction of Lomut Mango Store, construction of Kenyao Fresh produce market among others Refurbishment of non-residential buildings had the least expenditure at Kshs.0.82 million as shown in Figure 3.180 .
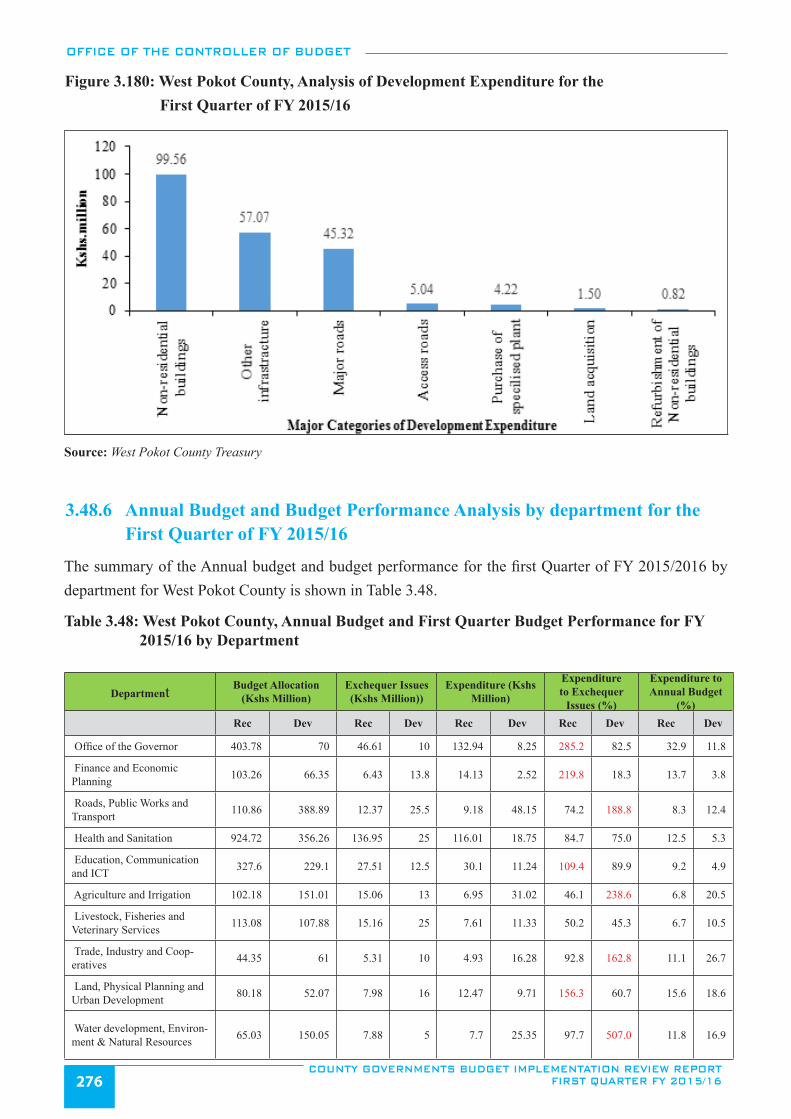
OFFICE OF THE CONTROLLER OF BUDGET
COUNTY GOVERNMENTS BUDGET IMPLEMENTATION REVIEW REPORT FIRST QUARTER FY 2015/16276
Figure 3.180: West Pokot County, Analysis of Development Expenditure for the First Quarter of FY 2015/16
Source: West Pokot County Treasury
3.48.6 Annual Budget and Budget Performance Analysis by department for the First Quarter of FY 2015/16
The summary of the Annual budget and budget performance for the first Quarter of FY 2015/2016 by department for West Pokot County is shown in Table 3.48.
Table 3.48: West Pokot County, Annual Budget and First Quarter Budget Performance for FY 2015/16 by Department
Department Budget Allocation (Kshs Million)
Exchequer Issues (Kshs Million))
Expenditure (Kshs Million)
Expenditure to Exchequer
Issues (%)
Expenditure to Annual Budget
(%)Rec Dev Rec Dev Rec Dev Rec Dev Rec Dev
Office of the Governor 403.78 70 46.61 10 132.94 8.25 285.2 82.5 32.9 11.8
Finance and Economic Planning 103.26 66.35 6.43 13.8 14.13 2.52 219.8 18.3 13.7 3.8
Roads, Public Works and Transport 110.86 388.89 12.37 25.5 9.18 48.15 74.2 188.8 8.3 12.4
Health and Sanitation 924.72 356.26 136.95 25 116.01 18.75 84.7 75.0 12.5 5.3
Education, Communication and ICT 327.6 229.1 27.51 12.5 30.1 11.24 109.4 89.9 9.2 4.9
Agriculture and Irrigation 102.18 151.01 15.06 13 6.95 31.02 46.1 238.6 6.8 20.5
Livestock, Fisheries and Veterinary Services 113.08 107.88 15.16 25 7.61 11.33 50.2 45.3 6.7 10.5
Trade, Industry and Coop-eratives 44.35 61 5.31 10 4.93 16.28 92.8 162.8 11.1 26.7
Land, Physical Planning and Urban Development 80.18 52.07 7.98 16 12.47 9.71 156.3 60.7 15.6 18.6
Water development, Environ-ment & Natural Resources 65.03 150.05 7.88 5 7.7 25.35 97.7 507.0 11.8 16.9
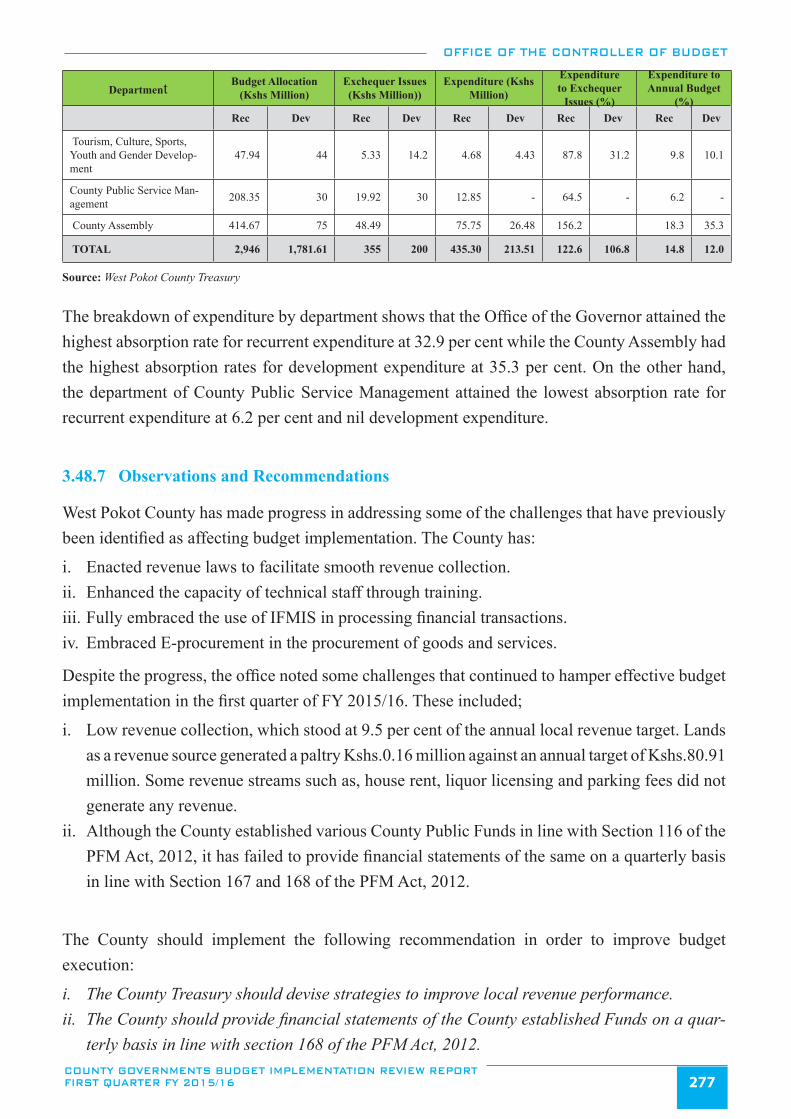
OFFICE OF THE CONTROLLER OF BUDGET
COUNTY GOVERNMENTS BUDGET IMPLEMENTATION REVIEW REPORT FIRST QUARTER FY 2015/16 277
Department Budget Allocation (Kshs Million)
Exchequer Issues (Kshs Million))
Expenditure (Kshs Million)
Expenditure to Exchequer
Issues (%)
Expenditure to Annual Budget
(%)Rec Dev Rec Dev Rec Dev Rec Dev Rec Dev
Tourism, Culture, Sports, Youth and Gender Develop-ment
47.94 44 5.33 14.2 4.68 4.43 87.8 31.2 9.8 10.1
County Public Service Man-agement 208.35 30 19.92 30 12.85 - 64.5 - 6.2 -
County Assembly 414.67 75 48.49 75.75 26.48 156.2 18.3 35.3
TOTAL 2,946 1,781.61 355 200 435.30 213.51 122.6 106.8 14.8 12.0
Source: West Pokot County Treasury
The breakdown of expenditure by department shows that the Office of the Governor attained the highest absorption rate for recurrent expenditure at 32.9 per cent while the County Assembly had the highest absorption rates for development expenditure at 35.3 per cent. On the other hand, the department of County Public Service Management attained the lowest absorption rate for recurrent expenditure at 6.2 per cent and nil development expenditure.
3.48.7 Observations and Recommendations
West Pokot County has made progress in addressing some of the challenges that have previously been identified as affecting budget implementation. The County has:
i. Enacted revenue laws to facilitate smooth revenue collection.ii. Enhanced the capacity of technical staff through training. iii. Fully embraced the use of IFMIS in processing financial transactions.iv. Embraced E-procurement in the procurement of goods and services.
Despite the progress, the office noted some challenges that continued to hamper effective budget implementation in the first quarter of FY 2015/16. These included;
i. Low revenue collection, which stood at 9.5 per cent of the annual local revenue target. Lands as a revenue source generated a paltry Kshs.0.16 million against an annual target of Kshs.80.91 million. Some revenue streams such as, house rent, liquor licensing and parking fees did not generate any revenue.
ii. Although the County established various County Public Funds in line with Section 116 of the PFM Act, 2012, it has failed to provide financial statements of the same on a quarterly basis in line with Section 167 and 168 of the PFM Act, 2012.
The County should implement the following recommendation in order to improve budget execution:
i. The County Treasury should devise strategies to improve local revenue performance.ii. The County should provide financial statements of the County established Funds on a quar-
terly basis in line with section 168 of the PFM Act, 2012.
OFFICE OF THE CONTROLLER OF BUDGET
COUNTY GOVERNMENTS BUDGET IMPLEMENTATION REVIEW REPORT FIRST QUARTER FY 2015/16278
4.0 KEY CHALLENGES, RECOMMENDATIONS AND CONCLUSIONS
4.1 Introduction
During the first quarter of FY 2015/16, budget implementation by the counties faced a number of challenges. This chapter highlights the key challenges that affected budget implementation. Recommendations aimed at addressing the issues and ultimately improving budget implementation by the County Governments in the future, and the conclusions of the budget implementation review report are also presented in this chapter.
4.2 Key Challenges and Recommendations
4.2.1 Capacity challenges in the use of the IFMIS E-procurement module
Section 12(1) (e) of the PFM Act, 2012 requires the National Treasury to design and prescribe an efficient financial management system for the National and County governments to ensure transparent financial management and standard financial reporting. Accordingly, the National Treasury has prescribed IFMIS as the financial management system. The system contains a number of modules that perform various financial processes such as budgeting, and procurement, which have already been rolled out. In order to enhance transparency in public procurement, the E-procurement module was rolled out at the beginning of FY 2015/16.
During the reporting period, the office observed inadequate staff capacity to use the E-Procurement module which affected uptake of development funds.
In order to improve absorption of development funds, the Office recommends that the IFMIS Directorate should liaise with County governments to evaluate the capacity of users of the E-Procurement module. This should be followed by a training program to build the capacity of the Procurement Officers.
4.2.2 High expenditure on Personnel Emoluments
In the period under review, the Counties spent an aggregate of Kshs.25.17 billion on personnel emoluments (PE), which represents an 11 per cent increase from Kshs.22.67 billion spent in a similar period of FY 2014/15. The personnel emoluments account for 56.2 per cent of the total expenditure for the reporting period. Further, this expenditure would have been higher than reported had all counties including Homa Bay, Kericho, Laikipia, Murang’a and Nairobi City County paid their September salaries in the period under review.
There is need to ensure that expenditure on personnel emoluments is contained at sustainable levels. The County governments should liaise with the National Government to devise strategies that will effectively address this challenge.
OFFICE OF THE CONTROLLER OF BUDGET
COUNTY GOVERNMENTS BUDGET IMPLEMENTATION REVIEW REPORT FIRST QUARTER FY 2015/16 279
4.2.3 Delay in disbursement of funds by the National Treasury
In the first quarter of FY 2015/16, the National Treasury disbursed a total of Kshs.31.39 billion to the Counties compared to Kshs.68.32 billion that was due for disbursement based on the County Allocation of Revenue Act, 2015 and the disbursement schedule approved by the Senate. The disbursed amount was 45.9 per cent of the amount that was due for disbursement during the period, and implies that Counties were underfunded.
Section (4)(2) of the County Allocation of Revenue Act, 2015 requires that county government allo-cations be transferred to the respective county Revenue Fund in accordance with a payment schedule approved by the Senate and published in the Gazette by the Cabinet Secretary in charge of the National Treasury. The approved schedule requires requires the National Government to disburse funds to County Governments not later than the fifteenth day of each month.
It is therefore recommended that the national shareable revenue be disbursed on a timely basis to ensure budget implementation is not adversely affected. The release should be in line with the disbursement schedule approved by the Senate in order to guarantee timely implementation of planned activities.
4.2.4 Inadequate Administration and Reporting on Public Funds Established by the Counties
Section 116 of the PFM, Act, 2012 provides for the establishment of County Public Funds. Each Fund should be managed by an administrator, who should submit quarterly financial reports to the County Treasury and the Controller of Budget in line with Section 168 of the PFM Act, 2012.
During the reporting period, the office noted that some counties had not designated administrators for es-tablished public funds rendering operationalization, administration and accounting for the funds difficult. Besides, some counties had not delinked Fund operations from their main county operations.
It is recommended that all established county public funds be managed by a designated administrator who should prepare quarterly financial reports in line with Section 168 of the PFM Act, 2012.
4.2.5 Failure to Constitute Internal Audit Committees
Section 155 of the PFM Act, 2012 requires that each County Government establishes an internal audit arrangement including the establishment of an internal audit committee. This is intended to enhance transparency and accountability in the management of public resources.
The Office has observed that, while the Counties have established internal audit units, they are yet to constitute internal audit committees to enhance management controls. The OCOB is concerned that this issue has not been addressed despite being raised in previous reports.
It is recommended that all Counties should establish effective Internal Audit Committees. In addition, the National Treasury should assist to build the technical capacity of the Internal Audit departments and
OFFICE OF THE CONTROLLER OF BUDGET
COUNTY GOVERNMENTS BUDGET IMPLEMENTATION REVIEW REPORT FIRST QUARTER FY 2015/16280
Internal Audit Committees.
4.2.6 Inclusion of Conditional Transfers from the National Government in the Approved Budgets
Article 202 (2) of the Constitution provides that County governments may be given additional alloca-tions from the National Government’s share of revenue either conditionally or unconditionally. In the County Allocation of Revenue Act, 2015, the National government included conditional allocation to-taling Khs.10.67 billion. This allocation becomes available to the counties upon inclusion in the County Appropriation Act.
The CARA, 2015 was approved in July 2015. This meant the Counties were not aware of the conditional allocations at the time of passing their budgets in June 2015. Nonetheless, Counties cannot access the grants unless these are included in the budgets and approved by the County Assemblies. We therefore, recommend that the Counties should develop Supplementary Budgets to include the conditional alloca-tions contained in the CARA, 2015.
4.2.7 Persistent Use of Locally Generated Revenue at Source
Article 209(3) of the Constitution grants powers to County governments to impose taxes and charges. These include; property rates, entertainment taxes and any other tax that is authorized by an Act of Par-liament. The County governments are required by Article 207 of the Constitution to deposit all money raised or received by or on behalf of the county government into the County Revenue Fund except money reasonably excluded by an Act of Parliament.
During the reporting period, the Office noted that a number of County governments have continued to violate the requirement to deposit all locally generated revenue into the County Revenue Fund. Instead, they have been spending the revenue at source. The Counties include: Homa Bay, Nairobi City, Nyeri, Taita Taveta, Nyeri, Tharaka Nithi and West Pokot.
Failure to deposit all locally generated revenue into the County Revenue Fund constitutes a breach of the law. Accordingly, we recommend that all Counties should deposit all locally generated revenue into the
County Revenue Fund.
OFFICE OF THE CONTROLLER OF BUDGET
COUNTY GOVERNMENTS BUDGET IMPLEMENTATION REVIEW REPORT FIRST QUARTER FY 2015/16 281
5.0 CONCLUSION
This is the ninth report by the Office of the Controller of Budget that seeks to provide an overview of budget implementation by the County Governments. It covers the first quarter of FY 2015/16. The report has noted the progress made by the counties in budget implementation and also identified challenges facing budget implementation.
Local revenue collection has continued to register improvement since the establishment of county governments in March 2013. During the first three months of FY 2015/16, local revenue collection improved to Kshs.6.93 billion (12.2 per cent of annual target) up from Kshs.6.25 billion (9.9 per cent of the annual target) over a similar period in FY 2014/15, which was also an improvement from the Kshs.4.4 billion (6.5 per cent) raised in the first quarter of FY 2013/14. While the local revenue remains below the expected first quarter target of 25 per cent, the continued improvement is noteworthy and is partly attributable to automation of revenue collection and enhanced capacity of the revenue collection staff.
During the period under review, the aggregate expenditure by the counties was Kshs.44.43 billion. This represented an absorption rate of 12.3 per cent of the total annual county government budgets. It was a decline from an absorption rate of 14.2 per cent attained in the first quarter of FY 2014/15 when the aggregate expenditure was Kshs.44.24 billion. Recurrent expenditure in the reporting period was Kshs.34.12 billion, representing 17 per cent of the annual recurrent budget, a decline from 18.5 per cent reported in a similar period of FY 2014/15, while development expenditure amounted to Kshs.10.31 billion, representing an absorption rate of 6.4 per cent, and a decline from 8.5 per cent attained in a similar period of FY 2014/15. The decline in absorption of both development and recurrent expenditure when compared to the first quarter of FY 2014/15 is largely attributed to delays in the disbursement of funds by the National Treasury. There is therefore, need to reverse this trend in order to enhance effective budget implementation.
The report also indicates that the county governments spent a total of Kshs.979.31 million on pending bills related to both recurrent and development activities from prior periods. This represented 2.2 per cent of the total expenditure for the period and an increase compared to Kshs.414.89 million or 0.9 per cent of the total expenditure reported in a similar period of FY 2014/15. This high increase in expenditure on pending bills indicates that the counties are accumulating pending bills. This may affect the efficient use of funds in the current year’s activities as funds are diverted to pay debts, hence, negatively affecting budget implementation. The counties should therefore, effectively manage the pending bills.
Other challenges that face budget implementation included; capacity and technical challenges in use of the IFMIS E-Procurement module, high expenditure on personnel emoluments, inadequate administration and reporting on public funds established by the counties, and, inadequate internal audit arrangements and failure to establish internal audit committees. The report makes recommendations to address these challenges. All relevant officers are encouraged to implement these recommendations in order to ensure effective budget implementation in the future.
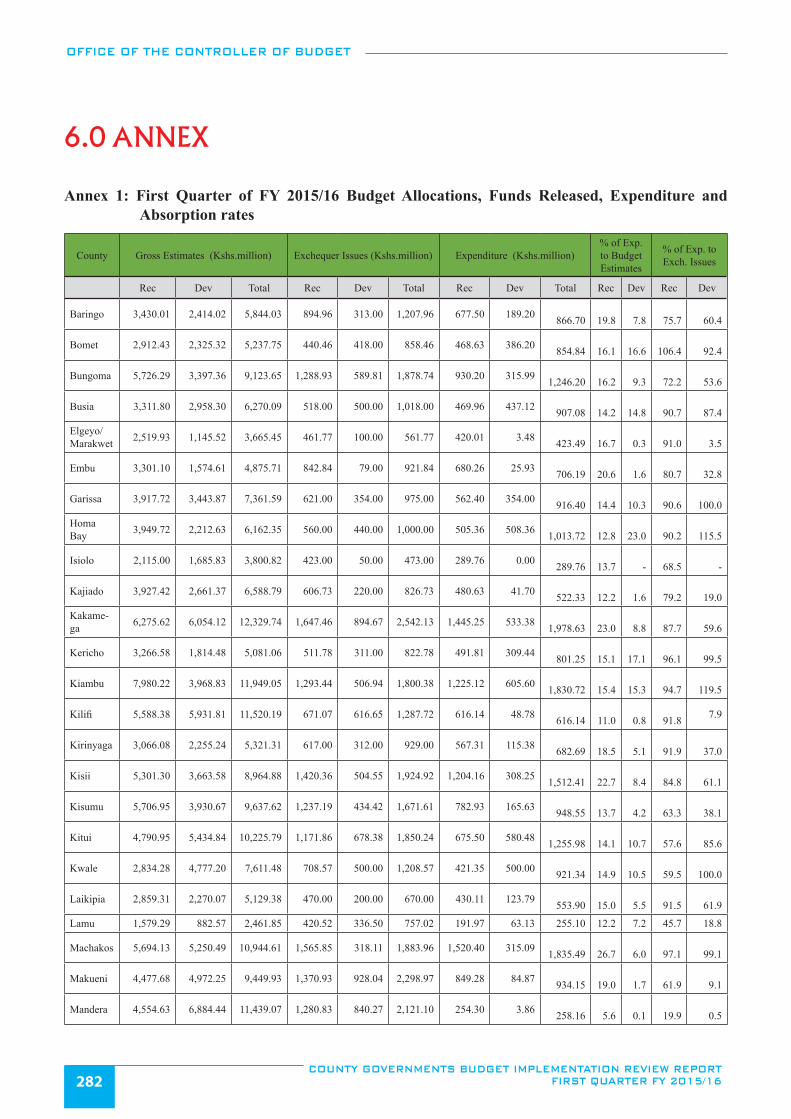
OFFICE OF THE CONTROLLER OF BUDGET
COUNTY GOVERNMENTS BUDGET IMPLEMENTATION REVIEW REPORT FIRST QUARTER FY 2015/16282
6.0 ANNEX
Annex 1: First Quarter of FY 2015/16 Budget Allocations, Funds Released, Expenditure and Absorption rates
County Gross Estimates (Kshs.million) Exchequer Issues (Kshs.million) Expenditure (Kshs.million)% of Exp. to Budget Estimates
% of Exp. to Exch. Issues
Rec Dev Total Rec Dev Total Rec Dev Total Rec Dev Rec Dev
Baringo 3,430.01 2,414.02 5,844.03 894.96 313.00 1,207.96 677.50 189.20 866.70
19.8
7.8
75.7
60.4
Bomet 2,912.43 2,325.32 5,237.75 440.46 418.00 858.46 468.63 386.20 854.84
16.1
16.6
106.4
92.4
Bungoma 5,726.29 3,397.36 9,123.65 1,288.93 589.81 1,878.74 930.20 315.99 1,246.20
16.2
9.3
72.2
53.6
Busia 3,311.80 2,958.30 6,270.09 518.00 500.00 1,018.00 469.96 437.12 907.08
14.2
14.8
90.7
87.4
Elgeyo/Marakwet 2,519.93 1,145.52 3,665.45 461.77 100.00 561.77 420.01 3.48
423.49 16.7
0.3
91.0
3.5
Embu 3,301.10 1,574.61 4,875.71 842.84 79.00 921.84 680.26 25.93 706.19
20.6
1.6
80.7
32.8
Garissa 3,917.72 3,443.87 7,361.59 621.00 354.00 975.00 562.40 354.00 916.40
14.4
10.3
90.6
100.0
Homa Bay 3,949.72 2,212.63 6,162.35 560.00 440.00 1,000.00 505.36 508.36
1,013.72 12.8
23.0
90.2
115.5
Isiolo 2,115.00 1,685.83 3,800.82 423.00 50.00 473.00 289.76 0.00 289.76
13.7
-
68.5
-
Kajiado 3,927.42 2,661.37 6,588.79 606.73 220.00 826.73 480.63 41.70 522.33
12.2
1.6
79.2
19.0
Kakame-ga 6,275.62 6,054.12 12,329.74 1,647.46 894.67 2,542.13 1,445.25 533.38
1,978.63 23.0
8.8
87.7
59.6
Kericho 3,266.58 1,814.48 5,081.06 511.78 311.00 822.78 491.81 309.44 801.25
15.1
17.1
96.1
99.5
Kiambu 7,980.22 3,968.83 11,949.05 1,293.44 506.94 1,800.38 1,225.12 605.60 1,830.72
15.4
15.3
94.7
119.5
Kilifi 5,588.38 5,931.81 11,520.19 671.07 616.65 1,287.72 616.14 48.78 616.14
11.0
0.8
91.8 7.9
Kirinyaga 3,066.08 2,255.24 5,321.31 617.00 312.00 929.00 567.31 115.38 682.69
18.5
5.1
91.9
37.0
Kisii 5,301.30 3,663.58 8,964.88 1,420.36 504.55 1,924.92 1,204.16 308.25 1,512.41
22.7
8.4
84.8
61.1
Kisumu 5,706.95 3,930.67 9,637.62 1,237.19 434.42 1,671.61 782.93 165.63 948.55
13.7
4.2
63.3
38.1
Kitui 4,790.95 5,434.84 10,225.79 1,171.86 678.38 1,850.24 675.50 580.48 1,255.98
14.1
10.7
57.6
85.6
Kwale 2,834.28 4,777.20 7,611.48 708.57 500.00 1,208.57 421.35 500.00 921.34
14.9
10.5
59.5
100.0
Laikipia 2,859.31 2,270.07 5,129.38 470.00 200.00 670.00 430.11 123.79 553.90
15.0
5.5
91.5
61.9
Lamu 1,579.29 882.57 2,461.85 420.52 336.50 757.02 191.97 63.13 255.10 12.2 7.2 45.7 18.8
Machakos 5,694.13 5,250.49 10,944.61 1,565.85 318.11 1,883.96 1,520.40 315.09 1,835.49
26.7
6.0
97.1
99.1
Makueni 4,477.68 4,972.25 9,449.93 1,370.93 928.04 2,298.97 849.28 84.87 934.15
19.0
1.7
61.9
9.1
Mandera 4,554.63 6,884.44 11,439.07 1,280.83 840.27 2,121.10 254.30 3.86 258.16
5.6
0.1
19.9
0.5
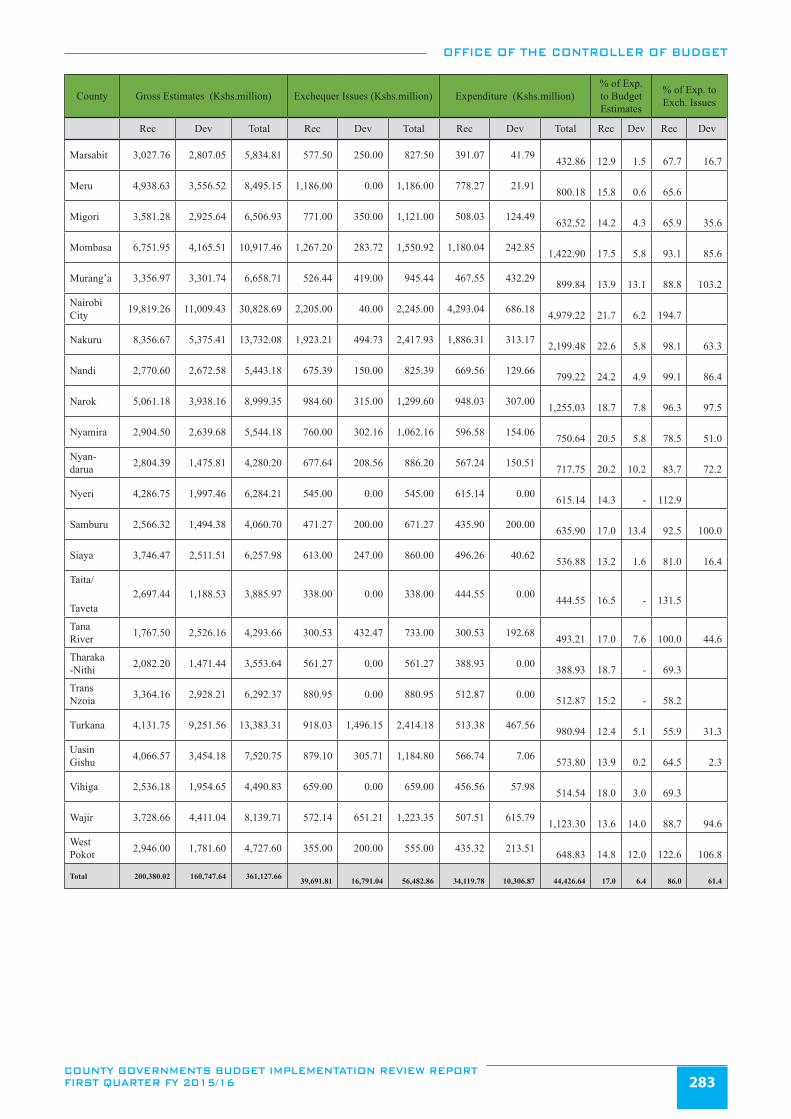
OFFICE OF THE CONTROLLER OF BUDGET
COUNTY GOVERNMENTS BUDGET IMPLEMENTATION REVIEW REPORT FIRST QUARTER FY 2015/16 283
County Gross Estimates (Kshs.million) Exchequer Issues (Kshs.million) Expenditure (Kshs.million)% of Exp. to Budget Estimates
% of Exp. to Exch. Issues
Rec Dev Total Rec Dev Total Rec Dev Total Rec Dev Rec Dev
Marsabit 3,027.76 2,807.05 5,834.81 577.50 250.00 827.50 391.07 41.79 432.86
12.9
1.5
67.7
16.7
Meru 4,938.63 3,556.52 8,495.15 1,186.00 0.00 1,186.00 778.27 21.91 800.18
15.8
0.6
65.6
Migori 3,581.28 2,925.64 6,506.93 771.00 350.00 1,121.00 508.03 124.49 632.52
14.2
4.3
65.9
35.6
Mombasa 6,751.95 4,165.51 10,917.46 1,267.20 283.72 1,550.92 1,180.04 242.85 1,422.90
17.5
5.8
93.1
85.6
Murang’a 3,356.97 3,301.74 6,658.71 526.44 419.00 945.44 467.55 432.29 899.84
13.9
13.1
88.8
103.2
Nairobi City 19,819.26 11,009.43 30,828.69 2,205.00 40.00 2,245.00 4,293.04 686.18
4,979.22 21.7
6.2
194.7
Nakuru 8,356.67 5,375.41 13,732.08 1,923.21 494.73 2,417.93 1,886.31 313.17 2,199.48
22.6
5.8
98.1
63.3
Nandi 2,770.60 2,672.58 5,443.18 675.39 150.00 825.39 669.56 129.66 799.22
24.2
4.9
99.1
86.4
Narok 5,061.18 3,938.16 8,999.35 984.60 315.00 1,299.60 948.03 307.00 1,255.03
18.7
7.8
96.3
97.5
Nyamira 2,904.50 2,639.68 5,544.18 760.00 302.16 1,062.16 596.58 154.06 750.64
20.5
5.8
78.5
51.0
Nyan-darua 2,804.39 1,475.81 4,280.20 677.64 208.56 886.20 567.24 150.51
717.75 20.2
10.2
83.7
72.2
Nyeri 4,286.75 1,997.46 6,284.21 545.00 0.00 545.00 615.14 0.00 615.14
14.3
-
112.9
Samburu 2,566.32 1,494.38 4,060.70 471.27 200.00 671.27 435.90 200.00 635.90
17.0
13.4
92.5
100.0
Siaya 3,746.47 2,511.51 6,257.98 613.00 247.00 860.00 496.26 40.62 536.88
13.2
1.6
81.0
16.4
Taita/
Taveta2,697.44 1,188.53 3,885.97 338.00 0.00 338.00 444.55 0.00
444.55 16.5
-
131.5
Tana River 1,767.50 2,526.16 4,293.66 300.53 432.47 733.00 300.53 192.68
493.21 17.0
7.6
100.0
44.6
Tharaka -Nithi 2,082.20 1,471.44 3,553.64 561.27 0.00 561.27 388.93 0.00
388.93 18.7
-
69.3
Trans Nzoia 3,364.16 2,928.21 6,292.37 880.95 0.00 880.95 512.87 0.00
512.87 15.2
-
58.2
Turkana 4,131.75 9,251.56 13,383.31 918.03 1,496.15 2,414.18 513.38 467.56 980.94
12.4
5.1
55.9
31.3
Uasin Gishu 4,066.57 3,454.18 7,520.75 879.10 305.71 1,184.80 566.74 7.06
573.80 13.9
0.2
64.5
2.3
Vihiga 2,536.18 1,954.65 4,490.83 659.00 0.00 659.00 456.56 57.98 514.54
18.0
3.0
69.3
Wajir 3,728.66 4,411.04 8,139.71 572.14 651.21 1,223.35 507.51 615.79 1,123.30
13.6
14.0
88.7
94.6
West Pokot 2,946.00 1,781.60 4,727.60 355.00 200.00 555.00 435.32 213.51
648.83 14.8
12.0
122.6
106.8
Total 200,380.02 160,747.64 361,127.66 39,691.81
16,791.04
56,482.86
34,119.78
10,306.87
44,426.64
17.0
6.4
86.0
61.4

OFFICE OF THE CONTROLLER OF BUDGET
COUNTY GOVERNMENTS BUDGET IMPLEMENTATION REVIEW REPORT FIRST QUARTER FY 2015/16284
Bima House, 12th FloorHarambee AvenueP. O. Box 35616 - 00100 Nairobi, KenyaTel: +254 (0) 20 318939, 2211056Fax: +254 (0) 20 2211920Email: [email protected]: www.cob.go.ke
REPUBLIC OF KENYA
OFFICE OF THE CONTROLLER OF BUDGET
COUNTY GOVERNMENTSBUDGET IMPLEMENTATION REVIEW
REPORT
FIRST QUARTERFY 2015/16
NOVEMBER 2015