Embed Size (px)
Citation preview

International Aviation Developments Series
Office of the Assistant Secretary for Aviation and
International Affairs
International Aviation Developments Series
June 2014
U.S. Department of Transportation Released March 2015

International Aviation Developments Series
Table of Contents
Introduction Pg 1 Summary of Data Pg 3
Passenger Traffic Pg 4 Departures and Seat Capacity Pg 5 Freight Traffic Pg 5
Data Tables
Table 1: Nonstop Travel Between the U.S. and the World - Passengers, Seats, Departures, and Freight
Table 2: U.S. International Nonstop Data by World Area - Passengers, Seats, Departures,
and Freight Table 3: Top 25 Foreign Country Gateways to U.S. (Passengers) Table 4: Top 25 Foreign Country Gateways to U.S. (Seats) Table 5: Top 25 Foreign Country Gateways to U.S. (Freight) Table 6: Top 40 U.S. Passenger Gateways to the World, Scheduled Service Table 7: Top 40 International Passenger Gateways to the U.S., Scheduled Service Table 8: Top 50 U.S. - International Airport-Pairs, Scheduled Passenger and Seat Data

International Aviation Developments Series Page 1 of 6
Introduction The U.S. International Air Passenger and Freight Statistics report has been developed to provide the public with additional access to international aviation data. The report is restricted to nonstop commercial traffic traveling between international points and U.S. airports. Global air travel systems are comprised of complex, ever-changing networks and alliances. The majority of international passengers to and from the U.S. make at least one connection before reaching their final destination. This report represents a limited aspect of international travel - nonstop flows into and out of the U.S. cities that serve as an international gateway will have high numbers in this report, but users should bear in mind that some portion of this traffic continued on a connecting flight to its final destination. Conversely, U.S. carriers serve some international points only through an international connection; therefore it might look as if no U.S. carrier serves a certain international point, when in fact U.S. carrier traffic is first flowing through a connecting city. Figures for U.S. nonstop market share do not necessarily correlate to the total service provided to that point by U.S. carriers. The widespread use of code-share agreements also influences this data. Under a code-share agreement, it is common for a passenger to fly on an aircraft owned and operated by a different airline than the one from which they bought their ticket. The data in this report represents the air carrier that operated the passenger or cargo flight reported. In some cases, such as U.S. to China, regulatory impediments make it difficult for U.S. domestic carriers to operate adequate service using their own equipment. U.S. carriers compensate by marketing and selling tickets under their own code to those destinations, and then arranging for a foreign code-share partner to actually transport the passengers. Therefore, low U.S. market share in certain restricted markets is not indicative of the true proportion of passengers purchasing U.S. carrier tickets, but rather represents the actual carrier that transported the passengers reported. Code-sharing and network- flow data issues also apply to cargo shipments. The data in this report is presented in a top-down format. Table 1 provides gross summaries of U.S.-international passengers, capacity, and freight. The same data is then broken down by world area and by country in Tables 2 through 5. Scheduled passenger data for the largest domestic gateway cities, the largest foreign gateway cities, and the largest U.S.-international airport-pairs can be found in Tables 6, 7, and 8. All data is derived from the T-100 Segment reports submitted to the Department by U.S. and foreign carriers. The T-100 program was instituted by the Department of Transportation effective January 1, 1990. It covers traffic reports of foreign airlines operating to the United States and traffic reports of the domestic and international operations of U.S. airlines. The airlines submit these reports monthly to the Department’s Office of Airline Information (OAI) of the Bureau of Transportation Statistics. The rules governing disclosure of the International T-100 data require that the data be kept confidential for a period of six months beyond the reporting date. Users of this report should take the following points into consideration:
The T-100 segment data includes all traffic arriving at U.S. airports and departing from U.S. airports on nonstop commercial international flights.
Prior to October 1st 2002, air carriers that operated aircraft with 60 seats or less were not required
to file T-100 data. Therefore prior to October 1st 2002, passenger volume in particular markets—particularly the Caribbean and certain Canadian markets – is understated in this report due to the large amount of service provided by small aircraft.

International Aviation Developments Series Page 2 of 6
T-100 data represents only nonstop service. The absence of U.S. nonstop service, or a low U.S. flag market share, does not necessarily correlate to the amount of service provided to that point by U.S. carriers. Many international destinations are served by U.S. carriers via connecting points. Those not heavily served on a nonstop basis are underrepresented in this report.
Conversely, traffic on U.S.-international routes that serve as connecting gateways will exceed the number of true Origin & Destination passengers on the route because of the high percentage of traffic connecting through the gateway.
Code-share relationships may cause U.S. carriers to seem under-represented in certain restrictive markets. This data is reported according to the operating carrier. In extensive code-share relationships (particularly to certain Asian countries) U.S. airlines sell a large number of tickets to passengers and then provide transport through the foreign code-share partner.
Cargo carriers also employ the use of networks and code-share arrangements; therefore, cargo data is susceptible to the same reporting shortcomings in this report as passenger data.
Freight tons do not include mail.
The T100 dataset is dynamic and subject to edits and updates. The data in this report represent a
snapshot of the T100 segment on the day the report tables are generated. This report will contain most recent data for the current month and previous 35 months.
This report is available on the Internet at http://ostpxweb.dot.gov/aviation/. More extensive International T-100 data is also posted at this location in a downloadable format. Questions and comments should be directed to the Office of Aviation Analysis, Office of the Secretary, at (202) 366-2352.
International Aviation Developments Series Page 3 of 6
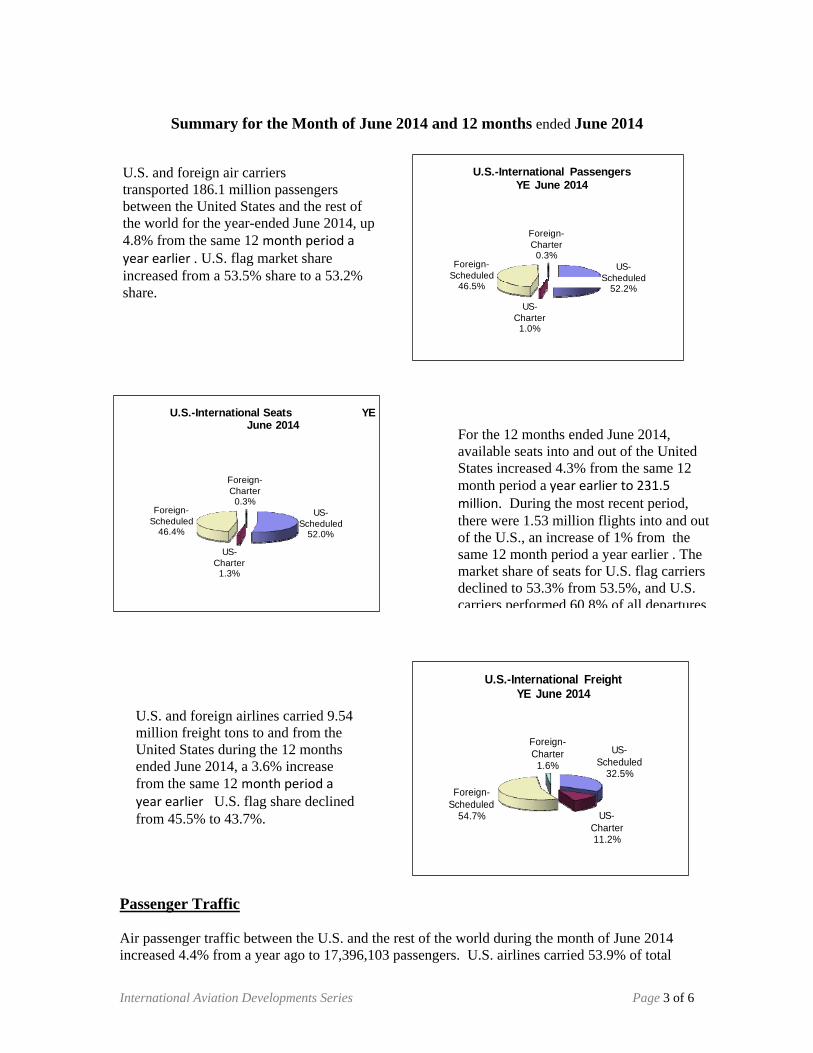
Summary for the Month of June 2014 and 12 months ended June 2014
Passenger Traffic Air passenger traffic between the U.S. and the rest of the world during the month of June 2014 increased 4.4% from a year ago to 17,396,103 passengers. U.S. airlines carried 53.9% of total
U.S. and foreign air carriers transported 186.1 million passengersbetween the United States and the rest of the world for the year-ended June 2014, up 4.8% from the same 12 month period a year earlier . U.S. flag market share increased from a 53.5% share to a 53.2% share.
For the 12 months ended June 2014, available seats into and out of the United States increased 4.3% from the same 12 month period a year earlier to 231.5 million. During the most recent period, there were 1.53 million flights into and out of the U.S., an increase of 1% from the same 12 month period a year earlier . The market share of seats for U.S. flag carriers declined to 53.3% from 53.5%, and U.S. carriers performed 60.8% of all departures.
US-Scheduled
52.0%
US-Charter
1.3%
Foreign-Scheduled
46.4%
Foreign-Charter
0.3%
U.S.-International Seats YE June 2014
U.S. and foreign airlines carried 9.54 million freight tons to and from the United States during the 12 months ended June 2014, a 3.6% increase from the same 12 month period a year earlier U.S. flag share declined from 45.5% to 43.7%.
US-Scheduled
32.5%
US-Charter11.2%
Foreign-Scheduled
54.7%
Foreign-Charter
1.6%
U.S.-International Freight YE June 2014
US-Scheduled
52.2%
US-Charter
1.0%
Foreign-Scheduled
46.5%
Foreign-Charter
0.3%
U.S.-International Passengers YE June 2014

International Aviation Developments Series Page 4 of 6
passengers traveling to or from international destinations. U.S. and foreign charter passengers accounted for 1.4% of international travel. For the 12 months ended June 2014, U.S.-world traffic was up 4.8% from the same 12 month period a year earlier to 186,119,546 passengers. U.S. airlines carried 53.2% of total passengers, compared to 53.5% the previous year. U.S. and foreign charter passengers accounted for 1.3% of international travel. World Area Trends Seven of the nine regions experienced passenger growth between the year-ended periods June 2014 and 2013. The Middle East experienced the largest percentage increase in nonstop passenger traffic growth to and from the U.S. for the 12 months ended June 2014, rising 16%. Passenger traffic between the U.S. and Africa contracted the most, falling 1.4% to 1,404,793 passengers. The largest U.S.-international regional gateway was U.S.-Europe, where 54.3 million passengers were transported during the 12 months ended June 2014 period. Europe is followed by Central America at 31.6 million passengers, and the Far East was third at 27.7 million passengers. Country Trends The top five U.S.-international country passenger gateways for the 12 months ended June 2014 were Canada, Mexico, the United Kingdom, Japan, and Germany. Of the top 25 country markets, 19 posted a positive passenger growth rate for the 12 months ended period and none experienced a loss in passenger traffic greater than 10%. U.S. flag share was up in 12 of the top 25 country markets, was unchanged in three country markets, and decreased in ten country markets. Gateway Trends The top five domestic scheduled passenger gateway airports for the 12 months ended June 2014 were New York, NY (JFK), Miami, FL (MIA), Los Angeles, CA (LAX), Newark, NJ (EWR), and Chicago, IL (ORD). Load factors were 70% or higher in 37 out of the top 40 domestic gateway airports. Load factors were below 60% in none of the top 40 domestic gateway airports. Passenger traffic for the 12 months ended June 2014 compared to 12 months ended June 2013 was up in 31 of the top 40 domestic gateways The top five foreign scheduled passenger gateways for the 12 months ended June 2014 were London, United Kingdom (LHR), Toronto, Canada (YYZ), Tokyo, Japan (NRT), Frankfurt, Germany (FRA), and Paris, France (CDG). There were 30 international gateways, Tokyo, Japan (NRT); Frankfurt, Germany (FRA); Paris, France (CDG); Cancun, Mexico (CUN); Amsterdam, Netherlands (AMS); Vancouver, Canada (YVR); Sao Paulo, Brazil (GRU); Calgary, Canada (YYC); Hong Kong, Hong Kong (HKG); Guadalajara, Mexico (GDL); Dubai, United Arab Emirates (DXB); San Jose del Cabo, Mexico (SJD); Beijing, China (PEK); Montego Bay, Jamaica (MBJ); Shanghai, China (PVG); Bogota, Colombia (BOG); Taipei, Taiwan (TPE); Munich, Germany (MUC); Punta Cana, Dominican Republic (PUJ); Madrid, Spain (MAD); San Jose, Costa Rica (SJO); Dublin, Ireland (DUB); Sydney, Australia (SYD); Lima, Peru (LIM); Rome, Italy (FCO); Zurich, Switzerland (ZRH); Tel Aviv, Israel (TLV); Istanbul, Turkey (IST); Puerto Vallarta, Mexico (PVR) and Edmonton, Canada (YEG), with a load factor of 80% or more for the annual period. There were no international gateways with a load factor under 60%. Of the top 40 foreign gateways, six reported traffic losses compared to the 12 months ended June 2013. The top U.S.-international gateway segments were 1) New York, NY (JFK)-London, United Kingdom (LHR); 2) Honolulu, HI (HNL)-Tokyo, Japan (NRT); 3) Los Angeles, CA (LAX)-London, United Kingdom (LHR); 4) New York, NY (JFK)-Paris, France (CDG); and 5) Chicago, IL (ORD)-London, United Kingdom (LHR).
International Aviation Developments Series Page 5 of 6
Departures and Seat Capacity Departures between the U.S. and the rest of the world for the month of June 2014 increased 3.5% from June 2013. Available seats increased by 6.8% over the same period. U.S. airlines provided 54.4% of international seats and 62.3% of departures. Charter service for all airlines accounted for 1.7% of international seats and 3.2% of international departures. For the 12 months ended June 2014, U.S.-world seats increased 4.3% from the same 12 month period a year earlier to 231.5 million. Departures increased by 1.0% to 1.53 million. U.S. airlines provided 53.3% of seats, compared to 53.5% the previous year. Charter service for all airlines accounted for 3.6% of international seats and 3.1% of international departures World Area Trends Seven of the nine world area regions recorded an increase in annual seat capacity between the 12 months ended periods June 2014 and 2013. The Middle East reported the largest relative increase in available seats to and from the U.S., rising 15.3% to 8.8 million, while Canada-U.S. seat capacity had the largest relative decline, down 4.6% to 32.0 million seats. Between the U.S. and Europe, 65.7 million seats were available for the 12 months ended June 2014, making it the largest U.S.-international regional gateway from a seat capacity standpoint. Europe is followed by Central America with 40 million seats, the Far East with 34.3 million seats, and Canada with 32 million seats. Country Trends The top five U.S.-international country gateways for seat capacity in the 12 months ended June 2014 were Canada, Mexico, the United Kingdom, Japan, and Germany. Of the top 25 U.S.-international countries, four posted negative growth rates. U.S. flag share was down in ten of the 25 country markets, was unchanged in three country markets, and increased in the remaining 12 country markets. Freight Traffic Air freight between the U.S. and the rest of the world in the month of June 2014 increased 7% from June 2013 to 833,495 tons. U.S. airlines carried 43.9% of total freight to and from international destinations. Charter service accounted for 13.1% of international freight traffic. For the 12 months ended June 2014, U.S.-world airfreight increased 3.6% over the same 12 month period a year earlier to 9.54 million tons. U.S. airlines carried 43.7% of total freight, compared to 45.5% the previous year. World Area Trends The Middle East experienced the greatest relative increase in nonstop freight shipments to and from the U.S. between the 12 months ended June 2014 and 2013, rising 21.9%. The Far East posted the second largest increase, up 3.8%. Six of the nine regions recorded a gain of freight traffic between the two 12 month ended periods. On an absolute basis, the Far East posted the largest increase, up 128 thousand tons to 3.5 million tons.

International Aviation Developments Series Page 6 of 6
In addition, with 3.5 million tons transported for the 12 months ended June 2014, this area the Far East is the largest U.S. international regional freight gateway, followed closely by Europe with 2.9 million tons of freight. Country Trends The top five U.S.-international country gateways for freight in the 12 months ended June 2014 were Japan, Germany, the United Kingdom, China, and Hong Kong. Of the top 25 country markets, 16 posted positive freight growth rates for the 12 months ended June 2014 versus the 12 months ended June 2013. Chile had the highest loss rate at 18.7%. U.S. flag share was down in 14 of the 25 country markets, was unchanged in 3 country markets, and increased in the remaining 8 country markets.

Table 1 : Nonstop Travel Between the U.S. and the WorldPassengers, Available Seats, Departures and Freight Totals By Month
Passengers
Yr/Yr US Foreign Scheduled Yr/Yr US Foreign Charter Yr/Yr US ForeignYear Month Total Growth Share Share Total Growth Share Share Total Growth Share Share
2012 7 17,333,274 2.1% 55.1% 44.9% 17,008,529 2.1% 54.7% 45.3% 324,745 5.5% 75.4% 24.6%2012 8 16,941,459 5.6% 53.6% 46.4% 16,657,710 5.5% 53.4% 46.6% 283,749 14.1% 62.8% 37.2%2012 9 13,986,164 4.3% 51.5% 48.5% 13,820,793 4.3% 51.4% 48.6% 165,371 3.8% 62.7% 37.3%2012 10 13,572,299 1.6% 52.0% 48.0% 13,426,158 1.5% 51.8% 48.2% 146,141 15.0% 72.9% 27.1%2012 11 12,921,065 5.0% 52.8% 47.2% 12,785,412 5.0% 52.5% 47.5% 135,653 4.8% 81.2% 18.8%2012 12 14,296,063 4.0% 53.4% 46.6% 14,119,044 3.9% 53.1% 46.9% 177,019 8.6% 78.6% 21.4%2013 1 13,992,683 4.1% 53.5% 46.5% 13,795,242 4.3% 53.1% 46.9% 197,441 -9.1% 75.7% 24.3%2013 2 12,253,744 2.6% 54.7% 45.3% 12,054,487 2.6% 54.5% 45.5% 199,257 0.6% 70.3% 29.7%2013 3 15,463,510 5.6% 54.9% 45.1% 15,210,387 5.6% 54.8% 45.2% 253,123 3.6% 63.2% 36.8%2013 4 14,534,430 1.9% 53.1% 46.9% 14,322,389 2.2% 52.8% 47.2% 212,041 -10.8% 70.8% 29.2%2013 5 15,570,696 7.3% 52.4% 47.6% 15,380,680 7.4% 52.2% 47.8% 190,016 -0.9% 72.2% 27.8%2013 6 16,665,195 5.0% 54.3% 45.7% 16,434,625 5.2% 54.1% 45.9% 230,570 -11.7% 70.9% 29.1%2013 7 18,065,647 4.2% 54.9% 45.1% 17,784,026 4.6% 54.6% 45.4% 281,621 -13.3% 75.9% 24.1%2013 8 17,938,319 5.9% 53.3% 46.7% 17,696,766 6.2% 53.1% 46.9% 241,553 -14.9% 63.4% 36.6%2013 9 14,435,956 3.2% 50.9% 49.1% 14,285,457 3.4% 50.8% 49.2% 150,499 -9.0% 61.7% 38.3%2013 10 14,523,638 7.0% 50.9% 49.1% 14,368,247 7.0% 50.6% 49.4% 155,391 6.3% 73.0% 27.0%2013 11 13,343,205 3.3% 52.5% 47.5% 13,192,425 3.2% 52.2% 47.8% 150,780 11.2% 83.6% 16.4%2013 12 15,293,174 7.0% 53.0% 47.0% 15,129,281 7.2% 52.7% 47.3% 163,893 -7.4% 81.4% 18.6%2014 1 14,834,839 6.0% 52.9% 47.1% 14,639,796 6.1% 52.5% 47.5% 195,043 -1.2% 79.3% 20.7%2014 2 12,594,333 2.8% 55.0% 45.0% 12,412,940 3.0% 54.6% 45.4% 181,393 -9.0% 83.3% 16.7%2014 3 15,863,261 2.6% 54.7% 45.3% 15,639,231 2.8% 54.4% 45.6% 224,030 -11.5% 78.2% 21.8%2014 4 15,486,712 6.6% 53.1% 46.9% 15,323,361 7.0% 52.8% 47.2% 163,351 -23.0% 81.2% 18.8%2014 5 16,344,359 5.0% 52.8% 47.2% 16,156,960 5.0% 52.5% 47.5% 187,399 -1.4% 79.4% 20.6%2014 6 17,396,103 4.4% 53.9% 46.1% 17,158,462 4.4% 53.6% 46.4% 237,641 3.1% 73.8% 26.2%
YE 201206 170,511,826 4.5% 54.5% 45.5% 168,026,247 4.3% 54.3% 45.7% 2,485,579 19.6% 70.4% 29.6%YE 201306 177,530,582 4.1% 53.5% 46.5% 175,015,456 4.2% 53.2% 46.8% 2,515,126 1.2% 70.9% 29.1%YE 201406 186,119,546 4.8% 53.2% 46.8% 183,786,952 5.0% 52.9% 47.1% 2,332,594 -7.3% 75.9% 24.1%
Source : U.S. Department of Transportation T-100 Segment Data. Page 1 of 4

Table 1 : Nonstop Travel Between the U.S. and the WorldPassengers, Available Seats, Departures and Freight Totals By Month
Seats
Yr/Yr US Foreign Scheduled Yr/Yr US Foreign Charter Yr/Yr US ForeignYear Month Total Growth Share Share Total Growth Share Share Total Growth Share Share
2012 7 20,531,576 2.4% 55.0% 45.0% 20,092,202 2.2% 54.5% 45.5% 439,374 8.6% 78.8% 21.2%2012 8 20,083,357 4.8% 53.8% 46.2% 19,688,201 4.6% 53.4% 46.6% 395,156 15.2% 70.4% 29.6%2012 9 17,555,245 2.2% 52.0% 48.0% 17,287,075 2.2% 51.7% 48.3% 268,170 4.8% 71.0% 29.0%2012 10 17,215,609 -0.3% 52.3% 47.7% 16,979,282 -0.5% 52.0% 48.0% 236,327 13.9% 79.2% 20.8%2012 11 16,622,115 3.0% 52.7% 47.3% 16,406,794 3.1% 52.3% 47.7% 215,321 -2.5% 83.1% 16.9%2012 12 18,213,492 2.1% 53.4% 46.6% 17,946,231 2.2% 53.0% 47.0% 267,261 -1.9% 81.8% 18.2%2013 1 18,308,362 2.2% 53.4% 46.6% 18,025,259 2.5% 53.0% 47.0% 283,103 -14.7% 79.5% 20.5%2013 2 16,427,022 -0.9% 54.4% 45.6% 16,150,255 -0.8% 54.1% 45.9% 276,767 -3.7% 74.7% 25.3%2013 3 19,151,777 2.6% 54.5% 45.5% 18,814,833 2.6% 54.3% 45.7% 336,944 0.5% 67.1% 32.9%2013 4 18,680,986 3.4% 53.0% 47.0% 18,381,859 3.6% 52.7% 47.3% 299,127 -10.9% 74.1% 25.9%2013 5 19,340,094 5.3% 52.7% 47.3% 19,059,710 5.3% 52.3% 47.7% 280,384 4.2% 75.9% 24.1%2013 6 19,723,238 3.5% 54.4% 45.6% 19,409,619 3.9% 54.1% 45.9% 313,619 -15.1% 75.6% 24.4%2013 7 21,176,130 3.1% 54.5% 45.5% 20,798,058 3.5% 54.0% 46.0% 378,072 -14.0% 79.8% 20.2%2013 8 20,921,128 4.2% 53.4% 46.6% 20,588,823 4.6% 53.2% 46.8% 332,305 -15.9% 70.4% 29.6%2013 9 17,998,806 2.5% 51.1% 48.9% 17,756,477 2.7% 50.9% 49.1% 242,329 -9.6% 70.5% 29.5%2013 10 18,375,162 6.7% 50.9% 49.1% 18,133,231 6.8% 50.6% 49.4% 241,931 2.4% 78.9% 21.1%2013 11 17,388,611 4.6% 52.5% 47.5% 17,134,984 4.4% 52.0% 48.0% 253,627 17.8% 86.3% 13.7%2013 12 18,908,393 3.8% 53.1% 46.9% 18,637,659 3.9% 52.7% 47.3% 270,734 1.3% 86.0% 14.0%2014 1 18,936,688 3.4% 53.4% 46.6% 18,616,839 3.3% 52.9% 47.1% 319,849 13.0% 84.2% 15.8%2014 2 16,716,141 1.8% 55.1% 44.9% 16,431,070 1.7% 54.5% 45.5% 285,071 3.0% 86.9% 13.1%2014 3 20,227,096 5.6% 54.4% 45.6% 19,908,361 5.8% 53.9% 46.1% 318,735 -5.4% 81.4% 18.6%2014 4 19,487,253 4.3% 53.3% 46.7% 19,218,517 4.6% 52.8% 47.2% 268,736 -10.2% 84.6% 15.4%2014 5 20,273,814 4.8% 53.4% 46.6% 19,962,643 4.7% 52.9% 47.1% 311,171 11.0% 83.8% 16.2%2014 6 21,061,859 6.8% 54.4% 45.6% 20,700,743 6.7% 54.0% 46.0% 361,116 15.1% 80.0% 20.0%
YE 201206 216,297,181 4.0% 54.8% 45.2% 212,663,435 3.7% 54.4% 45.6% 3,633,746 22.0% 75.5% 24.5%YE 201306 221,852,873 2.6% 53.5% 46.5% 218,241,320 2.6% 53.1% 46.9% 3,611,553 -0.6% 75.5% 24.5%YE 201406 231,471,081 4.3% 53.3% 46.7% 227,887,405 4.4% 52.9% 47.1% 3,583,676 -0.8% 81.0% 19.0%
Source : U.S. Department of Transportation T-100 Segment Data. Page 2 of 4

Table 1 : Nonstop Travel Between the U.S. and the WorldPassengers, Available Seats, Departures and Freight Totals By Month
Departures
Yr/Yr US Foreign Scheduled Yr/Yr US Foreign Charter Yr/Yr US ForeignYear Month Total Growth Share Share Total Growth Share Share Total Growth Share Share
2012 7 138,083 1.3% 61.5% 38.5% 133,269 1.6% 60.8% 39.2% 4,814 -5.8% 80.2% 19.8%2012 8 135,904 4.3% 60.7% 39.3% 131,431 4.7% 60.1% 39.9% 4,473 -7.0% 77.7% 22.3%2012 9 119,275 1.2% 58.7% 41.3% 115,663 1.8% 58.0% 42.0% 3,612 -14.6% 78.5% 21.5%2012 10 118,764 -0.1% 59.5% 40.5% 115,102 -0.1% 58.8% 41.2% 3,662 -0.1% 80.6% 19.4%2012 11 117,175 2.3% 59.5% 40.5% 113,590 2.5% 58.8% 41.2% 3,585 -4.5% 80.9% 19.1%2012 12 125,349 0.4% 60.1% 39.9% 121,529 0.7% 59.4% 40.6% 3,820 -8.7% 81.6% 18.4%2013 1 126,850 2.5% 60.1% 39.9% 123,153 3.1% 59.5% 40.5% 3,697 -12.8% 79.9% 20.1%2013 2 114,483 -1.8% 61.2% 38.8% 110,772 -1.8% 60.6% 39.4% 3,711 -3.7% 78.5% 21.5%2013 3 132,923 1.3% 61.3% 38.7% 128,612 1.5% 60.8% 39.2% 4,311 -4.9% 76.2% 23.8%2013 4 127,860 1.8% 60.3% 39.7% 123,599 2.1% 59.6% 40.4% 4,261 -4.3% 80.2% 19.8%2013 5 130,910 2.9% 59.8% 40.2% 126,975 3.2% 59.3% 40.7% 3,935 -5.2% 78.1% 21.9%2013 6 131,036 0.9% 61.4% 38.6% 126,923 1.2% 60.8% 39.2% 4,113 -8.7% 78.0% 22.0%2013 7 139,498 1.0% 61.1% 38.9% 135,385 1.6% 60.5% 39.5% 4,113 -14.6% 80.2% 19.8%2013 8 137,539 1.2% 60.1% 39.9% 133,685 1.7% 59.6% 40.4% 3,854 -13.8% 77.3% 22.7%2013 9 117,253 -1.7% 58.7% 41.3% 113,853 -1.6% 58.2% 41.8% 3,400 -5.9% 76.1% 23.9%2013 10 123,748 4.2% 58.4% 41.6% 119,947 4.2% 57.7% 42.3% 3,801 3.8% 80.5% 19.5%2013 11 117,867 0.6% 60.4% 39.6% 113,945 0.3% 59.6% 40.4% 3,922 9.4% 83.1% 16.9%2013 12 126,486 0.9% 60.9% 39.1% 122,476 0.8% 60.1% 39.9% 4,010 5.0% 84.5% 15.5%2014 1 125,525 -1.0% 60.8% 39.2% 121,613 -1.3% 60.2% 39.8% 3,912 5.8% 81.6% 18.4%2014 2 112,220 -2.0% 62.9% 37.1% 108,572 -2.0% 62.3% 37.7% 3,648 -1.7% 82.1% 17.9%2014 3 137,474 3.4% 61.2% 38.8% 133,132 3.5% 60.6% 39.4% 4,342 0.7% 80.9% 19.1%2014 4 128,031 0.1% 61.9% 38.1% 124,158 0.5% 61.3% 38.7% 3,873 -9.1% 81.2% 18.8%2014 5 131,904 0.8% 61.3% 38.7% 127,882 0.7% 60.6% 39.4% 4,022 2.2% 81.8% 18.2%2014 6 135,655 3.5% 62.3% 37.7% 131,286 3.4% 61.7% 38.3% 4,369 6.2% 80.1% 19.9%
YE 201206 1,496,928 2.4% 61.3% 38.7% 1,445,445 2.6% 60.6% 39.4% 51,483 -4.7% 79.3% 20.7%YE 201306 1,518,612 1.4% 60.4% 39.6% 1,470,618 1.7% 59.7% 40.3% 47,994 -6.8% 79.2% 20.8%YE 201406 1,533,200 1.0% 60.8% 39.2% 1,485,934 1.0% 60.2% 39.8% 47,266 -1.5% 80.8% 19.2%
Source : U.S. Department of Transportation T-100 Segment Data. Page 3 of 4

Table 1 : Nonstop Travel Between the U.S. and the WorldPassengers, Available Seats, Departures and Freight Totals By Month
Freight (Tons)
Yr/Yr US Foreign Scheduled Yr/Yr US Foreign Charter Yr/Yr US ForeignYear Month Total Growth Share Share Total Growth Share Share Total Growth Share Share
2012 7 787,615 -2.6% 46.3% 53.7% 689,947 -2.7% 40.7% 59.3% 97,668 -2.0% 86.3% 13.7%2012 8 763,302 -2.2% 45.9% 54.1% 671,194 -2.4% 40.4% 59.6% 92,108 -0.6% 85.8% 14.2%2012 9 775,673 -0.4% 45.1% 54.9% 688,050 0.6% 39.7% 60.3% 87,622 -7.5% 88.2% 11.8%2012 10 776,488 -6.4% 45.9% 54.1% 687,780 -5.2% 40.3% 59.7% 88,708 -14.6% 89.4% 10.6%2012 11 807,843 -0.7% 46.2% 53.8% 711,018 -0.5% 40.3% 59.7% 96,824 -1.7% 89.2% 10.8%2012 12 779,406 -3.4% 45.1% 54.9% 668,288 -5.4% 37.8% 62.2% 111,118 10.9% 88.9% 11.1%2013 1 700,826 2.1% 46.6% 53.4% 608,922 1.4% 40.0% 60.0% 91,905 6.6% 89.8% 10.2%2013 2 671,572 -8.4% 46.1% 53.9% 583,569 -10.1% 39.6% 60.4% 88,004 5.3% 88.8% 11.2%2013 3 797,732 -7.8% 44.7% 55.3% 692,818 -9.3% 37.9% 62.1% 104,915 3.5% 90.2% 9.8%2013 4 782,985 1.4% 47.0% 53.0% 664,939 -1.3% 38.9% 61.1% 118,046 19.8% 92.2% 7.8%2013 5 782,684 -1.9% 43.4% 56.6% 688,086 -1.2% 37.7% 62.3% 94,598 -6.8% 84.7% 15.3%2013 6 778,989 -1.1% 43.9% 56.1% 672,611 -2.8% 37.8% 62.2% 106,378 11.4% 82.1% 17.9%2013 7 771,284 -2.1% 43.2% 56.8% 673,723 -2.4% 37.2% 62.8% 97,561 -0.1% 84.2% 15.8%2013 8 782,087 2.5% 42.7% 57.3% 688,389 2.6% 36.7% 63.3% 93,698 1.7% 87.1% 12.9%2013 9 771,778 -0.5% 42.4% 57.6% 677,563 -1.5% 36.1% 63.9% 94,215 7.5% 87.9% 12.1%2013 10 834,557 7.5% 44.2% 55.8% 726,230 5.6% 37.9% 62.1% 108,327 22.1% 86.4% 13.6%2013 11 840,820 4.1% 44.4% 55.6% 725,619 2.1% 37.3% 62.7% 115,202 19.0% 88.8% 11.2%2013 12 788,545 1.2% 44.4% 55.6% 680,418 1.8% 37.3% 62.7% 108,127 -2.7% 89.1% 10.9%2014 1 729,199 4.0% 43.7% 56.3% 638,384 4.8% 37.4% 62.6% 90,815 -1.2% 88.0% 12.0%2014 2 672,535 0.1% 44.2% 55.8% 589,429 1.0% 38.2% 61.8% 83,106 -5.6% 87.2% 12.8%2014 3 869,646 9.0% 43.0% 57.0% 763,733 10.2% 36.9% 63.1% 105,913 1.0% 86.8% 13.2%2014 4 799,687 2.1% 44.5% 55.5% 691,120 3.9% 37.4% 62.6% 108,567 -8.0% 89.1% 10.9%2014 5 846,928 8.2% 44.0% 56.0% 738,722 7.4% 37.6% 62.4% 108,206 14.4% 87.8% 12.2%2014 6 833,495 7.0% 43.9% 56.1% 724,659 7.7% 37.9% 62.1% 108,836 2.3% 83.6% 16.4%
YE 201206 9,460,330 -3.3% 46.3% 53.7% 8,303,854 -2.1% 40.8% 59.2% 1,156,476 -11.6% 86.3% 13.7%YE 201306 9,205,115 -2.7% 45.5% 54.5% 8,027,222 -3.3% 39.2% 60.8% 1,177,893 1.9% 88.0% 12.0%YE 201406 9,540,561 3.6% 43.7% 56.3% 8,317,988 3.6% 37.3% 62.7% 1,222,573 3.8% 87.2% 12.8%
Source : U.S. Department of Transportation T-100 Segment Data. Page 4 of 4

Table 2 : U.S.-International Nonstop Data By World Area 1/Passengers, Available Seats, Departures and Freight Totals By Month
Passengers
Total Passengers Scheduled Service Nonscheduled Service
Year/ U.S. Foreign US Flag Foreign Flag US Flag Foreign Flag
Year Market Market Yr/Yr Market Yr/Yr Market Yr/Yr Market Yr/Yr Market
Region Period Total Change Share Share Total Change Share Total Change Share Total Change Share Total Change Share
Africa
2013 6 134,223 -1.6% 37.0% 63.0% 46,861 -9.8% 35.7% 84,524 3.5% 64.3% 2,824 3.0% 99.5% 14 7.7% 0.5%
2014 6 132,883 -1.0% 39.5% 60.5% 49,471 5.6% 38.1% 80,401 -4.9% 61.9% 3,011 6.6% 100.0% - -100.0% 0.0%
YE 201206 1,434,171 0.5% 41.7% 58.3% 566,686 -7.2% 40.4% 835,826 5.6% 59.6% 31,599 27.8% 99.8% 60 233.3% 0.2%
YE 201306 1,425,224 -0.6% 40.7% 59.3% 548,394 -3.2% 39.4% 844,586 1.0% 60.6% 32,206 1.9% 99.9% 38 -36.7% 0.1%
YE 201406 1,404,793 -1.4% 42.0% 58.0% 553,222 0.9% 40.4% 814,818 -3.5% 59.6% 36,704 14.0% 99.9% 49 28.9% 0.1%
Australia/Oceania
2013 6 360,034 7.0% 25.6% 74.4% 92,271 15.2% 25.6% 267,763 4.5% 74.4% - -100.0% 0.0% - 0.0% 0.0%
2014 6 359,195 -0.2% 23.4% 76.6% 84,187 -8.8% 23.4% 275,008 2.7% 76.6% - 0.0% 0.0% - 0.0% 0.0%
YE 201206 3,829,656 0.9% 24.6% 75.4% 939,940 -5.7% 24.6% 2,887,898 3.2% 75.4% 1,810 480.1% 99.6% 8 -98.3% 0.4%
YE 201306 4,018,701 4.9% 25.3% 74.7% 1,011,848 7.7% 25.2% 3,002,306 4.0% 74.8% 4,524 149.9% 99.5% 23 187.5% 0.5%
YE 201406 4,224,153 5.1% 25.3% 74.7% 1,069,773 5.7% 25.3% 3,154,259 5.1% 74.7% 30 -99.3% 24.8% 91 295.7% 75.2%
Canada
2013 6 1,996,975 3.4% 50.5% 49.5% 1,006,679 4.4% 50.7% 979,259 2.3% 49.3% 1,632 -17.7% 14.8% 9,405 9.7% 85.2%
2014 6 2,041,065 2.2% 52.1% 47.9% 1,060,310 5.3% 52.1% 976,527 -0.3% 47.9% 3,923 140.4% 92.8% 305 -96.8% 7.2%
YE 201206 23,616,292 3.6% 47.2% 52.8% 11,084,089 -1.6% 47.5% 12,237,115 8.7% 52.5% 63,619 7.6% 21.6% 231,469 3.7% 78.4%
YE 201306 24,999,581 5.9% 45.8% 54.2% 11,416,688 3.0% 46.1% 13,362,042 9.2% 53.9% 33,746 -47.0% 15.3% 187,105 -19.2% 84.7%
YE 201406 24,999,259 0.0% 47.7% 52.3% 11,881,291 4.1% 47.9% 12,908,022 -3.4% 52.1% 48,110 42.6% 22.9% 161,836 -13.5% 77.1%
Central America
2013 6 2,622,362 9.8% 74.6% 25.4% 1,913,845 7.9% 74.7% 649,236 16.2% 25.3% 42,753 -0.7% 72.1% 16,528 39.7% 27.9%
2014 6 2,862,169 9.1% 73.7% 26.3% 2,061,157 7.7% 74.0% 725,329 11.7% 26.0% 48,405 13.2% 64.0% 27,278 65.0% 36.0%
YE 201206 27,275,998 5.6% 75.6% 24.4% 20,365,590 3.0% 75.7% 6,544,678 15.3% 24.3% 267,386 17.0% 73.1% 98,344 -34.4% 26.9%
YE 201306 29,083,832 6.6% 73.5% 26.5% 20,948,562 2.9% 73.3% 7,616,051 16.4% 26.7% 441,747 65.2% 85.1% 77,472 -21.2% 14.9%
YE 201406 31,618,608 8.7% 73.2% 26.8% 22,641,736 8.1% 73.0% 8,387,822 10.1% 27.0% 501,910 13.6% 85.2% 87,140 12.5% 14.8%
Europe
2013 6 5,573,879 3.1% 43.8% 56.2% 2,432,641 2.1% 44.0% 3,099,349 3.9% 56.0% 5,988 430.4% 14.3% 35,901 -10.8% 85.7%
2014 6 5,680,094 1.9% 43.0% 57.0% 2,439,154 0.3% 43.2% 3,204,514 3.4% 56.8% 1,992 -66.7% 5.5% 34,434 -4.1% 94.5%
YE 201206 52,184,415 1.8% 43.4% 56.6% 22,622,444 -1.8% 43.6% 29,289,479 5.0% 56.4% 11,631 13.4% 4.3% 260,861 -19.5% 95.7%
YE 201306 52,274,026 0.2% 42.1% 57.9% 21,987,084 -2.8% 42.3% 30,000,872 2.4% 57.7% 20,642 77.5% 7.2% 265,428 1.8% 92.8%
YE 201406 54,283,345 3.8% 41.8% 58.2% 22,662,855 3.1% 41.9% 31,373,377 4.6% 58.1% 47,923 132.2% 19.4% 199,190 -25.0% 80.6%
Source : U.S. Department of Transportation T-100 Segment Data. Page 1 of 8
1- Due to extensive code-sharing agreements passenger and cargo data for U.S. carriers presented in this table might understate U.S. carrier presence in certain markets.
Please see the report's introduction for further details.

Table 2 : U.S.-International Nonstop Data By World Area 1/Passengers, Available Seats, Departures and Freight Totals By Month
Passengers
Total Passengers Scheduled Service Nonscheduled Service
Year/ U.S. Foreign US Flag Foreign Flag US Flag Foreign Flag
Year Market Market Yr/Yr Market Yr/Yr Market Yr/Yr Market Yr/Yr Market
Region Period Total Change Share Share Total Change Share Total Change Share Total Change Share Total Change Share
Far East
2013 6 2,378,244 4.4% 43.5% 56.5% 1,035,689 0.8% 43.6% 1,337,205 7.0% 56.4% 23 0.0% 0.4% 5,327 374.4% 99.6%
2014 6 2,457,133 3.3% 42.4% 57.6% 1,039,179 0.3% 42.3% 1,415,515 5.9% 57.7% 2,265 9747.8% 92.9% 174 -96.7% 7.1%
YE 201206 25,105,947 7.3% 44.8% 55.2% 11,213,604 7.2% 45.0% 13,715,324 7.1% 55.0% 38,121 39.7% 21.5% 138,898 23.4% 78.5%
YE 201306 26,503,734 5.6% 43.9% 56.1% 11,603,821 3.5% 44.2% 14,673,945 7.0% 55.8% 24,920 -34.6% 11.0% 201,048 44.7% 89.0%
YE 201406 27,661,585 4.4% 41.8% 58.2% 11,528,002 -0.7% 41.9% 15,985,413 8.9% 58.1% 35,952 44.3% 24.3% 112,218 -44.2% 75.7%
Middle East
2013 6 640,946 11.3% 20.3% 79.7% 130,141 9.7% 20.3% 510,805 11.7% 79.7% - -100.0% 0.0% - 0.0% 0.0%
2014 6 752,781 17.4% 14.8% 85.2% 111,735 -14.1% 14.8% 641,046 25.5% 85.2% - 0.0% 0.0% - 0.0% 0.0%
YE 201206 5,654,767 12.8% 23.9% 76.1% 1,350,542 -9.8% 23.9% 4,303,885 22.3% 76.1% 205 0.0% 60.3% 135 -19.2% 39.7%
YE 201306 6,296,484 11.3% 22.3% 77.7% 1,397,636 3.5% 22.2% 4,893,714 13.7% 77.8% 5,001 2339.5% 97.4% 133 -1.5% 2.6%
YE 201406 7,303,318 16.0% 17.3% 82.7% 1,261,333 -9.8% 17.3% 6,041,043 23.4% 82.7% - -100.0% 0.0% 942 608.3% 100.0%
South America
2013 6 1,175,598 12.2% 61.6% 38.4% 724,310 10.6% 61.6% 451,049 16.1% 38.4% 239 -94.9% 100.0% - -100.0% 0.0%
2014 6 1,229,847 4.6% 60.2% 39.8% 736,253 1.6% 60.1% 489,095 8.4% 39.9% 4,489 1778.2% 99.8% 10 0.0% 0.2%
YE 201206 12,572,821 6.9% 62.1% 37.9% 7,763,867 4.8% 62.0% 4,759,404 9.5% 38.0% 45,283 745.8% 91.4% 4,267 908.7% 8.6%
YE 201306 13,822,910 9.9% 61.4% 38.6% 8,434,330 8.6% 61.2% 5,338,805 12.2% 38.8% 49,649 9.6% 99.7% 126 -97.0% 0.3%
YE 201406 14,910,261 7.9% 60.5% 39.5% 9,003,120 6.7% 60.5% 5,883,801 10.2% 39.5% 23,275 -53.1% 99.7% 65 -48.4% 0.3%
The Carribean
2013 6 1,782,934 0.3% 90.4% 9.6% 1,502,290 2.9% 89.8% 170,708 -0.2% 10.2% 109,936 -24.5% 100.0% - -100.0% 0.0%
2014 6 1,880,936 5.5% 91.9% 8.1% 1,617,058 7.6% 91.4% 152,523 -10.7% 8.6% 111,355 1.3% 100.0% - 0.0% 0.0%
YE 201206 18,837,759 5.3% 88.3% 11.7% 15,344,764 3.4% 87.5% 2,201,112 3.5% 12.5% 1,290,532 44.7% 99.9% 1,351 -93.5% 0.1%
YE 201306 19,106,090 1.4% 88.9% 11.1% 15,811,166 3.0% 88.2% 2,123,606 -3.5% 11.8% 1,170,515 -9.3% 99.9% 803 -40.6% 0.1%
YE 201406 19,714,224 3.2% 89.9% 10.1% 16,644,248 5.3% 89.3% 1,992,817 -6.2% 10.7% 1,076,530 -8.0% 99.9% 629 -21.7% 0.1%
Source : U.S. Department of Transportation T-100 Segment Data. Page 2 of 8
1- Due to extensive code-sharing agreements passenger and cargo data for U.S. carriers presented in this table might understate U.S. carrier presence in certain markets.
Please see the report's introduction for further details.

Table 2 : U.S.-International Nonstop Data By World Area 1/Passengers, Available Seats, Departures and Freight Totals By Month
Available Seats
Total Seats Scheduled Service Nonscheduled Service
Year/ U.S. Foreign US Flag Foreign Flag US Flag Foreign Flag
Year Market Market Yr/Yr Market Yr/Yr Foreign Yr/Yr Market Yr/Yr Market
Region Period Total Change Share Share Total Change Share Total Change Share Total Change Share Total Change Share
Africa
2013 6 169,953 -3.3% 39.8% 60.2% 56,866 -14.8% 35.7% 102,258 -1.5% 64.3% 10,810 120.0% 99.8% 19 -88.5% 0.2%
2014 6 173,638 2.2% 41.3% 58.7% 59,933 5.4% 37.0% 101,955 -0.3% 63.0% 11,750 8.7% 100.0% - -100.0% 0.0%
YE 201206 1,951,375 2.3% 41.6% 58.4% 753,380 -5.4% 39.8% 1,137,974 8.5% 60.2% 59,079 -3.1% 98.4% 942 -38.0% 1.6%
YE 201306 1,918,362 -1.7% 40.2% 59.8% 662,921 -12.0% 36.6% 1,146,786 0.8% 63.4% 108,255 83.2% 99.6% 400 -57.5% 0.4%
YE 201406 1,904,325 -0.7% 41.6% 58.4% 652,601 -1.6% 37.0% 1,111,097 -3.1% 63.0% 140,525 29.8% 99.9% 102 -74.5% 0.1%
Australia/Oceania
2013 6 437,103 11.2% 26.6% 73.4% 116,172 15.2% 26.6% 320,931 10.0% 73.4% - -100.0% 0.0% - 0.0% 0.0%
2014 6 436,067 -0.2% 24.7% 75.3% 107,817 -7.2% 24.7% 328,250 2.3% 75.3% - 0.0% 0.0% - 0.0% 0.0%
YE 201206 4,814,742 -26.9% 25.6% 74.4% 1,223,062 -4.4% 25.5% 3,580,774 5.4% 74.5% 10,865 599.2% 99.6% 41 -96.5% 0.4%
YE 201306 5,051,137 4.9% 26.6% 73.4% 1,333,697 9.0% 26.5% 3,708,195 3.6% 73.5% 9,193 -15.4% 99.4% 52 26.8% 0.6%
YE 201406 5,283,922 4.6% 26.4% 73.6% 1,397,001 4.7% 26.4% 3,886,277 4.8% 73.6% 524 -94.3% 81.4% 120 130.8% 18.6%
Canada
2013 6 2,630,981 -0.6% 50.4% 49.6% 1,320,236 -0.9% 50.5% 1,294,254 -0.2% 49.5% 4,502 -9.5% 27.3% 11,989 -4.1% 72.7%
2014 6 2,591,240 -1.5% 51.3% 48.7% 1,318,917 -0.1% 51.1% 1,261,116 -2.6% 48.9% 10,194 126.4% 91.0% 1,013 -91.6% 9.0%
YE 201206 32,208,318 -15.1% 48.0% 52.0% 15,308,974 -1.5% 48.2% 16,481,869 7.0% 51.8% 139,453 20.8% 33.4% 278,022 -4.6% 66.6%
YE 201306 33,483,693 4.0% 45.8% 54.2% 15,236,548 -0.5% 45.9% 17,931,143 8.8% 54.1% 82,342 -41.0% 26.1% 233,660 -16.0% 73.9%
YE 201406 31,957,044 -4.6% 47.3% 52.7% 14,977,845 -1.7% 47.3% 16,657,331 -7.1% 52.7% 124,056 50.7% 38.5% 197,812 -15.3% 61.5%
Central America
2013 6 3,153,066 5.0% 74.0% 26.0% 2,276,451 4.5% 74.0% 799,817 7.3% 26.0% 58,178 -11.8% 75.8% 18,620 31.4% 24.2%
2014 6 3,545,744 12.5% 73.5% 26.5% 2,536,316 11.4% 73.7% 906,750 13.4% 26.3% 71,120 22.2% 69.3% 31,558 69.5% 30.7%
YE 201206 35,340,504 -50.6% 74.8% 25.2% 26,000,347 2.2% 74.8% 8,768,935 17.5% 25.2% 437,672 5.9% 76.6% 133,550 -36.3% 23.4%
YE 201306 37,084,547 4.9% 72.7% 27.3% 26,305,425 1.2% 72.4% 10,015,449 14.2% 27.6% 650,076 48.5% 85.1% 113,597 -14.9% 14.9%
YE 201406 39,973,012 7.8% 72.4% 27.6% 28,181,120 7.1% 72.1% 10,924,217 9.1% 27.9% 743,271 14.3% 85.7% 124,404 9.5% 14.3%
Europe
2013 6 6,223,151 2.4% 43.6% 56.4% 2,703,796 0.9% 43.8% 3,470,167 3.6% 56.2% 10,166 286.2% 20.7% 39,022 -14.5% 79.3%
2014 6 6,527,981 4.9% 43.3% 56.7% 2,818,653 4.2% 43.5% 3,665,142 5.6% 56.5% 5,417 -46.7% 12.3% 38,769 -0.6% 87.7%
YE 201206 63,626,238 -52.8% 43.9% 56.1% 27,892,412 -2.8% 44.1% 35,400,325 3.6% 55.9% 30,370 0.3% 9.1% 303,131 -18.9% 90.9%
YE 201306 62,958,183 -1.0% 42.6% 57.4% 26,760,770 -4.1% 42.7% 35,856,674 1.3% 57.3% 39,393 29.7% 11.6% 301,346 -0.6% 88.4%
YE 201406 65,721,799 4.4% 42.2% 57.8% 27,659,539 3.4% 42.3% 37,753,988 5.3% 57.7% 83,326 111.5% 27.0% 224,946 -25.4% 73.0%
Source : U.S. Department of Transportation T-100 Segment Data. Page 3 of 8
1- Due to extensive code-sharing agreements passenger and cargo data for U.S. carriers presented in this table might understate U.S. carrier presence in certain markets.
Please see the report's introduction for further details.

Table 2 : U.S.-International Nonstop Data By World Area 1/Passengers, Available Seats, Departures and Freight Totals By Month
Available Seats
Total Seats Scheduled Service Nonscheduled Service
Year/ U.S. Foreign US Flag Foreign Flag US Flag Foreign Flag
Year Market Market Yr/Yr Market Yr/Yr Market Yr/Yr Market Yr/Yr Market
Region Period Total Change Share Share Total Change Share Total Change Share Total Change Share Total Change Share
Far East
2013 6 2,787,535 6.3% 43.0% 57.0% 1,197,366 2.1% 43.1% 1,583,579 9.5% 56.9% 354 0.0% 5.4% 6,236 232.8% 94.6%
2014 6 2,904,478 4.2% 41.7% 58.3% 1,204,950 0.6% 41.6% 1,694,379 7.0% 58.4% 4,901 1284.5% 95.2% 248 -96.0% 4.8%
YE 201206 31,393,220 -80.8% 44.1% 55.9% 13,775,564 8.2% 44.2% 17,405,851 8.9% 55.8% 58,610 23.1% 27.7% 153,195 13.3% 72.3%
YE 201306 32,512,799 3.6% 43.2% 56.8% 14,009,316 1.7% 43.4% 18,244,053 4.8% 56.6% 32,938 -43.8% 12.7% 226,492 47.8% 87.3%
YE 201406 34,285,615 5.5% 41.4% 58.6% 14,127,891 0.8% 41.4% 19,973,420 9.5% 58.6% 58,168 76.6% 31.6% 126,136 -44.3% 68.4%
Middle East
2013 6 738,249 16.8% 19.4% 80.6% 143,522 11.5% 19.5% 593,971 18.3% 80.5% - -100.0% 0.0% 756 -31.8% 100.0%
2014 6 862,028 16.8% 14.4% 85.6% 124,378 -13.3% 14.4% 737,186 24.1% 85.6% - 0.0% 0.0% 464 -38.6% 100.0%
YE 201206 6,958,905 -95.9% 23.0% 77.0% 1,601,483 -10.6% 23.1% 5,343,460 19.5% 76.9% 1,429 0.0% 10.2% 12,533 61.8% 89.8%
YE 201306 7,632,538 9.7% 21.5% 78.5% 1,621,365 1.2% 21.3% 5,987,911 12.1% 78.7% 17,955 1156.5% 77.2% 5,307 -57.7% 22.8%
YE 201406 8,802,082 15.3% 16.4% 83.6% 1,445,218 -10.9% 16.4% 7,350,997 22.8% 83.6% - -100.0% 0.0% 5,867 10.6% 100.0%
South America
2013 6 1,428,727 12.4% 63.3% 36.7% 903,031 12.5% 63.3% 524,508 14.8% 36.7% 1,188 -88.7% 100.0% - -100.0% 0.0%
2014 6 1,562,092 9.3% 62.2% 37.8% 962,389 6.6% 62.0% 590,666 12.6% 38.0% 8,982 656.1% 99.4% 55 0.0% 0.6%
YE 201206 15,290,135 -91.7% 62.8% 37.2% 9,516,592 2.8% 62.6% 5,683,711 4.4% 37.4% 82,986 538.9% 92.4% 6,846 376.7% 7.6%
YE 201306 16,871,698 10.3% 62.1% 37.9% 10,362,862 8.9% 61.8% 6,396,122 12.5% 38.2% 112,150 35.1% 99.5% 564 -91.8% 0.5%
YE 201406 18,193,381 7.8% 62.0% 38.0% 11,245,062 8.5% 62.0% 6,906,055 8.0% 38.0% 41,906 -62.6% 99.2% 358 -36.5% 0.8%
The Carribean
2013 6 2,154,473 -3.4% 89.7% 10.3% 1,780,108 0.3% 88.9% 222,586 -11.5% 11.1% 151,779 -25.5% 100.0% - -100.0% 0.0%
2014 6 2,458,591 14.1% 90.1% 9.9% 2,038,009 14.5% 89.3% 243,937 9.6% 10.7% 176,631 16.4% 100.0% 14 0.0% 0.0%
YE 201206 24,713,744 -88.1% 87.6% 12.4% 19,719,114 3.1% 86.5% 3,069,608 5.4% 13.5% 1,922,067 54.4% 99.8% 2,955 -89.9% 0.2%
YE 201306 24,339,916 -1.5% 87.7% 12.3% 19,680,453 -0.2% 86.8% 2,981,630 -2.9% 13.2% 1,676,140 -12.8% 99.9% 1,693 -42.7% 0.1%
YE 201406 25,349,901 4.1% 89.0% 11.0% 20,847,815 5.9% 88.2% 2,789,931 -6.4% 11.8% 1,710,681 2.1% 99.9% 1,474 -12.9% 0.1%
Page 4 of 8
Source : U.S. Department of Transportation T-100 Segment Data.
1- Due to extensive code-sharing agreements passenger and cargo data for U.S. carriers presented in this table might understate U.S. carrier presence in certain markets.
Please see the report's introduction for further details.

Table 2 : U.S.-International Nonstop Data By World Area 1/Passengers, Available Seats, Departures and Freight Totals By Month
Departures
Total Departures Scheduled Service Nonscheduled Service
Year/ U.S. Foreign US Flag Foreign Flag US Flag Foreign Flag
Year Market Market Yr/Yr Market Yr/Yr Market Yr/Yr Market Yr/Yr Market
Region Period Total Change Share Share Total Change Share Total Change Share Total Change Share Total Change Share
Africa
2013 6 643 -7.2% 42.8% 57.2% 249 -13.5% 40.4% 367 -1.3% 59.6% 26 -16.1% 96.3% 1 -50.0% 3.7%
2014 6 654 1.7% 44.2% 55.8% 261 4.8% 41.7% 365 -0.5% 58.3% 28 7.7% 100.0% - -100.0% 0.0%
YE 201206 7,622 -1.2% 47.0% 53.0% 3,246 -7.3% 44.6% 4,029 4.3% 55.4% 333 -0.3% 96.0% 14 7.7% 4.0%
YE 201306 7,314 -4.0% 43.8% 56.2% 2,841 -12.5% 41.0% 4,096 1.7% 59.0% 360 8.1% 95.5% 17 21.4% 4.5%
YE 201406 7,255 -0.8% 44.5% 55.5% 2,886 1.6% 41.8% 4,015 -2.0% 58.2% 341 -5.3% 96.3% 13 -23.5% 3.7%
Australia/Oceania
2013 6 1,919 4.8% 29.7% 70.3% 509 12.1% 27.4% 1,349 3.4% 72.6% 61 -15.3% 100.0% - 0.0% 0.0%
2014 6 2,013 4.9% 28.6% 71.4% 514 1.0% 26.3% 1,437 6.5% 73.7% 62 1.6% 100.0% - 0.0% 0.0%
YE 201206 21,912 -24.5% 29.6% 70.4% 5,626 -5.8% 26.7% 15,416 6.1% 73.3% 866 11.0% 99.5% 4 -90.5% 0.5%
YE 201306 21,958 0.2% 31.2% 68.8% 5,916 5.2% 28.1% 15,107 -2.0% 71.9% 924 6.7% 98.8% 11 175.0% 1.2%
YE 201406 23,294 6.1% 30.1% 69.9% 6,225 5.2% 27.7% 16,279 7.8% 72.3% 784 -15.2% 99.2% 6 -45.5% 0.8%
Canada
2013 6 34,429 -3.1% 55.3% 44.7% 18,773 -3.0% 55.4% 15,088 -3.4% 44.6% 256 2.4% 45.1% 312 -0.3% 54.9%
2014 6 32,528 -5.5% 57.9% 42.1% 18,548 -1.2% 57.9% 13,479 -10.7% 42.1% 271 5.9% 54.1% 230 -26.3% 45.9%
YE 201206 417,185 -6.6% 54.2% 45.8% 222,900 -2.3% 54.5% 186,232 2.7% 45.5% 3,265 1.8% 40.5% 4,788 -7.6% 59.5%
YE 201306 425,971 2.1% 53.0% 47.0% 223,378 0.2% 53.3% 196,004 5.2% 46.7% 2,362 -27.7% 35.8% 4,227 -11.7% 64.2%
YE 201406 393,606 -7.6% 55.1% 44.9% 214,169 -4.1% 55.3% 172,992 -11.7% 44.7% 2,593 9.8% 40.2% 3,852 -8.9% 59.8%
Central America
2013 6 26,069 3.2% 74.8% 25.2% 18,732 2.2% 74.5% 6,422 8.3% 25.5% 762 -15.7% 83.3% 153 39.1% 16.7%
2014 6 27,840 6.8% 75.0% 25.0% 20,142 7.5% 74.9% 6,735 4.9% 25.1% 730 -4.2% 75.8% 233 52.3% 24.2%
YE 201206 295,187 -59.3% 75.6% 24.4% 213,858 5.1% 75.0% 71,115 12.7% 25.0% 9,252 -17.1% 90.6% 962 -35.6% 9.4%
YE 201306 308,437 4.5% 73.7% 26.3% 218,450 2.1% 73.1% 80,187 12.8% 26.9% 8,905 -3.8% 90.9% 895 -7.0% 9.1%
YE 201406 322,188 4.5% 73.8% 26.2% 228,792 4.7% 73.3% 83,190 3.7% 26.7% 9,080 2.0% 89.0% 1,126 25.8% 11.0%
Europe
2013 6 25,763 1.1% 49.1% 50.9% 12,405 -1.4% 49.1% 12,864 3.4% 50.9% 251 10.6% 50.8% 243 -0.4% 49.2%
2014 6 26,520 2.9% 49.3% 50.7% 12,817 3.3% 49.3% 13,191 2.5% 50.7% 248 -1.2% 48.4% 264 8.6% 51.6%
YE 201206 272,514 -72.7% 49.8% 50.2% 132,552 -2.1% 49.6% 134,459 1.9% 50.4% 3,133 -15.6% 56.9% 2,370 -0.5% 43.1%
YE 201306 264,974 -2.8% 48.7% 51.3% 126,155 -4.8% 48.5% 133,811 -0.5% 51.5% 2,764 -11.8% 55.2% 2,244 -5.3% 44.8%
YE 201406 272,236 2.7% 47.8% 52.2% 127,237 0.9% 47.6% 140,047 4.7% 52.4% 2,917 5.5% 58.9% 2,035 -9.3% 41.1%
Source : U.S. Department of Transportation T-100 Segment Data. Page 5 of 8
1- Due to extensive code-sharing agreements passenger and cargo data for U.S. carriers presented in this table might understate U.S. carrier presence in certain markets.
Please see the report's introduction for further details.

Table 2 : U.S.-International Nonstop Data By World Area 1/Passengers, Available Seats, Departures and Freight Totals By Month
Departures
Total Departures Scheduled Service Nonscheduled Service
Year/ U.S. Foreign US Flag Foreign Flag US Flag Foreign Flag
Year Market Market Yr/Yr Market Yr/Yr Market Yr/Yr Market Yr/Yr Market
Region Period Total Change Share Share Total Change Share Total Change Share Total Change Share Total Change Share
Far East
2013 6 12,882 3.6% 45.1% 54.9% 5,449 -1.6% 43.9% 6,956 6.1% 56.1% 363 31.0% 76.1% 114 67.6% 23.9%
2014 6 13,342 3.6% 43.2% 56.8% 5,349 -1.8% 41.6% 7,500 7.8% 58.4% 418 15.2% 84.8% 75 -34.2% 15.2%
YE 201206 150,661 -86.8% 46.0% 54.0% 66,064 5.4% 45.2% 79,960 3.9% 54.8% 3,196 -4.8% 68.9% 1,441 -34.5% 31.1%
YE 201306 151,947 0.9% 45.7% 54.3% 65,161 -1.4% 44.6% 80,934 1.2% 55.4% 4,303 34.6% 73.5% 1,549 7.5% 26.5%
YE 201406 159,383 4.9% 43.5% 56.5% 64,522 -1.0% 42.1% 88,916 9.9% 57.9% 4,809 11.8% 80.9% 1,136 -26.7% 19.1%
Middle East
2013 6 2,532 14.5% 23.9% 76.1% 556 14.2% 22.5% 1,911 13.7% 77.5% 50 38.9% 76.9% 15 87.5% 23.1%
2014 6 2,841 12.2% 17.4% 82.6% 463 -16.7% 16.5% 2,341 22.5% 83.5% 31 -38.0% 83.8% 6 -60.0% 16.2%
YE 201206 24,251 -97.9% 26.3% 73.7% 6,003 -8.7% 25.2% 17,797 17.8% 74.8% 375 135.8% 83.1% 76 20.6% 16.9%
YE 201306 26,878 10.8% 25.5% 74.5% 6,213 3.5% 23.7% 19,948 12.1% 76.3% 637 69.9% 88.8% 80 5.3% 11.2%
YE 201406 29,588 10.1% 19.9% 80.1% 5,405 -13.0% 18.6% 23,596 18.3% 81.4% 484 -24.0% 82.5% 103 28.8% 17.5%
South America
2013 6 8,429 8.1% 63.6% 36.4% 5,005 9.1% 62.2% 3,048 12.7% 37.8% 357 -26.5% 94.9% 19 0.0% 5.1%
2014 6 9,236 9.6% 63.0% 37.0% 5,444 8.8% 61.6% 3,398 11.5% 38.4% 372 4.2% 94.4% 22 15.8% 5.6%
YE 201206 97,673 -92.3% 62.1% 37.9% 54,862 5.1% 59.9% 36,708 0.5% 40.1% 5,798 8.3% 95.0% 305 -78.7% 5.0%
YE 201306 102,929 5.4% 61.5% 38.5% 57,994 5.7% 59.5% 39,399 7.3% 40.5% 5,333 -8.0% 96.3% 203 -33.4% 3.7%
YE 201406 107,374 4.3% 61.9% 38.1% 62,205 7.3% 60.5% 40,692 3.3% 39.5% 4,246 -20.4% 94.8% 231 13.8% 5.2%
The Carribean
2013 6 18,370 -1.4% 90.4% 9.6% 15,522 1.9% 90.0% 1,718 -11.4% 10.0% 1,084 -22.6% 95.9% 46 -22.0% 4.1%
2014 6 20,681 12.6% 90.8% 9.2% 17,437 12.3% 90.3% 1,865 8.6% 9.7% 1,338 23.4% 97.0% 41 -10.9% 3.0%
YE 201206 209,923 -85.6% 88.6% 11.4% 171,461 4.0% 88.1% 23,157 4.0% 11.9% 14,611 18.5% 95.5% 694 -15.3% 4.5%
YE 201306 208,204 -0.8% 88.8% 11.2% 172,495 0.6% 88.4% 22,529 -2.7% 11.6% 12,408 -15.1% 94.1% 772 11.2% 5.9%
YE 201406 218,276 4.8% 89.8% 10.2% 183,094 6.1% 89.4% 21,672 -3.8% 10.6% 12,949 4.4% 95.8% 561 -27.3% 4.2%
Source : U.S. Department of Transportation T-100 Segment Data. Page 6 of 8
1- Due to extensive code-sharing agreements passenger and cargo data for U.S. carriers presented in this table might understate U.S. carrier presence in certain markets.
Please see the report's introduction for further details.

Table 2 : U.S.-International Nonstop Data By World Area 1/Passengers, Available Seats, Departures and Freight Totals By Month
Freight (Tons)
Total Freight Scheduled Service Nonscheduled Service
Year/ U.S. Foreign US Flag Foreign Flag US Flag Foreign Flag
Year Market Market Yr/Yr Market Yr/Yr Market Yr/Yr Market Yr/Yr Market
Region Period Total Change Share Share Total Change Share Total Change Share Total Change Share Total Change Share
Africa
2013 6 3,141 -6.6% 47.1% 52.9% 774 -7.9% 31.8% 1,661 -6.7% 68.2% 705 -4.5% 100.0% - 0.0% 0.0%
2014 6 3,256 3.7% 47.4% 52.6% 685 -11.5% 28.6% 1,712 3.1% 71.4% 859 21.8% 100.0% - 0.0% 0.0%
YE 201206 34,475 7.8% 48.4% 51.6% 10,145 -12.5% 36.3% 17,791 19.2% 63.7% 6,539 21.0% 100.0% - -100.0% 0.0%
YE 201306 36,494 5.9% 45.8% 54.2% 9,507 -6.3% 32.8% 19,494 9.6% 67.2% 7,211 10.3% 96.2% 282 0.0% 3.8%
YE 201406 34,625 -5.1% 46.6% 53.4% 8,125 -14.5% 30.8% 18,231 -6.5% 69.2% 7,998 10.9% 96.7% 272 -3.6% 3.3%
Australia/Oceania
2013 6 14,543 -7.8% 48.0% 52.0% 4,553 -2.7% 37.6% 7,565 -9.4% 62.4% 2,425 -11.7% 100.0% - 0.0% 0.0%
2014 6 15,836 8.9% 42.7% 57.3% 4,592 0.8% 33.6% 9,081 20.0% 66.4% 2,163 -10.8% 100.0% - 0.0% 0.0%
YE 201206 172,196 -14.6% 49.2% 50.8% 54,794 -4.6% 38.5% 87,443 6.3% 61.5% 29,896 7.2% 99.8% 64 -96.9% 0.2%
YE 201306 183,027 6.3% 50.8% 49.2% 55,865 2.0% 38.4% 89,777 2.7% 61.6% 37,184 24.4% 99.5% 200 214.6% 0.5%
YE 201406 180,908 -1.2% 45.1% 54.9% 54,788 -1.9% 35.6% 99,280 10.6% 64.4% 26,811 -27.9% 99.9% 29 -85.3% 0.1%
Canada
2013 6 28,136 1.2% 75.8% 24.2% 19,519 -6.1% 78.9% 5,214 4.5% 21.1% 1,815 179.5% 53.3% 1,588 15.1% 46.7%
2014 6 28,169 0.1% 75.5% 24.5% 19,497 -0.1% 80.5% 4,732 -9.3% 19.5% 1,781 -1.9% 45.2% 2,159 36.0% 54.8%
YE 201206 330,747 -40.6% 76.0% 24.0% 233,894 1.9% 79.4% 60,865 -27.3% 20.6% 17,473 4.8% 48.6% 18,515 -28.1% 51.4%
YE 201306 326,997 -1.1% 76.3% 23.7% 237,281 1.4% 79.6% 60,920 0.1% 20.4% 12,344 -29.4% 42.9% 16,453 -11.1% 57.1%
YE 201406 330,366 1.0% 76.6% 23.4% 234,926 -1.0% 79.4% 61,131 0.3% 20.6% 18,096 46.6% 52.7% 16,214 -1.4% 47.3%
Central America
2013 6 55,750 -3.9% 64.1% 35.9% 30,229 8.9% 60.2% 19,951 -11.1% 39.8% 5,480 -28.9% 98.4% 90 -9.3% 1.6%
2014 6 49,044 -12.0% 71.4% 28.6% 30,728 1.7% 69.5% 13,474 -32.5% 30.5% 4,298 -21.6% 88.8% 545 508.2% 11.2%
YE 201206 685,931 -45.2% 63.3% 36.7% 323,242 8.1% 56.3% 250,481 0.4% 43.7% 111,062 -22.7% 99.0% 1,147 -57.1% 1.0%
YE 201306 650,656 -5.1% 63.2% 36.8% 349,348 8.1% 59.4% 239,170 -4.5% 40.6% 61,586 -44.5% 99.1% 553 -51.8% 0.9%
YE 201406 648,814 -0.3% 67.7% 32.3% 375,496 7.5% 65.4% 198,730 -16.9% 34.6% 63,984 3.9% 85.8% 10,605 1819.2% 14.2%
Europe
2013 6 248,465 -0.2% 39.7% 60.3% 83,403 -4.7% 36.6% 144,312 -0.1% 63.4% 15,276 5.1% 73.6% 5,474 121.0% 26.4%
2014 6 251,427 1.2% 42.3% 57.7% 88,710 6.4% 38.8% 139,924 -3.0% 61.2% 17,592 15.2% 77.2% 5,202 -5.0% 22.8%
YE 201206 2,964,371 -32.1% 40.9% 59.1% 1,024,441 -7.6% 37.5% 1,705,780 -3.0% 62.5% 189,068 -10.2% 80.7% 45,081 38.4% 19.3%
YE 201306 2,813,203 -5.1% 40.7% 59.3% 967,640 -5.5% 37.3% 1,628,073 -4.6% 62.7% 176,566 -6.6% 81.2% 40,924 -9.2% 18.8%
YE 201406 2,917,855 3.7% 41.3% 58.7% 1,013,050 4.7% 37.8% 1,665,742 2.3% 62.2% 192,706 9.1% 80.6% 46,356 13.3% 19.4%
Source : U.S. Department of Transportation T-100 Segment Data. Page 7 of 8
1- Due to extensive code-sharing agreements passenger and cargo data for U.S. carriers presented in this table might understate U.S. carrier presence in certain markets.
Please see the report's introduction for further details.
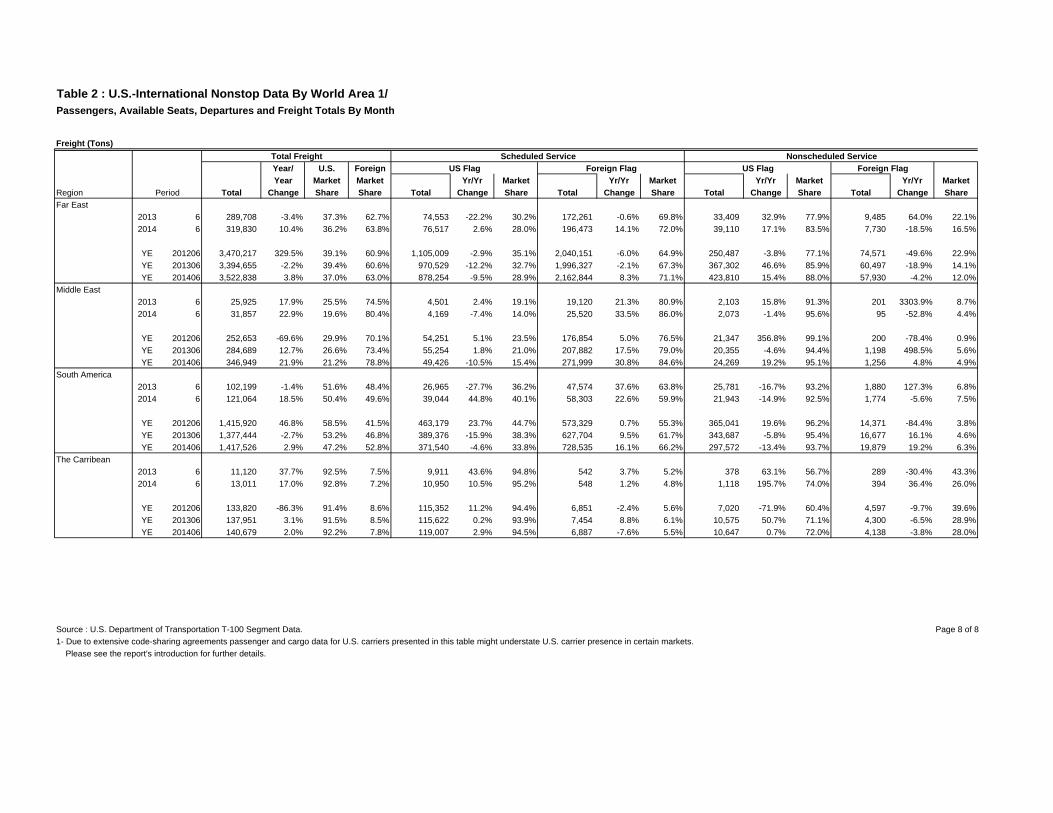
Table 2 : U.S.-International Nonstop Data By World Area 1/Passengers, Available Seats, Departures and Freight Totals By Month
Freight (Tons)
Total Freight Scheduled Service Nonscheduled Service
Year/ U.S. Foreign US Flag Foreign Flag US Flag Foreign Flag
Year Market Market Yr/Yr Market Yr/Yr Market Yr/Yr Market Yr/Yr Market
Region Period Total Change Share Share Total Change Share Total Change Share Total Change Share Total Change Share
Far East
2013 6 289,708 -3.4% 37.3% 62.7% 74,553 -22.2% 30.2% 172,261 -0.6% 69.8% 33,409 32.9% 77.9% 9,485 64.0% 22.1%
2014 6 319,830 10.4% 36.2% 63.8% 76,517 2.6% 28.0% 196,473 14.1% 72.0% 39,110 17.1% 83.5% 7,730 -18.5% 16.5%
YE 201206 3,470,217 329.5% 39.1% 60.9% 1,105,009 -2.9% 35.1% 2,040,151 -6.0% 64.9% 250,487 -3.8% 77.1% 74,571 -49.6% 22.9%
YE 201306 3,394,655 -2.2% 39.4% 60.6% 970,529 -12.2% 32.7% 1,996,327 -2.1% 67.3% 367,302 46.6% 85.9% 60,497 -18.9% 14.1%
YE 201406 3,522,838 3.8% 37.0% 63.0% 878,254 -9.5% 28.9% 2,162,844 8.3% 71.1% 423,810 15.4% 88.0% 57,930 -4.2% 12.0%
Middle East
2013 6 25,925 17.9% 25.5% 74.5% 4,501 2.4% 19.1% 19,120 21.3% 80.9% 2,103 15.8% 91.3% 201 3303.9% 8.7%
2014 6 31,857 22.9% 19.6% 80.4% 4,169 -7.4% 14.0% 25,520 33.5% 86.0% 2,073 -1.4% 95.6% 95 -52.8% 4.4%
YE 201206 252,653 -69.6% 29.9% 70.1% 54,251 5.1% 23.5% 176,854 5.0% 76.5% 21,347 356.8% 99.1% 200 -78.4% 0.9%
YE 201306 284,689 12.7% 26.6% 73.4% 55,254 1.8% 21.0% 207,882 17.5% 79.0% 20,355 -4.6% 94.4% 1,198 498.5% 5.6%
YE 201406 346,949 21.9% 21.2% 78.8% 49,426 -10.5% 15.4% 271,999 30.8% 84.6% 24,269 19.2% 95.1% 1,256 4.8% 4.9%
South America
2013 6 102,199 -1.4% 51.6% 48.4% 26,965 -27.7% 36.2% 47,574 37.6% 63.8% 25,781 -16.7% 93.2% 1,880 127.3% 6.8%
2014 6 121,064 18.5% 50.4% 49.6% 39,044 44.8% 40.1% 58,303 22.6% 59.9% 21,943 -14.9% 92.5% 1,774 -5.6% 7.5%
YE 201206 1,415,920 46.8% 58.5% 41.5% 463,179 23.7% 44.7% 573,329 0.7% 55.3% 365,041 19.6% 96.2% 14,371 -84.4% 3.8%
YE 201306 1,377,444 -2.7% 53.2% 46.8% 389,376 -15.9% 38.3% 627,704 9.5% 61.7% 343,687 -5.8% 95.4% 16,677 16.1% 4.6%
YE 201406 1,417,526 2.9% 47.2% 52.8% 371,540 -4.6% 33.8% 728,535 16.1% 66.2% 297,572 -13.4% 93.7% 19,879 19.2% 6.3%
The Carribean
2013 6 11,120 37.7% 92.5% 7.5% 9,911 43.6% 94.8% 542 3.7% 5.2% 378 63.1% 56.7% 289 -30.4% 43.3%
2014 6 13,011 17.0% 92.8% 7.2% 10,950 10.5% 95.2% 548 1.2% 4.8% 1,118 195.7% 74.0% 394 36.4% 26.0%
YE 201206 133,820 -86.3% 91.4% 8.6% 115,352 11.2% 94.4% 6,851 -2.4% 5.6% 7,020 -71.9% 60.4% 4,597 -9.7% 39.6%
YE 201306 137,951 3.1% 91.5% 8.5% 115,622 0.2% 93.9% 7,454 8.8% 6.1% 10,575 50.7% 71.1% 4,300 -6.5% 28.9%
YE 201406 140,679 2.0% 92.2% 7.8% 119,007 2.9% 94.5% 6,887 -7.6% 5.5% 10,647 0.7% 72.0% 4,138 -3.8% 28.0%
Source : U.S. Department of Transportation T-100 Segment Data. Page 8 of 8
1- Due to extensive code-sharing agreements passenger and cargo data for U.S. carriers presented in this table might understate U.S. carrier presence in certain markets.
Please see the report's introduction for further details.

Table 3 : Top 25 Foreign Country Gateways 1/
Passengers
Total Traffic Scheduled Service Nonscheduled Service
Foreign US Flag Foreign Flag US Flag Foreign Flag
Yr/Yr US Mkt Market Yr/Yr Market Yr/Yr Market Yr/Yr Market Yr/Yr Market
Country 2/ Period Total Chg. Share Share Total Chg. Share Total Chg. Share Total Chg. Share Total Chg. Share
Canada 2013 6 1,996,975 3.4% 50.5% 49.5% 1,006,679 4.4% 50.7% 979,259 2.3% 49.3% 1,632 -17.7% 14.8% 9,405 9.7% 85.2%
2014 6 2,041,065 2.2% 52.1% 47.9% 1,060,310 5.3% 52.1% 976,527 -0.3% 47.9% 3,923 140.4% 92.8% 305 -96.8% 7.2%
YE 201206 23,616,286 3.6% 47.2% 52.8% 11,084,089 -1.6% 47.5% 12,237,115 8.7% 52.5% 63,619 7.6% 21.6% 231,463 3.7% 78.4%
YE 201306 24,999,578 5.9% 45.8% 54.2% 11,416,688 3.0% 46.1% 13,362,042 9.2% 53.9% 33,746 -47.0% 15.3% 187,102 -19.2% 84.7%
YE 201406 24,999,173 0.0% 47.7% 52.3% 11,881,291 4.1% 47.9% 12,908,022 -3.4% 52.1% 48,033 42.3% 22.9% 161,827 -13.5% 77.1%
Mexico 2013 6 1,802,981 12.7% 77.4% 22.6% 1,361,979 9.3% 77.7% 390,419 26.0% 22.3% 34,055 10.5% 67.3% 16,528 39.7% 32.7%
2014 6 1,969,933 9.3% 77.0% 23.0% 1,482,135 8.8% 77.7% 425,792 9.1% 22.3% 34,728 2.0% 56.0% 27,278 65.0% 44.0%
YE 201206 18,788,681 5.0% 79.3% 20.7% 14,735,303 2.9% 79.6% 3,782,376 14.6% 20.4% 172,830 26.4% 63.8% 98,172 -34.4% 36.2%
YE 201306 20,003,179 6.5% 77.4% 22.6% 15,157,100 2.9% 77.3% 4,453,013 17.7% 22.7% 315,603 82.6% 80.3% 77,463 -21.1% 19.7%
YE 201406 21,833,127 9.1% 76.6% 23.4% 16,363,332 8.0% 76.5% 5,020,212 12.7% 23.5% 362,552 14.9% 80.6% 87,031 12.4% 19.4%
United Kingdom 2013 6 1,704,456 1.1% 39.9% 60.1% 679,026 -0.6% 40.6% 991,724 2.8% 59.4% 383 1640.9% 1.1% 33,323 -11.8% 98.9%
2014 6 1,697,358 -0.4% 39.5% 60.5% 670,987 -1.2% 40.2% 996,215 0.5% 59.8% 11 -97.1% 0.0% 30,145 -9.5% 100.0%
YE 201206 16,910,312 3.2% 39.8% 60.2% 6,724,503 -1.1% 40.3% 9,952,561 7.4% 59.7% 1,066 -42.9% 0.5% 232,182 -25.5% 99.5%
YE 201306 16,998,525 0.5% 38.7% 61.3% 6,582,407 -2.1% 39.3% 10,171,528 2.2% 60.7% 2,172 103.8% 0.9% 242,418 4.4% 99.1%
YE 201406 17,203,589 1.2% 38.6% 61.4% 6,639,652 0.9% 39.0% 10,383,455 2.1% 61.0% 1,841 -15.2% 1.0% 178,641 -26.3% 99.0%
Japan 2013 6 1,018,227 3.2% 64.4% 35.6% 656,078 -0.6% 64.5% 361,306 11.0% 35.5% - 0.0% 0.0% 843 -22.4% 100.0%
2014 6 974,692 -4.3% 62.2% 37.8% 605,827 -7.7% 62.2% 368,855 2.1% 37.8% 10 0.0% 100.0% - -100.0% 0.0%
YE 201206 10,900,480 6.3% 66.0% 34.0% 7,177,386 5.5% 66.7% 3,583,583 7.2% 33.3% 22,016 87.4% 15.8% 117,495 22.2% 84.2%
YE 201306 11,776,968 8.0% 64.3% 35.7% 7,557,172 5.3% 65.2% 4,039,805 12.7% 34.8% 19,194 -12.8% 10.7% 160,797 36.9% 89.3%
YE 201406 11,644,749 -1.1% 62.1% 37.9% 7,220,893 -4.4% 62.5% 4,328,883 7.2% 37.5% 6,488 -66.2% 6.8% 88,485 -45.0% 93.2%
Germany 2013 6 1,039,035 4.3% 35.2% 64.8% 365,728 -0.2% 35.2% 673,234 7.0% 64.8% 68 0.0% 93.2% 5 -16.7% 6.8%
2014 6 1,043,201 0.4% 33.9% 66.1% 354,052 -3.2% 33.9% 689,145 2.4% 66.1% - -100.0% 0.0% 4 -20.0% 100.0%
YE 201206 9,718,843 1.3% 36.8% 63.2% 3,571,400 -1.7% 36.8% 6,143,788 3.1% 63.2% 2,961 116.8% 81.0% 694 41.6% 19.0%
YE 201306 9,951,553 2.4% 35.8% 64.2% 3,558,215 -0.4% 35.8% 6,390,981 4.0% 64.2% 1,883 -36.4% 79.9% 474 -31.7% 20.1%
YE 201406 10,239,893 2.9% 35.1% 64.9% 3,591,949 0.9% 35.1% 6,644,829 4.0% 64.9% 2,903 54.2% 93.2% 212 -55.3% 6.8%
Source : U.S. Department of Transportation T-100 Segment Data. Page 1 of 5
1/ Due to extensive code-sharing agreements passenger and cargo data for U.S. carriers presented in this table might understate U.S. carrier presence in certain markets.
Please see the report's introduction for further details.
2/ Ranked in descending order according to YE 201406 data.
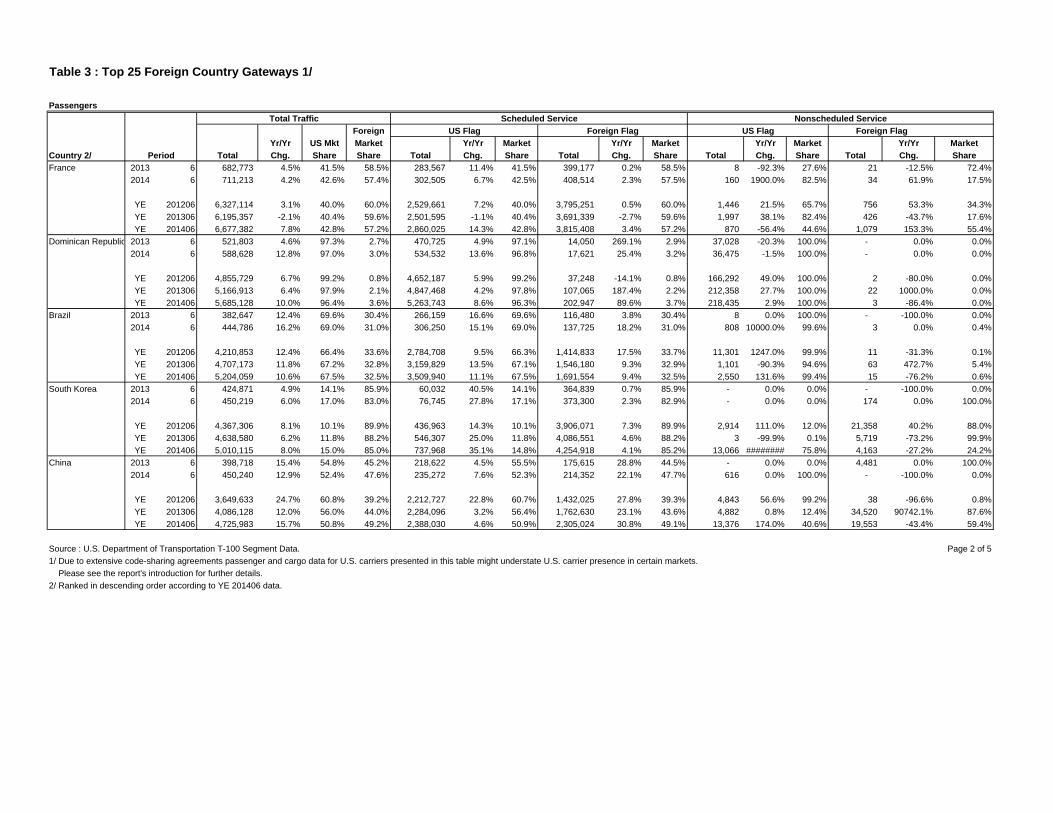
Table 3 : Top 25 Foreign Country Gateways 1/
Passengers
Total Traffic Scheduled Service Nonscheduled Service
Foreign US Flag Foreign Flag US Flag Foreign Flag
Yr/Yr US Mkt Market Yr/Yr Market Yr/Yr Market Yr/Yr Market Yr/Yr Market
Country 2/ Period Total Chg. Share Share Total Chg. Share Total Chg. Share Total Chg. Share Total Chg. Share
France 2013 6 682,773 4.5% 41.5% 58.5% 283,567 11.4% 41.5% 399,177 0.2% 58.5% 8 -92.3% 27.6% 21 -12.5% 72.4%
2014 6 711,213 4.2% 42.6% 57.4% 302,505 6.7% 42.5% 408,514 2.3% 57.5% 160 1900.0% 82.5% 34 61.9% 17.5%
YE 201206 6,327,114 3.1% 40.0% 60.0% 2,529,661 7.2% 40.0% 3,795,251 0.5% 60.0% 1,446 21.5% 65.7% 756 53.3% 34.3%
YE 201306 6,195,357 -2.1% 40.4% 59.6% 2,501,595 -1.1% 40.4% 3,691,339 -2.7% 59.6% 1,997 38.1% 82.4% 426 -43.7% 17.6%
YE 201406 6,677,382 7.8% 42.8% 57.2% 2,860,025 14.3% 42.8% 3,815,408 3.4% 57.2% 870 -56.4% 44.6% 1,079 153.3% 55.4%
Dominican Republic 2013 6 521,803 4.6% 97.3% 2.7% 470,725 4.9% 97.1% 14,050 269.1% 2.9% 37,028 -20.3% 100.0% - 0.0% 0.0%
2014 6 588,628 12.8% 97.0% 3.0% 534,532 13.6% 96.8% 17,621 25.4% 3.2% 36,475 -1.5% 100.0% - 0.0% 0.0%
YE 201206 4,855,729 6.7% 99.2% 0.8% 4,652,187 5.9% 99.2% 37,248 -14.1% 0.8% 166,292 49.0% 100.0% 2 -80.0% 0.0%
YE 201306 5,166,913 6.4% 97.9% 2.1% 4,847,468 4.2% 97.8% 107,065 187.4% 2.2% 212,358 27.7% 100.0% 22 1000.0% 0.0%
YE 201406 5,685,128 10.0% 96.4% 3.6% 5,263,743 8.6% 96.3% 202,947 89.6% 3.7% 218,435 2.9% 100.0% 3 -86.4% 0.0%
Brazil 2013 6 382,647 12.4% 69.6% 30.4% 266,159 16.6% 69.6% 116,480 3.8% 30.4% 8 0.0% 100.0% - -100.0% 0.0%
2014 6 444,786 16.2% 69.0% 31.0% 306,250 15.1% 69.0% 137,725 18.2% 31.0% 808 10000.0% 99.6% 3 0.0% 0.4%
YE 201206 4,210,853 12.4% 66.4% 33.6% 2,784,708 9.5% 66.3% 1,414,833 17.5% 33.7% 11,301 1247.0% 99.9% 11 -31.3% 0.1%
YE 201306 4,707,173 11.8% 67.2% 32.8% 3,159,829 13.5% 67.1% 1,546,180 9.3% 32.9% 1,101 -90.3% 94.6% 63 472.7% 5.4%
YE 201406 5,204,059 10.6% 67.5% 32.5% 3,509,940 11.1% 67.5% 1,691,554 9.4% 32.5% 2,550 131.6% 99.4% 15 -76.2% 0.6%
South Korea 2013 6 424,871 4.9% 14.1% 85.9% 60,032 40.5% 14.1% 364,839 0.7% 85.9% - 0.0% 0.0% - -100.0% 0.0%
2014 6 450,219 6.0% 17.0% 83.0% 76,745 27.8% 17.1% 373,300 2.3% 82.9% - 0.0% 0.0% 174 0.0% 100.0%
YE 201206 4,367,306 8.1% 10.1% 89.9% 436,963 14.3% 10.1% 3,906,071 7.3% 89.9% 2,914 111.0% 12.0% 21,358 40.2% 88.0%
YE 201306 4,638,580 6.2% 11.8% 88.2% 546,307 25.0% 11.8% 4,086,551 4.6% 88.2% 3 -99.9% 0.1% 5,719 -73.2% 99.9%
YE 201406 5,010,115 8.0% 15.0% 85.0% 737,968 35.1% 14.8% 4,254,918 4.1% 85.2% 13,066 ######## 75.8% 4,163 -27.2% 24.2%
China 2013 6 398,718 15.4% 54.8% 45.2% 218,622 4.5% 55.5% 175,615 28.8% 44.5% - 0.0% 0.0% 4,481 0.0% 100.0%
2014 6 450,240 12.9% 52.4% 47.6% 235,272 7.6% 52.3% 214,352 22.1% 47.7% 616 0.0% 100.0% - -100.0% 0.0%
YE 201206 3,649,633 24.7% 60.8% 39.2% 2,212,727 22.8% 60.7% 1,432,025 27.8% 39.3% 4,843 56.6% 99.2% 38 -96.6% 0.8%
YE 201306 4,086,128 12.0% 56.0% 44.0% 2,284,096 3.2% 56.4% 1,762,630 23.1% 43.6% 4,882 0.8% 12.4% 34,520 90742.1% 87.6%
YE 201406 4,725,983 15.7% 50.8% 49.2% 2,388,030 4.6% 50.9% 2,305,024 30.8% 49.1% 13,376 174.0% 40.6% 19,553 -43.4% 59.4%
Source : U.S. Department of Transportation T-100 Segment Data. Page 2 of 5
1/ Due to extensive code-sharing agreements passenger and cargo data for U.S. carriers presented in this table might understate U.S. carrier presence in certain markets.
Please see the report's introduction for further details.
2/ Ranked in descending order according to YE 201406 data.

Table 3 : Top 25 Foreign Country Gateways 1/
Passengers
Total Traffic Scheduled Service Nonscheduled Service
Foreign US Flag Foreign Flag US Flag Foreign Flag
Yr/Yr US Mkt Market Yr/Yr Market Yr/Yr Market Yr/Yr Market Yr/Yr Market
Country 2/ Period Total Chg. Share Share Total Chg. Share Total Chg. Share Total Chg. Share Total Chg. Share
Netherlands 2013 6 484,798 8.1% 65.8% 34.2% 318,914 10.9% 65.8% 165,884 3.0% 34.2% - 0.0% 0.0% - 0.0% 0.0%
2014 6 472,280 -2.6% 61.4% 38.6% 290,150 -9.0% 61.5% 181,339 9.3% 38.5% - 0.0% 0.0% 791 0.0% 100.0%
YE 201206 4,489,606 1.2% 61.8% 38.2% 2,773,296 -0.8% 61.8% 1,716,024 4.7% 38.2% 260 0.0% 90.9% 26 0.0% 9.1%
YE 201306 4,574,466 1.9% 63.6% 36.4% 2,907,325 4.8% 63.6% 1,666,689 -2.9% 36.4% 347 33.5% 76.8% 105 303.8% 23.2%
YE 201406 4,687,688 2.5% 63.3% 36.7% 2,966,232 2.0% 63.3% 1,720,567 3.2% 36.7% 98 -71.8% 11.0% 791 653.3% 89.0%
Jamaica 2013 6 299,332 0.6% 87.8% 12.2% 258,628 7.6% 87.6% 36,515 -28.7% 12.4% 4,189 -29.4% 100.0% - 0.0% 0.0%
2014 6 305,672 2.1% 91.1% 8.9% 270,152 4.5% 90.9% 27,112 -25.8% 9.1% 8,408 100.7% 100.0% - 0.0% 0.0%
YE 201206 3,178,639 7.0% 78.3% 21.7% 2,311,649 0.1% 77.1% 688,272 20.9% 22.9% 178,718 93.2% 100.0% - 0.0% 0.0%
YE 201306 3,078,733 -3.1% 82.3% 17.7% 2,502,350 8.2% 82.1% 544,870 -20.8% 17.9% 31,513 -82.4% 100.0% - 0.0% 0.0%
YE 201406 3,083,507 0.2% 87.5% 12.5% 2,664,737 6.5% 87.4% 385,630 -29.2% 12.6% 33,127 5.1% 100.0% 13 0.0% 0.0%
United Arab Emirate 2013 6 237,617 11.7% 12.0% 88.0% 28,497 7.4% 12.0% 209,120 12.3% 88.0% - 0.0% 0.0% - 0.0% 0.0%
2014 6 312,574 31.5% 9.0% 91.0% 28,112 -1.4% 9.0% 284,462 36.0% 91.0% - 0.0% 0.0% - 0.0% 0.0%
YE 201206 2,147,874 20.4% 15.1% 84.9% 324,012 0.6% 15.1% 1,823,861 24.7% 84.9% - 0.0% 0.0% 1 -75.0% 100.0%
YE 201306 2,431,518 13.2% 14.0% 86.0% 340,497 5.1% 14.0% 2,090,961 14.6% 86.0% - 0.0% 0.0% 60 5900.0% 100.0%
YE 201406 3,031,363 24.7% 10.8% 89.2% 328,269 -3.6% 10.8% 2,702,496 29.2% 89.2% - 0.0% 0.0% 598 896.7% 100.0%
Colombia 2013 6 252,097 10.8% 53.1% 46.9% 133,804 11.1% 53.1% 118,172 10.7% 46.9% 121 -61.7% 100.0% - 0.0% 0.0%
2014 6 262,198 4.0% 56.0% 44.0% 146,760 9.7% 56.0% 115,438 -2.3% 44.0% - -100.0% 0.0% - 0.0% 0.0%
YE 201206 2,325,067 0.2% 51.3% 48.7% 1,193,058 3.4% 51.3% 1,131,515 -2.9% 48.7% 484 -50.5% 98.0% 10 0.0% 2.0%
YE 201306 2,620,470 12.7% 52.3% 47.7% 1,369,082 14.8% 52.3% 1,250,061 10.5% 47.7% 1,320 172.7% 99.5% 7 -30.0% 0.5%
YE 201406 2,895,747 10.5% 53.5% 46.5% 1,549,143 13.2% 53.5% 1,345,758 7.7% 46.5% 844 -36.1% 99.8% 2 -71.4% 0.2%
Australia 2013 6 231,114 7.9% 30.9% 69.1% 71,347 12.0% 30.9% 159,767 6.1% 69.1% - 0.0% 0.0% - 0.0% 0.0%
2014 6 226,106 -2.2% 28.1% 71.9% 63,468 -11.0% 28.1% 162,638 1.8% 71.9% - 0.0% 0.0% - 0.0% 0.0%
YE 201206 2,392,425 2.4% 31.7% 68.3% 758,612 -3.9% 31.7% 1,633,732 5.6% 68.3% 79 1216.7% 97.5% 2 -99.6% 2.5%
YE 201306 2,606,347 8.9% 31.7% 68.3% 827,085 9.0% 31.7% 1,778,910 8.9% 68.3% 348 340.5% 98.9% 4 100.0% 1.1%
YE 201406 2,680,362 2.8% 31.2% 68.8% 837,529 1.3% 31.2% 1,842,813 3.6% 68.8% - -100.0% 0.0% 20 400.0% 100.0%
Source : U.S. Department of Transportation T-100 Segment Data. Page 3 of 5
1/ Due to extensive code-sharing agreements passenger and cargo data for U.S. carriers presented in this table might understate U.S. carrier presence in certain markets.
Please see the report's introduction for further details.
2/ Ranked in descending order according to YE 201406 data.

Table 3 : Top 25 Foreign Country Gateways 1/
Passengers
Total Traffic Scheduled Service Nonscheduled Service
Foreign US Flag Foreign Flag US Flag Foreign Flag
Yr/Yr US Mkt Market Yr/Yr Market Yr/Yr Market Yr/Yr Market Yr/Yr Market
Country 2/ Period Total Chg. Share Share Total Chg. Share Total Chg. Share Total Chg. Share Total Chg. Share
Spain 2013 6 290,308 -5.9% 63.0% 37.0% 179,645 0.8% 62.6% 107,285 -17.6% 37.4% 3,362 0.0% 99.5% 16 1500.0% 0.5%
2014 6 308,269 6.2% 62.6% 37.4% 192,741 7.3% 62.6% 115,188 7.4% 37.4% 305 -90.9% 89.7% 35 118.8% 10.3%
YE 201206 2,918,544 4.2% 56.2% 43.8% 1,636,507 4.2% 56.1% 1,279,438 4.3% 43.9% 2,447 26.7% 94.2% 152 -77.5% 5.8%
YE 201306 2,667,495 -8.6% 59.7% 40.3% 1,588,865 -2.9% 59.7% 1,074,780 -16.0% 40.3% 3,688 50.7% 95.8% 162 6.6% 4.2%
YE 201406 2,645,462 -0.8% 61.6% 38.4% 1,620,354 2.0% 61.5% 1,016,383 -5.4% 38.5% 8,534 131.4% 97.8% 191 17.9% 2.2%
Italy 2013 6 317,719 1.5% 69.1% 30.9% 219,511 -2.8% 69.1% 98,077 12.4% 30.9% 124 0.0% 94.7% 7 250.0% 5.3%
2014 6 338,247 6.5% 68.1% 31.9% 230,474 5.0% 68.1% 107,765 9.9% 31.9% - -100.0% 0.0% 8 14.3% 100.0%
YE 201206 2,578,497 -5.2% 65.7% 34.3% 1,695,356 -5.0% 65.8% 882,924 -5.6% 34.2% - -100.0% 0.0% 217 174.7% 100.0%
YE 201306 2,537,010 -1.6% 64.8% 35.2% 1,642,661 -3.1% 64.8% 894,119 1.3% 35.2% 145 0.0% 63.0% 85 -60.8% 37.0%
YE 201406 2,642,058 4.1% 65.6% 34.4% 1,732,463 5.5% 65.6% 909,495 1.7% 34.4% 2 -98.6% 2.0% 98 15.3% 98.0%
Panama 2013 6 194,963 14.5% 31.0% 69.0% 60,455 -2.6% 31.0% 134,508 24.3% 69.0% - -100.0% 0.0% - 0.0% 0.0%
2014 6 221,977 13.9% 26.5% 73.5% 58,717 -2.9% 26.5% 163,260 21.4% 73.5% - 0.0% 0.0% - 0.0% 0.0%
YE 201206 1,860,282 15.7% 38.2% 61.8% 710,387 1.7% 38.2% 1,149,070 26.6% 61.8% 817 -26.5% 99.0% 8 33.3% 1.0%
YE 201306 2,241,242 20.5% 31.4% 68.6% 701,994 -1.2% 31.3% 1,537,313 33.8% 68.7% 1,931 136.4% 99.8% 4 -50.0% 0.2%
YE 201406 2,555,823 14.0% 27.6% 72.4% 703,218 0.2% 27.5% 1,851,469 20.4% 72.5% 1,061 -45.1% 93.4% 75 1775.0% 6.6%
Hong Kong 2013 6 203,132 -8.3% 26.9% 73.1% 54,646 -18.4% 26.9% 148,486 -3.9% 73.1% - 0.0% 0.0% - 0.0% 0.0%
2014 6 239,767 18.0% 28.6% 71.4% 66,844 22.3% 28.1% 171,289 15.4% 71.9% 1,634 0.0% 100.0% - 0.0% 0.0%
YE 201206 2,410,631 3.2% 30.6% 69.4% 733,399 -5.1% 30.5% 1,674,167 7.3% 69.5% 3,065 -12.5% 100.0% - -100.0% 0.0%
YE 201306 2,404,951 -0.2% 27.9% 72.1% 669,943 -8.7% 27.9% 1,734,493 3.6% 72.1% 506 -83.5% 98.3% 9 0.0% 1.7%
YE 201406 2,517,960 4.7% 24.8% 75.2% 623,388 -6.9% 24.8% 1,892,322 9.1% 75.2% 2,247 344.1% 99.9% 3 -66.7% 0.1%
The Bahamas 2013 6 244,155 -7.8% 82.9% 17.1% 202,134 -9.6% 82.9% 41,707 8.4% 17.1% 314 -87.9% 100.0% - -100.0% 0.0%
2014 6 251,380 3.0% 83.1% 16.9% 204,308 1.1% 82.7% 42,608 2.2% 17.3% 4,464 1321.7% 100.0% - 0.0% 0.0%
YE 201206 2,574,259 3.8% 82.9% 17.1% 2,067,780 6.0% 82.4% 440,969 -9.6% 17.6% 65,171 56.7% 99.5% 339 -12.4% 0.5%
YE 201306 2,572,315 -0.1% 81.4% 18.6% 2,075,247 0.4% 81.3% 477,454 8.3% 18.7% 19,408 -70.2% 98.9% 206 -39.2% 1.1%
YE 201406 2,492,472 -3.1% 80.8% 19.2% 1,995,156 -3.9% 80.7% 478,426 0.2% 19.3% 18,566 -4.3% 98.3% 324 57.3% 1.7%
Source : U.S. Department of Transportation T-100 Segment Data. Page 4 of 5
1/ Due to extensive code-sharing agreements passenger and cargo data for U.S. carriers presented in this table might understate U.S. carrier presence in certain markets.
Please see the report's introduction for further details.
2/ Ranked in descending order according to YE 201406 data.

Table 3 : Top 25 Foreign Country Gateways 1/
Passengers
Total Traffic Scheduled Service Nonscheduled Service
Foreign US Flag Foreign Flag US Flag Foreign Flag
Yr/Yr US Mkt Market Yr/Yr Market Yr/Yr Market Yr/Yr Market Yr/Yr Market
Country 2/ Period Total Chg. Share Share Total Chg. Share Total Chg. Share Total Chg. Share Total Chg. Share
Costa Rica 2013 6 187,891 -4.6% 98.0% 2.0% 184,184 1.1% 98.0% 3,707 -74.8% 2.0% - -100.0% 0.0% - 0.0% 0.0%
2014 6 203,599 8.4% 100.0% 0.0% 203,557 10.5% 100.0% 25 -99.3% 0.0% 17 0.0% 100.0% - 0.0% 0.0%
YE 201206 2,279,552 5.7% 92.3% 7.7% 2,100,083 4.1% 92.3% 174,719 27.0% 7.7% 4,741 119.6% 99.8% 9 -60.9% 0.2%
YE 201306 2,301,447 1.0% 92.9% 7.1% 2,131,850 1.5% 92.9% 164,114 -6.1% 7.1% 5,483 15.7% 100.0% - -100.0% 0.0%
YE 201406 2,387,347 3.7% 98.8% 1.2% 2,350,399 10.3% 98.8% 28,190 -82.8% 1.2% 8,725 59.1% 99.6% 33 0.0% 0.4%
Ireland 2013 6 235,443 21.9% 50.3% 49.7% 118,407 27.8% 50.3% 116,961 17.6% 49.7% 71 -92.3% 94.7% 4 0.0% 5.3%
2014 6 261,753 11.2% 49.1% 50.9% 128,465 8.5% 49.1% 133,142 13.8% 50.9% 123 73.2% 84.2% 23 475.0% 15.8%
YE 201206 1,768,065 -0.2% 46.0% 54.0% 811,464 -6.0% 46.0% 953,903 5.2% 54.0% 2,576 12.9% 95.5% 122 18.4% 4.5%
YE 201306 1,904,275 7.7% 44.9% 55.1% 850,533 4.8% 44.8% 1,048,280 9.9% 55.2% 5,338 107.2% 97.7% 124 1.6% 2.3%
YE 201406 2,143,101 12.5% 45.7% 54.3% 978,751 15.1% 45.7% 1,162,992 10.9% 54.3% 1,119 -79.0% 82.4% 239 92.7% 17.6%
Taiwan 2013 6 167,221 3.0% 0.0% 100.0% - 0.0% 0.0% 167,221 3.0% 100.0% - 0.0% 0.0% - 0.0% 0.0%
2014 6 195,292 16.8% 7.4% 92.6% 14,362 0.0% 7.4% 180,930 8.2% 92.6% - 0.0% 0.0% - 0.0% 0.0%
YE 201206 1,753,948 0.6% 0.3% 99.7% 306 0.0% 0.0% 1,749,373 0.6% 100.0% 4,269 -26.5% 100.0% - -100.0% 0.0%
YE 201306 1,782,666 1.6% 0.0% 100.0% - -100.0% 0.0% 1,782,652 1.9% 100.0% 14 -99.7% 100.0% - 0.0% 0.0%
YE 201406 2,008,838 12.7% 4.2% 95.8% 83,075 0.0% 4.1% 1,925,463 8.0% 95.9% 300 2042.9% 100.0% - 0.0% 0.0%
Switzerland 2013 6 189,596 -3.3% 40.0% 60.0% 75,872 0.5% 40.0% 113,698 -5.7% 60.0% - 0.0% 0.0% 26 23.8% 100.0%
2014 6 189,583 0.0% 38.9% 61.1% 73,802 -2.7% 38.9% 115,760 1.8% 61.1% - 0.0% 0.0% 21 -19.2% 100.0%
YE 201206 1,951,414 0.6% 39.4% 60.6% 769,254 -2.0% 39.4% 1,181,790 2.3% 60.6% - 0.0% 0.0% 370 -13.8% 100.0%
YE 201306 2,116,184 8.4% 34.8% 65.2% 737,483 -4.1% 34.9% 1,378,435 16.6% 65.1% 3 0.0% 1.1% 263 -28.9% 98.9%
YE 201406 1,973,663 -6.7% 36.4% 63.6% 718,970 -2.5% 36.4% 1,254,358 -9.0% 63.6% 2 -33.3% 0.6% 333 26.6% 99.4%
Peru 2013 6 136,992 10.2% 48.0% 52.0% 65,739 13.9% 48.0% 71,253 7.1% 52.0% - 0.0% 0.0% - -100.0% 0.0%
2014 6 148,012 8.0% 51.6% 48.4% 76,301 16.1% 51.6% 71,711 0.6% 48.4% - 0.0% 0.0% - 0.0% 0.0%
YE 201206 1,408,408 6.3% 45.6% 54.4% 642,228 -1.9% 45.6% 766,144 14.3% 54.4% - -100.0% 0.0% 36 3500.0% 100.0%
YE 201306 1,522,478 8.1% 42.7% 57.3% 650,839 1.3% 42.7% 871,630 13.8% 57.3% - 0.0% 0.0% 9 -75.0% 100.0%
YE 201406 1,729,676 13.6% 46.6% 53.4% 806,717 24.0% 46.6% 922,917 5.9% 53.4% 34 0.0% 81.0% 8 -11.1% 19.0%
Source : U.S. Department of Transportation T-100 Segment Data. Page 5 of 5
1/ Due to extensive code-sharing agreements passenger and cargo data for U.S. carriers presented in this table might understate U.S. carrier presence in certain markets.
Please see the report's introduction for further details.
2/ Ranked in descending order according to YE 201406 data.

Table 4 : Top 25 Foreign Country Gateways 1/
Seats
Total Seats Scheduled Service Nonscheduled Service
Foreign US Flag Foreign Flag US Flag Foreign Flag
Yr/Yr US Mkt Market Yr/Yr Market Yr/Yr Market Yr/Yr Market Yr/Yr Market
Country 2/ Period Total Chg. Share Share Total Chg. Share Total Chg. Share Total Chg. Share Total Chg. Share
Canada 2013 6 2,630,981 -0.6% 50.4% 49.6% 1,320,236 -0.9% 50.5% 1,294,254 -0.2% 49.5% 4,502 -9.5% 27.3% 11,989 -4.1% 72.7%
2014 6 2,591,240 -1.5% 51.3% 48.7% 1,318,917 -0.1% 51.1% 1,261,116 -2.6% 48.9% 10,194 126.4% 91.0% 1,013 -91.6% 9.0%
YE 201206 32,208,295 2.7% 48.0% 52.0% 15,308,974 -1.5% 48.2% 16,481,869 7.0% 51.8% 139,453 20.9% 33.4% 277,999 -4.6% 66.6%
YE 201306 33,483,682 4.0% 45.8% 54.2% 15,236,548 -0.5% 45.9% 17,931,143 8.8% 54.1% 82,342 -41.0% 26.1% 233,649 -16.0% 73.9%
YE 201406 31,956,849 -4.6% 47.3% 52.7% 14,977,845 -1.7% 47.3% 16,657,331 -7.1% 52.7% 123,884 50.5% 38.5% 197,789 -15.3% 61.5%
Mexico 2013 6 2,151,246 8.1% 76.7% 23.3% 1,610,809 6.0% 77.0% 482,025 15.4% 23.0% 39,792 2.9% 68.1% 18,620 31.4% 31.9%
2014 6 2,420,644 12.5% 76.6% 23.4% 1,810,148 12.4% 77.2% 535,962 11.2% 22.8% 42,976 8.0% 57.7% 31,558 69.5% 42.3%
YE 201206 23,911,818 4.0% 78.4% 21.6% 18,504,798 1.2% 78.6% 5,035,292 17.3% 21.4% 238,514 12.8% 64.2% 133,214 -36.3% 35.8%
YE 201306 25,366,050 6.1% 75.8% 24.2% 18,832,048 1.8% 75.7% 6,031,309 19.8% 24.3% 389,133 63.1% 77.4% 113,560 -14.8% 22.6%
YE 201406 27,386,105 8.0% 75.5% 24.5% 20,213,120 7.3% 75.4% 6,591,227 9.3% 24.6% 457,587 17.6% 78.7% 124,171 9.3% 21.3%
United Kingdom 2013 6 1,883,485 -0.5% 40.3% 59.7% 757,629 -2.2% 41.0% 1,090,338 1.3% 59.0% 774 1512.5% 2.2% 34,744 -16.1% 97.8%
2014 6 1,970,591 4.6% 40.3% 59.7% 793,243 4.7% 41.0% 1,143,825 4.9% 59.0% 983 27.0% 2.9% 32,540 -6.3% 97.1%
YE 201206 21,051,894 3.2% 41.0% 59.0% 8,635,704 0.3% 41.5% 12,152,531 6.3% 58.5% 3,954 -40.2% 1.5% 259,705 -25.6% 98.5%
YE 201306 20,887,133 -0.8% 40.2% 59.8% 8,401,127 -2.7% 40.8% 12,213,007 0.5% 59.2% 5,088 28.7% 1.9% 267,911 3.2% 98.1%
YE 201406 21,426,736 2.6% 40.0% 60.0% 8,565,025 2.0% 40.4% 12,659,976 3.7% 59.6% 7,449 46.4% 3.7% 194,286 -27.5% 96.3%
Japan 2013 6 1,224,190 6.3% 63.8% 36.2% 780,478 0.8% 63.8% 442,290 17.5% 36.2% - 0.0% 0.0% 1,422 0.0% 100.0%
2014 6 1,158,282 -5.4% 61.4% 38.6% 711,513 -8.8% 61.4% 446,726 1.0% 38.6% 43 0.0% 100.0% - -100.0% 0.0%
YE 201206 13,634,128 5.7% 65.7% 34.3% 8,927,355 5.8% 66.3% 4,546,068 5.0% 33.7% 31,700 77.7% 19.7% 129,005 12.2% 80.3%
YE 201306 14,598,230 7.1% 63.9% 36.1% 9,310,541 4.3% 64.7% 5,086,734 11.9% 35.3% 24,927 -21.4% 12.4% 176,028 36.5% 87.6%
YE 201406 14,689,130 0.6% 61.3% 38.7% 9,004,173 -3.3% 61.7% 5,577,510 9.6% 38.3% 7,270 -70.8% 6.8% 100,177 -43.1% 93.2%
Germany 2013 6 1,160,176 3.7% 35.2% 64.8% 407,156 -1.1% 35.1% 751,731 6.3% 64.9% 1,254 0.0% 97.3% 35 9.4% 2.7%
2014 6 1,205,577 3.9% 34.3% 65.7% 413,479 1.6% 34.3% 791,791 5.3% 65.7% 278 -77.8% 90.6% 29 -17.1% 9.4%
YE 201206 11,794,989 1.4% 37.5% 62.5% 4,415,973 -0.8% 37.5% 7,368,987 2.7% 62.5% 8,004 135.6% 79.8% 2,025 27.3% 20.2%
YE 201306 11,932,058 1.2% 36.4% 63.6% 4,338,622 -1.8% 36.4% 7,587,759 3.0% 63.6% 4,741 -40.8% 83.5% 936 -53.8% 16.5%
YE 201406 12,312,776 3.2% 35.6% 64.4% 4,380,864 1.0% 35.6% 7,923,681 4.4% 64.4% 7,599 60.3% 92.3% 632 -32.5% 7.7%
Source : U.S. Department of Transportation T-100 Segment Data. Page 1 of 5
1/ Due to extensive code-sharing agreements passenger and cargo data for U.S. carriers presented in this table might understate U.S. carrier presence in certain markets.
Please see the report's introduction for further details.
2/ Ranked in descending order according to YE 201406 data.

Table 4 : Top 25 Foreign Country Gateways 1/
Seats
Total Seats Scheduled Service Nonscheduled Service
Foreign US Flag Foreign Flag US Flag Foreign Flag
Yr/Yr US Mkt Market Yr/Yr Market Yr/Yr Market Yr/Yr Market Yr/Yr Market
Country 2/ Period Total Chg. Share Share Total Chg. Share Total Chg. Share Total Chg. Share Total Chg. Share
France 2013 6 766,859 5.0% 41.1% 58.9% 314,859 12.2% 41.1% 451,911 0.6% 58.9% 13 -88.8% 14.6% 76 -74.0% 85.4%
2014 6 802,507 4.6% 42.4% 57.6% 340,207 8.1% 42.4% 461,669 2.2% 57.6% 446 3330.8% 70.7% 185 143.4% 29.3%
YE 201206 7,549,243 -0.2% 41.4% 58.6% 3,120,736 2.7% 41.4% 4,422,884 -2.2% 58.6% 2,071 6.6% 36.8% 3,552 26.5% 63.2%
YE 201306 7,271,379 -3.7% 41.4% 58.6% 3,004,950 -3.7% 41.4% 4,261,193 -3.7% 58.6% 3,107 50.0% 59.3% 2,129 -40.1% 40.7%
YE 201406 7,846,961 7.9% 43.8% 56.2% 3,437,058 14.4% 43.8% 4,405,483 3.4% 56.2% 1,842 -40.7% 41.7% 2,578 21.1% 58.3%
Dominican Republic 2013 6 608,152 4.3% 96.6% 3.4% 542,049 4.9% 96.3% 20,894 432.5% 3.7% 45,209 -27.9% 100.0% - 0.0% 0.0%
2014 6 735,877 21.0% 96.6% 3.4% 663,941 22.5% 96.3% 25,330 21.2% 3.7% 46,606 3.1% 100.0% - 0.0% 0.0%
YE 201206 6,062,853 8.3% 99.0% 1.0% 5,767,485 7.2% 99.0% 60,167 -9.5% 1.0% 235,027 59.5% 99.9% 174 262.5% 0.1%
YE 201306 6,353,458 4.8% 96.8% 3.2% 5,874,961 1.9% 96.6% 204,534 239.9% 3.4% 273,934 16.6% 100.0% 29 -83.3% 0.0%
YE 201406 7,199,464 13.3% 95.9% 4.1% 6,615,605 12.6% 95.7% 296,220 44.8% 4.3% 287,627 5.0% 100.0% 12 -58.6% 0.0%
South Korea 2013 6 503,635 8.5% 13.8% 86.2% 69,069 48.8% 13.7% 434,288 4.1% 86.3% 278 0.0% 100.0% - -100.0% 0.0%
2014 6 546,398 8.5% 15.5% 84.5% 84,749 22.7% 15.5% 461,401 6.2% 84.5% - -100.0% 0.0% 248 0.0% 100.0%
YE 201206 5,641,356 11.4% 9.5% 90.5% 535,159 18.4% 9.5% 5,079,181 10.6% 90.5% 2,969 12.8% 11.0% 24,047 30.8% 89.0%
YE 201306 5,865,461 4.0% 11.4% 88.6% 667,513 24.7% 11.4% 5,190,464 2.2% 88.6% 278 -90.6% 3.7% 7,206 -70.0% 96.3%
YE 201406 6,461,176 10.2% 14.3% 85.7% 897,095 34.4% 13.9% 5,534,557 6.6% 86.1% 24,611 8752.9% 83.4% 4,913 -31.8% 16.6%
Brazil 2013 6 495,376 16.9% 71.1% 28.9% 352,375 21.3% 71.1% 142,973 7.4% 28.9% 28 0.0% 100.0% - -100.0% 0.0%
2014 6 586,965 18.5% 70.4% 29.6% 410,554 16.5% 70.3% 173,518 21.4% 29.7% 2,880 10185.7% 99.6% 13 0.0% 0.4%
YE 201206 5,049,664 12.1% 67.9% 32.1% 3,412,064 9.0% 67.8% 1,620,658 17.9% 32.2% 16,872 1220.2% 99.6% 70 -18.6% 0.4%
YE 201306 5,826,192 15.4% 67.7% 32.3% 3,943,332 15.6% 67.7% 1,880,401 16.0% 32.3% 2,149 -87.3% 87.4% 310 342.9% 12.6%
YE 201406 6,427,642 10.3% 69.8% 30.2% 4,477,608 13.5% 69.7% 1,943,698 3.4% 30.3% 6,268 191.7% 98.9% 68 -78.1% 1.1%
China 2013 6 436,586 16.6% 54.0% 46.0% 235,583 5.1% 54.6% 196,203 30.5% 45.4% - 0.0% 0.0% 4,800 0.0% 100.0%
2014 6 522,419 19.7% 52.0% 48.0% 270,125 14.7% 51.9% 250,842 27.8% 48.1% 1,452 0.0% 100.0% - -100.0% 0.0%
YE 201206 4,352,114 25.8% 61.6% 38.4% 2,676,295 26.0% 61.6% 1,670,607 25.6% 38.4% 5,115 15.6% 98.1% 97 -94.3% 1.9%
YE 201306 4,683,597 7.6% 56.3% 43.7% 2,631,940 -1.7% 56.8% 2,002,376 19.9% 43.2% 6,051 18.3% 12.3% 43,230 44467.0% 87.7%
YE 201406 5,590,930 19.4% 51.1% 48.9% 2,836,645 7.8% 51.1% 2,715,014 35.6% 48.9% 18,257 201.7% 46.5% 21,014 -51.4% 53.5%
Source : U.S. Department of Transportation T-100 Segment Data. Page 2 of 5
1/ Due to extensive code-sharing agreements passenger and cargo data for U.S. carriers presented in this table might understate U.S. carrier presence in certain markets.
Please see the report's introduction for further details.
2/ Ranked in descending order according to YE 201406 data.

Table 4 : Top 25 Foreign Country Gateways 1/
Seats
Total Seats Scheduled Service Nonscheduled Service
Foreign US Flag Foreign Flag US Flag Foreign Flag
Yr/Yr US Mkt Market Yr/Yr Market Yr/Yr Market Yr/Yr Market Yr/Yr Market
Country 2/ Period Total Chg. Share Share Total Chg. Share Total Chg. Share Total Chg. Share Total Chg. Share
Netherlands 2013 6 539,637 6.6% 64.9% 35.1% 349,978 8.5% 64.9% 189,659 3.3% 35.1% - -100.0% 0.0% - 0.0% 0.0%
2014 6 530,168 -1.8% 61.8% 38.2% 327,714 -6.4% 61.9% 201,379 6.2% 38.1% - 0.0% 0.0% 1,075 0.0% 100.0%
YE 201206 5,303,721 -1.6% 62.2% 37.8% 3,296,093 -4.4% 62.2% 2,005,720 3.4% 37.8% 1,838 244.8% 96.3% 70 0.0% 3.7%
YE 201306 5,413,026 2.1% 63.4% 36.6% 3,427,574 4.0% 63.3% 1,983,455 -1.1% 36.7% 1,718 -6.5% 86.0% 279 298.6% 14.0%
YE 201406 5,494,169 1.5% 62.8% 37.2% 3,451,608 0.7% 62.8% 2,041,247 2.9% 37.2% 239 -86.1% 18.2% 1,075 285.3% 81.8%
Jamaica 2013 6 335,167 -4.2% 87.8% 12.2% 288,921 6.5% 87.6% 40,964 -42.9% 12.4% 5,282 -22.1% 100.0% - 0.0% 0.0%
2014 6 374,994 11.9% 88.8% 11.2% 322,962 11.8% 88.5% 41,870 2.2% 11.5% 10,162 92.4% 100.0% - 0.0% 0.0%
YE 201206 4,000,745 6.4% 76.1% 23.9% 2,805,003 -0.7% 74.6% 954,697 17.7% 25.4% 241,045 93.4% 100.0% - 0.0% 0.0%
YE 201306 3,765,077 -5.9% 80.5% 19.5% 2,988,209 6.5% 80.3% 734,580 -23.1% 19.7% 42,288 -82.5% 100.0% - 0.0% 0.0%
YE 201406 3,777,633 0.3% 85.8% 14.2% 3,195,912 7.0% 85.6% 537,408 -26.8% 14.4% 44,293 4.7% 100.0% 20 0.0% 0.0%
United Arab Emirate 2013 6 261,950 15.9% 12.3% 87.7% 32,270 10.4% 12.3% 229,388 16.6% 87.7% - 0.0% 0.0% 292 0.0% 100.0%
2014 6 350,969 34.0% 9.6% 90.4% 33,595 4.1% 9.6% 317,374 38.4% 90.4% - 0.0% 0.0% - -100.0% 0.0%
YE 201206 2,615,896 15.8% 14.7% 85.3% 385,597 0.5% 14.7% 2,230,284 18.9% 85.3% - 0.0% 0.0% 15 7.1% 100.0%
YE 201306 2,878,745 10.0% 13.5% 86.5% 389,173 0.9% 13.5% 2,488,404 11.6% 86.5% - 0.0% 0.0% 1,168 7686.7% 100.0%
YE 201406 3,652,527 26.9% 10.7% 89.3% 391,875 0.7% 10.7% 3,259,756 31.0% 89.3% - 0.0% 0.0% 896 -23.3% 100.0%
Colombia 2013 6 281,496 10.1% 54.0% 46.0% 151,824 13.4% 54.0% 129,360 7.2% 46.0% 312 -70.9% 100.0% - 0.0% 0.0%
2014 6 305,273 8.4% 56.5% 43.5% 172,544 13.6% 56.5% 132,729 2.6% 43.5% - -100.0% 0.0% - 0.0% 0.0%
YE 201206 2,815,925 -8.4% 52.7% 47.3% 1,482,236 -1.9% 52.7% 1,331,525 -14.7% 47.3% 2,151 -17.4% 99.4% 13 0.0% 0.6%
YE 201306 3,087,439 9.6% 54.0% 46.0% 1,662,268 12.1% 53.9% 1,420,635 6.7% 46.1% 4,517 110.0% 99.6% 19 46.2% 0.4%
YE 201406 3,505,092 13.5% 54.8% 45.2% 1,918,443 15.4% 54.8% 1,583,993 11.5% 45.2% 2,642 -41.5% 99.5% 14 -26.3% 0.5%
The Bahamas 2013 6 312,964 -14.2% 80.8% 19.2% 252,304 -12.5% 80.8% 60,120 -9.3% 19.2% 540 -94.7% 100.0% - -100.0% 0.0%
2014 6 354,447 13.3% 77.7% 22.3% 265,763 5.3% 77.0% 79,171 31.7% 23.0% 9,513 1661.7% 100.0% - 0.0% 0.0%
YE 201206 3,612,756 8.6% 82.4% 17.6% 2,820,683 7.9% 81.6% 636,594 -1.8% 18.4% 154,729 147.9% 99.5% 750 -16.0% 0.5%
YE 201306 3,525,003 -2.4% 79.5% 20.5% 2,750,723 -2.5% 79.2% 721,685 13.4% 20.8% 52,110 -66.3% 99.1% 485 -35.3% 0.9%
YE 201406 3,429,205 -2.7% 78.1% 21.9% 2,637,335 -4.1% 77.8% 751,976 4.2% 22.2% 39,341 -24.5% 98.6% 553 14.0% 1.4%
Source : U.S. Department of Transportation T-100 Segment Data. Page 3 of 5
1/ Due to extensive code-sharing agreements passenger and cargo data for U.S. carriers presented in this table might understate U.S. carrier presence in certain markets.
Please see the report's introduction for further details.
2/ Ranked in descending order according to YE 201406 data.

Table 4 : Top 25 Foreign Country Gateways 1/
Seats
Total Seats Scheduled Service Nonscheduled Service
Foreign US Flag Foreign Flag US Flag Foreign Flag
Yr/Yr US Mkt Market Yr/Yr Market Yr/Yr Market Yr/Yr Market Yr/Yr Market
Country 2/ Period Total Chg. Share Share Total Chg. Share Total Chg. Share Total Chg. Share Total Chg. Share
Panama 2013 6 246,349 3.7% 31.1% 68.9% 76,507 -3.3% 31.1% 169,842 7.3% 68.9% - -100.0% 0.0% - 0.0% 0.0%
2014 6 290,302 17.8% 27.7% 72.3% 80,492 5.2% 27.7% 209,810 23.5% 72.3% - 0.0% 0.0% - 0.0% 0.0%
YE 201206 2,633,922 20.0% 36.1% 63.9% 948,573 3.0% 36.0% 1,683,801 32.4% 64.0% 1,490 -14.6% 96.3% 58 383.3% 3.7%
YE 201306 2,904,297 10.3% 31.3% 68.7% 904,386 -4.7% 31.2% 1,996,094 18.5% 68.8% 3,793 154.6% 99.4% 24 -58.6% 0.6%
YE 201406 3,356,367 15.6% 27.7% 72.3% 927,426 2.5% 27.7% 2,425,554 21.5% 72.3% 3,213 -15.3% 94.9% 174 625.0% 5.1%
Australia 2013 6 274,833 11.0% 31.3% 68.7% 85,954 9.5% 31.3% 188,879 11.8% 68.7% - 0.0% 0.0% - 0.0% 0.0%
2014 6 271,373 -1.3% 28.9% 71.1% 78,498 -8.7% 28.9% 192,875 2.1% 71.1% - 0.0% 0.0% - 0.0% 0.0%
YE 201206 2,944,494 6.5% 32.0% 68.0% 942,494 0.4% 32.0% 2,001,778 9.7% 68.0% 208 940.0% 93.7% 14 -98.8% 6.3%
YE 201306 3,255,145 10.6% 32.2% 67.8% 1,045,649 10.9% 32.1% 2,207,267 10.3% 67.9% 2,215 964.9% 99.4% 14 0.0% 0.6%
YE 201406 3,347,733 2.8% 31.2% 68.8% 1,044,155 -0.1% 31.2% 2,303,540 4.4% 68.8% 9 -99.6% 23.7% 29 107.1% 76.3%
Spain 2013 6 324,965 -6.5% 62.0% 38.0% 197,387 -1.3% 61.5% 123,330 -16.5% 38.5% 4,150 0.0% 97.7% 98 880.0% 2.3%
2014 6 364,604 12.2% 61.5% 38.5% 223,670 13.3% 61.4% 140,356 13.8% 38.6% 470 -88.7% 81.3% 108 10.2% 18.7%
YE 201206 3,602,590 2.9% 54.7% 45.3% 1,967,226 2.3% 54.7% 1,630,767 3.7% 45.3% 3,436 -40.1% 74.7% 1,161 -30.9% 25.3%
YE 201306 3,235,534 -10.2% 57.8% 42.2% 1,864,870 -5.2% 57.7% 1,364,988 -16.3% 42.3% 4,944 43.9% 87.1% 732 -37.0% 12.9%
YE 201406 3,166,515 -2.1% 60.4% 39.6% 1,899,437 1.9% 60.2% 1,253,822 -8.1% 39.8% 12,599 154.8% 95.0% 657 -10.2% 5.0%
Italy 2013 6 358,246 0.1% 67.3% 32.7% 240,042 -3.9% 67.2% 117,232 8.4% 32.8% 940 0.0% 96.7% 32 146.2% 3.3%
2014 6 387,064 8.0% 66.3% 33.7% 256,673 6.9% 66.3% 130,376 11.2% 33.7% - -100.0% 0.0% 15 -53.1% 100.0%
YE 201206 3,083,661 -9.4% 64.3% 35.7% 1,982,683 -8.6% 64.3% 1,100,585 -10.8% 35.7% - -100.0% 0.0% 393 64.4% 100.0%
YE 201306 2,961,967 -3.9% 63.2% 36.8% 1,870,708 -5.6% 63.2% 1,089,434 -1.0% 36.8% 1,551 0.0% 85.0% 274 -30.3% 15.0%
YE 201406 3,122,264 5.4% 64.2% 35.8% 2,004,540 7.2% 64.2% 1,117,468 2.6% 35.8% 13 -99.2% 5.1% 243 -11.3% 94.9%
Costa Rica 2013 6 218,493 -8.2% 97.3% 2.7% 212,679 -3.0% 97.3% 5,814 -67.2% 2.7% - -100.0% 0.0% - 0.0% 0.0%
2014 6 259,516 18.8% 99.9% 0.1% 258,758 21.7% 99.9% 288 -95.0% 0.1% 470 0.0% 100.0% - 0.0% 0.0%
YE 201206 2,793,129 5.3% 92.3% 7.7% 2,568,342 3.8% 92.2% 216,198 25.4% 7.8% 8,577 121.9% 99.9% 12 -77.8% 0.1%
YE 201306 2,802,368 0.3% 93.0% 7.0% 2,596,403 1.1% 93.0% 196,664 -9.0% 7.0% 9,301 8.4% 100.0% - -100.0% 0.0%
YE 201406 2,947,884 5.2% 98.4% 1.6% 2,888,892 11.3% 98.4% 46,107 -76.6% 1.6% 12,840 38.0% 99.7% 45 0.0% 0.3%
Source : U.S. Department of Transportation T-100 Segment Data. Page 4 of 5
1/ Due to extensive code-sharing agreements passenger and cargo data for U.S. carriers presented in this table might understate U.S. carrier presence in certain markets.
Please see the report's introduction for further details.
2/ Ranked in descending order according to YE 201406 data.

Table 4 : Top 25 Foreign Country Gateways 1/
Seats
Total Seats Scheduled Service Nonscheduled Service
Foreign US Flag Foreign Flag US Flag Foreign Flag
Yr/Yr US Mkt Market Yr/Yr Market Yr/Yr Market Yr/Yr Market Yr/Yr Market
Country 2/ Period Total Chg. Share Share Total Chg. Share Total Chg. Share Total Chg. Share Total Chg. Share
Hong Kong 2013 6 236,275 -10.1% 25.1% 74.9% 59,250 -20.9% 25.1% 177,025 -5.8% 74.9% - 0.0% 0.0% - 0.0% 0.0%
2014 6 276,005 16.8% 29.3% 70.7% 77,352 30.6% 28.4% 195,265 10.3% 71.6% 3,388 0.0% 100.0% - 0.0% 0.0%
YE 201206 3,063,183 14.2% 29.1% 70.9% 882,258 -1.8% 28.9% 2,170,377 22.5% 71.1% 10,548 -14.2% 100.0% - -100.0% 0.0%
YE 201306 2,912,554 -4.9% 26.2% 73.8% 762,564 -13.6% 26.2% 2,149,357 -1.0% 73.8% 619 -94.1% 97.8% 14 0.0% 2.2%
YE 201406 2,899,865 -0.4% 25.0% 75.0% 719,803 -5.6% 24.9% 2,175,480 1.2% 75.1% 4,568 638.0% 99.7% 14 0.0% 0.3%
Ireland 2013 6 255,613 21.6% 51.3% 48.7% 130,956 30.4% 51.3% 124,366 15.0% 48.7% 257 -85.0% 88.3% 34 78.9% 11.7%
2014 6 284,177 11.2% 50.0% 50.0% 141,494 8.0% 49.9% 142,076 14.2% 50.1% 484 88.3% 79.7% 123 261.8% 20.3%
YE 201206 2,136,601 -2.3% 43.9% 56.1% 930,180 -6.7% 43.7% 1,199,078 1.5% 56.3% 6,970 -15.7% 94.9% 373 3.3% 5.1%
YE 201306 2,252,425 5.4% 43.7% 56.3% 975,751 4.9% 43.5% 1,267,342 5.7% 56.5% 8,954 28.5% 95.9% 378 1.3% 4.1%
YE 201406 2,509,481 11.4% 44.3% 55.7% 1,108,829 13.6% 44.2% 1,397,118 10.2% 55.8% 2,796 -68.8% 79.1% 738 95.2% 20.9%
Taiwan 2013 6 187,109 0.1% 0.0% 100.0% - 0.0% 0.0% 187,109 0.1% 100.0% - 0.0% 0.0% - 0.0% 0.0%
2014 6 220,409 17.8% 7.3% 92.7% 16,140 0.0% 7.3% 204,269 9.2% 92.7% - 0.0% 0.0% - 0.0% 0.0%
YE 201206 2,145,656 0.2% 0.3% 99.7% 374 0.0% 0.0% 2,140,164 0.3% 100.0% 5,118 -25.0% 100.0% - -100.0% 0.0%
YE 201306 2,137,327 -0.4% 0.0% 100.0% - -100.0% 0.0% 2,137,280 -0.1% 100.0% 47 -99.1% 100.0% - 0.0% 0.0%
YE 201406 2,431,148 13.7% 5.0% 95.0% 119,204 0.0% 4.9% 2,310,160 8.1% 95.1% 1,784 3695.7% 100.0% - 0.0% 0.0%
Switzerland 2013 6 213,149 -4.3% 42.6% 57.4% 90,825 -1.6% 42.6% 122,220 -6.2% 57.4% - 0.0% 0.0% 104 22.4% 100.0%
2014 6 223,215 4.7% 41.9% 58.1% 93,418 2.9% 41.9% 129,678 6.1% 58.1% - 0.0% 0.0% 119 14.4% 100.0%
YE 201206 2,395,015 0.7% 42.2% 57.8% 1,011,017 -2.2% 42.2% 1,382,309 3.0% 57.8% - 0.0% 0.0% 1,689 -49.3% 100.0%
YE 201306 2,549,250 6.4% 37.9% 62.1% 965,130 -4.5% 37.9% 1,582,600 14.5% 62.1% 14 0.0% 0.9% 1,506 -10.8% 99.1%
YE 201406 2,408,901 -5.5% 39.4% 60.6% 949,368 -1.6% 39.4% 1,457,709 -7.9% 60.6% 13 -7.1% 0.7% 1,811 20.3% 99.3%
El Salvador 2013 6 171,784 3.8% 39.5% 60.5% 62,548 16.1% 37.6% 103,958 -0.9% 62.4% 5,278 -20.6% 100.0% - 0.0% 0.0%
2014 6 196,092 14.2% 31.5% 68.5% 55,413 -11.4% 29.2% 134,362 29.2% 70.8% 6,317 19.7% 100.0% - 0.0% 0.0%
YE 201206 1,955,919 1.3% 35.7% 64.3% 659,765 -9.8% 34.4% 1,258,460 9.2% 65.6% 37,694 -19.1% 100.0% - 0.0% 0.0%
YE 201306 1,936,882 -1.0% 35.6% 64.4% 635,949 -3.6% 33.8% 1,248,220 -0.8% 66.2% 52,713 39.8% 100.0% - 0.0% 0.0%
YE 201406 2,182,120 12.7% 31.6% 68.4% 630,120 -0.9% 29.7% 1,492,938 19.6% 70.3% 59,062 12.0% 100.0% - 0.0% 0.0%
Source : U.S. Department of Transportation T-100 Segment Data. Page 5 of 5
1/ Due to extensive code-sharing agreements passenger and cargo data for U.S. carriers presented in this table might understate U.S. carrier presence in certain markets.
Please see the report's introduction for further details.
2/ Ranked in descending order according to YE 201406 data.

Table 5 : Top 25 Foreign Country Gateways 1/
Freight (Tons)
Total Freight Scheduled Service Nonscheduled Service
Foreign US Flag Foreign Flag US Flag Foreign Flag
Yr/Yr US Mkt Market Yr/Yr Market Yr/Yr Market Yr/Yr Market Yr/Yr Market
Country 2/ Period Total Chg. Share Share Total Chg. Share Total Chg. Share Total Chg. Share Total Chg. Share
Japan 2013 6 70,019 -5.6% 52.3% 47.7% 31,729 -19.5% 49.0% 33,063 1.5% 51.0% 4,897 191.9% 93.7% 330 -35.8% 6.3%
2014 6 77,897 11.3% 49.8% 50.2% 32,850 3.5% 45.6% 39,128 18.3% 54.4% 5,920 20.9% 100.0% - -100.0% 0.0%
YE 201206 824,662 -0.1% 57.2% 42.8% 446,249 4.8% 56.2% 348,095 0.9% 43.8% 25,315 -44.3% 83.5% 5,003 -46.0% 16.5%
YE 201306 830,334 0.7% 53.8% 46.2% 404,473 -9.4% 51.5% 381,260 9.5% 48.5% 42,440 67.6% 95.2% 2,160 -56.8% 4.8%
YE 201406 864,326 4.1% 50.3% 49.7% 368,336 -8.9% 46.2% 428,822 12.5% 53.8% 66,733 57.2% 99.4% 434 -79.9% 0.6%
Germany 2013 6 67,620 2.5% 42.8% 57.2% 22,308 -3.4% 36.6% 38,625 2.4% 63.4% 6,610 30.7% 98.9% 76 -21.0% 1.1%
2014 6 63,988 -5.4% 45.6% 54.4% 22,711 1.8% 39.7% 34,439 -10.8% 60.3% 6,449 -2.4% 94.3% 389 408.7% 5.7%
YE 201206 746,247 -10.9% 41.5% 58.5% 266,078 -11.9% 37.9% 435,347 -3.9% 62.1% 43,582 -45.4% 97.2% 1,239 -47.5% 2.8%
YE 201306 741,152 -0.7% 43.7% 56.3% 257,620 -3.2% 38.2% 416,459 -4.3% 61.8% 66,269 52.1% 98.8% 804 -35.1% 1.2%
YE 201406 775,884 4.7% 44.4% 55.6% 267,137 3.7% 38.4% 429,289 3.1% 61.6% 77,292 16.6% 97.3% 2,166 169.5% 2.7%
United Kingdom 2013 6 64,020 -1.0% 43.7% 56.3% 26,406 -1.6% 42.5% 35,705 -1.2% 57.5% 1,602 41.8% 83.9% 307 -45.7% 16.1%
2014 6 65,255 1.9% 45.0% 55.0% 27,855 5.5% 43.9% 35,621 -0.2% 56.1% 1,535 -4.2% 86.3% 243 -20.8% 13.7%
YE 201206 768,591 -5.3% 44.3% 55.7% 322,072 -7.8% 43.1% 424,829 -2.7% 56.9% 18,057 -12.1% 83.3% 3,632 -25.7% 16.7%
YE 201306 742,044 -3.5% 43.9% 56.1% 307,341 -4.6% 42.7% 412,380 -2.9% 57.3% 18,482 2.4% 82.8% 3,840 5.7% 17.2%
YE 201406 768,414 3.6% 45.2% 54.8% 327,242 6.5% 43.9% 418,973 1.6% 56.1% 20,209 9.3% 91.0% 1,989 -48.2% 9.0%
China 2013 6 56,535 -1.8% 41.6% 58.4% 17,418 -24.3% 34.5% 33,017 7.2% 65.5% 6,099 61.9% 100.0% - 0.0% 0.0%
2014 6 61,579 8.9% 44.0% 56.0% 16,308 -6.4% 32.1% 34,508 4.5% 67.9% 10,764 76.5% 100.0% - 0.0% 0.0%
YE 201206 656,479 2.7% 47.2% 52.8% 269,675 3.8% 43.8% 346,588 4.7% 56.2% 40,197 -17.5% 100.0% 19 0.0% 0.0%
YE 201306 659,873 0.5% 45.5% 54.5% 233,359 -13.5% 39.4% 358,718 3.5% 60.6% 66,959 66.6% 98.8% 837 4268.6% 1.2%
YE 201406 687,392 4.2% 43.9% 56.1% 198,926 -14.8% 34.0% 385,913 7.6% 66.0% 102,552 53.2% 100.0% - -100.0% 0.0%
Hong Kong 2013 6 51,586 -1.8% 45.3% 54.7% 11,294 -25.5% 28.6% 28,197 4.7% 71.4% 12,095 15.7% 100.0% - 0.0% 0.0%
2014 6 59,911 16.1% 40.7% 59.3% 10,919 -3.3% 23.5% 35,524 26.0% 76.5% 13,467 11.3% 100.0% - 0.0% 0.0%
YE 201206 604,499 -6.9% 45.6% 54.4% 169,854 -22.3% 34.1% 328,819 -13.9% 65.9% 105,826 117.4% 100.0% - 0.0% 0.0%
YE 201306 623,458 3.1% 46.2% 53.8% 142,641 -16.0% 29.8% 335,291 2.0% 70.2% 145,526 37.5% 100.0% - 0.0% 0.0%
YE 201406 674,530 8.2% 42.7% 57.3% 128,125 -10.2% 24.9% 386,484 15.3% 75.1% 159,922 9.9% 100.0% - 0.0% 0.0%
Source : U.S. Department of Transportation T-100 Segment Data. Page 1 of 5
1/ Due to extensive code-sharing agreements passenger and cargo data for U.S. carriers presented in this table might understate U.S. carrier presence in certain markets.
Please see the report's introduction for further details.
2/ Ranked in descending order according to YE 201406 data.

Table 5 : Top 25 Foreign Country Gateways 1/
Freight (Tons)
Total Freight Scheduled Service Nonscheduled Service
Foreign US Flag Foreign Flag US Flag Foreign Flag
Yr/Yr US Mkt Market Yr/Yr Market Yr/Yr Market Yr/Yr Market Yr/Yr Market
Country 2/ Period Total Chg. Share Share Total Chg. Share Total Chg. Share Total Chg. Share Total Chg. Share
South Korea 2013 6 55,609 -7.8% 33.3% 66.7% 8,443 -34.1% 23.2% 27,923 -15.5% 76.8% 10,088 9.3% 52.4% 9,155 75.1% 47.6%
2014 6 61,628 10.8% 30.5% 69.5% 10,040 18.9% 22.2% 35,240 26.2% 77.8% 8,752 -13.2% 53.5% 7,596 -17.0% 46.5%
YE 201206 715,009 -17.5% 32.4% 67.6% 153,168 -6.7% 27.0% 414,255 -8.1% 73.0% 78,825 -31.6% 53.4% 68,761 -49.5% 46.6%
YE 201306 662,268 -7.4% 35.3% 64.7% 122,363 -20.1% 24.7% 373,651 -9.8% 75.3% 111,581 41.6% 67.1% 54,673 -20.5% 32.9%
YE 201406 669,323 1.1% 30.1% 69.9% 108,520 -11.3% 20.9% 411,199 10.0% 79.1% 92,960 -16.7% 62.1% 56,643 3.6% 37.9%
Taiwan 2013 6 52,611 -0.6% 9.8% 90.2% 5,168 3.3% 9.8% 47,443 -1.0% 90.2% - 0.0% 0.0% - 0.0% 0.0%
2014 6 55,765 6.0% 10.2% 89.8% 5,711 10.5% 10.2% 50,053 5.5% 89.8% - 0.0% 0.0% - 0.0% 0.0%
YE 201206 621,671 -8.5% 9.2% 90.8% 57,013 -2.3% 9.2% 564,629 -8.8% 90.8% 29 -98.4% 100.0% - 0.0% 0.0%
YE 201306 577,247 -7.1% 10.6% 89.4% 61,396 7.7% 10.6% 515,791 -8.6% 89.4% 60 107.0% 100.0% - 0.0% 0.0%
YE 201406 594,371 3.0% 11.3% 88.7% 67,330 9.7% 11.3% 527,017 2.2% 88.7% 25 -58.8% 100.0% - 0.0% 0.0%
Colombia 2013 6 29,033 18.1% 41.8% 58.2% 5,631 -29.6% 25.0% 16,903 113.8% 75.0% 6,499 -25.0% 100.0% - 0.0% 0.0%
2014 6 42,753 47.3% 36.8% 63.2% 10,833 92.4% 28.6% 27,016 59.8% 71.4% 4,904 -24.5% 100.0% - 0.0% 0.0%
YE 201206 435,769 3.3% 51.9% 48.1% 107,633 25.6% 34.5% 204,416 -3.7% 65.5% 118,394 71.9% 95.7% 5,326 -90.3% 4.3%
YE 201306 409,405 -6.1% 42.9% 57.1% 96,162 -10.7% 29.1% 233,916 14.4% 70.9% 79,316 -33.0% 100.0% 11 -99.8% 0.0%
YE 201406 470,978 15.0% 34.6% 65.4% 94,055 -2.2% 23.4% 308,000 31.7% 76.6% 68,923 -13.1% 100.0% - -100.0% 0.0%
Mexico 2013 6 36,298 0.6% 60.1% 39.9% 18,669 5.8% 56.3% 14,472 -2.6% 43.7% 3,156 -11.4% 100.0% 0 0.0% 0.0%
2014 6 30,603 -15.7% 68.0% 32.0% 18,107 -3.0% 66.2% 9,256 -36.0% 33.8% 2,694 -14.6% 83.2% 545 119212.8% 16.8%
YE 201206 417,249 -3.4% 60.4% 39.6% 194,671 10.4% 54.2% 164,721 -1.3% 45.8% 57,462 -35.0% 99.3% 395 -17.1% 0.7%
YE 201306 407,981 -2.2% 60.2% 39.8% 207,791 6.7% 56.2% 162,137 -1.6% 43.8% 37,811 -34.2% 99.4% 242 -38.8% 0.6%
YE 201406 408,986 0.2% 62.4% 37.6% 216,002 4.0% 60.2% 143,073 -11.8% 39.8% 39,327 4.0% 78.8% 10,583 4274.9% 21.2%
France 2013 6 28,322 -14.3% 54.3% 45.7% 15,393 -16.6% 54.5% 12,830 -11.5% 45.5% - -100.0% 0.0% 99 0.0% 100.0%
2014 6 29,060 2.6% 55.1% 44.9% 15,968 3.7% 55.0% 13,058 1.8% 45.0% 35 0.0% 100.0% - -100.0% 0.0%
YE 201206 376,922 -1.1% 58.6% 41.4% 220,330 2.3% 58.6% 155,474 -5.2% 41.4% 473 -57.3% 42.3% 644 -9.7% 57.7%
YE 201306 338,195 -10.3% 57.0% 43.0% 190,778 -13.4% 56.8% 145,011 -6.7% 43.2% 1,920 306.1% 79.8% 486 -24.6% 20.2%
YE 201406 344,277 1.8% 55.9% 44.1% 192,100 0.7% 56.0% 151,232 4.3% 44.0% 468 -75.6% 49.5% 477 -1.8% 50.5%
Source : U.S. Department of Transportation T-100 Segment Data. Page 2 of 5
1/ Due to extensive code-sharing agreements passenger and cargo data for U.S. carriers presented in this table might understate U.S. carrier presence in certain markets.
Please see the report's introduction for further details.
2/ Ranked in descending order according to YE 201406 data.

Table 5 : Top 25 Foreign Country Gateways 1/
Freight (Tons)
Total Freight Scheduled Service Nonscheduled Service
Foreign US Flag Foreign Flag US Flag Foreign Flag
Yr/Yr US Mkt Market Yr/Yr Market Yr/Yr Market Yr/Yr Market Yr/Yr Market
Country 2/ Period Total Chg. Share Share Total Chg. Share Total Chg. Share Total Chg. Share Total Chg. Share
Netherlands 2013 6 26,618 -1.3% 36.5% 63.5% 7,312 6.7% 31.7% 15,782 -3.6% 68.3% 2,406 6.0% 68.3% 1,118 -24.6% 31.7%
2014 6 30,175 13.4% 39.3% 60.7% 9,638 31.8% 37.3% 16,168 2.4% 62.7% 2,220 -7.7% 50.8% 2,148 92.3% 49.2%
YE 201206 344,480 4.7% 30.5% 69.5% 76,917 -10.8% 26.6% 211,861 -1.6% 73.4% 28,075 22.2% 50.4% 27,628 522.4% 49.6%
YE 201306 319,120 -7.4% 33.3% 66.7% 80,385 4.5% 28.5% 201,685 -4.8% 71.5% 25,843 -8.0% 69.8% 11,207 -59.4% 30.2%
YE 201406 332,482 4.2% 34.5% 65.5% 92,738 15.4% 31.7% 199,981 -0.8% 68.3% 21,840 -15.5% 54.9% 17,922 59.9% 45.1%
Canada 2013 6 28,136 1.2% 75.8% 24.2% 19,519 -6.1% 78.9% 5,214 4.5% 21.1% 1,815 179.5% 53.3% 1,588 15.1% 46.7%
2014 6 28,169 0.1% 75.5% 24.5% 19,497 -0.1% 80.5% 4,732 -9.3% 19.5% 1,781 -1.9% 45.2% 2,159 36.0% 54.8%
YE 201206 330,733 -7.0% 76.0% 24.0% 233,894 1.9% 79.4% 60,865 -27.3% 20.6% 17,473 4.8% 48.6% 18,501 -28.2% 51.4%
YE 201306 326,912 -1.2% 76.4% 23.6% 237,281 1.4% 79.6% 60,920 0.1% 20.4% 12,344 -29.4% 43.0% 16,368 -11.5% 57.0%
YE 201406 330,366 1.1% 76.6% 23.4% 234,926 -1.0% 79.4% 61,131 0.3% 20.6% 18,096 46.6% 52.7% 16,214 -0.9% 47.3%
Brazil 2013 6 24,575 -7.7% 63.3% 36.7% 9,188 -17.5% 53.0% 8,156 20.9% 47.0% 6,370 -24.0% 88.1% 861 133.1% 11.9%
2014 6 23,685 -3.6% 61.5% 38.5% 10,417 13.4% 55.4% 8,372 2.6% 44.6% 4,150 -34.8% 84.8% 746 -13.4% 15.2%
YE 201206 331,817 -0.4% 67.9% 32.1% 140,247 5.4% 57.1% 105,447 6.3% 42.9% 84,912 -11.8% 98.6% 1,210 -73.8% 1.4%
YE 201306 290,406 -12.5% 62.1% 37.9% 107,645 -23.2% 51.3% 102,087 -3.2% 48.7% 72,821 -14.2% 90.3% 7,853 548.8% 9.7%
YE 201406 281,422 -3.1% 56.8% 43.2% 105,338 -2.1% 48.4% 112,155 9.9% 51.6% 54,619 -25.0% 85.4% 9,310 18.6% 14.6%
Peru 2013 6 13,912 -7.3% 46.7% 53.3% 2,644 -26.9% 29.2% 6,402 11.6% 70.8% 3,847 -26.5% 79.1% 1,018 144.1% 20.9%
2014 6 15,805 13.6% 51.1% 48.9% 4,977 88.2% 42.6% 6,694 4.6% 57.4% 3,106 -19.3% 75.1% 1,028 1.0% 24.9%
YE 201206 166,484 6.0% 56.4% 43.6% 41,147 68.7% 37.4% 69,003 -1.7% 62.6% 52,733 22.1% 93.6% 3,601 -81.3% 6.4%
YE 201306 180,530 8.4% 50.0% 50.0% 37,321 -9.3% 31.0% 82,997 20.3% 69.0% 52,895 0.3% 87.8% 7,317 103.2% 12.2%
YE 201406 178,356 -1.2% 46.4% 53.6% 39,190 5.0% 31.4% 85,727 3.3% 68.6% 43,583 -17.6% 81.6% 9,857 34.7% 18.4%
Luxembourg 2013 6 18,146 49.2% 22.3% 77.7% - 0.0% 0.0% 12,875 40.5% 100.0% 4,042 34.8% 76.7% 1,229 0.0% 23.3%
2014 6 15,734 -13.3% 24.5% 75.5% - 0.0% 0.0% 11,878 -7.7% 100.0% 3,856 -4.6% 100.0% - -100.0% 0.0%
YE 201206 164,157 -4.2% 26.7% 73.3% - -100.0% 0.0% 117,310 -4.5% 100.0% 43,766 5.3% 93.4% 3,082 -54.9% 6.6%
YE 201306 163,352 -0.5% 25.2% 74.8% - 0.0% 0.0% 120,411 2.6% 100.0% 41,218 -5.8% 96.0% 1,723 -44.1% 4.0%
YE 201406 177,699 8.8% 26.1% 73.9% - 0.0% 0.0% 131,212 9.0% 100.0% 46,368 12.5% 99.7% 119 -93.1% 0.3%
Source : U.S. Department of Transportation T-100 Segment Data. Page 3 of 5
1/ Due to extensive code-sharing agreements passenger and cargo data for U.S. carriers presented in this table might understate U.S. carrier presence in certain markets.
Please see the report's introduction for further details.
2/ Ranked in descending order according to YE 201406 data.

Table 5 : Top 25 Foreign Country Gateways 1/
Freight (Tons)
Total Freight Scheduled Service Nonscheduled Service
Foreign US Flag Foreign Flag US Flag Foreign Flag
Yr/Yr US Mkt Market Yr/Yr Market Yr/Yr Market Yr/Yr Market Yr/Yr Market
Country 2/ Period Total Chg. Share Share Total Chg. Share Total Chg. Share Total Chg. Share Total Chg. Share
Ecuador 2013 6 12,745 19.3% 41.6% 58.4% 2,080 -45.9% 21.8% 7,445 64.0% 78.2% 3,220 40.5% 100.0% - 0.0% 0.0%
2014 6 14,231 11.7% 56.0% 44.0% 4,060 95.2% 39.3% 6,267 -15.8% 60.7% 3,904 21.2% 100.0% - 0.0% 0.0%
YE 201206 113,628 11.8% 47.4% 52.6% 36,571 25.0% 38.1% 59,504 -0.7% 61.9% 17,306 41.0% 98.6% 248 2.4% 1.4%
YE 201306 133,070 17.1% 47.1% 52.9% 34,325 -6.1% 32.8% 70,396 18.3% 67.2% 28,349 63.8% 100.0% - -100.0% 0.0%
YE 201406 166,812 25.4% 44.5% 55.5% 30,564 -11.0% 24.8% 92,645 31.6% 75.2% 43,603 53.8% 100.0% - 0.0% 0.0%
Chile 2013 6 7,804 -22.2% 53.7% 46.3% 1,349 -54.7% 27.2% 3,613 -23.7% 72.8% 2,842 22.7% 100.0% - 0.0% 0.0%
2014 6 8,524 9.2% 51.6% 48.4% 1,913 41.8% 31.7% 4,124 14.1% 68.3% 2,486 -12.5% 100.0% - 0.0% 0.0%
YE 201206 161,043 26.5% 56.0% 44.0% 42,918 28.3% 37.7% 70,794 19.9% 62.3% 47,287 39.4% 99.9% 44 -95.1% 0.1%
YE 201306 159,215 -1.1% 53.0% 47.0% 25,854 -39.8% 26.0% 73,773 4.2% 74.0% 58,586 23.9% 98.3% 1,002 2177.4% 1.7%
YE 201406 129,516 -18.7% 49.0% 51.0% 23,153 -10.4% 26.1% 65,493 -11.2% 73.9% 40,367 -31.1% 98.8% 502 -49.9% 1.2%
United Arab Emirate 2013 6 9,579 11.7% 23.1% 76.9% 2,213 6.7% 23.1% 7,349 13.0% 76.9% - 0.0% 0.0% 17 0.0% 100.0%
2014 6 11,521 20.3% 17.3% 82.7% 1,993 -9.9% 17.3% 9,529 29.7% 82.7% - 0.0% 0.0% - -100.0% 0.0%
YE 201206 91,073 2.6% 25.3% 74.7% 23,048 48.1% 25.3% 67,997 -5.0% 74.7% 28 -98.1% 100.0% - -100.0% 0.0%
YE 201306 107,470 18.0% 24.3% 75.7% 26,109 13.3% 24.3% 81,245 19.5% 75.7% 7 -75.7% 5.8% 110 0.0% 94.2%
YE 201406 124,340 15.7% 19.8% 80.2% 24,273 -7.0% 19.6% 99,607 22.6% 80.4% 361 5195.6% 78.3% 100 -8.9% 21.7%
Australia 2013 6 9,996 -7.7% 56.9% 43.1% 3,976 -11.3% 48.0% 4,308 -6.2% 52.0% 1,712 -2.3% 100.0% - 0.0% 0.0%
2014 6 10,304 3.1% 51.7% 48.3% 4,091 2.9% 45.1% 4,973 15.4% 54.9% 1,240 -27.5% 100.0% - 0.0% 0.0%
YE 201206 120,653 0.3% 59.4% 40.6% 52,480 -4.2% 51.7% 48,976 6.6% 48.3% 19,197 9.6% 100.0% - -100.0% 0.0%
YE 201306 127,790 5.9% 60.3% 39.7% 50,434 -3.9% 49.9% 50,612 3.3% 50.1% 26,631 38.7% 99.6% 113 0.0% 0.4%
YE 201406 120,259 -5.9% 54.6% 45.4% 48,635 -3.6% 47.2% 54,514 7.7% 52.8% 17,080 -35.9% 99.8% 29 -73.9% 0.2%
Qatar 2013 6 6,159 37.3% 0.0% 100.0% - 0.0% 0.0% 6,159 37.3% 100.0% - 0.0% 0.0% - 0.0% 0.0%
2014 6 9,904 60.8% 0.0% 100.0% - 0.0% 0.0% 9,904 60.8% 100.0% - 0.0% 0.0% - 0.0% 0.0%
YE 201206 56,570 5.1% 0.0% 100.0% - 0.0% 0.0% 56,570 5.2% 100.0% - 0.0% 0.0% - -100.0% 0.0%
YE 201306 66,703 17.9% 0.0% 100.0% - 0.0% 0.0% 66,540 17.6% 100.0% - 0.0% 0.0% 163 0.0% 100.0%
YE 201406 104,196 56.2% 0.0% 100.0% - 0.0% 0.0% 104,196 56.6% 100.0% - 0.0% 0.0% - -100.0% 0.0%
Source : U.S. Department of Transportation T-100 Segment Data. Page 4 of 5
1/ Due to extensive code-sharing agreements passenger and cargo data for U.S. carriers presented in this table might understate U.S. carrier presence in certain markets.
Please see the report's introduction for further details.
2/ Ranked in descending order according to YE 201406 data.

Table 5 : Top 25 Foreign Country Gateways 1/
Freight (Tons)
Total Freight Scheduled Service Nonscheduled Service
Foreign US Flag Foreign Flag US Flag Foreign Flag
Yr/Yr US Mkt Market Yr/Yr Market Yr/Yr Market Yr/Yr Market Yr/Yr Market
Country 2/ Period Total Chg. Share Share Total Chg. Share Total Chg. Share Total Chg. Share Total Chg. Share
Belgium 2013 6 8,125 -42.6% 27.2% 72.8% 2,085 -17.6% 27.1% 5,620 -37.1% 72.9% 128 -95.1% 30.4% 293 180.7% 69.6%
2014 6 10,098 24.3% 48.0% 52.0% 2,083 -0.1% 28.6% 5,206 -7.4% 71.4% 2,765 2062.2% 98.5% 43 -85.3% 1.5%
YE 201206 183,008 -0.4% 38.9% 61.1% 30,764 -9.4% 22.5% 106,095 1.3% 77.5% 40,476 13.4% 87.7% 5,673 -39.2% 12.3%
YE 201306 112,778 -38.4% 37.5% 62.5% 25,068 -18.5% 27.4% 66,452 -37.4% 72.6% 17,257 -57.4% 81.2% 4,001 -29.5% 18.8%
YE 201406 101,986 -9.6% 41.3% 58.7% 24,007 -4.2% 28.9% 59,009 -11.2% 71.1% 18,113 5.0% 95.5% 855 -78.6% 4.5%
Italy 2013 6 8,410 25.6% 61.5% 38.5% 4,881 27.8% 60.1% 3,234 25.5% 39.9% 296 -1.9% 100.0% - 0.0% 0.0%
2014 6 9,331 10.9% 58.7% 41.3% 5,098 4.5% 57.1% 3,832 18.5% 42.9% 380 28.6% 95.1% 20 0.0% 4.9%
YE 201206 69,382 -2.6% 60.4% 39.6% 39,341 -11.1% 59.0% 27,350 7.2% 41.0% 2,582 82.4% 96.0% 109 101.2% 4.0%
YE 201306 82,306 18.6% 59.4% 40.6% 46,071 17.1% 58.1% 33,276 21.7% 41.9% 2,827 9.5% 95.6% 131 20.9% 4.4%
YE 201406 89,856 9.2% 60.2% 39.8% 50,961 10.6% 58.8% 35,774 7.5% 41.2% 3,090 9.3% 99.0% 32 -75.9% 1.0%
Argentina 2013 6 6,169 -11.1% 54.1% 45.9% 2,425 -6.0% 46.1% 2,832 -4.8% 53.9% 911 -34.1% 100.0% - 0.0% 0.0%
2014 6 6,852 11.1% 52.1% 47.9% 2,405 -0.8% 42.3% 3,282 15.9% 57.7% 1,165 27.9% 100.0% - 0.0% 0.0%
YE 201206 81,155 1.3% 55.9% 44.1% 34,267 1.9% 48.9% 35,741 -1.2% 51.1% 11,086 10.9% 99.5% 61 -81.7% 0.5%
YE 201306 92,016 13.4% 58.3% 41.7% 36,364 6.1% 48.7% 38,356 7.3% 51.3% 17,296 56.0% 100.0% - -100.0% 0.0%
YE 201406 82,371 -10.5% 56.2% 43.8% 34,071 -6.3% 48.6% 36,090 -5.9% 51.4% 12,210 -29.4% 100.0% - 0.0% 0.0%
Switzerland 2013 6 6,766 -8.2% 22.1% 77.9% 1,495 -3.9% 22.1% 5,271 -9.3% 77.9% - 0.0% 0.0% - 0.0% 0.0%
2014 6 6,827 0.9% 21.4% 78.6% 1,461 -2.2% 21.4% 5,365 1.8% 78.6% - 0.0% 0.0% - 0.0% 0.0%
YE 201206 83,908 -4.1% 24.1% 75.9% 20,251 -13.5% 24.1% 63,656 -0.7% 75.9% - -100.0% 0.0% - 0.0% 0.0%
YE 201306 88,461 5.4% 20.5% 79.5% 18,092 -10.7% 20.5% 70,364 10.5% 79.5% 5 0.0% 100.0% - 0.0% 0.0%
YE 201406 81,874 -7.4% 20.4% 79.6% 16,660 -7.9% 20.4% 65,044 -7.6% 79.6% 13 151.7% 7.5% 157 0.0% 92.5%
Venezuela 2013 6 5,863 -18.8% 78.2% 21.8% 2,903 -21.5% 69.4% 1,279 6.8% 30.6% 1,680 -27.4% 100.0% 0 -92.2% 0.0%
2014 6 6,289 7.3% 75.1% 24.9% 2,840 -2.2% 64.5% 1,565 22.4% 35.5% 1,884 12.1% 100.0% - -100.0% 0.0%
YE 201206 92,057 6.3% 76.5% 23.5% 44,647 80.7% 69.9% 19,208 -10.1% 30.1% 25,780 -12.2% 91.4% 2,423 -78.3% 8.6%
YE 201306 81,893 -11.0% 79.0% 21.0% 39,677 -11.1% 70.1% 16,940 -11.8% 29.9% 24,981 -3.1% 98.8% 294 -87.9% 1.2%
YE 201406 78,018 -4.7% 78.0% 22.0% 33,089 -16.6% 65.8% 17,169 1.4% 34.2% 27,760 11.1% 100.0% - -100.0% 0.0%
Source : U.S. Department of Transportation T-100 Segment Data. Page 5 of 5
1/ Due to extensive code-sharing agreements passenger and cargo data for U.S. carriers presented in this table might understate U.S. carrier presence in certain markets.
Please see the report's introduction for further details.
2/ Ranked in descending order according to YE 201406 data.

Table 6 : Top 40 U.S. Passenger Gateways to the World, Scheduled Passenger Service 1/
YE US Foreign US Foreign Yr/Yr June 2014
Gateway City Apt. Passengers Share Share Passengers Share Share Growth LF
New York, NY JFK 26,804,394 38.3% 61.7% 25,242,219 39.4% 60.6% 6.2% 81.1%
Miami, FL MIA 19,526,865 59.4% 40.6% 19,048,884 59.6% 40.4% 2.5% 80.0%
Los Angeles, CA LAX 18,143,337 23.7% 76.3% 16,961,887 22.3% 77.7% 7.0% 84.0%
Newark, NJ EWR 11,159,723 70.0% 30.0% 11,144,905 69.5% 30.5% 0.1% 82.1%
Chicago, IL ORD 10,914,048 54.9% 45.1% 10,280,407 56.4% 43.6% 6.2% 80.4%
Atlanta, GA ATL 10,328,012 87.6% 12.4% 9,734,025 86.9% 13.1% 6.1% 85.7%
San Francisco, CA SFO 9,854,516 39.6% 60.4% 9,274,246 40.0% 60.0% 6.3% 84.9%
Houston, TX IAH 9,199,160 75.7% 24.3% 8,527,190 78.1% 21.9% 7.9% 79.1%
Washington, DC IAD 6,875,959 44.4% 55.6% 6,598,516 46.4% 53.6% 4.2% 77.2%
Dallas/Fort Worth, TX DFW 6,662,174 83.5% 16.5% 6,154,396 82.6% 17.4% 8.3% 77.9%
Honolulu, HI HNL 4,893,384 42.0% 58.0% 4,554,585 45.7% 54.3% 7.4% 77.0%
Boston, MA BOS 4,121,176 24.3% 75.7% 4,096,633 27.2% 72.8% 0.6% 78.8%
Fort Lauderdale, FL FLL 3,938,106 60.2% 39.8% 3,561,116 55.7% 44.3% 10.6% 80.2%
Orlando, FL MCO 3,891,253 14.7% 85.3% 3,728,519 14.7% 85.3% 4.4% 82.3%
Philadelphia, PA PHL 3,869,074 88.8% 11.2% 3,852,704 88.5% 11.5% 0.4% 77.5%
Seattle, WA SEA 3,447,519 56.4% 43.6% 3,181,605 55.5% 44.5% 8.4% 79.8%
Detroit, MI DTW 3,378,091 88.9% 11.1% 3,267,008 89.2% 10.8% 3.4% 83.5%
Charlotte, NC CLT 3,124,244 93.4% 6.6% 3,013,919 92.9% 7.1% 3.7% 81.3%
Las Vegas, NV LAS 2,998,137 0.1% 99.9% 2,859,814 0.0% 100.0% 4.8% 83.8%
Guam, TT GUM 2,694,182 65.5% 34.5% 2,751,911 66.9% 33.1% -2.1% 75.9%
Minneapolis, MN MSP 2,349,861 93.1% 6.9% 2,191,525 94.2% 5.8% 7.2% 82.3%
Phoenix, AZ PHX 2,219,991 64.8% 35.2% 2,252,514 68.4% 31.6% -1.4% 79.1%
Denver, CO DEN 2,126,556 69.9% 30.1% 1,779,433 65.8% 34.2% 19.5% 82.1%
New York, NY LGA 1,613,055 34.9% 65.1% 1,622,112 30.6% 69.4% -0.6% 66.9%
San Juan, PR SJU 928,582 76.7% 23.3% 1,008,214 74.4% 25.6% -7.9% 68.2%
Saipan, TT SPN 745,304 26.6% 73.4% 712,693 32.9% 67.1% 4.6% 81.1%
San Diego, CA SAN 739,070 37.6% 62.4% 614,959 33.2% 66.8% 20.2% 81.9%
Baltimore, MD BWI 686,990 72.8% 27.2% 606,522 69.3% 30.7% 13.3% 81.2%
Chicago, IL MDW 560,060 38.1% 61.9% 477,080 24.1% 75.9% 17.4% 74.8%
Tampa, FL TPA 501,200 1.3% 98.7% 488,701 1.4% 98.6% 2.6% 80.2%
Portland, OR PDX 462,830 74.7% 25.3% 446,309 71.9% 28.1% 3.7% 79.0%
San Antonio, TX SAT 454,805 24.2% 75.8% 464,544 22.6% 77.4% -2.1% 74.4%
San Jose, CA SJC 352,974 45.8% 54.2% 246,489 55.9% 44.1% 43.2% 82.3%
Santa Ana, CA SNA 352,893 47.0% 53.0% 366,150 40.6% 59.4% -3.6% 72.0%
Salt Lake City, UT SLC 349,660 99.7% 0.3% 328,338 100.0% 0.0% 6.5% 83.7%
Kahului, HI OGG 301,785 0.0% 100.0% 327,896 0.0% 100.0% -8.0% 86.5%
Fort Myers, FL RSW 295,954 2.6% 97.4% 299,768 2.0% 98.0% -1.3% 83.2%
Washington, DC DCA 290,673 55.2% 44.8% 410,109 48.6% 51.4% -29.1% 68.1%
Palm Springs, CA PSP 263,493 0.0% 100.0% 239,877 0.0% 100.0% 9.8% 80.9%
Raleigh/Durham, NC RDU 187,285 68.1% 31.9% 180,186 67.5% 32.5% 3.9% 72.1%
Source : U.S. Department of Transportation T-100 Segment Data Page 1 of 11/ Ranked in descending order according to latest year ended data.
YE June 2014 YE June 2013

Table 7 : Top 40 International Passenger Gateways to the U.S., Scheduled Passenger Service 1/
YE June 2014 YE June 2013 YE Foreign US Foreign US Foreign Yr/Yr June 2014
Gateway City Airport Passengers Share Share Passengers Share Share Growth LF
London, United Kingdom LHR 14,162,763 38.6% 61.4% 13,843,571 38.5% 61.5% 2.3% 79.6%
Toronto, Canada YYZ 9,199,469 34.7% 65.3% 9,720,816 32.7% 67.3% -5.4% 77.4%
Tokyo, Japan NRT 8,143,810 60.9% 39.1% 8,137,752 63.9% 36.1% 0.1% 81.0%
Frankfurt, Germany FRA 6,513,331 35.2% 64.8% 6,429,696 36.7% 63.3% 1.3% 83.1%
Paris, France CDG 6,412,178 43.1% 56.9% 5,951,671 40.4% 59.6% 7.7% 85.3%
Cancun, Mexico CUN 6,088,064 98.1% 1.9% 5,488,727 98.5% 1.5% 10.9% 85.3%
Mexico City, Mexico MEX 5,888,906 50.1% 49.9% 5,568,981 51.9% 48.1% 5.7% 76.4%
Seoul, South Korea ICN 4,933,175 15.0% 85.0% 4,582,473 11.9% 88.1% 7.7% 77.8%
Amsterdam, Netherlands AMS 4,686,799 63.3% 36.7% 4,574,014 63.6% 36.4% 2.5% 85.3%
Vancouver, Canada YVR 4,540,445 51.0% 49.0% 4,296,354 49.2% 50.8% 5.7% 82.5%
Sao Paulo, Brazil GRU 3,297,088 64.8% 35.2% 2,894,741 65.0% 35.0% 13.9% 80.7%
Montreal, Canada YUL 3,147,471 55.6% 44.4% 3,265,739 53.1% 46.9% -3.6% 77.7%
Calgary, Canada YYC 3,009,910 49.4% 50.6% 2,771,718 50.0% 50.0% 8.6% 80.4%
Panama City, Panama PTY 2,554,687 27.5% 72.5% 2,239,307 31.3% 68.7% 14.1% 76.2%
Hong Kong, Hong Kong HKG 2,515,710 24.8% 75.2% 2,404,436 27.9% 72.1% 4.6% 86.9%
Guadalajara, Mexico GDL 2,515,371 46.1% 53.9% 2,256,564 50.5% 49.5% 11.5% 80.4%
Dubai, United Arab Emirates DXB 2,386,804 13.8% 86.2% 1,979,576 17.2% 82.8% 20.6% 84.5%
San Jose del Cabo, Mexico SJD 2,320,231 100.0% 0.0% 1,968,281 100.0% 0.0% 17.9% 83.4%
Beijing, China PEK 2,289,395 47.7% 52.3% 1,935,180 56.0% 44.0% 18.3% 83.0%
Montego Bay, Jamaica MBJ 2,220,461 92.8% 7.2% 2,138,957 90.8% 9.2% 3.8% 81.7%
Punta Cana, Dominican Republ PUJ 1,979,729 98.4% 1.6% 1,598,096 97.9% 2.1% 23.9% 84.7%
Santo Domingo, Dominican Rep SDQ 2,069,237 91.7% 8.3% 2,025,438 96.4% 3.6% 2.2% 77.0%
Nassau, The Bahamas NAS 2,032,267 80.1% 19.9% 2,104,640 80.7% 19.3% -3.4% 75.7%
Shanghai, China PVG 2,033,975 63.5% 36.5% 1,797,137 66.8% 33.2% 13.2% 85.8%
Bogota, Colombia BOG 2,023,438 51.9% 48.1% 1,859,578 53.0% 47.0% 8.8% 83.3%
Taipei, Taiwan TPE 2,008,196 4.1% 95.9% 1,782,652 0.0% 100.0% 12.7% 82.7%
Munich, Germany MUC 1,998,535 36.6% 63.4% 1,985,199 35.5% 64.5% 0.7% 84.5%
Madrid, Spain MAD 1,929,912 47.3% 52.7% 1,944,508 44.7% 55.3% -0.8% 82.6%
San Jose, Costa Rica SJO 1,808,181 98.4% 1.6% 1,746,886 90.6% 9.4% 3.5% 81.7%
Dublin, Ireland DUB 1,789,885 43.6% 56.4% 1,594,394 43.0% 57.0% 12.3% 85.9%
Sydney, Australia SYD 1,762,773 42.9% 57.1% 1,764,606 43.6% 56.4% -0.1% 80.6%
Lima, Peru LIM 1,729,393 46.6% 53.4% 1,522,469 42.7% 57.3% 13.6% 85.7%
Rome, Italy FCO 1,724,925 56.4% 43.6% 1,713,430 57.1% 42.9% 0.7% 85.2%
San Salvador, El Salvador SAL 1,656,243 28.4% 71.6% 1,470,948 30.0% 70.0% 12.6% 78.0%
Zurich, Switzerland ZRH 1,666,865 32.6% 67.4% 1,798,487 30.6% 69.4% -7.3% 83.4%
Tel Aviv, Israel TLV 1,420,946 53.5% 46.5% 1,390,280 53.7% 46.3% 2.2% 87.8%
Ezeiza, Argentina EZE 1,414,574 65.5% 34.5% 1,393,610 73.1% 26.9% 1.5% 79.9%
Puerto Vallarta, Mexico PVR 1,331,696 99.4% 0.6% 1,200,800 100.0% 0.0% 10.9% 85.6%
Istanbul, Turkey IST 1,349,114 5.8% 94.2% 1,221,037 14.4% 85.6% 10.5% 84.7%
Edmonton, Canada YEG 1,317,884 65.5% 34.5% 1,204,906 64.7% 35.3% 9.4% 83.2%
Source : U.S. Department of Transportation T-100 Segment Data Page 1 of 11/ Ranked in descending order according to latest year ended data.

Table 8: Top 50 U.S- International Airport Pairs, Scheduled Passenger Service 1/Passenger Data Seat Data
US Foreign US Foreign YEUS Foreign Market Market YE YE Yr/Yr Market Market YE YE Yr/Yr June 2014
Airport Airport Share Share June 2014 June 2013 Growth Share Share June 2014 June 2013 Growth LF
JFK LHR 30.3% 69.7% 2,930,384 2,886,783 1.5% 36.3% 63.7% 3,820,150 3,701,136 3.2% 76.7%HNL NRT 38.0% 62.0% 1,506,320 1,505,032 0.1% 43.6% 56.4% 1,867,280 1,797,706 3.9% 80.7%LAX LHR 23.2% 76.8% 1,439,647 1,389,640 3.6% 22.8% 77.2% 1,685,438 1,612,675 4.5% 85.4%JFK CDG 27.4% 72.6% 1,392,077 1,348,769 3.2% 28.6% 71.4% 1,586,416 1,522,579 4.2% 87.7%ORD LHR 65.5% 34.5% 1,140,530 1,140,476 0.0% 69.2% 30.8% 1,461,948 1,414,507 3.4% 78.0%LAX NRT 44.0% 56.0% 1,139,861 1,266,338 -10.0% 37.2% 62.8% 1,337,739 1,507,111 -11.2% 85.2%EWR LHR 44.8% 55.2% 1,118,389 1,139,710 -1.9% 42.4% 57.6% 1,525,517 1,534,135 -0.6% 73.3%LGA YYZ 19.6% 80.4% 1,110,973 1,055,360 5.3% 21.0% 79.0% 1,663,297 1,690,028 -1.6% 66.8%LAX SYD 35.6% 64.4% 1,054,254 1,048,171 0.6% 35.3% 64.7% 1,309,964 1,297,136 1.0% 80.5%MIA GRU 51.5% 48.5% 1,013,834 883,419 14.8% 56.1% 43.9% 1,232,698 1,086,098 13.5% 82.2%LAX ICN 0.0% 100.0% 1,005,414 1,005,368 0.0% 0.0% 100.0% 1,276,557 1,252,285 1.9% 78.8%MIA LHR 33.2% 66.8% 981,706 972,073 1.0% 22.6% 77.4% 1,143,626 1,110,580 3.0% 85.8%
GUM NRT 83.7% 16.3% 936,380 1,000,478 -6.4% 86.0% 14.0% 1,158,799 1,239,591 -6.5% 80.8%SFO LHR 30.9% 69.1% 937,153 938,527 -0.1% 31.7% 68.3% 1,061,855 1,080,616 -1.7% 88.3%LAX TPE 0.0% 100.0% 895,315 861,788 3.9% 0.0% 100.0% 1,086,132 1,028,966 5.6% 82.4%IAD LHR 42.0% 58.0% 882,925 905,696 -2.5% 46.4% 53.6% 1,203,249 1,218,357 -1.2% 73.4%BOS LHR 12.5% 87.5% 874,740 927,206 -5.7% 29.4% 70.6% 1,092,353 1,142,345 -4.4% 80.1%MIA CCS 49.2% 50.8% 870,982 857,295 1.6% 51.6% 48.4% 1,065,961 1,061,556 0.4% 81.7%SFO HKG 28.4% 71.6% 839,746 879,013 -4.5% 25.6% 74.4% 992,707 1,057,916 -6.2% 84.6%LAX YVR 44.1% 55.9% 806,479 715,502 12.7% 42.9% 57.1% 961,905 857,844 12.1% 83.8%LAX GDL 48.3% 51.7% 800,141 667,185 19.9% 49.4% 50.6% 937,895 753,602 24.5% 85.3%JFK STI 100.0% 0.0% 787,931 766,931 2.7% 100.0% 0.0% 1,079,036 960,754 12.3% 73.0%JFK FRA 16.1% 83.9% 781,109 751,527 3.9% 16.0% 84.0% 978,791 930,962 5.1% 79.8%MIA EZE 45.6% 54.4% 765,348 735,877 4.0% 47.9% 52.1% 955,480 904,834 5.6% 80.1%LAX MEX 39.0% 61.0% 761,993 741,829 2.7% 36.4% 63.6% 885,523 896,801 -1.3% 86.1%JFK DXB 0.1% 99.9% 756,768 558,160 35.6% 0.0% 100.0% 903,960 655,505 37.9% 83.7%MIA BOG 37.4% 62.6% 726,575 703,743 3.2% 43.9% 56.1% 875,873 834,703 4.9% 83.0%JFK SDQ 99.9% 0.1% 712,264 717,577 -0.7% 100.0% 0.0% 961,861 884,380 8.8% 74.1%MIA LIM 35.7% 64.3% 711,997 643,994 10.6% 36.8% 63.2% 823,138 758,601 8.5% 86.5%SFO ICN 31.7% 68.3% 708,596 734,989 -3.6% 30.0% 70.0% 868,044 881,136 -1.5% 81.6%ATL CUN 100.0% 0.0% 704,881 646,719 9.0% 100.0% 0.0% 785,700 734,665 6.9% 89.7%JFK GRU 53.3% 46.7% 699,948 648,225 8.0% 59.5% 40.5% 883,455 790,628 11.7% 79.2%MIA PTY 33.6% 66.4% 699,404 667,186 4.8% 38.3% 61.7% 913,564 877,937 4.1% 76.6%JFK TLV 37.5% 62.5% 671,228 650,431 3.2% 36.3% 63.7% 759,521 740,545 2.6% 88.4%MIA MEX 44.4% 55.6% 670,389 708,230 -5.3% 45.1% 54.9% 927,142 984,960 -5.9% 72.3%IAH MEX 70.2% 29.8% 668,958 599,369 11.6% 73.6% 26.4% 919,576 828,405 11.0% 72.7%JFK MAD 35.8% 64.2% 662,861 637,054 4.1% 33.2% 66.8% 791,356 779,456 1.5% 83.8%DFW LHR 69.2% 30.8% 658,395 636,878 3.4% 68.0% 32.0% 769,031 735,121 4.6% 85.6%ORD NRT 43.1% 56.9% 653,978 622,096 5.1% 52.9% 47.1% 859,583 767,270 12.0% 76.1%MCO LGW 0.0% 100.0% 649,779 638,989 1.7% 0.0% 100.0% 788,418 776,655 1.5% 82.4%DFW CUN 99.2% 0.8% 637,522 557,268 14.4% 100.0% 0.0% 766,669 643,034 19.2% 83.2%ORD YYZ 85.1% 14.9% 642,708 737,644 -12.9% 69.2% 30.8% 824,137 962,296 -14.4% 78.0%ATL CDG 32.5% 67.5% 638,035 572,171 11.5% 30.6% 69.4% 710,308 646,554 9.9% 89.8%JFK NRT 37.0% 63.0% 637,309 574,425 10.9% 37.4% 62.6% 823,692 723,040 13.9% 77.4%ORD FRA 48.0% 52.0% 632,090 599,471 5.4% 52.2% 47.8% 771,668 718,431 7.4% 81.9%SFO FRA 55.2% 44.8% 629,776 627,925 0.3% 52.9% 47.1% 699,668 716,036 -2.3% 90.0%DTW AMS 100.0% 0.0% 627,344 620,951 1.0% 100.0% 0.0% 724,765 728,396 -0.5% 86.6%JFK AMS 29.8% 70.2% 626,731 589,631 6.3% 31.2% 68.8% 710,292 675,006 5.2% 88.2%JFK DUB 39.2% 60.8% 614,820 509,527 20.7% 24.4% 75.6% 707,429 584,667 21.0% 86.9%SFO TPE 7.3% 92.7% 610,787 514,871 18.6% 0.0% 100.0% 708,117 608,259 16.4% 86.3%
Source : U.S. Department of Transportation T-100 Segment Data Page 1 of 11/ Passenger and seat data is for traffic traveling in both directions. For example, JFK-LHR figures encompass traffic flowing from New York-JFK to London-Heathrow as well as traffic flowing from London-Heathrow to New York-JFK.2/ Ranked in descending order according to latest year ended data.


![68 U.S. International Transactions October 2012 October/1012... · 3 8 15 68 U.S. International Transactions October 2012 . Table 1. U.S. International Transactions [Millions of dollars]](https://img.pdfslide.us/doc/110x75/5fb4721f0ac96a68f22c9161/68-us-international-transactions-october-2012-october1012-3-8-15-68-us.jpg)