Embed Size (px)
Citation preview

Community Improvement
Districts
Report No. 2018-056 August 2018
Office of Missouri State Auditor
Nicole Galloway, CPA
auditor.mo.gov
August 2018 Nicole Galloway, CPA
Missouri State Auditor CITIZENS SUMMARY
Findings in the review of Community Improvement Districts
Significant changes to the state's Community Improvement District (CID) laws are necessary to protect taxpayers. State law allows a CID to be formed and taxes and assessments to be imposed without adequate public scrutiny or sufficient public protections. State law also allows sales taxes to be imposed without voter approval and for significant conflicts of interest to potentially occur. CID imposed sales taxes do not have to be disclosed to the public and CID reporting compliance requirements are incomplete and lack enforcement power. State law allows CIDs to overtax the public and remit the excess taxation to conflicted parties. Annual reports of statewide CID sales tax collections and distributions published by the Department of Revenue (DOR) do not include taxes distributed to all districts. The sales tax administration system in place at the DOR does not adequately track sales tax district boundaries, and the DOR does not have adequate procedures in place to ensure district sales taxes are correctly administered, charged, collected, and disbursed. CIDs have routinely not complied with state laws regarding budget preparation, annual financial and performance reporting, Sunshine Law compliance, and holding an annual meeting. We determined 11 of the 15 (73 percent) CIDs reviewed did not properly adopt budgets or did not properly provide prepared budgets to the municipalities. Prepared budgets were also often incomplete and sometimes not approved timely. CIDs consistently failed to provide required annual financial reports to the State Auditor's Office and annual performance reports to the Department of Economic Development. We determined 3 of the 15 (20 percent) CIDs reviewed did not comply with the Sunshine Law by failing to prepare board meeting minutes with all required information. We identified 4 of the 15 CIDs did not hold an annual meeting during 2017 as required.
Significant Weaknesses Exist in the State's CID Laws
Weaknesses Exist in Sales Tax Administration
Noncompliance with Statutory Requirements
Due to the nature of this report no rating is provided.
1
2 Background .................................................................................................... 4 Scope and Methodology ................................................................................. 8 1. Significant Weaknesses Exist in the State's CID Laws ........................ 10 2. Weaknesses Exist in Sales Tax Administration ................................... 21 3. Noncompliance with Statutory Requirements ...................................... 25 CID Districts, Approving Municipality Life of District, Revenues and
Estimated Project Costs for the Year Ended December 31, 2017, by County ....................................................................................................... 29
State Auditor's Report
Introduction
Community Improvement Districts Table of Contents
Management Advisory Report - State Auditor's Findings
Appendix
NICOLE GALLOWAY, CPA Missouri State Auditor
2
Honorable Michael L. Parson, Governor and Members of the General Assembly, and Joel W. Walters, Director Department of Revenue Jefferson City, Missouri We have audited certain aspects of the state's Community Improvement District (CID) laws and certain information related to a selection of CIDs, in fulfillment of our duties under Chapter 29, RSMo. Due to the increasing number of CIDs in the state, and the significant amount of public money collected and spent by such districts, state laws establishing CIDs are a significant issue to taxpayers. The scope of the audit included, but was not limited to, the year ended December 31, 2017. The objectives of our audit were to:
1. Evaluate internal controls over significant management and financial functions related to CIDs.
2. Evaluate compliance with certain legal provisions related to CIDs. 3. Evaluate the economy and efficiency of certain management practices and procedures,
including certain financial transactions related to CIDs. 4. Evaluate potential changes needed in state laws governing CIDs.
Except as discussed in the following paragraph, we conducted our audit in accordance with the standards applicable to performance audits contained in Government Auditing Standards, issued by the Comptroller General of the United States. Those standards require that we plan and perform our audit to obtain sufficient, appropriate evidence to provide a reasonable basis for our findings and conclusions based on our audit objectives. We believe that the evidence obtained provides such a basis. Government Auditing Standards require us to obtain and report the views of responsible officials of the audited entity concerning the findings, conclusions, and recommendations included in the audit report. Since there is no central agency charged with oversight of CIDs, we could not obtain views of responsible officials for the findings, conclusions, and recommendations outlined in findings 1 and 3 of the Management Advisory Report. We obtained the views of responsible CID officials and municipality officials and included them in the report where appropriate.
3
For the areas audited, we identified (1) deficiencies in internal controls over management and financial functions related to CIDs, (2) significant non-compliance with legal provisions related to CIDs, (3) significant weaknesses in CID management practices, and (4) significant weaknesses in the state laws for CIDs. The accompanying Management Advisory Report presents our findings arising from our statewide audit of CIDs. Nicole R. Galloway, CPA State Auditor The following auditors participated in the preparation of this report: Director of Audits: Robert E. Showers, CPA, CGAP Audit Manager: Wayne T. Kauffman, MBA, CPA, CGAP In-Charge Auditor: Matthew Schulenberg, CFE Audit Staff: Michaela N. Horstman
Hunter O'Donnell, M.Acct. Michelle Pummill Mackenzie J. Wooster
4
Community Improvement Districts Introduction
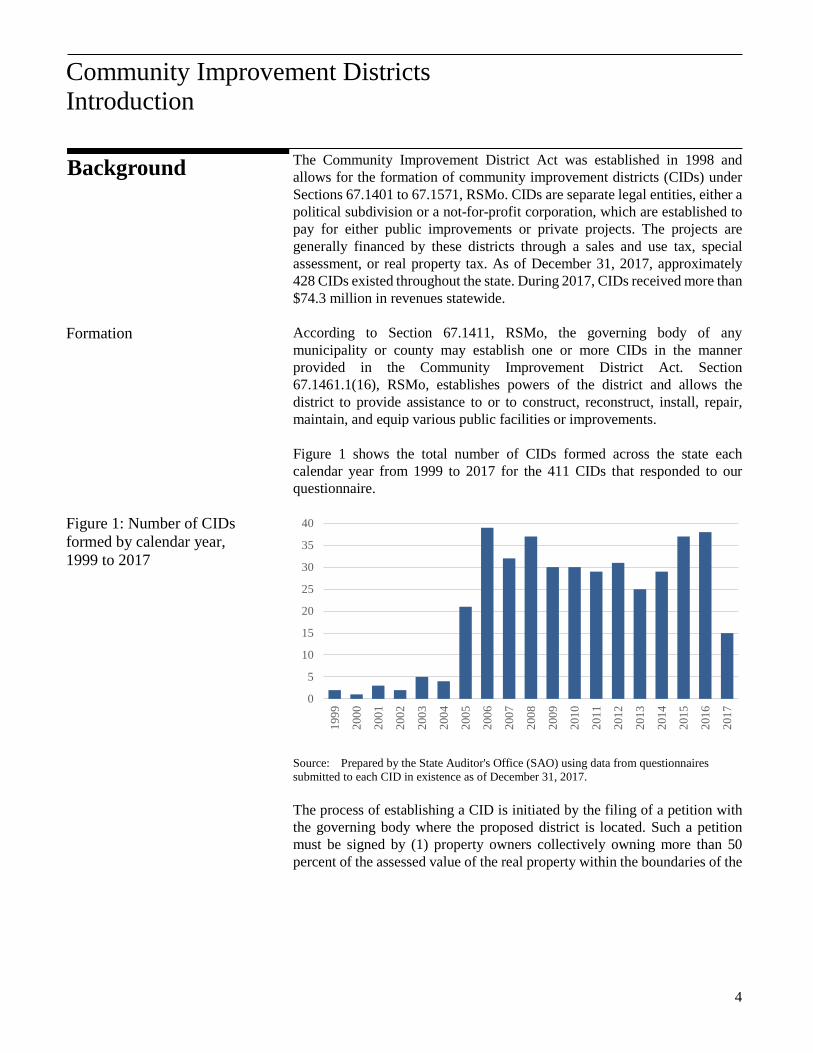
The Community Improvement District Act was established in 1998 and allows for the formation of community improvement districts (CIDs) under Sections 67.1401 to 67.1571, RSMo. CIDs are separate legal entities, either a political subdivision or a not-for-profit corporation, which are established to pay for either public improvements or private projects. The projects are generally financed by these districts through a sales and use tax, special assessment, or real property tax. As of December 31, 2017, approximately 428 CIDs existed throughout the state. During 2017, CIDs received more than $74.3 million in revenues statewide. According to Section 67.1411, RSMo, the governing body of any municipality or county may establish one or more CIDs in the manner provided in the Community Improvement District Act. Section 67.1461.1(16), RSMo, establishes powers of the district and allows the district to provide assistance to or to construct, reconstruct, install, repair, maintain, and equip various public facilities or improvements. Figure 1 shows the total number of CIDs formed across the state each calendar year from 1999 to 2017 for the 411 CIDs that responded to our questionnaire. Source: Prepared by the State Auditor's Office (SAO) using data from questionnaires submitted to each CID in existence as of December 31, 2017. The process of establishing a CID is initiated by the filing of a petition with the governing body where the proposed district is located. Such a petition must be signed by (1) property owners collectively owning more than 50 percent of the assessed value of the real property within the boundaries of the
Background
Community Improvement Districts Introduction
Formation
Figure 1: Number of CIDs formed by calendar year, 1999 to 2017
0
5
10
15
20
25
30
35
40
1999
2000
2001
2002
2003
2004
2005
2006
2007
2008
2009
2010
2011
2012
2013
2014
2015
2016
2017

5
Community Improvement Districts Introduction
proposed district and (2) more than 50 percent per capita1 of all real property owners within the boundaries of the proposed district. A petition to form must also include (1) a legal description of the proposed district, including a map illustrating the district boundaries; (2) the name of the proposed district; (3) a notice that the signatures of the signers may not be withdrawn later than 7 days after the petition is filed with the municipal clerk; (4) a 5-year plan stating a description of the purposes of the proposed district, the services it will provide, the improvement it will make and an estimate of costs of these services and improvements to be incurred; (5) a statement as to whether the district will be a political subdivision or a not-for-profit corporation, including the name of the not-for-profit corporation; (6) if the district is to be a political subdivision, a statement as to whether the district will be governed by a board elected by the district or whether the board will be appointed by the municipality; (7) if the district is to be a political subdivision, the number of directors to serve on the board; (8) the total assessed value of all real property within the proposed district; (9) a statement as to whether the petitioners are seeking a determination that the proposed district, or any legally described portion thereof, is a blighted area;2 (10) the proposed length of time for the existence of the district; (11) the maximum rates of real property taxes, and, business license taxes in the county seat of a county of the first classification without a charter form of government containing a population of at least 200,000, that may be submitted to the qualified voters3 for approval; (12) the maximum rates of special assessments, and respective methods of assessment that may be proposed by petition; (13) the limitations, if any, on borrowing capacity of the district; (14) the limitations, if any, on the revenue generation of the district; (15) other limitations, if any, on the powers of the district; (16) a request that the district be established; and (17) any other items the petitioners deem appropriate. Section 67.1421, RSMo, requires the municipal clerk to determine if the petition substantially complies with the requirements and for the governing body of the municipality in which the proposed district is located to hold a public hearing before the governing body can adopt an ordinance approving the petition and establishing a district as set forth in the petition.
1 As defined by Section 67.1401, RSMo, per capita is one head count applied to each individual, entity or group of individuals or entities having fee ownership of real property within the district. 2 As defined by Section 67.1401, RSMo, a blighted area is an area which (1) by reason of the insanitary or unsafe conditions, deterioration of site improvements, or the existence of conditions which endanger life or property by fire and other causes retards the provision of housing accommodations or constitutes an economic or social liability or a menace to the public health, safety, morals or welfare in its present condition and use; or (2) has been declared blighted or found to be a blighted area pursuant to Missouri law. 3 As defined by Section 67.1401, RSMo, a qualified voter is registered voters or the owners of one or more parcels of real property located within the district.

6
Community Improvement Districts Introduction
CIDs are governed by a board of directors. If a district is a political subdivision, the district shall be governed by a board consisting of at least 5 but not more than 30 directors. Directors must be (1) at least 18 years old, (2) be either (a) an owner of real property or of a business operating within the district or (b) a registered voter4 residing within the district, and (3) any other qualifications set forth in the petition establishing the district. If there are fewer than 5 owners of real property located within a district, the board may be comprised of up to 5 legally authorized representatives of any of the owners of real property located within the district. The board can either be elected or appointed, as provided in the petition. After the district's formation has been approved, the board has the authority to carry out the purposes and provisions of the Community Improvement District Act. If the district is a not-for-profit corporation, the election and qualification of members to the board of directors must be in accordance with Missouri's Nonprofit Corporation Act (Chapter 355, RSMo). CIDs have the powers to provide assistance to or to construct, reconstruct, install, repair, maintain, and equip any of the following public improvements:5 • Pedestrian or shopping malls and plazas. • Parks, lawns, trees, and any other landscaping. • Convention centers, arenas, aquariums, aviaries, and meeting facilities. • Parking lots, garages, or other facilities. • Paintings, murals, display cases, sculptures, and fountains. • Any other useful, necessary, or desired improvement.
CIDs also have the power to demolish and remove, renovate, reconstruct, or rehabilitate any building or structure owned by a private property owner if the area is declared to be blighted.6
4 As defined by Section 67.1401, RSMo, a registered voter is a person(s) who resides within the district and whom are qualified and registered to vote pursuant to chapter 115. 5 Section 67.1461.1(16), RSMo. 6 Section 67.1461.2(1), RSMo.
Governance
Allowable projects
7
Community Improvement Districts Introduction
State law allows CIDs 4 different methods to generate revenue: 1. Sales and Use Tax - Any district formed as a political subdivision may
impose by resolution a district sales and use tax of up to one percent on retail transactions, subject to exceptions cited in state law.
2. Real Property or Business License Tax - The district may levy by
resolution a tax upon real property or on any business located within the boundaries of the district, provided no such resolution shall be final nor shall it take effect until the qualified voters approve the tax that the resolution seeks to impose. The district may levy a real property tax rate lower than the tax rate ceiling approved by qualified voters and may increase that lowered tax rate to a level not exceeding the tax rate ceiling without approval of the qualified voters.
3. Special Assessments - A district may levy by resolution one or more
special assessments against real property within its boundaries, upon receipt of an in accordance with a petition signed by (1) owners of real property collectively owning more than 50 percent by assessed value of real property within the boundaries of the district, and (2) more than 50 percent per capita of the owners of all real property within the boundaries of the district.
4. To fix, charge, and collect fees, rents, and other charges for use of any of
the following:
• The district's real property, except for public rights-of-way for utilities.
• The district's personal property, except in a city not within a county.
• Any of the district's interest in such real or personal property, except
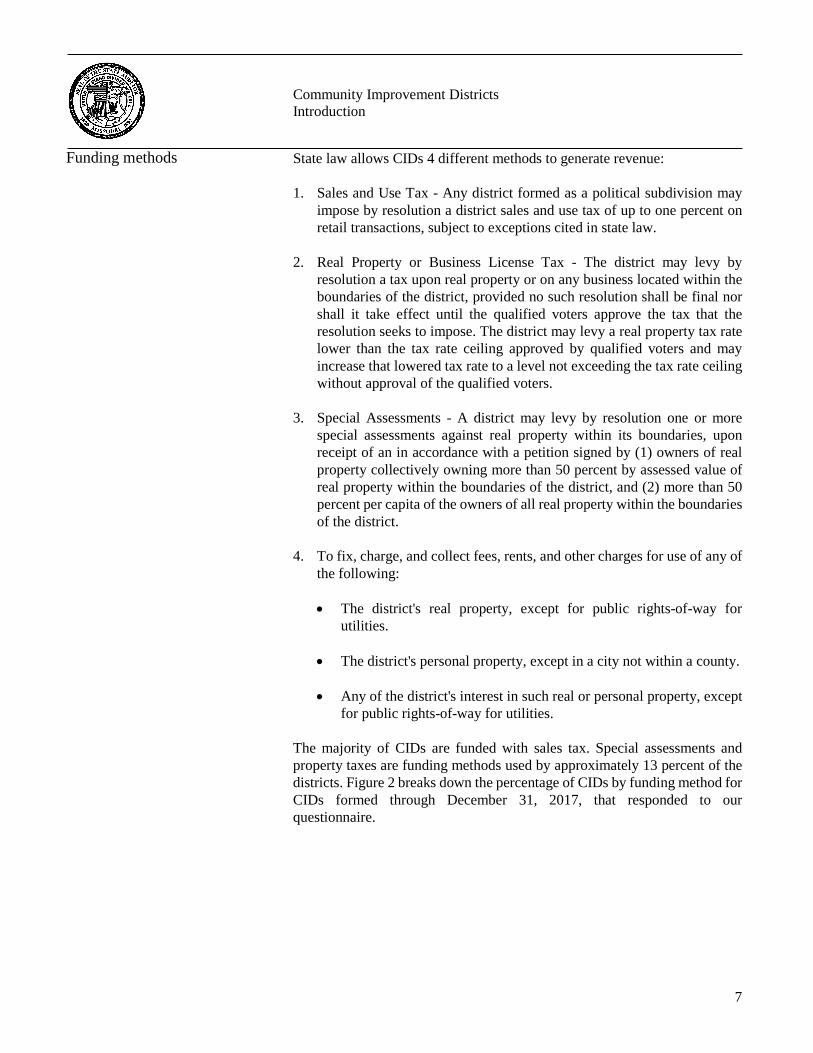
for public rights-of-way for utilities. The majority of CIDs are funded with sales tax. Special assessments and property taxes are funding methods used by approximately 13 percent of the districts. Figure 2 breaks down the percentage of CIDs by funding method for CIDs formed through December 31, 2017, that responded to our questionnaire.
Funding methods
8
Community Improvement Districts Introduction
Source: Prepared by the SAO using data from questionnaires submitted to each CID in existence as of December 31, 2017. Information was not available for 17 districts. Under state law, upon receipt of a proper petition and after notice of a public hearing, any district may be terminated by ordinance adopted by the governing body of the municipality prior to the expiration of its term if the district has no outstanding obligations. Upon expiration or termination of a district, the assets of such district shall be distributed in accordance with the plan for dissolution as approved by ordinance. The municipality is to make every effort for the assets of the district to be distributed in such a manner so as to benefit the real property that was formerly a part of the district. The scope of our audit included, but was not limited to, the year ended December 31, 2017. Our methodology included gathering information regarding the CIDs established through discussions with various officials from the Department of Economic Development (DED) and the Department of Revenue (DOR) and reviewing information maintained by those agencies. We sent questionnaires to districts using contact information provided by or obtained from the DED, DOR, SAO, and municipalities. We requested the geographic location of the district, the district's fiscal year, estimated total project costs, estimated revenues when the district was formed, the life of the district, the proposed funding method, when collection of revenues started, district's liabilities/unpaid project costs, businesses/properties within the district, board members, and other information. To gain an understanding of the legal requirements governing CIDs, we reviewed applicable state laws and interviewed individuals from the DED and DOR.
Figure 2: Percentage of CIDs, by funding method
Abolishment
Scope and Methodology
Sales Tax87%
Special Assessment
10%
Property Tax3%

9
Community Improvement Districts Introduction
We also selected 15 CIDs across the state to review in more detail. The districts selected and their approving municipalities are:
District Name
Approving Municipality
76 Entertainment CID Branson BaratHaven CID Dardenne Prairie Independence Events Center CID Independence Capital Mall CID Jefferson City Hope Valley CID Joplin 12th & Wyandotte CID Kansas City Ward Parkway Shopping Center CID Kansas City Park Ridge CID Lee's Summit Miner Gateway CID Miner North Oaks Plaza Shopping Center CID Northwoods 2317 Belt CID St. Joseph East Hills CID St. Joseph Downtown St. Louis CID St. Louis Liberty Commons CID St. Robert Black Mountain CID Van Buren
During 2017, the SAO performed individual audits of the BaratHaven CID,7 the Independence Events Center CID,8 the Ward Parkway Shopping Center CID,9 and the North Oaks Plaza Shopping Center CID.10 These districts were also included in our review of additional detail during this audit. During our review of these districts, our methodology included reviewing minutes of meetings, financial records, and other pertinent documents; interviewing various personnel of the district, as well as certain external parties; testing selected transactions, and performing on-site inspections and observations. These districts were not selected due to any known issues or concerns, and are considered representative of the entire population of CIDs throughout the state.
7 SAO, BaratHaven Community Improvement District, report number 2017-121, issued October 2017. 8 SAO, Independence Events Center Community Improvement District, report number 2017-136, issued November 2017. 9 SAO, Ward Parkway Center Community Improvement District, report number 2017-147, issued December 2017. 10 SAO, North Oaks Plaza Shopping Center Community Improvement District, report number 2017-102, issued September 2017.
10
Community Improvement Districts Management Advisory Report - State Auditor's Findings
Significant changes to the state's Community Improvement District (CID) laws are necessary to protect taxpayers. State law allows for the formation of a CID and the imposition of taxes without adequate public scrutiny, sufficient public protections, or voter approval. Without adequate public scrutiny, district petitions are approved without a well-defined purpose for extended, and even perpetual, timeframes. State law also allows for significant conflicts of interest within the governance structure of the districts, giving significant oversight responsibilities to developers and property owners. As a result, there is an increased risk of districts not acting in the public's best interest. State law also does not ensure adequate transparency or sufficient reporting requirements, allows excess taxation without oversight, and does not contain adequate abolishment provisions. State law allows a CID to be formed and taxes and assessments to be imposed without adequate public scrutiny or sufficient public protections. As of December 31, 2017, the state had approximately11 428 CIDs that collected $74.3 million in taxes and assessments from the public during calendar year 2017. Estimated project costs12 at the time of formation provided by 39613 CIDs totaled more than $2.2 billion. A petition must be filed with the municipal clerk in order for a district to be established. State law14 requires the petition to contain certain elements, including, but not limited to: • The legal description of the district, including a map illustrating the
district boundaries. • A 5 year plan stating the purposes of the district, the services to be
provided, any improvements to be made, and an estimate of the costs to be incurred.
• The method for selecting the board.
11 We do not know the exact number of CIDs in existence because there is no requirement in state law for the State Auditor's Office (SAO) to be notified upon the creation of a district. See section 1.4. 12 Based on survey questionnaires completed by CIDs. Some districts provided the total estimated project costs while other districts provided the estimated costs for the first 5 years of the district. Therefore, the total estimated project cost is likely significantly higher than reported. 13 Not all CIDs returned their questionnaire to the SAO. Additionally, several that returned the questionnaire did not know the estimated project cost when the district was formed. Therefore, we do not know the estimated project costs for all 428 CIDs. 14 Section 67.1421.2(3), RSMo.
1. Significant Weaknesses Exist in the State's CID Laws
Community Improvement Districts Management Advisory Report State Auditor's Findings
1.1 Districts formed and taxes imposed without public scrutiny or public protections
11
Community Improvement Districts Management Advisory Report - State Auditor's Findings
• A statement as to whether the petitioners are seeking a blighted designation for the district.
• The proposed length of time for the existence of the district. The municipality is required to hold a public hearing and then may adopt an ordinance to establish the district.15 While state law requires the approval of the municipality, there are no provisions requiring the municipality to perform an evaluation to ensure a district is in the best interest of the public before adopting the ordinance establishing it. As a result, municipalities do not always provide adequate scrutiny to ensure a district benefits the public. According to representatives from the City of Kansas City and the City of St. Louis, their municipalities perform a review to ensure the petition contains all the elements required by state law. The representatives also indicated the petition for the district to form would be approved unless they identified statutory compliance issues. As of December 31, 2017, the City of Kansas City and the City of St. Louis were the approving municipalities for approximately 55 and 60 CIDs, respectively. Additionally, representatives from 616 of the 12 (50 percent) municipalities17 we interviewed indicated they only ensured the petition was compliant with state law. Based on this information, the majority of districts created are not scrutinized by public officials to evaluate the merits of the district and to ensure the district benefits the public even though state law allows them to do so. Amending state law to require municipalities evaluate the proposed district to ensure it appropriately benefits the public will provide more assurance districts created are in the best interests of the public. In the absence of a law change, municipalities must provide more critical review of district petition documents to ensure the interests of the public are considered. State law does not require district petition documents contain a well-defined purpose. While state law requires the petition to state the general purpose of the district, the estimated costs to be incurred, and the proposed length of time the district will be in existence, district petition documents do not always specifically define these parameters. As a result, districts are allowed to form with vague purposes.
15 Section 67.1421.4, RSMo. 16 City of Branson, City of Independence, City of Jefferson City, City of Kansas City, City of St. Louis, and the City of Van Buren. 17 We attempted to interview the 13 municipalities that approved the formation of the 15 CIDs selected for further review as documented in the Scope and Methodology section above; however, the City of Northwoods failed to respond to our inquiries.
Municipalities do not perform adequate scrutiny
State law does not require district purpose to be well defined
12
Community Improvement Districts Management Advisory Report - State Auditor's Findings
We looked at the petition documents for the 15 CIDs reviewed and determined 1018 of them (67 percent) did not have a well-defined purpose. For example, the petition documents stated the tax revenues could be used for "payment or reimbursement of any other costs or expenses permitted by the CID Act" or some other non-specific purpose. Requiring the CID petition to better define the purpose of the district would provide better information to the municipality evaluating the merits of the district to ensure the district is in the best interest of the public. State law does not limit the allowable life of a CID and does not require the expected timeframe stated in the petition to be a defined period. As a result, districts typically have excessive lifespans, and in many cases have perpetual lifespans. Our survey determined the average lifespan for districts with a defined life is 31 years. In addition, the survey determined the state has 75 districts with no defined lifespan. Requiring the CID petition to have a reasonable and defined lifespan would help the municipality reevaluate whether the district is in the best interests of the public on a periodic basis. Having a defined lifespan would also allow the municipality additional oversight opportunity and would help ensure the district was fulfilling its stated purpose. Without a defined and reasonable lifespan, excessive and unnecessary taxation can occur and CID funds would be at an increased risk of misappropriation. A review of established CIDs identified districts created with the sole purpose of paying down tax increment financing (TIF) liabilities, thereby ensuring the developer is repaid for TIF reimbursable costs sooner than otherwise would occur. We determined 219 of the 15 (13 percent) CIDs reviewed are associated with a TIF. These arrangements can involve most CID revenues going toward the TIF, instead of only 50 percent like other economic activity taxes. State law already includes funding mechanisms for developers to be reimbursed for TIF projects but developers/property owner(s) are establishing CIDs to provide additional funding for TIF projects. It is not clear if state law intended the formation of CIDs for this purpose. No estimate of the economic impact of a potential district is required prior to formation. An economic analysis of a potential district would include an analysis of the projected revenues the district would generate over time. This
18 12th & Wyandotte CID, 2317 Belt CID, Black Mountain CID, Capital Mall CID, East Hills CID, Hope Valley CID, Miner Gateway CID, North Oaks Plaza Shopping Center CID, Park Ridge CID, and Ward Parkway Shopping Center CID. 19 Liberty Commons CID and East Hills CID.
Allowable life of districts not limited, resulting in excessive lifespans as well as perpetual districts
Districts can be established to pay TIF liabilities
No assessment of economic impact required
13
Community Improvement Districts Management Advisory Report - State Auditor's Findings
information would allow the municipality evaluating the petition to determine the economic activity anticipated if the CID is established. Such information is commonly required for economic development programs. For example, prior to a TIF district being approved, a developer is statutorily required to provide information pertaining to the development's potential economic impact to the community.20 Similarly, at the state level, the Department of Economic Development (DED) requires the assessment of the estimated cost/benefit of proposed projects for some tax credit programs.21 Requiring a developer/property owner to demonstrate the estimated economic impact a potential project will generate provides assurance the investment of public monies is in the public's best interest. There is no requirement that the developer/property owner(s) provide a 'but for' determination to establish a CID when the project involves a private asset. This determination is typically required to provide assurance that the project involving a private asset would not be possible 'but for' the public incentive being requested. Such a determination is required by statute to establish a TIF district,22 and is required by the DED when evaluating projects applying for state Business Use Incentives for Large Scale Development Program incentives.23 Requiring a 'but for' determination provides the public some assurance the awarding of public incentives to a project for a private asset is necessary for the development to proceed, and helps ensure the public incentives granted are in the public's best interest. State law requires municipalities to approve the petition to form a CID. However, state law does not require CID petition documents to include a well-defined purpose, does not require the lifespan of a district to be limited or specifically defined, and does not require any estimate of how much revenue will be collected or an evaluation of the merits of the district. As a result, districts are collecting an unspecified amount of taxes or assessments for undefined purposes for an unknown period of time. State law allows municipalities the flexibility to modify the structure of CIDs, including ensuring the projects are well defined, and the lifespan of the district is limited before forming the district. Municipalities can review the project to ensure the same project is not already receiving public assistance. The municipalities
20 Section 99.810.1(5), RSMo. 21 Business Use Incentives for Large Scale Development Program, Brownfield Redevelopment Program, and the Missouri Works Tax Credit Program at Sections 100.810, 447.708.1(6), and 620.2010.2(2), RSMo; respectively. 22 Section 99.810.1(1), RSMo. 23 Section 100.760(4), RSMo.
No 'but for' determination required
Conclusion
14
Community Improvement Districts Management Advisory Report - State Auditor's Findings
can also perform an assessment to ensure the district benefits the public before forming the district. However, our survey results indicate municipal officials are generally not utilizing their oversight capabilities when reviewing district petitions. Once a district is formed, the municipality has limited or no recourse if the district is not structured with adequate public protections, and districts can exist and tax the public for an infinite number of years. Clarifying state law to require petition documents to include more specific language of the district's purpose and lifespan would be in the best interest of taxpayers. State law allows sales taxes to be imposed without voter approval. During the year ending December 31, 2017, 314 CIDs received sales tax revenue totaling approximately $57 million. A significant portion of CID sales taxes are not approved by a vote of the public. State law requires a CID sales tax to be approved by the qualified voters of the district after approved by the district board.24 However, the majority of the districts do not contain registered voters, which allows the developer/property owner to essentially impose the tax. State law allows district boundaries to be customized so as to intentionally not include registered public voters, creating "micro" taxing districts in many cases. Only 14 percent of the districts imposing a sales tax that responded to our survey had registered voters, which would require a public vote to impose a tax. The developer/property owner(s) maintain a controlling interest in the board of directors for a majority of the districts. For those districts that imposed a sales tax and responded to our inquiry, the developer/property owner has a controlling interest on the board for 234 of the 287 (82 percent) districts statewide, and for 1125 of the 12 (92 percent) districts26 we reviewed. As a result, the overwhelming majority of CID sales taxes are not approved by the general public, but rather by the developer/property owner(s). Allowing developers/property owners and local governments to form special "micro" taxing districts and impose taxes without a public vote is inconsistent with how other sales taxes are imposed. Municipalities and other taxing districts are typically required by state law to put any proposed sales taxes to a public vote. A simple majority vote in favor of the tax is necessary to put it into effect.
24 Section 67.1545.1, RSMo. 25 12th & Wyandotte CID, 2317 Belt CID, 76 Entertainment CID, Black Mountain CID, Capital Mall CID, East Hills CID, Hope Valley CID, Liberty Commons CID, Miner Gateway CID, North Oaks Shopping Center CID, and Ward Parkway Shopping Center CID. 26 Sales taxes are not imposed for 3 of the 15 districts we reviewed.
1.2 Public vote not required to impose CID sales tax

15
Community Improvement Districts Management Advisory Report - State Auditor's Findings
State law allows for significant conflicts of interest to occur at CIDs. Approximately 83 percent of district boards are controlled by the developer/property owner(s). These developer controlled boards are responsible for procuring any construction work necessary, services to be performed, and oversight of other CID-related expenses. As a result, there is a significant risk of improper and related party transactions. State law does not require anyone independent of the developer/property owner(s) to be on the board of directors if no registered voters reside within the district. While state law allows the municipality to dictate the make-up of the board before the municipality forms the district, the majority of municipalities do not require independent representation prior to approving the petition. As a result, many of the district boards do not include anyone independent of the developer/property owner. Based on our survey, the developer/property owner has a controlling interest in approximately 83 percent of district boards and 62 percent of district boards do not include anyone independent of the developer/property owner. As a result, developers/property owners find themselves with conflicting interests when representing the CID board. For example, a cooperative agreement we reviewed between the developer, the city and the district27 was signed by the same individual as both the Chairman of the CID Board and the developer. Requiring someone independent of the developer/property owner(s) to be on the board of directors would provide additional assurance the district is being subjected to appropriate oversight and is acting in the best interest of the public. State law does not require CID boards to competitively procure construction contracts or the majority of the services paid for with public monies.28 Since there are no requirements to ensure the independence of the CID board, there is a higher risk of developer/property owner(s) awarding construction or service contracts to themselves or other related party contractors without allowing other non-related entities to submit proposals for the contracts. We identified numerous instances of contracts being awarded or payments being made to related parties: • The Downtown St. Louis CID did not competitively procure management
services. Instead, the district paid a not-for-profit organization with representatives on the CID Board more than $1.6 million for management services from July 2016 to June 2017. A conflict of interest exists
27 Park Ridge CID. 28 Sections 8.285 through 8.291 and 8.675 to 8.687, RSMo, require political subdivisions to competitively procure architectural and engineering services and construction management services; respectively.
1.3 State law allows for significant conflicts of interest
Boards are not required to include anyone independent
Competitive procurement for most services is not required
16
Community Improvement Districts Management Advisory Report - State Auditor's Findings
between the district and the not-for-profit organization since (1) the two organizations share the same President and CEO, (2) the Chair and Vice Chair of the not-for profit organization are ex officio members of the CID Board, and (3) the Chair and Vice Chair of the CID Board are ex officio members of the not-for-profit organization's Board of Trustees. The petition filed creating the district requires the CID to contract with the not-for-profit organization for management and to staff day-to-day operations. The CID then entered into a management agreement with the not-for-profit organization allowing the organization to determine the amount of reimbursement as long as it is within the budget of the CID and records are available for the CID Board to review.
• The Independence Events Center CID29 did not competitively procure
administrative services and instead contracted with the City of Independence, which had a controlling interest in the Board, to administer the district. The district paid more than $110,000 annually since 2013 for services that other districts procure for less than $15,000 annually.
• Ward Parkway Shopping Center CID did not competitively procure
construction management services worth $1.2 million. Instead, members of the Board of Directors approved payments for these services to their employer.
• The North Oaks Plaza Shopping Center CID did not competitively
procure parking lot repair services worth approximately $85,000. The district made payments for these services to a company owned by a Board member.
• The Park Ridge CID did not competitively procure lawn and landscaping
services and paid more than $75,000 for these services in 2017. The district made payments for these services to a company owned by the Chairman of the Board.
• The Black Mountain CID Board leased land from members of the Board
for 3 years at a total cost of $31,600 for signage for a business within the boundaries of the district. The sign being leased was constructed in 2000 with no lease payments being made to the property owners/Board members until the CID payments were made from 2015 through 2018. Board members could not explain how they determined the lease rate.
Based on survey responses submitted by 396 CIDs, districts across the state are anticipating spending more than $2.2 billion in project costs. Requiring
29 The Independence Events Center CID is the largest CID in the state in terms of sales tax collection.
17
Community Improvement Districts Management Advisory Report - State Auditor's Findings
competitive procurement of construction and other services would provide assurance the lowest and best bidder was selected and would be in the public's best interest. Transportation Development Districts (TDD) are already required by state law to competitively procure construction contracts in excess of $5,000.30 State law does not impose sufficient sales tax and reporting transparency requirements on CIDs. CIDs do not have to disclose the rate of the district sales tax publically at all retail locations within the CID. In addition, CIDs are not required to notify the SAO when they are formed. State law does not impose adequate reporting requirements on CIDs and there is no penalty for not filing the required reports to the public entities. There is no requirement in state law to notify the public of the additional sales tax imposed by a CID. As a result, taxpayers may not be aware of the additional tax they are paying to fund the district. Sales taxes are the planned source of revenues for 358 of the 41131 districts (87 percent) that responded to our survey. Informing the public of the additional sales tax charged within the district would increase transparency. State law already requires the rate of a TDD sales tax to be prominently displayed at the cash register area at each retail location in the TDD.32 State law does not impose adequate notification and reporting requirements on CIDs. The law also lacks enforcement mechanisms when CIDs fail to meet statutory reporting requirements. We identified the following concerns: • CIDs are allowed to form without notifying the SAO of their formation.
The SAO has authority to audit CIDs33 and is also required to monitor CIDs to help ensure the districts comply with the financial reporting requirements imposed on all political subdivisions.34
• State law does not impose sufficient financial reporting requirements on
CIDs. State law imposes some reporting requirements, including submitting (1) a proposed annual budget to the governing board of the municipality,35 (2) an annual performance report to the municipal clerk
30 Section 238.252(2), RSMo. 31 Representatives of 411 CIDs responded to our questionnaire and provided their planned source of revenue. No additional information is known for districts that did not respond. 32 Section 238.280, RSMo. 33 Section 67.1471.5, RSMo. 34 15 CSR 40-3.030(5) and Section 105.145, RSMo. 35 Section 67.1471.2, RSMo.
1.4 Inadequate transparency to the public
Sales taxes are not disclosed to the public
Reporting requirements are insufficient and lack enforcement mechanisms

18
Community Improvement Districts Management Advisory Report - State Auditor's Findings
of the approving municipality and the DED, and (3) an annual financial report to the SAO.36 However, these reporting requirements do not include other important information, such as:
the funding method. revenues received to date. reimbursable costs by type to date. anticipated reimbursable costs by type. unpaid reimbursable costs. current estimated years until abolishment.
• State law does not have a mechanism to ensure the CIDs provide the reporting already required to the DED and the municipalities. We identified significant noncompliance with reporting requirements (see section 3.2).
Requiring CIDs to report the rate of sales tax imposed, to notify the SAO upon formation, to provide additional reporting, and adding a mechanism to state law to increase reporting compliance would increase transparency and allow the public to be better informed of these districts. Municipalities already have to report the formation of a CID to the DED37 and TIF information to the Department of Revenue (DOR).38 In addition, state law already imposes fines as a mechanism to ensure reporting. For example, state law effective August 28, 2017,39 imposes fines to political subdivision for noncompliance with financial reporting requirements and requires those fines to be paid to local school districts. State law allows CIDs to overtax the public and remit the excess taxation to conflicted parties. Additionally, state law does not require an audit by the SAO before a district can abolish. State law does not require a district to rescind its funding mechanism once the district expenses have been paid, resulting in excess taxation of the public. State law40 requires the excess taxation to go towards the real property that
36 15 CSR 40-3.030(5) and Section 105.145, RSMo. 37 Section 67.1421.6, RSMo. 38 Section 99.865, RSMo. 39 Section 105.145.9 to 105.145.11, RSMo. 40 Section 67.1481.5, RSMo.
1.5 Excess taxation without oversight
Excess taxation occurs and benefits conflicted parties

19
Community Improvement Districts Management Advisory Report - State Auditor's Findings
was formerly part of the district and may result in conflicted parties benefiting from the excess taxation. For example, the Eureka South I-44 CID Board was controlled by the municipality and abolished in November 2014. Prior to abolishment, the district overcharged the public by more than $120,000. These funds were remitted to the city and placed in the Road Fund. The city-controlled district failed to rescind the sales tax and special assessment timely and as a result, the city received the excess taxation windfall from the district. Another example involves the Kansas Battlefield CID in Springfield that satisfied its debt in March 2015. However, due to a lack of planning, the sales tax was not rescinded until January 1, 2016, which resulted in the taxpayers being over taxed by approximately $225,000. This excess taxation resulted in a windfall to the local municipality. Ensuring any excess taxes collected during the closeout of a CID do not go to the entity that provides oversight would help reduce the conflict of interest faced by those charged with oversight. In addition, as previously noted, fines imposed on political subdivisions for noncompliance with financial reporting requirements are to be paid to local school districts. Similarly requiring any over collections of sales tax revenue remaining after abolishment to be remitted to local school districts would remove the conflict of interest a board or local municipality may face. State law does not require a district to be audited by the SAO prior to abolishment. State law41 requires a district to be file a petition with the local municipality and the governing body of the municipality to adopt an ordinance in order for a district to be abolished. Requiring a CID to be audited by the SAO prior to abolishing would provide assurance the district's assets exceed its liabilities and the board has a plan in place for the dissolution of assets. State law42 already requires an audit by the SAO in order for a TDD to abolish. Annual reports of statewide CID sales tax collections and distributions published by the DOR do not include taxes distributed to all districts. The DOR redacts the amount of sales tax distributed to CIDs that include less than 6 retailers. As a result, sales tax distributions for 2017 for 109 of 314 districts (35 percent), totaling approximately $5.4 million, are redacted from publicly available DOR reports and the appendix.
41 Section 67.1481.2, RSMo. 42 Section 238.275.3, RSMo.
Lack of oversight of abolishment
1.6 Lack of reporting transparency

20
Community Improvement Districts Management Advisory Report - State Auditor's Findings
State law43 requires annual financial reports, including the amount of receipts, of every political subdivision of the state to be filed with the SAO. State law44 also requires these financial reports to be public records. DOR officials assert Section 32.057, RSMo, supersedes this language, and the amount of money collected for CIDs with fewer than 6 businesses must be protected from disclosure to the general public so as not to disclose private taxpayer information. While the recent law change to improve financial reporting compliance of political subdivisions will improve the transparency of CIDs, this change will not resolve the DOR's interpretation of the law that results in public reports of CID distributions being redacted. To comply with DOR's reporting restrictions, some sales tax distribution amounts to individual CIDs are redacted in the appendix because the sales tax information presented in the appendix was obtained from the DOR. However, the total statewide distribution amount presented in DOR reports and our appendix includes all CID sales taxes distributed by the DOR. Clarification to state law is necessary to ensure the completeness of the distribution reports published by the DOR, and to ensure the transparency of CID tax distributions statewide. The General Assembly consider amending state law to: 1.1 Require municipalities to perform an evaluation of petitioned CIDs
and document their results to ensure a district is in the best interest of the public before adopting an ordinance establishing it. In addition, state law should be amended to require the CID's purpose and lifespan be well-defined in the district petition documents. State law should also be amended to require an assessment of economic impact be prepared and presented and require the developer/property owner(s) provide a 'but for' determination to establish a CID when the project involves a private asset. Consideration should also be given to clarifying state law regarding establishing CIDs to repay TIF reimbursable costs.
1.2 Require a public vote of the citizens to impose a CID sales tax. 1.3 Require a representative of a public entity to be on the board of
directors. Also, require CIDs to competitively procure construction contracts and other major services.
1.4 Require districts to notify the public of the additional sales tax
imposed by a CID and require the approving municipality to notify
43 Section 105.145.2, RSMo. 44 Section 105.145.7, RSMo.
Recommendations

21
Community Improvement Districts Management Advisory Report - State Auditor's Findings
the SAO of a district's formation. In addition, state law should impose more detailed reporting requirements on CIDs and establish a mechanism to ensure CIDs provide required reports to the state and appropriate municipality.
1.5 Require districts to rescind their funding mechanism(s) once
obligations have been repaid and ensure excess taxation does not benefit conflicting parties. In addition, require an audit of CIDs by the SAO prior to abolishment.
1.6 Clarify if sales tax distribution amounts by the DOR should be
available to the public. Due to no state or local entity having oversight or management responsibilities over CIDs on a statewide basis, no management response can be obtained. The views of any applicable municipalities, or individual CID board members were obtained as appropriate and considered as part of our audit fieldwork. The sales tax administration system in place at the DOR does not adequately track sales tax district boundaries, and the DOR does not have adequate procedures in place to ensure district sales taxes are correctly administered, charged, collected, and disbursed. As a result, our review of the collection and remittance of district sales taxes identified errors for 10 of the 1245 (83 percent) districts reviewed for sales tax compliance. Most errors noted involved issues with the department's inability to accurately recognize CID boundaries. This condition was reported to the DOR in previous SAO audits of TDDs in 2017 and Sales and Use Tax procedures in 2015.46 During the year ended December 31, 2017, the DOR disbursed $56.9 million in sales taxes to CIDs. When a CID enacts a sales tax the DOR requires the district to submit specific documentation to the department including, but not limited to (1) the name of the district imposing the tax; (2) percentage of tax increase; (3) a list of business names, addresses, and Missouri sales tax identification numbers of businesses located in the district, and (4) a map showing street names and district boundaries. DOR personnel will verify the information provided by the district, update the department's tax system, which includes the geographic information system (GIS), and inform the district of the effective date of the tax. The DOR makes available monthly distribution detail reports to each district. These reports provide a listing of open businesses within the
45 Only 12 of 15 districts selected for additional review were funded by a sales tax. 46 Report 2017-020, Transportation Development Districts, issued in April 2017, and report 2015-080, Sales and Use Tax, issued September 2015.
Auditee's Response
2. Weaknesses Exist in Sales Tax Administration
22
Community Improvement Districts Management Advisory Report - State Auditor's Findings
district and a detailed breakdown of the CID sales tax remitted to the district by retailer. In 3 of the 12 (25 percent) districts reviewed,47 we identified a total of 4 businesses inside district boundaries charging the CID sales tax but not remitting those taxes collected to the DOR. For example, CID taxes were collected by a business within the designated district boundaries of the Capital Mall CID. While the business charged the additional district sales tax, the business did not remit the tax to DOR.48 Neither DOR personnel nor the sales tax system identified this business as being within the boundaries of the district, and therefore had not identified this business as being noncompliant. We confirmed with DOR personnel that this business is within the district boundaries, but they indicated the district did not provide notification this business was within the district boundaries. The CID did not elect to receive the monthly distribution reports from the DOR that would have allowed district officials to identify they were not receiving sales taxes from the business. In 9 of the 12 (75 percent) districts reviewed,49 we identified a total of 16 businesses within the district boundaries not charging the CID sales tax and thus did not remit such collections to the DOR. For example, CID taxes were not being charged by a business within the designated district boundaries of the Hope Valley CID. DOR personnel indicated the business was not in their system as being inside the district boundaries because the business owners indicated on their initial sales tax application that it was not in the district. After SAO inquiries with district officials, they notified the DOR that the business should be collecting the tax. Since the DOR failed to recognize this business as being within the district boundaries, the business did not charge the additional district sales tax and did not remit the district sales tax to the DOR. Neither DOR personnel nor the sales tax system identified that this business was within the boundaries of the district and should be charging the additional district sales tax and remitting this district sales tax to the DOR. Even though DOR personnel utilize a GIS to determine the political subdivisions a business is in, they rely upon the business and/or district to inform them of businesses within the district boundaries. CID officials were aware this
47 Capital Mall CID, East Hills CID, and Independence Events Center CID. 48 Follow up action to determine the status of any sales taxes collected but not remitted is beyond the scope of our audit. This matter was referred to the DOR for follow up. 49 76 Entertainment CID, Black Mountain CID, Capital Mall CID, East Hills CID, Hope Valley CID, Independence Events Center CID, Liberty Commons CID, North Oaks Plaza Shopping Center CID, and Ward Parkway Shopping Center CID.
Businesses inside the districts are not remitting CID sales taxes to the DOR
Businesses inside the districts are not charging the CID sales tax

23
Community Improvement Districts Management Advisory Report - State Auditor's Findings
business was within the boundaries of the district and should have been charging the additional district sales tax; however, they failed to identify the business was not included on the monthly DOR reports that detail the breakdown of sales taxes remitted each retailer. In 2 of the 12 (17 percent) districts reviewed,50 we identified a total of 2 businesses not within the district boundaries charging the CID sales tax. For example, CID taxes were collected by a business that was approximately 1 mile outside the designated district boundaries of the Miner Gateway CID. DOR personnel indicated when this business opened, the business provided the department with an address and informed them the business was within the boundaries of the district. The DOR coded the business as being within the boundaries of the district without confirming the location of the business and the district's boundaries. The business was actually outside the district boundaries and had no legal authority to collect the district sales tax based on our review of the district. The business remitted the additional district sales tax collected to the DOR and the DOR remitted the taxes to the district. Neither DOR personnel nor the department's sales tax system identified this business was not within the boundaries of the district and had no legal authority to charge the additional district sales tax. The CID was not aware this business was charging the additional district sales tax because the district chose not to receive the monthly DOR distribution reports. In addition, a business located approximately 4 miles outside the boundaries of the Independence Events Center CID charged the CID sales tax. DOR personnel indicated they registered this business as a business within the boundaries of the district based on a sales tax return filed by the business. The business had no legal authority to collect the district sales tax based on our review of the district. Neither DOR personnel nor the department's sales tax system identified this business was not within the boundaries of the district and had no legal authority to impose the additional district sales tax. The DOR imposes requirements on taxing districts, including CIDs, which are beyond what the DOR requires of cities and counties. Special taxing districts in the state are required to notify the DOR when new businesses are added, which is not required of large political subdivisions like cities and counties. DOR officials indicate the department's system is capable of identifying the applicable tax rates that should be charged by a new business in a city or county, but for smaller taxing districts, such as CIDs, the entity is responsible for monitoring for new businesses and notifying the DOR.
50 Independence Events Center CID and Miner Gateway CID.
Businesses outside the districts are charging district sales tax
Conclusion
24
Community Improvement Districts Management Advisory Report - State Auditor's Findings
State law51 requires the DOR to perform all functions incident to the administration, collection, enforcement, and operation of the district sales tax. The DOR has a fiduciary duty to the public to ensure taxes are administered correctly and to detect and prevent improper taxation. The DOR implement controls to prevent or detect improper taxation. The Missouri Department of Revenue provided the Missouri State Auditor's office (SAO) detailed financial and business location reports for twelve Community Improvement Districts (CIDs). Errors were identified for ten of the CIDs reviewed. There are approximately 795 unique businesses within those 10 CIDs. The SAO discovered issues with 22 businesses, representing a 97 percent accuracy rate. The DOR has addressed all issues contained in the report and made necessary corrections to those businesses. In September 2017, the department began using a new Integrated Tax System which interfaces with the Sales Tax Rate Geographic Information System (STRGIS). When registrations are completed, the interface with STRGIS systematically provides department staff a rate and location code associated with the business address. This will help the department identify if the address is within a district, even when the taxpayer reports they are not within a district. In the previous tax system, at the time of registration, department employees had to perform a manual check for the address in STRGIS. In some instances this manual review did not occur, resulting in incorrect registrations. This improvement should result in greater accuracy. The DOR continues to work closely with the Office of Administration - Information Technology Services Division to ensure accurate and timely updates are made to STRGIS. In addition, in response to House Bill 1858 passed in the most recent legislative session, the department will begin working with political subdivisions to view the addresses currently located within their boundaries. Reports that provide a list of the open businesses registered within the district and monthly distributions from each business within the CID are available to each CID free of charge. Prior to implementation of the Integrated Tax System, political subdivisions were provided one free report per year, and charged $35 for each subsequent report requested by the CID. The department has notified CIDs of the availability of these reports. The department requests updates from the CIDs as new businesses are added or if their taxing boundaries change. The department also requires other political subdivisions, including cities and counties, to notify the department
51 Section 32.087.6, RSMo.
Recommendation Auditee's Response
25
Community Improvement Districts Management Advisory Report - State Auditor's Findings
of new businesses as a result of annexations or if they identify any discrepancies on their reports. The department's ability to provide accurate rate for each district is limited by the completeness of information provided by each CID. It is common for districts to have undeveloped areas without addresses at the time the district is formed. If the district does not provide notification of new businesses within the district, the department does not have the ability to identify specific businesses when the boundaries do not encompass the entire city or county. Due to incorrect boundaries in DOR's mapping system, sales tax errors were identified in 10 of the 12 (83 percent) districts reviewed, which includes 5 districts with multiple errors. Given the significant error rate found in districts reviewed as part of the audit, improper taxation is likely occurring in other special taxing districts throughout the state. CIDs have routinely not complied with state laws regarding budget preparation, annual financial and performance reporting, Sunshine Law compliance, and holding an annual meeting. CIDs routinely do not comply with state laws requiring budgets be reported to municipalities, contain certain information, and be adopted timely. We determined 11 of the 15 (73 percent) CIDs reviewed did not properly adopt budgets or did not properly provide those budgets to the municipality. • Four52 CIDs did not prepare an annual budget for the fiscal year 2017. • Two53 CIDs prepared a fiscal year 2017 budget but failed to provide the
budget to the municipality. • Five54 CIDs failed to submit their annual budget to the municipality
within the timeframe required by state law. These CIDs submitted their fiscal year 2017 budget to the municipality between 29 to 169 days after the statutory deadline.
Section 67.010.1, RSMo, requires political subdivisions to prepare an annual budget. Section 67.1471.2, RSMo, requires CIDs to submit a proposed budget
52 Black Mountain CID, Hope Valley CID, Liberty Commons CID, and Miner Gateway CID. 53 12th & Wyandotte CID and North Oaks Plaza Shopping Center CID. 54 2317 Belt CID, BaratHaven CID, Capital Mall CID, Independence Events Center CID, and Ward Parkway Shopping Center CID.
Auditor's Comment
3. Noncompliance with Statutory Requirements
3.1 Annual budgets
Lack of transparency to municipalities
26
Community Improvement Districts Management Advisory Report - State Auditor's Findings
to the governing body of the municipality between 180 and 90 days prior to the first day of the fiscal year. We determined 5 of the 955 (56 percent) CIDs reviewed prepared incomplete budgets. • The budgets for 256 CIDs did not contain a budget message or a general
budget summary. • The budgets for 257 CIDs did not contain a comparative statement of
actual and estimated revenues and expenditures for the preceding 2 years. • The budget for 158 CID did not contain a budget message, budget
summary, or contain a comparative statement of actual estimated revenues and expenditures for the preceding 2 years.
Section 67.010.1, RSMo, requires a CID board to present a budget with a complete financial plan to include a budget message describing the important features of the budget and major changes from the preceding year, comparative statement of estimated revenues and expenditures for the preceding 2 years, and a general budget summary. We determined 259 of the 11 (18 percent) CIDs60 reviewed that adopted a budget did not adopt their budgets timely. Those CIDs adopted their budget at least 45 days after the statutory deadline. Section 67.1471.3, RSMo, requires CID boards to adopt an annual budget no later than 30 days prior to the start of the CIDs fiscal year. CIDs consistently failed to provide required reports to the SAO and DED.
55 We could only review the budgets for 9 of the 15 CIDs because the Black Mountain CID, Hope Valley CID, Liberty Commons CID, and Miner Gateway CID failed to adopt a budget. The Downtown St. Louis CID and Park Ridge CID are not-for-profit established CIDs, and Section 67.010, RSMo, does not apply to not-for-profit CIDs. 56 12th & Wyandotte CID and North Oaks Plaza Shopping Center CID. 57 76 Entertainment CID and Capital Mall CID. 58 2317 Belt CID. 59 Capital Mall CID and Ward Parkway Shopping Center CID. 60 We could only review the timelines of approving budgets for 11 of the 15 CIDs because the Black Mountain CID, Hope Valley CID, Liberty Commons CID, and Miner Gateway CID failed to prepare a budget, and therefore could not adopt a budget in an annual Board meeting.
Budgets were incomplete
Budgets were not approved timely
3.2 Annual reports
27
Community Improvement Districts Management Advisory Report - State Auditor's Findings
For their most recent fiscal year, we determined 92 of the 40361 (23 percent) CIDs failed to provide an annual financial report to the SAO and 39 of the 403 (10 percent) submitted their report late. Based on DED records, the compliance rate on performance report requirements is low. For their most recent fiscal year, we determined 163 of the 43062 (38 percent) CIDs failed to provide an annual performance report to the DED and 65 of the 430 (15 percent) CIDs submitted their report after the statutory deadline. Only 202 of 430 districts (47 percent) timely filed the required performance reports with the DED. Section 105.145, RSMo, requires all political subdivision, including CIDs, to file annual financial statements with the SAO. 15 CSR 40-03.030(5) requires a CID to submit the annual financial statements to the SAO within 6 months following the end of the fiscal year. Additionally, Section 67.1471.4, RSMo, requires a CID to submit an annual performance report to DED within 120 days after the end of the fiscal year. We determined 3 of the 15 (20 percent) CIDs reviewed did not comply with the Sunshine Law by failing to prepare Board meeting minutes with all required information. We identified the following errors: • Two63 CIDs failed to indicate the Board members present and absent in
the minutes.
• One64 CID failed to indicate where the meeting was held in the minutes.
• One65 CID failed to indicate the time the meeting was held in the minutes. Section 610.020.7, RSMo, states minutes of open and closed meetings shall be taken and retained by the public governmental body, including, but not limited to, a record of any votes taken at such meetings. The minutes shall include the date, time, place, members present, members absent, and a record of any votes taken.
61 Seventeen CIDs were established as not-for-profit organizations, which are not required to submit annual financial reports. Eight CIDs were established in 2017 and did not have to submit a financial report until after our review period. 62 DED indicated 430 CIDs were active as of January 23, 2018. 63 2317 Belt CID and Black Mountain CID. 64 Black Mountain CID. 65 East Hills CID.
Annual financial report
Annual performance report
3.3 Sunshine Law
28
Community Improvement Districts Management Advisory Report - State Auditor's Findings
We determined 466 of the 15 (27 percent) CIDs reviewed did not hold an annual meeting during 2017. Section 67.1471.3, RSMo, requires CID boards to hold an annual meeting. CID Boards: 3.1 Ensure compliance with state law by adopting a budget, submitting
the budget timely to the municipality, including all information in the budget required by state law, and adopting the budget by the deadline established by state law.
3.2 Ensure annual financial reports and performance reports are filed
with the appropriate entities within the time frames established by state law.
3.3 Ensure meeting minutes include all the information required by the
Sunshine Law. 3.4 Ensure compliance with state law by holding at least one meeting of
the Board of Directors annually. Due to no state or local entity having oversight or management responsibilities over CIDs on a statewide basis, no management response can be obtained. The views of any applicable municipalities, or individual CID board members were obtained as appropriate and considered as part of our audit fieldwork.
66 Black Mountain CID, Hope Valley CID, Liberty Commons CID, and Miner Gateway CID.
3.4 Annual meetings
Recommendations
Auditee's Response

29
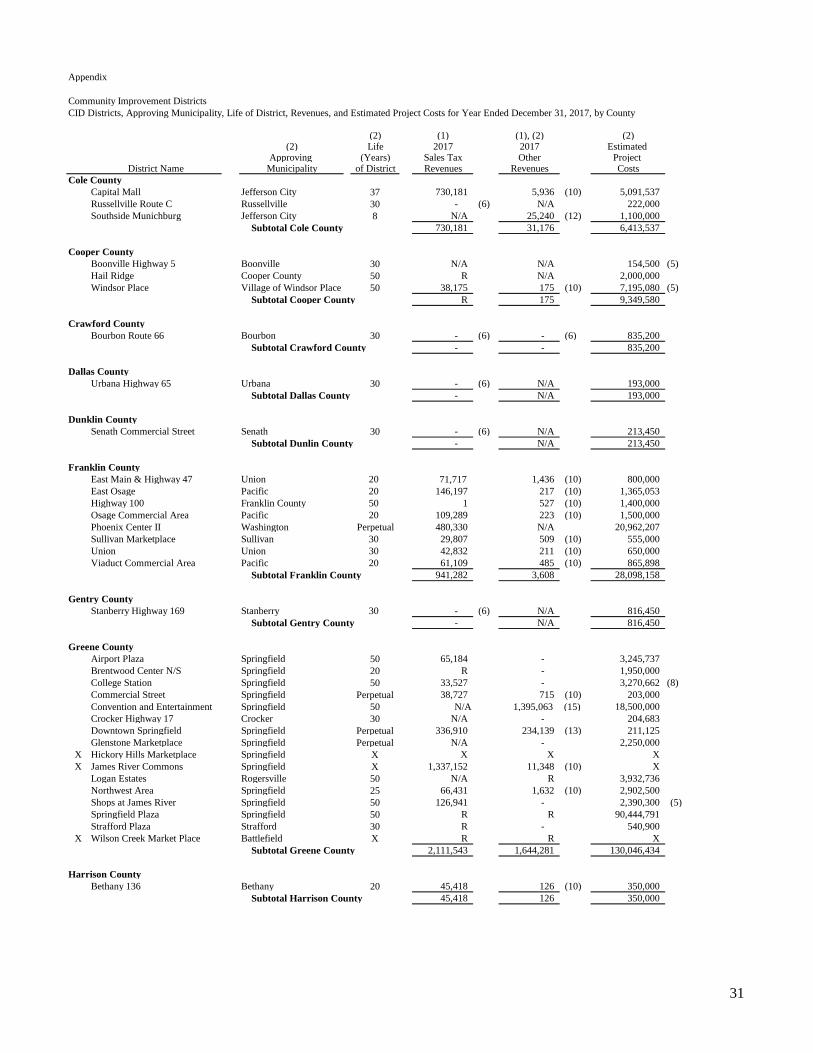
Appendix
Community Improvement DistrictsCID Districts, Approving Municipality, Life of District, Revenues, and Estimated Project Costs for Year Ended December 31, 2017, by County
(2) (1) (1), (2) (2)(2) Life 2017 2017 Estimated
Approving (Years) Sales Tax Other Project District Name Municipality of District Revenues Revenues Costs
Adair County Baltimore Commons Kirksville Perpetual $ R R 1,883,000 Franklin Street Kirksville Perpetual N/A N/A 1,000,000 North Baltimore Street Kirksville Perpetual R N/A 2,500,000 South 63 Corridor Kirksville 35 90,494 N/A 463,400
Subtotal Adair County 100,516 R 5,846,400
Barry CountyMonett Marketplace Monett 20 R N/A 700,000
Subtotal Barry County R - 700,000
Boone CountyBusiness Loop Columbia 20 33,190 60,899 (14) - (4)Downtown (Columbia) Columbia 20 578,148 207,933 (13) 475,000 (5)East Ashland Plaza Ashland 30 R R 2,437,767 North 763 Columbia 25 30,986 N/A 1,084,980
Subtotal Boone County R R 3,997,747
Buchanan County2317 Belt St. Joseph Perpetual R N/A 927,000 Ag Expo Buchanan County 35 N/A 845,845 (2) - (4)Belt Highway and Beck Road St. Joseph 40 R R 8,276,068 Cook Crossings St. Joseph 25 R 155,666 (12) 13,000,000 East Hills St. Joseph Perpetual 597,368 5,836 (10) 15,600,000 St. Joseph Downtown St. Joseph 30 54,755 49,491 130,000 The Commons St. Joseph 20 42,964 N/A 10,576,893 Tuscany Village Project 1 St. Joseph 40 R R 74,041,847
Subtotal Buchanan County 1,179,903 1,057,562 122,551,808
Butler CountyGreen Forest Poplar Bluff 45 N/A N/A 3,980,000 Highway 67 South Butler County 30 R N/A 615,000 Kelly Town Plaza Poplar Bluff 30 R R 1,200,775 Qulin Highway North Qulin 30 - (6) N/A 171,000 Stateline Butler County 30 R N/A 865,000 Sycamore Street Poplar Bluff 30 N/A N/A 300,000
Subtotal Butler County 65,096 R 7,131,775
Camden CountyX American Center Camdenton X 25,891 X X
Arrowhead Center Osage Beach 33 R N/A 28,000,000 Ball Parks of the Ozarks Camden County 30 N/A N/A - (4)Greenview Camden County 35 26,951 N/A 165,000 Ozark Bar-B-Que Camden County 5 - (6) N/A 50,000 Peninsula Development Camden County 40 N/A N/A 7,829,226 Sunrise Beach Market Center Village of Sunrise Beach 30 R N/A 1,609,960 Toad Cove Complex Camden County Perpetual - (7) N/A - (4)Toad Cove Resort Camden County Perpetual - (7) N/A - (4)
Subtotal Camden County 212,880 - 37,654,186
Cape Girardeau CountyDowntown Cape Girardeau Cape Girardeau Perpetual 154,046 N/A 255,000 (5)Town Plaza Cape Girardeau 20 132,834 6,464 (10) 4,284,900
Subtotal Cape Girardeau County 286,880 6,464 4,539,900
Carter CountyBlack Mountain Van Buren 30 R N/A 850,000 Ellsinore Herren Ave Ellsinore 30 R N/A 541,000 Ellsinore Highway 60 Ellsinore 30 N/A N/A 199,250 Landing River Center Carter County 30 R N/A 952,000 Leerjak Ellsinore 50 R R 1,250,000
Subtotal Carter County 88,006 R 3,792,250

30
Appendix
Community Improvement DistrictsCID Districts, Approving Municipality, Life of District, Revenues, and Estimated Project Costs for Year Ended December 31, 2017, by County
(2) (1) (1), (2) (2)(2) Life 2017 2017 Estimated
Approving (Years) Sales Tax Other Project District Name Municipality of District Revenues Revenues Costs
Cass County58 Highway Regional Market Raymore 20 134,928 104,855 (13) 14,500,000 211th Street Peculiar 50 R N/A 9,500,000 Cedar Tree Belton 40 N/A - (12) 6,210,406 Downtown Pleasant Hill Pleasant Hill Perpetual N/A - (7) - (4)Eastern Hills Harrisonville 25 N/A 6,180 (11) 287,500 Foxridge Raymore 20 N/A 56,388 (12) 1,067,850 Foxwood Village Raymore 30 R N/A 1,228,028 Grand Hill Belton 25 N/A - (7) 150,000 Highway 58 and Dean Avenue Raymore 25 R R 9,170,328 Jeter Farm Raymore 30 N/A R 436,000 Northwest Cass Village of Loch Lloyd 30 N/A - (7) 8,500,000 Raymore Galleria CID Raymore 30 84,486 N/A 3,454,435 Stonegate Raymore Perpetual N/A 78,780 (12) 414,950 TXRH Belton 20 R R 1,815,102 Y Belton Belton 30 N/A - (7) 280,000 Y Highway Market Place Belton 25 R R 7,128,037 (8)
Subtotal Cass County 521,222 248,914 64,142,636
Christian CountyAvicenna Ozark 30 - (6) N/A 2,206,000 Bluff Drive Ozark 20 N/A 15,582 (11) 142,500 Clever Highway 14 Clever 30 - (6) N/A 261,700 Deerbrook Marketplace Ozark 30 N/A N/A 3,285,480 Highlandville Highlandville 30 R N/A 2,000,000 Highway J & 17th Street Ozark 30 R N/A 1,657,769 McCroskey Street Nixa 20 38,025 556 (10) 500,000 Ozark Downtown Ozark N/A - (6) N/A - (4)Town & Country Village Ozark 25 R R 8,930,000
Subtotal Christian County 124,433 R 18,983,449
Clay County210 Highway Kansas City Perpetual 228,610 N/A - (4)901 South 291 Liberty 27 R R 980,000 Antioch Center Kansas City 50 447,511 N/A 10,000,000 Blue Jay Crossing Liberty 50 75,869 329 (10) 4,878,362 Creekwood Commons Kansas City 20 318,110 598 (10) 1,926,678 Crossroads Shop Center Liberty 50 102,141 1,044 (10) 3,875,000 Downtown Excelsior Springs Excelsior Springs 20 35,047 60 (10) 45,000 (5)Elms Hotel Excelsior Springs 33 R R 15,748,226 Flintlock Plaza Kansas City Perpetual 115,074 636 (10) 250,900 Flintlock Shoppes Kansas City Perpetual 237,644 2,766 (10) 296,500 Historic Downtown Liberty Commercial Liberty 30 75,958 53 (10) 463,000
Homestead Liberty 99 N/A - (3) 1,150,000 Hubach Hills & North Cass Parkway Raymore 32 N/A - (3) 4,884,627
Kearney West Side Kearney 30 82,911 N/A 533,000 Liberty Commons Liberty 35 220,876 8,670 (10) 10,694,140 Liberty Corners Liberty 30 237,687 1,237 (10) 1,350,000 Liberty Tri Shop Center Liberty 50 164,435 2,220 (10) 1,835,000 (5)Liberty Triangle Liberty 50 950,246 8,923 (10) 54,185,000 Meadowbrook Village Gladstone 15 62,958 362 (10) 923,632 Metro North Square and Commons Kansas City 23 134,337 2,665 (10) 13,495,922
North Haven Center Liberty 30 N/A - (3) 635,000 North Oak Village Kansas City 30 332,817 12,411 (10) 10,000,000 Oak Barry Kansas City 23 369,177 2,576 (10) 15,136,000 Renaissance Plaza (9) Kansas City 20 N/A N/A 406,344 (8)Rogers Plaza Liberty 50 R R 21,824,722 Shoppes at Kearney Kearney 30 344,572 264 (10) 4,000,000 South Bristol Center Kansas City 30 N/A - (3) 2,988,991 Twin Creeks Center Kansas City 30 N/A - (3) 6,937,886 Villages Kansas City 20 243,803 762 (10) 1,383,000 Vintage Plaza Excelsior Springs 20 67,691 643 (10) 1,000,000
Subtotal Clay County 5,110,009 47,962 191,826,930
31
Appendix
Community Improvement DistrictsCID Districts, Approving Municipality, Life of District, Revenues, and Estimated Project Costs for Year Ended December 31, 2017, by County
(2) (1) (1), (2) (2)(2) Life 2017 2017 Estimated
Approving (Years) Sales Tax Other Project District Name Municipality of District Revenues Revenues Costs
Cole CountyCapital Mall Jefferson City 37 730,181 5,936 (10) 5,091,537 Russellville Route C Russellville 30 - (6) N/A 222,000 Southside Munichburg Jefferson City 8 N/A 25,240 (12) 1,100,000
Subtotal Cole County 730,181 31,176 6,413,537
Cooper CountyBoonville Highway 5 Boonville 30 N/A N/A 154,500 (5)Hail Ridge Cooper County 50 R N/A 2,000,000 Windsor Place Village of Windsor Place 50 38,175 175 (10) 7,195,080 (5)
Subtotal Cooper County R 175 9,349,580
Crawford CountyBourbon Route 66 Bourbon 30 - (6) - (6) 835,200
Subtotal Crawford County - - 835,200
Dallas CountyUrbana Highway 65 Urbana 30 - (6) N/A 193,000
Subtotal Dallas County - N/A 193,000
Dunklin CountySenath Commercial Street Senath 30 - (6) N/A 213,450
Subtotal Dunlin County - N/A 213,450
Franklin CountyEast Main & Highway 47 Union 20 71,717 1,436 (10) 800,000 East Osage Pacific 20 146,197 217 (10) 1,365,053 Highway 100 Franklin County 50 1 527 (10) 1,400,000 Osage Commercial Area Pacific 20 109,289 223 (10) 1,500,000 Phoenix Center II Washington Perpetual 480,330 N/A 20,962,207 Sullivan Marketplace Sullivan 30 29,807 509 (10) 555,000 Union Union 30 42,832 211 (10) 650,000 Viaduct Commercial Area Pacific 20 61,109 485 (10) 865,898
Subtotal Franklin County 941,282 3,608 28,098,158
Gentry CountyStanberry Highway 169 Stanberry 30 - (6) N/A 816,450
Subtotal Gentry County - N/A 816,450
Greene CountyAirport Plaza Springfield 50 65,184 - 3,245,737 Brentwood Center N/S Springfield 20 R - 1,950,000 College Station Springfield 50 33,527 - 3,270,662 (8)Commercial Street Springfield Perpetual 38,727 715 (10) 203,000 Convention and Entertainment Springfield 50 N/A 1,395,063 (15) 18,500,000 Crocker Highway 17 Crocker 30 N/A - 204,683 Downtown Springfield Springfield Perpetual 336,910 234,139 (13) 211,125 Glenstone Marketplace Springfield Perpetual N/A - 2,250,000
X Hickory Hills Marketplace Springfield X X X XX James River Commons Springfield X 1,337,152 11,348 (10) X
Logan Estates Rogersville 50 N/A R 3,932,736 Northwest Area Springfield 25 66,431 1,632 (10) 2,902,500 Shops at James River Springfield 50 126,941 - 2,390,300 (5)Springfield Plaza Springfield 50 R R 90,444,791 Strafford Plaza Strafford 30 R - 540,900
X Wilson Creek Market Place Battlefield X R R X Subtotal Greene County 2,111,543 1,644,281 130,046,434
Harrison CountyBethany 136 Bethany 20 45,418 126 (10) 350,000
Subtotal Harrison County 45,418 126 350,000
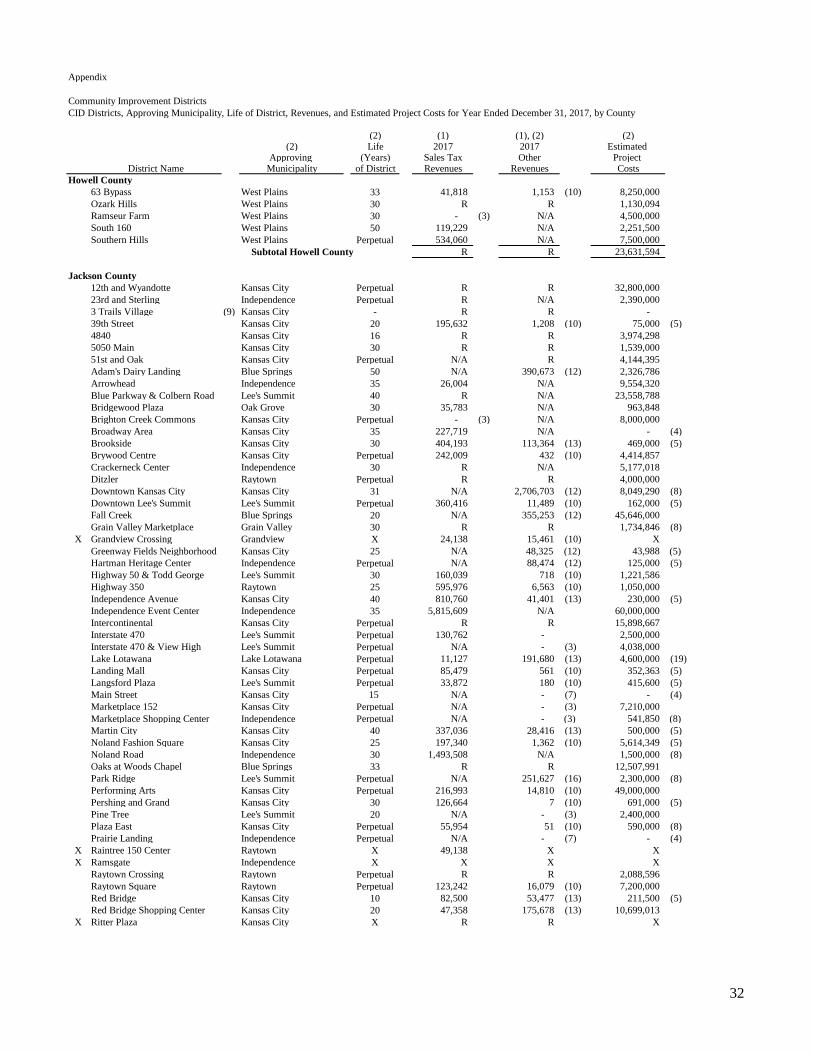
32
Appendix
Community Improvement DistrictsCID Districts, Approving Municipality, Life of District, Revenues, and Estimated Project Costs for Year Ended December 31, 2017, by County
(2) (1) (1), (2) (2)(2) Life 2017 2017 Estimated
Approving (Years) Sales Tax Other Project District Name Municipality of District Revenues Revenues Costs
Howell County63 Bypass West Plains 33 41,818 1,153 (10) 8,250,000 Ozark Hills West Plains 30 R R 1,130,094 Ramseur Farm West Plains 30 - (3) N/A 4,500,000 South 160 West Plains 50 119,229 N/A 2,251,500 Southern Hills West Plains Perpetual 534,060 N/A 7,500,000
Subtotal Howell County R R 23,631,594
Jackson County12th and Wyandotte Kansas City Perpetual R R 32,800,000 23rd and Sterling Independence Perpetual R N/A 2,390,000 3 Trails Village (9) Kansas City - R R - 39th Street Kansas City 20 195,632 1,208 (10) 75,000 (5)4840 Kansas City 16 R R 3,974,298 5050 Main Kansas City 30 R R 1,539,000 51st and Oak Kansas City Perpetual N/A R 4,144,395 Adam's Dairy Landing Blue Springs 50 N/A 390,673 (12) 2,326,786 Arrowhead Independence 35 26,004 N/A 9,554,320 Blue Parkway & Colbern Road Lee's Summit 40 R N/A 23,558,788 Bridgewood Plaza Oak Grove 30 35,783 N/A 963,848 Brighton Creek Commons Kansas City Perpetual - (3) N/A 8,000,000 Broadway Area Kansas City 35 227,719 N/A - (4)Brookside Kansas City 30 404,193 113,364 (13) 469,000 (5)Brywood Centre Kansas City Perpetual 242,009 432 (10) 4,414,857 Crackerneck Center Independence 30 R N/A 5,177,018 Ditzler Raytown Perpetual R R 4,000,000 Downtown Kansas City Kansas City 31 N/A 2,706,703 (12) 8,049,290 (8)Downtown Lee's Summit Lee's Summit Perpetual 360,416 11,489 (10) 162,000 (5)Fall Creek Blue Springs 20 N/A 355,253 (12) 45,646,000 Grain Valley Marketplace Grain Valley 30 R R 1,734,846 (8)
X Grandview Crossing Grandview X 24,138 15,461 (10) XGreenway Fields Neighborhood Kansas City 25 N/A 48,325 (12) 43,988 (5) Hartman Heritage Center Independence Perpetual N/A 88,474 (12) 125,000 (5)Highway 50 & Todd George Lee's Summit 30 160,039 718 (10) 1,221,586 Highway 350 Raytown 25 595,976 6,563 (10) 1,050,000 Independence Avenue Kansas City 40 810,760 41,401 (13) 230,000 (5)Independence Event Center Independence 35 5,815,609 N/A 60,000,000 Intercontinental Kansas City Perpetual R R 15,898,667 Interstate 470 Lee's Summit Perpetual 130,762 - 2,500,000 Interstate 470 & View High Lee's Summit Perpetual N/A - (3) 4,038,000 Lake Lotawana Lake Lotawana Perpetual 11,127 191,680 (13) 4,600,000 (19)Landing Mall Kansas City Perpetual 85,479 561 (10) 352,363 (5)Langsford Plaza Lee's Summit Perpetual 33,872 180 (10) 415,600 (5)Main Street Kansas City 15 N/A - (7) - (4)Marketplace 152 Kansas City Perpetual N/A - (3) 7,210,000 Marketplace Shopping Center Independence Perpetual N/A - (3) 541,850 (8) Martin City Kansas City 40 337,036 28,416 (13) 500,000 (5)Noland Fashion Square Kansas City 25 197,340 1,362 (10) 5,614,349 (5)Noland Road Independence 30 1,493,508 N/A 1,500,000 (8)Oaks at Woods Chapel Blue Springs 33 R R 12,507,991 Park Ridge Lee's Summit Perpetual N/A 251,627 (16) 2,300,000 (8)Performing Arts Kansas City Perpetual 216,993 14,810 (10) 49,000,000 Pershing and Grand Kansas City 30 126,664 7 (10) 691,000 (5)Pine Tree Lee's Summit 20 N/A - (3) 2,400,000 Plaza East Kansas City Perpetual 55,954 51 (10) 590,000 (8)Prairie Landing Independence Perpetual N/A - (7) - (4)
X Raintree 150 Center Raytown X 49,138 X XX Ramsgate Independence X X X X
Raytown Crossing Raytown Perpetual R R 2,088,596 Raytown Square Raytown Perpetual 123,242 16,079 (10) 7,200,000 Red Bridge Kansas City 10 82,500 53,477 (13) 211,500 (5)Red Bridge Shopping Center Kansas City 20 47,358 175,678 (13) 10,699,013
X Ritter Plaza Kansas City X R R X

33
Appendix
Community Improvement DistrictsCID Districts, Approving Municipality, Life of District, Revenues, and Estimated Project Costs for Year Ended December 31, 2017, by County
(2) (1) (1), (2) (2)(2) Life 2017 2017 Estimated
Approving (Years) Sales Tax Other Project District Name Municipality of District Revenues Revenues Costs
River Market Kansas City 19 N/A 312,145 (12) 1,322,239 (5)Shoal Creek Valley Kansas City Perpetual N/A - (3) 350,000 (5)Shops on Blue Parkway Kansas City Perpetual 142,706 672 (10) 115,076 (5)Skelly Kansas City Perpetual 75,364 727 (10) 171,390 (5)State Line Shopping Center Kansas City 20 82,395 339 (10) 6,757,147 Stone Canyon Independence Perpetual N/A - (7) 14,205,000 (19)Summit Fair Lee's Summit Perpetual 758,873 534,854 (12) 19,865,751 Summit Point Lee's Summit 100 N/A - (7) - (4)Sunrise Farms Grandview 50 R R 15,700,000 Trinity Woods Independence 30 N/A - (7) 74,000 (5)Troost Avenue Kansas City Perpetual 229,656 25,116 (13) 200,000 (5)Truman Road Kansas City 20 104,886 44,014 (13) 160,000 (5)Truman's Marketplace Grandview 40 435,521 355,953 (12) 8,700,000 Uptown Kansas City 20 52,678 255 (10) 103,000 (5)Waldo Kansas City Perpetual 580,769 37,085 (13) 211,000 (5)Ward Parkway Shopping Center Kansas City 40 1,511,555 19,718 (10) 24,364,800 Watts Mill Kansas City 20 70,246 137 (10) 1,730,000 Westport Kansas City 15 N/A 1,114,531 (12) 761,053 (5)Westport II Kansas City 20 509,565 3,756 (10) 275,000 (5)White Oak Blue Springs 23 R R 49,639,471 Zona Rosa Kansas City 23 N/A 201,350 (12) 5,500,000
Subtotal Jackson County 17,506,815 7,240,935 502,713,876
Jasper County510 Rangeline Joplin 20 N/A - (3) 990,000 Briarbrook Carl Junction 20 N/A 159,809 (11) 1,900,000 Downstream Q Store Newton County 30 N/A - (7) 6,500,000 (5)Northpark Lane Joplin 20 1,041,733 16,855 (10) 10,000,000 Peachtree Village Carthage 30 7,253 2,392 (10) 2,528,136 South Main Street Joplin 30 N/A - (3) 5,222,394
Subtotal Jasper County 1,048,986 179,056 27,140,530
Jefferson CountyBiltmore East Jefferson County 20 92,232 251 (10) 1,500,000 High Ridge Commons Jefferson County 30 758,685 N/A 10,500,000 McNutt Road Corridor Herculaneum 30 402,747 N/A 7,000,000 Peach Tree Hillsboro 30 R N/A 2,528,136
X Richardson Crossing Arnold X 19,432 1,823 (10) XRidgecrest Arnold 40 30,906 527 (10) 300,000 Springdale Jefferson County 40 33,613 4,573 (10) 1,592,000 Truman Village Festus 25 N/A 1,266 (10) 1,700,000 Twin City Mall Crystal City 30 163,117 N/A 4,617,893
Subtotal Jefferson County R 8,440 29,738,029
Johnson CountyKnob Noster Ninth Street Knob Noster 30 - (6) N/A 244,000
Subtotal Johnson County - N/A 244,000
Laclede CountyThe Fountains Lebanon 25 47,780 N/A 1,200,000 Lebanon Marketplace Lebanon 25 31,998 7,059 (11) 954,000 Southdale Center Lebanon 25 56,731 67 (10) 3,270,000
Subtotal Laclede County 136,509 7,126 5,424,000
Lincoln CountyLincoln Crossing Troy 25 73,723 2,415 (10) 2,820,000
Subtotal Lincoln County 73,723 2,415 2,820,000
Livingston CountyStoneybrooke Chillicothe 25 205,578 7,726 (10) 1,451,500
Subtotal Livingston County 205,578 7,726 1,451,500 Marion County
SZC Development District Inc. Hannibal 14 R N/A 4,500,000 Subtotal Marion County R - 4,500,000
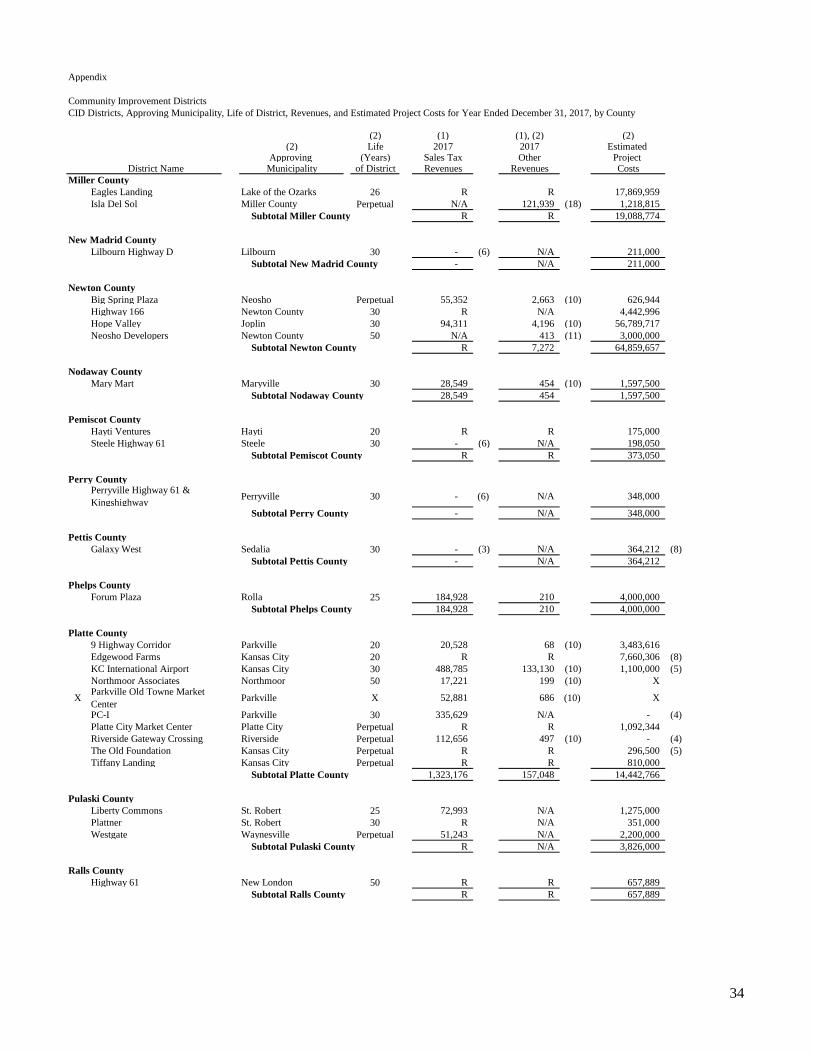
34
Appendix
Community Improvement DistrictsCID Districts, Approving Municipality, Life of District, Revenues, and Estimated Project Costs for Year Ended December 31, 2017, by County
(2) (1) (1), (2) (2)(2) Life 2017 2017 Estimated
Approving (Years) Sales Tax Other Project District Name Municipality of District Revenues Revenues Costs
Miller CountyEagles Landing Lake of the Ozarks 26 R R 17,869,959 Isla Del Sol Miller County Perpetual N/A 121,939 (18) 1,218,815
Subtotal Miller County R R 19,088,774
New Madrid CountyLilbourn Highway D Lilbourn 30 - (6) N/A 211,000
Subtotal New Madrid County - N/A 211,000
Newton CountyBig Spring Plaza Neosho Perpetual 55,352 2,663 (10) 626,944 Highway 166 Newton County 30 R N/A 4,442,996 Hope Valley Joplin 30 94,311 4,196 (10) 56,789,717 Neosho Developers Newton County 50 N/A 413 (11) 3,000,000
Subtotal Newton County R 7,272 64,859,657
Nodaway CountyMary Mart Maryville 30 28,549 454 (10) 1,597,500
Subtotal Nodaway County 28,549 454 1,597,500
Pemiscot CountyHayti Ventures Hayti 20 R R 175,000 Steele Highway 61 Steele 30 - (6) N/A 198,050
Subtotal Pemiscot County R R 373,050
Perry CountyPerryville Highway 61 & Kingshighway Perryville 30 - (6) N/A 348,000
Subtotal Perry County - N/A 348,000
Pettis CountyGalaxy West Sedalia 30 - (3) N/A 364,212 (8)
Subtotal Pettis County - N/A 364,212
Phelps CountyForum Plaza Rolla 25 184,928 210 4,000,000
Subtotal Phelps County 184,928 210 4,000,000
Platte County9 Highway Corridor Parkville 20 20,528 68 (10) 3,483,616 Edgewood Farms Kansas City 20 R R 7,660,306 (8)KC International Airport Kansas City 30 488,785 133,130 (10) 1,100,000 (5)Northmoor Associates Northmoor 50 17,221 199 (10) X
X Parkville Old Towne Market Center Parkville X 52,881 686 (10) X
PC-I Parkville 30 335,629 N/A - (4)Platte City Market Center Platte City Perpetual R R 1,092,344 Riverside Gateway Crossing Riverside Perpetual 112,656 497 (10) - (4)The Old Foundation Kansas City Perpetual R R 296,500 (5)Tiffany Landing Kansas City Perpetual R R 810,000
Subtotal Platte County 1,323,176 157,048 14,442,766
Pulaski CountyLiberty Commons St. Robert 25 72,993 N/A 1,275,000 Plattner St. Robert 30 R N/A 351,000 Westgate Waynesville Perpetual 51,243 N/A 2,200,000
Subtotal Pulaski County R N/A 3,826,000
Ralls CountyHighway 61 New London 50 R R 657,889
Subtotal Ralls County R R 657,889

35
Appendix
Community Improvement DistrictsCID Districts, Approving Municipality, Life of District, Revenues, and Estimated Project Costs for Year Ended December 31, 2017, by County
(2) (1) (1), (2) (2)(2) Life 2017 2017 Estimated
Approving (Years) Sales Tax Other Project District Name Municipality of District Revenues Revenues Costs
Randolph CountyDowntown Moberly Moberly 20 6,462 737 (10) - (4)Meadow Ridge Moberly 20 N/A 3 (20) 584,000 Moberly Crossing Moberly 20 23,323 216 (10) 754,109
Subtotal Randolph County 29,785 956 1,338,109
Scott CountyMiner Gateway Miner 23 43,079 930 (10) 2,100,000
Subtotal Scott County 43,079 930 2,100,000
St. Charles CountyBaratHaven Dardenne Prairie 41 N/A - (7) 4,200,000 Bear Creek Wentzville 44 381,191 N/A 22,955,000 Belleau O'Fallon 40 56,365 22,993 (13) 3,000,000 Bryan Road Dardenne Prairie 20 23,750 64,662 (13) 3,600,000 Caledonia O'Fallon 21 8,418 1,345 (10) 3,000,000 Cora Marie Dardenne Prairie 40 N/A - (3) 25,000,000 Elm & 370 St. Charles 20 16,451 3,584 (10) 825,000 Elm Point Commons St. Charles 25 N/A 224,480 (12) 2,530,000 Fairgrounds Road St. Charles 25 N/A - (3) 1,000,000 Fountain Lakes Commerce Center North St. Charles 30 R R - (4) Fountain Lakes Community Center South (9) St. Charles - R R - (4)
Mountain Farm Weldon Spring 24 R R 1,250,000 O'Fallon Retail Walk O'Fallon 20 282,192 495 (10) 7,911,000 Old Town Cottleville Cottleville 40 115,927 850 (10) 5,700,000 Plaza at Noahs Ark St. Charles Perpetual 356,430 276,864 (13) 18,895,000 Shoppes of Mid Rivers St. Peters 23 35,127 212 (10) 7,800,000 St Charles Riverfront St. Charles Perpetual 298,309 52,630 (10) 16,870,000 St Peters Hotel St. Peters 25 R R 1,500,000 Suemandy Dr 1 St. Peters 40 R R 2,400,000 Suemandy Dr 2 St. Peters 25 R R 2,400,000 Suemandy/Mid Rivers St. Peters 40 1,025,235 6,257 (10) 13,700,000 Veterans Memorial Parkway St. Charles 30 23,895 - (10) 3,000,000 Waterbury Storm Water O'Fallon Perpetual 33,114 1,176 (10) 250,000 Wentzille Bluffs Wentzville 20 171,110 256,293 (13) 6,495,000 West Clay Extension St. Charles 35 339,565 N/A 6,000,000 West Pearce Wentzville Perpetual R R 1,083,000 Zumbehl Road/Hwy 94 St. Charles 15 32,439 1,180 (10) 410,978
Subtotal St. Charles County 3,560,882 1,133,820 161,774,978
St. Clair CountyCollins St. Clair County 30 - (6) N/A 925,000
Subtotal St. Clair County - N/A 925,000
St. Francois CountyGPMVLC Farmington 20 - N/A 2,716,259 Maple Valley Plaza Farmington Perpetual 65,407 72 (10) 4,000,000 Mineral Area Farmington 30 121,765 2,956 (10) 2,000,000
Subtotal St. Francois County 187,172 3,028 8,716,259
St. Louis County25 North Central Clayton 23 N/A R 1,500,000 370/Missouri Bottom Road/Taussig Road Hazelwood 25 N/A 38,551 (12) 1,529,000
1030 Woodcrest Terrace St. Louis County 40 N/A - (3) 3,250,000 8750 Manchester Road Brentwood 20 33,007 1,994 (10) 1,332,500 10100 Watson Road Sunset Hills 25 R R 900,000 10700 Pear Tree Lane Edmundson 40 228,841 864 (10) 2,000,000 Adie/St Charles Rock Road St. Ann 40 R R 500,000 (8)Affton Plaza St. Louis County Perpetual 29,503 N/A 14,845,000 Arbors of Rockwood Eureka 32 N/A - (3) 3,413,573 Berkeley Northpark Berkeley 40 R R 20,000,000 Brentwood Blvd/Clayton Road Richmond Heights Perpetual R R 5,800,000
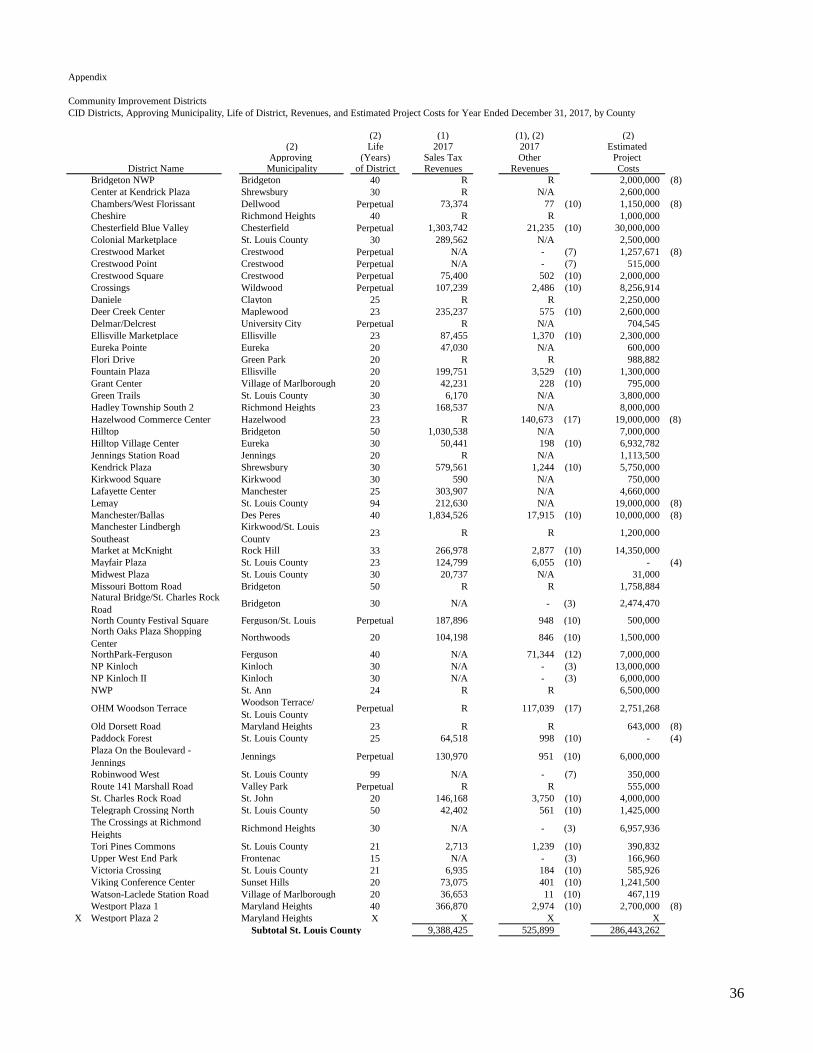
36
Appendix
Community Improvement DistrictsCID Districts, Approving Municipality, Life of District, Revenues, and Estimated Project Costs for Year Ended December 31, 2017, by County
(2) (1) (1), (2) (2)(2) Life 2017 2017 Estimated
Approving (Years) Sales Tax Other Project District Name Municipality of District Revenues Revenues Costs
Bridgeton NWP Bridgeton 40 R R 2,000,000 (8)Center at Kendrick Plaza Shrewsbury 30 R N/A 2,600,000 Chambers/West Florissant Dellwood Perpetual 73,374 77 (10) 1,150,000 (8)Cheshire Richmond Heights 40 R R 1,000,000 Chesterfield Blue Valley Chesterfield Perpetual 1,303,742 21,235 (10) 30,000,000 Colonial Marketplace St. Louis County 30 289,562 N/A 2,500,000 Crestwood Market Crestwood Perpetual N/A - (7) 1,257,671 (8)Crestwood Point Crestwood Perpetual N/A - (7) 515,000 Crestwood Square Crestwood Perpetual 75,400 502 (10) 2,000,000 Crossings Wildwood Perpetual 107,239 2,486 (10) 8,256,914 Daniele Clayton 25 R R 2,250,000 Deer Creek Center Maplewood 23 235,237 575 (10) 2,600,000 Delmar/Delcrest University City Perpetual R N/A 704,545 Ellisville Marketplace Ellisville 23 87,455 1,370 (10) 2,300,000 Eureka Pointe Eureka 20 47,030 N/A 600,000 Flori Drive Green Park 20 R R 988,882 Fountain Plaza Ellisville 20 199,751 3,529 (10) 1,300,000 Grant Center Village of Marlborough 20 42,231 228 (10) 795,000 Green Trails St. Louis County 30 6,170 N/A 3,800,000 Hadley Township South 2 Richmond Heights 23 168,537 N/A 8,000,000 Hazelwood Commerce Center Hazelwood 23 R 140,673 (17) 19,000,000 (8) Hilltop Bridgeton 50 1,030,538 N/A 7,000,000 Hilltop Village Center Eureka 30 50,441 198 (10) 6,932,782 Jennings Station Road Jennings 20 R N/A 1,113,500 Kendrick Plaza Shrewsbury 30 579,561 1,244 (10) 5,750,000 Kirkwood Square Kirkwood 30 590 N/A 750,000 Lafayette Center Manchester 25 303,907 N/A 4,660,000 Lemay St. Louis County 94 212,630 N/A 19,000,000 (8)Manchester/Ballas Des Peres 40 1,834,526 17,915 (10) 10,000,000 (8)Manchester Lindbergh Southeast
Kirkwood/St. Louis County 23 R R 1,200,000
Market at McKnight Rock Hill 33 266,978 2,877 (10) 14,350,000 Mayfair Plaza St. Louis County 23 124,799 6,055 (10) - (4)Midwest Plaza St. Louis County 30 20,737 N/A 31,000 Missouri Bottom Road Bridgeton 50 R R 1,758,884 Natural Bridge/St. Charles Rock Road Bridgeton 30 N/A - (3) 2,474,470
North County Festival Square Ferguson/St. Louis Perpetual 187,896 948 (10) 500,000 North Oaks Plaza Shopping Center Northwoods 20 104,198 846 (10) 1,500,000
NorthPark-Ferguson Ferguson 40 N/A 71,344 (12) 7,000,000 NP Kinloch Kinloch 30 N/A - (3) 13,000,000 NP Kinloch II Kinloch 30 N/A - (3) 6,000,000 NWP St. Ann 24 R R 6,500,000
OHM Woodson Terrace Woodson Terrace/ St. Louis County Perpetual R 117,039 (17) 2,751,268
Old Dorsett Road Maryland Heights 23 R R 643,000 (8)Paddock Forest St. Louis County 25 64,518 998 (10) - (4)Plaza On the Boulevard - Jennings Jennings Perpetual 130,970 951 (10) 6,000,000
Robinwood West St. Louis County 99 N/A - (7) 350,000 Route 141 Marshall Road Valley Park Perpetual R R 555,000 St. Charles Rock Road St. John 20 146,168 3,750 (10) 4,000,000 Telegraph Crossing North St. Louis County 50 42,402 561 (10) 1,425,000 The Crossings at Richmond Heights Richmond Heights 30 N/A - (3) 6,957,936
Tori Pines Commons St. Louis County 21 2,713 1,239 (10) 390,832 Upper West End Park Frontenac 15 N/A - (3) 166,960 Victoria Crossing St. Louis County 21 6,935 184 (10) 585,926 Viking Conference Center Sunset Hills 20 73,075 401 (10) 1,241,500 Watson-Laclede Station Road Village of Marlborough 20 36,653 11 (10) 467,119 Westport Plaza 1 Maryland Heights 40 366,870 2,974 (10) 2,700,000 (8)
X Westport Plaza 2 Maryland Heights X X X X Subtotal St. Louis County 9,388,425 525,899 286,443,262
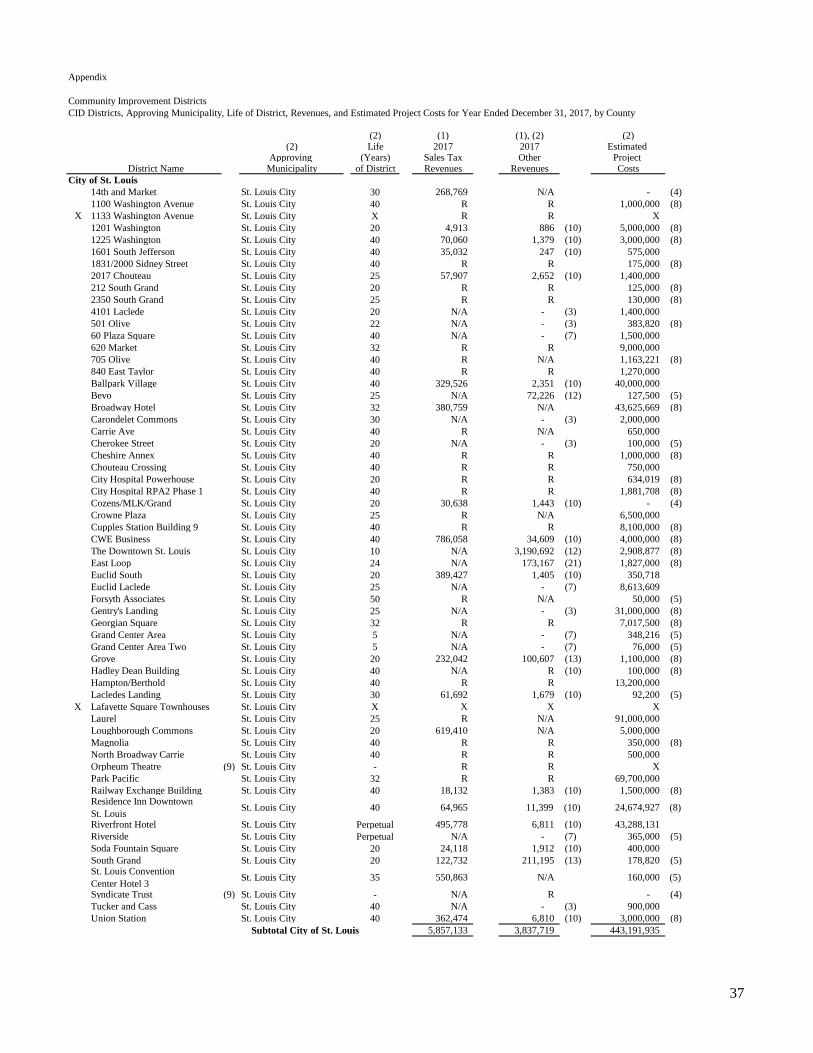
37
Appendix
Community Improvement DistrictsCID Districts, Approving Municipality, Life of District, Revenues, and Estimated Project Costs for Year Ended December 31, 2017, by County
(2) (1) (1), (2) (2)(2) Life 2017 2017 Estimated
Approving (Years) Sales Tax Other Project District Name Municipality of District Revenues Revenues Costs
City of St. Louis14th and Market St. Louis City 30 268,769 N/A - (4)1100 Washington Avenue St. Louis City 40 R R 1,000,000 (8)
X 1133 Washington Avenue St. Louis City X R R X1201 Washington St. Louis City 20 4,913 886 (10) 5,000,000 (8)1225 Washington St. Louis City 40 70,060 1,379 (10) 3,000,000 (8)1601 South Jefferson St. Louis City 40 35,032 247 (10) 575,000 1831/2000 Sidney Street St. Louis City 40 R R 175,000 (8)2017 Chouteau St. Louis City 25 57,907 2,652 (10) 1,400,000 212 South Grand St. Louis City 20 R R 125,000 (8)2350 South Grand St. Louis City 25 R R 130,000 (8)4101 Laclede St. Louis City 20 N/A - (3) 1,400,000 501 Olive St. Louis City 22 N/A - (3) 383,820 (8)60 Plaza Square St. Louis City 40 N/A - (7) 1,500,000 620 Market St. Louis City 32 R R 9,000,000 705 Olive St. Louis City 40 R N/A 1,163,221 (8)840 East Taylor St. Louis City 40 R R 1,270,000 Ballpark Village St. Louis City 40 329,526 2,351 (10) 40,000,000 Bevo St. Louis City 25 N/A 72,226 (12) 127,500 (5)Broadway Hotel St. Louis City 32 380,759 N/A 43,625,669 (8)Carondelet Commons St. Louis City 30 N/A - (3) 2,000,000 Carrie Ave St. Louis City 40 R N/A 650,000 Cherokee Street St. Louis City 20 N/A - (3) 100,000 (5)Cheshire Annex St. Louis City 40 R R 1,000,000 (8)Chouteau Crossing St. Louis City 40 R R 750,000 City Hospital Powerhouse St. Louis City 20 R R 634,019 (8)City Hospital RPA2 Phase 1 St. Louis City 40 R R 1,881,708 (8)Cozens/MLK/Grand St. Louis City 20 30,638 1,443 (10) - (4)Crowne Plaza St. Louis City 25 R N/A 6,500,000 Cupples Station Building 9 St. Louis City 40 R R 8,100,000 (8)CWE Business St. Louis City 40 786,058 34,609 (10) 4,000,000 (8)The Downtown St. Louis St. Louis City 10 N/A 3,190,692 (12) 2,908,877 (8)East Loop St. Louis City 24 N/A 173,167 (21) 1,827,000 (8)Euclid South St. Louis City 20 389,427 1,405 (10) 350,718 Euclid Laclede St. Louis City 25 N/A - (7) 8,613,609 Forsyth Associates St. Louis City 50 R N/A 50,000 (5)Gentry's Landing St. Louis City 25 N/A - (3) 31,000,000 (8)Georgian Square St. Louis City 32 R R 7,017,500 (8)Grand Center Area St. Louis City 5 N/A - (7) 348,216 (5)Grand Center Area Two St. Louis City 5 N/A - (7) 76,000 (5)Grove St. Louis City 20 232,042 100,607 (13) 1,100,000 (8)Hadley Dean Building St. Louis City 40 N/A R (10) 100,000 (8)Hampton/Berthold St. Louis City 40 R R 13,200,000 Lacledes Landing St. Louis City 30 61,692 1,679 (10) 92,200 (5)
X Lafayette Square Townhouses St. Louis City X X X XLaurel St. Louis City 25 R N/A 91,000,000 Loughborough Commons St. Louis City 20 619,410 N/A 5,000,000 Magnolia St. Louis City 40 R R 350,000 (8)North Broadway Carrie St. Louis City 40 R R 500,000 Orpheum Theatre (9) St. Louis City - R R XPark Pacific St. Louis City 32 R R 69,700,000 Railway Exchange Building St. Louis City 40 18,132 1,383 (10) 1,500,000 (8)Residence Inn Downtown St. Louis St. Louis City 40 64,965 11,399 (10) 24,674,927 (8)
Riverfront Hotel St. Louis City Perpetual 495,778 6,811 (10) 43,288,131 Riverside St. Louis City Perpetual N/A - (7) 365,000 (5)Soda Fountain Square St. Louis City 20 24,118 1,912 (10) 400,000 South Grand St. Louis City 20 122,732 211,195 (13) 178,820 (5)St. Louis Convention Center Hotel 3 St. Louis City 35 550,863 N/A 160,000 (5)
Syndicate Trust (9) St. Louis City - N/A R - (4)Tucker and Cass St. Louis City 40 N/A - (3) 900,000 Union Station St. Louis City 40 362,474 6,810 (10) 3,000,000 (8)
Subtotal City of St. Louis 5,857,133 3,837,719 443,191,935

38
Appendix
Community Improvement DistrictsCID Districts, Approving Municipality, Life of District, Revenues, and Estimated Project Costs for Year Ended December 31, 2017, by County
(2) (1) (1), (2) (2)(2) Life 2017 2017 Estimated
Approving (Years) Sales Tax Other Project District Name Municipality of District Revenues Revenues Costs
Ste. Genevieve CountyOzora Ste. Genevieve County 23 R N/A 3,010,000
Subtotal Ste. Genevieve County R N/A 3,010,000
Taney County 76 Entertainment Branson Perpetual 427,724 8,353 (10) 16,608,515 Branson Commerce Park Branson 35 N/A - (3) 13,875,000
X Branson Creek Branson X X X XBranson Hills Branson 50 940,810 N/A 7,253,348 (8)Branson Hills Infrastructure Branson 30 31,397 781,078 (12) 15,000,000 Forsythe Road Branson 25 N/A - (3) 2,500,000 Historic Downtown Branson Branson 20 441,115 N/A 300,000 (5)Southtowne Hollister 30 260,718 8,412 (10) 3,971,420 (8)
Subtotal Taney County 2,101,764 797,843 59,508,283
Texas CountyLicking Route 32 Licking 30 - (6) N/A 244,250
Subtotal Texas County - N/A 244,250
Statewide Totals $ 56,939,691 17,364,052 2,312,167,343
R Amount redacted. The Departmen tof Revenue (DOR) asserts that the amount of money collected for CIDs with fewer than 6 businesses must be protected from disclosure to the general public citing Section 32.057, RSMo.
X The CID did not return a completed survey.N/A Not Applicable(1) Information was obtained from the DOR and is on a calendar year basis.(2) Information was obtained from entity survey information filed with the SAO.(3) No revenues collected as of December 31, 2017. (4) The CID reported no estimated project cost on survey information filed with the SAO. (5) The CID reported estimated project cost only for the initial year.(6) The CID has stopped collections.(7) The CID revenue was not reported to the SAO for the CID's 2017 fiscal year as of June 25, 2018.(8) The CID reported estimated project cost was for the first 5 years.(9) The CID has been abolished/terminated.(10) Use tax revenue amount; this amount was obtained from the DOR and is on a calendar year basis.(11) Property tax revenue amount; this amount was obtained from the CID's 2017 financial statements and is based on the CID's fiscal year end.
Fiscal year ends vary by CID.(12) Special assessment revenue amount; this amount was obtained from the CID's 2017 financial statements and is based on the CID's fiscal year end.
Fiscal year ends vary by CID.(13) Use tax and special assessment revenue amounts; these amounts were obtained from the DOR and the CID's 2017 financial statements, which
are based on the CID's fiscal year end. Fiscal year ends vary by CID. (14) Use tax and property tax revenue amounts; these amounts were obtained from the DOR and the CID's 2017 financial statements, which are
based on the CID's fiscal year end. Fiscal year ends vary by CID. (15) Property tax, amusement sales tax, hotel/motel and restaurant/meals tax revenue amounts; all amounts were obtained from the CID's 2017
financial statements. Fiscal year ends vary by CID.(16) Special assessment revenue amount for the 2017 calendar year. Calculated using information obtained from CID.(17) Special assessment revenues, use tax redacted. (18) Real property tax and special assessment revenues. (19) The CID did not report estimated projects costs on the survey information filed with the SAO; however, the CID reported actual project costs
on survey information filed with the SAO. This amount represents the actual project costs. (20) Interest revenue, obtained from the CID's 2017 financial statements, which are based on the CID's fiscal year end. Fiscal year ends vary by CID.(21) Rental and other revenues, obtained from the CID's 2017 financial statements, which are based on the CID's fiscal year end. Fiscal year ends
vary by CID.